Citigroup 14 th Annual High Yield / Leveraged Finance Conference
|
|
|
- Reynard Cox
- 5 years ago
- Views:
Transcription
1 FMC Corporation Citigroup 14 th Annual High Yield / Leveraged Finance Conference March 7, 2005 Thomas C. Deas, Jr. Vice President & Treasurer
2 Disclaimer Safe Harbor Statement under the Private Securities Litigation Reform Act of 1995 These slides and the accompanying presentation contain forwardlooking statements that represent management s best judgment as of the date hereof based on information currently available. Actual results of the Company may differ materially from those contained in the forward-looking statements. Additional information concerning factors that may cause results to differ materially from those in the forward-looking statements is contained in the Company s periodic reports filed under the Securities Exchange Act of 1934, as amended. The Company undertakes no obligation to update or revise these forward-looking statements to reflect new events or uncertainties. Non-GAAP Financial Terms These slides contain certain non-gaap financial terms which are defined in the appendix. In addition, we have provided reconciliations of non-gaap terms to the closest GAAP term in the appendix. 1
3 FMC Corporation Diversified chemical company with leading market positions in industrial, consumer and agricultural markets globally ($ million, 12/31/04) FMC Revenue: $2,051.2 EBITDA: $369.8 Margin*: 18.0% Industrial Chemicals Revenue: $813.7 EBITDA: $124.3 Margin*: 15.3% Specialty Chemicals Revenue: $538.0 EBITDA: $128.5 Margin*: 23.9% Agricultural Products Revenue: $703.5 EBITDA: $147.7 Margin*: 21.0% * EBITDA margin 2
4 Company Strengths Leading market positions Global presence Diversified business mix and high-quality customer base Diversified and integrated cost structure Focused R&D and strong applications expertise Commitment to strong credit profile 3
5 Leading Market Positions Industrial Chemicals Agricultural Products Specialty Chemicals Product Soda Ash Hydrogen Peroxide Phosphorus Chemicals (1) Persulfates Pyrethroids Carbofuran Microcrystalline Cellulose Carrageenan Alginates Lithium Specialties Market Position #1 in N.A. #1 in N.A. #2 in N.A. (2) #1 in N.A. #2 in N.A. #1 Globally #1 Globally #1 Globally #2 Globally #1 Globally (1) (1) Shared (2) Held by Astaris, our 50%-owned joint venture 4
6 Global Presence Geographically diversified business Latin America 17% North America 43% Asia Pacific 11% Note: Based on 2004 consolidated sales Europe, Middle East & Africa 29% 5
7 Diversified Customers and End Markets Revenues by End Market Non-Cyclical 81% Food 8% Pharmaceuticals 11% Bottle Glass 3% Other 16% Chemicals 6% Cyclical 19% Pulp & Paper 4% Glass/Fiberglass 4% Electronics 2% Other 3% Detergents 10% Agricultural 33% Approximately 80% of sales are to non-cyclical end markets Long-term relationships with blue chip customers No one customer represents more than 5% of sales Top 10 customers in aggregate make up approximately 15% of sales Note: Based on 2003 consolidated sales 6
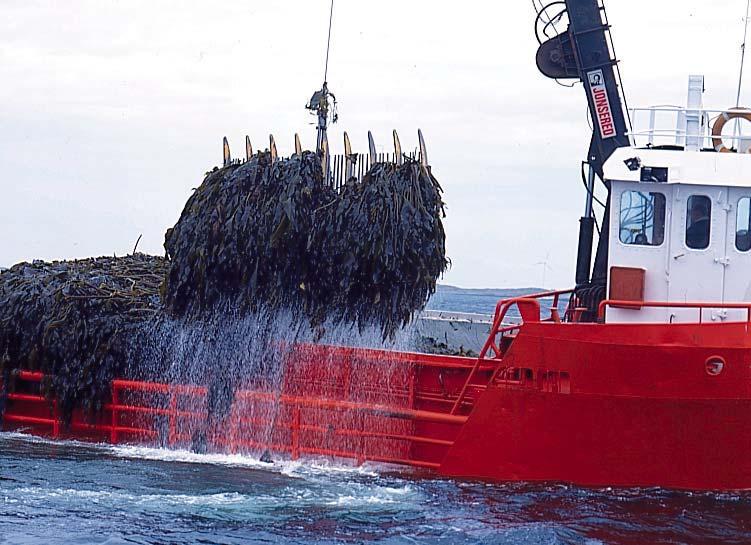
8 Diversified and Integrated Cost Structure Low-cost sourcing of raw materials Backward integration: soda ash, lithium Global sourcing of renewable resources: pulp, seaweed Low reliance on purchased raw materials Total raw materials represent approximately 25% of cost of sales Limited use of petrochemical feedstock reduces volatility of raw material costs No single raw material represents more than 7% of total raw material purchases Low energy demand requirements Energy costs represent approximately 10% of cost of sales 7
9 Focused R&D and Applications Expertise Agricultural Products Focused insecticide discovery strategy that combines whole insect screening with biochemical, target-based testing Use of state-of-the-art technologies including genomics, robotics and advanced computational software Specialty Chemicals BioPolymer focus on developing close working relationship with large food and pharmaceutical companies R&D groups Lithium focus on new compounds used in the chemical synthesis of active pharmaceutical ingredients and energy storage Industrial Chemicals Process R&D focused entirely on continued cost leadership 8
10 Our Objectives Unlocking value and creating a faster growing FMC Realize the operating leverage inherent within FMC Sustained double-digit growth in earnings* Industrial Chemicals recovery Continued growth in Specialty Chemicals and Agricultural Products Create greater financial flexibility Reduce net debt to $600 million by the end of 2006 Regain an investment grade credit rating Focus the portfolio on higher growth businesses Manage Specialty Chemicals and Agricultural Products for growth Manage Industrial Chemicals for cash Divest any business that cannot sustain our cost of capital Improve ROIC to 12 percent minimum by 2006 * Before restructuring and other income and charges 9


11 Industrial Chemicals 10
12 Industrial Chemicals Overview 2004 Consolidated Sales: $813.7 million Asia 7% Foret 35% Peroxygens 18% Alkali (Soda ash) 47% Europe/Middle East/Africa 36% Latin America 8% North America 50% Excludes phosphorus chemicals sales at Astaris JV, largely in North America #1 North American manufacturer of soda ash and peroxygens Backward integration into natural resources Low-cost, proprietary process technology 11
13 Industrial Chemicals 2005 Outlook Expected to be main driver of FMC s earnings growth in near term 2005 earnings to be up approximately 50 percent versus total price realization of $50 million Successful price increase on domestic non-restricted soda ash volume Significant improvement in soda ash export prices Peroxide price increase of a couple cents per lb. Higher selling prices for North American and European phosphates Peak soda ash prices expected by Partially offset by cost increases of $25 million Freight and energy account for 2/3 s of the increase Balance is raw materials: caustic, sulfuric acid, acetic acid, phosphate rock Increased volumes and fixed cost reduction to contribute 12
14 Industrial Chemicals Performance Now emerging from 2003 trough profits that were more than $100 million below the late 1990 s peak $250 25% $200 $194 $208 $177 20% Millions $150 $100 $133 $130 $94 $124 15% 10% Margin $50 5% $ EBITDA Capital Spending EBITDA Margin (%) 0% 13
15 Soda Ash Demand 12 North American Soda Ash Shipments 10 8 Export 6 Glass Container Demand Drivers: GDP Flat Glass Chemicals Detergents Other F Cost advantage of natural soda ash versus synthetic soda ash Industrialization rates in key export markets 14
16 U.S. Soda Ash Supply & Cost Positions Share of Nameplate Capacity Solvay OCI General SVM Wyoming Solvay Colorado 29% 20% 17% 19% 6% 9% 1.6 Cost Index Base = Solution Mining FMC Solution Mining FMC Longwall Mining Competitors 0 15
17 Sold-out U.S. Soda Ash Industry 2005 domestic price increase is the most significant since % U.S. Bulk Soda Ash Price Index (1990 = 1.0) U.S. Capacity Utilization (% Effective) 95% 90% 85% F 2005 Contract Renewals Price Index Effective Capacity Util.
18 Tight Domestic Hydrogen Peroxide Market 2005 to represent the third consecutive year of rising prices Hydrogen Peroxide Price Index (1994=1.0) Effective Capacity Utilization (%, North America) F Price Index Effective Capacity Util.


19 Specialty Chemicals 18
20 Specialty Chemicals Overview 2004 Consolidated Sales: $538.0 million Lithium 28% BioPolymer 72% Asia 15% Europe/Middle East/Africa 36% North America 41% Latin America 8% BioPolymer: Lithium: Adds structure, texture and stability to food Acts as a binder & disintegrant for dry tablet drugs Market leader in every product line One of two global, integrated manufacturers Focus on specialty products - pharmaceuticals and energy storage devices 19
21 Specialty Chemicals Performance The benefit of continued sales growth has recently been offset by cost pressures in BioPolymer $140 $120 $127 $122 $116 $132 $129 30% 25% Millions $100 $80 $60 $40 $20 20% 15% 10% 5% Margin $ EBITDA Capital Spending EBITDA Margin (%) 0% 20
22 Specialty Chemicals 2005 Outlook Expected to be the long-term driver of top and bottom line growth 2005 revenue growth in mid-single digits Strong organic growth in BioPolymer end-markets of 3-6% per year Focus on lithium specialty markets growing at 4 to >10% per year Selective increases in selling prices Earnings growth rate in excess of revenue growth Productivity improvements to drive margin expansion in 2005 Raw materials to remain stable versus 2004 and improve thereafter Promising new products for the future Oral-dosage-form technologies Functional food ingredients Fine chemistry applications of lithium 21


23 Agricultural Products 22
24 Agricultural Products Overview 2004 Consolidated Sales: $703.5 million Herbicides 25% Fungicides 2% Insecticides 73% Europe Middle East Africa 16% Asia 13% Latin America 36% North America 35% Proprietary, branded insecticides and herbicides Key crops: cotton, corn, rice, cereals, fruits and vegetables FMC differentiated by: Focused innovation (R&D is ~10% of sales) Cost reduction strategies The depth and breadth of partnerships and alliances 23
25 Agricultural Products Performance Significant recovery driven by improving global farm economy, strength in Brazil and benefits of a highly focused FMC strategy $160 $148 25% Millions $140 $120 $100 $80 $60 $114 $101 $99 $111 20% 15% 10% Margin $40 $20 $ % 0% EBITDA Capital Spending EBITDA Margin (%) 24
26 Agricultural Products 2005 Outlook Expected to remain strong near-term and benefit from inlicensed products in the next several years Relatively flat revenue versus 2004 Growth in new products and labels in the Americas and Europe Brazilian market to remain strong for at least another year Unfavorable impact of price pressure from generic producers in North American insecticides Similar earnings in 2005 versus 2004 Relatively flat sales Continued progress in reducing manufacturing costs via outsourcing Higher energy, raw material and freight costs In-licensed products to contribute $50-90 million to sales by 09 25
27 Financial Overview 26
28 Strong 2004 Results Outstanding performance in Agricultural Products A 10% year-over-year increase in sales Even stronger earnings growth of 44% Healthy pipeline of in-licensed and newly discovered compounds Improvement in Industrial Chemicals Generally higher North American selling prices Significant growth in soda ash export volumes $20 million in annual restructuring savings at Astaris Sold-out market conditions in several businesses Steady top-line growth in our Specialty Chemicals franchise Steady growth in demand for BioPolymer and Lithium Several unfavorable one-time cost impacts in 2004 Unfavorable raw material costs Reduction in net debt of $155 million 27
29 Multi-Year Recovery We remain on track to deliver a sustained multi-year recovery in sales and earnings Sales, $ millions 2,200 2,000 1,800 1,600 1,400 1, EPS*, $ 1, E - Sales EPS * Earnings before restructuring and other income and charges per diluted share; calculated in 2005E using the mid-point of January 28, 2005 guidance. 28
30 Contingent Obligation Update Legacy contingent obligations have largely been addressed As-of 2001 YE Current Astaris Keepwell Payments $111.9 million* $ - ** TG Soda Ash Payment*** $75 million $ - FTI Guarantees $ 289 million $4 million Note: * Reflects 50% of Astaris total debt at 12/31/01 ** Keepwell obligation ended February 2005 *** TG Soda Ash final payment of $32.4 million made on 12/31/03 29
31 Credit Statistics EBITDA Interest Expense, net 12/31/2004 $370 Capital Expenditures 85 Debt (1) Debt / EBITDA EBITDA / Interest Exp. (EBITDA - CapEx) / Interest Exp. 2.4x 4.7x 3.7x 1) Long-term debt plus current portion of long-term debt. 30
32 Capital Structure 12/31/ /31/ /31/2004 ($ - millions) Debt $250 Term Loan Due $100 Term Loan Due $400 million Revolving Credit Agreement % Notes Due Industrial Revenue & Pollution Control Bonds Other Public Domestic Debt Short-term Debt Total Debt $ 1,267.0 $ 1,050.2 $ Cash Restricted Cash Cash Total Cash $ $ $ Net Debt $ $ $ Stockholders' Equity $ $ $ Total Capital (Total Debt + Stockholders' Equity) $ 1,673.0 $ 1,638.5 $ 1,799.4 Net Debt/Total Capital, less all cash 69.0% 59.3% 44.4% 31
33 Lengthened Maturities Our successful refinancing in 2004 of our bank facilities addressed our maturity profile $ - millions $450 $417 $400 $350 $300 $250 $248 $200 $150 $100 $50 $0 $ $70 $63 $88 $
34 Summary Great businesses, each generating EBITDA of over $100 million Industrial Chemicals earnings still $75 million below peak Steady growth in Ag Products & Specialty Low capital expenditure requirements Significant improvement in creditworthiness 33
35 FMC Corporation
36 Non-GAAP Financial Terms These slides contain certain non-gaap financial terms which are defined below. In addition, we have provided reconciliations of non-gaap terms to the closest GAAP term in the appendix of this presentation. EBITDA (Earnings Before Interest, Taxes, Depreciation and Amortization) is the sum of Income (loss) from continuing operations before income taxes and Depreciation and Amortization. EBITDA Margin is the quotient of EBITDA (defined above) divided by Revenue. ROIC (Return on Invested Capital) is the sum of Earnings from continuing operations before restructuring and other income and charges and after-tax Interest expense divided by the sum of Short-term debt, Current portion of longterm debt, Long-term debt and Total shareholders equity. 35
37 Segment Financial Terms These slides contain references to segment financial items which are presented in detail in Note 19 of FMC s 2003 Form 10-K. Some of the segment financial terms are non-gaap financial terms and are defined below. In addition, we have provided reconciliations of non-gaap terms to the closest GAAP term in the appendix of this presentation. EBITDA (Earnings Before Interest, Taxes, Depreciation and Amortization) for a segment is the sum of Income (loss) from continuing operations before income taxes for that segment and Depreciation and Amortization for that segment. EBITDA Margin for a segment is the quotient of EBITDA (defined above) divided by Revenue for that segment. 36
38 Appendix: Earnings Reconciliation RECONCILIATION OF NET INCOME (GAAP) TO AFTER-TAX INCOME FROM CONTINUING OPERATIONS, EXCLUDING RESTRUCTURING AND OTHER INCOME AND CHARGES (NON-GAAP) (Unaudited, in millions, except per share amounts) Twelve Months Ended December 31, Diluted earnings per common share (GAAP) $ 4.28 $ 0.75 Discontinued operations per diluted share (GAAP) Restructuring and other charges per diluted share, before tax* Tax effect of restructuring and other charges per diluted share (0.16) (0.57) Write-off of deferred financing fees per diluted share** Tax effect of write-off of deferred financing fees per diluted share (0.10) - Tax adjustments per diluted share*** (1.90) - Diluted after-tax income from continuing operations per share, excluding restructuring and other income and charges (Non-GAAP) $ 3.20 $ 1.90 Average number of shares used in diluted after-tax income from continuing operations per share computations *Restructuring and other charges includes FMC's share of charges recorded by Astaris, LLC, the phosphorous joint venture. FMC's share of such charges are included in "Equity in loss of affiliates" and were $0.7 million-gain and $11.5 million, before tax, for the three and twelve months ended December 31, 2004 and $8.4 million and $53.3 million, before tax, for the three and twelve months ended December 31, 2003 respectively. **In conjunction with entering into the 2004 Credit Agreement on October 29, 2004, the Company wrote off $9.9 million of deferred financing fees associated with the previous credit agreements. ***For the three months ended December 31, 2004, tax adjustments represent a tax benefit of $38.6 million resulting from an adjustment to income tax liabilities due to a December 2004 pronouncement from the Internal Revenue Service and a tax benefit of $31.1 million primarily related to valuation allowance adjustments. For the twelve months ended December 31, 2004, tax adjustments includes the items noted in the three months ended December 31, 2004 as well as a tax benefit of $1.3 million resulting from a refund received from the Internal Revenue Service. 37
39 Appendix: EBITDA Reconciliation Reconciliation of full-year 2004 consolidated income from continuing operations before income taxes (a GAAP measure) to 2004 EBITDA (a Non-GAAP measure) (Unaudited, in millions) 12/31/2004 Income (loss) from continuing operations before income taxes $131.1 Add: Restructuring and other charges 15.0 Interest expense, net 78.4 Write-off of deferred financing fees 9.9 Affiliate Interest Expense 1.1 Depreciation and amortization EBITDA (Non-GAAP)
40 Appendix: Segment EBITDA Reconciliation Reconciliation of full-year 2004 segment operating profit (a GAAP measure) to 2004 EBITDA (a Non-GAAP measure) (Unaudited, in millions) Industrial Specialty Agricultural Segment Chemicals Chemicals Products FY 2004 segment operating profit (GAAP) $57.3 $96.1 $118.4 Add: Depreciation and amortization FY 2004 EBITDA (Non-GAAP) $124.3 $128.5 $
41 Appendix: ROIC Reconciliation Reconciliation of Numerator Income from Continuing Operations (GAAP) to numerator Income from Continuing Operations before restructuring and other income and charges and and after-tax interest expense, net (Non-GAAP) used in ROIC (Return on Invested Capital) calculation. (Unaudited, in millions) Actual Actual Income (loss) from continuing operations (GAAP) $ 39.8 $ Interest Expense, net Tax effect of Interest Expense, net (20.0) (18.2) Restructuring and other charges* Tax effect of restructuring and other charges (gains) (20.5) (5.8) Write-off of deferred financing fees** 9.9 Tax effect of write-off of deferred financing fees (3.9) Tax Adjustments*** (71.0) ROIC numerator (Non-GAAP) $ $ Point Average Denominator Dec-02 Dec-03 Dec-04 Short-term Debt $ 64.3 $ 13.8 $ 30.2 Current portion of long-term debt Long-term debt 1, , Shareholder's Equity $ 1,673.0 $ 1,638.5 $ 1,799.4 ROIC denominator (2 pt. avg) (GAAP) $ 1,655.8 $ 1,719.0 ROIC ( Using Non-GAAP Numerator) 8.4% 10.5% *Restructuring and other charges includes FMC's share of charges recorded by Astaris, LLC, the phosphorous joint venture. FMC's share of such charges are included in "Equity in loss of affiliates" and were $0.7 million-gain and $11.5 million, before tax, for the three and twelve months ended December 31, 2004 and $8.4 million and $53.3 million, before tax, for the three and twelve months ended December 31, 2003 respectively. **In conjunction with entering into the 2004 Credit Agreement on October 29, 2004, the Company wrote off $9.9 million of deferred financing fees associated with the previous credit agreements. ***For the three months ended December 31, 2004, tax adjustments represent a tax benefit of $38.6 million resulting from an adjustment to income tax liabilities due to a December 2004 pronouncement from the Internal Revenue Service and a tax benefit of $31.1 million primarily related to valuation allowance adjustments. For the twelve months ended December 31, 2004, tax adjustments includes the items noted in the three months ended December 31, 2004 as well as a tax benefit of $1.3 million resulting from a refund received from the Internal Revenue Service. 40
42 FMC Corporation
Longbow Research Minneapolis, MN October 12, 2005 W. Kim Foster Senior Vice President and CFO
 FMC Corporation Longbow Research Minneapolis, MN October 12, 2005 W. Kim Foster Senior Vice President and CFO Disclaimer Safe Harbor Statement under the Private Securities Litigation Reform Act of 1995
FMC Corporation Announces Agreement to Acquire Cheminova A/S. September 8, 2014
 FMC Corporation Announces Agreement to Acquire Cheminova A/S September 8, 2014 Safe Harbor Statement Statements in this presentation that are forward-looking statements are subject to various risks and
BAML Global Agriculture and Materials Conference. February 28, 2018
 BAML Global Agriculture and Materials Conference February 28, 2018 Safe Harbor Statement Safe Harbor Statement under the Private Securities Act of 1995: Statements in this news release that are forward-looking
Q Earnings Presentation August 2, 2018
 Q2 2018 Earnings Presentation August 2, 2018 Safe Harbor Statement Safe Harbor Statement under the Private Securities Act of 1995: Statements in this news release that are forward-looking statements are
STRENGTH DISCIPLINE VALUE. FMC CORPORATION 2005 Annual Report
 STRENGTH DISCIPLINE VALUE FMC CORPORATION 2005 Annual Report Financial Highlights FMC Corporation is one of the world s foremost, diversified chemical companies with leading positions in agricultural,
4Q 2017 Earnings Presentation February 13, 2018
 4Q 2017 Earnings Presentation February 13, 2018 Safe Harbor Statement Safe Harbor Statement under the Private Securities Act of 1995: Statements in this news release that are forward-looking statements
FMC Corp. NEUTRAL ZACKS CONSENSUS ESTIMATES (FMC-NYSE)
") February 17, 2015 FMC Corp. (FMC-NYSE) Current Recommendation SUMMARY DATA NEUTRAL Prior Recommendation Underperform Date of Last Change 12/17/2013 Current Price (02/16/15) $63.68 Target Price $67.00 52-Week
February 17, 2015 FMC Corp. (FMC-NYSE) Current Recommendation SUMMARY DATA NEUTRAL Prior Recommendation Underperform Date of Last Change 12/17/2013 Current Price (02/16/15) $63.68 Target Price $67.00 52-Week
Q Earnings Presentation November 6, 2018
 Q3 2018 Earnings Presentation November 6, 2018 Safe Harbor Statement Safe Harbor Statement under the Private Securities Litigation Reform Act of 1995: Statements in this news release that are forward-looking
intermediates chemical intermediates
 FMC Corporation (FMC) was incorporated in 1928 under Delaware law and has its principal executive offices at 1735 Market Street, Philadelphia, Pennsylvania 19103. Throughout this Annual Report on Form
Fourth Quarter and Full- Year 2017 Earnings February 1, 2018
 Fourth Quarter and Full- Year 207 Earnings February, 208 Forward-Looking Statements Certain statements in these slides and made during this presentation may be considered forward-looking statements. These
Investor Presentation February 2017
 Investor Presentation February 2017 Safe Harbor Certain statements in this document regarding anticipated financial, business, legal or other outcomes including business and market conditions, outlook
Forward-Looking Statements
 Fourth Quarter 2014 Conference Call February 17, 2015 Forward-Looking Statements Certain information contained in this presentation constitutes forward-looking statements for purposes of the safe harbor
Dow Reports Fourth Quarter Results Record Fourth Quarter Sales and Strong Earnings Second Highest Annual Earnings in Company s History
 January 25, 2007 Dow Reports Fourth Quarter Results Record Fourth Quarter Sales and Strong Earnings Second Highest Annual Earnings in Company s History Fourth Quarter of Highlights Sales set a new fourth
January 28, 2014 Media Contact: Patty Seif WILMINGTON, Del Investor Contact:
 January 28, 2014 Media Contact: Patty Seif WILMINGTON, Del. 302-774-4482 patricia.r.seif@dupont.com Investor Contact: 302-774-4994 DuPont Reports 4Q and Full-Year 2013 Operating EPS of $.59 and $3.88;
First Quarter 2010 Highlights
 Dow Reports First Quarter Results Accelerated Sales Growth, Broad-Based EBITDA Margin Expansion and Record Equity Earnings Drive Higher Operating Results versus the Same Quarter Last Year First Quarter
ZEBRA TECHNOLOGIES SECOND-QUARTER 2016 RESULTS. August 9, 2016
 ZEBRA TECHNOLOGIES SECOND-QUARTER 2016 RESULTS August 9, 2016 Anders Gustafsson Chief Executive Officer Mike Smiley Chief Financial Officer 2 Safe Harbor Statement Statements made in this presentation
Second Quarter 2011 Review. July 28, John V. Faraci Chairman & Chief Executive Officer
 John V. Faraci Chairman & Chief Executive Officer Second Quarter 2011 Review July 28, 2011 Tim S. Nicholls Senior Vice President & Chief Financial Officer Forward-Looking Statements Certain statements
Forward-Looking Statements
 Third Quarter 2015 Conference Call October 29, 2015 Forward-Looking Statements Certain information contained in this presentation constitutes forward-looking statements for purposes of the safe harbor
Forward-Looking Statements
 Third Quarter 2014 Conference Call October 29, 2014 Forward-Looking Statements Certain information contained in this presentation constitutes forward-looking statements for purposes of the safe harbor
Third Quarter 2017 Earnings October 25, 2017
 Third Quarter 2017 Earnings October 25, 2017 Forward-Looking Statements Certain statements in these slides and made during this presentation may be considered forward-looking statements. These statements
Waters Corporation Management Presentation
 Waters Corporation Management Presentation Chris O Connell Chairman & Chief Executive Officer January 2019 Cautionary Statements This presentation may contain forward-looking statements regarding future
Third Quarter 2016 Earnings October 27, 2016
 Third Quarter 2016 Earnings October 27, 2016 Forward-Looking Statements Certain statements in these slides and made during this presentation may be considered forward-looking statements. These statements
Waters Corporation Management Presentation. July 2018
 Waters Corporation Management Presentation July 2018 Cautionary Statements This presentation may contain forward-looking statements regarding future results and events. For this purpose, any statements
Q2 FY17 Results April 26, 2017
 Q2 FY17 Results April 26, 2017 Steve Voorhees Chief Executive Officer Ward Dickson Chief Financial Officer Jim Porter President, Business Development and Latin America Jeff Chalovich President, Corrugated
DuPont Segment Commentary
 This data should be read in conjunction with the Company s third quarter earnings news release dated October 22, and DuPont s 3Q Earnings Conference Call presentation materials posted on the Investor Center
4Q 2018 Highlights and Operating Results. Products. Technology. Services. Delivered Globally.
 4Q 2018 Highlights and Operating Results Products. Technology. Services. Delivered Globally. Table of Contents Page 3 Safe Harbor Statement and Non-GAAP Financial Measures 4 Sales Overview 9 Overview of
ZEBRA TECHNOLOGIES FIRST QUARTER 2016 RESULTS May 10, 2016
 ZEBRA TECHNOLOGIES FIRST QUARTER 2016 RESULTS May 10, 2016 Anders Gustafsson Chief Executive Officer Mike Smiley Chief Financial Officer 2 Safe Harbor Statement Statements made in this presentation which
Bank of America Merrill Lynch 2015 Paper, Packaging and Builders Conference Owens-Illinois, Inc. December 10, 2015
 Bank of America Merrill Lynch 2015 Paper, Packaging and Builders Conference Owens-Illinois, Inc. December 10, 2015 Safe harbor comments Regulation G The information presented here regarding adjusted net
FMC Corporation Announces Acquisition of Significant Portion of DuPont s Crop Protection Business; Simultaneous Sale of Health and Nutrition to DuPont
 FMC Corporation Announces Acquisition of Significant Portion of DuPont s Crop Protection Business; Simultaneous Sale of Health and Nutrition to DuPont March 31, 2017 As Prepared for Delivery Introduction
Agilent Technologies. December 1, 2009 President and General Manager. Ron Nersesian. The Phoenician Electronic Measurement Group Scottsdale, AZ
 Agilent Technologies Credit Suisse Annual Technology Conference Ron Nersesian December 1, 2009 President and General Manager The Phoenician Electronic Measurement Group Scottsdale, AZ Safe Harbor Statement
First Quarter 2018 May 3, 2018
 First Quarter 2018 May 3, 2018 Safe Harbor Please note that in this presentation, we may discuss events or results that have not yet occurred or been realized, commonly referred to as forward-looking statements.
productivity results support our confidence in raising the full-year earnings outlook.
 April 21, 2011 Media Contact: Anthony Farina WILMINGTON, Del. 302-773-4418 anthony.r.farina@usa.dupont.com Investor Contact: 302-774-4994 DuPont Reports 1Q 2011 Earnings of $1.52 per Share, Raises 2011
Investor Presentation
 Investor Presentation November 2014 Lee D. Rudow President and CEO John J. Zimmer Sr. Vice President of Finance and CFO 1 Safe Harbor Statement This presentation contains forward-looking statements within
ECOLAB FIRST QUARTER 2018
 1Q 2018 Overview Sales: ECOLAB FIRST QUARTER 2018 Reported sales +10% and fixed currency and acquisition adjusted fixed currency sales +6%. New business growth, share gains, pricing and new product introductions
Fiscal Year 2016 Fourth Quarter Conference Call
 Fiscal Year 2016 Fourth Quarter Conference Call November 7, 2016 2 Safe Harbor Statement This presentation includes statements related to the expected future results of the company and are therefore forward-looking
ICL MAKES A STEP CHANGE IN ITS GLOBAL PHOSPHATE BUSINESS BY FORMING A STRATEGIC ALLIANCE WITH CHINA S YUNNAN YUNTIANHUA
 PRESS CONTACT INVESTOR RELATIONS CONTACT Amiram Fleisher Limor Gruber Fleisher Communications Head of Investor Relations, ICL +972-3-6241241 +972-3-684-4471 amiram@fleisher-pr.com Limor.Gruber@icl-group.com
Fourth Quarter and Full Year 2017 Financial Results February 19, 2018
 Fourth Quarter and Full Year 2017 Financial Results February 19, 2018 Trademark of Trinseo S.A. or its affiliates Introductions & Disclosure Rules Introductions Chris Pappas, President & CEO Barry Niziolek,
ITT Inc. Q Earnings Call & 2018 Guidance
 ITT Inc. Q4 2017 Earnings Call & 2018 Guidance February 16, 2018 Safe Harbor This presentation contains forward-looking statements intended to qualify for the safe harbor from liability established by
ECOLAB THIRD QUARTER 2018
 3Q 2018 Overview Sales: ECOLAB THIRD QUARTER 2018 Reported sales +5%; fixed currency sales were +6%, with acquisition adjusted fixed currency sales +7%. New business growth, share gains, pricing and new
Second Quarter 2016 Earnings July 28, 2016
 Second Quarter 2016 Earnings July 28, 2016 Forward-Looking Statements Certain statements in these slides and made during this presentation may be considered forward-looking statements. These statements
Q Investor Highlights. August 8, 2018
 Q2 2018 Investor Highlights August 8, 2018 Forward Looking Statements This document contains forward-looking statements, that is, information related to future, not past, events. Such statements generally
J.P. Morgan Auto Conference
 J.P. Morgan Auto Conference August 11, 2015 Forward-Looking Statements Certain information contained in this presentation constitutes forward-looking statements for purposes of the safe harbor provisions
2016 THIRD-QUARTER EARNINGS REVIEW October 25, 2016
 2016 THIRD-QUARTER EARNINGS REVIEW October 25, 2016 0 THIRD-QUARTER EARNINGS PRESENTATION WHIRLPOOL CORPORATION ADDITIONAL INFORMATION This presentation contains forward-looking statements about Whirlpool
Rockwell Automation. Company Overview August 2018 PUBLIC. Copyright 2018 Rockwell Automation, Inc. All Rights Reserved.
 Rockwell Automation Company Overview August 2018 SAFE HARBOR STATEMENT THIS PRESENTATION INCLUDES STATEMENTS RELATED TO THE EXPECTED FUTURE RESULTS OF THE COMPANY AND ARE THEREFORE FORWARD-LOOKING STATEMENTS.
W. R. Grace & Co. Fourth Quarter 2014 Business Update. Investor Presentation February 5, 2015
 W. R. Grace & Co. Fourth Quarter Business Update Investor Presentation February 5, 2015 Disclaimer Statement Regarding Safe Harbor For Forward-Looking Statements This presentation contains forward-looking
First Quarter 2015 Conference Call
 First Quarter 2015 Conference Call April 29, 2015 Forward-Looking Statements Certain information contained in this presentation constitutes forward-looking statements for purposes of the safe harbor provisions
This is an English convenience translation of the original Hebrew version. In case of any discrepancy, the binding version is the Hebrew original
 This is an English convenience translation of the original Hebrew version. In case of any discrepancy, the binding version is the Hebrew original Israel Corporation Ltd. Registrar Number: 520028010 Form
Goldman Sachs Industrials Conference 2015
 Goldman Sachs Industrials Conference 2015 November 3, 2015 Forward-Looking Statements Certain information contained in this presentation constitutes forward-looking statements for purposes of the safe
Q3 Fiscal Year 2013 Earnings Conference Call
 NASDAQ: CMCO Q3 Fiscal Year 2013 Earnings Conference Call January 25, 2013 Timothy T. Tevens President & Chief Executive Officer Gregory P. Rustowicz Vice President - Finance & Chief Financial Officer
Full-Year / Fourth Quarter 2010 Results
 Full-Year / Fourth Quarter 2010 Results 16 February 2011 Disclaimer This presentation contains certain statements that are neither reported financial results nor other historical information. This presentation
Forward-Looking Statements
 Fourth Quarter 2015 Conference Call February 9, 2016 Forward-Looking Statements Certain information contained in this presentation constitutes forward-looking statements for purposes of the safe harbor
During the year, the Company achieved a number of milestones in executing its growth strategy:
 Party City Announces Fourth Quarter and Full Year 2015 Results Revenue increase of 4% 1 on a constant currency basis to a record $2.29 billion for fiscal year 2015 Adjusted Net Income increase of 32% in
Ingersoll Rand s Acquisition of Precision Flow Systems (PFS) February 11, 2019
 February 11, 2019") Ingersoll Rand s Acquisition of Precision Flow Systems (PFS) February 11, 2019 1 Safe Harbor This presentation contains forward-looking statements, which are statements that are not historical facts, including
Ingersoll Rand s Acquisition of Precision Flow Systems (PFS) February 11, 2019 1 Safe Harbor This presentation contains forward-looking statements, which are statements that are not historical facts, including
3Q 2017 Conference Call
 FMC Corporation 3Q 2017 Conference Call November 7, 2017 As Prepared for Delivery Introduction Michael Wherley Thank you and good morning everyone. Welcome to FMC Corporation s third quarter earnings call.
Forward-Looking Statements
 First Quarter 2016 Conference Call April 27, 2016 Forward-Looking Statements Certain information contained in this presentation constitutes forward-looking statements for purposes of the safe harbor provisions
BASF We create chemistry. Dr. Lars Budde, Senior Manager Investor Relations EQUITA European Conference, Milan, November 23, 2017
 BASF We create chemistry Dr. Lars Budde, Senior Manager Investor Relations EQUITA European Conference, Milan, November 23, 2017 Cautionary note regarding forward-looking statements This presentation contains
First Quarter 2011 Highlights
 April 28, 2011 Dow Reports First Quarter Results Dow Delivers 90 Percent Increase in Earnings Per Share Driven by 20 Percent Sales Gain and Broad-Based Demand Growth (1) First Quarter 2011 Highlights Earnings
Sept Treasurer. Vice President Finance & Chief Financial Officer
 Sept 28 2017 Investor Sidoti & Company Presentation Fall Convention Gregory Mark D. Morelli P. Rustowicz Vice President President and Chief Finance Executive & Chief Officer Financial Officer Jon Gregory
4Q 2017 Highlights and Operating Results
 4Q 2017 Highlights and Operating Results January 30, 2018 1 4Q 2017 Highlights and Operating Results Table of Contents Page(s) 1 Sales Overview 4-8 2 Financial Performance Trends 9-16 3 Leverage Metrics
Commercial and Consumer Fine Papers. Filtration. Premium Packaging. Digital Transfer Media. Paper Gift Cards & Packaging. Backings (Tape & Abrasives)
") v Filtration Commercial and Consumer Fine Papers Premium Packaging Digital Transfer Media Backings (Tape & Abrasives) Paper Gift Cards & Packaging High End Spirits Labels Other Performance Materials (Labels,
v Filtration Commercial and Consumer Fine Papers Premium Packaging Digital Transfer Media Backings (Tape & Abrasives) Paper Gift Cards & Packaging High End Spirits Labels Other Performance Materials (Labels,
Wells Fargo Securities Industrial & Construction Conference May 8, 2014 New York
 Wells Fargo Securities Industrial & Construction Conference May 8, 2014 New York Nick Fanandakis Chief Financial Officer E. I. du Pont de Nemours & Company Regulation G The attached charts include company
October 27, 2015 Media Contact: Dan Turner WILMINGTON, Del Investor Contact:
 October 27, 2015 Media Contact: Dan Turner WILMINGTON, Del. 302-996-8372 daniel.a.turner@dupont.com Investor Contact: 302-774-4994 DuPont Reports 3Q Operating EPS of $0.13; YTD Operating EPS of $2.49 Cost
Innophos Holdings, Inc.
 Innophos Holdings, Inc. Jefferies Industrials Conference August 12, 2015 Safe Harbor During the course of this presentation, management may make forward-looking statements regarding financial performance
Bank of America Global Agriculture and Chemicals Conference
 Bank of America Global Agriculture and Chemicals Conference Sergey Vasnetsov SVP, Strategic Planning & Transactions March 2, 2016 Cautionary Statement The statements in this presentation relating to matters
4Q15 Earnings Presentation
 1 www.lbfoster.com 4Q15 Earnings Presentation March 1, 2016 2 Safe Harbor Statement This presentation and oral statements regarding the subject matter may contain forwardlooking statements within the meaning
Western New York Investors Conference
 Western New York Investors Conference September 26, 2014 Lee D. Rudow President and CEO John J. Zimmer Sr. Vice President of Finance and CFO 1 Safe Harbor Statement This presentation contains forward-looking
Albemarle Corporation Second Quarter 2018 Earnings and Non-GAAP Reconciliations Conference Call/Webcast Wednesday, August 8 th, :00am ET
 Albemarle Corporation Second Quarter 2018 Earnings and Non-GAAP Reconciliations Conference Call/Webcast Wednesday, August 8 th, 2018 9:00am ET Forward-Looking Statements Some of the information presented
Third Quarter Fiscal 2019 Earnings Call
 NYSE: GHM January 30, 2019 Third Quarter Fiscal 2019 Earnings Call James R. Lines President & Chief Executive Officer Jeffrey F. Glajch Vice President & Chief Financial Officer 2019 Graham Corp. 1 Safe
Second Quarter 2018 Earnings Teleconference. July 31, 2018
 Second Quarter 2018 Earnings Teleconference July 31, 2018 CONTENTS Q2 2018 Summary 2018 Guidance Q2 2018 Supplemental Information Appendix 2 Disclosure Regarding Forward-Looking Statements Information
Transcat Reports Fiscal 2015 Second Quarter Record Revenue of $31.1 Million; Earnings per Diluted Share Up 20%
 Transcat, Inc. 35 Vantage Point Drive Rochester NY 14624 Phone: (585) 352-7777 IMMEDIATE RELEASE NEWS RELEASE Transcat Reports Fiscal 2015 Second Quarter Record Revenue of $31.1 Million; Earnings per Diluted
2017 THIRD QUARTER RESULTS. Ended September 30, 2017
 2017 THIRD QUARTER RESULTS Ended September 30, 2017 Forward Looking Statements Disclaimer This presentation contains statements, including statements about future plans and expectations, which constitute
Third Quarter 2018 Results November 8, 2018
 Third Quarter 2018 Results November 8, 2018 Safe Harbor Caution Regarding Forward Looking Statements This presentation any other oral or written statements made by us or on our behalf may include forward-looking
Q4 and Full Year 2018 Earnings Call
 We make healthy possible Q4 and Full Year 2018 Earnings Call Financial Results and Business Update February 28, 2019 Safe Harbor Statement Safe Harbor Statement Certain statements contained herein, regarding
Fourth-Quarter 2017 Results. January 31, 2018
 Fourth-Quarter 2017 Results January 31, 2018 Safe Harbor This presentation includes forward-looking statements which are statements that are not historical facts, including statements that relate to the
PolyOne Investor Presentation Credit Suisse Boston Basic Materials Conference. June 26, 2013
 PolyOne Investor Presentation Credit Suisse Boston Basic Materials Conference June 26, 2013 Forward Looking Statements In this presentation, statements that are not reported financial results or other
2011 Full Year Results
 2011 Full Year Results Basel: February 8, 2012 Safe harbor This document contains forward-looking statements, which can be identified by terminology such as expect, would, will, potential, plans, prospects,
4Q16 Earnings Presentation
 TUBULAR & ENERGY SERVICES CONSTRUCTION PRODUCTS RAIL PRODUCTS & SERVICES www.lbfoster.com 4Q16 Earnings Presentation March 2, 2017 Safe Harbor Statement This presentation and oral statements regarding
Q Investor Highlights. May 8, 2018
 Q1 2018 Investor Highlights May 8, 2018 Forward Looking Statements This document contains, and our other public communications may contain, forward-looking statements, that is, information related to future,
Graham Corporation Reports Fiscal 2018 Third Quarter and Year-to-Date Results
 News Release IMMEDIATE RELEASE Reports Fiscal 2018 Third Quarter and Year-to-Date Results Third quarter orders of $40 million, backlog increased to $96 million Diluted loss per share of $1.19, included
2Q 2017 Highlights and Operating Results
 2Q 2017 Highlights and Operating Results July 25, 2017 1 2Q 2017 Highlights and Operating Results Table of Contents Page(s) 1 Sales Overview and Highlights 4-5 2 NSS Overview 6-7 3 EES Overview 8-9 4 UPS
Second Quarter 2018 Earnings I July 26, 2018
 Second Quarter 208 Earnings I July 26, 208 Forward-Looking Statements Certain statements in this presentation may be considered forward-looking statements. Words such as expects, anticipates, estimates,
Second Quarter 2018 Results July 31, 2018
 Second Quarter 2018 Results July 31, 2018 Eddie Edwards President and Chief Executive Officer Alex Pease Executive Vice President and Chief Financial Officer Safe harbor Caution Regarding Forward Looking
News. PPG reports second quarter 2016 financial results
 News PPG Media Contact: Mark Silvey Corporate Communications +1-412-434-3046 silvey@ppg.com PPG Investor Contact: Scott Minder Investor Relations +1-412-434-3466 sminder@ppg.com www.ppg.com/investor PPG
A LEADING PRODUCER OF NATURAL SODA ASH
 A LEADING PRODUCER OF NATURAL SODA ASH OCI RESOURCES LP INVESTOR PRESENTATION AUGUST 2014 OCI Resources LP 1 ORGANIZATIONAL OVERVIEW Organizational Structure OCI Enterprises Inc. 100% OCI Chemical Corporation
Investors: Antonella Franzen (609) CONTACT: Ryan Edelman (609) Media: Fraser Engerman (414) FOR IMMEDIATE RELEASE
 CONTACT: Ryan Edelman (609) Media: Fraser Engerman (414) FOR IMMEDIATE RELEASE") FOR IMMEDIATE RELEASE CONTACT: Investors: Antonella Franzen (609) 720-4665 Ryan Edelman (609) 720-4545 Media: Fraser Engerman (414) 524-2733 Johnson Controls reports fiscal and full year earnings with
FOR IMMEDIATE RELEASE CONTACT: Investors: Antonella Franzen (609) 720-4665 Ryan Edelman (609) 720-4545 Media: Fraser Engerman (414) 524-2733 Johnson Controls reports fiscal and full year earnings with
Fiscal Year nd Quarter Earnings Conference Call Presentation April 27, 2011
 Fiscal Year 2011 2nd Quarter Earnings Conference Call Presentation April 27, 2011 Jim Rubright Chairman and Chief Executive Officer Steve Voorhees EVP, Chief Financial Officer and Chief Administrative
We create chemistry for a sustainable future
 Dr. Stefanie Wettberg Senior Vice President Investor Relations Investor Visit Ludwigshafen June 27, 2017 We create chemistry for a sustainable future Cautionary note regarding forward-looking statements
LafargeHolcim makes good progress in 2017; Strategy 2022 to drive growth. EPS 11.9% up on prior year excluding impairment and divestments
 Zurich, 07:00, March 2, 2018 LafargeHolcim makes good progress in 2017; Strategy 2022 to drive growth 4.7% growth in Net Sales on like-for-like basis Recurring EBITDA up 6.1% on like-for-like basis EPS
Johnson Controls reports fiscal Q3 earnings with strong organic growth and underlying margin expansion
 FOR IMMEDIATE RELEASE CONTACT: Investors: Antonella Franzen (609) 720-4665 Ryan Edelman (609) 720-4545 Media: Fraser Engerman (414) 524-2733 Johnson Controls reports fiscal Q3 earnings with strong organic
Dunkin Brands Group, Inc.
 Dunkin Brands Group, Inc. Investor Presentation Fourth Quarter 2013 1 Forward-Looking Statements Certain information contained in this presentation, particularly information regarding future economic performance,
Fiscal Year st Quarter Earnings Conference Call
 Fiscal Year 2018 1 st Quarter Earnings Conference Call February 7, 2018 www.jacobs.com worldwide Forward-Looking Statement Disclaimer Certain statements contained in this presentation constitute forward-looking
CommScope Reports Fourth Quarter and Full Year 2018 Results
 CommScope Reports Fourth Quarter and Full Year 2018 Results February 21, 2019 Fourth Quarter 2018 Performance Sales of $1.06 billion GAAP operating income of $49 million Non-GAAP adjusted operating income
We create chemistry for a sustainable future
 Ingo Rose Director Investor Relations Redburn Conference Toronto May 9-10, 2017 We create chemistry for a sustainable future Cautionary note regarding forward-looking statements This presentation contains
2014 Investor Forum. Joe Harlan Chief Commercial Officer and Vice Chairman, Market Businesses November 13, Dow.com
 2014 Investor Forum Joe Harlan Chief Commercial Officer and Vice Chairman, Market Businesses November 13, 2014 Dow.com SEC Disclosure Rules Some of our comments today include statements about our expectations
Investor Presentation
 Investor Presentation November 2018 SAFE HARBOR STATEMENT & NON-GAAP MEASURES Statements in this presentation include forward-looking statements within the meaning of the Private Securities Litigation
First Quarter 2016 Business Update
 Focused. First Quarter 2016 Business Update Innovative. Investor Presentation April 27, 2016 Performance Driven. Disclaimer Statement Regarding Safe Harbor For Forward-Looking Statements This presentation
ZEBRA TECHNOLOGIES. William Blair Growth Stock Conference June 16, 2016
 ZEBRA TECHNOLOGIES William Blair Growth Stock Conference June 16, 2016 Safe Harbor Statement Statements made in this presentation which are not statements of historical fact are forward-looking statements
October 22, 2013 Media Contact: Patty Seif WILMINGTON, Del Investor Contact:
 October 22, 2013 Media Contact: Patty Seif WILMINGTON, Del. 302-774-4482 patricia.r.seif@dupont.com Investor Contact: 302-774-4994 DuPont Delivers 3Q 2013 Operating Earnings of $.45 per Share Sales Increase
Investor Presentation
 Sept. 2015 Investor Presentation Lee D. Rudow President and CEO John J. Zimmer Senior VP of Finance and CFO 1 Safe Harbor Statement This presentation contains forward-looking statements within the meaning
Q3 FY17 Results August 3, 2017
 Q3 FY17 Results August 3, 2017 Steve Voorhees Chief Executive Officer Ward Dickson Chief Financial Officer Jim Porter President, Business Development and Latin America Jeff Chalovich President, Corrugated