Important Notice PAGE 2
|
|
|
- Asher Thompson
- 5 years ago
- Views:
Transcription

1 MIC September 2018
2 Important Notice This presentation by Macquarie Infrastructure Corporation (MIC) is proprietary and all rights are reserved. Any reproduction, in whole or in part, without the prior written consent of MIC is prohibited. This presentation is based on information generally available to the public and does not contain any material, non-public information. The presentation has been prepared solely for informational purposes. It is not a solicitation of any offer to buy or sell any security or instrument. This presentation contains forward-looking statements. Forwardlooking statements in this presentation are subject to a number of risks and uncertainties, some of which are beyond our control. Our actual results, performance, prospects or opportunities could differ materially from those expressed in or implied by the forward-looking statements. A description of known risks that could cause our actual results to differ appears under the caption Risk Factors in our Form 10-K filed with the SEC on February 21, 2018, our Form 10-Q filed with the SEC on August 1, 2018, and other materials filed with the SEC subsequently. Additional risks of which we are not currently aware could also cause our actual results to differ. These forward-looking statements are made as of the date of this presentation. We undertake no obligation to publicly update or revise any forward-looking statements whether as a result of new information, future events or otherwise, except as required by law. Macquarie Group consists of Macquarie Group Limited and its worldwide subsidiaries and affiliates. MIC is not an authorized deposit-taking institution for the purposes of the Banking Act 1959 (Commonwealth of Australia) and its obligations do not represent deposits or other liabilities of Macquarie Bank Limited ABN Macquarie Bank Limited does not guarantee or otherwise provide assurance in respect of the obligations of MIC. Use of Non-GAAP Metrics In addition to our results under U.S. GAAP, we use certain non- GAAP measures to assess the performance and prospects of our businesses. In particular, we use EBITDA excluding non-cash items, Free Cash Flow and certain proportionately combined financial metrics. Proportionately combined financial metrics reflect our proportionate ownership interest in our wind and solar facilities. We define EBITDA excluding non-cash items as net income (loss) or earnings the most comparable GAAP measure before interest, taxes, depreciation and amortization and non-cash items including impairments, unrealized derivative gains and losses, adjustments for other non-cash items and pension expense reflected in the statements of operations. EBITDA excluding noncash items also excludes base management fees and performance fees, if any, whether paid in cash or stock. We define Free Cash Flow as cash from operating activities the most comparable GAAP measure which includes cash paid for interest, taxes and pension contributions, less maintenance capital expenditures, which includes principal repayments on capital lease obligations used to fund maintenance capital expenditures, and excludes changes in working capital. Please review our Form 10-Q and earnings release, filed on August 1, 2018, for a complete discussion of our use of non-gaap metrics and reconciliations to the most comparable GAAP measures. PAGE 2
3 MIC Overview MIC provides investors with an opportunity to generate an attractive risk-adjusted total return through the ownership of infrastructure and infrastructure-like businesses Ticker Symbol NYSE: MIC Market Capitalization 1 ~$4.0 billion Current Dividend 2 $4.00/share Dividend Yield 1,2 ~8.5% Credit Rating BBB 3 MIC s businesses: Are large-scale, capital intensive providers of essential services upon which the growth of a modern community depend Employ long-lived, high-value physical assets that often create a privileged position in their respective markets Tend to generate revenue and/or gross profit that reflects a pass through of rising costs and insulates investors from the negative aspects of historically normal rates of inflation We are confident in our ability to continue to deliver long-term value to shareholders: Expertise and track record of success Disciplined capital management Balance sheet strength and flexibility Organic and inorganic growth prospects 1. As of September 5, Reflects quarterly dividend of $1.00/share, declared for the quarter ended June 30, 2018, annualized. Dividends are subject to the continued stable performance of MIC s businesses, no material deterioration in the condition of the broader U.S. economy, and authorization of the Company s Board of Directors. 3. S&P Global Ratings, a business unit of Standard & Poor s Financial Services LLC. PAGE 3


4 MIC Overview Owns and operates a diverse portfolio of infrastructure businesses in the U.S. IMTT An industry leader in the handling and storage of bulk liquid petroleum, chemical and agricultural products 46% of EBITDA 1 Atlantic Aviation Operates one of the largest networks of fixed base operations (FBOs) across the U.S. 37% of EBITDA 1 Contracted Controlling interests in seven solar 10% Power 2 facilities and two wind facilities 2 of EBITDA 1 MIC Hawaii Comprises Hawaii Gas and businesses collectively engaged in efforts to reduce the cost and improve the reliability and sustainability of energy in Hawaii 7% of EBITDA 1 1. Proportionately combined EBITDA for the three months ended June 30, 2018, pro forma to exclude BEC (announced on July 29, 2018) and reflecting MIC s proportionate ownership interest in its wind and solar facilities. Excludes $9.9 million of losses from MIC Corporate. 2. MIC announced that it has entered into an agreement to sell 100% of BEC, which currently forms part of the Contracted Power segment. The transaction is expected to close in the fourth quarter of 2018, subject to receipt of customary regulatory and other approvals. PAGE 4
5 International-Matex Tank Terminals Business Overview An independent provider of bulk liquid terminal services in the U.S. Stores and handles refined petroleum products, chemicals, and vegetable/tropical oils Services include storage tank rentals, dock and inter-modal transportation access, product throughput, heating, blending, and packaging Presence in key commodity distribution, transhipment, and trading hubs Demand tied to the overall level of commodity consumption, import and export activity, and geographical imbalances in commodity supply and demand Expected to grow through investments in additional capacity and capability Key Statistics Geographic Footprint 5 Terminals 1 Storage Capacity 2 Net Income 3 EBITDA excluding non-cash items 3 Cash from Operations 3 Free Cash Flow 3 19 (17 U.S. / 2 Canada) 48.6 million barrels $362.1 million $312.9 million $252.9 million $231.7 million Net Debt/EBITDA 3,4 3.7x 1. One Canadian facility is 20% owned by IMTT. 2. As of June 30, Includes 3.0m bbl in Newfoundland and 0.6m bbl in Geismar not subject to lease agreements. 3. For the twelve months ended June 30, EBITDA excluding non-cash items and Free Cash Flow are non-gaap measures. 4. Pro forma for full year EBITDA impact of acquisitions in 2017 and the repayment of $150 million outstanding on the revolving credit facility using the proceeds of the sale of BEC. 5. IMTT s two Canadian facilities are not depicted. PAGE 5


6 IMTT Key Markets IMTT St. Rose IMTT Bayonne PAGE 6
7 Atlantic Aviation Domestic FBO Network Owns one of the largest U.S. networks of Fixed Base Operations Provides fuel and fuel related services, de-icing, aircraft parking, hangar rental, catering, and other services primarily to general aviation (non-commercial) aircraft owners and operators Operates at 70 domestic airports subject to long-dated leases granted by airport authorities Demand driven bygeneral aviation flight activity, the installed base of turbine aircraft, and average fuel consumption across the installed base Changes in underlying fuel costs are passed through to consumers - seeks to maintain, and ultimately grow, dollar based fuel margins Locations 1 70 Key Statistics Geographic Footprint 1,5 WA Remaining Lease Life 1,2 Net Income 3 EBITDA excluding non-cash items 3 Cash from Operations 3 Free Cash Flow years $139.6 million $256.2 million $217.2 million $200.4 million Net Debt/EBITDA 3,4 2.6x 1. As of June 30, Weighted by EBITDA excluding non-cash items in the prior calendar year, adjusted for the impact of acquisitions and dispositions. 3. For the twelve months ended June 30, EBITDA excluding non-cash items and Free Cash Flow are non-gaap measures. 4. Pro forma for full year EBITDA impact of acquisitions in Not depicted are four locations in Alaska. PAGE 7


8 Atlantic Aviation Las Vegas, NV New 37,000 ft 2 hangar at LAX PAGE 8
9 Contracted Power Business Overview Employs proven power technologies to produce a stable stream of cash flows Controlling interests in solar / wind facilities, 100% of a gas-fired facility - Announced agreement to sell 100% of BEC power generation facility on July 29, Expected to close in 4Q 18, subject to receipt of customary regulatory and other approvals Electricity sold to creditworthy off-takers, typically under multi-year contracts - Renewables have weighted average remaining contract life of ~15 years (MW weighted) Joint venture with a developer of renewable power generation and storage projects Key Statistics Capacity Growth Gross Generating Capacity 1 Net Income 2 989MW $36.2 million 1, EBITDA excluding non-cash items 2,3 Cash from Operations 2 Free Cash Flow 2 $112.9 million $79.0 million $85.1 million 1. As of June 30, BEC has a generation capacity of 644MW. 2. For the twelve months ended June 30, EBITDA excluding non-cash items and Free Cash Flow are non-gaap measures. Reflects 100% of reported segment results, not MIC s proportionate interest in the wind and solar power businesses. 3. Expected contribution to Adjusted EBITDA from BEC in 2018 of $52.0 million, as disclosed in the 2Q 18 Supplemental Materials presented on August 2, MWs Q'18 Renewables BEC PAGE 9


10 Contracted Power Bayonne Energy Center Representative Solar PV Facility PAGE 10

11 Contracted Power Sale of Bayonne Energy Center 644MW power generation facility to be sold for approximately $900 million Transaction values BEC at approximately $1,400 per kilowatt of generating capacity Net proceeds to be used to: - Reduce debt: Repay $150 million outstanding on the revolving credit facility at IMTT - Reduce debt: Deconsolidate $243.5 million asset level financing - Enhance financial flexibility: Fund a portion of planned growth capital deployments in 2018 and 2019 without accessing external capital Bayonne Energy Center PAGE 11
12 MIC Hawaii Business Overview Provider of low cost, clean, reliable energy to customers in Hawaii Hawaii Gas: a regulated gas utility, unregulated liquefied petroleum gas (LPG) distribution business Hawaii s only government franchised gas utility Processes and distributes gas across Hawaii s six main islands Waihonu Solar: 7MW facilities located on Oahu Critchfield Pacific: a design-build mechanical contractor Other distributed generation projects serving commercial users under long-term contracts Net Income 1 Key Statistics $21.2 million Kauai Utility and Non-Utility Geographic Footprint EBITDA excluding non-cash items 1 Cash from Operations 1 $53.0 million $37.8 million Oahu Headquarters SNG Manufacturing Plant Utility and Non-Utility Solar Facilities Molokai & Lanai Utility and Non-Utility Maui Utility and Non-Utility Free Cash Flow 1 $32.5 million Net Debt/EBITDA excluding non-cash items 1,2 3.9x Solar Hawaii Utility and Non-Utility 1. For the twelve months ended June 30, EBITDA excluding non-cash items and Free Cash Flow are non-gaap measures. Reflects 100% of the segment result, not MIC s proportionate interest in the solar power business. 2. Excludes renewable business in MIC Hawaii segment. PAGE 12


13 MIC Hawaii Hawaii Gas Waihonu Solar Facilities PAGE 13
14 MIC Strategic Priorities
15 MIC Strategic Priorities Multiple value-enhancing initiatives currently underway Priority Initiatives / Objectives Cost / Timeline Reinforce the infrastructure characteristics of MIC s businesses Efficiently manage capital Reduce leverage, increase financial flexibility Repurpose up to 3 million barrels of capacity at IMTT to products with better demand outlook Reposition IMTT estate to increase interconnectivity, capacity and capability ~$35 million, up to 18 months, EBITDA generative on re-contracting ~$190 million, over three years EBITDA and Free Cash Flow generative as individual projects progress and complete (12-24 months) Prioritize capital expenditure $300 million of growth capital expected to be deployed or committed in 2018 Complete strategic review of Contracted Power Divested BEC for ~$900 million, expected to close in 4Q 18, review of renewable assets underway Sell smaller, non-core operations ~$40 million realized to date, not including BEC Reduce leverage/net debt with proceeds of asset sales Ongoing, with the sale of BEC resulting in the deconsolidation of $243.5 million asset level financing and the repayment of $150 million outstanding on the revolving credit facility at IMTT Extend tenor of debt facilities Preparing for upcoming July 2019 maturity of certain convertible debt facilities PAGE 15
16 Priority One: Reinforce Infrastructure Characteristics - IMTT
17 IMTT Facilities Overview Two major terminal locations represent more than 80% of total storage capacity, in privileged positions in two of the four major marine bulk liquid markets in the US Terminal Barrel capacity (45.0 million) 1 : Capacity (m barrels) Capacity (% of total) Heavy & Residual Key Products 2 Distillates & Gasoline Chemical Vegetable & Tropical St Rose % Gretna % Avondale % Geismar % LMR % Bayonne % Renewable IMTT terminals privileged positions Lower Mississippi River (20.3 million barrels) St. Rose in close proximity to some of the largest, most efficient refineries in North America Geismar well positioned to capitalize on growth in export petrochemical production Avondale positioning as tropical oil hub Opportunities exist to repurpose and enhance clean product capacity and further improve terminal connectivity Quebec % Savannah-N % Savannah-S % Chesapeake % Lemont % Joliet % Other % Other % Total % Source: IMTT. As at June 30, Excludes 3.0m bbl in Newfoundland and 0.6 million bbl related to a customer in Geismar. 2. Key Products excludes crude oil, which is only stored at St Rose. 3. Alamogordo, Bremen, Macon, Montgomery, Moundville, Richmond (VA), Richmond (CA). Bayonne (15.9 million barrels) Bayonne largest facility in New York Harbor, with premier marine infrastructure including 20 berths and deep draft Handles primarily refined petroleum products for domestic consumption in New York and Northeast markets Opportunities exist to further enhance strategic positioning through improvements in pipelines and intermodal connectivity PAGE 17
18 IMTT Product Capacity IMTT s portfolio is well diversified including significant capacity serving chemical, vegetable / tropical oils, and renewable products Barrels of capacity by product 1 : Chemical, Vegetable / Tropical Oils, and Renewables (26%) Continue to leverage privileged geographic locations to meet growing demand and increase product diversification Renewable Vegetable and 1.5 Tropical Oils 2.5 Chemical 7.7 Crude 0.8 Heavy and Residual Oil 17.3 Heavy and Residual (38%) Diversified sub product mix with continued customer interest Rightsizing capacity into clean products as part of ~3 million barrel repurposing strategy Highly flexible capacity handling a broad array of heavy products Gasoline 4.7 Two thirds of existing capacity located in the Lower Mississippi River ( LMR ) Distillates 10.5 Gasoline and Distillates (34%) Significant portion located in Bayonne, NJ facility in New York Harbor Opportunities from growing export market in LMR In New York Harbor s mature market, focus is on infrastructure enhancement to better integrate with customer supply chains Source: IMTT. As at June 30, Excludes 3.0m bbl in Newfoundland and 0.6m bbl related to a customer in Geismar. PAGE 18
19 IMTT Repurposing Leverage IMTT s privileged position to respond to market changes and capitalize on growth opportunities Repurposing (existing tanks) Expands customer base Diversifies product mix Leverages existing asset base Increases attractiveness of terminals What is it? Clean and convert up to 3 million barrels of existing Heavy and Residual tanks and install ancillary infrastructure to store and handle clean products What is the potential capex and earnings impact? 1 Capex: Up to $35 million by December 31, 2019 (1.3 million underway, 0.9 million re-contracted) EBITDA multiple: x Short time for completion Shorter payback Reduces exposure to heavy and residual oil How long does it take? 3 to 9 months per tank depending on previous product stored, degree of cleaning required for new product, installation of ancillary infrastructure Which products and terminals? Majority of projects are related to clean petroleum and chemicals and are located on the LMR 1. Subject to ongoing assessment and approval on the basis of investment considerations, market conditions, satisfactory due diligence and business performance. PAGE 19

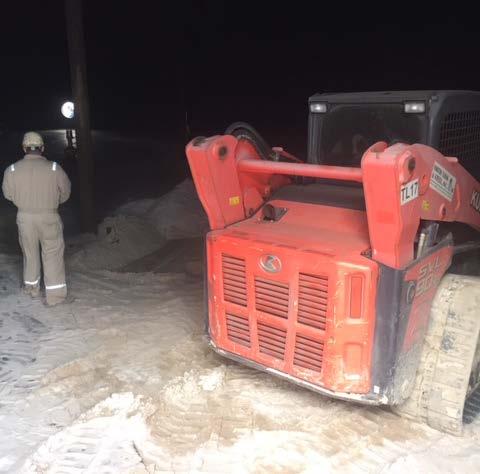
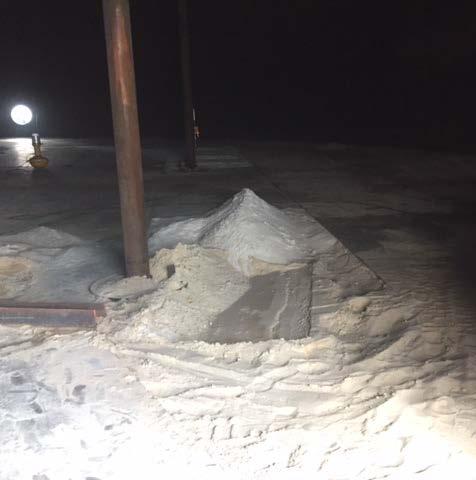
20 IMTT Repurposing Tank undergoing repurposing at IMTT PAGE 20
21 IMTT LMR Heavy and Residual Capacity Post Repurposing Post repurposing up to 3 million barrels of Heavy and Residual capacity on the LMR, approximately three-quarters of remaining storage capacity associated with refining and industrial demand IMTT Attributes on the LMR Stored Heavy and Residual Products on the LMR Flexible tank configuration Refinery Feedstock Marine Fuel/Blend Stock 18 barge and ship berths Tanks capable of storing asphalt and a variety of other products requiring elevated heat Use: Processed / re-refined to produce more middle distillates Product: VGO and VTB Use: Fuel for shipping industry Product: High and low sulphur marine fuel, cutter stock Diverse tank sizes and blending capabilities Residual Oil Other Products Proximity to complex refineries Access to decongested port with deep draft Use: Back-up fuel for power generation, exports Product: 6 Oil Use: Roads, buildings, roofs, tires and hoses Product: Asphalt and CBO Source: IMTT. As at June 30, PAGE 21
22 IMTT Repositioning (new capabilities) Leverage IMTT s privileged position to respond to market changes and capitalize on growth opportunities Repurposing (new capabilities) Expands customer base Integration with fundamental users supply chains Adds inter-modal capabilities Leverages IMTT s experience on similar projects What is it? Investments in truck, pipeline, marine and rail infrastructure to better integrate existing IMTT terminals with customer supply chains What is the potential capex and earnings impact? 1 Five projects under evaluation Capex: $ million over the next four years EBITDA multiple: x Increases attractiveness of terminals How long does it take? 12 to 24 months depending on engineering complexity, permitting, rights of way, and construction Which products and terminals? Majority of projects are related to transportation fuels (gasoline, diesel, jet fuel) and are located in the NYH and on the LMR 1. Subject to ongoing assessment and approval on the basis of investment considerations, market conditions, satisfactory due diligence and business performance. PAGE 22
23 IMTT Repositioning (new capacity) Leverage IMTT s privileged position to respond to market changes and capitalize on growth opportunities Repositioning (new tanks) Expands customer base Integration with fundamental users Diversifies product mix (chemical and tropical) Enhances terminals footprint What is it? Build new tanks and logistics infrastructure primarily at existing IMTT terminals to serve customer needs for product storage What is the potential capex and earnings impact? 1 Ten projects under evaluation Capex: $ million over the next four years EBITDA multiple: x Long term contracts Customer backed How long does it take? 12 to 36 months depending on engineering complexity, permitting, commercial negotiation, and construction Which products and terminals? Majority of projects are related to chemical and tropical oil products and are located on the LMR and other smaller terminals 1. Subject to ongoing assessment and approval on the basis of investment considerations, market conditions, satisfactory due diligence and business performance. PAGE 23
24 Priority Two: Efficient Capital Management
25 2018 Capital Deployment Forecast 2018 growth capital deployment and commitments of $300 million, maintenance capital expenditures of $63 million Maintenance Capex 2018E Maintenance Capex: $63 million 2018E Committed Capex: $185 million Growth Capex 2018E Strategic Capex: $115 million ($ millions) ($ millions) ($ millions) Business Unit Prior Outlook 1 Current Outlook 2 Business Unit Prior Outlook 1 Current Outlook 2 Business Unit Prior Outlook 1 Current Outlook 2 IMTT Atlantic Aviation Contracted Power - 13 MIC Hawaii IMTT Atlantic Aviation Contracted Power MIC Hawaii IMTT Repurposing and Repositioning 3 Other Strategic Capex TOTAL TOTAL Corporate and Other 5 5 TOTAL Note: Totals may not add due to rounding. 1. Reported on May 2, 2018 with Q financial results. 2. Reported on August 2, 2018 with Q financial results. 3. Reflects classification of $10 million of repurposing capex as Maintenance Capex and $6m to Committed Capex. PAGE 25
26 Growth Capital Deployment Funded Through Efficient Capital Management Description 2018E Current outlook for adjusted free cash flow (proportionately combined) 1 : Net proceeds from sale of BEC after debt reduction Dividend at $1.00/share/quarter guidance 3 (341.0) Amount available to fund 2018E growth capital Target growth capital deployment (300.0) Amount available to fund 2019E growth capital and enhance financial flexibility The residual $360 million enhances financial flexibility With 2019 Free Cash Flow, funds a portion of growth projects in 2019 Enhances balance sheet strength and flexibility Consider options to return any excess capital while the sale non-core assets continue to be assessed. 1. Includes only MIC s proportionate interest in its wind and solar facilities within the Contracted Power and MIC Hawaii segments. 2. Net proceeds from the sale of BEC is calculated as $900m proceeds less the deconsolidation of $243.5m asset level financing and the repayment of $150m outstanding on the revolving credit facility at IMTT. 3. Includes dividend of $1.44/per share for the fourth quarter of 2017 paid in March 2018 PAGE 26
27 Priority Three: Credit Profile - Enhance Financial Flexibility
28 Credit Profile Holding company rated BBB- (S&P) Proportionately combined leverage ratio of 5.0x (excluding renewable assets) 1 As of July 31, 2018: Business MIC Corporate IMTT Atlantic Aviation Contracted Power MIC Hawaii 5 Debt Revolving Facility Convertible Senior Notes Senior Notes Tax-Exempt Bonds 3 Revolving Facility Term Loan Revolving Facility Weighted Average Remaining Life (Years) Renewables Project Finance 13.9 BEC Term Loan Term Loan Senior Notes Revolving Facility Balance Outstanding ($000 s) 1 141, , , , , , , , ,000 96, ,000 15,000 Weighted Average Rate % 2.41% 3.97% 3.34% 3.58% 2.75% 3.83% 4.84% 3.91% 2.85% 4.22% 3.33% Total 4.8 3,602, % 1. Proportionate to MIC s ownership interest. 2. Reflects annualized interest rate on all facilities including interest rate hedges. 3. Interest rate reflects the impact of the Tax Cuts and Jobs Act. 4. The BEC Term Loan balance of $246.0 million was classified as Liabilities held for sale on the Consolidated Condensed Balance Sheet for June 30, Excludes $2.3m of equipment loans at the MIC Hawaii business. PAGE 28
29 MIC Contact for additional information Jay Davis Managing Director Dileep Murthy Vice President 125 W. 55th Street, Level 15 New York, NY (212) W. 55th Street, Level 15 New York, NY (212) PAGE 29
30 APPENDICES
31 Financial Results for the Quarter and Six Months Ended June 30, 2018
32 Results and Guidance Consolidated and Proportionately Combined Results Selected Key Results: Consolidated Proportionately Combined 1 $ Millions 2Q 18 2Q 17 % 2Q 18 2Q 17 % Net Income % % Adjusted EBITDA ex Non-cash Items (3%) (3%) Cash from Operating Activities % % Adjusted Free Cash Flow (10%) (10%) Adjusting 2018 Guidance: $ Millions (Proportionately Combined 1 ) Current Outlook 2018E Prior Outlook 2018E 2017A Adjusted EBITDA ex Non-cash Items Adjusted Free Cash Flow Dividend per Share $4.00 $4.00 $ Includes only MIC s proportionate interest in its wind and solar facilities within the Contracted Power and MIC Hawaii segments. 2. For 2018 and 2017, Adjusted EBITDA excluding non-cash items and Adjusted Free Cash Flow excludes costs relating to certain investment and acquisition/disposition activities. Adjusted EBITDA excluding non-cash items and Adjusted Free Cash Flow for 2017 also excludes implementation costs relating to our shared services center. 3. Conformed to current period presentation for the adoption of ASU No , Statement of Cash Flows (Topic 230): Restricted Cash. See Note 2, Basis of Presentation, in our Notes to Consolidated Condensed Financial Statements in Part I of Form 10-Q for the quarter ended June 30, PAGE 32
33 Adjusted Free Cash Flow Performance ($ in millions) Adjusted Free Cash Flow (Proportionately Combined) 1,2 : $ millions Business Unit Adjusted EBITDA (8.3) IMTT 2.9 Atlantic Aviation 5.8 Contracted Power (3.1) (2.3) MIC Hawaii (3.0) (5.4) (1.1) Q 17 2Q 18 Corporate EBITDA Proportionately Combined Maintenance Expense Interest Expense Cash Taxes Adjusted Free Cash Flow (Proportionately Combined) 1,2 was $126.6 million in 2Q 18, reflecting a decrease of 10% from $141.1 million in 2Q 17 Outperformance at Atlantic Aviation and Contracted Power offset reduced contribution from IMTT and MIC Hawaii Decline was due primarily to higher interest expense, increased maintenance capital expenditures, and reduced Corporate EBITDA Weighted average shares outstanding increased to 85.1 million for 2Q 18 compared to 82.4 million in 2Q Includes only MIC s proportionate interest in its wind and solar facilities within the Contracted Power and MIC Hawaii segments. 2. For 2018 and 2017, Adjusted EBITDA excluding non-cash items and Adjusted Free Cash Flow excludes costs relating to certain investment and acquisition/disposition activities. Adjusted EBITDA excluding non-cash items and Adjusted Free Cash Flow for 2017 also excludes implementation costs relating to our shared services center. PAGE 33
34 Summary Financial Information $ % ($ In Thousands, Except Share and Per Share Data) (Unaudited) GAAP Metrics Net income $ 36,279 $ 26,025 10, Weighted average number of shares outstanding: basic 85,082,209 82,430,324 2,651, Net income per share attributable to MIC $ 0.45 $ Cash provided by operating activities (1) 121, , MIC Non-GAAP Metrics Quarter Ended June 30, Change Favorable/(Unfavorable) EBITDA excluding non-cash items (2) $ 168,935 $ 170,924 (1,989) (1.2) Shared service implementation costs (3) - 3,091 (3,091) (100.0) Investment and acquisition costs (3) 4,651 4,850 (199) (4.1) Adjusted EBITDA excluding non-cash items (3) $ 173,586 $ 178,865 (5,279) (3.0) Cash interest (4) $ (31,789) $ (26,410) (5,379) (20.4) Cash taxes (3,712) (2,618) (1,094) (41.8) Maintenance capital expenditures (9,490) (6,480) (3,010) (46.5) Noncontrolling interest (5) (1,948) (2,244) Adjusted Free Cash Flow (3) $ 126,647 $ 141,113 (14,466) (10.3) NM Not meaningful 1. Conformed to current period presentation for the adoption of ASU No , Statement of Cash Flows (Topic 230): Restricted Cash. See Note 2, Basis of Presentation, in our Notes to Consolidated Condensed Financial Statements in Part I of Form 10-Q for the quarter ended June 30, EBITDA excluding non-cash items is calculated as net income before interest expense, taxes, depreciation and amortization expense, management fees, pension expense and other non-cash (income) expense recorded in the consolidated statement of operations. See below for reconciliation of net income (loss) to EBITDA excluding non-cash items. 3. For 2018 and 2017, Adjusted EBITDA excluding non-cash items and Adjusted Free Cash Flow excludes costs relating to certain investment and acquisition/disposition activities. Adjusted EBITDA excluding non-cash items and Adjusted Free Cash Flow for 2017 also excludes implementation costs relating to our shared services center. 4. Cash interest is calculated as interest expense, net, excluding the impact of non-cash adjustments for unrealized (gains) losses from derivative instruments, amortization of deferred financing costs and the amortization of debt discount recorded in the consolidated statement of operations. 5. Noncontrolling interest adjustment represents the portion of Free Cash Flow not attributable to MIC s ownership interest. PAGE 34
35 Reconciliation from Consolidated Free Cash Flow to Proportionately Combined Free Cash Flow PAGE 35
36 Proportionately Combined Free Cash Flow Quarter Ended June 30, 2018 NM Not meaningful 1. Represents MIC s proportionately combined interests in the businesses comprising these reportable segments. 2. The sum of the amounts attributable to MIC in proportion to its ownership. 3. Interest expense, net, includes adjustments to derivative instruments, non-cash amortization of deferred financing fees and non-cash amortization of debt discount related to the 2.00% Convertible Senior Notes due October Pension expense primarily consists of interest cost, expected return on plan assets and amortization of actuarial and performance gains and losses. 5. Other non-cash expense (income), net, primarily includes non-cash amortization of tolling liabilities, unrealized gains (losses) on commodity hedges and non-cash gains (losses) related to disposal of assets. See Earnings Before Interest, Taxes, Depreciation and Amortization (EBITDA) excluding non-cash items, Free Cash Flow and Proportionately Combined Metrics above for further discussion. 6. Represents the cash interest expense reclassified from MIC Corporate to Atlantic Aviation related to the 2.00% Convertible Senior Notes due October 2023, proceeds of which were used to pay down a portion of Atlantic Aviation s credit facility in October PAGE 36
37 Proportionately Combined Free Cash Flow Quarter Ended June 30, 2017 NM Not meaningful 1. Represents MIC s proportionately combined interests in the businesses comprising these reportable segments. 2. The sum of the amounts attributable to MIC in proportion to its ownership. 3. Interest expense, net, includes adjustments to derivative instruments, non-cash amortization of deferred financing fees and non-cash amortization of debt discount related to the 2.00% Convertible Senior Notes due October Pension expense primarily consists of interest cost, expected return on plan assets and amortization of actuarial and performance gains and losses. 5. Other non-cash expense (income), net, primarily includes non-cash amortization of tolling liabilities, unrealized gains (losses) on commodity hedges and non-cash gains (losses) related to disposal of assets. See Earnings Before Interest, Taxes, Depreciation and Amortization (EBITDA) excluding non-cash items, Free Cash Flow and Proportionately Combined Metrics above for further discussion. 6. Represents the cash interest expense reclassified from MIC Corporate to Atlantic Aviation related to the 2.00% Convertible Senior Notes due October 2023, proceeds of which were used to pay down a portion of Atlantic Aviation s credit facility in October Conformed to current period presentation for the adoption of ASU No , Statement of Cash Flows (Topic 230): Restricted Cash. See Note 2, Basis of Presentation, in our Notes to Consolidated Condensed Financial Statements in Part I of Form 10-Q for the quarter ended June 30, PAGE 37
38 Adjusted Guidance
39 Updating 2018 Adjusted EBITDA Outlook ($ in millions) Adjusted EBITDA (Proportionately Combined) 1 : $719 $705 ($12.5) ($5) Contracted Power MIC Corporate $687.5 Reducing midpoint of Adjusted EBITDA (Proportionately Combined) guidance as a result of: Anticipated timing of BEC sale closing in early Q Unbudgeted advisory expenses at MIC Corporate incurred in connection with addressing shareholder matters No change to IMTT, Atlantic Aviation or MIC Hawaii 2017A Prior 2,3 Current 3 Outlook Outlook 1. Includes only MIC s proportionate interest in its wind and solar facilities within the Contracted Power and MIC Hawaii segments. 2. Reported on May 2, 2018 alongside Q financial results. 3. Prior Outlook and Current Outlook reflect midpoints of segment guidance. PAGE 39
40 Updating 2018 Adjusted Free Cash Flow Outlook ($ in millions) Adjusted Free Cash Flow (Proportionately Combined) 1 : $568 $532 ($22.5) ($10) ($5) $494.5 Reducing midpoint of Free Cash Flow guidance to accommodate: Updates for BEC sale Updates For BEC Sale MIC Corporate Reclassification of IMTT Repurposing Growth Capex as Maintenance Capex $341 Reclassification of IMTT repurposing growth capex as maintenance capex Unbudgeted advisory expenses at MIC Corporate incurred in connection with addressing shareholder matters 2017A Prior 2,3 Outlook Current Outlook Dividend Guidance 2018 Dividend Guidance implies 69% Adjusted Free Cash Flow payout ratio at midpoint 1. Includes only MIC s proportionate interest in its wind and solar facilities within the Contracted Power and MIC Hawaii segments. 2. Reported on May 2, 2018 alongside Q financial results. 3. Prior Outlook and Current Outlook reflect midpoints of segment guidance. PAGE 40
41 Outlook Updates For BEC Sale ($ in millions) Impacts to Previous Outlook: Metric Full Year 2018 Impact Impact to Prior Outlook Notes Adjusted EBITDA ($52.0) ($12.5) Assumes early Q4 closing Maintenance Capex $ - ($12.5) Accelerated maintenance capex incurred in conjunction with sale Interest Expense $10.0 $2.5 Assumes early Q4 closing Adjusted Free Cash Flow 2 ($42.0) ($22.5) 1. Reported on May 2, 2018 alongside Q financial results. 2. Adjusted Free Cash Flow impacts of the BEC divestment excludes: (a) transaction expenses, (b) state income and transfer taxes on sale and (c) accelerated purchase of catalyst placed into inventory. PAGE 41
42 MIC September 2018
MIC. Second Quarter 2018 Earnings Conference Call Supplemental Materials. August 2, 2018
 MIC Second Quarter 2018 Earnings Conference Call Supplemental Materials August 2, 2018 Important Notice This presentation by Macquarie Infrastructure Corporation (MIC) is proprietary and all rights are
Important Notice PAGE 2
 MIC November 2018 Important Notice This presentation by Macquarie Infrastructure Corporation (MIC) is proprietary and all rights are reserved. Any reproduction, in whole or in part, without the prior written
MIC. Third Quarter 2018 Earnings Conference Call Supplemental Materials. November 1, 2018
 MIC Third Quarter 2018 Earnings Conference Call Supplemental Materials November 1, 2018 Important Notice This presentation by Macquarie Infrastructure Corporation (MIC) is proprietary and all rights are
MIC. Overview of the IMTT Segment. December
 MIC Overview of the IMTT Segment December 2017 1 1. The contents of this presentation reflect financial and operating information through the period ended September 30, 2017, as reported on the Company
Telephone Facsimile Internet
 MIC 125 West 55 th Street New York, NY10019 United States Media Release Telephone Facsimile Internet +1 212 231 1825 +1 212 231 1828 www.macquarie.com/mic MIC REPORTS FOURTH QUARTER AND FULL YEAR 2018
MIC Overview of the MIC Hawaii Segment
 MIC Overview of the MIC Hawaii Segment May 2017 1 1. The contents of this presentation reflect financial and operating information through the period ended March 31, 2017, as reported on the Company s
MIC. Third Quarter 2017 Earnings Conference Call Support Slides. November 2017
 MIC Third Quarter 2017 Earnings Conference Call Support Slides November 2017 Disclaimer This presentation by Macquarie Infrastructure Corporation (MIC) is proprietary and all rights are reserved. Any reproduction,
MIC Reports Second Quarter 2018 Financial Results, Cash Dividend Of $1.00 Per Share
 Reports Second Quarter 2018 Financial Results, Cash Dividend Of $1.00 Per Share August 1, 2018 - Financial Performance for the Quarter in Line with Expectations: -- Net income of $36.3 million, up 39.4%
MIC First Quarter 2017 Earnings Conference Call Support Slides. May 2017
 MIC First Quarter 2017 Earnings Conference Call Support Slides May 2017 Disclaimer This presentation by Macquarie Infrastructure Corporation (MIC) is proprietary and all rights are reserved. Any reproduction,
Macquarie Infrastructure Corporation Reports First Quarter 2016 Financial Results, Increased Dividend
 May 2, 2016 Macquarie Infrastructure Corporation Reports First Quarter 2016 Financial Results, Increased Dividend Proportionately Combined Free Cash Flow increases 8.7% to $133.4 million $1.67 per share
MIC. Fourth Quarter 2017 Earnings Conference Call Support Slides. February 2018
 MIC Fourth Quarter 2017 Earnings Conference Call Support Slides February 2018 Disclaimer This presentation by Macquarie Infrastructure Corporation (MIC) is proprietary and all rights are reserved. Any
Telephone Facsimile Internet:
 125 West 55 th Street New York, NY10019 United States FOR IMMEDIATE RELEASE Telephone Facsimile Internet: +1 212 231 1825 +1 212 231 1828 www.macquarie.com/mic REPORTS 2017 FINANCIAL RESULTS, INCREASE
Infrastructure Corporation
 Macquarie Infrastructure Corporation Third Quarter Earnings Conference Call Support Slides November 2015 Disclaimer This presentation by Macquarie Infrastructure Corporation (MIC) is proprietary and all
Telephone Facsimile Internet:
 MIC 125 West 55 th Street New York, NY10019 United States FOR IMMEDIATE RELEASE Telephone Facsimile Internet: +1 212 231 1825 +1 212 231 1828 www.macquarie.com/mic MIC REPORTS FIRST QUARTER 2017 FINANCIAL
MACQUARIE INFRASTRUCTURE CORPORATION REPORTS THIRD QUARTER 2016 FINANCIAL RESULTS, INCREASED DIVIDEND
 Macquarie Infrastructure Corporation 125 West 55th Street Telephone +1 212 231 1825 New York, NY10019 Facsimile +1 212 231 1828 United States Internet: www.macquarie.com/mic 1 FOR IMMEDIATE RELEASE MACQUARIE
MACQUARIE INFRASTRUCTURE CO LLC
 MACQUARIE INFRASTRUCTURE CO LLC FORM 10-Q (Quarterly Report) Filed 04/29/13 for the Period Ending 03/31/13 Address 125 WEST 55TH STREET, 22ND FLOOR NEW YORK, NY 10019 Telephone 212 231 1000 CIK 0001289790
Macquarie Infrastructure Corporation Reports Fourth Quarter and Full-Year 2015 Financial Results, Increases Cash Dividend
 February 22, 2016 Macquarie Infrastructure Corporation Reports Fourth Quarter and Full-Year 2015 Financial Results, Increases Cash Dividend Fourth quarter cash dividend of $1.15 per share declared 2015
MIC. Maintenance Capex Review. June 2018
 MIC Maintenance Capex Review June 2018 Important Notice This presentation by Macquarie Infrastructure Corporation (MIC) is proprietary and all rights are reserved. Any reproduction, in whole or in part,
Morgan Stanley Midstream MLP and Diversified Natural Gas Corporate Access Event
 Morgan Stanley Midstream MLP and Diversified Natural Gas Corporate Access Event March 4-5, 2014 LEGAL NOTICE/FORWARD-LOOKING STATEMENTS This presentation contains forward-looking statements that we believe
TransMontaigne Partners L.P. (NYSE TLP) Wells Fargo th Annual Energy Symposium December 10 th, 2013
 Wells Fargo th Annual Energy Symposium December 10 th, 2013") TransMontaigne Partners L.P. (NYSE TLP) Wells Fargo 2013 12 th Annual Energy Symposium December 10 th, 2013 Forward Looking Statements All statements, other than statements of historical facts, contained
TransMontaigne Partners L.P. (NYSE TLP) Wells Fargo 2013 12 th Annual Energy Symposium December 10 th, 2013 Forward Looking Statements All statements, other than statements of historical facts, contained
Magellan Midstream Partners, L.P. (Exact name of registrant as specified in its charter)
") UNITED STATES SECURITIES AND EXCHANGE COMMISSION Washington, D.C. 20549 FORM 10-Q QUARTERLY REPORT PURSUANT TO SECTION 13 OR 15(d) OF THE SECURITIES EXCHANGE ACT OF 1934 For the quarterly period ended
UNITED STATES SECURITIES AND EXCHANGE COMMISSION Washington, D.C. 20549 FORM 10-Q QUARTERLY REPORT PURSUANT TO SECTION 13 OR 15(d) OF THE SECURITIES EXCHANGE ACT OF 1934 For the quarterly period ended
News Release NYSE: BPL
 News Release NYSE: BPL Buckeye Partners, L.P. One Greenway Plaza Suite 600 Houston, TX 77046 Contact: Kevin J. Goodwin Vice President & Treasurer irelations@buckeye.com (800) 422-2825 BUCKEYE PARTNERS,
Arc Logistics Partners LP Investor Presentation May 2015
 Arc Logistics Partners LP Investor Presentation May 2015 Cautionary Note Forward Looking Statements Certain statements and information in this presentation may constitute "forward-looking statements."
Macquarie Infrastructure Company Reports First Quarter 2008 Financial Results
 Macquarie Infrastructure Company Reports First Quarter 2008 Financial Results Growth in Airport Services Drives Increased Distributable Cash Net Swings to Loss on Non-Cash Expenses of Investee Increased
TransMontaigne Partners L.P. (NYSE TLP) Wells Fargo Energy Symposium December 9 th and 10 th, 2014
 Wells Fargo Energy Symposium December 9 th and 10 th, 2014") TransMontaigne Partners L.P. (NYSE TLP) Wells Fargo Energy Symposium December 9 th and 10 th, 2014 Forward Looking Statements All statements, other than statements of historical facts, contained herein
TransMontaigne Partners L.P. (NYSE TLP) Wells Fargo Energy Symposium December 9 th and 10 th, 2014 Forward Looking Statements All statements, other than statements of historical facts, contained herein
TransMontaigne Partners Announces Third Quarter 2017 Results
 TransMontaigne Partners Announces Third Quarter 2017 Results Net earnings for the third quarter of 2017 totaled $11.0 million, compared to $11.9 million in the prior year third quarter Consolidated EBITDA
Arc Logistics Partners LP Investor Presentation March 2015
 Arc Logistics Partners LP Investor Presentation March 2015 Vince Cubbage - CEO, Chairman and Director Bradley Oswald - Senior Vice President, CFO and Treasurer Cautionary Note Forward Looking Statements
CONDENSED INTERIM CONSOLIDATED FINANCIAL STATEMENTS (unaudited) Condensed Consolidated Balance Sheets
 Condensed Consolidated Balance Sheets") CONDENSED INTERIM CONSOLIDATED FINANCIAL STATEMENTS (unaudited) Condensed Consolidated Balance Sheets (millions of Canadian dollars) September 30, 2017 December 31, 2016 Assets Current assets Cash and
CONDENSED INTERIM CONSOLIDATED FINANCIAL STATEMENTS (unaudited) Condensed Consolidated Balance Sheets (millions of Canadian dollars) September 30, 2017 December 31, 2016 Assets Current assets Cash and
Buckeye Partners, L.P. One Greenway Plaza Suite 600 Houston, TX 77046
 News Release NYSE: BPL Buckeye Partners, L.P. One Greenway Plaza Suite 600 Houston, TX 77046 Contact: Kevin J. Goodwin Vice President and Treasurer irelations@buckeye.com (800) 422-2825 BUCKEYE PARTNERS,
PBF Energy March 2018
 PBF Energy March 2018 1 Safe Harbor Statements This presentation contains forward-looking statements made by PBF Energy Inc. ( PBF Energy ), the indirect parent of PBF Logistics LP ( PBFX, or Partnership,
MAGELLAN MIDSTREAM PARTNERS, L.P. CONSOLIDATED STATEMENTS OF INCOME (In thousands, except per unit amounts) (Unaudited)
 (Unaudited)") CONSOLIDATED STATEMENTS OF INCOME (In thousands, except per unit amounts) (Unaudited) Transportation and terminals revenue... $ 415,371 $ 458,930 $ 1,591,119 $ 1,731,775 Product sales revenue... 195,995
CONSOLIDATED STATEMENTS OF INCOME (In thousands, except per unit amounts) (Unaudited) Transportation and terminals revenue... $ 415,371 $ 458,930 $ 1,591,119 $ 1,731,775 Product sales revenue... 195,995
News Release NYSE: BPL
 News Release NYSE: BPL Buckeye Partners, L.P. One Greenway Plaza Suite 600 Houston, TX 77046 Contact: Kevin J. Goodwin Vice President & Treasurer irelations@buckeye.com (800) 422-2825 BUCKEYE PARTNERS,
News Release NYSE: BPL
 News Release NYSE: BPL Buckeye Partners, L.P. One Greenway Plaza Suite 600 Houston, TX 77046 Contact: Kevin J. Goodwin Vice President & Treasurer irelations@buckeye.com (800) 422-2825 BUCKEYE PARTNERS,
Fortress Transportation and Infrastructure Investors LLC. Supplemental Information Third Quarter 2018
 Fortress Transportation and Infrastructure Investors LLC Supplemental Information Third Quarter 2018 Disclaimers IN GENERAL. This disclaimer applies to this document and the verbal or written comments
Buckeye GP Holdings L.P. (NYSE: BGH) Buckeye Partners, L.P. (NYSE: BPL) Kelso & Company April 23, 2009
 Buckeye Partners, L.P. (NYSE: BPL) Kelso & Company April 23, 2009") Buckeye GP Holdings L.P. (NYSE: BGH) Buckeye Partners, L.P. (NYSE: BPL) Kelso & Company April 23, 2009 1 Buckeye Partners, L.P. Buckeye GP Holdings L.P. Forward Looking Statement Certain statements contained
Buckeye GP Holdings L.P. (NYSE: BGH) Buckeye Partners, L.P. (NYSE: BPL) Kelso & Company April 23, 2009 1 Buckeye Partners, L.P. Buckeye GP Holdings L.P. Forward Looking Statement Certain statements contained
Q Investor Presentation. Global Partners LP (NYSE: GLP)
") Q4 2018 Investor Presentation Global Partners LP (NYSE: GLP) Forward-Looking Statements Certain statements and information in this presentation may constitute forward-looking statements. The words believe,
Q4 2018 Investor Presentation Global Partners LP (NYSE: GLP) Forward-Looking Statements Certain statements and information in this presentation may constitute forward-looking statements. The words believe,
Driven to Create Value
 Driven to Create Value Bank of America Refining Conference March 2016 2015 Corporation. All Rights Reserved. Forward Looking Statements This Presentation includes forward-looking statements within the
Cautionary Note. Forward Looking Statements
 Cautionary Note Forward Looking Statements Certain statements and information in this presentation constitute "forward-looking statements." Certain expressions including believe, expect, intends, or other
SEACOR Holdings Inc.
 UNITED STATES SECURITIES AND EXCHANGE COMMISSION WASHINGTON, D.C. 20549 FORM 8-K CURRENT REPORT Pursuant to Section 13 or 15(d) of the Securities Exchange Act of 1934 Date of Report (Date of Earliest Event
Citi MLP / Midstream Infrastructure Conference. Las Vegas Aug. 2016
 Citi MLP / Midstream Infrastructure Conference Las Vegas Aug. 2016 1 Forward-Looking Statements Portions of this document constitute forward-looking statements as defined by federal law. Although management
TransMontaigne Announces Third Quarter Results
 TransMontaigne Announces Third Quarter Results Achieved record levels of revenue, Consolidated EBITDA and distributable cash flow for the third quarter of 2018 Revenue for the third quarter of 2018 totaled
TransMontaigne Announces First Quarter Results and Expansion
 TransMontaigne Announces First Quarter Results and Expansion TransMontaigne will expand its Brownsville, Texas operations, supported by the execution of longterm, fee-based terminaling and pipeline agreements
TransMontaigne Announces Fourth Quarter and Full Year 2017 Results and the Filing of its 2017 Annual Report on Form 10-K
 TransMontaigne Announces Fourth Quarter and Full Year 2017 Results and the Filing of its 2017 Annual Report on Form 10-K Acquired two terminal facilities on the U.S. West Coast with approximately 5 million
Driven to Create Value Goldman Sachs 2017 Global Energy Conference January 2017
 Driven to Create Value Goldman Sachs 2017 Global Energy Conference January 2017 2015 Corporation. All Rights Reserved. Forward Looking Statements On November 17, 2016, we announced our plans to acquire
NuStar Energy, L.P. NEUTRAL ZACKS CONSENSUS ESTIMATES (NS-NYSE) SUMMARY
 SUMMARY") March 13, 2015 NuStar Energy, L.P. Current Recommendation Prior Recommendation Underperform Date of Last Change 09/26/2013 Current Price (03/12/15) $60.71 Target Price $63.00 NEUTRAL SUMMARY (NS-NYSE)
March 13, 2015 NuStar Energy, L.P. Current Recommendation Prior Recommendation Underperform Date of Last Change 09/26/2013 Current Price (03/12/15) $60.71 Target Price $63.00 NEUTRAL SUMMARY (NS-NYSE)
Buckeye Partners, L.P. Wachovia Pipeline and MLP Symposium - December 2008
 Buckeye Partners, L.P. Wachovia Pipeline and MLP Symposium - December 2008 1 Buckeye Partners, L.P. Forward Looking Statement Certain statements contained in this presentation or made by representatives
Tidewater Midstream and Infrastructure Ltd. announces fourth quarter 2018 results and operational update and earnings call
 Tidewater Midstream and Infrastructure Ltd. announces fourth quarter 2018 results and operational update and earnings call CALGARY, March 14, 2019 /CNW/ - Tidewater Midstream and Infrastructure Ltd. ("Tidewater"
INVESTOR PRESENTATION. March 2019
 INVESTOR PRESENTATION March 2019 FORWARD-LOOKING STATEMENTS Some of the statements in this presentation constitute forward-looking statements about Sunoco LP ( SUN, we, our, and us ) that involve risks,
2015 UBS MLP 1x1 Conference Park City, Utah January 13-14, 2015
 2015 UBS MLP 1x1 Conference Park City, Utah January 13-14, 2015 FORWARD-LOOKING STATEMENTS This presentation contains forward-looking statements that we believe to be reasonable as of the date of this
Wells Fargo Annual Pipeline and MLP Symposium
 Wells Fargo Annual Pipeline and MLP Symposium New York City Dec. 2017 1 Forward-Looking Statements Portions of this document constitute forward-looking statements as defined by federal law. Although management
Master Limited Partnership Association Annual Investor Conference. Orlando June 2016
 Master Limited Partnership Association Annual Investor Conference Orlando June 2016 1 Forward-Looking Statements Portions of this document constitute forward-looking statements as defined by federal law.
Valero Energy Reports Third Quarter 2016 Results
 Valero Energy Reports Third Quarter 2016 Results Reported net income attributable to Valero stockholders of $613 million, or $1.33 per share. Reported adjusted net income attributable to Valero stockholders
PBF Energy June 2018
 PBF Energy June 2018 1 Safe Harbor Statements This presentation contains forward-looking statements made by PBF Energy Inc. ( PBF Energy ), the indirect parent of PBF Logistics LP ( PBFX, or Partnership,
Master Limited Partnership Association Investor Conference
 Master Limited Partnership Association Investor Conference Orlando May 31 June 1, 2017 1 Forward-Looking Statements Portions of this document constitute forward-looking statements as defined by federal
Transformation through Distinctive Performance Simmons Energy Conference. February 27, 2014
 Transformation through Distinctive Performance Simmons Energy Conference February 27, 2014 Forward Looking Statements This Presentation includes forward looking statements within the meaning of the Private
Valero Energy Reports Third Quarter 2017 Results
 Valero Energy Reports Third Quarter 2017 Results Reported net income attributable to Valero stockholders of $841 million, or $1.91 per share. Invested $565 million of growth and sustaining capital in the
Buckeye Partners, L.P. Master Limited Partner Conference February 2005
 Buckeye Partners, L.P. Master Limited Partner Conference February 2005 Forward Looking Statements This presentation may include forward-looking statements within the meaning of Section 27A of the Securities
SEACOR HOLDINGS ANNOUNCES RESULTS FOR ITS SECOND QUARTER AND SIX MONTHS ENDED JUNE 30, 2016
 August 1, SEACOR HOLDINGS ANNOUNCES RESULTS FOR ITS SECOND QUARTER AND SIX MONTHS ENDED JUNE 30, FORT LAUDERDALE, FL -- (Marketwired) -- 08/01/16 -- SEACOR Holdings Inc. (NYSE: CKH) (the "Company") today
UBS MLP One-On-One Conference 2016 Park City, Utah January 12-13, 2016
 UBS MLP One-On-One Conference 2016 Park City, Utah January 12-13, 2016 FORWARD-LOOKING STATEMENTS This presentation contains forward-looking statements that we believe to be reasonable as of the date of
PBF Energy Inc. (NYSE: PBF) January 2017 Investor Presentation
 January 2017 Investor Presentation") PBF Energy Inc. (NYSE: PBF) January 2017 Investor Presentation Safe Harbor Statements This presentation contains forward-looking statements made by PBF Energy Inc. ( PBF Energy ), the indirect parent of
PBF Energy Inc. (NYSE: PBF) January 2017 Investor Presentation Safe Harbor Statements This presentation contains forward-looking statements made by PBF Energy Inc. ( PBF Energy ), the indirect parent of
Evercore ISI Energy Summit. Houston March 7, 2017
 Evercore ISI Energy Summit Houston March 7, 2017 1 Forward-Looking Statements Portions of this document constitute forward-looking statements as defined by federal law. Although management believes any
(NYSE:TLP) Master Limited Partnership Association (MLPA) Conference
 Master Limited Partnership Association (MLPA) Conference") (NYSE:TLP) Master Limited Partnership Association (MLPA) Conference June 1, 2017 Forward Looking Statements All statements, other than statements of historical facts, contained herein and made by representatives
(NYSE:TLP) Master Limited Partnership Association (MLPA) Conference June 1, 2017 Forward Looking Statements All statements, other than statements of historical facts, contained herein and made by representatives
PBF Logistics LP (NYSE: PBFX)
") PBF Logistics LP (NYSE: PBFX) UBS MLP One-on-One Conference January 2017 Safe Harbor Statements This presentation contains forward-looking statements made by PBF Logistics LP ( PBFX ), PBF Energy Inc.
PBF Logistics LP (NYSE: PBFX) UBS MLP One-on-One Conference January 2017 Safe Harbor Statements This presentation contains forward-looking statements made by PBF Logistics LP ( PBFX ), PBF Energy Inc.
Tesoro Logistics LP NYSE: TLLP Citi MLP/Midstream Infrastructure Conference August 2012
 Tesoro Logistics LP NYSE: TLLP 2012 Citi MLP/Midstream Infrastructure Conference August 2012 Forward Looking Statements This Presentation includes forward-looking statements. These statements relate to,
Casper Terminal Acquisition
 Casper Terminal Acquisition October 2015 Cautionary Statements This presentation may contain forward-looking statements within the meaning of U.S. federal securities laws, including statements related
Wells Fargo Pipeline, MLP and Energy Symposium
 Wells Fargo Pipeline, MLP and Energy Symposium December 10, 2013 LEGAL NOTICE/FORWARD-LOOKING STATEMENTS This presentation contains forward-looking statements that we believe to be reasonable as of the
Valero Energy Reports Third Quarter 2018 Results
 Valero Energy Reports Third Quarter 2018 Results Reported net income attributable to Valero stockholders of $856 million, or $2.01 per share. Invested $604 million of capital in the third quarter. Approved
Creating Superior Value Go for Extraordinary
 Creating Superior Value Go for Extraordinary Mizuho Energy Summit April 9-10, 2018 Forward Looking Statements This presentation (and oral statements made regarding the subjects of this presentation) includes
Chickasaw Capital Management MLP Investor Conference Houston, TX September 21, 2016
 Chickasaw Capital Management MLP Investor Conference Houston, TX September 21, 2016 FORWARD-LOOKING STATEMENTS This presentation contains forward-looking statements that we believe to be reasonable as
Report to Shareholders
 Year ended 2015 Report to Shareholders Management s Discussion and Analysis Q4 2015 Table of Contents 1. Financial and operating summary...3 2. Segment results... 10 3. Quarterly financial data... 22 4.
BMO 2017 High Yield Conference Toronto October 5, parkland.ca
 BMO 2017 High Yield Conference Toronto October 5, 2017 parkland.ca FORWARD LOOKING STATEMENT DISCLAIMER & NOTE ON NON GAAP MEASURES Certain information included herein is forward-looking. Many of these
Alon USA Reports Fourth Quarter and Full Year 2010 Results
 March 10, 2011 Alon USA Reports Fourth Quarter and Full Year 2010 Results Company schedules conference call for March 11, 2011, at 10:00 A.M. Eastern DALLAS, March 10, 2011 /PRNewswire/ -- Alon USA Energy,
BPL 2011 Third-Quarter Earnings Results Page 1. Buckeye Partners, L.P. One Greenway Plaza Suite 600 Houston, TX 77046
 BPL 2011 Third-Quarter Earnings Results Page 1 News Release NYSE: BPL Buckeye Partners, L.P. One Greenway Plaza Suite 600 Houston, TX 77046 Contact: Investor Relations Irelations@buckeye.com (800) 422-2825
Martin Midstream Partners Reports 2018 Fourth Quarter Financial Results
 Martin Midstream Partners Reports 2018 Fourth Quarter Financial Results February 13, 2019 Net income of $44.1 million for 2018 Adjusted Leverage Ratio 4.61x at 2018 Financial Guidance for 2019 KILGORE,
PBF Energy January 2019
 PBF Energy January 2019 1 Safe Harbor Statements This presentation contains forward-looking statements made by PBF Energy Inc. ( PBF Energy ), the indirect parent of PBF Logistics LP ( PBFX, or Partnership,
Valero Energy Reports 2017 Fourth Quarter and Full Year Results
 Valero Energy Reports 2017 Fourth Quarter and Full Year Results Reported net income attributable to Valero stockholders of $2.4 billion, or $5.42 per share, for the fourth quarter and $4.1 billion, or
Fourth Quarter and Full Year 2016
 Fourth Quarter and Full Year 2016 Financial Results Conference Call February 24, 2017 Forward-Looking Statements This Presentation has been prepared by Calumet Specialty Products Partners, L.P. (the Company
INVESTOR PRESENTATION. December 2018
 INVESTOR PRESENTATION December 2018 FORWARD-LOOKING STATEMENTS Some of the statements in this presentation constitute forward-looking statements about Sunoco LP ( SUN, we, our, and us ) that involve risks,
Oiltanking s Houston Ship Channel Pipeline and Storage Project September 21,
 Oiltanking s Houston Ship Channel Pipeline and Storage Project September 21, 2012 Trying to look all big and dumb.. Forward-Looking Statements Some of the information in this presentation may contain forward-looking
Buckeye Partners, L.P. One Greenway Plaza Suite 600 Houston, TX 77046
 News Release NYSE: BPL Buckeye Partners, L.P. One Greenway Plaza Suite 600 Houston, TX 77046 Contact: Kevin J. Goodwin Senior Director, Investor Relations Irelations@buckeye.com (800) 422-2825 BUCKEYE
NYSE: MMP. Citi One-on-One MLP / Midstream Infrastructure Conference
 NYSE: MMP Citi One-on-One MLP / Midstream Infrastructure Conference Las Vegas Aug. 15-16, 2018 Forward-Looking Statements Portions of this document constitute forward-looking statements as defined by federal
KIRBY CORPORATION ANNOUNCES 2016 THIRD QUARTER RESULTS third quarter earnings per share of $0.59 compared with $1.04 in the 2015 third quarter
 KIRBY CORPORATION FOR IMMEDIATE RELEASE Contact: Sterling Adlakha 713-435-1101 KIRBY CORPORATION ANNOUNCES 2016 THIRD QUARTER RESULTS 2016 third quarter earnings per share of $0.59 compared with $1.04
2017 Annual financial statements and management discussion and analysis
 2017 Annual financial statements and management discussion and analysis Financial section Table of contents Page Financial information (U.S. GAAP)... 2 Frequently used terms... 3 Management s discussion
EXXON MOBIL CORPORATION ANNOUNCES ESTIMATED FOURTH QUARTER 2012 RESULTS % %
 News Release Exxon Mobil Corporation 5959 Las Colinas Boulevard Irving, TX 75039 972 444 1107 Telephone 972 444 1138 Facsimile FOR IMMEDIATE RELEASE FRIDAY, FEBRUARY 1, 2013 EXXON MOBIL CORPORATION ANNOUNCES
INFRASTRUCTURE 8 LOGISTICS 10 WHOLESALE 10
 Contents BUSINESS OVERVIEW 2 SELECTED FINANCIAL INFORMATION 2 2018 REVIEW 3 PROJECT DEVELOPMENTS, ACQUISITIONS AND MARKET OUTLOOK 5 RESULTS OF CONTINUING OPERATIONS 7 INFRASTRUCTURE 8 LOGISTICS 10 WHOLESALE
Valero Energy Reports First Quarter 2018 Results
 Valero Energy Reports First Quarter 2018 Results Reported net income attributable to Valero stockholders of $469 million, or $1.09 per share, and adjusted net income attributable to Valero stockholders
HollyFrontier Corporation Reports Quarterly Net Income
 February 21, 2018 HollyFrontier Corporation Reports Quarterly Net Income DALLAS--(BUSINESS WIRE)-- HollyFrontier Corporation (NYSE: HFC) ("HollyFrontier" or the "Company") today reported fourth quarter
CIBC Annual Whistler Institutional Investor Conference January 25-28, 2017 Whistler, BC. parkland.ca
 CIBC Annual Whistler Institutional Investor Conference January 25-28, 2017 Whistler, BC parkland.ca FORWARD LOOKING STATEMENT DISCLAIMER & NOTE ON NON-GAAP MEASURES 2 Certain information included herein
PBF Logistics LP (NYSE: PBFX)
") PBF Logistics LP (NYSE: PBFX) Master Limited Partnership Association 2016 Investor Conference June 2016 Safe Harbor Statements This presentation contains forward-looking statements made by PBF Logistics
PBF Logistics LP (NYSE: PBFX) Master Limited Partnership Association 2016 Investor Conference June 2016 Safe Harbor Statements This presentation contains forward-looking statements made by PBF Logistics
Forward-Looking Statements
 March 2006 0 Forward-Looking Statements This presentation contains forward-looking statements that are subject to a number of risks and uncertainties, many of which are outside our control. These forward-looking
Alon USA Reports Fourth Quarter and Full Year 2012 Results
 March 6, 2013 Alon USA Reports Fourth Quarter and Full Year 2012 Results Company schedules conference call for March 7, 2013 at 11:30 a.m. Eastern DALLAS, March 6, 2013 /PRNewswire/ -- Alon USA Energy,
Credit Suisse MLP and Energy Logistics Conference
 Credit Suisse MLP and Energy Logistics Conference New York City June 2014 www.magellanlp.com Forward-Looking Statements Portions of this document constitute forward-looking statements as defined by federal
Marathon Petroleum Corporation Reports First-Quarter 2015 Results
 Marathon Petroleum Corporation Reports First-Quarter 2015 Results Reported record first-quarter earnings of $891 million ($3.24 per diluted share) Converted over 400 of the 1,245 new retail sites to the
KIRBY CORPORATION ANNOUNCES 2011 FIRST QUARTER RESULTS
 KIRBY CORPORATION FOR IMMEDIATE RELEASE Contact: Steve Holcomb 713-435-1135 KIRBY CORPORATION ANNOUNCES 2011 FIRST QUARTER RESULTS 2011 first quarter earnings per share were $.60 compared with $.46 earned
Forward-Looking Statements
 William Blair & Company 27 th Annual Growth Stock Conference June 20, 2007 0 Forward-Looking Statements This presentation contains forward-looking statements that are subject to a number of risks and uncertainties,
CREDIT SUISSE 2015 MLP & ENERGY LOGISTICS CONFERENCE. June 23, 2015
 CREDIT SUISSE 2015 MLP & ENERGY LOGISTICS CONFERENCE June 23, 2015 FORWARD-LOOKING STATEMENTS Some of the statements in this presentation constitute forward-looking statements about Sunoco LP ( SUN ) and
BMO Farm to Market Conference. May 18, 2017
 BMO Farm to Market Conference May 18, 2017 Todd Becker President & Chief Executive Officer Green Plains Inc. NASDAQ: GPRE www.gpreinc.com Green Plains Partners LP NASDAQ: GPP www.greenplainspartners.com
Jefferies 2014 Global Energy Conference. November 11 & 12, 2014
 Jefferies 2014 Global Energy Conference November 11 & 12, 2014 Forward Looking Statements Statements contained in this presentation that state management s expectations or predictions of the future are
HollyFrontier Corporation Reports Quarterly Net Income
 November 5, 2014 HollyFrontier Corporation Reports Quarterly Net Income DALLAS--(BUSINESS WIRE)-- HollyFrontier Corporation (NYSE:HFC) ("HollyFrontier" or the "Company") today reported third quarter net
KIRBY CORPORATION ANNOUNCES 2017 FOURTH QUARTER AND FULL YEAR RESULTS
 KIRBY CORPORATION FOR IMMEDIATE RELEASE Contact: Eric Holcomb 713-435-1545 KIRBY CORPORATION ANNOUNCES 2017 FOURTH QUARTER AND FULL YEAR RESULTS 2017 fourth quarter and full year earnings per share of