Investor Presentation September 2018
|
|
|
- Stanley Morrison
- 5 years ago
- Views:
Transcription
1 Investor Presentation September 2018
2 Forward Looking Statements This presentation contains forward-looking statements within the meaning of the Private Securities Litigation Reform Act of These forward-looking statements involve certain risks and uncertainties that could cause actual results to differ materially from those expressed or implied by these statements. These risks and uncertainties include factors detailed in the reports we file with the SEC, including those described under Risk Factors in our most recent Annual Report on Form 10-K and our Quarterly Reports on Form 10-Q. These forward-looking statements speak only as of the date of this communication. We expressly disclaim any obligation or undertaking to disseminate any updates or revisions to any forward-looking statement contained herein to reflect any change in our expectations with regard thereto or any change in events, conditions or circumstances on which any such statement is based. It should also be noted that this presentation contains certain financial measures, including Adjusted EBITDA, Adjusted Earnings per Share, Adjusted Free Cash Flow, and Net Leverage Ratio that are not required by, or presented in accordance with, accounting principles generally accepted in the United States, or GAAP. These measures are presented here to provide additional useful measurements to review our operations, provide transparency to investors and enable periodto-period comparability of financial performance. A description of non-gaap financial measures that we use to evaluate our operations and financial performance, and reconciliation of these non-gaap financial measures to the most directly comparable financial measures calculated and reported in accordance with GAAP, can be found in the appendix under Reconciliation of Non-GAAP Measures. 2


3 About AAM $7B PRO FORMA SALES AAM is a premier, global leader in design, engineering, validation and manufacturing of driveline, metal forming, powertrain and casting technologies for automotive, commercial and industrial markets Over 75 MANUFACTURING FACILITIES Over 700 CUSTOMERS AAM is Delivering POWER through world-class quality, technology leadership and operational excellence 16 ENGINEERING CENTERS Over 25,000 ASSOCIATES 17 COUNTRIES Over 90 LOCATIONS 3
4 Strong Financial Performance SALES ADJUSTED EBITDA * MARGIN $8.0 $7.0 $6.0 $5.0 $4.0 $3.2 $3.7 $3.9 $3.9 $6.3 $ $7.25** 18.0% 17.0% 16.0% 15.0% 14.0% 13.2% 13.9% 14.6% 15.7% 17.6% 17.5% %** $ % 12.0% $ % $ % $ E 9.0% E Dollars in billions AAM has been growing sales while delivering industry-leading profitability * For definitions of terms and Non-GAAP reconciliations, please see the attached appendix **Mid point of the 2018 target used for charting purposes 4


5 Strong Financial Performance ADJ. FREE CASH FLOW * NET LEVERAGE RATIO * $400 $350 $300 $250 $200 $150 $123 $190 $199 $341 5% of Sales $ $50 $- $ E E Dollars in millions Strong free cash flow growth generation and net leverage reduction * For definitions of terms and Non-GAAP reconciliations, please see the attached appendix 5


6 Business Units and Market Leadership DRIVELINE $4.0B #1 Globally - Full-Size Pickup Trucks and SUV driveline systems #1 North America and #2 China AWD Systems for crossovers Pioneer of Disconnecting AWD systems POWERTRAIN $1.1B #1 Globally Powder metal connecting rods Damped gears and rubber isolation pulleys Viscous dampers for passenger cars #1 North America - Aluminum valve bodies METAL FORMING $1.5B CASTING $900M Largest automotive forger in the world #1 Globally - Differential gears, axle shafts, hypoid pinions and ring gears #1 North America - Transmission gears and CVT pulleys Leading automotive iron casting operations #1 North America ductile iron casting supplier #1 / #2 North America - Differential carriers and cases, steering knuckles, control arms and brake calipers *Note: Market leadership based on company estimates as compared to other independent suppliers, business unit sales based on estimated 2017 pro forma amounts before eliminations of intercompany sales of approximately $0.5 billion 6
7 AAM Growth Opportunities
8 New and Incremental Business Backlog Commercial and Other 5% $1.5 BILLION: as disclosed on January 17, 2018 Backlog by Vehicle Segment Full-size Light Truck and SUV 25% Passenger Cars 15% Backlog by Global Market Europe 15% Asia 20% South America and other 5% Crossover Vehicles 55% North America 60% 40% of our New Business Backlog is in markets outside of North America 8


9 Revenue Diversification Other Top 15 Global OEMs 6% Ford 1% AAM 2016 Sales by Customer FCA 18% Other 8% GM 67% 2016 Sales by Region North America 84% Asia 10% Europe 3% Other 3% 2016 Sales by BU Metal Forming 13% Driveline 87% AAM 2020E Sales by Customer 2020E Sales by Region 2020E Sales by BU Other Top 15 Global OEMs 13% Other 27% FCA 15% GM 31% Ford 14% North America 76% Asia 11% Europe 10% Other 3% Casting 12% Powertrain 17% Metal Forming 20% Driveline 51% AAM experiencing diversification and growth in many areas 9
10 China Continues to Drive Growth for AAM AAM China Sales $700 $440 $ E Current growth driven by: Demand for crossover vehicles, luxury passenger cars and LCVs JV partnerships (Liuzhou AAM and HAAM) New business awards in our backlog: Differential assemblies (SAIC-GM) Power Transfer Units (Foton, SAIC-GM, CAF) Isolation Pulleys (Geely and Renault) Rubber Dampers (Chery) Transmission Valve Bodies (Wanliyang) Balance Shaft Assemblies (CAF and SAIC) Transmissions Shafts and Gears (Volkswagen) Connecting Rods (SAIC) Dollars in millions * Includes revenues of unconsolidated joint ventures 10
11 Exponential Growth in Europe $100 AAM Europe Sales $480 $700 Current growth driven by: MPG acquisition Added Metal Forming operations Strong Powertrain presence New business launches Two new e-aam program launches Global crossover program begins production Growing relationships with Daimler, JLR, Ford, Renault, and BMW E Dollars in millions 11
12 Global Growth Beyond % of AAM s $1.5 billion quoting and emerging business opportunities are outside of North America * Hybridization will drive additional Powertrain content Increased demand for our e-aam products to support higher electric vehicle production, especially in Europe and China Increased global Metal Forming presence Further leveraging joint venture partnerships AAM s multi business unit strategy for global growth features many innovative technologies * As disclosed in June
13 Technology Leadership


")


14 AAM Technology Leadership ICE HYBRID ELECTRIC (BEV) AAM ENGINEERING COMPETENCIES Efficiency Customer Value Lightweighting Performance/NVH Power Density 14


15 EcoTrac Continues to Drive Profitable Growth $800M Cherokee Currently Launching Terrain/Equinox $550M in % CAGR $55M in 2013 Edge/Nautilus Cadillac XT4 Featured on several significant global crossover platforms 15


16 QUANTUM Technology QUANTUM Features all-new, completely redesigned family of lightweight axles and drive units KEY ATTRIBUTES Industry first technology along with a revolutionary design Significant mass reduction (up to 35%) In combination, additional efficiency and weight reduction can deliver 1% to 1.5% improved vehicle fuel economy Scalable across multiple applications - without loss of performance or power Streamlined manufacturing process for key driveline components QUANTUM in Light Duty Truck QUANTUM RDU w/ elsd QUANTUM Rear Axle Recently awarded inaugural Altair Enlighten Future of Lightweighting Award! 16


17 Key Fuel Efficiency Trends Benefit AAM Downsized Engines Multi-speed Transmissions Crankshaft Dampers & Isolation Pulleys 3 Cylinder Engine Balance Shaft Systems 10 Speed Transmission Transmission Components Damped Gears Demand for fuel efficiency gains is driving powertrain conversions, leading to additional AAM content-per-vehicle opportunities of over $100 17


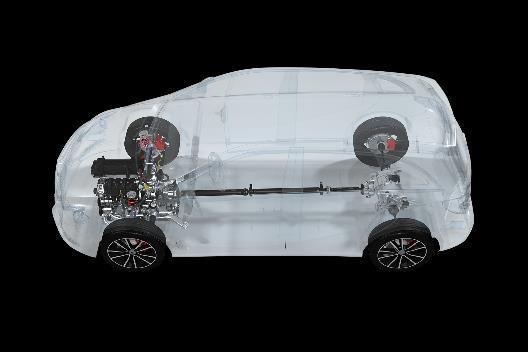
 AAM P4 e-drive")
18 e-aam Hybrid and Electric Driveline Systems TM e-aam driveline systems Position AAM to benefit from the global trend of electrification KEY ATTRIBUTES Highly integrated electric motor, gear reduction, & differential Power dense, low NVH, high efficiency design allows for easy integration for multiple vehicle platforms Modular solutions for passenger cars / crossovers to provide economies of scale Optional features for performance and functionality AAM P4 Rear e-drive unit (Hybrid) AAM P4 e-drive units (e-awd BEV) 18

19 Hybrid and Electric Vehicle Architectures P0/P1 P2 P3 P4 AAM Content AAM Content AAM Content AAM Content Conventional AAM Content New Electrification AAM Content AAM content is featured across all hybrid and electric vehicle architectures 19
20 AAM s Capabilities for Hybrid and Electric Vehicles P0, P1 and P2 are fully supported by AAM s conventional content. P3 P4 Our e-aam investments have been focused on P3 and P4 solutions as growth opportunities. Conventional AAM Content New Electrification AAM Content Launching edrive in 2020 E-Systems Integration Launching edrive in 2018 Content per vehicle opportunities of $500 - $2,500+ for P3 and P4 applications 20
21 AAM and Electrification Current State >5% of our Backlog $100M - $200M Revenue by 2021 >$1B Booked Revenue e-aam is becoming an increasing part of our new business backlog Launching two sizable electrification programs with premium global OEMs Revenues of awarded business through lifetime of the booked programs AAM is benefiting from early investments in electrification 21
22 AAM and Electrification Future State RAPID GROWTH Total Addressable Market Estimated TAM for e-drive units expected to grow from $2 billion today to $10 billion by 2025 $500M * New Business Opportunities Approximately 1/3 of AAM s current $1.5 billion quoted and emerging new business opportunities relate to our e-aam products across Asia, Europe and North America 25% - 30% Expected Win Rate Based on AAM s technology and customer interest, we expect to achieve our normal win rate on new e-drive business opportunities We expect e-aam quoting activity to continue to expand and deliver significant organic growth * As disclosed in June
23 Financial Overview


24 2Q 2018 AAM Highlights $1.90B $348M 18.3% of sales Record Quarterly Sales Record Quarterly Adj. EBITDA * $100M Adjusted Free Cash Flow * AAM Recognized as Fortune 500 Company Sold Aftermarket division of our Powertrain BU Prepaid $100M of Senior Notes due 2022 * For definitions of terms and non-gaap reconciliations, please see the attached appendix. 24
25 AAM s 2018 Financial Targets As of August 3, Full Year Targets Sales Adjusted EBITDA* Margin Adjusted Free Cash Flow* $7.2 - $7.25 billion 17.5% % of sales 5% of sales Based on the anticipated launch schedule of our new business backlog and our assumption that the US SAAR* is in the range of 16.8 to 17.0 million units. Adjusted Free Cash Flow target assumes capital expenditures of 8% of sales. Elevated capital spending in 2018 reflects significant new and replacement program launches. We estimate approximately $50 to $75 million of restructuring and acquisition-related costs (net of related gains) and payments during The impact of these have been excluded from our Adjusted EBITDA and Adjusted Free Cash Flow targets. AAM expects another record year in 2018 * For definitions of terms, please see the attached appendix 25
26 Synergy Achievement Progress from MPG Acquisition Public Company Costs and Overhead Rationalization $40 M Purchasing Power and AAM Know-How $60 M Synergy Achievement Gauge (Annual Run Rate in millions) Vertical Integration Benefits and Manufacturing Initiatives $40 M Targeted Cost Reduction Synergies - Run Rate by 2020 = $140 M 1Q 2019 Target $120 million 2020 Target $140 million AAM has a clear path to meeting its updated synergy targets 26
27 Cash Flow ALIGNMENT Cash Flow is the SOLE operational financial metric for the 2018 LTI Management Performance Awards >$800M >$1.5B $341M 5% of Sales 2017 Adjusted Free Cash Flow* (FCF) Targeted 2018 Adjusted FCF 2019E E Adjusted FCF Projected Cumulative Adj. FCF E Strong cash flow potential and high free cash flow yield * For definitions of terms and Non-GAAP reconciliations, please see the attached 27
28 Cash Flow Breakeven 17.2 US SAAR (units in millions) 25-30% downturn 12 Highly variable cost structure allows for flexibility during periods of lower volumes AAM has track record of reducing fixed costs through facility and labor efficiency initiatives during previous downside periods Multiple options available to manage to additional potential change in volumes, including SG&A, capital spending, R&D etc. 2017E Breakeven Continued synergy attainment and productivity initiatives further reduce breakeven points AAM has a very flexible cost structure 28
29 Capital Allocation Leverage Reduction AAM has paid down >$300M of gross debt over last 12 months Organic Growth Invest in R&D and continue organic growth with the appropriate returns Strategic Focus on objectives of technology, portfolio positioning, diversification and growth Shareholder Activity At the appropriate time, other options that may benefit our shareholders further Capital allocation aligned with strategic objectives of AAM 29
30 Why AAM? SOLID FOUNDATIONAL BUSINESS INNOVATIVE TECHNOLOGY LEADERSHIP COMPELLING GROWTH AND DIVERSIFICATION INDUSTRY LEADING PROFITABILITY Concentrated in the strongest vehicle segments of light trucks, SUVs and crossovers Focused on hybridization, electrification, lightweighting, fuel efficiency and performance Driven by our new business backlog, innovative advanced technologies and global footprint Fueled by powerful vertical integration, productivity initiatives and operational excellence Potential for Multiple Expansion and Share Appreciation POWERFUL CASH GENERATOR Strong free cash flow yield while funding investments in profitable growth opportunities 30
31 Q&A
32 SUPPLEMENTAL DATA
33 Reconciliation of Non-GAAP Measures In addition to the results reported in accordance with accounting principles generally accepted in the United States of America (GAAP) included within this presentation, we have provided certain information, which includes non-gaap financial measures. Such information is reconciled to its closest GAAP measure in accordance with Securities and Exchange Commission rules and is included in the following slides. Certain of the forward-looking financial measures included in this presentation are provided on a non-gaap basis. A reconciliation of non-gaap forward-looking financial measures to the most directly comparable financial measures calculated and presented in accordance with GAAP is not practical given the difficulty of projecting event driven transactional and other non-core operating items, as well as accounting adjustments related to recent tax reform and their related effects in any future period. The magnitude of these items, however, may be significant. 33
34 Supplemental Data Earnings before Interest, Income Taxes, Depreciation and Amortization (EBITDA) and Adjusted EBITDA ($ in millions) Net income $ $ $ $ $ 94.5 Interest expense Income tax expense (benefit) (8.2) Depreciation and amortization EBITDA $ $ $ $ $ Restructuring and acquisition-related costs, debt refinancing and redepemtion costs and non-recurring items Adjusted EBITDA 1,102.7 $ $ $ $ as % of net sales 17.6 % 15.7 % 14.6 % 13.9 % 13.2 % 34
35 Supplemental Data EBITDA and Adjusted EBITDA for the Trailing Twelve Months Ended December 31, 2017 ($ in millions) Trailing Twelve Months Ended March 31, June 30, September 30, December 31, December 31, Net income $ 78.4 $ 66.3 $ 86.3 $ $ Interest expense Income tax expense (benefit) (13.1) 2.5 Depreciation and amortization EBITDA, as defined $ $ $ $ $ Restructuring and acquisition-related costs Debt refinancing and redemption costs Non-recurring items: Quarter Ended Acquisition-related fair value inventory adjustment Other (3.8) (0.5) Adjusted EBITDA $ $ $ $ $ 1,102.7 Pre-acquisition adjusted EBITDA from acquired entities Pro forma Adjusted EBITDA $ ,
36 Supplemental Data Free Cash Flow and Adjusted Free Cash Flow Reconciliation ($ in millions) Net cash provided by operating activities $ $ $ $ $ Purchases of property, plant & equipment, net of proceeds from sale of property, plant & equipment and from government grants (475.2) (218.5) (188.1) (195.3) (218.7) Free cash flow $ $ $ $ $ 4.3 Cash payments for restructuring and acquisition-related costs Acquisition-related settlement of pre-existing accounts payable balances with acquired entities 35.2 Interest payments upon settlement of acquired company debt 24.6 Adjusted free cash flow $ $ $ $ $
37 Supplemental Data Net Debt and Net Leverage Ratio ($ in millions) Twelve Months Ended December 31, 2017 Current portion of long-term debt $ 5.9 Long-term debt, net 3,969.3 Total debt, net 3,975.2 Less: Cash and cash equivalents Net debt at end of period $ 3,598.4 Pro forma Adjusted EBITDA $ 1,231.8 Net leverage ratio
38 Supplemental Data American Axle & Manufacturing Holdings, Inc. Net Debt and Net Leverage Ratio ($ in millions) at December 31, Current portion of long-term debt $ 3.3 $ 3.3 $ 13.0 $ Long-term debt, net 1, , , ,537.0 Total debt, net 1, , , ,537.0 Less: Cash and cash equivalents Net debt at end of period $ $ 1,096.5 $ 1,268.4 $ 1,383.0 Net leverage ratio
39 Supplemental Data EBITDA and Adjusted EBITDA Reconciliation ($ in millions) Three Months Ended June 30, Six Months Ended June 30, Net income $ $ 66.3 $ $ Interest expense Income tax expense Depreciation and amortization EBITDA Restructuring and acquisition-related costs Debt refinancing and redemption costs Gain on sale of business (15.5) - (15.5) - Non-recurring items: Gain on settlement of capital lease (15.6) - (15.6) - Acquisition-related fair value inventory adjustment Other - (3.7) - (3.7) Adjusted EBITDA $ $ $ $ As % of net sales 18.3% 18.5% 17.7% 18.1% 39
40 Supplemental Data Free Cash Flow and Adjusted Free Cash Flow Reconciliation ($ in millions) Three Months Ended Six Months Ended June 30, June 30, Net cash provided by operating activities $ $ $ $ Less: Capital expenditures net of proceeds from sale of property, (141.7) (103.0) (272.1) (137.1) plant and equipment Free cash flow Cash payments for restructuring and acquisition-related costs Acquisition-related settlement of pre-existing accounts payable balances with acquired entities Interest payments upon the settlement of acquired company debt Adjusted Free Cash Flow $ $ $ 58.6 $
41 Supplemental Data EBITDA and Adjusted EBITDA We define EBITDA to be earnings before interest expense, income taxes, depreciation and amortization. Adjusted EBITDA is defined as EBITDA excluding the impact of restructuring and acquisition-related costs, debt refinancing and redemption costs, and non-recurring items. We believe that EBITDA and Adjusted EBITDA are meaningful measures of performance as they are commonly utilized by management and investors to analyze operating performance and entity valuation. Our management, the investment community and the banking institutions routinely use EBITDA and Adjusted EBITDA, together with other measures, to measure our operating performance relative to other Tier 1 automotive suppliers. We also use Segment Adjusted EBITDA as the measure of earnings to assess the performance of each segment and determine the resources to be allocated to the segments. EBITDA and Adjusted EBITDA should not be construed as income from operations, net income or cash flow from operating activities as determined under GAAP. Other companies may calculate EBITDA and Adjusted EBITDA differently. Other Non-recurring Items Other non-recurring items reflect the impact of a non-cash pension settlement charge related to one of our foreign entities, the impact of a gain related to the change of our method of accounting for indirect inventory and the interest expense for the debt drawdown period prior to acquisition funding requirement. Free Cash Flow and Adjusted Free Cash Flow We define free cash flow to be net cash provided by operating activities less capital expenditures net of proceeds from the sale of property, plant and equipment and from government grants. Adjusted free cash flow is defined as free cash flow excluding the impact of cash payments for restructuring and acquisition-related costs, settlements of pre-existing accounts payable balances with acquired entities, and interest payments upon the settlement of acquired company debt. We believe free cash flow and Adjusted free cash flow are meaningful measures as they are commonly utilized by management and investors to assess our ability to generate cash flow from business operations to repay debt and return capital to our stockholders. Free cash flow and Adjusted free cash flow are also key metrics used in our calculation of incentive compensation. Other companies may calculate free cash flow and Adjusted free cash flow differently. Net Debt and Net Leverage Ratio We define net debt to be total debt, net less cash and cash equivalents. We define Net Leverage Ratio to be net debt divided by the trailing 12 months of Adjusted EBITDA or pro forma Adjusted EBITDA, where applicable. Pro forma Adjusted EBITDA includes AAM's Adjusted EBITDA and the pre-acquisition EBITDA of acquired entities. We believe that Net Leverage Ratio is a meaningful measure of financial condition as it is commonly used by management, investors and creditors to assess capital structure risk. Other companies may calculate Net Leverage Ratio differently. Liquidity We define Liquidity as cash on hand plus amounts available on our revolving credit facility and foreign credit facilities. US SAAR We define US SAAR as the seasonally adjusted annual rate of light vehicle sales in the United States. CAGR We define CAGR to be the compound annual growth rate of sales. 41
Bank of America Merrill Lynch Leveraged Finance Conference December 5, 2018
 Bank of America Merrill Lynch Leveraged Finance Conference December 5, 2018 Forward Looking Statements This presentation contains forward-looking statements within the meaning of the Private Securities
INVESTOR PRESENTATION MARCH 2018
 INVESTOR PRESENTATION MARCH 2018 Forward Looking Statements This presentation contains forward-looking statements within the meaning of the Private Securities Litigation Reform Act of 1995. These forward-looking
UNITED STATES SECURITIES AND EXCHANGE COMMISSION WASHINGTON, DC FORM 8-K
 UNITED STATES SECURITIES AND EXCHANGE COMMISSION WASHINGTON, DC 20549 FORM 8-K CURRENT REPORT PURSUANT TO SECTION 13 OR 15(D) OF THE SECURITIES EXCHANGE ACT OF 1934 Date of report (Date of earliest event
Investor Presentation January 2019
 Investor Presentation January 2019 Forward Looking Statements This presentation contains forward-looking statements within the meaning of the Private Securities Litigation Reform Act of 1995. These forward-looking
UNITED STATES SECURITIES AND EXCHANGE COMMISSION WASHINGTON, DC FORM 8-K
 UNITED STATES SECURITIES AND EXCHANGE COMMISSION WASHINGTON, DC 20549 FORM 8-K CURRENT REPORT PURSUANT TO SECTION 13 OR 15(D) OF THE SECURITIES EXCHANGE ACT OF 1934 Date of report (Date of earliest event
Second Quarter 2018 Earnings Call August 3, 2018
 Second Quarter 2018 Earnings Call August 3, 2018 Forward-Looking Statements This supplemental information contains forward-looking statements within the meaning of the Private Securities Litigation Reform
Fourth Quarter 2017 Earnings Call. February 16, 2018
 Fourth Quarter 2017 Earnings Call February 16, 2018 Forward-Looking Statements This supplemental information contains forward-looking statements within the meaning of the Private Securities Litigation
Fourth Quarter and Full Year 2018 Earnings Call February 15, 2019
 Fourth Quarter and Full Year 2018 Earnings Call February 15, 2019 Forward-Looking Statements This supplemental information contains forward-looking statements within the meaning of the Private Securities
Third Quarter 2018 Earnings Call November 2, 2018
 Third Quarter 2018 Earnings Call November 2, 2018 Forward-Looking Statements This supplemental information contains forward-looking statements within the meaning of the Private Securities Litigation Reform
FORM 8-K. AMERICAN AXLE & MANUFACTURING HOLDINGS, INC. (Exact Name of Registrant as Specified in Its Charter)
") UNITED STATES SECURITIES AND EXCHANGE COMMISSION WASHINGTON, DC 20549 FORM 8-K CURRENT REPORT PURSUANT TO SECTION 13 OR 15(D) OF THE SECURITIES EXCHANGE ACT OF 1934 Date of report (Date of earliest event
UNITED STATES SECURITIES AND EXCHANGE COMMISSION WASHINGTON, DC 20549 FORM 8-K CURRENT REPORT PURSUANT TO SECTION 13 OR 15(D) OF THE SECURITIES EXCHANGE ACT OF 1934 Date of report (Date of earliest event
Subject Company: Metaldyne Performance Group Inc. (Commission File No: )
") 2016 BANK OF AMERICA MERRILL LYNCH LEVERAGED FINANCE CONFERENCE NOVEMBER 30, 2016 Filed by American Axle & Manufacturing Holdings, Inc. (Commission File No. 1-14303) Pursuant to Rule 425 of the Securities
2016 BANK OF AMERICA MERRILL LYNCH LEVERAGED FINANCE CONFERENCE NOVEMBER 30, 2016 Filed by American Axle & Manufacturing Holdings, Inc. (Commission File No. 1-14303) Pursuant to Rule 425 of the Securities
AAM Reports Fourth Quarter and Full Year 2017 Financial Results
 For Immediate Release AAM Reports Fourth Quarter and Full Year 2017 Financial Results Achieves record full year sales and accelerates business diversification in 2017 DETROIT, February 16, 2018 -- American
AAM Reports First Quarter 2018 Financial Results
 For Immediate Release AAM Reports First Quarter 2018 Financial Results New business backlog drives record quarterly sales DETROIT, May 4, 2018 -- American Axle & Manufacturing Holdings, Inc. (AAM), (NYSE:
UNITED STATES SECURITIES AND EXCHANGE COMMISSION WASHINGTON, DC FORM 8-K
 UNITED STATES SECURITIES AND EXCHANGE COMMISSION WASHINGTON, DC 20549 FORM 8-K CURRENT REPORT PURSUANT TO SECTION 13 OR 15(D) OF THE SECURITIES EXCHANGE ACT OF 1934 Date of report (Date of earliest event
AAM Reports Second Quarter 2018 Financial Results
 For Immediate Release AAM Reports Second Quarter 2018 Financial Results AAM achieves record quarterly sales and gross profit DETROIT, August 3, 2018 -- American Axle & Manufacturing Holdings, Inc. (AAM),
UNITED STATES SECURITIES AND EXCHANGE COMMISSION WASHINGTON, DC FORM 8-K
 UNITED STATES SECURITIES AND EXCHANGE COMMISSION WASHINGTON, DC 20549 FORM 8-K CURRENT REPORT PURSUANT TO SECTION 13 OR 15(D) OF THE SECURITIES EXCHANGE ACT OF 1934 Date of report (Date of earliest event
AMERICAN AXLE & MANUFACTURING HOLDINGS, INC. (Exact Name of Registrant as Specified in Its Charter)
") UNITED STATES SECURITIES AND EXCHANGE COMMISSION WASHINGTON, DC 20549 FORM 8-K CURRENT REPORT PURSUANT TO SECTION 13 OR 15(D) OF THE SECURITIES EXCHANGE ACT OF 1934 Date of report (Date of earliest event
UNITED STATES SECURITIES AND EXCHANGE COMMISSION WASHINGTON, DC 20549 FORM 8-K CURRENT REPORT PURSUANT TO SECTION 13 OR 15(D) OF THE SECURITIES EXCHANGE ACT OF 1934 Date of report (Date of earliest event
J.P. Morgan Auto Conference
 Combination with GKN Driveline J.P. Morgan Auto Conference August 8, 2017 Creating a Global Leader in Electrified Drive Systems Jonathan Collins Executive Vice President & Chief Financial Officer March
Dana Investor Forum Hosted by Guggenheim Securities
 Dana Investor Forum Hosted by Guggenheim Securities March 19, 2018 Dana 2018 1 Safe Harbor Statement Important Information for Investors and Stockholders This presentation does not constitute an offer
SAA Planning Summit September 13, 2016
 SAA Planning Summit September 13, 2016 Disclaimer This presentation and any related statements contain certain forward-looking statements about MPG s financial results and estimates and business prospects
First Quarter 2017 Results & Outlook for May 2, 2017
 First Quarter 2017 Results & Outlook for 2017 May 2, 2017 Forward-Looking Statements and Risk Factors This presentation contains statements which constitute forward-looking statements, within the meaning
Fourth Quarter and Full Year 2017 Earnings Conference Call
 Fourth Quarter and Full Year 2017 Earnings Conference Call February 9, 2018 NYSE: TEN Agenda Fourth Quarter Highlights Segment Results Financial Overview Full Year Highlights and Outlook Brian Kesseler
Second Quarter Earnings Conference Call
 Second Quarter Earnings Conference Call July 27, 2018 NYSE: TEN 1 Safe Harbor Forward-Looking Statements This communication contains forward-looking statements. These forward-looking statements include,
Investor Presentation. August 2016
 Investor Presentation August 2016 The Strategic Difference Technology Leadership Customer and Geographic Diversity Financial Strength and Discipline Copyright 2016 BorgWarner Inc. 2 Attractive Business
FY 2017 Third Quarter Earnings Call
 FY 2017 Third Quarter Earnings Call July 27, 2017 Improving the experience of a world in motion Forward Looking Statement Adient has made statements in this document that are forward-looking and, therefore,
Annual Meeting of Stockholders
 Annual Meeting of Stockholders May 17, 2018 Presented by: Ray Scott, President and CEO Jeff Vanneste, SVP and CFO Safe Harbor Statement Forward-Looking Statements This presentation contains forward-looking
Driving Value Through Culture, Innovation and Results. INVESTOR PRESENTATION November 2017
 Driving Value Through Culture, Innovation and Results INVESTOR PRESENTATION November 2017 Forward-Looking Statements This presentation includes forward-looking statements within the meaning of U.S. federal
First Quarter 2018 Earnings Call. April 26, 2018
 First Quarter 2018 Earnings Call April 26, 2018 Safe Harbor Statement Forward-Looking Statements This presentation contains forward-looking statements within the meaning of the Private Securities Litigation
Driving Value Through Culture, Innovation and Results. INVESTOR PRESENTATION March 2018
 Driving Value Through Culture, Innovation and Results INVESTOR PRESENTATION March 2018 Forward-Looking Statements This presentation includes forward-looking statements within the meaning of U.S. federal
Third Quarter Earnings Conference Call
 Third Quarter Earnings Conference Call October 26, 2018 NYSE: TEN 1 Safe Harbor Forward-Looking Statements This communication contains forward-looking statements. These forward-looking statements include,
2018 FOURTH QUARTER EARNINGS CALL
 NORTH AMERICA S LEADING BUILDING MATERIALS DISTRIBUTOR RESIDENTIAL COMMERCIAL INTERIOR SOLAR 2018 FOURTH QUARTER EARNINGS CALL Forward Looking Statements / Non-GAAP Measures This presentation contains
$7B K+ COMPANY PROFILE. 17 Countries. More than 90 Locations. Nearly $7B Pro Forma Sales. 17 Engineering Centers
 2017 ANNUAL REPORT COMPANY PROFILE 17 Countries 17 More than 90 Locations 90+ Nearly $7B Pro Forma Sales $7B 17 Engineering Centers 17 More than 700 Customers 700+ More than 25,000 Associates 25K+ More
Fourth Quarter and Full Year 2018 Earnings Conference Call
 Fourth Quarter and Full Year 2018 Earnings Conference Call March 14, 2019 NYSE: TEN 1 Safe Harbor Forward-Looking Statements This communication contains forward-looking statements. These forward-looking
FISCAL YEAR 2018 FIRST QUARTER EARNINGS PRESENTATION
 FISCAL YEAR 2018 FIRST QUARTER EARNINGS PRESENTATION Jay Craig CEO & President Kevin Nowlan Senior Vice President & CFO January 31, 2018 Proprietary Meritor, Inc. 2017 Forward-Looking Statements This presentation
Adient ( ADNT ) Investor Meeting. November 2016
 Investor Meeting. November 2016") Adient ( ADNT ) Investor Meeting November 2016 Forward looking statements Adient has made statements in this document that are forward-looking and, therefore, are subject to risks and uncertainties. All
Adient ( ADNT ) Investor Meeting November 2016 Forward looking statements Adient has made statements in this document that are forward-looking and, therefore, are subject to risks and uncertainties. All
Visteon Q4 and Full Year 2018 Earnings. February 21, 2019
 Visteon Q4 and Full Year 2018 Earnings February 21, 2019 2018 Highlights Financial Performance Sales of $2,984 million Adj. EBITDA of $330 million Adj. FCF of $107 million Outperforming in China Sales
/// The New Wabtec. February 25, 2019
 The New Wabtec February 25, 2019 DISCLAIMER / FORWARD-LOOKING STATEMENTS Caution Concerning Forward-Looking Statements This presentation contains forward-looking statements as that term is defined in Section
Our Transformation Continues Sidoti NDR May 29-30, 2018
 Our Transformation Continues Sidoti NDR May 29-30, 2018 Disclosure Regarding Forward-Looking Statements Forward-Looking Statements and Factors That May Affect Future Results: Throughout this presentation,
Second Quarter 2017 Earnings Conference Call
 Second Quarter 2017 Earnings Conference Call July 28, 2017 NYSE: TEN Agenda Second Quarter Highlights Segment Results and Financial Overview Outlook and Strategic Priorities Brian Kesseler Chief Executive
MANAGEMENT DISCUSSION AND ANALYSIS OF OPERATING RESULTS AND FINANCIAL POSITION. For the three and six months ended June 30, 2018
 MANAGEMENT DISCUSSION AND ANALYSIS OF OPERATING RESULTS AND FINANCIAL POSITION For the three and six months ended The following management discussion and analysis ( MD&A ) was prepared as of August 8,
MARTINREA INTERNATIONAL INC. Martinrea International Inc. Reports Record First Quarter Results, New Product Awards and Announces Increased Dividend
 MARTINREA INTERNATIONAL INC. Martinrea International Inc. Reports Record First Quarter Results, New Product Awards and Announces Increased Dividend PRESS RELEASE May 3, 2018 For Immediate Distribution
Our Transformation Continues. March 21, 2018
 Our Transformation Continues March 21, 2018 Disclosure Regarding Forward-Looking Statements Forward-Looking Statements and Factors That May Affect Future Results: Throughout this presentation, we make
Third Quarter 2017 Earnings Conference Call
 Third Quarter 2017 Earnings Conference Call October 27, 2017 NYSE: TEN Agenda Third Quarter Highlights Segment Results and Financial Overview Outlook and Strategic Priorities Brian Kesseler Chief Executive
Auto Conference. August 8, Jonathan Collins Executive Vice President & Chief Financial Officer. June 22, Dana
 J.P. TM4 Morgan Acquisition Auto Conference August 8, 2017 Jonathan Collins Executive Vice President & Chief Financial Officer June 22, 2018 Dana 2018 1 Safe Harbor Statement Certain statements and projections
/// INVESTOR PRESENTATION. July 2018
 /// INVESTOR PRESENTATION July 2018 /// FORWARD-LOOKING STATEMENTS Statements contained in this presentation, which are not historical facts, are forward-looking statements as that item is defined in the
Annual Meeting of Stockholders
 Annual Meeting of Stockholders Lake Forest, IL May 16, 2018 NYSE: TEN 2 Safe Harbor Forward-Looking Statements This communication contains forward-looking statements. These forward-looking statements include,
CAGNY Conference 2018
 CAGNY Conference 2018 Forward-Looking Statements Certain statements in this presentation, other than statements of historical fact, including estimates, projections, statements related to our business
Third Quarter 2018 Earnings Call. October 25, 2018
 Third Quarter 2018 Earnings Call October 25, 2018 Forward-looking statements Certain statements contained in this presentation may constitute forward-looking statements within the meaning of the Private
CREATING A CHAMPION. May International is a registered trademark of, Inc. NYSE: NAV1
 CREATING A CHAMPION May 2017 International is a registered trademark of, Inc. NYSE: NAV1 Safe Harbor Statement and Other Cautionary Notes Information provided and statements contained in this presentation
FY 2017 FOURTH QUARTER EARNINGS. Adient s Q4 results solidify a strong FY17; positive momentum reflected in FY18 outlook $389M $344M $3,979M $3.
 FY 2017 FOURTH QUARTER EARNINGS Adient s Q4 results solidify a strong FY17; positive momentum reflected in FY18 outlook > > Q4 GAAP net income and EPS diluted increased to $344M and $3.67, respectively;
Nemak reports 3Q17 results
 Nemak reports 3Q17 results - Quarterly revenues and EBITDA of US$1.1 billion and US$153 million - Won new contracts worth US$570 million in annual revenues Monterrey, Mexico. October 16, 2017. - Nemak,
FY 2019 First Quarter Earnings Call
 FY 2019 First Quarter Earnings Call February 7, 2019 Improving the experience of a world in motion Important information Adient has made statements in this document that are forward-looking and, therefore,
Esterline Explained. Third Quarter, Fiscal 2014
 Esterline Explained Third Quarter, Fiscal 2014 This presentation may contain "forward-looking statements" within the meaning of the Private Securities Litigation Reform Act of 1995. These statements relate
Q EARNINGS PRESENTATION
 Q4 2016 EARNINGS PRESENTATION December 20, 2016 International is a registered trademark of, Inc. 1 Safe Harbor Statement and Other Cautionary Notes Information provided and statements contained in this
Delphi Automotive PLC (Exact name of registrant as specified in its charter)
") UNITED STATES SECURITIES AND EXCHANGE COMMISSION Washington, D.C. 20549 FORM 8-K CURRENT REPORT Pursuant to Section 13 or 15(d) of the Securities Exchange Act of 1934 Date of Report (Date of earliest event
UNITED STATES SECURITIES AND EXCHANGE COMMISSION Washington, D.C. 20549 FORM 8-K CURRENT REPORT Pursuant to Section 13 or 15(d) of the Securities Exchange Act of 1934 Date of Report (Date of earliest event
Deutsche Bank Annual Global High Yield Conference
 Deutsche Bank Annual Global High Yield Conference September 29, 2005 Scottsdale, AZ Joseph S. Cantie Executive Vice President and Chief Financial Officer Safe Harbor Statement This material contains statements
BANK OF AMERICA MERRILL LYNCH 2017 LEVERAGED FINANCE CONFERENCE
 THE NEW NAVISTAR November 29, 2017 BANK OF AMERICA MERRILL LYNCH 2017 LEVERAGED FINANCE CONFERENCE International is a registered trademark of, Inc. NYSE: NAV1 Safe Harbor Statement and Other Cautionary
Q Investors Presentation
 Q2 2017 Investors Presentation Forward Looking Statements and Non-GAAP Measures This presentation contains information about management's view of the Company's future expectations, plans and prospects
SHILOH INDUSTRIES REPORTS FOURTH-QUARTER and FULL-YEAR FISCAL 2017 RESULTS FULL-YEAR GROSS MARGIN EXPANSION OF 200 BASIS POINTS
 SHILOH INDUSTRIES REPORTS FOURTH-QUARTER and FULL-YEAR FISCAL 2017 RESULTS FULL-YEAR GROSS MARGIN EXPANSION OF 200 BASIS POINTS VALLEY CITY, Ohio, January 5, 2018 (GLOBE NEWSWIRE) - Shiloh Industries,
FORD UNIVERSITY. July 15, 2016
 FORD UNIVERSITY July 15, 2016 Agenda Ford Changes in Sector and Segment Reporting Use of Non-GAAP Financial Measures Variance Analysis Cash Flow and Working Capital Changes Warranty Reserves Ford Credit
Forward Looking Statement
 as of 2/26/2015 Forward Looking Statement Statements and information included in this presentation that are not purely historical are forward-looking statements within the meaning of the Private Securities
Feb 2012 / Investor Meet Systech Sector
 Mahindra Forgings Feb 2012 / Investor Meet Mahindra Forgings : Structure Holding structure created to enable global strategy 1 M&M MFL SCHONEWEISS JECO STOKES M&M: 47.1% Others: 52.9% M&M: 100.0% M&M:
Investor Presentation. April 2018
 Investor Presentation April 2018 Safe Harbor Statement Forward-Looking Statements This presentation contains forward-looking statements within the meaning of the Private Securities Litigation Reform Act
Visteon Corporation. Frankfurt Auto Show UBS Investor Conference. September 2011
 Visteon Corporation Frankfurt Auto Show UBS Investor Conference September 2011 Visteon Overview Leading global automotive supplier of climate, interiors, electronics and lighting products Global manufacturing
UNITED STATES SECURITIES AND EXCHANGE COMMISSION WASHINGTON, DC FORM 8-K
 UNITED STATES SECURITIES AND EXCHANGE COMMISSION WASHINGTON, DC 20549 FORM 8-K CURRENT REPORT PURSUANT TO SECTION 13 OR 15(D) OF THE SECURITIES EXCHANGE ACT OF 1934 Date of report (Date of earliest event
Deutsche Bank Global Automotive Conference. Ford Motor Company January 16, 2018
 Deutsche Bank Global Automotive Conference Ford Motor Company January 16, 2018 Important Notice Regarding This Presentation This presentation includes our preliminary view of 2017 results. Our actual results
FY 2017 SECOND QUARTER EARNINGS. Adient delivers strong Q2 results; increases full year earnings expectations $286M $192M $2.04 $4,212M $235M 7.
 FY 2017 SECOND QUARTER EARNINGS Adient delivers strong Q2 results; increases full year earnings expectations > > GAAP net income and EPS diluted increased to $192M and $2.04, respectively; adjusted-eps
2016 INVESTOR MEETINGS FIRST QUARTER 2016 WHIRLPOOL CORPORATION
 2016 INVESTOR MEETINGS FIRST QUARTER 0 FIRST-QUARTER INVESTOR MEETINGS WHIRLPOOL CORPORATION ADDITIONAL INFORMATION This Presentation contains forward-looking statements about Whirlpool Corporation and
August 8, Second Quarter 2018 Results
 August 8, 2018 Second Quarter 2018 Results Forward-looking statements This presentation, as well as other statements made by Delphi Technologies PLC (the Company ), contains forward-looking statements
Eaton Corporation A Premier Diversified Industrial
 Eaton Corporation A Premier Diversified Industrial Citigroup s 19 th Annual Global Industrial Manufacturing Conference March 7, 2006 2006 Eaton Corporation. All rights reserved. Forward Looking Statements
Driving Value Through Culture, Innovation and Results. ROTH CAPITAL PARTNERS GROWTH STOCK CONFERENCE March 12, 2018
 Driving Value Through Culture, Innovation and Results ROTH CAPITAL PARTNERS GROWTH STOCK CONFERENCE March 12, 2018 Forward-Looking Statements This presentation includes forward-looking statements within
2006 Credit Suisse Conference
 2006 Credit Suisse Conference September 7, 2006 Our Three-Year Plan Restructure Improve Base Operations Grow the Business Action underperforming and non-strategic facilities Achieve competitive cost sourcing
21st Annual Needham Growth Conference. January 16, 2019
 21st Annual Needham Growth Conference January 16, 2019 1 Safe Harbor Statements made during this presentation that are forward-looking statements are based on current expectations and assumptions that
MANAGEMENT DISCUSSION AND ANALYSIS OF OPERATING RESULTS AND FINANCIAL POSITION. For the three months ended March 31, 2018
 MANAGEMENT DISCUSSION AND ANALYSIS OF OPERATING RESULTS AND FINANCIAL POSITION For the three months ended The following management discussion and analysis ( MD&A ) was prepared as of May 3, 2018 and should
First Quarter 2018 Earnings Call. April 26, 2018
 First Quarter 2018 Earnings Call April 26, 2018 Forward-looking statements Certain statements contained in this presentation may constitute forward-looking statements within the meaning of the Private
New Flyer Industries (NFI) acquisition of Motor Coach Industries (MCI)
 acquisition of Motor Coach Industries (MCI)") 0 New Flyer Industries (NFI) acquisition of Motor Coach Industries (MCI) + North America s leading Transit Bus Manufacturer and Parts Supplier North America s leading Motor Coach Manufacturer and Parts
0 New Flyer Industries (NFI) acquisition of Motor Coach Industries (MCI) + North America s leading Transit Bus Manufacturer and Parts Supplier North America s leading Motor Coach Manufacturer and Parts
2018 Investor Presentation
 2018 Investor Presentation TimkenSteel: At a glance Overview Headquartered in Canton, Ohio Annual melt capacity of ~2m tons Only focused North American SBQ producer Widest size range of SBQ bar capability
PSA & Opel / Vauxhall Alliance: Driving Towards A Better Future
 PSA & Opel / Vauxhall Alliance: Driving Towards A Better Future A Game-Changing Alliance for PSA & Opel / Vauxhall Leading European OEM: #1 / #2 Positions Across Key Markets Complementary Brands Drive
Raymond James 37 th Annual Institutional Investors Conference. March 8, 2016
 Raymond James 37 th Annual Institutional Investors Conference March 8, 2016 Forward-looking statements and Non-GAAP financial measures Forward-looking statements Certain statements included in this presentation,
A global industrial technology company focused on environmental, energy, fluid handling industries. Integrated Clean Air Solutions for Industry
 A global industrial technology company focused on environmental, energy, fluid handling industries 1 NOTES TO INVESTORS Forward-Looking Statements and Non-GAAP Information Any statements contained in this
TI Fluid Systems plc Half Year Results Presentation for TI Fluid Systems plc. 8 August 2018
 2018 Half Year Results Presentation for 8 August 2018 Disclaimer This presentation contains certain forward-looking statements with respect to the financial condition, results of operations and business
Revenue Growth Drives Continued 2018 Momentum Revenue Growth of over 75% versus Prior Year Second Quarter
 Plug Power is changing the way the world moves by developing industry-leading hydrogen fuel cell energy solutions for high growth markets around the globe. Revenue Growth Drives Continued 2018 Momentum
BANK OF AMERICA MERRILL LYNCH CONSUMER & RETAIL CONFERENCE. March 4, 2015
 2015 BANK OF AMERICA MERRILL LYNCH CONSUMER & RETAIL CONFERENCE March 4, 2015 Whirlpool Corporation Additional Information This document contains forward-looking statements about Whirlpool Corporation
Second Quarter 2018 Earnings Call. July 24, 2018
 Second Quarter 2018 Earnings Call July 24, 2018 Forward-looking statements Certain statements contained in this presentation may constitute forward-looking statements within the meaning of the Private
American Axle & Manufacturing Holdings, Inc.
 The information in this prospectus supplement is not complete and may be changed. This prospectus supplement and the accompanying prospectus are not an offer to sell these securities and we are not soliciting
Copyright 2018 CPI Card Group. Fourth Quarter & FY 2017 Earnings Conference Call March 12, 2018
 Fourth Quarter & FY 2017 Earnings Conference Call March 12, 2018 Safe Harbor Forward-Looking Statements Statements in this presentation that are not statements of historical fact are forward-looking statements
February 21, Fourth Quarter 2018 Results
 February 21, 2019 Fourth Quarter 2018 Results Forward-looking statements This presentation, as well as other statements made by Delphi Technologies PLC (the Company ), contains forward-looking statements
TopBuild Reports Strong Second Quarter 2018 Results
 NYSE:BLD The leading purchaser, installer and distributor of insulation products to the U.S. construction industry TopBuild Reports Strong Second Quarter 2018 Results Net Sales Increased 27.7% $0.76 Income
November 2, Third Quarter 2017 Earnings Call
 November 2, 2017 Third Quarter 2017 Earnings Call Forward-looking Statements This presentation, as well as other statements made by Delphi Automotive PLC (the Company ), contain forward-looking statements
SUPERIOR INDUSTRIES INTERNATIONAL, INC. Deutsche Bank Global Auto Industry Conference. January 17, 2018
 SUPERIOR INDUSTRIES INTERNATIONAL, INC. Deutsche Bank Global Auto Industry Conference January 17, 2018 Non-GAAP Financial Measures and Forward-Looking Statements Forward-Looking Statements This presentation
Second quarter results FY2016. May 13, 2016
 Second quarter results FY2016 May 13, 2016 Disclaimer Stabilus S.A. (the Company, later Stabilus ) has prepared this presentation solely for your information. It should not be treated as giving investment
FY 2018 Second Quarter Earnings Call
 FY 2018 Second Quarter Earnings Call May 3, 2018 Improving the experience of a world in motion Important information Adient has made statements in this document that are forward-looking and, therefore,
Nasdaq: DAIO. Joel Hatlen. Chief Operating & Financial Officer. Data I/O Corporation September 2017 Investor Presentation
 Nasdaq: DAIO Joel Hatlen Chief Operating & Financial Officer Data I/O Corporation September 2017 Investor Presentation Safe Harbor The matters that we discuss today will include forward-looking statements
H1019-JPMorgan-2/09 1
 H1019-JPMorgan-2/09 1 1 Forward-Looking Statements Certain statements contained in this presentation are forward-looking statements within the meaning of the Private Securities Litigation Reform Act of
Nasdaq: DAIO. Data I/O Corporation January 2018 Investor Presentation
 Nasdaq: DAIO Data I/O Corporation January 2018 Investor Presentation Safe Harbor The matters that we discuss today will include forward-looking statements that involve risks factors that could cause Data
FY 2019 FIRST QUARTER EARNINGS. Adient reports first quarter 2019 financial results
 FY 2019 FIRST QUARTER EARNINGS Adient reports first quarter 2019 financial results > > Q1 GAAP net loss and EPS diluted of $(17)M and $(0.18) respectively; Q1 Adjusted-EPS diluted of $0.31 > > Adjusted-EBIT
Q215 Earnings Call. August 5, Silver Spring Networks. All rights reserved.
 Earnings Call August 5, 2015 Forward-Looking Statements This document contains forward-looking statements that involve risks and uncertainties. These forwardlooking statements include statements regarding
Investor Presentation June 18, 2014 TE CONNECTIVITY ACQUIRES MEASUREMENT SPECIALTIES
 Investor Presentation June 18, 2014 TE CONNECTIVITY ACQUIRES MEASUREMENT SPECIALTIES Forward-Looking Statements Forward Looking Statements This presentation contains certain forward-looking statements
Quarterly Update FY16 Fourth Quarter. November 8, 2016
 Quarterly Update FY16 Fourth Quarter November 8, 2016 Johnson Controls International plc Cautionary Statement Regarding Forward-Looking Statements Johnson Controls International plc has made statements
Fourth Quarter 2015 Earnings Call
 Fourth Quarter 2015 Earnings Call February 25, 2016 Rob Wagman President & Chief Executive Officer Nick Zarcone Executive Vice President & Chief Financial Officer Joe Boutross Director, Investor Relations