Task Force Report on Mortality Improvement
|
|
|
- Amos Hill
- 5 years ago
- Views:
Transcription

1 Final Report Task Force Report on Mortality Improvement September 2017 Document Ce document est disponible en français 2017 Canadian Institute of Actuaries
2 MEMORANDUM To: From: All Fellows, Affiliates, Associates, and Correspondents of the Canadian Institute of Actuaries and other interested parties Faisal Siddiqi, Chair Practice Council Alexis Gerbeau, Chair Task Force on Mortality Improvement Date: September 20, 2017 Subject: Task Force Report on Mortality Improvement (Final) The Task Force on Mortality Improvement has prepared this final report. The draft version of the report was published on April 28, An initial communication was published on May 2, The task force received comments on six different issues following the publication of the draft report. A summary of the comments and the task force s responses is provided below. Comments on the Draft Report and Responses 1. Consider a broader range of viewpoints when setting the long-term improvement rate. Comment: The ultimate mortality improvement rate is a critical component of any mortality improvement scale. We acknowledge that the selection of the ultimate rate is one of the more subjective aspects of setting mortality improvement assumptions. It is difficult to set this assumption because many factors, each of which is inherently uncertain, can affect it. We believe it would be beneficial to consider a broader range of viewpoints when setting the ultimate rate. Response: The task force agrees that it is desirable to consider a broad range of viewpoints. The report now includes a reference to a survey of pension actuaries in the UK that had been considered in our discussion, but not included in the draft version of the report. Overall, the task force believes that a broad range of opinion has been considered in our work. 2. Consider a forward-looking approach. Comment: In addition to analyzing historical trends, we believe that the task force would benefit from using a forward-looking approach to set expectations about future mortality improvement for the Canadian population. Powerful tools exist that split future improvements into key categories and allow users to form a view from the ground up on the contribution of each. We urge the task force to consider the emerging best practice of projecting the contribution of each of the drivers of future mortality improvement Albert, Ottawa, ON K1R 7X head.office@cia-ica.ca / siege.social@cia-ica.ca cia-ica.ca
3 Response: Performing forward-looking analysis was not in the scope of our mandate, given the timeline of our work and the tools available to the task force. In the final version of the report, we have identified the application of forward-looking techniques to mortality improvement as a potential area of further research for the CIA. 3. The specific purpose of the report is not clear. Comment: The report states that We recommend that Canadian actuaries consider the selection of MI-2017 for use in actuarial work in Canada. Later, in Section 7 (Recommendation), the report states The mortality improvement scale recommended by the task force [TF] is called CIA MI-2017 (or simply MI-2017). We are concerned that these TF recommendations are broad and do not consider any specific recommended purpose. Response: Although one of the stated objectives of the task force was to contribute to narrowing the range of mortality improvement assumptions used across different actuarial practices, it is the role of the applicable practice committees to provide guidance on the selection of assumptions for practice-specific work. The report is a research paper, and as such does not represent a binding requirement to any actuary. It is expected that applicable practice committees will consider issuing updated guidance to reflect the work of the task force. 4. Clarify the use of prescribed tables for the pension practice. Comment: The report states that Although the mortality improvement scale for Canadian pension plan valuation is not prescribed by the Standards of Practice. We observe that this statement is not entirely true, as for solvency and hypothetical wind-up pension valuations, both the mortality table and mortality improvement scales for certain liabilities are effectively prescribed. Further, for going concern valuations, some provincial regulators have strong expectations about what mortality assumptions should be used. Response: We agree with this comment and this has been clarified in the final version of the report. 5. Provide comments for the difference in life expectancies between CPM-B and MI Comment: The change in life expectancy, as shown in Section 7.2, resulting from moving from CPM-B to MI-2017 is somewhat problematic. It is a relatively large change given the relatively short period since CPM-B was published in There is no apparent explanation to support this change. As you know, assumptions in respect of future mortality improvement rates are subject to a high level of uncertainty and debate. Given this debate, it is not clear why the recommended assumption should be materially changed in such a short period of time. What is the cause? A difference in methodology, or data set, or other reasons? In light of the widespread adoption of CPM-B, some sort of reconciliation between the two is strongly warranted if there is an expectation that MI-2017 is to replace CPM-B. Therefore, we suggest providing further explanations to help address these potential inconsistencies. 2
4 Response: The task force added comments in the final version of the report to explain the difference in life expectancies between CPM-B and MI The main driver is the ultimate mortality improvement rates. 6. The cohort effect should be more reflected. Comment: We have received three comments to the effect that the cohort effect was not sufficiently reflected in our work. Response: The task force agrees that there is an indication of a cohort effect in the historical data, particularly for males, although there is some indication of the cohort effect dissipating. The task force believes that the cohort effect is sufficiently recognized and that the convergence to no cohort effect in the ultimate rates is appropriate. Some comments were added to clarify the task force s intention. Although the interpolation between 2013 and 2033 (or earlier) is along attained age, the cohort effect is not absent because the slope of the improvement rates for is maintained. That slope is more positive at the leading edge of a positive cohort effect (such as births in the 1930) and more negative at the trailing edge. The opposite is true for a negative cohort effect (such as births in the 1950). If you have any questions or comments regarding this report, please contact Alexis Gerbeau, Chair, at Alexis_Gerbeau@manulife.com. FS, AG 3
5 Table of Contents 1 Executive Summary Background Objectives Data Analysis General Approach Model for Mortality Improvement Rates Assumptions for Mortality Improvement Rates Materiality Considerations Extension of the HMD Data Using the OAS Data Initial Rates Graduation Issues Graduation Technique Initial Rates Ultimate Rates Overview What Does History Tell us about Past Mortality Improvements? What Can We Learn from Other Experts and Organizations? Recommended Ultimate Mortality Improvement Rates Convergence Period and Method Convergence Period Convergence Method Segments of the General Population Recommendation Scales Initial and Ultimate Improvement Rates Transition between Initial and Ultimate Rates
6 7.2 Annuity Factors and Life Expectancy Heat Maps Comparison with Other Scales Appendix Extension of the Data to 2015 using OAS Data Choice of Method and Parameters in Construction Definition of Metric for Stability Definition of Metric for Fit Definition of Metric for Predictiveness Definition of Metric for Smoothness Bibliography
7 1 Executive Summary The report has been prepared by the Canadian Institute of Actuaries (CIA) Task Force on Mortality Improvement and provides an analysis of the rate of mortality improvement for the Canadian population and the construction of a mortality projection scale for the purpose of reflecting future mortality improvement in Canadian actuarial work. The results presented in this report are based in part on an examination of the historical rates of mortality improvement up to 2011 in the general Canadian population data recorded in the Human Mortality Database (HMD), supplemented by additional data for the Canadian Old Age Security (OAS) program plan up to This analysis included the application of standard actuarial techniques for graduating volatile historical improvement rates to identify underlying trends. In addition, the task force also reviewed commonly used techniques for building future mortality improvement scales that combine historical experience with expert opinion on the prospects for future improvement in population mortality rates. A two-dimensional mortality improvement scale, MI-2017, is presented in this report. This scale was derived by assuming that observed historical mortality improvement rates will transition smoothly to an assumed ultimate mortality improvement rate, with the transition occurring over a year period varying by age. The ultimate rate is assumed to be 1 percent for ages up to 90. The 1 percent assumption is close to the long term historical average of mortality improvement in Canada from 1921 to It is also in the middle of the range of expert opinions of 0.8 percent to 1.2 percent. A sample of the mortality improvement rates under MI-2017 are as follows: Age\ Male Female Year % 1.75% 1.12% 1.00% 1.00% 1.29% 1.18% 1.03% 1.00% 1.00% % 1.80% 1.39% 1.05% 1.00% 1.41% 1.31% 1.15% 1.02% 1.00% % 1.69% 1.34% 1.10% 1.00% 1.78% 1.58% 1.32% 1.10% 1.00% % 1.76% 1.36% 1.09% 1.00% 1.67% 1.33% 1.12% 1.03% 1.00% % 1.57% 1.29% 1.08% 1.00% 1.39% 1.04% 0.94% 0.96% 1.00% We recommend that Canadian actuaries consider the selection of MI-2017 for use in actuarial work in Canada. It might be appropriate for Canadian actuaries to make adjustments to mortality improvement assumptions recommended by this task force to reflect the nature of their work. This report does not provide alternative assumptions for different segments of the population. The task force view is that it may be appropriate for the actuary to establish mortality improvement assumptions that vary by segments of the population when there is evidence of differences in recently observed data. The task force believes that the mortality improvement scale presented in this report, and based on the general population, would be in a reasonable range for most actuarial applications in Canada. 6
8 Notwithstanding the above recommendation, the task force recognizes that the selection of a mortality improvement assumption is inherently subjective, particularly with respect to the ultimate improvement scale. Furthermore, short-term mortality improvement rates are volatile, and emerging experience should be regularly monitored. 2 Background Mortality improvement assumptions are used by actuaries across all areas of practice. Historically, each practice area has developed its own guidance with respect to mortality improvement.in February 2014, the Pension Experience Subcommittee of the Research Committee published a report on Canadian pensioners mortality, including a mortality improvement scale (CPM-B) developed based on the Canada Pension Plan (CPP)/ Québec Pension Plan (QPP) experience ending in For the purpose of determining lump sum commuted values payable to eligible pension plan participants, the mortality assumption is prescribed in the Standards of Practice and the Actuarial Standards Board (ASB) has promulgated the use of the CPM-B improvement scale for this purpose effective October 1, Although the mortality improvement scale for Canadian pension plan going-concern valuation is not prescribed by the Standards of Practice, the CPM-B scale is commonly used for this purpose by Canadian actuaries, is supported by the CIA Committee on Pension Plan Financial Reporting s (PPFRC) March 2014 Educational Note on the Selection of Mortality Assumptions for Pension Plan Actuarial Valuations (Canadian Institute of Actuaries, 2014), and some provincial regulators have strong expectations about the use of CPM-B in funding valuations. Furthermore, in solvency and wind-up valuations CPM-B is prescribed for benefits assumed to be settled via commuted value payment and is the mortality basis used in the annuity proxy published by the PPFRC to help pension actuaries estimate the cost of settling benefits via annuity purchase (although it is important to note that the annuity proxy itself is based on annuity quotes provided to the PPFRC by insurance companies and hence already implicitly reflects the underlying longevity assumptions used by insurance actuaries for pricing annuities). In July 2011, the ASB promulgated prescribed mortality improvement rates (Canadian Institute of Actuaries, 2011) referenced in the Standards of Practice for the valuation of insurance contract liabilities. A research paper (Canadian Institute of Actuaries, 2010) released in September 2010 provided the rationale for the promulgation. These prescribed mortality improvement rates were developed based on the general population experience ending in As almost 15 years of additional data is now available, the Life MI Margins and Aggregation Subcommittee of the Committee on Life Insurance Financial Reporting (CLIFR), was created in 2014 to update the prescribed mortality improvement rates. In the course of 2014, several members of the actuarial community suggested that a common guidance for mortality improvement be developed for all practice areas, as it is 1 The ASB promulgation permits the temporary use of a simplifying approximation to the CPM-B scale to ease the transition to a two dimensional mortality improvement scale. 7
9 generally accepted that the mortality improvement experienced by different segments of the population is correlated. An example where the correlation would be very high is between pensioners and group annuitants; both groups coming from the same segment of the population. The Research Committee therefore established a Task Force on Mortality Improvement, composed of representatives of the different practice areas, with the mandate of developing a common view on mortality improvement. The outcome of this task force could then be used by the various practice areas to develop consistent guidance. Consistent guidance will better serve the public interest by avoiding divergent advice from actuaries in different practice areas. We also believe that combining the knowledge of actuaries across all practice areas has contributed to a better outcome. Mortality improvement rates cannot be predicted with certainty, as they are driven by numerous drivers which are themselves difficult to predict. Because of this, there is a wide range of opinion about future magnitude, and even direction, of mortality improvement. Examples of drivers include lifestyle changes, medical advances, and access to medical care. The task force has used the most recent information available and considered a large range of expert opinions to come up with one recommendation for mortality improvement rates. However, we must acknowledge that the actual future improvement may be very different from that recommended. We believe that the recommendation of the task force is balanced; it is not at either extreme of the range of opinions. We believe that the Research Executive Committee should consider further research to analyze and develop forward-looking approaches to mortality improvement modelling. 3 Objectives The objectives of the task force were to do the following: Include appropriate representation from relevant practice areas; Develop a best estimate assumption for the mortality improvement rates for the general Canadian population; Determine whether the best estimate assumption for the general population needs to be modified for different segments of the population; Leverage the work done by the UK actuarial association (Institute and Faculty of Actuaries) and the Society of Actuaries (SOA) where appropriate; and Educate members. The appropriate level of conservatism (margin for adverse deviations), which is specific to each practice area, was out of the scope of our mandate. Modelling mortality improvement rates is complex. The models for projecting mortality improvement rates have evolved greatly over the last decade and have become increasingly sophisticated. Given its timeline, the objective of the task force was not to develop a new revolutionary model, but to make the best use of modelling tools currently available. 8
10 4 Data To develop a best estimate assumption for the mortality improvement rates for the general Canadian population, the task force naturally selected Canadian population mortality data. The primary source of general population mortality improvement data for Canada is Statistics Canada, which is required by law to provide statistics for the whole of Canada and each of its provinces. Statistics Canada provides national data relating to the Canadian population, resources, economy, society, and culture, including the Canada life tables. The life tables are available for experience years 1990 through 2011 on a periodic basis. Splits of population mortality results are available by age, gender, race, and cause of death. CANSIM is an electronic database service provided by Statistics Canada that is updated daily for new information. Another source for Canadian population data is the Human Mortality Database (HMD) which includes mortality data for Canada covering the entire period from 1921 through Data to 2013 are expected to become available later in Data are available by attained age and gender. The HMD is a database created by the Department of Demography at the University of Montréal in collaboration with the Max Planck Institute for Demographic Research in Rostock and the Department of Demography of the University of California at Berkeley, and is based on Canadian vital statistics prepared by Statistics Canada. HMD is an international database which currently holds detailed data for 37 countries or regions 2. Statistics Canada and HMD present similar but not totally identical data. For example, Statistics Canada presents data for ages 0 to 99 by single year and then for the open interval 100+, while HMD presents data for ages 0 to 109 and then the age group The task force was also able to obtain, on a confidential basis, total deaths and exposure data for OAS for 2005 year-end to 2015 year-end by individual ages for and for ages 95 and up combined. The OAS and HMD populations have considerable overlap for years and ages where they are both available. Because the exposures for OAS come from administrative data rather than census data, as used by HMD, OAS mortality rates are expected to be more reliable. OAS has fewer lives exposed at its younger end but a similar number at the older end. OAS mortality rates are higher at younger ages, but similar at older ages. The task force decided to use both the HMD and OAS data. HMD data are easily accessible, consistent over long periods of time, and consistent for comparison across regions. OAS data allowed the task force to use more recent data. 2 Details on the HMD methodology is provided on the HMD website 9
11 5 Analysis 5.1 General Approach The task force considered mortality improvement rates using the general approach summarized below. The task force believes this approach is appropriate for the purpose of this report. To be clear on how we define the improvement scale, if q(x,y) is the mortality rate for age x in year y, and f(x,y) is the improvement rate for age x in year y, then future mortality rates may be developed recursively from the improvement scale as follows. q(x, y + 1) = q(x, y)(1 f(x, y + 1)) Although past trends in mortality improvement are instructive, the task force does not believe that recent past trends should be assumed to continue indefinitely into the future. In this report, mortality improvement rates are developed under the following conceptual framework: Past mortality data are graduated to determine initial mortality improvement. These rates vary by gender, age, and year. Ultimate mortality improvement rates are established. These rates vary by age only. Mortality improvement rates are assumed to transition smoothly from the initial mortality improvement rates to the ultimate mortality improvement rates over an assumed convergence period Model for Mortality Improvement Rates The characteristics and components of the model are as follows: Mortality improvement rates are two-dimensional, varying by age and year. Observed past rates of mortality improvement are smoothed using standard actuarial graduation techniques. o For data in the most recent years to be smoothed, the last year of the smoothed rates precedes the final year of data available (i.e., there is a step-back in the historical mortality improvement rates compared to the final year of available data). Mortality improvement rates are interpolated between the graduated recent past experience (initial rates) and the assumed ultimate mortality improvement rates by fitting a curve between the recent trend and the ultimate rates. The details of the model (i.e., graduation methodology, step-back, and the specific formulas for interpolation) are set out in the rest of this section. 10
12 5.1.2 Assumptions for Mortality Improvement Rates The assumptions used in the model to derive mortality improvement rates are as follows: The ultimate mortality improvement rates are themselves an assumption. As noted above, ultimate expected mortality improvement trends are largely judgmental. A substantial body of literature on the topic is available. The length of time until the assumed ultimate mortality improvement rates are attained is also subject to judgment. This convergence period is an assumption in the model. Mortality improvement trends have been observed by age (i.e., horizontal trends in mortality tables organized by age and year) and by year of birth (i.e., diagonal trends in mortality tables organized by age and year, also known as cohort trends). The extent to which horizontal and diagonal trends are assumed to continue in the future is an assumption in the model. Information on how the ultimate mortality improvement rates for this report were selected is available in section 5.5. Information on convergence period, and horizontal vs. diagonal trends appears in section 5.6. The general approach described above is commonly used to establish mortality improvement rates for actuarial purposes. In recent years, this overall approach has been used by several actuarial research entities: The UK actuarial profession s Continuous Mortality Investigation (CMI) research organization uses a similar approach to establish mortality improvement assumptions for UK actuarial work. Research committees for both the SOA and the CIA used a similar approach for the purpose of publishing mortality assumptions for pension plan valuation in the U.S. and Canada, respectively 3. The Office of the Chief Actuary uses a similar approach to project the mortality component of the population projections which are in turn used to project the long-term financial status of Canada s OAS Program and the CPP. As described above, the task force s mandate is to develop information that is relevant to all Canadian actuaries. Different areas of practice in the Canadian actuarial profession have different requirements with respect to the inclusion of margins for adverse deviations in actuarial assumptions. Accordingly, the mortality improvement rates determined in this report are intended to represent a best estimate assumption. Individual actuaries using this information in the preparation of actuarial work are responsible for establishing appropriate margins. 3 For more information, refer to the Society of Actuaries Retirement Plans Experience Committee website on mortality improvement scale MP-2014 and MP-2015, and the Canadian Institute of Actuaries 2014 paper (Canadian Institute of Actuaries, 2014) on Canadian pensioners mortality. 11
13 5.2 Materiality Considerations As discussed earlier, development of mortality improvement rates for each age and gender depends on several parameters: initial rates, ultimate rates, length of transition period, convergence method, as well as reflecting cohort effects. Materiality was one of the factors taken into account in the task force s decisions. Materiality was measured by the impacts of proposed mortality improvement scales on annuity factors as well as on life expectancies at certain ages. Note that the impacts on annuity factors are usually less than those on life expectancies due to the time value of money. Where impacts of the variation in parameters and/or methods were judged not to be material, the simpler approach was chosen. Reducing the complexity has the advantage of increasing transparency, minimizing the likelihood of errors, as well as improving the understanding of methodology by individuals who have limited knowledge in the development of mortality tables. Note that the task force s focus was mainly on pension and insurance products as well as on the valuations performed over the next decade or so. However, other programs, especially social security programs such as C/QPP and OAS, may have much longer projection horizons than the majority of pension and insurance products, and are mostly based on open group projection methodology. Moreover, the main emphasis in assessing the financial sustainability of these programs is put on non-discounted cash flows (time value of money is not taken into account). As a result, the considerations that were judged as immaterial by the task force in the context of its work may be material in the development of mortality improvement rates assumptions for these programs. Therefore, it might be appropriate for Canadian social security actuaries to make adjustments to mortality improvement assumptions recommended by this task force to reflect the nature of their work. 5.3 Extension of the HMD Data Using the OAS Data HMD data are available only as far as 2011 at this time. The task force was provided with OAS data on a confidential basis. Those data are summarized by sex, by year for , and by age for 65 94, and for 95+. The OAS data were used to extend the HMD data to 2015 for all ages. The extension is only approximate for ages under 65, but it can be considered an improvement in quality for at least ages The task force judged the extension to be desirable because of the length of the gap between the current year and the last year for HMD. A detailed description of the extension method is provided in section
14 5.4 Initial Rates Graduation Issues Typically, raw mortality improvement is a very volatile data set. The purpose of graduation is to smooth out the noise so that the assumed smooth underlying improvement rates can be observed. Current best practice is to graduate a two-dimensional data set (ages and calendar years) to determine mortality improvement rates. There are a number of techniques that work well in two dimensions. Many actuaries will be familiar with Whittaker-Henderson graduation (WH) from their student days, although it is no longer on the SOA syllabus. In recent years, the CMI in the UK has popularized P-splines as a graduation method. WH is actually a special case of P-spline graduation. The two methods give very similar results when they have consistent parameters. The task force chose to use WH because it is better known among Canadian actuaries, efficient software is available, and task force members were more readily able to control the graduation. Although it is feasible to graduate the raw improvement rates, better results are obtained on most data sets by graduating mortality rates first and then calculating improvement rates from the smooth mortality rates. The task force decided to graduate the logarithms of the ratios of the raw mortality rates to the rates of a smooth base table (A/E ratio). The weights of the graduation are the expected deaths on the base table. The A/E ratios were chosen because it was not practical to graduate the mortality rates for newborns directly since mortality rates slope downward for the first several years of life. Because mortality improvement can be regarded as a multiplicative process, it is reasonable to work with the logarithm of the mortality rates or mortality ratios. The base table was developed from HMD data for , the last 10 years available. Ages 0 2 were taken as the raw mortality rates. The remaining rates were obtained from a WH graduation of the logarithm of the average rates with the average exposure as the weights. The WH parameters were 4 for order of difference and 500 for the smoothness factor. The smoothness factor was selected to be larger than normal for such a graduation because it is important to have a smooth base table; the twodimensional graduation will produce smooth A/E ratios, but the result will not be smooth if the base table is not itself smooth. The goodness of fit for the base table is less important because the two-dimensional graduation also gives attention to goodness of fit. Any graduation of a two-dimensional data set will have more reliable data in the middle of the data set, less reliable along the edges, and least reliable on the corners. That is because the graduated value for a particular point is influenced by all of its neighbours, but on the edges and at the corners there are fewer neighbours. Accordingly, it is good practice to drop off from the graduated values those that lie on the edges. This is referred to as a step-back to avoid edge effects. A step-back of two or three years is 13
15 typically necessary. It is not feasible to step back for the edge representing age zero; some lack of precision will have to be tolerated Graduation Technique WH minimizes the sums shown below. 2 m 2 n Wt( Grad Raw) + h ( Grad) + v ( Grad) The second term is the sum of squared m th finite difference taken in a horizontal direction (across years within each age in our case), and the third is the sum of squared n th finite difference taken in a vertical direction (along ages within each year in our case). There are four parameters that must be chosen for the graduation: the orders of difference m and n, and the balancing (or smoothing) factors, h and v. It is helpful, but not required, that the weights be scaled so that their sum is the number of numbers being graduated. (This is referred to as normalizing the weights.) Doing so simplifies the task of finding good values for h and v. The graduation uses the logarithm of A/E ratios for Raw and normalized expected deaths for Wt. The order of difference (m and n) is 2 is both cases, and the balancing factors (h and v) are both 300. The reasons for these choices are set out in section 8.2. Improvement rates are calculated directly from the graduated numbers: hor Imp(x, y) = 1 exp (grad(x, y) grad(x, y 1)) Initial mortality improvement rates were calculated covering calendar years 1968 to A step-back of two years was chosen. Therefore, the last year of historical improvement rates in the initial rates is 2013, and thus, the first year of projection will be Although improvement rates were calculated to age 100, the rates at the highest ages cannot be considered reliable because there is little data at the highest ages. Therefore, the step-back was set at five years for high ages. Improvement rates over age 95 are calculated by linear interpolation from the age 95 rate to zero at age 105 and higher. ver Initial Rates The initial rates for male and female are defined as the age-specific improvement rates covering calendar years 1970 to 2013 and resulting from the graduation described in the previous section. The year 2013 corresponds to the step-back of two, and year 2014 is the first year of projection. The following graphs show the resulting rates in 2013 (of MI-2017) in comparison to the 10-year average improvement rates and to other existing publicly available scales (the average is calculated by a linear regression of the logarithm of the raw mortality rates for at each age). 14
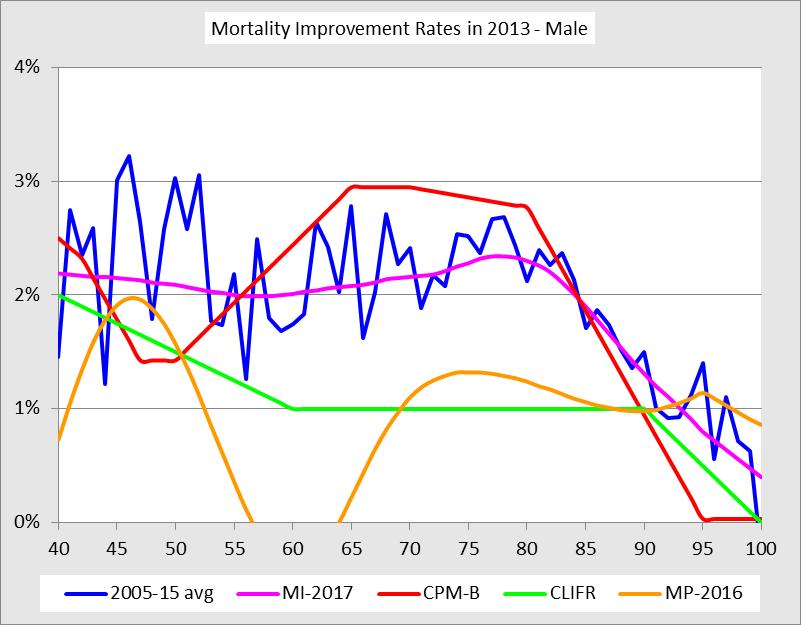
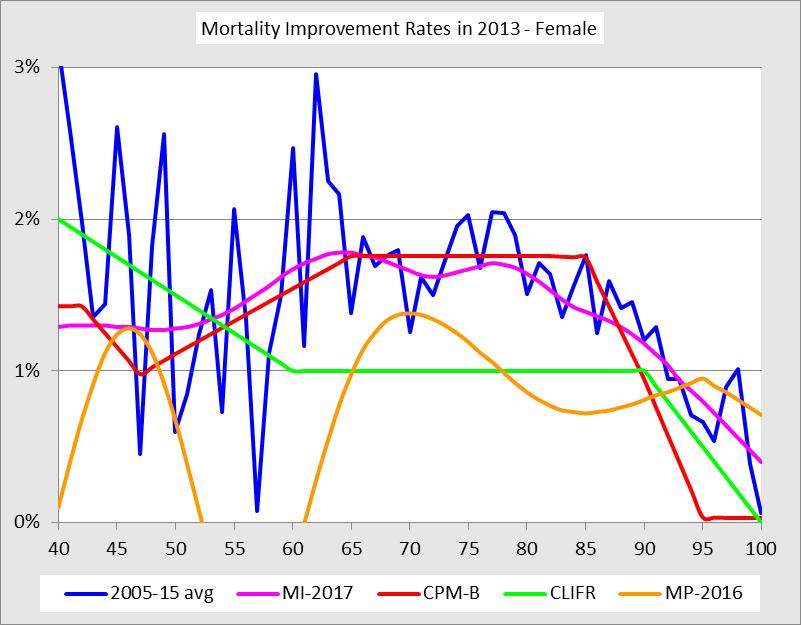
16 15
17 The fact that the MI-2017 initial rates for ages 60 to 90 are higher than the corresponding CLIFR rates is not surprising given that CLIFR rates are based on long-term historical averages in Canada. The differences with CPM-B rates are mostly explained by the use of most recent data in deriving MI Ultimate Rates Overview The ultimate mortality improvement rates are a critical assumption of MI-2017 (or any mortality improvement scale). The task force recognizes that the selection of the ultimate mortality improvement rate assumption is also one of the more judgmental and subjective aspects and is as much or more a look into the future as it is a look back. Many factors, each with their own uncertainties, can impact such a far-reaching assumption such as mortality improvement of the Canadian population. In looking back, mortality has steadily improved through a succession of medical breakthroughs, improved public health awareness, and the general increase in the standard of living in the developed world. There are a number of areas of medical research where huge investments are being made to conquer even more dread diseases. All of this represents the momentum of the past and often carries significant weight in the actuary s deliberations on mortality improvement. Looking forward is harder. Since the turn of the last century, developed nations have enjoyed an unprecedented period of prolonged economic growth and prosperity. Fueled by cheap energy (oil and natural gas), economies have grown steadily and broad segments of the population experienced steadily increasing standards of living, coupled with technological innovation that progressed at a breathtaking pace. The task force has considered both historical trends and a large range of opinions from experts, organisations and surveys when selecting an ultimate mortality rate improvement assumption of 1.0 percent for ages up to 90, 0.2 percent at age 100, and 0 percent at age 105. The ultimate rates between ages 90, 100, and 105 assumes a linear grading What Does History Tell us about Past Mortality Improvements? In order to help us better understand future mortality trends, the task force reviewed and analyzed the historical mortality improvement rates over a period of 1921 to 2011 in Canada using mortality from the HMD. The following table shows the long-term averages of Canadian males and females for different periods and age groups. 16
18 Age Group Last 90 years Last 50 years Last 20 years Male Female Both Male Female Both Male Female Both % 2.93% 2.18% 1.68% 1.73% 1.69% 2.57% 1.30% 2.18% % 1.64% 1.32% 2.08% 1.59% 1.90% 2.23% 1.56% 1.98% % 1.49% 1.12% 1.73% 1.53% 1.65% 2.75% 1.69% 2.34% % 1.25% 0.97% 1.19% 1.41% 1.30% 2.38% 1.69% 2.07% % 0.77% 0.65% 0.59% 0.88% 0.77% 1.12% 0.88% 0.97% % 0.32% 0.25% 0.20% 0.37% 0.33% 0.45% 0.21% 0.27% % 1.23% 1.03% 1.43% 1.23% 1.33% 2.14% 1.30% 1.74% % 1.17% 0.98% 1.42% 1.23% 1.33% 2.13% 1.30% 1.73% % 1.07% 0.88% 1.18% 1.15% 1.17% 2.09% 1.25% 1.67% % 0.71% 0.61% 0.56% 0.80% 0.71% 1.06% 0.77% 0.88% It is important to note that the historical mortality improvement rates for higher age bands shown in the table above are derived from fewer exposures than younger ages, and accordingly the credibility of the past experience is lower What Can We Learn from Other Experts and Organizations? In reviewing available results and surveys of the mortality projections produced by various organizations in Canada and around the world, the task force found that the most common range for the assumed ultimate mortality improvement rate assumption is around 0.8 percent to 1.2 percent. This range gave us a reference point to ensure that our view of future longevity is similar to other experts in the industry. The best estimate views regarding the ultimate rate of mortality improvement assumptions for Canada, the U.S., and the UK general population are presented in the table below. Note that one should exercise caution in comparing mortality improvement rates associated with different countries since these rates are usually developed by taking into account, among a variety of factors, the current mortality levels of the underlying population. 17
19 Age MI Statistics Canada (Males)¹ 2015 Statistics Canada (Females)¹ Assumed Ultimate Rate of Annual Mortality Improvement 27 th CPP Actuarial Report² 2016 U.S. Trustees Report U.S. Technical Panel 4 QPP Actuarial report as at 31/12/ UK ONS 6 Male Female 2017 UK KPMG s Pension Accounting Survey % 1.2% 1.0% 0.80% 0.5% 0.5% 1.01% % 0.9% 1.0% 0.80% 0.5% 0.5% % 1.3% 1.1% 0.80% 0.9% 1.1% 0.74% % 1.1% 1.0% 0.80% 1.3% 1.3% 1.00% % 0.6% 0.7% 0.80% 0.5% 0.5% % 0.1% 0.1% 0.45% 0.5% 0.5% 0.49% % 0.0% 0.1% 0.30% 0.2% 0.4% % 0.0% 0.0% 0.10% 0.2% 0.4% 1.20% 21% 8 use 1.00% 49% use 1.25% 25% use 1.50% 5% use 1.75%+ ¹ The 2015 Statistics Canada Population Projections for Canada medium assumption for the period 2031/2032 (Statistics Canada, 2015). ² The 27 th Actuarial Report on the Canada Pension Plan as at 31 December 2015 (Government of Canada, 2016). 3 The 2016 Trustees ultimate intermediate assumptions are for the period The 2015 Technical Panel ultimate assumptions are for the period The QPP mortality improvement rates are shown by decades. For ages over 50, mortality-to-incidence ratios (MIRs) in the decade are slightly higher than shown, and for the decade are slightly lower than shown (especially for males). 6 The 2014 Office for National Statistics in the UK principal projection assumptions are for the period KPMG s Pensions Accounting Survey 2017 for clients with UK defined benefit pension schemes. 8 Percentages refer to the proportion of respondents assuming a given improvement rate Recommended Ultimate Mortality Improvement Rates After considering both the historical mortality improvement trends and the expert opinions, the task force believes it is reasonable to assume an ultimate mortality improvement rate of 1 percent for ages up to 90, decreasing to 0.2 percent at age 100 and 0 percent at age 105. The 1 percent assumption is close to the long-term historical average of mortality improvement in Canada from 1921 to It is also in the middle of the range of expert opinions of 0.8 percent to 1.2 percent. The task force also believes that ultimate mortality improvement rates assumed for women and men should be the same. Male improvement rates in Canada have been higher than female rates, but the task force observed that male life expectancies have been converging with higher female life expectancies in the past 20 years. Therefore, the task force concluded that the ultimate mortality improvement rates for males should be the same as female rates at the end of the convergence period. 18
20 The task force built a modest allowance for mortality improvement rates at ages over 100, recognizing the uncertainty about mortality improvement at all ages but especially very high ages. The task force believes that history provides an instructive warning that mortality improvement can happen at ages where there has not yet been credible prior experience. The following table presents the projected average annualized rates of mortality improvement from the proposed MI-2017 scale starting in year Age Group Next 90 Next 50 Next 20 Male Female Both Male Female Both Male Female Both % 0.94% 0.96% 1.04% 0.95% 0.99% 1.25% 1.02% 1.13% % 0.93% 0.96% 1.04% 0.95% 0.99% 1.25% 1.02% 1.13% % 0.92% 0.95% 1.03% 0.94% 0.98% 1.24% 0.99% 1.10% % 0.84% 0.87% 0.93% 0.85% 0.88% 1.03% 0.86% 0.92% The following graph shows the proposed ultimate mortality improvement rates compared to the CPM and CLIFR scales. 2.0% Comparison of Industry Ultimate Improvement Rates 1.5% 1.0% 0.5% 0.0% MI-2017 CPM-B CLIFR 19
21 5.6 Convergence Period and Method Convergence Period Significant professional judgment is required to select the convergence period in our mortality improvement model. The main consideration for establishing this assumption is the length of the cycles of mortality improvement rates observed in the past. The visual inspection of the historical heat maps provides some insight in this respect. In the absence of a compelling quantitative analysis, the task force decided to adopt a convergence period similar to that assumed in the building of other mortality improvement scales in recent years. The assumption used by the CMI in the UK is a convergence period of 10 years for ages 20 to 50, 20 years for ages 60 to 80, five years for ages 95 and older, with a linear interpolation for other ages. A convergence period of 20 years for all ages was assumed for the 2014 CPP-26, the 2014 CPM-B, and MP MP-2016 used a mix of 10 years (horizontal) and 20 years (diagonal). This information is summarized in a table format in section 7.4. Twenty years, therefore, is the most common convergence period assumed in the building of improvement scales in recent years for ages between 60 and 80. The task force believes that this convergence period is reasonable in light of the historical heat maps. The heat maps reveal that historical improvement rates have tended to be more volatile at younger ages than at older ones. Accordingly, it seemed reasonable to use a shorter convergence period for younger ages, as the CMI assumed. At very old ages (90 years and up), an argument could be made that high improvement rates have been observed for a shorter period than at younger ages, that the experience is less credible, and that therefore the convergence period should be shorter at old ages, as the CMI assumed. The heat maps, however, reveal that there has been a long-term upward trend in mortality improvement rates at old ages, comparable to those observed at younger ages. Another consideration for not shortening the convergence period at very old ages is that there is a lower differential between initial and ultimate mortality improvement rates at older ages compared to ages 60 to 80. It is thus less material to have a different convergence period. Therefore, the task force believes that the convergence period assumed at very old ages should be the same as for ages 60 to 80. The task force decided to assume a convergence period of 10 years (until 2023) for ages 0 to 40 and a convergence period of 20 years (until 2033) for ages 60 and up. For ages 41 to 59 the transition period is interpolated linearly (not rounded) Convergence Method The task force believes that improvement rates may be assumed to progress smoothly from recent history to the ultimate rates. Of course, the assumption is about the trend rather than the actual improvement rates that emerge over time because the actual is still expected to show volatility from year to year and age to age. 20
22 The task force considered the approach used by CMI: a cubic running between the last historical improvement rate and the ultimate rate. The slope is set to zero at the ultimate year, and a third point is estimated at the middle year of the transition. The SOA s Retirement Plans Experience Committee (RPEC) also used cubics for the transition in MP-2014, MP-2015 and MP Rather than estimating a third point, RPEC used as the initial slope of the cubic the slope of the secant between the last two historical improvement rates. The slope was not allowed to exceed in absolute value. RPEC used two cubics, one along attained ages and one along birth cohorts, believing that the observed cohort effect would be maintained better. For MP-2016, RPEC constrained the slope to zero; that is, it used a flat slope at both ends of the cubic. The task force decided to use an approach similar to that used by RPEC, but testing indicated that little was gained by using the more complicated approach with two cubics. It was believed that the cohort effect was sufficiently recognized by a cubic interpolation along attained ages. To achieve a smooth transition, the task force decided to fit a cubic equation between 2013 (the last year of historical graduated improvement rate after step-back) and the ultimate rate. The slope is assumed to be zero at the ultimate year, and the slope at the start is taken as the slope from 2012 to 2013, to a maximum absolute value of There is a separate equation for each age. No attempt was made to link successive equations because there is adequate smoothness in both the historical rates by age and the ultimate rates. The formula for the cubic equation is III(x, y) = III(x, 2013) + m(y 2013) 2m(yyyy 2013) 3 III(x, yyyy) III(x, 2013) (yyyy 2013) 2 (y 2013) 2 m(yyyy 2013) 2 III(x, yyyy) III(x, 2013) + (yyyy 2013) 3 (y 2013) 3 where y is the year of improvement, x is the age, m is the slope at 2013, and yult is the first year that the ultimate rate applies. The constraint of was never binding. The maximum slope was for males and for females. 6 Segments of the General Population There is little data available to study mortality improvement at a more granular level than the general population and determine whether the best estimate assumption for the general population could or should be modified for different segments of the population. The task force has not produced any new analysis on the matter but has conducted a literature review. 21
23 In 2013, the CIA published a document (Adam, 2013) authored by Louis Adam on mortality improvement rates. This study used individual administrative data of Canadian pensioners over the age of 60. It analyzed mortality improvement rates by gender, age, income level, and data source (CPP, QPP, and both plans combined) over various periods ending in Amongst other findings, the study found differences in mortality improvement rates by income and by data source, especially for males. A paper (Towers Watson, 2011) published in 2011, produced by Towers Watson and sponsored by the SOA, also provides insight on the segments of the population directly relevant for actuaries, like smokers versus non-smokers and insureds and annuitants. Other references focus on the impact of socioeconomic profiles, and use a variety of techniques to measure it. The main observations are the following: Several papers concluded that in the U.S., mortality improvement has been higher for the higher socioeconomic classes during a period going approximately from 1980 to The inequality in longevity among socioeconomic segments has thus been rising during this period in the U.S. Some papers concluded that the inequality in longevity among socioeconomic segments has diminished in the UK and in Canada during the 2000 to 2010 period. Mortality improvement has been lower for smokers than for non-smokers. The task force view is that it may be appropriate for the actuary to establish mortality improvement assumptions that vary by segments of the population when there is evidence of differences in recently observed data. The task force believes that the mortality improvement scale presented in this report and based on the general population would be in a reasonable range for most actuarial applications in Canada. 7 Recommendation The mortality improvement scale recommended by the task force is called CIA MI-2017 (or simply MI-2017). This section shows rates from the scales and compares it with some other published scales. 7.1 Scales The CIA MI-2017 recommended improvement rates vary by gender, attained age, and calendar year. They comprise gender-specific initial rates for , converging to unisex ultimate rates over a period of up to 20 years (shorter for younger ages) by attained age, along cubic curves. The full set of rates for CIA MI-2017 are provided in the Excel workbook, available for download from the CIA, called Constructing MI-2017 (Canadian Institute of Actuaries, 2017), in the worksheets MI-2017 Male and MI-2017 Female. The workbook also includes Visual Basic for Applications (VBA) code to enable the calculation of a similar 22
24 scale with a variation in parameters in case that may be needed for some purpose such as sensitivity testing; see the worksheet Parameters and follow the instructions. The following tables show illustrative rates for key ages starting in 2013: Male AA\CY % 1.75% 1.12% 1.00% 1.00% % 1.80% 1.39% 1.05% 1.00% % 1.69% 1.34% 1.10% 1.00% % 1.76% 1.36% 1.09% 1.00% % 1.57% 1.29% 1.08% 1.00% Female AA\CY % 1.18% 1.03% 1.00% 1.00% % 1.31% 1.15% 1.02% 1.00% % 1.58% 1.32% 1.10% 1.00% % 1.33% 1.12% 1.03% 1.00% % 1.04% 0.94% 0.96% 1.00% Initial and Ultimate Improvement Rates The following graph shows how the improvement rates for 2013 (the last year of the initial improvement rates after step-back) and ultimate improvement rates compare. 23
25 3% CIA MI Initial and Ultimate Rates 2% 1% 0% Ultimate Transition between Initial and Ultimate Rates The transition period is 10 years for ages 0 to 40, 20 years for 60 and higher, and grading linearly in between (not rounded to the nearest integer). Thus the transition period is 10.5 years for age 41, 11 years for age 42, 11.5 years for age 43, etc. The improvement rates in the transition are obtained by fitting a cubic equation separately for each age from 0 to 104, as described in section 5.6. The following graphs present the improvement rates of the MI-2017 scale for key attained ages. One can see the smooth progression from the rates for initial years towards the ultimate rate. The first year of the projection is The black vertical line indicates the last of the initial years of MI
26 3.5% CIA MI-2017 Improvement Rates - Male 3.0% 2.5% 2.0% 1.5% 1.0% 0.5% 0.0% % CIA MI-2017 Improvement Rates - Female 2.0% 1.5% 1.0% 0.5% 0.0%
27 7.2 Annuity Factors and Life Expectancy The following table presents illustrative annuity factors for key ages as at January 1, 2018 on the following basis: Annuity-due paid monthly; Discount rate of 4 percent; Base mortality rates using the CPM2014 mortality table; and Alternative mortality improvement scales, including MI-2017 and other industry scales. These factors are provided for reference only to illustrate the potential materiality of applying the MI-2017 mortality improvement rates. The scope of the task force s work did not include a review of the appropriateness of using the MI-2017 mortality improvement scale in combination with any particular underlying mortality table for any specific purpose. Annuity Factors (January 1, 2018) Change to MI-2017 MI-2017 CPM-B CLIFR AA CPM-B CLIFR AA M % 0.6% 0.5% M % 0.9% 1.0% M % 1.3% 1.7% M % 1.7% 2.8% M % 1.2% 3.1% F % 0.2% 1.3% F % 0.4% 1.7% F % 0.5% 2.0% F % 0.5% 2.2% F % 0.5% 2.5% The change from CPM-B to MI-2017 is mostly a result of the fact that the ultimate improvement rate was 0.8 percent for CPM-B but is 1 percent for MI-2017 for most ages and has a different pattern over age 82. The following table presents the life expectancy as of certain key ages for males and females, calculated under the CIA MI-2017 scale and compared to other industry scales. 26
28 Life Expectancies (January 1, 2018) Change to MI-2017 MI-2017 CPM-B CLIFR AA CPM-B CLIFR AA M % 1.3% 1.8% M % 1.6% 2.3% M % 1.9% 3.0% M % 2.2% 4.0% M % 1.5% 3.7% F % 0.6% 3.4% F % 0.7% 3.5% F % 0.7% 3.4% F % 0.7% 3.3% F % 0.7% 3.1% 7.3 Heat Maps The following heat maps present the improvement scale CIA MI-2017 in a graphical format. The vertical black line on the heat maps is after 2013, demarking the initial rates from the projected ones. One can see that CIA MI-2017 produces a smooth and intuitive transition from the initial improvement rates to the projected. Some may be concerned that the cohort effect does not continue strongly. There has been some evidence of the cohort effect dissipating in recent years. The ultimate assumption of 1 percent for all ages 0 90 implies that the cohort effects eventually disappear. (Although the thinking was more that we do not have sufficient knowledge now to predict what, if any, cohort effects may be present in 2033 and later.) The use, in the transition, of the slope of improvement rates over the last two of the initial years gives rise to some continuation of the cohort effect, but the effect wears off in the progression to the ultimate. 27

29 MI-2017 Male 28

30 MI-2017 Female 7.4 Comparison with Other Scales The following table compares the construction of the CIA MI-2017 improvement rates against other recent two-dimensional improvement scales. 29
31 Initial Rates Assumptions Source of Data Smoothing Method Canada 2017 CIA Task Force Canadian Population extended with Old Age Security data Whittaker-Henderson Canada 2016 CPP-27 Canadian Population extended with Old Age Security data 15-year average by age Canada 2014 CPM-B C/QPP Income Class 4 UK CMI 2015 core model U.K. Population US MP-2016 Social Security Administration with conjunction of OASDI Trustees Reports 10-year weighted average Age-Cohort P-Spline Whittaker-Henderson Calendar Jan 1, 1975 to July 31, Years Ages Ultimate Rates Convergence Period Rates at Older Ages Recognize Cohort Effect? Last Year of Historical Initial Rates Ultimate Rate (Age/Period ) Ultimate Rate (Cohort) Ultimate Rate (Maximum Age of Improvement) Convergence Period (Age/Period ) Convergence Period (Cohort) Grade linearly from age 95 to 0% at 105 Implicit 2013 (Last available data two years) Ages 0 90: 1.0% Age 100: 0.2% Ages 105+: 0.0% linear interpolation in between Step decrease to a rate of 0.0% at age 120 Male ages only maximum rate of 0.5% 2011 CMHD, 2014 OAS Ages 0 87: 0.8% Age 92: 0.5% Ages 97: 0.36% Ages 110+: 0.0% Linear interpolation in between Linear decrease from rate of 3.0% at age 80 to a rate of 0.0% at age 95 No 2011 Same as 2014 CPP-26 but 0.0% at age 115+ Linear decrease from rate at age 100 to a rate of 0.0% at age 110 Age/Period and Cohort (year-of-birth) Component 2012 (Last available full-year data two years) User Defined; Linear decrease from rate at age 90 to a rate of 0.0% at age 120 Linear decrease from rate at age 95 to 0.0% at age 115 Implicit 2012 (Last available data two years) 1% to age 85, linear to 0.85% at age 95, linear to 0.0% at age 115+ N/A N/A N/A 0.0% N/A Ages 0 40: 10 years Ages 60+: 20 years Increasing by one every two ages in between 20 years 20 years N/A N/A N/A Ages 20 50: 10 years Ages 60 80: 20 years Ages 95+: 5 years In/(de)creasing by one in between Ages 20 60: 40 years Ages 95+: 5 years Decreasing by one in between 10 years 20 years 4 Raw rates used for data smoothing. 30
32 Assumptions Rates during Convergence Period Convergence Method Canada 2017 CIA Task Force N/A Canada 2016 CPP-27 Same as UK CMI methodology, except males ages use 25% of initial rate remaining at mid-point of convergence period Canada 2014 CPM-B N/A UK CMI 2015 core model - 50% of initial rate remaining at mid-point of convergence period - Cubic interpolation inbetween Cubic interpolation Same as UK CMI Linear grading Cubic interpolation US MP-2016 N/A Cubic Interpolation both by age and year of birth 31
33 8 Appendix 8.1 Extension of the Data to 2015 using OAS Data The extension was made by distinct methods in each of three age ranges. Each is described below. In-force counts were provided for year-ends , and deaths for each of those years. Therefore, raw mortality rates could be calculated for and raw improvement rates for Definitions qh(x,y) Mortality rate obtained from HMD for age x, year y, y < EH(x,y) The corresponding exposure from HMD for age x, year y. qo(x,y) Mortality rate obtained from OAS for age x, year y, 2005 < y < Raw(x,y) The raw mortality rate to be used in graduation for age x, year y. Wt(x,y) The weight to be used in graduation for age x, year y. For All Ages and Years except Those Specified Below Raw(x,y) = qh(x,y) Wt(x,y) = EH(x,y) For 65 < x < 95 and 2006 < y < 2016 OAS data are available for individual ages Because there are many new entrants at age 65 and because the implied improvement rates at age 65 seemed inconsistent with age 66, the data for age 65 was not used. The mortality rates for 2007 to 2015 were developed from the HMD rates in 2006 with the rates of mortality improvement observed in the OAS data from Note that this is not simply an extension. HMD rates were actually replaced for to be consistent with mortality improvement rates observed in OAS data; it was believed that the OAS data were of higher quality than the HMD data, particularly at the oldest ages. Raw(x,y) = Raw(x,y-1) * qo(x,y) / qo(x,y-1) Wt(x,y) = EH(x,y) for y 2011 only. Later weights will be described below. For x > 94 and y > 2011 OAS rates are grouped for ages 95 and up. HMD mortality rates were extended for as the HMD rates for 2011 at ages with the rates of improvement observed for OAS for ages 95+. Note that the same improvement rates are used for each of ages for this calculation. Raw(x,y) = Raw(x,y-1) * qo(95+,y) / qo(95+,y-1) For x < 66 and y > 2011 Because OAS starts at age 65, there is no data for lower ages for the period 2012 to Nonetheless, the task force was satisfied that a sufficiently reliable extrapolation 32
34 could be made using the correlation observed in HMD data between the mortality improvement for the two age ranges 0 65 and , and the improvement for in the OAS data. A necessary hypothesis is that mortality improves at about the same rate, by years, for the two age ranges 0 65 or To test the hypothesis, the change in age-adjusted mortality rates (which represents the average mortality rates in each age range) for the two age ranges are compared for The charts below provide an illustration of the results. The trends are very close for females and close enough for males. Essentially, this shows that we can safely use the improvements observed at ages 66+ from 2012 to 2015 to infer the improvement at ages 0 to 65 for the same period. 100% Trend in male mortality 100% Trend in female mortality 95% 95% 90% 85% 90% 80% % The calculation for the extension is much more complex than for the other sections. It involves several steps. Step 1. Calculate two sets of age-adjusted mortality rates. 65 qlo(y) = Raw(x, y)wt(x, 2011) Wt(x, 2011) for 2003 y 2011 x=0 100 qhi(y) = Raw(x, y)wt(x, 2011) Wt(x, 2011) for 2003 y 2015 x=66 The choice of weights for age-adjusting is arbitrary; 2011 is a reasonable choice. The start of the calculation in 2003 is also arbitrary. For a later step, we did not want to go too far back into the past; 2003 was chosen for that reason. 65 x=0 100 x=66 The charts above show qlo and qhi scaled to 1 in Note how similar they are. Step 2. Calculate a year pattern for The cumulative improvement factor over is 82.3 percent for qlo and 81.4 percent for qhi for males, and 86.6 percent for qlo and 86.7 percent for qhi for females. 33
35 The cumulative improvement is very close for females, and it is sufficiently close for males. The closeness of the improvement factors justifies applying the pattern of improvement for of qhi to extend mortality rates for 0 65 to The term year pattern (YP) is used to refer to the cumulative improvement in the age-adjusted mortality rates over those years. Note that YP is based on qhi only because qlo is not available to YP(y) = qhi(y) qhi(2011) for 2012 y 2015 Step 3. Remove the year pattern from mortality rates for The goal is to estimate an age pattern (AP) using data for To see the impact of age, as distinct from year, the year pattern has to be removed from each mortality rate. The calculation is done to age 75, but ultimately ages over 65 will not be used. q(x, y) = Raw(x, y) qlo(2011) qlo(y) Step 4. Calculate an age pattern from for 2003 y 2011 This step calculates the average improvement rate for each age, 0 to 75, using a linear least squares regression on the logarithm of the adjusted mortality rates in the previous step. The least squares regression of all the mortality is used rather than just the end points because the end points have too much inherent volatility. The result is a better estimate of the average. Logarithms are used because improvement is essentially a multiplicative rather than additive process. Step 5. Graduate age pattern. AP(x) = 1 exp (slope of log regression line of q(x, y)) The graduation is done with Whittaker-Henderson, order of difference 2, smoothing factor 50, with Wt(x,2011) as the weights. Graduated rates are used only to age 65. They replace AP(x) calculated above. This step was not absolutely essential. We applied graduation to avoid too much influence on the extension from the fluctuation by age. Step 6. Estimate mortality rates for 0 65 for Raw(x, y) = Raw(x, 2011)YP(y)(1 AP(x)) y 2011 This has mortality rates improving at the same year pattern and also according to the age pattern. Exposures for Years 2012 to 2015 Because the exposures will be used later as weights in the graduation, it is necessary to estimate exposures for for each age. Weights are calculated by the recursive formulas below. 34
36 Wt(0, y) = Wt(0, y 1) Wt(x, y) = Wt(x 1, y 1) 1 Raw(x 1, y) + Raw(x, y) 2 for x > 0 and y > 2011 Because the approximation is less precise other than for ages 66 94, in the graduation, 50 percent of the above weights is used for ages 0 65 and 75 percent of the above weights for ages Choice of Method and Parameters in Construction There are four metrics that can be considered in choosing the method and parameters for constructing CIA MI-2017: 1. Stability; 2. Fit; 3. Predictiveness; and 4. Smoothness. Each of the metrics is defined so that values are non-negative and the smaller the value the closer the scale is to the ideal for that metric. The formulas are given in section 8.3. The four metrics are calculated by doing backtesting on the method. A scale is calculated for each of 15 consecutive years using the HMD data that is assumed to have been available at that time. The metrics are calculated on that scale or by a comparison between scales. For the purpose of the backtesting, it is assumed that there is a gap of three years between the last year of history available from HMD and the year of publication of the scale. The idea of stability is to determine how close valuations are when using successively developed scales with the same method and graduation parameters. Stability has been looked at using backtesting over a moving three-year range (assuming a new scale is developed every three years). The task force believes that a method which exhibits more stability (smaller value) is to be preferred over one that is more volatile because there would be less fluctuation in actuarial values. However, a zero value for the metric would imply perfect stability, but that would not be good because we expect improvement rates to change over time. The idea of fit is to determine how close the calculated improvement rates are to the actual. Of course, the actual cannot be known; the actual is estimated by the average improvement rate over the last several years of historical data. The average of the scale is calculated in the same manner. A method that produces a better fit (smaller value) would normally be considered a better method; however, because the actual data are so noisy, there is a danger that an extremely good fit would show fluctuations in the data rather than the underlying trend. 35

37 The idea of predictiveness is to determine how good the prediction of the next several improvement rates is compared to the actual improvement rates that are seen to emerge over time. A strongly predictive method is desirable, but it may not be attainable. There seems to be little variation in the predictive metric over a range of reasonable methods and parameters. The idea of smoothness is to verify that the improvement rates are progressing smoothly from year to year for each age within a scale. In the real world, the progression will not appear smooth, a lot because of fluctuation, but some because the drivers of mortality improvement may not be smooth themselves. However, we cannot hope to predict accurately an unsmooth trend. Therefore, our scale should be a smooth approximation to the impact of many drivers. A good method will have generally low values for each of the four metrics. Within a method, parameters which produce generally lower values will likely be preferable. We found no method which simultaneously minimizes all metrics. Judgment is still required. The optimal improvement scale is not necessarily the one that has the lowest combined value for the four criteria. For example, the charts below show how the four metrics varied for males when trying order of difference 2 and 3 in the graduation and a number of different balancing factors. Our analysis reveals that stability is much better for order 2 than order 3, but the opposite is true of fit. Smoothness is consistently better for order 2. Predictiveness is not materially different for order 2 and 3. Because order 2 provides better stability with no deterioration in predictiveness, the choice of order 2 is quite clear. The choice of 36

38 balancing factor is less obvious. A value in the range of seems to strike a good balance. The decision was to use 300 because there were some anomalies around age 65 for a balancing factor at the lower end of that range which disappeared at the upper end. Another aspect of the construction which the task force considered was whether to interpolate between the graduated historical rates and the ultimate rates by age, by cohort, or a combination of the two. The task force also considered how long the interpolation period should be. The charts below, also for males, show the metrics for the three directions of interpolation and various lengths of interpolation. (The charts assume the same length for all ages, although the final decision was to use a shorter period at younger ages.) It seems evident that the direction of interpolation is not important. Predictiveness is slightly better along cohorts and smoothness is better along ages. (Because smoothness is always calculated along ages, that result is not surprising.) The task force decided to interpolate along ages because the method was simpler. Stability is better with a shorter interpolation period, but predictiveness and smoothness are better with a longer period. Although the task force generally emphasized stability, it may not be reasonable to improve stability by shortening the interpolation period. The extreme case is to use no interpolation at all but use the ultimate rates immediately after the initial; then stability is zero. But the result is not acceptable because it implies that recent history is irrelevant for future improvement rates in the near term. The four metrics are defined below. 37
Selection of Mortality Assumptions for Pension Plan Actuarial Valuations
 Educational Note Second Revision Selection of Mortality Assumptions for Pension Plan Actuarial Valuations Committee on Pension Plan Financial Reporting December 2017 Document 217128 Ce document est disponible
Selection of Mortality Assumptions for Pension Plan Actuarial Valuations
 Revised Educational Note Selection of Mortality Assumptions for Pension Plan Actuarial Valuations Committee on Pension Plan Financial Reporting March 2014 Document 214029 Ce document est disponible en
Memorandum. According to subsection 3530 of the Standards of Practice: Demographic Assumptions
 To: From: Memorandum All Fellows, Affiliates, Associates, and Correspondents of the Canadian Institute of Actuaries, and other interested parties Conrad Ferguson, Chair Actuarial Standards Board Geoffrey
Development of New Prescribed Interest Rate Scenarios for CALM Valuations
 Research Paper Development of New Prescribed Interest Rate Scenarios for CALM Valuations Committee on Life Insurance Financial Reporting October 2014 Document 214109 Ce document est disponible en français
Memorandum. INTRODUCTION According to subsection 3530 of the Standards of Practice: Demographic Assumptions
 Memorandum To: From: All Fellows, Affiliates, Associates, and Correspondents of the Canadian Institute of Actuaries and Other Interested Parties James K. Christie, Chair Actuarial Standards Board Conrad
Article from: Pension Section News. May 2014 Issue 83
 Article from: Pension Section News May 2014 Issue 83 CANADIAN PENSIONERS MORTALITY: A REVIEW OF THE FINAL REPORT By Faisal Siddiqi Faisal Siddiqi, FSA, FCIA, is principal and consulting actuary at Buck
April 9, Robert Choi Director, Employee Plans Internal Revenue Service 1111 Constitution Avenue, NW NCA 614 Washington, DC 20224
 April 9, 2015 J. Mark Iwry Senior Advisor to the Secretary Deputy Assistant Secretary (Retirement & Health Policy) U.S. Department of the Treasury 1500 Pennsylvania Avenue, NW Washington, DC 20220 Victoria
Mortality Improvement Research Paper
 Research Paper Mortality Improvement Research Paper Committee on Life Insurance Financial Reporting September 2010 Document 210065 Ce document est disponible en français 2010 Canadian Institute of Actuaries
General Session #2. Mortality in 2-D. Christopher Bone. Laurence Pinzur PBGC. Aon Hewitt. March 25, 2014
 General Session #2 Mortality in 2-D Jointly sponsored by the American Academy of Actuaries And the Conference of Consulting Actuaries In cooperation with the Society of Actuaries Christopher Bone PBGC
FINAL STANDARD OF PRACTICE FOR DETERMINING PENSION COMMUTED VALUES. Effective date: September 1, 2004 COMMITTEE ON PENSION PLAN FINANCIAL REPORTING
 FINAL STANDARD OF PRACTICE FOR DETERMINING PENSION COMMUTED VALUES Effective date: September 1, 2004 COMMITTEE ON PENSION PLAN FINANCIAL REPORTING FEBRUARY 2004 2004 Canadian Institute of Actuaries Document
Session 6A, Mortality Improvement Approaches. Moderator: Jean Marc Fix, FSA, MAAA. Presenters: Laurence Pinzur, FSA
 Session 6A, Mortality Improvement Approaches Moderator: Jean Marc Fix, FSA, MAAA Presenters: Laurence Pinzur, FSA Session 6A Mortality Improvement Models 6 January 2017 Laurence Pinzur, PhD, FSA Aon Hewitt
Construction of CIA9704 Mortality Tables for Canadian Individual Insurance based on data from 1997 to 2004
 Report Construction of CIA9704 Mortality Tables for Canadian Individual Insurance based on data from 1997 to 004 Individual Life Eperience Subcommittee Research Committee May 010 Document 1008 Ce document
Mortality Table Development 2014 VBT Primary Tables. Table of Contents
 8/18/ Mortality Table Development VBT Primary Tables and Society Joint Project Oversight Group Mary Bahna-Nolan, MAAA, FSA, CERA Chairperson, Life Experience Subcommittee August 14, 2008 SOA NAIC Life
Memorandum. Introduction. Background
 To: From: Memorandum All Fellows, Affiliates, Associates, and Correspondents of the Canadian Institute of Actuaries and other interested parties Conrad Ferguson, Chair Actuarial Standards Board Dominic
Investment Assumptions Used in the Valuation of Life and Health Insurance Contract Liabilities
 Revised Educational Note Investment Assumptions Used in the Valuation of Life and Health Insurance Contract Liabilities Committee on Life Insurance Financial Reporting September 2015 Document 215072 Ce
Regulatory Capital Filing Certification
 Draft Revised Educational Note Regulatory Capital Filing Certification Committee on Risk Management and Capital Requirements September 2017 Document 217092 Ce document est disponible en français 2017 Canadian
Session 158 PD - Living to 100: Modeling of Mortality Improvement. Moderator: Andrew J. Peterson, FSA, EA, FCA, MAAA
 Session 158 PD - Living to 100: Modeling of Mortality Improvement Moderator: Andrew J. Peterson, FSA, EA, FCA, MAAA Presenters: Elena V. Black, FSA, EA, FCA, MAAA Marianne C. Purushotham, FSA, MAAA SOA
ACTUARIAL REPORT 27 th. on the
 ACTUARIAL REPORT 27 th on the CANADA PENSION PLAN Office of the Chief Actuary Office of the Superintendent of Financial Institutions Canada 12 th Floor, Kent Square Building 255 Albert Street Ottawa, Ontario
EXPOSURE DRAFT. STANDARD OF PRACTICE FOR DETERMINING PENSION COMMUTED VALUES Effective date: September 1, 2003
 EXPOSURE DRAFT STANDARD OF PRACTICE FOR DETERMINING PENSION COMMUTED VALUES Effective date: September 1, 2003 COMMITTEE ON PENSION PLAN FINANCIAL REPORTING APRIL 2002 2002 Canadian Institute of Actuaries
Assumptions for Hypothetical Wind-Up and Solvency Valuations with Effective Dates Between December 31, 2011, and December 30, 2012
 Educational Note Assumptions for Hypothetical Wind-Up and Solvency Valuations with Effective Dates Between December 31, 2011, and December 30, 2012 Committee on Pension Plan Financial Reporting May 2012
Calibration of Stochastic Risk-Free Interest Rate Models for Use in CALM Valuation
 Revised Educational Note Supplement Calibration of Stochastic Risk-Free Interest Rate Models for Use in CALM Valuation Committee on Life Insurance Financial Reporting August 2017 Document 217085 Ce document
ACTUARIAL REPORT 25 th. on the
 25 th on the CANADA PENSION PLAN Office of the Chief Actuary Office of the Superintendent of Financial Institutions Canada 16 th Floor, Kent Square Building 255 Albert Street Ottawa, Ontario K1A 0H2 Facsimile:
CalPERS Experience Study and Review of Actuarial Assumptions
 California Public Employees Retirement System Experience Study and Review of Actuarial Assumptions CalPERS Experience Study and Review of Actuarial Assumptions CalPERS Actuarial Office December 2013 Table
Determination of Best Estimate Discount Rates for Going Concern Funding Valuations
 Draft of Educational Note Determination of Best Estimate Discount Rates for Going Concern Funding Valuations Committee on Pension Plan Financial Reporting June 2009 Document 209054 Ce document est disponible
Pension Commuted Values
 Educational Note Pension Commuted Values Committee on Pension Plan Financial Reporting April 2006 Document 206042 Ce document est disponible en français 2006 Canadian Institute of Actuaries Educational
ACTUARIAL REPORT 12 th. on the
 12 th on the OLD AGE SECURITY PROGRAM Office of the Chief Actuary Office of the Superintendent of Financial Institutions Canada 12 th Floor, Kent Square Building 255 Albert Street Ottawa, Ontario K1A 0H2
MISSOURI STATE EMPLOYEES RETIREMENT SYSTEM - JUDGES
 MISSOURI STATE EMPLOYEES RETIREMENT SYSTEM - JUDGES 5 - YEAR EXPERIENCE STUDY JULY 1, 2010 THROUGH JUNE 30, 2015 ACTUARIAL INVESTIGATION REPORT 2010-2015 TABLE OF CONTENTS Item Overview and Economic Assumptions
Session 36 PD, Mortality Assumption Setting for Pension Actuaries. Moderator: Andrew J. Peterson, FSA, EA, FCA, MAAA
 Session 36 PD, Mortality Assumption Setting for Pension Actuaries Moderator: Andrew J. Peterson, FSA, EA, FCA, MAAA Presenters: David T. Kausch, FSA, EA, FCA, MSPA Laurence Pinzur, FSA Session 36 - Panel
Mortality Improvement Trends and Assumption Setting
 Mortality Improvement Trends and Assumption Setting Marianne Purushotham, FSA, MAAA SEAC Annual Meeting November 15, 2012 Topics to be covered Review of historical mortality improvement trends US population
Subject: Experience Review for the Years June 30, 2010, to June 30, 2014
 STATE UNIVERSITIES RE T I R E M E N T S Y S T E M O F I L L I N O I S 201 5 E X P E R I E N C E R E V I E W F O R T H E Y E A R S J U N E 3 0, 2010, T O J U N E 3 0, 2014 January 16, 2015 Board of Trustees
Select Period Mortality Survey
 Select Period Mortality Survey March 2014 SPONSORED BY Product Development Section Committee on Life Insurance Research Society of Actuaries PREPARED BY Allen M. Klein, FSA, MAAA Michelle L. Krysiak, FSA,
RESEARCH PAPER GROUP LIFE WAIVER STUDY BASED ON CANADIAN GROUP LTD TERMINATION EXPERIENCE
 RESEARCH PAPER GROUP LIFE WAIVER STUDY BASED ON 1988-1994 CANADIAN GROUP LTD TERMINATION EXPERIENCE COMMITTEE ON EXPECTED EXPERIENCE GROUP LIFE AND HEALTH NOVEMBER 2001 2001 Canadian Institute of Actuaries
Draft Educational Note. Data Validation. Committee on Workers Compensation. December Document
 Draft Educational Note Data Validation Committee on Workers Compensation December 2017 Document 217124 Ce document est disponible en français 2017 Canadian Institute of Actuaries Members should be familiar
Memorandum. To: All Fellows, Affiliates, Associates, and Correspondents of the Canadian Institute of Actuaries and Other Interested Parties.
 Memorandum To: From: All Fellows, Affiliates, Associates, and Correspondents of the Canadian Institute of Actuaries and Other Interested Parties James K. Christie, Chair Actuarial Standards Board Conrad
Session 48 PD, Mortality Update. Moderator: James M. Filmore, FSA, MAAA
 Session 48 PD, Mortality Update Moderator: James M. Filmore, FSA, MAAA Presenters: Thomas P. Edwalds, FSA, ACAS, MAAA Dieter S. Gaubatz, FSA, FCIA, MAAA 2015 VBT Table Development Tom Edwalds, FSA, ACAS,
Research Paper. Provisions for Adverse Deviations in Going Concern Actuarial Valuations of Defined Benefit Pension Plans
 Research Paper Provisions for Adverse Deviations in Going Concern Actuarial Valuations of Defined Benefit Pension Plans Task Force on the Determination of Provisions for Adverse Deviations in Going Concern
Standards of Practice Practice-Specific Standards for Pension Plans
 Revised Exposure Draft Standards of Practice Practice-Specific Standards for Pension Plans Actuarial Standards Board February 2010 Document 210006 Ce document est disponible en français 2010 Canadian Institute
METROPOLITAN TORONTO PENSION PLAN REPORT ON THE ACTUARIAL VALUATION FOR FUNDING PURPOSES AS AT DECEMBER 31, 2016 APRIL 2017
 GM21.6 Attachment 1 Attachment 1 REPORT ON THE ACTUARIAL VALUATION FOR FUNDING PURPOSES AS AT DECEMBER 31, 2016 APRIL 2017 Financial Services Commission of Ontario Registration Number: 0351577 Canada Revenue
Life Insurance Capital Adequacy Test (LICAT) and Capital Adequacy Requirements for Life and Health Insurance (CARLI)
 and Capital Adequacy Requirements for Life and Health Insurance (CARLI)") Educational Note Life Insurance Capital Adequacy Test (LICAT) and Capital Adequacy Requirements for Life and Health Insurance (CARLI) Committee on Life Insurance Financial Reporting Committee on Risk Management
Educational Note Life Insurance Capital Adequacy Test (LICAT) and Capital Adequacy Requirements for Life and Health Insurance (CARLI) Committee on Life Insurance Financial Reporting Committee on Risk Management
Revised Exposure Draft
 Revised Exposure Draft Amendments to Section 3500 of the Practice-Specific Standards for Pension Plans Pension Commuted Values Actuarial Standards Board November 2018 Document 218141 Ce document est disponible
Session 2b Pension Product Pricing and Longevity Risk Management. Andrew D. Rallis, FSA, MAAA
 Session 2b Pension Product Pricing and Longevity Risk Management Andrew D. Rallis, FSA, MAAA Pension Product Pricing and Longevity Risk Management ANDY RALLIS 2016.9.1 Agenda US Defined Benefit Pension
DALHOUSIE UNIVERSITY STAFF PENSION PLAN REPORT ON THE ACTUARIAL VALUATION AS AT MARCH 31, November Prepared by:
 DALHOUSIE UNIVERSITY REPORT ON THE ACTUARIAL VALUATION November 2010 Prepared by: Eckler Ltd. 1969 Upper Water Street, Suite 503 Halifax, Nova Scotia B3J 3R7 TABLE OF CONTENTS SECTION PAGE SUMMARY OF RESULTS
DISCUSSION DRAFT STANDARD OF PRACTICE FOR DETERMINING PENSION COMMUTED VALUES COMMITTEE ON PENSION PLAN FINANCIAL REPORTING
 DISCUSSION DRAFT STANDARD OF PRACTICE FOR DETERMINING PENSION COMMUTED VALUES COMMITTEE ON PENSION PLAN FINANCIAL REPORTING APRIL 2001 2001 Canadian Institute of Actuaries Document 20115 Ce document est
Simon Fraser University Pension Plan for Administrative/Union Staff
 Actuarial Report on the Simon Fraser University Pension Plan for Administrative/Union Staff as at 31 December 2010 Vancouver, B.C. September 13, 2011 Contents Highlights and Actuarial Opinion... 1 Appendix
Measuring Policyholder Behavior in Variable Annuity Contracts
 Insights September 2010 Measuring Policyholder Behavior in Variable Annuity Contracts Is Predictive Modeling the Answer? by David J. Weinsier and Guillaume Briere-Giroux Life insurers that write variable
Memorandum. Introduction. Background
 To: From: Memorandum All Fellows, Affiliates, Associates, and Correspondents of the Canadian Institute of Actuaries, and Other Interested Parties Tyrone Faulds, Chair Actuarial Standards Board Gavin Benjamin,
Exposure Draft. Revised Standards of Practice for Pension Commuted Values (Section 3800) Actuarial Standards Board. June 2008.
 Actuarial Standards Board. June 2008.") Exposure Draft Revised Standards of Practice for Pension Commuted Values (Section 3800) Actuarial Standards Board June 2008 Document 208044 Ce document est disponible en français 2008 Canadian Institute
Exposure Draft Revised Standards of Practice for Pension Commuted Values (Section 3800) Actuarial Standards Board June 2008 Document 208044 Ce document est disponible en français 2008 Canadian Institute
Exposure Draft. Amendments to Section 3500 of the Practice-Specific Standards for Pension Plans Pension Commuted Values. Actuarial Standards Board
 Exposure Draft Amendments to Section 3500 of the Practice-Specific Standards for Pension Plans Pension Commuted Values Actuarial Standards Board July 2017 Document 217075 Ce document est disponible en
Article from: Pension Section News. September 2013 Issue 81
 Article from: Pension Section News September 2013 Issue 81 Living to 100: Insight on the Challenges and Opportunities of Longevity By Jennifer Haid Jennifer Haid, FSA, MAAA, is a Consulting Actuary with
3-6 Principal Valuation Results 7-8 Expected Termination from Active Employment 9-10 COMMENTS AND CONCLUSION. Data Furnished for Valuation
 THE POLICE AND FIRE RETIREMENT SYSTEM OF THE CITY OF DETROIT ANNUAL ACTUARIAL VALUATION OF COMPONENT II JUNE 30, 2014 OUTLINE OF CONTENTS Pages Items 1 Cover letter Valuation Results 3-6 Principal Valuation
Selection of Mortality Assumptions for Pension Plan Actuarial Valuations
 Educational Note Selection of Mortality Assumptions for Pension Plan Actuarial Valuations Committee on Pension Plan Financial Reporting March 2008 Document 208014 Ce document est disponible en français
Report of the Group Annuity Experience Committee Mortality Experience for
 Overview Report of the Group Annuity Experience Committee Mortality Experience for 2001-2002 The Group Annuity Experience Committee performs biennial mortality studies of insurance company annuity experience
PUBLIC POSITION. Meeting the Needs of Canada s Future Retirees A CALL TO TIMELY ACTION: NOVEMBER 10, 2015 SUMMARY OF CIA POSITION
 NOVEMBER 10, 2015 SUMMARY OF CIA POSITION The Canadian retirement system has been the subject of several studies and much public discussion. It is at a crossroads due to the convergence of many forces
Mortality of Beneficiaries of Charitable Gift Annuities 1 Donald F. Behan and Bryan K. Clontz
 Mortality of Beneficiaries of Charitable Gift Annuities 1 Donald F. Behan and Bryan K. Clontz Abstract: This paper is an analysis of the mortality rates of beneficiaries of charitable gift annuities. Observed
PUBLIC EMPLOYEES RETIREMENT ASSOCIATION OF MINNESOTA. Actuarial Experience Study for the period July 1, 2000 through June 30, 2004.
 PUBLIC EMPLOYEES RETIREMENT ASSOCIATION OF MINNESOTA Actuarial Experience Study for the period July 1, 2000 through June 30, 2004 Copyright 2005 THE SEGAL GROUP, INC., THE PARENT OF THE SEGAL COMPANY ALL
Mortality Improvement Scale MP-2018
 Mortality Improvement Scale MP-2018 October 2018 2 Mortality Improvement Scale MP-2018 AUTHOR Society of Actuaries Retirement Plans Experience Committee Caveat and Disclaimer This study is published by
2003 SOA Pension Plan Turnover Study Summary and Practical Guidance
 Summary and Practical Guidance This summary is intended to provide the pension actuary with guidance in interpreting and using the termination and retirement information in the 2003 SOA Pension Plan Termination
Mortality Tables for Determining Present Value under Defined Benefit Pension
 This document is scheduled to be published in the Federal Register on 10/05/2017 and available online at https://federalregister.gov/d/2017-21485, and on FDsys.gov [4830-01-p] DEPARTMENT OF THE TREASURY
Longevity Underwriting
 Longevity Underwriting November 11, 2014 Presented to ACHS Meeting Steven Rancourt FSA, MAAA 2014 Prudential Financial, Inc. and its related entities. Prudential, the Prudential logo, the Rock symbol and
Events Occurring After the Calculation Date of an Actuarial Opinion for a Pension Plan
 Revised Educational Note Events Occurring After the Calculation Date of an Actuarial Opinion for a Pension Plan Committee on Pension Plan Financial Reporting January 2015 Document 215004 Ce document est
Actuarial Funding Report as at January 1, 2018
 Ontario Retirement Pension Plan Actuarial Funding Report as at January 1, 2018 Ontario Retirement Pension Plan Actuarial Funding Report as at January 1, 2018 i Table of Contents Section 1 : Executive
Comparison of IFRS 17 to Current CIA Standards of Practice
 Draft Educational Note Comparison of IFRS 17 to Current CIA Standards of Practice Committee on International Insurance Accounting September 2018 Document 218117 Ce document est disponible en français 2018
Memorandum. To: From:
 To: From: Memorandum All Fellows, Affiliates, Associates and Correspondents of the Canadian Institute of Actuaries and Other Interested Parties A. David Pelletier, Chairperson Actuarial Standards Board
29 June The Honourable Lloyd Axworthy, P.C., M.P. Minister of Human Resources Development House of Commons Ottawa, Ontario K1A 0G5
 29 June 1995 The Honourable Lloyd Axworthy, P.C., M.P. Minister of Human Resources Development House of Commons Ottawa, Ontario K1A 0G5 Dear Minister: Pursuant to section 6 of the Public Pensions Reporting
The CMI Mortality Projections Model Fri 13 th November 2009
 IAA Mortality Task Force The CMI Mortality Projections Model Fri 13 th November 2009 Brian Ridsdale, Faculty and Institute Representative Courtesy: CMI The CMI Mortality Projections Model Agenda Introduction
Issue Brief. Amer ican Academy of Actuar ies. An Actuarial Perspective on the 2006 Social Security Trustees Report
 AMay 2006 Issue Brief A m e r i c a n Ac a d e my o f Ac t ua r i e s An Actuarial Perspective on the 2006 Social Security Trustees Report Each year, the Board of Trustees of the Old-Age, Survivors, and
An alternative approach for the key assumption of life insurers and pension funds
 2018 An alternative approach for the key assumption of life insurers and pension funds EMBEDDING TIME VARYING EXPERIENCE FACTORS IN PROJECTION MORTALITY TABLES AUTHORS: BIANCA MEIJER JANINKE TOL Abstract
Public Service Shared Risk Plan Actuarial Valuation Report as at January 1, 2016
 Public Service Shared Risk Plan Actuarial Valuation Report as at January 1, 2016 Registration number: Canada Revenue Agency: #0305839 NB Superintendent of Pensions: #0305839 Report prepared July 2016 Table
Her Majesty the Queen in Right of Canada (2017) All rights reserved
 All rights reserved") Her Majesty the Queen in Right of Canada (2017) All rights reserved All requests for permission to reproduce this document or any part thereof shall be addressed to the Department of Finance Canada. Cette
Her Majesty the Queen in Right of Canada (2017) All rights reserved All requests for permission to reproduce this document or any part thereof shall be addressed to the Department of Finance Canada. Cette
Last Revised: November 27, 2017
 BRIEF SUMMARY of the Methods Protocol for the Human Mortality Database J.R. Wilmoth, K. Andreev, D. Jdanov, and D.A. Glei with the assistance of C. Boe, M. Bubenheim, D. Philipov, V. Shkolnikov, P. Vachon
Termination, Retirement and SMP Experience Study for the Public Service Pension Plan
 Termination, Retirement and SMP Experience Study for the Public Service Pension Plan June 2015 Risk. Reinsurance. Human Resources Table of Contents Executive Summary... 1 Section 1: Introduction... 2 Section
MERCER METROPOLITAN TORONTO POLICE BENEFIT FUND REPORT ON THE ACTUARIAL VALUATION FOR FUNDING PURPOSES AS AT DECEMBER 31, 2014
 GM4.6 MERCER Attachment 1 TALENT HEALTH RETIREMENT INVESTMENTS METROPOLITAN TORONTO POLICE BENEFIT FUND REPORT ON THE ACTUARIAL VALUATION FOR FUNDING PURPOSES AS AT DECEMBER 31, 2014 APRIL 2015 Financial
Contents. 1. Summary of Results ($000) Introduction...3 Report on the Actuarial Valuation as at July 1,
 Introduction...3 Report on the Actuarial Valuation as at July 1,") Contents 1. Summary of Results ($000)...1 2. Introduction...3 as at July 1, 2003...3 3. Financial Position of the Plan...6 Valuation Results Going-Concern Basis...6 Valuation Results Solvency Basis...7
Contents 1. Summary of Results ($000)...1 2. Introduction...3 as at July 1, 2003...3 3. Financial Position of the Plan...6 Valuation Results Going-Concern Basis...6 Valuation Results Solvency Basis...7
Texas Municipal Retirement System. June 20, Retiree Mortality Study. Joseph Newton Mark Randall. Copyright 2012 GRS All rights reserved.
 Texas Municipal Retirement System Retiree Mortality Study June 20, 2013 Joseph Newton Mark Randall Copyright 2012 GRS All rights reserved. Today s Agenda Mortality Assumption Overview Actuarial Standards
THE UNIVERSITY OF OTTAWA RETIREMENT PENSION PLAN REPORT ON THE ACTUARIAL VALUATION FOR FUNDING PURPOSES AS AT JANUARY 1, 2014
 REPORT ON THE ACTUARIAL VALUATION FOR FUNDING PURPOSES AS AT JANUARY 1, 2014 JUNE 2014 Financial Services Commission of Ontario Registration Number: 0310839 Canada Revenue Agency Registration Number: 0310839
The City of Saint John Shared Risk Plan
 The City of Saint John Shared Risk Plan Actuarial Valuation Report as at January 1, 2015 Report prepared September 2015 Registration Number: Canada Revenue Agency #0269209 NB Superintendent of Pensions
Lapse Experience Under Term-to-100 Insurance Policies
 Research Paper Lapse Experience Under Term-to-100 Insurance Policies Research Committee Individual Life Experience Subcommittee September 2015 Document 215075 Ce document est disponible en français 2015
Stochastic Analysis Of Long Term Multiple-Decrement Contracts
 Stochastic Analysis Of Long Term Multiple-Decrement Contracts Matthew Clark, FSA, MAAA and Chad Runchey, FSA, MAAA Ernst & Young LLP January 2008 Table of Contents Executive Summary...3 Introduction...6
Constructing Two-Dimensional Mortality Improvement Scales for Canadian Pension Plans and Insurers: A Stochastic Modelling Approach
 Research paper Constructing Two-Dimensional Mortality Improvement Scales for Canadian Pension Plans and Insurers: A Stochastic Modelling Approach Prepared by: Johnny Siu-Hang Li Department of Statistics
Public Service Pension Plan Actuarial Valuation as at December 31, Registration number: CRA
 Public Service Pension Plan Actuarial Valuation as at December 31, 2016 Registration number: CRA 0208769 Original Date: July 21, 2017 Revised Date: November 10, 2017 Table of Contents 1. Executive Summary
TACOMA EMPLOYES RETIREMENT SYSTEM. STUDY OF MORTALITY EXPERIENCE January 1, 2002 December 31, 2005
 TACOMA EMPLOYES RETIREMENT SYSTEM STUDY OF MORTALITY EXPERIENCE January 1, 2002 December 31, 2005 by Mark C. Olleman Fellow, Society of Actuaries Member, American Academy of Actuaries taca0384.doc May
Ratio of Projected RP-2000 Rates to RP-2014 Rates Male Healthy Annuitants. Figure 10.3(M)
") Page 34 of 76 Figure 10.2 (M) shows that the male RP-2014 rates are higher than the projected RP-2000 rates at the younger and older Employee ages, but lower than the projected RP-2000 rates between ages
Page 34 of 76 Figure 10.2 (M) shows that the male RP-2014 rates are higher than the projected RP-2000 rates at the younger and older Employee ages, but lower than the projected RP-2000 rates between ages
Good practice when choosing assumptions for defined benefit pension schemes with a special focus on mortality
 Good practice when choosing assumptions for defined benefit pension schemes with a special focus on mortality Consultation document February 2008 www.thepensionsregulator.gov.uk Contents Foreword... 3
Projection Assumption Guidelines
 Projection Assumption Guidelines Institut québécois de planification financière (IQPF) Financial Planning Standards Council (FPSC) Nathalie Bachand, A.S.A., F.Pl. Martin Dupras, A.S.A., F.Pl., M.Fisc.
BBC Pension Scheme. Actuarial valuation as at 1 April June willistowerswatson.com
 BBC Pension Scheme Actuarial valuation as at 1 April 2016 30 June 2017 willistowerswatson.com 1 Summary The main results of the Scheme s actuarial valuation are as follows: Technical provisions funding
The CMI Mortality Projections Model
 Presentation to the PBSS Colloquium 2011 Gordon Sharp The CMI Mortality Projections Model Edinburgh, 26 September 2011 Agenda Background and overview of the Model Highlights of the research on mortality
Article from. The Financial Reporter. December 2015 Issue 103
 Article from The Financial Reporter December 2015 Issue 103 PBA Corner By Karen Rudolph The views expressed in this article are those of the author and do not necessarily reflect the views of Milliman
Society of Actuaries Finalizes New Mortality Assumptions
 Consulting Retirement Society of Actuaries Finalizes New Mortality Assumptions The Financial and Strategic Implications for Pension Plan Sponsors November 2014 Risk. Reinsurance. Human Resources. Highlights
Final Standards. Final Standards Practice-Specific Standards for Insurance (Part 2000) Actuarial Standards Board. February 2017.
 Actuarial Standards Board. February 2017.") Final Standards Final Standards Practice-Specific Standards for Insurance (Part 2000) Actuarial Standards Board February 2017 Document 217014 Ce document est disponible en français 2017 Actuarial Standards
Final Standards Final Standards Practice-Specific Standards for Insurance (Part 2000) Actuarial Standards Board February 2017 Document 217014 Ce document est disponible en français 2017 Actuarial Standards
Research Paper. Settlement Cost Compared to Going Concern Funding Targets. Analysis of Pension Plans Registered in Ontario.
 Research Paper Settlement Cost Compared to Going Concern Funding Targets Analysis of Pension Plans Registered in Ontario Doug Chandler Canadian Retirement Research Actuary Society of Actuaries February
SUBMISSION BY THE CANADIAN INSTITUTE OF ACTUARIES *** COMMENTS ON THE REGULATION AMENDING THE REGULATION RESPECTING SUPPLEMENTAL PENSION PLANS
 Translation SUBMISSION BY THE CANADIAN INSTITUTE OF ACTUARIES TO THE RÉGIE DES RENTES DU QUÉBEC *** COMMENTS ON THE REGULATION AMENDING THE REGULATION RESPECTING SUPPLEMENTAL PENSION PLANS NOVEMBER 9,
Pricing of Life Insurance and Annuity Products
 Actuarial Standard of Practice No. 54 Pricing of Life Insurance and Annuity Products Developed by the Life Insurance and Annuity Pricing Task Force of the Life Committee of the Actuarial Standards Board
August 4, Debbie Lyon Superintendent of Pensions The Manitoba Pension Commission York Avenue Winnipeg, MB R3C OP8
 August 4, 2009 Debbie Lyon Superintendent of Pensions The Manitoba Pension Commission 1004-401 York Avenue Winnipeg, MB R3C OP8 Dear Ms Lyon: The Canadian Institute of Actuaries (CIA) is pleased to be
Sensitivity Analysis to Illustrate the Effect of Adverse Deviations for Pension Plan Actuarial Valuations
 Draft of Educational Note Sensitivity Analysis to Illustrate the Effect of Adverse Deviations for Pension Plan Actuarial Valuations Committee on Pension Plan Financial Reporting April 2009 Document 209033
POLICYHOLDER BEHAVIOR IN THE TAIL UL WITH SECONDARY GUARANTEE SURVEY 2012 RESULTS Survey Highlights
 POLICYHOLDER BEHAVIOR IN THE TAIL UL WITH SECONDARY GUARANTEE SURVEY 2012 RESULTS Survey Highlights The latest survey reflects a different response group from those in the prior survey. Some of the changes
Teachers Pension and Annuity Fund of New Jersey. Experience Study July 1, 2006 June 30, 2009
 Teachers Pension and Annuity Fund of New Jersey Experience Study July 1, 2006 June 30, 2009 by Richard L. Gordon Scott F. Porter December, 2010 TABLE OF CONTENTS PAGE SECTION I EXECUTIVE SUMMARY 1 INTRODUCTION
American Academy of Actuaries Life Reserve Working Group - VM-20 Mortality Section
 VM-20_111006_012 Life Actuarial (A) Task Force Amendment Proposal Form* 1. Identify yourself, your affiliation and a very brief description (title) of the issue. American Academy of Actuaries Life Reserve
Canadian Institute of Actuaries Institut Canadien des Actuaires MEMORANDUM
 Canadian Institute of Actuaries Institut Canadien des Actuaires MEMORANDUM TO: FROM: All Life Insurance Practitioners Simon Curtis, Chairperson Committee on Life Insurance Financial Reporting DATE: October
Mortality Rates Estimation Using Whittaker-Henderson Graduation Technique
 MATIMYÁS MATEMATIKA Journal of the Mathematical Society of the Philippines ISSN 0115-6926 Vol. 39 Special Issue (2016) pp. 7-16 Mortality Rates Estimation Using Whittaker-Henderson Graduation Technique
Employment Benefits: Discount Rate Guidance in Section PS 3250
 Invitation to Comment Employment Benefits: Discount Rate Guidance in Section PS 3250 November 2017 COMMENTS TO PSAB MUST BE RECEIVED BY MARCH 9, 2018 An online form has been posted with this document to