Consolidated Financial Statements. With Independent Auditors Report Thereon
|
|
|
- Dortha Cole
- 6 years ago
- Views:
Transcription
1 ( ) Türkiye Garanti Bankası Anonim Şirketi And Its Financial Affiliates Consolidated Financial Statements As of and For the Year Ended 31 December 2017 ( and Related Disclosures and Footnotes ) With Independent Auditors Report Thereon 31 January 2018 This report contains Independent Auditors Report comprising 5 pages and; "Consolidated Financial Statements and Related Disclosures and Footnotes comprising 155 pages.


2

3
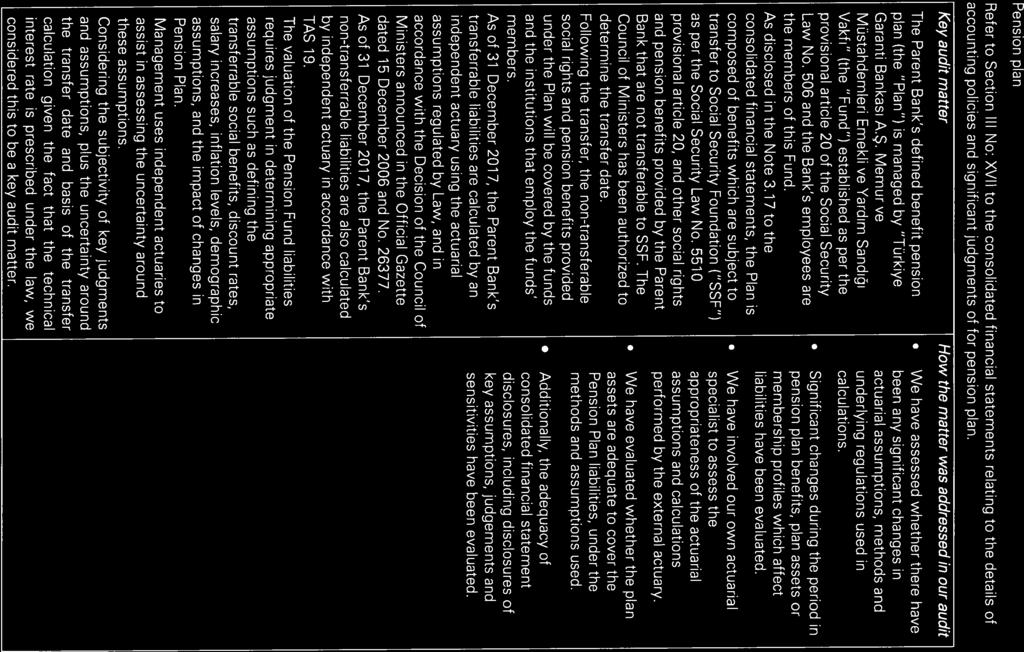
4
5


6
7 ( and Related Disclosures and Footnotes ) TÜRKİYE GARANTİ BANKASI ANONİM ŞİRKETİ AND ITS FINANCIAL AFFILIATES CONSOLIDATED FINANCIAL REPORT AS OF AND FOR THE YEAR ENDED 31 DECEMBER 2017 Levent Nispetiye Mah.Aytar Cad. No:2 Beşiktaş Istanbul Telephone: Fax: investorrelations@garanti.com.tr The consolidated financial report for the year-end prepared in accordance with the communiqué of Financial Statements to be Announced to Public by Banks as regulated by Banking Regulation and Supervision Agency, is comprised of the following sections: 1. General Information about Parent Bank 2. Consolidated Financial Statements of Parent Bank 3. Accounting Policies 4. Consolidated Financial Position and Results of Operations, and Risk Management Applications of Group 5. Disclosures and Footnotes on Consolidated Financial Statements 6. Other Disclosures 7. Independent Auditors Report The consolidated affiliates and structured entities in the scope of this consolidated financial report are the followings: Affiliates 1. Garanti Bank International NV 2.Garanti Emeklilik ve Hayat AŞ 3. Garanti Holding BV 4. Garanti Finansal Kiralama AŞ 5.Garanti Faktoring AŞ 6.Garanti Yatırım Menkul Kıymetler AŞ 7.Garanti Portföy Yönetimi AŞ Structured Entities 1.Garanti Diversified Payment Rights Finance Company 2.RPV Company
8 The consolidated financial statements and related disclosures and footnotes that were subject to independent audit, are prepared in accordance with the Regulation on Accounting Applications for Banks and Safeguarding of Documents, Turkish Accounting Standards, Turkish Financial Reporting Standards and the related statements and guidances and in compliance with the financial records of our Bank and, unless stated otherwise, presented in thousands of Turkish Lira (TL). Süleyman Sözen Ali Fuat Erbil Aydın Güler Aylin Aktürk Board of Directors Chairman General Manager Executive Vice President Coordinator Responsible of Financial Reporting Javier Bernal Dionis Audit Committee Member Jorge Saenz - Azcunaga Carranza Audit Committee Member The authorized contact person for questions on this financial report: Name-Surname/Title: Handan SAYGIN/Senior Vice President of Investor Relations Phone no: Fax no:
9 SECTION ONE Page No: General Information I. History of parent bank including its incorporation date, initial legal status, amendments to legal status 1 II. Parent bank s shareholder structure, management and internal audit, direct and indirect shareholders, change in shareholder structure during the year and information on its risk group 1 III. Information on parent bank s board of directors chairman and members, audit committee members, chief executive officer, executive vice presidents and their responsibilities and, if any, shareholdings in the bank 2 IV. Information on parent bank s qualified shareholders 3 V. Summary information on parent bank s activities and services 3 VI. Information on application differences between consolidation practices as per the Regulation on Preparation of Consolidated Financial Statements of Banks as per the Turkish Accounting Standards, and entities subject to full or proportional consolidation or deducted from equity or not subject to any of these three methods 3 VII. Current or likely actual or legal barriers to immediate transfer of equity or repayment of debts between parent bank and its affiliates 3 SECTION TWO Consolidated Financial Statements I. Consolidated balance sheet-assets 4 II. Consolidated balance sheet-liabilities 5 III. Consolidated off-balance sheet items 6 IV. Consolidated income statement 7 V. Consolidated statement of income/expense items accounted under shareholders equity 8 VI. Consolidated statement of changes in shareholders equity 9 VII. Consolidated statement of cash flows 10 SECTION THREE Accounting Policies I. Basis of presentation 11 II. Strategy for use of financial instruments and foreign currency transactions 11 III. Information on consolidated affiliates 12 IV. Forwards, options and other derivative transactions 13 V. Interest income and expenses 14 VI. Fees and commissions 15 VII. Financial assets 15 VIII. Impairment of financial assets 16 IX. Netting and derecognition of financial instruments 16 X. Repurchase and resale agreements and securities lending 17 XI. Assets held for sale, assets of discontinued operations and related liabilities 17 XII. Goodwill and other intangible assets 17 XIII. Tangible assets 18 XIV. Leasing activities 19 XV. Provisions and contingent liabilities 20 XVI. Contingent assets 20 XVII. Liabilities for employee benefits 20 XVIII. Insurance technical reserves and technical income and expense 22 XIX. Taxation 22 XX. Funds borrowed 25 XXI. Share issuances 25 XXII. Confirmed bills of exchange and acceptances 25 XXIII. Government incentives 25 XXIV. Segment reporting 25 XXV. Profit reserves and profit appropriation 26 XXVI. Earnings per share 27 XXVII. Related parties 27 XXVIII. Cash and cash equivalents 27 XXIX. Reclassifications 27 XXX. Other disclosures 27 SECTION FOUR Consolidated Financial Position and Results of Operations and Risk Management I. Consolidated capital 30 II. Consolidated credit risk 41 III. Consolidated currency risk 51 IV. Consolidated interest rate risk 54 V. Consolidated position risk of equity securities 57 VI. Consolidated liquidity risk 58 VII. Consolidated leverage ratio 65 VIII. Fair values of financial assets and liabilities 66 IX. Transactions carried out on behalf of customers and items held in trust 67 X. Risk management objectives and policies 68 SECTION FIVE Disclosures and Footnotes on Consolidated Financial Statements I. Consolidated assets 93 II. Consolidated liabilities 122 III. Consolidated off-balance sheet items 132 IV. Consolidated income statement 137 V. Consolidated statement of changes in shareholders equity 144 VI. Consolidated statement of cash flows 145 VII. Related party risks 147 and foreign representative offices of parent bank VIII. IX. Domestic, foreign and off-shore branches or equity investments, Matters arising subsequent to balance sheet date SECTION SIX Other Disclosures on Activities I. Information on international risk ratings 152 II. Dividends 154 III. Other disclosures 154 SECTION SEVEN Independent Auditors Report I. II. Disclosure on independent auditors report Disclosures and footnotes prepared by independent auditors
10 for the Year Ended 31 December General Information 1.1 History of parent bank including its incorporation date, initial legal status, amendments to legal status Türkiye Garanti Bankası Anonim Şirketi (the Bank) was established by the decree of Council of Ministers numbered 3/4010 dated 11 April 1946 as a private bank and its Articles of Association was issued in the Official Gazette dated 25 April Following the acquisition on 27 July 2015, Banco Bilbao Vizcaya Argentaria SA (BBVA) s stake in the Bank reached to 39.90% and BBVA become the main shareholder. Accordingly, the Bank was moved to the Foreign Deposit Banks category from the Private Deposit Bank category by the Banking Regulation and Supervision Agency (the BRSA). The Bank provides banking services through 937 domestic branches, 8 foreign branches and three representative offices abroad (31 December 2016: 959 domestic branches, nine foreign branches and three representative offices abroad). The Bank s head office is located in Istanbul. 1.2 Parent bank s shareholder structure, management and internal audit, direct and indirect shareholders, change in shareholder structure during period and information on its risk group As of 31 December 2017, group of companies under BBVA that currently owns 49.85% shares of the Bank, is defined as the BBVA Group (the Group) and it is the main shareholder. On 22 March 2011, BBVA had acquired; shares of the Bank owned by GE Capital Corporation at a total nominal value of TL 781,200 thousands representing 18.60% ownership, and shares of the Bank owned by Doğuş Holding AŞ at a total nominal value of TL 264,188 thousands representing 6.29% ownership. BBVA, purchasing 24.89% shares of the Bank, had joint control on the Bank s management together with group of companies under Doğuş Holding AŞ (the Doğuş Group). Subsequently, on 7 April 2011, BBVA had acquired shares at a nominal value of TL 5,032 thousands and increased its ownership in the Bank s share capital to 25.01%. In accordance with the terms of the agreement between BBVA and the Doğuş Group which was previously disclosed on 19 November 2014, the sale of shares representing 14.89% of the share capital of the Bank with a face value of TL 625,380 thousands and shares by the Doğuş Group to BBVA, was completed on 27 July Following the acquisition, BBVA s stake in the Bank reached to 39.90% and BBVA became the main shareholder. The Bank was moved to Foreign Deposit Banks category from Private Deposit Bank category by the BRSA. On 21 February 2017, BBVA agreed with Doğuş Group to acquire shares at a nominal value of TL 417,900 thousands representing 9.95% ownership and on 22 March 2017 in accordance with the terms of the agreement share transfer had been finalized. After the share transfer BBVA s interest in the share capital of the Bank is at 49.85%. As of balance sheet date, the Doğuş Group s interest in the share capital of the Bank is at 0.05%. BBVA Group BBVA is operating for more than 150 years, providing variety of wide spread financial and nonfinancial services to 70 million retail and commercial customers. The Group's headquarter is in Spain, where the Group has concrete leadership in retail and commercial markets. BBVA adopting innovative, and customer and community oriented management style, besides banking, operates in insurance sector in Europe and portfolio management, private banking and investment banking in global markets. 1
11 for the Year Ended 31 December 2017 BBVA that owns a bank being the largest financial institution in Mexico and the market leader in South America, operates in more than 35 countries with more than 130 thousand employees. 1.3 Information on parent bank s board of directors chairman and members, audit committee members, chief executive officer, executive vice presidents and their responsibilities and, if any, shareholdings in the bank Board of Directors Chairman and Members: Experience in Name and Surname Responsibility Appointment Date Education Banking and Business Administration Süleyman Sözen Chairman University 35 years Sait Ergun Özen Member University 30 years Jorge Saenz Azcunaga Carranza Vice Chairman Independent Member and Member University 23 years of Audit Committee Dr. Muammer Cüneyt Sezgin Member PhD 29 years Belkıs Sema Yurdum Independent Member University 37 years Jaime Saenz de Tejada Pulido Member University 24 years Javier Bernal Dionis Independent Member and Member of Audit Committee Master 27 years Ali Fuat Erbil Member and CEO PhD 25 years Rafael Salinas Martinez de Lecea Member Master 27 years Ricardo Gomez Barredo Member Master 25 years CEO and Executive Vice Presidents: Experience in Name and Surname Responsibility Appointment Date Education Banking and Business Administration Ali Fuat Erbil CEO PhD 25 years Gökhan Erün EVP-Corporate Banking and Treasury Deputy CEO Master 23 years Halil Hüsnü Erel EVP-Technology, Operation Center, Marketing and Business Development University 42 years Avni Aydın Düren EVP-Legal Services and Collection Master 23 years Betül Ebru Edin EVP-Project Finance University 23 years Didem Başer EVP-Digital Banking Master 22 years Recep Baştuğ EVP-Commercial Banking University 27 years Osman Nuri Tüzün EVP- Human Resources and Support Services Master 25 years Aydın Güler EVP-Finance and Accounting University 27 years Ali Temel Head of Credit Risk Management University 27 years Mahmut Akten EVP-Retail Banking Master 17 years Cemal Onaran EVP-SME Banking University 26 years Gökhan Erün resigned his position as EVP responsible from Corporate Banking and Treasury and Deputy CEO on 15 January As of 31 January 2018, Betül Ebru Edin s responsibility was revised as EVP responsible from Corporate Banking, Treasury and Project Finance and Didem Başer s responsibility was revised as EVP responsible from Digital Banking, Customer Experience, Corporate Brand Management and Marketing Communication. The top management listed above does not hold any material unquoted shares of the Bank. 2
12 for the Year Ended 31 December Information on parent bank s qualified shareholders Paid-in Unpaid Company Shares Ownership Capital Portion Banco Bilbao Vizcaya Argentaria SA 2,093, % 2,093,700 - Doğuş Holding AŞ 2, % 2,107 - According to the decision made at the General Assembly of Founder Shares Owners and the Extraordinary General Shareholders meetings held on 13 June 2008, the Bank repurchased all the 370 founder share-certificates issued in order to redeem and exterminate them, subsequent to the permissions obtained from the related legal authorities, at a value of TL 3,876 thousands each in accordance with the report prepared by the court expert and approved by the Istanbul 5 th Commercial Court of First Instance. A total payment of TL 1,434,233 thousands has been made to the owners of 368 founder share-certificates from extraordinary reserves, and the value of remaining 2 founder share-certificates has been blocked in the bank accounts. Subsequent to these purchases, the clauses 15, 16 and 45 of the Articles of Association of the Bank have been revised accordingly. 1.5 Summary information on parent bank s activities and services Activities of the Bank as stated at the third clause of its Articles of Association are as follows: All banking operations, Participating in, establishing, and trading the shares of enterprises at various sectors within the limits setforth by the Banking Law; Providing attorneyship, insurance agency, brokerage and freight services in relation with banking activities, Purchasing/selling debt securities, treasury bills, government bonds and other share certificates issued by Turkish government and other official and private institutions, Developing economical and financial relations with foreign organizations, Dealing with all economic operations in compliance with the Banking Law. The Bank s activities are not limited to those disclosed in that third clause, but whenever the Board of Directors deems any operations other than those stated above to be of benefit to the Bank, it is recommended in the general meeting, and the launching of the related project depends on the decision taken during the General Assembly which results in a change in the Articles of Association and on the approval of this decision by the Ministry of Industry and Commerce. Accordingly, the approved decision is added to the Articles of Association. The Bank is not a specialized bank but deals with all kinds of banking activities. Deposits are the main sources of the lendings to the customers. The Bank grants loans to companies operating in various sectors while aiming to maintain the required level of efficiency. The Bank also grants non-cash loans to its customers; especially letters of guarantee, letters of credit and acceptance credits. 1.6 Information on application differences between consolidation practices as per the Regulation on Preparation of Consolidated Financial Statements of Banks and as per the Turkish Accounting Standards, and entities subject to full or proportional consolidation or deducted from equity or not subject to any of these three methods As per the Regulation on Preparation of Consolidated Financial Statements of Banks, the investments in financial affiliates are subject to consolidation whereas as per the Turkish Accounting Standards, the investments in both financial and non-financial subsidiries are subject to consolidation. There are no investments in entities subject to proportional consolidation or to deduction from equity. 1.7 Current or likely actual or legal barriers to immediate transfer of equity or repayment of debts between parent bank and its affiliates None. 3
13 2 Consolidated Financial Statements ( ) Türkiye Garanti Bankası Anonim Şirketi and Its Financial Affiliates Consolidated Balance Sheet (Statement of Financial Position) At 31 December 2017 THOUSANDS OF TURKISH LIRA (TL) ASSETS Footnotes CURRENT PERIOD PRIOR PERIOD 31 December December 2016 TL FC Total TL FC Total I. CASH AND BALANCES WITH CENTRAL BANK ,635,968 25,967,673 33,603,641 6,723,712 17,227,762 23,951,474 II. FINANCIAL ASSETS AT FAIR VALUE THROUGH PROFIT OR LOSS (Net) ,290, ,913 2,877,813 2,801,058 1,004,483 3,805, Financial assets held for trading 2,290, ,913 2,877,813 2,801,058 1,004,483 3,805, Government securities 803,974 16, ,578 73,157 29, , Equity securities 68,173-68,173 60,379-60, Derivative financial assets held for trading 1,379, ,220 1,946,989 2,661, ,126 3,613, Other securities 38,984 3,089 42,073 5,935 22,865 28, Financial assets valued at fair value through profit or loss Government securities Equity securities Loans Other securities III. BANKS ,010,727 18,459,616 19,470,343 1,214,509 15,666,535 16,881,044 IV. INTERBANK MONEY MARKETS 3,353-3,353 22, , , Interbank money market placements Istanbul Stock Exchange money market placements , , Receivables from reverse repurchase agreements 3,353-3,353 22,180-22,180 V. FINANCIAL ASSETS AVAILABLE-FOR-SALE (Net) ,222,532 4,055,456 26,277,988 18,497,281 5,486,167 23,983, Equity securities 41, , ,872 40, , , Government securities 21,912, ,591 22,579,220 17,669, ,603 18,392, Other securities 268,143 3,155,753 3,423, ,886 4,585,736 5,372,622 VI. LOANS ,323,034 85,030, ,353, ,985,680 81,423, ,409, Loans 143,274,157 84,718, ,992, ,980,397 81,095, ,075, Loans to bank's risk group ,307 2,141,026 2,662, ,351 1,814,479 2,216, Government securities Other 142,752,850 82,577, ,330, ,578,046 79,280, ,858, Loans under follow-up 5,408, ,871 6,176,985 5,272, ,687 6,124, Specific provisions (-) 4,359, ,075 4,816,312 4,267, ,598 4,791,089 VII. FACTORING RECEIVABLES ,261,812 1,117,956 3,379,768 1,912, ,095 2,851,223 VIII. INVESTMENTS HELD-TO-MATURITY (Net) ,900,962 11,413,578 24,314,540 12,139,123 10,970,573 23,109, Government securities 12,815,088 7,417,468 20,232,556 12,122,339 6,986,465 19,108, Other securities 85,874 3,996,110 4,081,984 16,784 3,984,108 4,000,892 IX. INVESTMENTS IN ASSOCIATES (Net) , ,751 37, , Associates consolidated under equity accounting Unconsolidated associates 35, ,751 37, , Financial investments in associates 31,789-31,789 33,329-33, Non-financial investments in associates 3, ,962 3, ,932 X. INVESTMENTS IN SUBSIDIARIES (Net) ,372 2, , ,236 1, , Unconsolidated financial investments in affiliates Unconsolidated non-financial investments in affiliates 114,372 2, , ,236 1, ,858 XI. INVESTMENTS IN JOINT-VENTURES (Net) Joint-ventures consolidated under equity accounting Unconsolidated joint-ventures Financial investments in joint-ventures Non-financial investments in joint-ventures XII. LEASE RECEIVABLES (Net) ,471,740 4,316,696 5,788,436 1,399,086 4,395,174 5,794, Financial lease receivables 1,740,146 4,730,823 6,470,969 1,655,755 4,843,852 6,499, Operational lease receivables Others Unearned income (-) 268, , , , , ,347 XIII. DERIVATIVE FINANCIAL ASSETS HELD FOR HEDGING PURPOSE , , ,720 79, , , Fair value hedges 89,104 14, ,262 73,946 11,534 85, Cash flow hedges 465, , ,458 5, , , Net foreign investment hedges XIV. TANGIBLE ASSETS (Net) ,910, ,004 4,096,651 3,533, ,088 3,680,621 XV. INTANGIBLE ASSETS (Net) ,016 33, , ,078 31, , Goodwill 6,388-6,388 6,388-6, Other intangibles 339,628 33, , ,690 31, ,265 XVI. INVESTMENT PROPERTY (Net) , , , ,825 XVII. TAX ASSET 436,799 30, , ,330 61, , Current tax asset 6,697 19,069 25, ,657 27, Deferred tax asset ,102 11, , ,651 34, ,342 XVIII. ASSETS HELD FOR SALE AND ASSETS OF DISCONTINUED OPERATIONS (Net) ,000 12, , ,738 13, , Asset held for resale 823,000 12, , ,738 13, , Assets of discontinued operations XIX. OTHER ASSETS ,656, ,869 4,100,751 3,015, ,873 3,725,080 TOTAL ASSETS 204,558, ,773, ,331, ,105, ,016, ,121,939 The accompanying notes are an integral part of these consolidated financial statements. 4
14 ( ) Türkiye Garanti Bankası Anonim Şirketi and Its Financial Affiliates Consolidated Balance Sheet (Statement of Financial Position) At 31 December 2017 LIABILITIES AND SHAREHOLDERS' EQUITY Footnotes 31 December December 2016 TL FC Total TL FC Total I. DEPOSITS ,203, ,569, ,773,560 76,025, ,664, ,689, Deposits from bank's risk group , , , , ,759 1,146, Other 87,844, ,046, ,891,604 75,350, ,193, ,543,334 II. DERIVATIVE FINANCIAL LIABILITIES HELD FOR TRADING ,381, ,535 2,898,822 2,639,416 1,074,569 3,713,985 III. FUNDS BORROWED ,134,258 45,970,461 47,104,719 3,127,679 43,454,174 46,581,853 IV. INTERBANK MONEY MARKETS 13,886,785 4,751,071 18,637,856 10,704, ,168 11,230, Interbank money market takings 11,712,429 3,892,365 15,604,794 2,501, ,501, Istanbul Stock Exchange money market takings 1,286,649-1,286, , , Obligations under repurchase agreements , ,706 1,746,413 7,287, ,081 7,813,821 V. SECURITIES ISSUED (Net) ,162,999 12,631,453 20,794,452 5,871,646 11,874,002 17,745, Bills 4,003,253-4,003,253 2,240,063-2,240, Asset backed securities Bonds 4,159,746 12,631,453 16,791,199 3,631,583 11,874,002 15,505,585 VI. FUNDS Borrower funds Other VII. MISCELLANEOUS PAYABLES ,585, ,775 10,376,346 8,260,088 1,079,660 9,339,748 VIII. OTHER EXTERNAL FUNDINGS PAYABLE 2,191, ,803 3,080,350 2,204, ,216 3,170,339 IX. FACTORING PAYABLES X. LEASE PAYABLES (Net) Financial lease payables Operational lease payables Others Deferred expenses (-) XI. DERIVATIVE FINANCIAL LIABILITIES HELD FOR HEDGING PURPOSE , , ,826 26, , , Fair value hedges 6, , ,755 26, , , Cash flow hedges 1,025 3,046 4,071-66,370 66, Net foreign investment hedges XII. PROVISIONS ,453, ,180 6,848,102 4,851, ,009 5,032, General provisions 3,597,720 75,949 3,673,669 3,118,954 96,579 3,215, Restructuring reserves Reserve for employee benefits 822,958 86, , ,204 20, , Insurance technical provisions (Net) 355,827 34, , ,375 32, , Other provisions 1,677, ,342 1,874, ,331 31, ,040 XIII. TAX LIABILITY ,103,072 60,090 1,163, ,400 11, , Current tax liability 1,103,072 45,725 1,148, ,400 11, , Deferred tax liability - 14,365 14, XIV. LIABILITIES FOR ASSETS HELD FOR SALE AND ASSETS OF DISCONTINUED OPERATIONS (Net) Asset held for sale Assets of discontinued operations XV. SUBORDINATED DEBTS ,849,471 2,849, XVI. SHAREHOLDERS' EQUITY ,142, ,866 41,606,001 35,540, ,254 35,795, Paid-in capital 4,200,000-4,200,000 4,200,000-4,200, Capital reserves 1,320, ,555 1,526,847 1,461,875 12,494 1,474, Share premium 11,880-11,880 11,880-11, Share cancellation profits Securities value increase fund (425,824) 108,010 (317,814) (484,900) (58,725) (543,625) Revaluation surplus on tangible assets 1,722,980 24,889 1,747,869 1,685,290 5,772 1,691, Revaluation surplus on intangible assets Revaluation surplus on investment property Bonus shares of associates, affiliates and joint-ventures Hedging reserves (effective portion) (617,941) 73,656 (544,285) (419,123) 65,447 (353,676) Revaluation surplus on assets held for sale and assets of discontinued operations Other capital reserves 628, , , , Profit reserves 28,967, ,311 29,224,949 24,505, ,760 24,748, Legal reserves 1,368,395 23,864 1,392,259 1,241,962 29,560 1,271, Status reserves Extraordinary reserves 25,901,360-25,901,360 22,185,729 6,576 22,192, Other profit reserves 1,697, ,447 1,931,330 1,077, ,624 1,284, Profit or loss 6,332,056-6,332,056 5,105,291-5,105, Prior periods profit/loss Current period net profit/loss 6,332,056-6,332,056 5,105,291-5,105, Minority interest 322, , , ,808 TOTAL LIABILITIES AND SHAREHOLDERS' EQUITY 174,252, ,078, ,331, ,718, ,403, ,121,939 The accompanying notes are an integral part of these consolidated financial statements. THOUSANDS OF TURKISH LIRA (TL) CURRENT PERIOD PRIOR PERIOD 5
15 ( ) Türkiye Garanti Bankası Anonim Şirketi and Its Financial Affiliates Consolidated Off-Balance Sheet Items At 31 December 2017 THOUSANDS OF TURKISH LIRA (TL) CURRENT PERIOD PRIOR PERIOD OFF-BALANCE SHEET ITEMS Footnotes 31 December December 2016 TL FC Total TL FC Total A. OFF-BALANCE SHEET COMMITMENTS AND CONTINGENCIES (I+II+III) 189,643, ,352, ,996, ,878, ,614, ,492,566 I. GUARANTEES AND SURETIES ,424,930 36,770,464 56,195,394 17,138,984 38,946,496 56,085, Letters of guarantee 19,405,859 20,283,642 39,689,501 17,111,138 20,901,575 38,012, Guarantees subject to State Tender Law - 981, ,914-1,029,481 1,029, Guarantees given for foreign trade operations 1,842, ,767 2,238,586 2,134, ,444 2,466, Other letters of guarantee 17,563,040 18,905,961 36,469,001 14,977,068 19,539,650 34,516, Bank acceptances 14,273 1,536,377 1,550,650 27,846 2,099,488 2,127, Import letter of acceptance 14,273 1,536,377 1,550,650 27,846 2,099,488 2,127, Other bank acceptances Letters of credit 4,798 14,764,718 14,769,516-15,754,367 15,754, Documentary letters of credit Other letters of credit 4,798 14,764,718 14,769,516-15,754,367 15,754, Guaranteed prefinancings Endorsements Endorsements to the Central Bank of Turkey Other endorsements Underwriting commitments Factoring related guarantees Other guarantees - 185, , , , Other sureties II. COMMITMENTS 44,879,991 12,711,898 57,591,889 39,448,303 10,404,168 49,852, Irrevocable commitments 44,532,503 7,539,747 52,072,250 39,310,120 5,369,433 44,679, Asset purchase and sale commitments 2,205,254 5,742,735 7,947, ,021 3,752,040 3,956, Deposit purchase and sale commitments ,040 74, Share capital commitments to associates and affiliates - 6,443 6,443-5,266 5, Loan granting commitments 9,468,364 1,231,571 10,699,935 6,967,401 1,037,722 8,005, Securities issuance brokerage commitments Commitments for reserve deposit requirements Commitments for cheque payments 3,797,901-3,797,901 3,555,087-3,555, Tax and fund obligations on export commitments 31,365-31,365 24,000-24, Commitments for credit card limits 29,020, ,288 29,542,049 27,849, ,443 28,226, Commitments for credit cards and banking services related promotions 8,273-8,273 8,708-8, Receivables from "short" sale commitments on securities Payables from "short" sale commitments on securities Other irrevocable commitments ,710 38, , , , Revocable commitments 347,488 5,172,151 5,519, ,183 5,034,735 5,172, Revocable loan granting commitments 156,116 4,796,577 4,952,693 23,040 4,653,740 4,676, Other revocable commitments 191, , , , , ,138 III. DERIVATIVE FINANCIAL INSTRUMENTS ,338, ,870, ,209, ,290, ,263, ,554, Derivative financial instruments held for risk management 7,255,392 38,177,132 45,432,524 10,145,282 34,208,867 44,354, Fair value hedges 5,452,476 12,916,842 18,369,318 7,307,595 14,701,424 22,009, Cash flow hedges 1,802,916 25,260,290 27,063,206 2,837,687 19,507,443 22,345, Net foreign investment hedges Trading derivatives 118,083, ,693, ,776,993 96,145, ,054, ,200, Forward foreign currency purchases/sales 15,358,246 19,209,970 34,568,216 11,723,664 16,145,274 27,868, Forward foreign currency purchases 5,427,014 11,771,096 17,198,110 3,833,951 10,111,495 13,945, Forward foreign currency sales 9,931,232 7,438,874 17,370,106 7,889,713 6,033,779 13,923, Currency and interest rate swaps 88,816, ,895, ,712,528 62,027, ,439, ,466, Currency swaps-purchases 32,307,469 73,063, ,371,319 23,993,140 55,350,676 79,343, Currency swaps-sales 55,840,060 45,238, ,078,109 37,539,222 41,571,364 79,110, Interest rate swaps-purchases 334,516 17,797,034 18,131, ,324 18,258,692 18,506, Interest rate swaps-sales 334,516 17,797,034 18,131, ,324 18,258,692 18,506, Currency, interest rate and security options 13,831,781 25,562,957 39,394,738 22,338,459 38,228,684 60,567, Currency call options 7,234,150 7,153,660 14,387,810 9,793,681 16,465,095 26,258, Currency put options 6,565,822 8,172,614 14,738,436 12,487,141 14,903,735 27,390, Interest rate call options - 9,247,686 9,247,686-5,927,914 5,927, Interest rate put options - 988, , , , Security call options 9,414-9,414 10,871 44,410 55, Security put options 22,395-22,395 46,766 44,410 91, Currency futures 62,874 92, ,061 37, , , Currency futures-purchases 20,293 44,824 65,117 14,586 80,808 95, Currency futures-sales 42,581 47,363 89,944 22,587 63,943 86, Interest rate futures - 18,879 18, , , Interest rate futures-purchases Interest rate futures-sales - 18,879 18, , , Others 14,055 14,913,516 14,927,571 19,206 8,996,700 9,015,906 B. CUSTODY AND PLEDGED ITEMS (IV+V+VI) 715,477, ,013,443 1,329,491, ,736, ,278,312 1,160,015,231 IV. ITEMS HELD IN CUSTODY 52,856,646 38,573,970 91,430,616 48,564,102 41,691,499 90,255, Customers' securities held 18,138,585-18,138,585 15,065,124-15,065, Investment securities held in custody 15,042,103 16,314,890 31,356,993 16,489,131 17,080,586 33,569, Checks received for collection 16,558,278 3,885,992 20,444,270 14,117,779 3,153,993 17,271, Commercial notes received for collection 2,824, ,585 3,725,171 2,551,368 1,165,068 3,716, Other assets received for collection 98,797 13,830,800 13,929,597 78,792 16,103,427 16,182, Assets received through public offering - 92,625 92,625-85,344 85, Other items under custody 194,297 3,549,078 3,743, ,908 4,103,081 4,364, Custodians V. PLEDGED ITEMS 662,621, ,439,473 1,238,060, ,172, ,586,813 1,069,759, Securities 4,123, ,868 4,384,068 4,588, ,976 4,904, Guarantee notes 36,609,095 16,584,613 53,193,708 37,868,541 14,996,659 52,865, Commodities 14,095-14,095 19,841-19, Warranties - 242, , , , Real estates 159,488, ,578, ,066, ,621,890 92,300, ,922, Other pledged items 462,386, ,772, ,159, ,074, ,767, ,841, Pledged items-depository VI. CONFIRMED BILLS OF EXCHANGE AND SURETIES TOTAL OFF-BALANCE SHEET ITEMS (A+B) 905,121, ,366,413 1,820,487, ,615, ,892,797 1,603,507,797 The accompanying notes are an integral part of these consolidated financial statements. 6
16 ( ) Türkiye Garanti Bankası Anonim Şirketi and Its Financial Affiliates Consolidated Income Statement At 31 December 2017 THOUSANDS OF TURKISH LIRA (TL) CURRENT PERIOD PRIOR PERIOD INCOME AND EXPENSE ITEMS Footnotes 1 January January December December 2016 I. INTEREST INCOME ,360,370 22,617, Interest income on loans 21,912,595 17,577, Interest income on reserve deposits 222, , Interest income on banks 451, , Interest income on money market transactions 14,022 7, Interest income on securities portfolio 4,791,622 3,694, Trading financial assets 41,220 22, Financial assets valued at fair value through profit or loss Financial assets available-for-sale 2,550,023 2,039, Investments held-to-maturity 2,200,379 1,633, Financial lease income 442, , Other interest income 525, ,613 II. INTEREST EXPENSE ,673,800 10,361, Interest on deposits 8,439,849 7,000, Interest on funds borrowed 1,323,169 1,143, Interest on money market transactions 1,309,125 1,098, Interest on securities issued 1,579,644 1,094, Other interest expenses 22,013 25,010 III. NET INTEREST INCOME (I - II) 15,686,570 12,255,733 IV. NET FEES AND COMMISSIONS INCOME 3,860,413 3,275, Fees and commissions received 5,118,766 4,324, Non-cash loans 433, , Others 4,685,578 3,979, Fees and commissions paid 1,258,353 1,049, Non-cash loans 3,868 3, Others 1,254,485 1,045,627 V. DIVIDEND INCOME ,816 9,088 VI. NET TRADING INCOME/LOSSES (Net) (1,842,027) (743,653) 6.1 Trading account income/losses (Net) (324,697) 386, Income/losses from derivative financial instruments (Net) (3,266,721) (925,789) 6.3 Foreign exchange gains/losses (Net) 1,749,391 (204,488) VII. OTHER OPERATING INCOME ,942,284 2,113,576 VIII. TOTAL OPERATING PROFIT (III+IV+V+VI+VII) 19,655,056 16,910,434 IX. PROVISION FOR LOSSES ON LOANS AND OTHER RECEIVABLES (-) ,681,863 3,387,096 X. OTHER OPERATING EXPENSES (-) ,623,756 7,032,388 XI. NET OPERATING PROFIT/LOSS (VIII-IX-X) 8,349,437 6,490,950 XII. INCOME RESULTED FROM MERGERS - - XIII. INCOME/LOSS FROM INVESTMENTS UNDER EQUITY ACCOUNTING - - XIV. GAIN/LOSS ON NET MONETARY POSITION - - XV. PROFIT/LOSS BEFORE TAXES (XI+XII+XIII+XIV) ,349,437 6,490,950 XVI. PROVISION FOR TAXES (±) ,961,463 1,343, Current tax charge 2,284,299 1,035, Deferred tax charge/(credit) (322,836) 307,584 XVII. NET OPERATING PROFIT/LOSS AFTER TAXES (XV±XVI) ,387,974 5,147,759 XVIII. INCOME FROM DISCONTINUED OPERATIONS Income from assets held for sale Income from sale of associates, affiliates and joint-ventures Others - - XIX. EXPENSES FROM DISCONTINUED OPERATIONS (-) Expenses on assets held for sale Expenses on sale of associates, affiliates and joint-ventures Others - - XX. PROFIT/LOSS BEFORE TAXES ON DISCONTINUED OPERATIONS (XVIII-XIX) XXI. PROVISION FOR TAXES OF DISCONTINUED OPERATIONS (±) Current tax charge Deferred tax charge/(credit) - - XXII. NET PROFIT/LOSS AFTER TAXES ON DISCONTINUED OPERATIONS (XX±XXI) XXIII. NET PROFIT/LOSS (XVII+XXII) ,387,974 5,147, Equity holders of the bank 6,332,056 5,105, Minority interest 55,918 42,468 Earnings per Share The accompanying notes are an integral part of these consolidated financial statements. 7
17 ( ) Türkiye Garanti Bankası Anonim Şirketi and Its Financial Affiliates Consolidated Statement of Income/Expense Items Accounted for under Shareholders Equity At 31 December 2017 THOUSANDS OF TURKISH LIRA (TL) INCOME AND EXPENSE ITEMS UNDER SHAREHOLDERS' EQUITY CURRENT PERIOD PRIOR PERIOD 1 January January December December 2016 I. MARKET VALUE GAINS ON AVAILABLE FOR SALE ASSETS ACCOUNTED UNDER "SECURITIES VALUE INCREASE FUND" 256,760 (293,599) II. REVALUATION SURPLUS ON TANGIBLE ASSETS 160,314 12,220 III. REVALUATION SURPLUS ON INTANGIBLE ASSETS - - IV. TRANSLATION DIFFERENCES FOR TRANSACTIONS IN FOREIGN CURRENCIES 674, ,301 V. GAIN/LOSS ON DERIVATIVE FINANCIAL ASSETS HELD FOR CASH FLOW HEDGES (effective portion) 56,034 11,475 VI. GAIN/LOSS ON DERIVATIVE FINANCIAL ASSETS HELD FOR HEDGES OF NET INVESTMENT IN FOREIGN OPERATIONS (effective portion) (291,004) (180,458) VII. EFFECTS OF CHANGES IN ACCOUNTING POLICIES AND CORRECTIONS - - VIII. OTHER INCOME/EXPENSE ITEMS ACCOUNTED UNDER SHAREHOLDERS' EQUITY AS PER TAS (49,496) (58,826) IX. DEFERRED TAXES ON VALUE INCREASES/DECREASES (133,139) 62,489 X. NET INCOME/EXPENSE ITEMS ACCOUNTED DIRECTLY UNDER SHAREHOLDERS' EQUITY (I+II+III+IV+V+VI+VII+VIII+IX) 673,620 12,602 XI. CURRENT PERIOD PROFIT/LOSSES 6,387,974 5,147, Net changes in fair value of securities (transferred to income statement) (30,723) 214, Gains/losses on derivative financial assets held for cash flow hedges, reclassified and recorded in income statement (85,449) (125,301) 1.3 Gains/losses on hedges of net investment in foreign operations, reclassified and recorded in income statement Others 6,504,146 5,058,645 XII. TOTAL PROFIT/LOSS ACCOUNTED FOR THE CURRENT PERIOD (X+XI) 7,061,594 5,160,361 The accompanying notes are an integral part of these consolidated financial statements. 8
18 9 The accompanying notes are an integral part of these consolidated financial statements. ( ) Türkiye Garanti Bankası Anonim Şirketi and Its Financial Affiliates Consolidated Statement of Changes in Shareholders' Equity At 31 December 2017 STATEMENT OF CHANGES IN SHAREHOLDERS' EQUITY PRIOR PERIOD - 1 January-31 December 2016 THOUSANDS OF TURKISH LIRA (TL) Revaluation Revaluation Surplus Shareholders' Securities Surplus on Bonus on Assets Held Equity Inflation Share Current Prior Value Tangible and Shares for Sale and Assets before Total Footnotes Paid-In Adjustment to Share Cancellation Legal Status Extraordinary Other Period Net Period Increase Intangible of Equity Hedging of Discontinued Minority Minority Shareholders' Capital Paid-In Capital Premium Profits Reserves Reserves Reserves Reserves Profit/(Loss) Profit/(Loss) Fund Assets Participations Reserves Operations Interest Interest Equity I. Balances at beginning of the period 4,200, ,554 11,880-1,226,628-19,168, ,943-3,580,901 (283,642) 1,765, (218,120) - 30,977, ,617 31,203,756 II. Correction made as per TAS Effect of corrections Effect of changes in accounting policies III. Adjusted balances at beginning of the period (I+II) 4,200, ,554 11,880-1,226,628-19,168, ,943-3,580,901 (283,642) 1,765, (218,120) - 30,977, ,617 31,203,756 Changes during the period IV. Mergers V. Market value changes of securities (262,279) (262,279) (29) (262,308) VI. Hedging reserves (135,341) - (135,341) - (135,341) 6.1. Cash flow hedge ,025-9,025-9, Hedge of net investment in foreign operations (144,366) - (144,366) - (144,366) VII. Revaluation surplus on tangible assets , ,776-9,776 VIII. Revaluation surplus on intangible assets IX. Bonus shares of associates, affiliates and joint-ventures X. Translation differences ,107-5, , ,483 - (215) - 459, ,301 XI. Changes resulted from disposal of assets (3,442) - 52,208 7, ,296 (89,232) (30,871) - (30,871) XII. Changes resulted from resclassification of assets XIII. Effect of change in equities of associates on bank's equity XIV. Capital increase Cash Internal sources XV. Share issuance XVI. Share cancellation profits XVII. Capital reserves from inflation adjustments to paid-in capital XVIII. Others (27,917) (766) (27,917) (38) (27,955) XIX. Current period net profit/loss ,105, ,105,291 42,468 5,147,759 XX. Profit distribution ,229-2,965, (3,580,901) - 3, (567,000) (1,210) (568,210) Dividends (567,000) (567,000) (1,210) (568,210) Transfers to reserves ,229-2,965, (3,009,178) Others (4,723) - 3, Balances at end of the period (III+IV+V+...+XVIII+XIX+XX) 4,200, ,554 11,880-1,271,522-22,192,305 1,179,839 5,105,291 - (543,625) 1,691, (353,676) - 35,528, ,808 35,795,907 CURRENT PERIOD - 1 January-31 December 2017 I. Balances at beginning of the period 4,200, ,554 11,880-1,271,522-22,192,305 1,179,839-5,105,291 (543,625) 1,691, (353,676) - 35,528, ,808 35,795,907 Changes during the period 5.5 II. Mergers III. Market value changes of securities , , ,818 IV. Hedging reserves (190,648) - (190,648) - (190,648) 4.1. Cash flow hedge ,155-42,155-42, Hedge of net investment in foreign operations (232,803) - (232,803) - (232,803) V. Revaluation surplus on tangible assets , ,903-3,903 VI. Revaluation surplus on intangible assets VII. Bonus shares of associates, affiliates and joint-ventures (35) - - (35) - (35) VIII. Translation differences , , , , ,151 IX. Changes resulted from disposal of assets X. Changes resulted from resclassification of assets XI. Effect of change in equities of associates on bank's equity (11) - XII. Capital increase Cash Internal sources XIII. Share issuance XIV. Share cancellation profits XV. Capital reserves from inflation adjustments to paid-in capital XVI. Others ,656 (65,858) (170,294) (39,496) (73) (39,569) XVII. Current period net profit/loss ,332, ,332,056 55,918 6,387,974 XVIII. Profit distribution ,719-3,511,961 5,738 - (5,105,291) - 221, (1,250,000) (1,500) (1,251,500) Dividends (1,250,000) (1,250,000) (1,500) (1,251,500) Transfers to reserves ,719-3,511, (3,627,680) Others ,738 - (227,611) - 221, Balances at end of the period (I+II+III+...+XVI+XVII+XVIII) 4,200, ,554 11,880-1,392,259-25,901,360 1,787,061 6,332,056 - (317,814) 1,747, (544,285) - 41,283, ,149 41,606,001
19 ( ) Türkiye Garanti Bankası Anonim Şirketi and Its Financial Affiliates Consolidated Statement of Cash Flows At 31 December 2017 STATEMENT OF CASH FLOWS A. CASH FLOWS FROM BANKING OPERATIONS Footnotes THOUSANDS OF TURKISH LIRA (TL) CURRENT PERIOD PRIOR PERIOD 1 January January December December Operating profit before changes in operating assets and liabilities 5.6 8,279,543 5,612, Interests received 24,903,497 20,848, Interests paid (12,001,215) (10,535,351) Dividend received 7,816 9, Fees and commissions received 5,118,766 4,324, Other income 1,577,846 2,166, Collections from previously written-off loans and other receivables 187, , Payments to personnel and service suppliers (6,539,838) (6,016,150) Taxes paid (1,884,033) (1,549,381) Others (3,091,100) (3,846,240) 1.2 Changes in operating assets and liabilities 5.6 (13,152,134) (3,358,704) Net (increase) decrease in financial assets held for trading (755,332) 32, Net (increase) decrease in financial assets valued at fair value through profit or loss - 200, Net (increase) decrease in due from banks and other financial institutions (12,584,956) 4,433, Net (increase) decrease in loans (29,522,295) (32,331,594) Net (increase) decrease in other assets (885,530) (46,229) Net increase (decrease) in bank deposits (2,857,766) (2,473,473) Net increase (decrease) in other deposits 24,718,233 24,964, Net increase (decrease) in funds borrowed 7,545,144 1,977, Net increase (decrease) in matured payables Net increase (decrease) in other liabilities 1,190,368 (114,950) I. Net cash flow from banking operations 5.6 (4,872,591) 2,253,924 B. CASH FLOWS FROM INVESTING ACTIVITIES II. Net cash flow from investing activities 5.6 (1,047,230) 1,149, Cash paid for purchase of associates, affiliates and joint-ventures (179) Cash obtained from sale of associates, affiliates and joint-ventures 1, , Purchases of tangible assets (819,185) (1,020,765) 2.4 Sales of tangible assets 293, , Cash paid for purchase of financial assets available-for-sale, net (10,859,357) (9,706,665) 2.6 Cash obtained from sale of financial assets available-for-sale, net 9,652,673 10,857, Cash paid for purchase of investments held-to-maturity (302,008) (498,479) 2.8 Cash obtained from sale of investments held-to-maturity 985,994 1,186, Others - - C. CASH FLOWS FROM FINANCING ACTIVITIES III. Net cash flow from financing activities 4,582,854 (379,641) 3.1 Cash obtained from funds borrowed and securities issued 22,335,206 8,182, Cash used for repayment of funds borrowed and securities issued (16,500,852) (7,994,001) 3.3 Equity instruments issued Dividends paid (1,251,500) (568,210) 3.5 Payments for financial leases Others - - IV. Effect of change in foreign exchange rate on cash and cash equivalents 597, ,129 V. Net increase/(decrease) in cash and cash equivalents (I+II+III+IV) 5.6 (739,630) 3,951,560 VI. Cash and cash equivalents at beginning of period ,692,142 11,740,582 VII. Cash and cash equivalents at end of period (V+VI) ,952,512 15,692,142 The accompanying notes are an integral part of these consolidated financial statements. 10
20 for the Year Ended 31 December Accounting Policies 3.1 Basis of presentation The Bank prepares its consolidated financial statements in accordance with the BRSA Accounting and Reporting Regulation which includes the regulation on The Procedures and Principles Regarding Banks Accounting Practices and Maintaining Documents published in the Official Gazette dated 1 November 2006 with No , and other regulations on accounting records of banks published by the Banking Regulation and Supervision Board and circulars and pronouncements published by the BRSA and Turkish Accounting Standards published by the Public Oversight Accounting and Auditing Standards Authority for the matters not regulated by the aforementioned legislations. The accompanying consolidated financial statements are prepared in accordance with the historical cost basis except for financial instuments at fair value through profit or loss, financial assets available for sale, real estates and investments in associates and affiliates valued at equity basis of accounting or that are quoted on the stock exchanges which are presented on a fair value basis. New and revised Turkish Accounting Standards effective for annual periods beginning on or after 1 January 2017 have no material effect on the consolidated financial statements, consolidated financial performance and on the Bank s accounting policies and accounting estimates. New and revised Turkish Accounting Standards issued but not yet effective have no material effect on the consolidated financial statements, consolidated financial performance and on the Bank s accounting policies and accounting estimates, except for IFRS9 which will be effective from periods beginning on or after 1 January The Bank continues to work in order to comply with TFRS9 standard, and the related studies are summarized in Note The accounting policies and the valuation principles applied in the preparation of the accompanying consolidated financial statements are explained in Notes 3.2 to Strategy for use of financial instruments and foreign currency transactions Strategy for use of financial instruments The liability side of the balance sheet is intensively composed of short-term deposits in line with the general trend in the banking sector. In addition to deposits, the Bank and its financial affiliates have access to longer-term borrowings via the borrowings from abroad. In order to manage the interest rate risk arising from short-term deposits, the Bank and its financial affiliates are keen on maintaining floating rate instruments such as government bonds with quarterly coupon payments and instruments like credit cards and consumer loans providing regular cash inflows. A portion of the fixed-rate securities and loans, and the bonds of the Bank are hedged under fair value hedges. The fair value risks of such fixed-rate assets and financial liabilities are hedged with interest rate swaps and cross currency swaps. The fair value changes of the hedged fixed-rate financial assets and financial liabilities together with the changes in the fair value of the hedging instruments, namely interest rate swaps and cross currency swaps, are accounted under net trading income/losses in the income statement. At the inception of the hedge and during the subsequent periods, the hedge is expected to achieve the offsetting of changes in fair value attributable to the hedged risk for which the hedge is designated, and accordingly, the hedge effectiveness tests are performed. The Bank may classify its financial assets and liabilities as at fair value through profit or loss at the initial recognition in order to eliminate any accounting inconsistency. The fundamental strategy to manage the liquidity risk that may incur due to short-term structure of funding, is to expand the deposit base through customer-oriented banking philosophy, and to increase customer transactions and retention rates. The widespread and effective branch network, advantage of primary dealership and strong market share in the treasury and capital markets, are the most effective tools in the realisation of this strategy. For this purpose, serving customers by introducing new products and services continuously and reaching the customers satisfaction are very important. 11
21 for the Year Ended 31 December 2017 Another influential factor in the management of the interest and liquidity risk on balance sheet is product diversification both on asset and liability sides. Exchange rate risk, interest rate risk and liquidity risk are controlled and measured by various risk management systems, and the balance sheet is managed under the limits set by these systems and the limits legally required. Asset-liability management and value at risk models, stress tests and scenario analysis are used for this purpose. Purchase and sale of short and long-term financial instruments are allowed within the predetermined limits to generate risk-free return on capital. The foreign currency position is controlled by the equilibrium of a currency basket to eliminate the foreign exchange risk Foreign currency transactions Foreign exchange gains and losses arising from foreign currency transactions are recorded at transaction dates. At the end of the periods, foreign currency assets and liabilities evaluated with the Bank s spot purchase rates for the parent Bank and with the Central Bank of Turkey s spot purchase rates for domestic financial affiliates, and the differences are recorded as foreign exchange gain or loss in the income statement. During the consolidation of foreign affiliates, the assets and liabilities are translated into TL at exchange rates ruling at the balance sheet date, the income and expenses in income statement are translated into TL using monthly average exchange rates. Foreign exchange differences arising from the translation of income and expenses and other equity items, are recognized under other profit reserves of the shareholders equity. The foreign currency risk arising from net investments in foreign affiliates are hedged with longterm foreign currency borrowings and the currency translation differences arising from the conversion of net investments in foreign affiliates and long-term foreign currency borrowings into TL are accounted for other profit reserves and hedging reserves, respectively in equity. 3.3 Information on consolidated affiliates As of 31 December 2017, Türkiye Garanti Bankası Anonim Şirketi and the following financial affiliates are consolidated in the accompanying consolidated financial statements; Garanti Bank International (GBI), Garanti Finansal Kiralama AŞ (Garanti Finansal Kiralama), Garanti Yatırım Menkul Kıymetler AŞ (Garanti Yatırım), Garanti Portföy Yönetimi AŞ (Garanti Portföy), Garanti Emeklilik ve Hayat AŞ (Garanti Emeklilik), Garanti Faktoring AŞ (Garanti Faktoring) and Garanti Holding BV (Garanti Holding). Garanti Finansal Kiralama was established in 1990 to perform financial lease activities and all related transactions and contracts. The company s head office is in Istanbul. The Bank increased its shareholding to 100% through a further acquisition of 0.04% of the company s shares on 21 October Garanti Faktoring was established in 1990 to perform import, export and domestic factoring activities. The company s head office is in Istanbul. The Bank owns 81.84% of Garanti Faktoring shares including the shares acquired in the market, T. İhracat Kredi Bankası AŞ owns 9.78% of the company s shares and the remaining 8.38% shares are held by public. GBI was established in October 1990 to perform banking activities abroad. The head office of this bank is in Amsterdam. It is wholly owned by the Bank. Garanti Yatırım was established in 1991 to perform brokerage activities for marketable securities, valuable papers and documents representing financial values or financial commitments of issuing parties other than securities. The company s head office is in Istanbul. It is wholly owned by the Bank. Garanti Yatırım Ortaklığı AŞ that Garanti Yatırım participated by 3.30%, has been consolidated in the accompanying consolidated financial statements due to the company s right to elect all the members of the board of directors as resulted from its privilege in election of board members. 12
22 for the Year Ended 31 December 2017 In 1992, it was decided to operate life and health branches under a different company and accordingly Garanti Hayat Sigorta AŞ was established. Garanti Hayat Sigorta AŞ was converted into a private pension company in compliance with the legislation early in 2003 and its name was changed as Garanti Emeklilik ve Hayat AŞ. Following the sale transactions that took place on 21 June 2007, the Bank s ownership in Garanti Emeklilik decreased to 84.91%. The head office of this company is in Istanbul. Garanti Portföy was established in June 1997 to manage the customer portfolios by using the capital market products in compliance with the principles and rules of the regulations regarding the company s purpose of establishment and the portfolio management agreements signed with the customers. The company s head office is in Istanbul. It is wholly owned by the Bank. Garanti Holding was established in December 2007 in Amsterdam and all its shares was purchased by the Bank from Doğuş Holding AŞ in May As of 27 January 2011 the consolidated affiliate s legal named changed to Garanti Holding BV from D Netherlands BV. Garanti Diversified Payment Rights Finance Company and RPV Company are structured entities established for the parent Bank s securitization transactions, and consolidated in the accompanying consolidated financial statements. The Bank or any of its affiliates does not have any shareholding interests in these companies. The Bank and its financial affiliates do not consider the bonus shares received through capital increases of their affiliates from their own equities as income in accordance with TAS 18, as such capital increases do not create any differences in the financial position or economic interest of the Bank or its financial affiliates and it is not certain that there is an economic benefit associated with such transactions that will flow to the Bank or its financial affiliates. 3.4 Forwards, options and other derivative transactions As per the Turkish Accounting Standard 39 (TAS 39) Financial Instruments: Recognition and Measurement ; forward foreign currency purchases/sales, swaps, options and futures are classified as either hedging purposes or trading purposes Derivative financial instruments held for trading The derivative transactions mainly consist of foreign currency and interest rate swaps, foreign currency options and forward foreign currency purchase/sale contacts. Derivatives are initially recorded at their fair values. The related transaction costs are recognized in income statement at the date they incur. The changes in their fair values are recorded on balance sheet under derivative financial assets held for trading or derivative financial liabilities held for trading, respectively depending on the fair values being positive or negative. Fair value changes for trading derivatives are recorded under income statement. The spot legs of currency swap transactions are recorded on the balance sheet and the forward legs in the off-balance sheet accounts as commitment. In the initial phase of currency swaps, the, currency exchange transactions to realise at value dates are recorded and followed as irrevocable commitments in the off-balance sheet accounts up to their value dates. Liabilities and receivables arising from the derivative instruments are followed in the off-balance sheet accounts at their contractual values. Embedded derivatives are separated from the host contract and accounted as derivative instruments according to TAS 39 Financial Instruments: Recognition and Measurement in case the related embedded derivative s economic features and risks are not closely related to the host contract, meets the derivative product definition of a different instrument having the same contract conditions with the embedded derivative and the hybrid instrument is not carried at fair value through profit or loss. There are no embedded derivatives separated from the host contracts. 13
23 for the Year Ended 31 December 2017 Credit derivatives are capital market tools designed to transfer credit risk from one party to another. The Bank s credit derivatives portfolio included in the off-balance sheet accounts composes of total return swaps and credit default swaps resulted from protection buying or selling. Credit default swap is a contract, in which the protection seller commits to pay the protection value to the protection buyer in case of certain credit risk events in return for the premium paid by the buyer for the contract. Credit default swaps are valued daily at their fair values. Total return swap is a contract, in which the protection seller commits to make a certain payment and compensate the decreases in market values of the reference assets to the buyer under the condition that the protection buyer will transfer all the cash flows to be created by and the increases in market values of the reference asset. The Bank enters into total return swap contract for the purpose of generating long-term funding Derivative financial instruments held for hedging purpose The Bank and its consolidated financial affiliates enter into interest rate and cross currency swap transactions in order to hedge the changes in fair values of fixed-rate financial instruments. The changes in fair values of derivative financial assets held for fair value hedges are recognised in income/losses from derivative financial instruments. If the hedging is effective, the changes in fair value of the hedged item is presented in statement of financial position together with the fixedrate loan, and in case of the fixed-rate financial assets available for sale, such changes are reclassified from shareholders equity to income statement. The Bank and its consolidated financial affiliates enter into interest rate and cross currency swap transactions in order to hedge the changes in cash flows of the floating-rate financial instruments. While applying cash flow hedge accounting, the effective portion of the changes in the fair value of the hedging instrument is accounted for under hedging reserves in shareholders equity, and the ineffective portion is recognised in income statement. The changes recognized in shareholders equity is removed and included in income statement in the same period when the hedged cash flows effect the income or loss. Effectiveness tests are performed at the beginning of the hedge accounting period and at each reporting period. The effectiveness tests are carried out using the Dollar off-set model and the hedge accounting is applied as long as the test results are between the range of 80%-125% of effectiveness. The hedge accounting is discontinued when the hedging instrument expires, is exercised, sold or no longer effective. When discontinuing fair value hedge accounting, the cumulative fair value changes in carrying value of the hedged item arising from the hedged risk are amortised to income statement under trading account income/loss caption over the maturity of the hedged item from that date of the hedge accounting is discontinued. While expiring, sale, discontinuing cash flow hedge accounting or when no longer effective the cumulative gains/losses recognised in shareholders equity and presented under hedging reserves are continued to be kept in this account. When the cash flows of hedged item incur, the gain/losses accounted for under shareholders equity are recognised in income statement considering the original maturity. 3.5 Interest income and expenses General Interest is recorded according to the effective interest rate method (rate equal to the rate in calculation of present value of future cash flows of financial assets or liabilities) defined in the Turkish Accounting Standard 39 (TAS 39) Financial Instruments: Recognition and Measurement. In case an interest was accrued on a security before its acquisition, the collected interest is divided into two parts as interest before and after the acquisition and only the interest income of the period after the acquisition is recorded as interest income in the financial statements. The accrued interest income on non-performing loans are reversed and subsequently recognised as interest income only when collected. 14
24 for the Year Ended 31 December 2017 Financial lease operations Total of minimum rental payments including interests and principals are recorded under financial lease receivables as gross. The difference, i.e. the interest, between the total of rental payments and the cost of the related tangible asset is recorded under unearned income. When the rent payment incurs, the rent amount is deducted from financial lease receivables ; and the interest portion is recorded as interest income in the income statement. 3.6 Fees and commissions Except for certain fees related with certain banking transactions and recognized when received, fees and commissions received or paid, and other fees and commissions paid to financial institutions are accounted under accrual basis of accounting. The income derived from agreements or asset purchases from real-person or corporate third parties are recognized as income when realized. 3.7 Financial assets Financial assets at fair value through profit or loss Financial assets valued at fair value through profit or loss are valued at their fair values and gain/loss arising on those assets is recorded in the income statement. Interest income earned on trading securities and the difference between their acquisition costs and amortized costs are recorded as interest income in the income statement. The differences between the amortized costs and the fair values of such securities are recorded under trading account income/losses in the income statement. In cases where such securities are sold before their maturities, the gains/losses on such sales are recorded under trading account income/losses. The Bank classifies certain loans and securities issued at their origination dates, as financial assets/liabilities at fair value through profit or loss in compliance with TAS 39. The interest income/expense earned and the difference between the acquisition costs and the amortized costs of financial instruments are recorded under interest income/expense in income statement, the difference between the amortized costs and the fair values of financial instruments are recorded under trading account income/losses in income statement Investments held-to-maturity, financial assets available-for-sale and loans and receivables Financial assets are initially recorded at their purchase costs including the transaction costs. Investments held-to-maturity are financial assets with fixed maturities and pre-determined payment schedules and held by the intent and ability to hold until maturity, excluding originated loans and receivables. There are no financial assets that were previously classified as held-to-maturity but cannot be subject to this classification for two years due to breach of classification principles. In accordance with TAS 39 Financial Instruments: Recognition and Measurement, sale or reclassification to available for sale portfolio of insignificant amount of financial assets, sale or reclassification to available for sale portfolio of financial assets which are close to maturity less than three months, or sale or reclassification to available for sale portfolio of assets as a result of significant increase in the risk weights of held-to-maturity investments used for regulatory risk-based capital purposes will not result in tainting. Following their recognition, investments held-to-maturity are measured at amortized costs using internal rate of return after deducting impairments, if any. Financial assets available-for-sale, are financial assets other than assets held for trading purposes, investments held-to-maturity and originated loans and receivables. Financial assets available-for-sale are measured at their fair values subsequently. However, assets for which fair values could not be determined reliably are valued at amortized costs by using the discounting method with internal rate of return for floating-rate securities; and by using valuation models or discounted cash flow techniques for fixed-rate securities. Unrecognised gain/losses derived from the difference between their fair value and the discounted values are recorded in securities value increase fund under the shareholders equity. In case of sales, the gain/losses arising from fair value measurement accumulated under shareholders equity are recognized in income statement. 15
25 for the Year Ended 31 December 2017 Interests calculated and/or earned by using the effective interest method during holding of financial assets available-for-sale are recorded primarily in interest income. In case of sale of such financial assets available-for-sale before maturity date, the difference between the sales income calculated as difference between the cost in accordance with the Uniform Chart of Accounts and the sale price and the recognized interest income is transferred to trading income/losses. The Bank owns consumer price indexed government bonds (CPI) portfolio. CPI s are valued and accounted according to the effective interest rate method which is calculated according to the real coupon rate and the reference inflation index on the issue date. As it is mentioned in the Undersecretariat of Treasury s Investor Guide of CPI, the reference index used during the calculation of the actual coupon payment amount is the previous two months CPI s. The bank determines its expected inflation rates in compliance with this guide. The estimated inflation rate according to the Central Bank of Turkey and the Bank s expectations, is updated during the year when it is considered necessary. Purchase and sale transactions of securities are accounted at delivery dates. Loans and receivables are financial assets other than those held for trading in short term or generated through providing money, commodity and services to debtors. Loans are financial assets with fixed or determinable payments and not quoted in an active market. Loans and receivables are recognized at cost and measured at amortized cost using the effective interest method. Duties paid, transaction costs and other similar expenses on assets received against such risks are considered as a part of transaction cost and charged to customers. 3.8 Impairment of financial assets Financial asset or group of financial assets are reviewed at each balance sheet date to determine whether there is objective evidence of impairment. If any such indication exists, the Bank estimates the amount of impairment. Impairment loss incurs if, and only if, there is an objective evidence that the expected future cash flows of financial asset or group of financial assets are adversely effected by an event(s) ( loss event(s) ) incurred subsequent to recognition. The losses expected to incur due to future events are not recognized even if the probability of loss is high. If there is an objective evidence that certain loans will not be collected, for such loans; the Bank makes reclassification and provides specific and general allowances in accordance with the Regulation on Identification of and Provision against Non-Performing Loans and Other Receivables (the Provisioning Regulation) published on the Official Gazette no dated 1 November 2006 and TAS. The allowances are recorded in the income statement of the related period. Provisions made during the period are recorded under provision for losses on loans and other receivables. Provisions booked in the prior periods and relased in the current year are recorded under other operating income. 3.9 Netting and derecognition of financial instruments Netting of financial instruments In cases where the fair values of trading securities, securities available-for-sale, securities quoted at the stock exchanges, associates and affiliates are less then their carrying values, a provision for impairment is allocated, and the net value is shown on the balance sheet. Specific allowances for non-performing loan and other receivables are provided in accordance with the Regulation on Identification of and Provision against Non-Performing Loans and Other Receivables. Such allowances are deducted from loans under follow-up on the asset side. Financial assets and liabilities are offset and the net amount is reported in the balance sheet when the Bank and its financial affiliates have legally enforceable rights to offset the recognized amounts and to collect/pay related financial assets and liabilities on a net basis, or there is an intention to realize the asset and settle the liability simultaneously. 16
26 for the Year Ended 31 December Derecognition of financial assets A financial asset is derecognized only when the contractual rights to the cash flows from this asset expire, or when the financial asset and substantially all its risks and rewards of ownership are transferred to another party. If all the risks and rewards of ownership are neither transferred nor retained subtantially and the control of the transferred asset is maintained, the retained interest in asset and associated liability for amounts that may have to be paid, is recognized. If all the risks and rewards of ownership of a transferred financial asset is retained substantially the financial asset is continued to be recognized and a collateralized borrowing for the proceeds received is also recognized. On derecognition of a financial asset in its entirety, the difference between the asset s carrying amount and the sum of the consideration received and receivable and the cumulative gain or loss that had been recognized in other comprehensive income and accumulated in equity is recognized in the income statement. In case an existing financial asset is replaced with another financial asset from the same counterparty where the terms on the initial financial asset are substantially modified, the existing financial asset is derecognized and a new financial asset is recognized. The difference between the carrying values of the respective financial assets is recognized in the income statement Repurchase and resale agreements and securities lending Securities sold under repurchase agreements are recorded on the balance sheet in compliance with the Uniform Chart of Accounts. Accordingly, government bonds and treasury bills sold to customers under repurchase agreements are classified as Investments Subject to Repurchase Agreements and valued based on the management s future intentions, either at market prices or using discounting method with internal rate of return. Funds received through repurchase agreements are classified separately under liability accounts and the related interest expenses are accounted for on an accrual basis. Securities purchased under resale agreements are classified under interbank money markets separately. An income accrual is accounted for the positive difference between the purchase and resale prices earned during the period on such securities. Securities lending transactions are classified under interbank money markets and the related expense accruals are accounted Assets held for sale, assets of discontinued operations and related liabilities According to the Turkish Financial Reporting Standard 5 (TFRS 5) Assets Held for Sale and Discontinued Operations, a tangible asset (or a group of assets to be disposed) classified as asset held for sale is measured at lower of carrying value and fair value less costs to sell. An asset (or a group of assets to be disposed) is regarded as asset held for resale only when the sale is highly probable and the asset (or a group of assets to be disposed) is available for immediate sale in its present condition. For a highly probable sale, there must be a valid plan prepared by the management for the sale of asset including identification of possible buyers and completion of sale process. Furthermore, the asset should be actively in the market at a price consistent with its fair value. Assets held for sale consist of tangible assets that were acquired against non-performing receivables. A discontinued operation is a part of the business classified as sold or held-for-sale. The operating results of the discontinued operations are disclosed separately in income statement. The Bank or its financial affiliates have no discontinued operations Goodwill and other intangible assets The intangible assets consist of goodwill, softwares, intangible rights and other intangible assets. Goodwill and other intangible assets are recorded at cost in accordance with the Turkish Accounting Standard 38 (TAS 38) Intangible Assets. The costs of other intangible assets purchased before 31 December 2004 are restated from the purchasing dates to 31 December 2004, the date the hyperinflationary period is considered to be ended. The intangible assets purchased after this date are recorded at their initial purchase costs. 17
27 for the Year Ended 31 December 2017 As per TAS 38, internally-generated softwares should be recognised as intangible assets if they meet the below listed criterias: - The technical feasibility of completing the intangible asset so that it will be available for use, - Availability of the Bank and its financial affiliates intention to complete and use the intangible asset, - The ability to use the intangible asset, - Clarity in probable future economic benefits to be generated from the intangible asset, - The availability of adequate technical, financial and other resources to complete the development phase and to start using the intangible asset, - The availability to measure reliably the expenditure attributable to the intangible asset during the development phase. The directly attributable development costs of intangible asset are included in the cost of such assets, however the research costs are recognised as expense as incurred. The intangible assets are amortised over their estimated useful lives based on their inflation adjusted costs on a straight-line basis. Goodwill represents the excess of the total acquisition costs over the shares owned in the net assets of the acquired company at the date of acquisition. The net goodwill resulted from the acquisition of the investment and to be included in the consolidated balance sheet, is calculated based on the financial statements of the investee company as adjusted according to the required accounting principles. If any goodwill is computed at consolidation, it is recorded under intangible assets on the asset side of the consolidated balance sheet as an asset. It is assessed to identify whether there is any indication of impairment. If any such indication exists, the necessary provision is recorded as an expense in the income statement. The goodwill is not amortized. Estimated useful lives of the intangible assets except for goodwill, are 3-15 years, and amortisation rates are %. If there is objective evidence of impairment, the asset s recoverable amount is estimated in accordance with the Turkish Accounting Standard 36 (TAS 36) Impairment of Assets and if the recoverable amount is less then the carrying value of the related asset, a provision for impairment loss is provided Tangible assets The cost of the tangible assets purchased before 31 December 2004 are restated from the purchasing dates to 31 December 2004, the date the hyperinflationary period is considered to be ended. The tangible assets purchased after this date are recorded at their historical costs. As of 1 November 2015, changing the existing accounting policy, it has been decided to apply revaluation model for properties recorded under tangible assets instead of cost model in accordance with the Turkish Accounting Standard 16 (TAS 16) Property, Plant and Equipment. Accordingly, for all real estates registered in the ledger, a valuation study was performed by independent expertise firms. If there is objective evidence of impairment, the asset s recoverable amount is estimated in accordance with the Turkish Accounting Standard 36 (TAS 36) Impairment of Assets and if the recoverable amount is less than the carrying value of the related asset, a provision for impairment loss is provided. Gains/losses arising from the disposal of the tangible assets are calculated as the difference between the net book value and the net sale price. 18
28 for the Year Ended 31 December 2017 Maintenance and repair costs incurred for tangible assets, are recorded as expense. There are no restrictions such as pledges, mortgages or any other restriction on tangible assets. The depreciation rates and estimated useful lives of tangible assets are presented below. Depreciation method in use was not changed in the current period. Tangible assets Estimated Useful Lives (Years) Depreciation Rates % Buildings 50 2 Vaults 50 2 Motor Vehicles Other Tangible Assets The depreciation of an asset held for a period less than a full financial year is calculated as a proportion of the full year depreciation charge from the date of acquisition to the financial year end. Useful lives of buildings are reviewed at least once a year and if current estimates are different than previous estimates, then the revised estimates are considered as accounting policy change in accordance with the Turkish Accounting Standard 8 (TAS 8) Accounting Policies, Changes in Accounting Estimates and Errors. Investment properties Land and buildings that are held to earn rentals or for capital appreciation or both rather than for use in production, supply of goods or services, administrative purposes or sale in the ordinary course of business are clasified as investment property. As of 1 November 2015, changing the existing accounting policy, it has been decided to apply fair value model for investment properties instead of cost model in accordance with the Turkish Accounting Standard 40 (TAS 40) Investment Property. Accordingly, for all the investment properties registered in the ledger, a valuation study was performed by independent expertise firms. Fair value changes in investment properties were accounted in the income statement for the period they occurred. Investment properties accounted at fair value are not depreciated Leasing activities Tangible assets acquired through financial leasing are recognized as assets and the related liabilities as lease payables in assets and liabilities, respectively. In the determination of the related asset and liability amounts, the lower of the fair value of the leased assets and the present value of leasing payments is considered. Financial costs on leasing agreements are distributed throughout the lease periods at fixed interest rates. Interest expenses and foreign exchange losses related with financial leasing are accounted in income statement. In cases where leased assets are impaired or the expected future benefits of the assets are less than their book values, the book values of such leased assets are reduced to their net realizable values. Depreciation for assets acquired through financial leases is calculated consistently with the same principle as for the tangible assets. Leases, in which the majority of risks and returns of the related asset belong to the lessor, are classified as operational lease. In operating leases, the rent payments are recognized as expense in income statement in equal amounts over the lease term. 19
29 for the Year Ended 31 December Provisions and contingent liabilities Provisions and contingent liabilities resulted from past events, if it is probable that the commitment will be settled and a reliable estimate can be made for the amount of the obligation, are accounted for in accordance with the Turkish Accounting Standard 37 (TAS 37) Provisions, Contingent Liabilities and Contingent Assets Contingent assets The contingent assets usually arise from unplanned or other unexpected events that give rise to the possibility of an inflow of economic benefits to the Bank or its financial affiliates. If an inflow of economic benefits has become probable, then the contingent asset is disclosed in the footnotes to the financial statements. If it has become virtually certain that an inflow of economic benefits will arise, the asset and the related income are recognized in the financial statements of the related period Liabilities for employee benefits Severance indemnities and short-term employee benefits As per the existing labour law in Turkey, the entities are required to pay certain amounts to the employees retired or fired except for resignations or misbehaviours specified in the Turkish Labour Law. Accordingly, the Bank and its financial affiliates subject to the labour law, reserved for employee severance indemnities in the accompanying financial statements using actuarial method in compliance with the Turkish Accounting Standard 19 (TAS 19) Employee Benefits for all its employees who retired or whose employment is terminated, called up for military service or died. The major actuarial assumptions used in the calculation of the total liability are as follows: 31 December December 2016 Net Effective Discount Rate 3.04% 3.43% Discount Rate 11.70% 11.20% Expected Rate of Salary Increase 9.90% 9.30% Inflation Rate 8.40% 7.80% In the above table, the ranges of effective rates are presented for the Bank and its financial affiliates subject to the labour law, whereas the rates applied for the calculations differ according to the employee s years-in-service. The Bank provided for undiscounted short-term employee benefits earned during the financial periods as per services rendered in compliance with TAS 19. The actuarial gains/losses are recognised under shareholders equity as per the revised TAS19. Retirement benefit obligations A defined benefit plan is a pension plan that defines an amount of pension benefit that an employee and his/her dependents will receive on retirement. The Bank s defined benefit plan (the Plan ) is managed by Türkiye Garanti Bankası Anonim Şirketi Memur ve Müstahdemleri Emekli ve Yardım Sandığı Vakfı (the Fund) established as per the provisional article 20 of the Social Security Law no.506 and the Bank s employees are the members of this Fund. The Plan is funded through contributions of both by the employees and the employer as required by Social Security Law no These contributions are as follows: 31 December 2017 Employer Employee Pension contributions 15.5% 10.0% Medical benefit contributions 6.0% 5.0% 20
30 for the Year Ended 31 December 2017 The Plan is composed of a) the contractual benefits of the employees, which are subject to transfer to Social Security Foundation ( SSF ) as per the Social Security Law no.5754 ( the Law ), and b) other social rights and medical benefits provided by the Bank but not transferable to SSF. a) Benefits transferable to SSF The first paragraph of the provisional article 23 of Banking Law no. 5411, published in the Official Gazette on 1 November 2005, no , which requires the transfer of the members of the funds subject to the provisional article 20 of the Social Security Law no.506, and the persons who are paid under insurance coverage for disablement, old-age and mortality and their right-holders to the SSF within three years following the effective date of the related article was cancelled with the decision of the Constitutional Court dated 22 March 2007, no. 2007/33. The reasoned ruling regarding the cancellation of the Constitutional Court was published in the Official Gazette no , dated 15 December The Constitutional Court stated that the reason behind this cancellation was the possible loss of antecedent rights of the fund members. Following the publication of the verdict, the Turkish Grand National Assembly ( Turkish Parliament ) started to work on the new legal arrangements by taking the cancellation reasoning into account and the articles of the Law no.5754 regulating the principles related with such transfers were accepted and approved by Turkish Parliament on 17 April 2008, and enacted on 8 May 2008 after being published in the Official Gazette no As per the Law, the present value of post-employment benefits as at the transfer date for the fund members to be transferred, are to be calculated by a commission composing from the representatives of the SSF, the Ministry of Finance, the Undersecretariat of Treasury, the Undersecretariat of State Planning Organisation, the BRSA, the Savings Deposit Insurance Fund ( SDIF ), the banks and the funds, by using a technical discount rate of 9.80% taking into account the funds income and expenses as per insurance classes and the transferable contributions and payments of the funds including any salary and income differences paid by the funds above the limits of SSF for such payments. The transfers are to take place within the three-year period starting from 1 January Subsequently, the transfer of the contributors and the persons receiving monthly or regular income and their right-holders from such funds established for employees of the banks, insurance and reinsurance companies, trade chambers, stock markets and unions that are part of these organizations subject to the provisional article 20 of the Social Security Law no.506 to the SSF, has been postponed for two years. The decision was made by the Council of Ministers on 14 March 2011 and published in the Official Gazette no dated 9 April 2011 as per the decision of the Council of Ministers no. 2011/1559, and as per the letter no. 150 of the Ministry of Labor and Social Security dated 24 February 2011 and according to the provisional article 20 of the Social Security and Public Health Insurance Law no On 19 June 2008, Cumhuriyet Halk Partisi ( CHP ) had applied to the Constitutional Court for the cancellation of various articles of the Law including the first paragraph of the provisional Article 20. At the meeting of the Constitutional Court on 30 March 2011, it was decided that the article 73 and the first paragraph of the provisional Article 20 added to the law no are not contradictory to the Constitutional Law, and accordingly the dismissal of the cancellation request has been denied with the majority of votes. Before the completion of two-years period set by the Council of Ministers on 14 March 2011 as explained above, as per the Article no. 51 of the law no. 6645, published in the Official Gazette no dated 23 April 2015, the Article no. 20 of the law no was amended giving the Council of Ministers the authority to determine the date of transfer without defining any timeline. b) Other benefits not transferable to SSF Other social rights and payments provided in the existing trust indenture but not covered through the transfer of the funds members and their right-holders to the SSF, are to be covered by the funds and the institutions that employ the funds members. The actuarial gains/losses are recognised under shareholders equity as per the revised TAS19. The consolidated affiliates do not have retirement benefit plans for their employees. The retirement related benefits of the employees of the consolidated affiliates are subject to the Social Security Institution in case of domestic investees and to the legislations of the related countries in case of foreign investee companies. There are no obligations not reflected in the accompanying consolidated financial statements. 21
31 for the Year Ended 31 December Insurance technical reserves and technical income and expense Insurance technical reserves The Group s insurance subsidiaries adopted TFRS 4, Insurance Contracts ( TFRS 4 ). TFRS 4 requires that all contracts issued by insurance companies be classified as either insurance contracts or investment contracts. Contracts with significant insurance risk are considered insurance contracts. Insurance risk is defined as risk, other than financial risk, transferred from the holder of a contract to the issuer. TFRS 4 permits a company to continue with its previously adopted accounting policies with regard to recognition and measurement of insurance contracts. Only in case of presentation of more reliable figures a change in accounting policy shall be carried out. Contracts issued by insurance companies without significant insurance risk are considered investment contracts. Investment contracts are accounted for in accordance with TAS 39 Turkish Accounting Standard for Financial Instruments: Recognition and Measurement. Insurance technical provisions on the consolidated financial statements consist of, reserve for unearned premiums, reserve for unexpired risk, and provision for outstanding claims and mathematical provisions Insurance technical income and expense In insurance companies, premium income is obtained subsequent to the share of reinsurers in policy income is diminished. Claims are recorded in expense on accrual basis. Outstanding loss provisions are recognized for the claims reported but not paid yet and for the claims that incurred but not reported. Reinsurers share of claims paid and outstanding loss are offset in these provisions Taxation Corporate tax While the corporate tax rate was at the rate of 20% since 1 January 2016, for all companies, such rate has been set as 22% for the tax bases of the years 2018, 2019, and 2020 based on the legislation of the Amendment on Certain Tax Laws and Other Laws no Furthermore, the Council of Ministers has been authorized to reduce the rate of 22% down to 20%. This rate is applied to tax base which is calculated by adding certain non deductable expenses for tax purposes and deducting certain exemptions (like dividend income) and other deductions on accounting income. If there is no dividend distribution, no further tax charges are made. Dividends paid to the resident institutions and the institutions working through local offices or representatives in Turkey are not subject to withholding tax. As per the decisions no. 2009/14593 and 2009/14594 of the Council of Ministers published in the Official Gazette no dated 3 February 2009, certain duty rates included in the articles no.15 and 30 of the new Corporate Tax Law no.5520 are revised. Accordingly, the withholding tax rate on the dividend payments other than the ones paid to the nonresident institutions generating income in Turkey through their operations or permanent representatives and the resident institutions is 15%. In applying the withholding tax rates on dividend payments to the nonresident institutions and the individuals, the withholding tax rates covered in the related Double Tax Treaty Agreements are taken into account. Appropriation of the retained earnings to capital is not considered as profit distribution and therefore is not subject to withholding tax. The prepaid taxes are calculated and paid at the rates valid for the earnings of the related years. The prepayments can be deducted from the annual corporate tax calculated for the whole year earnings. In accordance with the Turkish tax legislation, the tax losses can be carried forward to offset against future taxable income for up to five years. Tax losses cannot be carried back to offset profits from previous periods. Effective between 1 January 2017 and 4 December 2017, earnings generated through transfer of real estates, equity shares, founders shares, redeemed shares and pre-emption rights owned by the companies being under legal proceedings due to their debts to the banks or liable to the Savings Deposit Insurance Fund or by their guarantors and mortgage providers and earnings generated by the banks through sale of such assets are exempt from corporate tax at the rate of 75%. 22
32 for the Year Ended 31 December 2017 Effective between 1 January 2017 and 4 December 2017, 75% of earnings generated through sale of real estates, equity shares, founders shares, redeemed shares and pre-emption rights held as asset at least for two years by the institutions are exempt from the corporate tax with the conditions that such earnings shall be held in a special reserve account under equity until the end of five years following the year of sale and shall be collected as cash until the end of the following two fiscal years. On the other hand, based on the legislation of the Amendment on Certain Tax Laws and Other Laws no. 7061, effective from 5 December 2017, the aforementioned exemption rate is set as 50% for the earnings generated through sale of real estates and 75% for the earnings generated through sale of other items. Tax applications for foreign branches NORTHERN CYPRUS According to the Corporate Tax Law of the Turkish Republic of Northern Cyprus no.41/1976 as amended, the corporate earnings (including foreign corporations) are subject to a 10% corporate tax and 15% income tax. This tax is calculated based on the income that the taxpayers earn in an accounting period. Tax base is determined by modifying accounting income for certain exclusions and allowances for tax purposes. The corporations cannot benefit from the rights of offsetting losses, investment incentives and amortisation unless they prepare and have certified their balance sheets, income statements and accounting records used for tax calculations by an auditor authorized by the Ministry of Finance. In cases where it is revealed that the earnings of a corporation were not subject to taxation in prior years or the tax paid on such earnings are understated, additional taxes can be charged in the next twelve years following that the related taxation period. The corporate tax returns are filed in the tax administration office in April after following the end of the accounting year to which they relate. The corporate taxes are paid in two equal installments in May and October. MALTA The corporate earnings are subject to a 35% corporate tax. This rate is determined by modifying accounting income for certain exclusions and allowances for tax purposes. The earnings of the foreign corporations branches in Malta are also subject to the same tax rate that the resident corporations in Malta are subject to. The earnings of such branches that are transferred to their head offices are not subject to an additional tax. The taxes payable is calculated by the obligating firm and the calculation is presented in the tax declaration form that is due till the following year s month of November. LUXEMBOURG The corporate earnings are subject to a 21% corporate tax. This rate is determined by modifying accounting income for certain exclusions and allowances for tax purposes. An additional 7% of the calculated corporate income tax is paid as a contribution to unemployment insurance fund. 3% of the taxable income is paid as municipality tax in addition to corporate tax. The municipalities have the right to increase this rate up to 200%-350%. The municipality commerce tax, which the Bank s Luxembourg branch subject to currently is applied as 7.50% of the taxable income. The tax returns do not include any tax amounts to be paid. The tax calculation is done by the tax office and the amount to be paid is declared to corporate through an official letter called Note. The amounts and the payment dates of prepaid taxes are determined and declared by the tax office at the beginning of the taxation period. The corporations whose head offices are outside Luxembourg, are allowed to transfer the rest of their net income after tax following the allocation of 5% of it for legal reserves, to their head offices. Tax applications for foreign financial affiliates THE NETHERLANDS In the Netherlands, corporate income tax is levied at the rate of 20% for tax profits up to EUR 200,000 and 25% for the excess part over this amount on the worldwide income of resident companies, which is determined by modifying accounting income for certain exclusions and allowances for tax purposes for the related year. A unilateral decree for the avoidance of double taxation provides relief for resident companies from Dutch tax on income, such as foreign business 23
33 for the Year Ended 31 December 2017 profits derived through a permanent establishment abroad, if no tax treaty applies. In general, there is an additional dividend tax of 5% computed only on the amounts of dividend distribution at the time of such payments. Under the Dutch taxation system, tax losses can be carried forward to offset against future taxable income for nine years. Tax losses can be carried back to the prior year. Companies must file their tax returns within nine months following the end of the tax year to which they relate, unless the company applies for an extension (normally an additional nine months). Tax returns are open for five years from the date of final assessment of the tax return during which time the tax authorities have the right to audit tax returns, and the related accounting records on which they are based, and may issue re-assessments based on their findings. The corporate income tax for the Germany branch is 30%. ROMANIA The applicable corporate tax rate in Romania is 16%. The taxation system in Romania is continuously developing and is subject to varying interpretations and constant changes, which may become rarely retroactive. In Romania, tax periods remain open for tax audits for seven years. Tax losses can be carried forward to offset against future taxable income for seven years Deferred taxes According to the Turkish Accounting Standard 12 (TAS 12) Income Taxes ; deferred tax assets and liabilities are recognized, using the balance sheet method, on all taxable temporary differences arising between the carrying values of assets and liabilities in the financial statements and their corresponding balances considered in the calculation of the tax base, except for the differences not deductible for tax purposes and initial recognition of assets and liabilities which affect neither accounting nor taxable profit. If transactions and events are recorded in the income statement, then the related tax effects are also recognized in the income statement. However, if transactions and events are recorded directly in the shareholders equity, the related tax effects are also recognized directly in the shareholders equity. The deferred tax assets and liabilities of the Bank and its consolidated affiliates are reported as net in their individual financial statements. In compliance with TAS 12, the deferred tax assets and liabilities of the consolidated affiliates are presented on the asset and liability sides of financial statements separately, without any offsetting. The carrying amount of deferred tax assets is reviewed at each balance sheet date and reduced to the extent that it is no longer probable that sufficient taxable profits will be available to allow all or part of the asset to be recovered. Furthermore, the deferred tax assets are not subject to profit distribution or capital increase as per the BRSA s related circular in cases where there are net asset balances after netting deferred tax assets with deferred tax liabilities Transfer pricing The article no.13 of the Corporate Tax Law describes the issue of transfer pricing under the title of Disguised Profit Distribution by Way of Transfer Pricing. The General Communiqué on Disguised Profit Distribution by Way of Transfer Pricing published at 18 November 2007, explains the application related issues on this topic. According to this Communiqué, if the taxpayers conduct transactions like purchase and sale of goods or services with the related parties where the prices are not determined according to the arm s length principle, then it will be concluded that there is a disguised profit distribution by way of transfer pricing. Such disguised profit distributions will not be deducted from the corporate tax base for tax purposes. As stated in the 7.1 Annual Documentation section of this communiqué, the taxpayers are required to fill out the Transfer Pricing, Controlled Foreign Entities and Thin Capitalization form for the purchase and sale of goods or services conducted with their related parties in a taxation period, attach these forms to their corporate tax returns and submit to the tax offices. 24
34 for the Year Ended 31 December Funds borrowed The Bank, whenever required, generates funds from domestic and foreign sources in the form of borrowings, syndications, securitizations, and bill and bond issuances in the local and international markets.the funds borrowed are recorded at their purchase costs and valued at amortised costs using the effective interest method. In cases where such funds are valued at their amortised costs but this application results in measurement or accounting mismatch due to having the related financial instruments valued using different methods or the related gains or losses are recognized differently, such fundings are reclassifed as financial liabilities at their fair values through profit or loss at initial recognition in order to prevent such mismatch. The interest expenses paid during holding the related financial liabilities and the difference between the amortized cost and the acquisition cost are recorded as interest expense in income statement and the difference between the fair values and the amortized costs of the financial liabilities are recorded under trading account income/losses Shares and share issuances If the Bank issues a share at a price above its nominal value, the difference between the issue price and the nominal value is accounted for share premium under shareholders equity Confirmed bills of exchange and acceptances Payments of the confirmed bills of exchange and acceptances are made simultaneously with the payments of the customers. Confirmed bills of exchange and acceptances are recorded in offbalance sheet accounts as possible debts and commitments, if any Government incentives As of 31 December 2017, the Bank or its financial affiliates do not have any government incentives or grants (2016: none) Segment reporting The Bank operates in corporate, commercial, retail and investment banking. Accordingly, the banking products served to customers are; custody services, time and demand deposits, accumulating deposit accounts, repos, overdraft facilities, spot loans, foreign currency indexed loans, consumer loans, automobile and housing loans, working capital loans, discounted bills, gold loans, foreign currency loans, Eximbank loans, pre-export loans, ECA covered financing, letters of guarantee, letters of credit, export factoring, acceptance credits, draft facilities, forfaiting, leasing, insurance, forward, futures, salary payments, investment account (ELMA), cheques, safety boxes, bill payments, tax collections, payment orders. GarantiCard, BonusCard, Miles&Smiles Card, FlexiCard, MoneyCard, BusinessCard under the brand name of Visa and Mastercard, virtual cards and also American Express credit cards and Paracard debit cards with Maestro, Electron, Visa and Mastercard brand names, are available. The Bank provides service packages to its corporate, commercial and retail customers including deposit, loans, foreign trade transactions, investment products, cash management, leasing, factoring, insurance, credit cards, and other banking products. A customer-oriented branch network has been built in order to serve customers needs effectively and efficiently. The Bank also utilizes alternative delivery channels intensively. The Bank provides corporate banking products to international and national holdings in Turkey by coordinating regional offices, suppliers and intermediaries, utilizing cross-selling techniques. Mainly, it provides services through its commercial and mixed type of branches to export-revenue earning sectors like tourism and textile and exporters of Turkey s traditional agricultural products. Additionally, the Bank provides banking services to enterprises and their employees working in retail and service sectors through product packages including overdraft accounts, POS machines, credit cards, cheque books, Turkish Lira and foreign currency deposits, investment accounts, internet banking and call-center, debit cards and bill payment modules. 25
35 for the Year Ended 31 December 2017 Retail banking customers form a wide-spread and sustainable deposit base for the Bank. Individual customers needs are met by diversified consumer banking products through branches and alternative delivery channels. Information on the business segments on a consolidated basis is as follows: Current Period Retail Banking Corporate / Commercial Banking Investment Banking Other Total Operations Total Operating Profit 7,809,622 7,031, ,384 4,467,872 19,647,240 Other Total Operating Profit 7,809,622 7,031, ,384 4,467,872 19,647,240 Net Operating Profit 3,450,976 3,796, , ,418 8,341,621 Income from Associates and Affiliates ,816 7,816 Net Operating Profit 3,450,976 3,796, , ,234 8,349,437 Provision for Taxes ,961,463 1,961,463 Net Profit 3,450,976 3,796, ,704 (991,229) 6,387,974 Segment Assets 69,610, ,744,598 95,004,662 31,819, ,179,235 Investments in Associates and Affiliates , ,432 Total Assets 69,610, ,744,598 95,004,662 31,971, ,331,667 Segment Liabilities 128,802,347 81,145,621 83,621,821 21,155, ,725,666 Shareholders Equity ,606,001 41,606,001 Total Liabilities and Shareholders Equity 128,802,347 81,145,621 83,621,821 62,761, ,331,667 Retail Banking Corporate / Commercial Banking Investment Banking Other Total Operations Total Operating Profit 6,448,700 5,414,154 1,054,411 3,984,081 16,901,346 Other Total Operating Profit 6,448,700 5,414,154 1,054,411 3,984,081 16,901,346 Net Operating Profit 2,692,970 1,925, ,983 1,153,980 6,481,862 Income from Associates and Affiliates ,088 9,088 Net Operating Profit 2,692,970 1,925, ,983 1,163,068 6,490,950 Provision for Taxes ,343,191 1,343,191 Net Profit 2,692,970 1,925, ,983 (180,123) 5,147,759 Segment Assets 61,499, ,924,123 80,712,705 28,832, ,968,820 Investments in Associates and Affiliates , ,119 Total Assets 61,499, ,924,123 80,712,705 28,985, ,121,939 Segment Liabilities 116,243,213 67,671,139 74,092,285 18,319, ,326,032 Shareholders Equity ,795,907 35,795,907 Total Liabilities and Shareholders Equity 116,243,213 67,671,139 74,092,285 54,115, ,121, Profit reserves and profit appropriation Retained earnings as per the statutory financial statements other than legal reserves, are available for distribution, subject to the legal reserve requirement explained to below. Under the Turkish Commercial Code, legal reserves consist of first legal reserve and second legal reserve. First legal reserve, appropriated at the rate of 5%, until the total reserve is equal to 20% of issued and fully paid-in share capital. Second legal reserve, appropriated at the rate of at least 10% 26
36 for the Year Ended 31 December 2017 of distributions in excess of 5% of issued and fully paid-in share capital, but holding companies are not subject to such transaction. According to the Turkish Commercial Code, legal reserves can only be used to compensate accumulated losses and cannot be used for other purposes unless they exceed 50% of paid-in capital. In the ordinary general assembly dated 30 March 2017, it was decided to distribute cash dividend from the net profit of the Bank amounting to TL 5,070,549 thousands from its 2016 operations to the shareholders as disclosed in Note Earnings per share Earnings per share disclosed in the income statement are calculated by dividing net profit for the period by the weighted average number of shares outstanding during the period concerned. Current Period Distributable net profit for the year 6,332,056 5,105,291 Average number of issued common shares (thousand) 420,000, ,000,000 Earnings per share (amounts presented full TL) In Turkey, companies can increase their share capital by making a pro-rata distribution of shares ( bonus shares ) to existing shareholders from retained earnings. For the purpose of earnings per share computations, the weighted average number of shares outstanding during the year has been adjusted in respect of bonus shares issued without a corresponding change in resources by giving them a retroactive effect for the year in which they were issued and for each earlier period. In case bonus shares are distributed after the balance sheet date but before the preparation of the financial statements, earnings per share is calculated considering the new number of shares. There are no bonus shares issued in 2017 (2016: none) Related parties For the purpose of these financial statements, shareholders having control shares of the Bank, key management personnel and board members together with their families and companies controlled by/affiliated with them, associated companies and joint ventures and the Fund providing post employment benefits are considered and referred to as related parties in accordance with TAS 24 Related Parties. The transactions with related parties are disclosed in detail in Note Cash and cash equivalents For the purposes of the cash flow statement, cash includes cash effectives, cash in transit, purchased cheques and demand deposits including balances with the Central Bank of Turkey; and cash equivalents include interbank money market placements, time deposits at banks with original maturity periods of less than three months and investments on marketable securities other than common stocks Reclassifications None Other disclosures In January 2017, Public Oversight Accounting and Auditing Standards Authority ( POA ) published the final version of TFRS 9 which replaces TAS 39. TFRS 9 brings together all three aspects of the accounting for financial instruments project: classification and measurement, impairment and hedge accounting. In this context, it became compulsory for banks to adopt TFRS 9 effective from 1 January 2018 based on the regulation published in the Official Gazette no dated 22 June 2016 in connection with procedures and principals regarding classification of loans and allowances allocated for such loans. 27
37 for the Year Ended 31 December 2017 The Bank has been analysing the potential impact of the new standard on both in the classification of portfolios and in the valuation models of financial instruments ever since publication of the initial drafts of the standard. During 2016 and 2017, the Bank conducted an extensive project to implement TFRS 9 with the participation of finance, risk, technology, economic research departments and business areas. In this project, it is established the definition of the processes regarding implementation of the corresponding accounting policies and standards and made necessary preparations in connection with the presentation of the financial statements. The impact assessment regarding three phases of TFRS 9 is explained below: Measurement and Classification of Financial Instruments: Financial Assets: TFRS 9 contains a new approach regarding the classification and measurement of financial assets that reflects the business model in which the assets are managed and their cash flow characteristics. TFRS 9 contains three main categories of classification for financial assets: valued at amortized cost, valued at fair value with changes in other comprehensive income, and valued at fair value through profit or loss. It is anticipated that the financial assets valued at fair value through profit or loss will continue to be measured at fair value. On the other hand, there might be classifications among the financial assets classified as financial assets valued at amortized cost or valued at fair value with changes in other comprehensive income depending on the characteristics of their business models. Loans and receivables are held to collect contractual cash flows and such cash flows consist of principal and interest collections. The Bank analysed contractual cash flow characteristics of these financial instruments and decided to classify such instruments as financial assets valued at amortised cost. Accordingly, it shall not be possible to classify these financial instruments into a different category. Based on the analysis carried out up until today, the Bank considers that the new classification requirements under TFRS 9 will not have a significant impact on the balance sheet of the Bank. Financial Liabilities: TFRS 9 maintains the requirements in TAS 39 for the classification of financial liabilities except for allowing accounting of the fair value changes occurred as a result of changes in a financial liability s own credit risk under other comprehensive income for the liabilities designated for fair value option (applicable for instances not affecting the accounting mismatch at large extent). Based on the evaluation of the Bank, it is not anticipated a significant impact regarding accounting of financial liabilities based on the scope of TFRS 9. Impairment: TFRS 9 replaces the "incurred losses" model in TAS 39 with a model of "expected credit loss". The new standard establishes three stages impairment model (general model) based on the change in credit quality subsequent to initial recognition. Stage 1: Includes financial assets not having significant increase in their credit risk from initial recognition till the following reporting date or financial assets having low credit risk at the reporting date. It is recognized 12-month expected credit losses for such financial assets. Stage 2: Includes financial assets having significant increase in their credit risk subsequent to the initial recognition, but not having objective evidence about impairment. It is recognized life time expected credit losses for such financial assets. Stage 3: Includes financial assets having objective evidence about impairment at the reporting date. It is recognized life time expected credit losses for such financial assets. 28
38 for the Year Ended 31 December 2017 The matters which have the most significant impact on TFRS 9 implementation and may change impairment calculations considerably are presented below: Assessment of under which conditions there may be significant increase in credit risk Macroeconomic factors, forward looking information and multiple scenarios Maximum contractual period over which it is exposed to credit risk to be considered during measurement of expected credit losses Definition of default It is not anticipated a significant impact on the total equity as a result of the impairment calculation based expected credit loss model in accordance with TFRS 9. The impact of implementation for this standard is based on the assessments made so far. As of the transition date, it is still ongoing the revisions on the accounting policies, relevant processes and internal controls. Accordingly, there might be changes in the anticipated impact of TFRS 9 on the financials until announcement of the first time adoption financial statement including the opening balance sheet as of 1 January Besides, the Bank will calculate deferred tax on the expected credit losses calculated on stage 1 and 2 loans and the impact regarding calculated deferred tax asset will be accounted under equity during transition. Hedge Accounting: TFRS 9 also includes new hedge accounting rules regarding alignment of the risk management strategies with hedge accounting. During selection of the accounting policies, TFRS 9 gives option of continuing with TAS 39 hedge accounting principles and deferring hedge accounting rules in accordance with TFRS 9. Accordingly, the Bank will continue to apply TAS 39 rules regarding hedge accounting applications. 29
39 for the Year Ended 31 December Consolidated Financial Position and Results of Operations and Risk Management 4.1 Consolidated total capital The consolidated capital items calculated as per the Regulation on Equities of Banks published on 5 September 2013, are presented below: Components of consolidated total capital Current Period COMMON EQUITY TIER I CAPITAL Amount Paid-in Capital to be Entitled for Compensation after All Creditors 4,972,554 Share Premium 11,880 Reserves 27,527,097 Other Comprehensive Income according to TAS 4,045,373 Profit 6,332,056 Current Period Profit 6,332,056 Profit - Bonus Shares from Associates, Affiliates and Joint-Ventures not Accounted in Current Period's Profit 912 Minority Interest 122,991 Amount as per the regulation before 1/1/2014 (*) Common Equity Tier I Capital Before Deductions 43,012,863 Deductions From Common Equity Tier I Capital Valuation adjustments calculated as per the article 9. (i) of the Regulation on Bank Capital - - Current and s' Losses not Covered by Reserves, and Losses Accounted under Equity according to TAS (-) 1,717,191 - Leasehold Improvements on Operational Leases (-) 130,913 - Goodwill Netted with Deferred Tax Liabilities 5,110 6,388 Other Intangible Assets Netted with Deferred Tax Liabilities Except Mortgage Servicing Rights 274, ,368 Net Deferred Tax Asset/Liability (-) 5,905 7,381 Differences arise when assets and liabilities not held at fair value, are subjected to cash flow hedge accounting - - Total credit losses that exceed total expected loss calculated according to the Regulation on Calculation of Credit Risk by Internal Ratings Based Approach - - Securitization gains - - Unrealized gains and losses from changes in bank s liabilities fair values due to changes in creditworthiness - - Net amount of defined benefit plans - - Direct and Indirect Investments of the Bank on its own Tier I Capital (-) 1,394 - Shares Obtained against Article 56, Paragraph 4 of the Banking Law (-) - - Total of Net Long Positions of the Investments in Equity Items of Unconsolidated Banks and Financial Institutions where the Bank Owns 10% or less of the Issued Share Capital Exceeding the 10% Threshold of - - above Tier I Capital (-) Total of Net Long Positions of the Investments in Equity Items of Unconsolidated Banks and Financial Institutions where the Bank Owns 10% or more of the Issued Share Capital Exceeding the 10% Threshold of above Tier I Capital (-) - - Mortgage Servicing Rights Exceeding the 10% Threshold of Tier I Capital (-) - - Net Deferred Tax Assets arising from Temporary Differences Exceeding the10% Threshold of Tier I Capital (-) - - Amount Exceeding the 15% Threshold of Tier I Capital as per the Article 2, Clause 2 of the Regulation on Measurement and Assessment of Capital Adequacy Ratios of Banks (-)
40 for the Year Ended 31 December 2017 Amount as per the regulation before Amount 1/1/2014 (*) The Portion of Net Long Position of the Investments in Equity Items of Unconsolidated Banks and Financial Institutions where the Bank Owns 10% or more of the Issued Share Capital not deducted from - - Tier I Capital (-) Excess Amount arising from Deferred Tax Assets from Temporary Differences (-) - - Other items to be Defined by the BRSA (-) - - Deductions from Tier I Capital in cases where there are no adequate Additional Tier I or Tier II Capitals (-) - Total Deductions from Common Equity Tier I Capital 2,135,208 Total Common Equity Tier I Capital 40,877,655 ADDITIONAL TIER I CAPITAL Preferred Stock not Included in Common Equity Tier I Capital and the Related Share Premiums - Debt Instruments and the Related Issuance Premiums Defined by the BRSA - Debt Instruments and the Related Issuance Premiums Defined by the BRSA (Covered by Temporary Article 4) - Shares of Third Parties in Additional Tier I Capital Shares of Third Parties in Additional Tier I Capital (Covered by Temporary Article 3) - Additional Tier I Capital before Deductions - Deductions from Additional Tier I Capital Direct and Indirect Investments of the Bank on its own Additional Tier I Capital (-) - - Investments in Equity Instruments Issued by Banks or Financial Institutions Invested in Bank s Additional Tier I Capital and Having Conditions Stated in the Article 7 of the Regulation - - Total of Net Long Positions of the Investments in Equity Items of Unconsolidated Banks and Financial Institutions where the Bank Owns 10% or less of the Issued Share Capital Exceeding the 10% Threshold of - - above Tier I Capital (-) The Total of Net Long Position of the Direct or Indirect Investments in Additional Tier I Capital of Unconsolidated Banks and Financial Institutions where the Bank Owns more than 10% of the Issued Share - - Capital (-) Other items to be defined by the BRSA (-) - - Items to be Deducted from Tier I Capital During the Transition Period Goodwill and Other Intangible Assets and Related Deferred Taxes not deducted from Tier I Capital as per the Temporary Article 2, Clause 1 of the Regulation on Measurement and Assessment of Capital Adequacy 69,951 - Ratios of Banks (-) Net Deferred Tax Asset/Liability not deducted from Tier I Capital as per the Temporary Article 2, Clause 1 of the Regulation on Measurement and Assessment of Capital Adequacy Ratios of Banks (-) 1,476 - Deduction from Additional Tier I Capital when there is not enough Tier II Capital (-) - - Total Deductions from Additional Tier I Capital - - Total Additional Tier I Capital - - Total Tier I Capital (Tier I Capital= Common Equity Tier I Capital + Additional Tier I Capital) 40,806,228 TIER II CAPITAL Debt Instruments and the Related Issuance Premiums Defined by the BRSA 2,831,850 Debt Instruments and the Related Issuance Premiums Defined by the BRSA (Covered by Temporary Article 4) - Provisions (Amounts explained in the first paragraph of the article 8 of the Regulation on Bank Capital) 3,078,025 Total Deductions from Tier II Capital 5,909,875 Deductions from Tier II Capital Direct and Indirect Investments of the Bank on its own Tier II Capital (-) - - Investments in equity instruments issued by Banks and Financial Institutions Invested in Bank s Tier II Capital and having conditions stated in the Article 8 of the Regulation
41 for the Year Ended 31 December 2017 Total of Net Long Positions of the Investments in Equity Items of Unconsolidated Banks and Financial Institutions where the Bank Owns 10% or less of the Issued Share Capital Exceeding the 10% Threshold of above Tier I Capital (-) Total of Net Long Positions of the Investments in Equity Items of Unconsolidated Banks and Financial Institutions where the Bank Owns 10% or more of the Issued Share Capital Exceeding the 10% Threshold of above Tier I Capital (-) Amount Amount as per the regulation before 1/1/2014 (*) Other items to be defined by the BRSA (-) - - Total Deductions from Tier II Capital - - Total Tier II Capital 5,909,875 Total Equity (Total Tier I and Tier II Capital) 46,716,103 Total Tier I Capital and Tier II Capital ( Total Equity) Loans Granted against the Articles 50 and 51 of the Banking Law (-) 5 Other items to be Defined by the BRSA (-) 30,874 Items to be Deducted from the Sum of Tier I and Tier II Capital (Capital) during the Transition Period The Portion of Total of Net Long Positions of the Investments in Equity Items of Unconsolidated Banks and Financial Institutions where the Bank Owns 10% or less of the Issued Share Capital Exceeding the 10% Threshold of above Tier I Capital not deducted from Tier I Capital, Additional Tier I Capital or Tier II Capital as per the Temporary Article 2, Clause 1 of the Regulation (-) The Portion of Total of Net Long Positions of the Investments in Equity Items of Unconsolidated Banks and Financial Institutions where the Bank Owns more than 10% of the Issued Share Capital Exceeding the 10% Threshold of above Tier I Capital not deducted from Additional Tier I Capital or Tier II Capital as per the Temporary Article 2, Clause 1 of the Regulation (-) The Portion of Net Long Position of the Investments in Equity Items of Unconsolidated Banks and Financial Institutions where the Bank Owns 10% or more of the Issued Share Capital, of the Net Deferred Tax Assets arising from Temporary Differences and of the Mortgage Servicing Rights not deducted from Tier I Capital as per the Temporary Article 2, Clause 2, Paragraph (1) and (2) and Temporary Article 2, Clause 1 of the Regulation (-) CAPITAL Total Capital (Total of Tier I Capital and Tier II Capital) 46,685,224 - Total Risk Weighted Assets 278,024,586 - CAPITAL ADEQUACY RATIOS Consolidated CET1 Capital Ratio (%) Consolidated Tier I Capital Ratio (%) Consolidated Capital Adequacy Ratio (%) BUFFERS Total Additional CET1 Capital Requirement Ratio (a+b+c) a) Capital Conservation Buffer Ratio (%) b) Bank-specific Counter-Cyclical Capital Buffer Ratio (%) c) Systemically Important Banks Buffer Ratio (%) Additional CET1 Capital Over Total Risk Weighted Assets Ratio Calculated According to the Article 4 of Capital Conservation and Counter-Cyclical Capital Buffers Regulation (%) Amounts Lower Than Excesses as per Deduction Rules Remaining Total of Net Long Positions of the Investments in Equity Items of Unconsolidated Banks and Financial Institutions where the Bank Owns 10% or less of the Issued Share Capital - - Remaining Total of Net Long Positions of the Investments in Tier I Capital of Unconsolidated Banks and Financial Institutions where the Bank Owns more than 10% or less of the Issued Share Capital - - Remaining Mortgage Servicing Rights - - Net Deferred Tax Assets arising from Temporary Differences 459,775-32
42 for the Year Ended 31 December 2017 Limits for Provisions Used in Tier II Capital Calculation General Loan Provisions for Exposures in Standard Approach (before limit of one hundred and twenty five per ten thousand) Amount Amount as per the regulation before 1/1/2014 (*) 3,673,669 - General Loan Provisions for Exposures in Standard Approach Limited by 1.25% of Risk Weighted Assets 3,078,025 - Total Loan Provision that Exceeds Total Expected Loss Calculated According to Communiqué on Calculation of Credit Risk by Internal Ratings Based Approach - - Total Loan Provision that Exceeds Total Expected Loss Calculated According to Communiqué on Calculation of Credit Risk by Internal Ratings Based Approach, Limited by 0.6% Risk Weighted Assets - - Debt Instruments Covered by Temporary Article 4 (effective between ) Upper Limit for Additional Tier I Capital Items subject to Temporary Article Amount of Additional Tier I Capital Items Subject to Temporary Article 4 that Exceeds Upper Limit - - Upper Limit for Additional Tier II Capital Items subject to Temporary Article Amount of Additional Tier II Capital Items Subject to Temporary Article 4 that Exceeds Upper Limit - - (*) (**) Under this item fully loaded amounts were reported for items that are subject to phasing in according to Bank Capital Regulation dated 1 January According to Bank Capital Regulation article 10 paragraph 4, which published on Official Gazette dated 5th September 2013 and numbered 28756, banks also calculate their consolidated capital with their consolidated insurance company investments as unconsolidated financial institutions if 9th article s 4th paragraph s (c) and (ç) items apply. Lesser of consolidated capital calculated according to 1st and 4th paragraphs is considered the consolidated capital according to this regulation. As the consolidated capital calculated including the insurance affiliate is lesser, the consolidated capital is calculated according to consolidated financial statements including the insurance affiliate. 33
43 for the Year Ended 31 December 2017 COMMON EQUITY TIER I CAPITAL Amount Paid-in Capital to be Entitled for Compensation after All Creditors 4,972,554 Share Premium 11,880 Reserves 23,704,951 Other Comprehensive Income according to TAS 3,090,208 Profit 5,114,182 Current Period Profit 5,114,182 Profit - Bonus Shares from Associates, Affiliates and Joint-Ventures not Accounted in Current Period's Profit 947 Minority Interest 52,513 Amount as per the regulation before 1/1/2014 (*) Common Equity Tier I Capital Before Deductions 36,947,235 Deductions From Common Equity Tier I Capital Valuation adjustments calculated as per the article 9. (i) of the Regulation on Bank Capital - - Current and s' Losses not Covered by Reserves, and Losses Accounted under Equity according to TAS (-) 1,429,152 - Leasehold Improvements on Operational Leases (-) 116,307 - Goodwill Netted with Deferred Tax Liabilities 3,833 6,388 Other Intangible Assets Netted with Deferred Tax Liabilities Except Mortgage Servicing Rights 156, ,520 Net Deferred Tax Asset/Liability (-) 7,129 11,881 Differences arise when assets and liabilities not held at fair value, are subjected to cash flow hedge accounting - - Total credit losses that exceed total expected loss calculated according to the Regulation on Calculation of Credit Risk by Internal Ratings Based Approach - - Securitization gains - - Unrealized gains and losses from changes in bank s liabilities fair values due to changes in creditworthiness - - Net amount of defined benefit plans - - Direct and Indirect Investments of the Bank on its own Tier I Capital (-) 1,730 - Shares Obtained against Article 56, Paragraph 4 of the Banking Law (-) - - Total of Net Long Positions of the Investments in Equity Items of Unconsolidated Banks and Financial Institutions where the Bank Owns 10% or less of the Issued Share Capital Exceeding the 10% Threshold of - - above Tier I Capital (-) Total of Net Long Positions of the Investments in Equity Items of Unconsolidated Banks and Financial Institutions where the Bank Owns 10% or more of the Issued Share Capital Exceeding the 10% Threshold of above Tier I Capital (-) - - Mortgage Servicing Rights Exceeding the 10% Threshold of Tier I Capital (-) - - Net Deferred Tax Assets arising from Temporary Differences Exceeding the10% Threshold of Tier I Capital (-) Amount Exceeding the 15% Threshold of Tier I Capital as per the Article 2, Clause 2 of the Regulation on Measurement and Assessment of Capital Adequacy Ratios of Banks (-) The Portion of Net Long Position of the Investments in Equity Items of Unconsolidated Banks and Financial Institutions where the Bank Owns 10% or more of the Issued Share Capital not deducted from Tier I Capital (-) Excess Amount arising from Deferred Tax Assets from Temporary Differences (-) - - Other items to be Defined by the BRSA (-) - - Deductions from Tier I Capital in cases where there are no adequate Additional Tier I or Tier II Capitals (-) - Total Deductions from Common Equity Tier I Capital 1,715,062 Total Common Equity Tier I Capital 35,232,173 34
44 for the Year Ended 31 December 2017 ADDITIONAL TIER I CAPITAL Amount Preferred Stock not Included in Common Equity Tier I Capital and the Related Share Premiums - Debt Instruments and the Related Issuance Premiums Defined by the BRSA - Amount as per the regulation before 1/1/2014 (*) Debt Instruments and the Related Issuance Premiums Defined by the BRSA (Covered by Temporary Article 4) - Shares of Third Parties in Additional Tier I Capital Shares of Third Parties in Additional Tier I Capital (Covered by Temporary Article 3) - Additional Tier I Capital before Deductions - Deductions from Additional Tier I Capital Direct and Indirect Investments of the Bank on its own Additional Tier I Capital (-) - - Investments in Equity Instruments Issued by Banks or Financial Institutions Invested in Bank s Additional Tier I Capital and Having Conditions Stated in the Article 7 of the Regulation - - Total of Net Long Positions of the Investments in Equity Items of Unconsolidated Banks and Financial Institutions where the Bank Owns 10% or less of the Issued Share Capital Exceeding the 10% Threshold of - - above Tier I Capital (-) The Total of Net Long Position of the Direct or Indirect Investments in Additional Tier I Capital of Unconsolidated Banks and Financial Institutions where the Bank Owns more than 10% of the Issued Share Capital (-) - - Other items to be defined by the BRSA (-) - - Items to be Deducted from Tier I Capital During the Transition Period Goodwill and Other Intangible Assets and Related Deferred Taxes not deducted from Tier I Capital as per the Temporary Article 2, Clause 1 of the Regulation on Measurement and Assessment of Capital Adequacy Ratios of Banks (-) 107,163 - Net Deferred Tax Asset/Liability not deducted from Tier I Capital as per the Temporary Article 2, Clause 1 of the Regulation on Measurement and Assessment of Capital Adequacy Ratios of Banks (-) 4,752 - Deduction from Additional Tier I Capital when there is not enough Tier II Capital (-) - - Total Deductions from Additional Tier I Capital - - Total Additional Tier I Capital - - Total Tier I Capital (Tier I Capital= Common Equity Tier I Capital + Additional Tier I Capital) 35,120,258 TIER II CAPITAL Debt Instruments and the Related Issuance Premiums Defined by the BRSA - Debt Instruments and the Related Issuance Premiums Defined by the BRSA (Covered by Temporary Article 4) - Provisions (Amounts explained in the first paragraph of the article 8 of the Regulation on Bank Capital) 2,889,903 Total Deductions from Tier II Capital 2,889,903 Deductions from Tier II Capital Direct and Indirect Investments of the Bank on its own Tier II Capital (-) - - Investments in equity instruments issued by Banks and Financial Institutions Invested in Bank s Tier II Capital and having conditions stated in the Article 8 of the Regulation - - Total of Net Long Positions of the Investments in Equity Items of Unconsolidated Banks and Financial Institutions where the Bank Owns 10% or less of the Issued Share Capital Exceeding the 10% Threshold of above Tier I Capital (-) Total of Net Long Positions of the Investments in Equity Items of Unconsolidated Banks and Financial Institutions where the Bank Owns 10% or more of the Issued Share Capital Exceeding the 10% Threshold of above Tier I Capital (-) Other items to be defined by the BRSA (-) - - Total Deductions from Tier II Capital - - Total Tier II Capital 2,889,903 Total Equity (Total Tier I and Tier II Capital) 38,010,161 35
45 for the Year Ended 31 December 2017 Total Tier I Capital and Tier II Capital ( Total Equity) Amount Loans Granted against the Articles 50 and 51 of the Banking Law (-) 31 Net Book Values of Movables and Immovables Exceeding the Limit Defined in the Article 57, Clause 1 of the Banking Law and the Assets Acquired against Overdue Receivables and Held for Sale but Retained more than Five Years (-) 56,325 Other items to be Defined by the BRSA (-) 36,994 Items to be Deducted from the Sum of Tier I and Tier II Capital (Capital) during the Transition Period The Portion of Total of Net Long Positions of the Investments in Equity Items of Unconsolidated Banks and Financial Institutions where the Bank Owns 10% or less of the Issued Share Capital Exceeding the 10% Threshold of above Tier I Capital not deducted from Tier I Capital, Additional Tier I Capital or Tier II Capital as per the Temporary Article 2, Clause 1 of the Regulation (-) The Portion of Total of Net Long Positions of the Investments in Equity Items of Unconsolidated Banks and Financial Institutions where the Bank Owns more than 10% of the Issued Share Capital Exceeding the 10% Threshold of above Tier I Capital not deducted from Additional Tier I Capital or Tier II Capital as per the Temporary Article 2, Clause 1 of the Regulation (-) The Portion of Net Long Position of the Investments in Equity Items of Unconsolidated Banks and Financial Institutions where the Bank Owns 10% or more of the Issued Share Capital, of the Net Deferred Tax Assets arising from Temporary Differences and of the Mortgage Servicing Rights not deducted from Tier I Capital as per the Temporary Article 2, Clause 2, Paragraph (1) and (2) and Temporary Article 2, Clause 1 of the Regulation (-) CAPITAL Amount as per the regulation before 1/1/2014 (*) Total Capital (Total of Tier I Capital and Tier II Capital) 37,916,811 - Total Risk Weighted Assets 258,425,540 - CAPITAL ADEQUACY RATIOS Consolidated CET1 Capital Ratio (%) Consolidated Tier I Capital Ratio (%) Consolidated Capital Adequacy Ratio (%) BUFFERS Bank-Specific total CET1 Capital Ratio (%) Capital Conservation Buffer Ratio (%) Bank-Specific Counter-Cyclical Capital Buffer Ratio (%) Additional CET1 Capital Over Total Risk Weighted Assets Ratio Calculated According to the Article 4 of Capital Conservation and Counter-Cyclical Capital Buffers Regulation (%) Amounts Lower Than Excesses as per Deduction Rules Remaining Total of Net Long Positions of the Investments in Equity Items of Unconsolidated Banks and Financial Institutions where the Bank Owns 10% or less of the Issued Share Capital Remaining Total of Net Long Positions of the Investments in Tier I Capital of Unconsolidated Banks and Financial Institutions where the Bank Owns more than 10% or less of the Issued Share Capital (**) 1,125,107 - Remaining Mortgage Servicing Rights - - Net Deferred Tax Assets arising from Temporary Differences 245,522 - Limits for Provisions Used in Tier II Capital Calculation General Loan Provisions for Exposures in Standard Approach (before limit of one hundred and twenty five per ten thousand) 3,215,533 - General Loan Provisions for Exposures in Standard Approach Limited by 1.25% of Risk Weighted Assets 2,889,903 - Total Loan Provision that Exceeds Total Expected Loss Calculated According to Communiqué on Calculation of Credit Risk by Internal Ratings Based Approach - - Total Loan Provision that Exceeds Total Expected Loss Calculated According to Communiqué on Calculation of Credit Risk by Internal Ratings Based Approach, Limited by 0.6% Risk Weighted Assets
46 for the Year Ended 31 December 2017 Amount as per the regulation before Amount 1/1/2014 (*) Debt Instruments Covered by Temporary Article 4 (effective between ) Upper Limit for Additional Tier I Capital Items subject to Temporary Article Amount of Additional Tier I Capital Items Subject to Temporary Article 4 that Exceeds Upper Limit - - Upper Limit for Additional Tier II Capital Items subject to Temporary Article Amount of Additional Tier II Capital Items Subject to Temporary Article 4 that Exceeds Upper Limit - - (*) Under this item fully loaded amounts were reported for items that are subject to phasing in according to Bank Capital Regulation dated 1 January (**) 250% risk weight is applied to TL 1,125,107 thousands according to Regulation on Capital Adequacy Ratio Annex-1 Paragraph 73, which is not deducted from Common Equity Tier 1 Capital. The Bank plans its Common Equity Tier 1 (CET1) Capital by considering 10% as the minimum target while considering its additional CET 1 requirements during the phase-in period due to aforementioned regulations. 37
47 for the Year Ended 31 December Items included in capital calculation Information about instruments included in total capital calculation Issuer T. Garanti Bankası A.Ş. Identifier (CUSIP, ISIN vb.) Governing law (s) of the instrument Subject to 10% deduction as of 1/1/2015 Eligible on unconsolidated and /or consolidated basis Instrument type Amount recognized in regulatory capital (Currency in TL million, as of most recent reporting date) Reg S: ISIN: XS Common Code: A: CUSIP: AE7 ISIN: US900148AE73 Common Code: Subject to English Law and in terms of certain articles to Turkish Regulations. It is issued within the scope of the Communiqué VII on Debt Instruments of the Capital Markets Board and the Regulation on Bank Capital of the BRSA. Regulatory treatment No Eligible on unconsolidated and consolidated Subordinated debt instruments (Notes) 2,832 Nominal value of instrument (TL million) 2,832 Accounting classification of the instrument Secondary Subordinated Loans Issuance date of instrument Maturity structure of the instrument (demand/time) Time Original maturity of the instrument Issuer call subject to prior supervisory (BRSA) approval Yes Optional call date, contingent call dates and redemption amount USD750,000, Subsequent call dates, if applicable - Interest/dividend payment* Fixed or floating coupon/dividend payments Fixed Coupon rate and any related index % Existence of any dividend payment restriction None Fully discretionary, partially discretionary or mandatory - Existence of step up or other incentive to redeem None Noncumulative or cumulative None Convertible into equity shares None If convertible, conversion trigger (s) - If convertible, fully or partially - If convertible, conversion rate - If convertible, mandatory or optional conversion - If convertible, type of instrument convertible into - If convertible, issuer of instrument to be converted into - Write-down feature Yes Due to the losses incurred, where the Bank is at the point at which the BRSA may determine pursuant to Article 71 of the Banking Law that: (i) its operating license is to be revoked and the Bank is liquidated or (ii) the rights of all of its shareholders (except to If bonds can be written-down, write-down trigger(s) dividends), and the management and supervision of the Bank, are to be transferred to the SDIF on the condition that losses are deducted from the capital of existing shareholders (occurrence of either condition means the issuer has become non-viable), or (iii) it is probable that the Issuer will become non-viable; then the bonds can be written-down. If bond can be written-down, full or partial Partially or fully If bond can be written-down, permanent or temporary Continuously If temporary write-down, description of write-up mechanism There are no any temporary write-up mechanisms. Position in subordination hierarchy in case of liquidation (instrument type immediately senior to the instrument) In priority of receivables, it comes after the senior obligations of the Issuer. In compliance with article number 7 and 8 of Regulation on Bank Capital Instrument is in compliant with Article 8 of the Regulation on Bank Capital. Details of incompliances with article number 7 and 8 of Regulation on Bank Capital Instrument is not in compliant with Article 7 of the Regulation on Bank Capital. 38

48 for the Year Ended 31 December Reconciliation of capital items to balance sheet Current Period Carrying value Amount of correction Value of the capital report Paid-in Capital 4,200, ,554 4,972,554 Capital Reserves 1,526,847 (883,725) 643,122 Other Comprehensive Income According to TAS 1,514,055 (883,725) 630,330 Securities Value Increase Fund (317,814) 10,504 (307,310) Revaluation Surplus on Tangible Assets Revaluation Surplus on Intangible Assets Revaluation Surplus on Investment Property 1,747,869-1,747, Explanation of the differences Inflation adjustments included in Paid-in Capital according to Regulation s Temporary Article 1 Adjustment effect required by the Regulation on "Bank Capital" Article 10 Paragraph 4 Adjustment effect required by the Regulation on "Bank Capital" Article 10 Paragraph 4 Adjustment effect required by the Regulation on "Bank Capital" Article 10 Paragraph 4 Adjustment effect required by the Regulation on "Bank Capital" Article 10 Paragraph 4 Hedging Reserves (Effective Portion) (544,285) (121,675) (665,960) Items not included in the calculation as per Regulation s Article 9-1-f Revaluation Surplus on Assets Held for Sale and Assets of Discontinued Operations Other Capital Reserves 628,285 (772,554) (144,269) Adjustment effect required by the Regulation on "Bank Capital" Article 10 Paragraph 4; and Inflation adjustments included in Paid-in Capital according to Regulation s Temporary Article 1 Bonus Shares of Associates, Affiliates and Joint-Ventures Share Premium 11,880-11,880 Profit Reserves 29,224,949-29,224,949 Adjustment effect required by the Regulation on "Bank Capital" Article 10 Paragraph 4 Profit or Loss 6,332,056-6,332,056 Adjustment effect required by the Regulation on "Bank Capital" Article 10 Paragraph 4 s Profit/Loss Current Period Net Profit/Loss 6,332,056-6,332,056 Adjustment effect required by the Regulation on "Bank Capital" Article 10 Paragraph 4 Minority Interest 322,149 (199,158) 122,991 Adjustment effect required by the Regulation on "Bank Capital" Article 10 Paragraph 4 Deductions from Common Equity Tier I Capital (-) - 418,017 Common Equity Tier I Capital 41,606,001 40,877,655 Subordinated Debts - Deductions from Tier I Capital (-) Tier I Capital 40,806,228 Subordinated Debts 2,831,850 Deductions from Common Equity Tier 1 Capital as per the Regulation 71,427 Deductions from Tier I Capital as per the Regulation General Provisions 3,078,025 General Loan Provision added to Tier II Capital as per the Regulation s Article 8 Deductions from Tier II Capital (-) - Deductions from Tier II Capital as per the Regulation Tier II Capital 5,909,875 Deductions from Total Capital (-) 30,879 Deductions from Capital as per the Regulation Total 46,685,224 39
 583,100 Securities Value Increase Fund (543,625) 9,161 (534,464) Revaluation Surplus on Tangible Assets Revaluation Surplus on Intangible")
49 for the Year Ended 31 December 2017 Carrying value Amount of correction Value of the capital report (*) Paid-in Capital 4,200, ,554 4,972,554 Capital Reserves 1,474,369 (878,442) 595,927 Other Comprehensive Income According to TAS 1,461,542 (878,442) 583,100 Securities Value Increase Fund (543,625) 9,161 (534,464) Revaluation Surplus on Tangible Assets Revaluation Surplus on Intangible Assets Revaluation Surplus on Investment Property 1,691,062 (36,807) 1,654, Explanation of the differences Inflation adjustments included in Paid-in Capital according to Regulation s Temporary Article 1 Adjustment effect required by the Regulation on "Bank Capital" Article 10 Paragraph 4 (*) Adjustment effect required by the Regulation on "Bank Capital" Article 10 Paragraph 4 (*) Adjustment effect required by the Regulation on "Bank Capital" Article 10 Paragraph 4 (*) Adjustment effect required by the Regulation on "Bank Capital" Article 10 Paragraph 4 (*) Hedging Reserves (Effective Portion) (353,676) (78,370) (432,046) Items not included in the calculation as per Regulation s Article 9-1-f Revaluation Surplus on Assets Held for Sale and Assets of Discontinued Operations Other Capital Reserves 667,781 (772,426) (104,645) Adjustment effect required by the Regulation on "Bank Capital" Article 10 Paragraph 4 (*) ; and Inflation adjustments included in Paid-in Capital according to Regulation s Temporary Article 1 Bonus Shares of Associates, Affiliates and Joint-Ventures Share Premium 11,880-11,880 Profit Reserves 24,748,439 34,468 24,782,907 Adjustment effect required by the Regulation on "Bank Capital" Article 10 Paragraph 4 (*) Profit or Loss 5,105,291 8,891 5,114,182 s Profit/Loss Current Period Net Profit/Loss 5,105,291 8,891 5,114,182 Minority Interest 267,808 (215,295) 52,513 Deductions from Common Equity Tier I Capital (-) - 285,910 Common Equity Tier I Capital 35,795,907 35,232,173 Adjustment effect required by the Regulation on "Bank Capital" Article 10 Paragraph 4 (*) Adjustment effect required by the Regulation on "Bank Capital" Article 10 Paragraph 4 (*) Adjustment effect required by the Regulation on "Bank Capital" Article 10 Paragraph 4 (*) Deductions from Common Equity Tier 1 Capital as per the Regulation 40
50 for the Year Ended 31 December 2017 Carrying value Amount of correction Value of the capital report (*) Subordinated Debts - Deductions from Tier I Capital (-) Tier I Capital 35,120,258 Subordinated Debts - General Provisions 2,889,903 Deductions from Tier II Capital (-) Tier II Capital 2,889,903 Deductions from Total Capital (-) 41 Explanation of the differences 111,915 Deductions from Tier I Capital as per the Regulation General Loan Provision added to Tier II Capital as per the Regulation s Article 8 - Deductions from Tier II Capital as per the Regulation 93,350 Deductions from Capital as per the Regulation Total 37,916,811 (*) According to Bank Capital Regulation article 10 paragraph 4, which published on Official Gazette dated 5th September 2013 and numbered 28756, banks calculated their consolidated capital with their consolidated insurance company investments as unconsolidated financial institutions if 9th article s 4th paragraph s (c) and (ç) items apply. Lesser of consolidated capital calculated according to 1st and 4th paragraphs is considered the consolidated capital according to this regulation. As the consolidated capital calculated without including the insurance affiliate is lesser than the consolidated capital calculated including the insurance affiliate, when proceeding from the consolidated financial statements to the consolidated capital there is an adjustment for excluding the insurance company from consolidation. 4.2 Consolidated credit risk Credit risk is defined as risks and losses that may occur if the counterparty that the Bank or its consolidated financial affiliates work with, fails to comply with the agreement s requirements and cannot perform its obligations partially or completely on the terms set. In compliance with the legislation, the credit limits are set for the financial position and credit requirements of customers within the authorization limits assigned for Branches, Lending Departments, Executive Vice President responsible of Lending, General Manager, Credit Committee and Board of Directors. The limits are subject to revision if necessary. The debtors or group of debtors are subject to credit risk limits. Sectoral risk concentrations are reviewed on a monthly basis. Credit worthiness of debtors is reviewed periodically in compliance with the legislation by the internal risk rating models. The credit limits are revised and further collateral is required if the risk level of debtor deteriorates. For unsecured loans, the necessary documentation is gathered in compliance with the legislation. Geographical concentration of credit customers is reviewed monthly. This is in line with the concentration of industrial and commercial activities in Turkey. In accordance with the lending policies, the debtor s creditworthiness is analysed and the adequate collateral is obtained based on the financial position of the company and the type of loan; like cash collateral, bank guarantees, mortgages, pledges, bills and personal or corporate guarantees. There are control limits on the position held through forwards, options and other similar agreements. Credit risk of such instruments is managed together with the risk from market fluctuations. The risk arising from such instruments are followed up and when necessary, the actions to decrease it are taken. The liquidated non-cash loans are subject to the same risk weight with the overdue loans. Foreign trade finance and other interbank credit transactions are performed through widespread correspondents network. Accordingly, limits are assigned to domestic and foreign banks and other financial institutions based on review of their credit worthiness, periodically. The Bank developed a statistical-based internal risk rating model for its credit portfolio of corporate/commercial/medium-size companies. This internal risk rating model has been in use for
51 for the Year Ended 31 December 2017 customer credibility assessment since Risk rating has become a requirement for loan applications, and ratings are used both to determine branch managers credit authorization limits and in credit assessment process. The concentration table of the cash and non-cash loans for the Bank according to the risk rating system for its customers defined as corporate, commercial and medium-size enterprises is presented below: Current Period % % Above Avarage Average Below Average Total Total amount of exposures after offsetting transactions but before applying credit risk mitigations and the average exposure amounts that are classified in different risk groups and types, are disclosed below for the relevant period: Exposure Categories Current Period (*) Average (**) (*) Average (**) Conditional and unconditional exposures to central governments or central banks 93,544,327 85,195,158 67,305,286 73,988,899 Conditional and unconditional exposures to regional governments or local authorities 124, , ,655 92,560 Conditional and unconditional exposures to administrative bodies and non-commercial undertakings 323, ,339 64,343 65,561 Conditional and unconditional exposures to multilateral development banks 1,816,462 1,666,895 1,443,371 1,139,231 Conditional and unconditional exposures to international organisations Conditional and unconditional exposures to banks and brokerage houses 38,173,204 38,722,083 45,659,651 41,464,066 Conditional and unconditional exposures to corporates 149,299, ,452, ,683, ,475,572 Conditional and unconditional retail exposures 81,863,528 75,775,025 66,769,991 59,081,330 Conditional and unconditional exposures secured by real estate property 38,559,431 40,245,558 36,698,091 30,988,810 Past due items 1,161,094 1,093,809 1,065, ,536 Items in regulatory high-risk categories 1,091,083 1,824,289 2,308,629 4,654,614 Exposures in the form of bonds secured by mortgages Securitisation positions Short term exposures to banks, brokerage houses and corporates Exposures in the form of collective investment undertakings 44,516 28, Shares 164, , , ,245 Other items (***) 10,283,383 8,472,383 9,494,987 8,377,418 (*) Includes total risk amounts before the effect of credit risk mitigation but after credit conversions. (**) Average risk amounts are the arithmetical averages of the amounts in monthly reports prepared as per the Regulation on Measurement and Assessment of Capital Adequacy Ratios of Banks. (***) Shares are reported under other items in the prior period. The parent Bank and its financial affiliates largest 100 and 200 cash loan customers compose 23.07% (31 December 2016: 24.42%) and 29.25% (31 December 2016: 31.27%) of the total cash loan portfolio, respectively. The parent Bank and its financial affiliates largest 100 and 200 non-cash loan customers compose 45.45% (31 December 2016: 51.42%) and 55.08% (31 December 2016: 61.15%) of the total noncash loan portfolio, respectively. The parent Bank and its financial affiliates largest 100 ve 200 cash and non-cash loan customers represent 7.95% (31 December 2016: 8.69%) and 10.14% (31 December 2016: 11.24%) of the total on and off balance sheet assets, respectively. The general provision for consolidated credit risk amounts to TL 3,673,669 thousands (31 December 2016: TL 3,215,533 thousands). 42

52 for the Year Ended 31 December Profile of significant exposures in major regions Exposure Categories (*) Current Period (****) Conditional and unconditional exposures to central governments or central banks Conditional and unconditional exposures to banks and brokerage houses Conditional and unconditional exposures to corporates Conditional and unconditional retail exposures Conditional and unconditional exposures secured by real estate property Items in regulatory high-risk categories Other Total Domestic 84,901,396 9,989, ,612,153 78,346,834 37,065, ,172 11,310, ,132,373 European Union (EU) Countries 7,713,667 24,028,466 11,892,093 3,093,618 1,455, ,918 2,561,361 50,894,353 OECD Countries (**) 139 1,030,796 4,107,924 5,152 7,072 32, ,183,967 Off-Shore Banking Regions - 75, ,631 1, ,028 USA, Canada 1,079 2,571,777 2,255,887 6,676 4, ,776 4,856,457 Other Countries 928, ,607 2,123, ,174 26,634 2,198 16,495 3,897,642 Associates, Subsidiaries and Joint Ventures - 86,232 8, , ,023 Unallocated Assets/Liabilities (***) Total 93,544,327 38,173, ,299,065 81,863,528 38,559,431 1,091,083 13,918, ,448,843 Exposure Categories (*) (****) Conditional and unconditional exposures to central governments or central banks Conditional and unconditional exposures to banks and brokerage houses Conditional and unconditional exposures to corporates Conditional and unconditional retail exposures Conditional and unconditional exposures secured by real estate property Items in regulatory high-risk categories Other Total Domestic 62,213,592 13,280, ,348,484 63,961,399 35,871, ,687 10,339, ,806,273 European Union (EU) Countries 4,605,824 30,261,053 10,436,611 2,418, , ,866 2,007,318 50,860,880 OECD Countries (**) ,111 3,963,959 3,070 5, ,898 4,596,825 Off-Shore Banking Regions - 3, ,608 1, , ,242 USA, Canada 1,131 1,076,577 2,452,419 8,313 3,283 9,325 3,003 3,554,051 Other Countries 484, ,005 1,705, ,013 20,948 33,927 27,169 3,017,931 Associates, Subsidiaries and Joint Ventures - 76,445 3, ,125,107 11,922 1,216,764 Unallocated Assets/Liabilities (***) Total 67,305,286 45,659, ,683,596 66,769,991 36,698,091 2,308,629 12,419, ,844,966 (*) Exposure categories are as per the Regulation on Measurement and Assessment of Capital Adequacy Ratios of Banks. (**) Includes OECD countries other than EU countries, USA and Canada. (***) Includes asset and liability items that can not be allocated on a consistent basis. (****) Includes risk amounts before the effect of credit risk mitigation but after the credit conversions. 43
53 for the Year Ended 31 December Risk profile by sectors or counterparties Exposure Categories (*) Current Period (**) TP YP Toplam Agriculture ,028, , ,057 18,489 40, ,398,689 1,820,317 3,219,006 Farming and Stockbreeding ,694, , ,469 17,469 39, ,312,626 1,462,686 2,775,312 Forestry ,785 42,656 24, , , ,634 Fishery ,367 30,275 9, , , ,060 Manufacturing , ,677,060 8,086,547 7,794, , , ,105-28,280,427 52,841,866 81,122,293 Mining and Quarrying ,600, ,098 86,091 8,550 15, ,962 2,171,875 3,072,837 Production ,931,403 7,541,250 4,298, , , ,105-22,222,714 26,898,061 49,120,775 Electricity, Gas and Water , ,145, ,199 3,409,656 39,392 44, ,156,751 23,771,930 28,928,681 Construction ,884,000 4,288,576 2,634,550 63,680 71, ,345,461 5,597,216 15,942,677 Services ,816,462-38,173,204 67,040,339 18,222,876 9,317, , , ,516 30,489-52,247,265 83,629, ,877,055 Wholesale and Retail Trade ,594,333 13,863,462 4,595, ,829 89, ,936,376 17,449,824 47,386,200 Accomodation and Dining ,999, ,246 2,633, ,797 18, ,334,835 5,406,484 7,741,319 Transportation and Telecommunication ,642,547 2,254, , ,097 37, ,946,398 14,727,008 19,673,406 Financial Institutions ,816,462-38,173,204 8,684, ,374 72,644 4, , ,516 30,489-11,687,796 37,745,463 49,433,259 Real Estate and Rental Services ,177, , ,568 14,722 8, ,405,687 5,019,254 6,424,941 Professional Services Educational Services , , , , , , ,121 Health and Social Services ,588, , ,686 10,218 7, ,170,752 3,108,057 4,278,809 Others 93,543, , , ,669,117 50,553,504 18,393, , , ,699 10,283, ,261,277 53,026, ,287,812 Total 93,544, , ,865 1,816,462-38,173, ,299,065 81,863,528 38,559,431 1,161,094 1,091, , ,293 10,283, ,533, ,915, ,448,843 (*) Exposure categories are as per the Regulation on Measurement and Assessment of Capital Adequacy Ratios of Banks. (**) Includes risk amounts before the effect of credit risk mitigation but after the credit conversions. 1- Conditional and unconditional exposures to central governments or central banks 2- Conditional and unconditional exposures to regional governments or local authorities 3- Conditional and unconditional exposures to administrative bodies and non-commercial undertakings 4- Conditional and unconditional exposures to multilateral development banks 5- Conditional and unconditional exposures to international organisations 6- Conditional and unconditional exposures to banks and brokerage houses 7- Conditional and unconditional exposures to corporates 8- Conditional and unconditional retail exposures 9- Conditional and unconditional exposures secured by real estate property 10- Past due receivables 11- Receivables in regulatory high-risk categories 12- Exposures in the form of bonds secured by mortgages 13- Securitisation positions 14- Short term exposures to banks, brokerage houses and corporates 15- Exposures in the form of collective investment undertakings 16- Shares 17- Other receivables 44
54 for the Year Ended 31 December 2017 Exposure Categories (*) (**) TL FC Total Agriculture ,086, , ,471 56,205 10, ,199, ,810 2,156,817 Farming and Stockbreeding , , ,966 55,612 8, ,124, ,905 1,867,224 Forestry ,633 36,041 28, , , ,737 Fishery ,637 22,332 8, , ,308 81, ,856 Manufacturing ,678 56,420,611 6,446,944 7,157, , , ,801-20,828,288 49,867,023 70,695,311 Mining and Quarrying ,630, , ,122 16,431 8, ,030 2,252,057 3,052,087 Production ,166,478 6,043,707 4,299, , , ,801-16,711,133 25,234,658 41,945,791 Electricity, Gas and Water ,678 22,623, ,916 2,740,997 38,842 41, ,317,125 22,380,308 25,697,433 Construction ,584,160 3,131,638 2,395, ,651 79, ,488,021 5,821,298 13,309,319 Services ,668 1,443,371-44,605,066 60,326,969 14,211,299 9,551, , , ,693-83,034,202 48,124, ,159,144 Wholesale and Retail Trade ,684,402 10,716,937 4,983, , , ,339,788 17,390,200 41,729,988 Accomodation and Dining ,517, ,381 2,697,010 91,466 17, ,874,952 5,268,060 7,143,012 Transportation and Telecommunication ,572,019 1,823, , ,933 26, ,231,372 13,945,394 17,176,766 Financial Institutions ,443,371-44,605,066 7,997, ,864 65,700 2, , ,693-50,503,300 4,016,980 54,520,280 Real Estate and Rental Services ,535, , ,968 12,629 5, ,404,116 4,984,532 6,388,648 Professional Services Educational Services , , , ,374 24,986 12, , , ,516 Health and Social Services ,745, , ,503 9,162 8, ,005,702 2,366,232 3,371,934 Others 67,304, ,620 46, ,907 11,265,232 42,411,126 17,158, ,886 1,518, ,498 9,494,987 73,371,764 77,152, ,524,375 Total 67,305, ,655 64,343 1,443,371-45,659, ,683,596 66,769,991 36,698,091 1,065,374 2,308, ,992 9,494, ,921, ,923, ,844,966 (*) Exposure categories are as per the Regulation on Measurement and Assessment of Capital Adequacy Ratios of Banks. (**) Includes risk amounts before the effect of credit risk mitigation but after the credit conversions. 1- Conditional and unconditional exposures to central governments or central banks 2- Conditional and unconditional exposures to regional governments or local authorities 3- Conditional and unconditional exposures to administrative bodies and non-commercial undertakings 4- Conditional and unconditional exposures to multilateral development banks 5- Conditional and unconditional exposures to international organisations 6- Conditional and unconditional exposures to banks and brokerage houses 7- Conditional and unconditional exposures to corporates 8- Conditional and unconditional retail exposures 9- Conditional and unconditional exposures secured by real estate property 10- Past due receivables 11- Receivables in regulatory high-risk categories 12- Exposures in the form of bonds secured by mortgages 13- Securitisation positions 14- Short term exposures to banks, brokerage houses and corporates 15- Shares 16- Other receivables 45
55 4.2.3 Analysis of maturity-bearing exposures according to remaining maturities Current Period Term To Maturity Exposure Categories (*) Up to Over 1 Demand Total Month Months Months Months Year Conditional and unconditional 1 exposures to central governments or 14,820,747 23,751,196 1,650, ,625 42,524,823 10,681,912 93,544,327 central banks Conditional and unconditional 2 exposures to regional governments 3, , , ,592 or local authorities Conditional and unconditional 3 exposures to administrative bodies ,651 15, ,763 11, ,865 and non-commercial undertakings Conditional and unconditional 4 exposures to multilateral 1,613,682 13,369 51,562 71,012 66,837-1,816,462 development banks Conditional and unconditional 5 exposures to international organisations Conditional and unconditional 6 exposures to banks and brokerage houses 9,393,739 1,988,724 1,807,593 2,152,437 19,163,615 3,667,096 38,173,204 7 Conditional and unconditional exposures to corporates 8,220,016 9,614,277 9,407,690 17,788,422 86,282,518 17,986, ,299,065 8 Conditional and unconditional retail exposures 8,439,791 4,925,061 2,413,635 5,023,648 43,488,580 17,572,813 81,863,528 Conditional and unconditional 9 exposures secured by real estate property 144, , ,857 1,614,223 32,905,831 2,961,105 38,559, Past due items ,161,094 1,161, Items in regulatory high-risk categories 235, ,484 1,967 12, , ,341 1,091, Exposures in the form of bonds secured by mortgages 13 Securitisation positions Short term exposures to banks, brokerage houses and corporates Exposures in the form of collective investment undertakings ,516 44, Shares , , Other items 36, , ,471,592 10,283,383 Total 42,908,992 41,747,700 16,018,979 26,795, ,926,811 64,051, ,448,843 (*) Includes risk amounts before the effect of credit risk mitigation but after the credit conversions. 46
56 Term To Maturity Exposure Categories (*) Up to Over 1 Demand Total Month Months Months Months Year Conditional and unconditional 1 exposures to central governments or 6,877,124 14,069,704 87,825 5,445 38,718,233 7,546,955 67,305,286 central banks Conditional and unconditional 2 exposures to regional governments 2, ,217 2, , ,655 or local authorities Conditional and unconditional 3 exposures to administrative bodies , ,343 2,694 64,343 and non-commercial undertakings Conditional and unconditional 4 exposures to multilateral ,379 1,436,992-1,443,371 development banks Conditional and unconditional 5 exposures to international organisations Conditional and unconditional 6 exposures to banks and brokerage houses 13,919,811 2,744,333 2,312,751 3,003,511 22,680, ,738 45,659,651 7 Conditional and unconditional exposures to corporates 9,374,574 11,462,845 12,423,601 18,147,263 80,021,580 5,253, ,683,596 8 Conditional and unconditional retail exposures 13,654,414 7,649,530 2,535,461 4,972,916 31,815,225 6,142,445 66,769,991 Conditional and unconditional 9 exposures secured by real estate property 227, , ,913 1,842,293 31,356,990 2,009,390 36,698, Past due items ,065,374 1,065, Items in regulatory high-risk categories 304, ,797 13,009 28, ,055 1,514,818 2,308, Exposures in the form of bonds secured by mortgages 13 Securitisation positions Short term exposures to banks, brokerage houses and corporates Exposures in the form of collective investment undertakings Shares , , Other items 646, ,848,280 9,494,987 Total 45,007,874 36,636,768 18,161,349 28,009, ,427,965 33,601, ,844,966 (*) Includes risk amounts before the effect of credit risk mitigation but after the credit conversions Exposure categories An international rating firm, Fitch Ratings external risk ratings are used to determine the risk weigths of the risk categories as per the Article 6 of the "Regulation on Measurement and Assessment of Capital Adequacy Ratios of Banks". The international risk ratings are used for the exposures to central governments and central banks, whereas for central governments and central banks that are not rated by Fitch Ratings, the published country ratings as announced by the Organisation for Economic Cooperation and Development (OECD) are used. According to the regulation on capital adequacy, external risk ratings are used only for the exposures to banks and brokerage houses and to corporates where the counterparties are resident in abroad, to determine their risk weights. Where the counterparties are domestic, the related exposures are included in the calculation of capital adequcy as unrated. 47
57 In the determination of risk weights for items that are not included in trading book; if a relevant rating is available then such rating, but if it is an unrated exposure then the rating available for the issuer is used. Fitch Ratings risk ratings as per the credit quality grades and the risk weights according to exposure categories are presented below: Credit Quality Grade Fitch Ratings Long Term Credit Rating Exposures to Central Governments or Central Banks Exposure Categories Exposures to Banks and Brokerage Houses Exposures with Original Maturities Less Than 3 Months Exposures with Original Maturities More Than 3 Months Exposures to Corporates 1 AAA to AA- 0% 20% 20% 20% 2 A+ to A- 20% 20% 50% 50% 3 BBB+ to BBB- 50% 20% 50% 100% 4 BB+ to BB- 100% 50% 100% 100% 5 B+ to B- 100% 50% 100% 150% 6 CCC+ and below 150% 150% 150% 150% Exposures by risk weights The total amount of exposures corresponding to each class of risk weight before and after credit risk mitigation and the deductions from equity as defined in the Regulation on Measurement and Assessment of Capital Adequacy Ratios of Banks Appendix-1 are presented below: Current Period 0% 10% 20% 35% 50% 75% 100% 150% 200% 250% Risk Weights Exposures before Credit Risk Mitigation Deductions from Equity 85,725,369-10,263,392 20,590,422 26,490,693 86,264, ,179, , , ,852 Exposures after Credit Risk Mitigation 86,476,219-9,355,827 20,574,657 25,457,059 75,615, ,437, , , ,852 0% 10% 20% 35% 50% 75% 100% 150% 200% 250% Risk Weights Exposures before Credit Risk Mitigation Deductions from Equity 47,225,556-11,824,122 19,397,663 65,531,157 71,641, ,011, ,891-1,368, ,632 Exposures after Credit Risk Mitigation 42,562,410-8,339,872 19,391,219 62,853,998 66,169, ,104, ,973-1,368, ,632 48
58 4.2.6 Information by major sectors and type of counterparties As per the TAS and TFRS; Impaired Credits; are the credits that either overdue more than 90 days as of the reporting date or are treated as impaired due to their creditworthiness. For such credits, specific provisons are allocated as per the Provisioning Regulation. Past Due Credits; are the credits that overdue upto 90 days but not impaired. For such credits, general provisions are allocated as per the Provisioning Regulation. Current Period Credit Risks Major Sectors/Counterparties Impaired Past Due Value Specific Credits Credits Adjustments Provisions Agriculture 155,115 30,974 1,012 95,810 Farming and Stockbreeding 150,783 18, ,983 Forestry 2,498 5, ,605 Fishery 1,834 7, ,222 Manufacturing 910, ,851 21, ,867 Mining and Quarrying 88,678 22, ,729 Production 653, ,351 19, ,404 Electricity, Gas and Water 168,273 4,254 1,389 84,734 Construction 560, ,417 7, ,482 Services 2,192,559 4,761, ,674 1,269,844 Wholesale and Retail Trade 1,092, ,570 9, ,365 Accomodation and Dining 216, ,666 5,623 80,230 Transportation and Telecommunication 738,037 3,790, , ,907 Financial Institutions 27,810 47, ,619 Real Estate and Rental Services 45,432 83, ,140 Professional Services Educational Services 41,762 15, ,226 Health and Social Services 29,730 33, ,027 Others 3,416,939 4,003,257 85,834 2,957,384 Total 7,235,634 9,778, ,319 5,278,387 49
59 Credit Risks Major Sectors/Counterparties Impaired Past Due Value Specific Credits Credits Adjustments Provisions Agriculture 180,128 18, ,186 Farming and Stockbreeding 174,721 15, ,949 Forestry 2,930 1, ,996 Fishery 2,477 1, ,241 Manufacturing 1,085, ,172 16, ,413 Mining and Quarrying 77,108 16, ,503 Production 857, ,410 9, ,448 Electricity, Gas and Water 151,030 88,471 6,943 70,462 Construction 577, ,042 4, ,482 Services 2,042,009 4,139,420 60,341 1,158,689 Wholesale and Retail Trade 1,142, ,516 15, ,623 Accomodation and Dining 197, ,809 3,417 77,717 Transportation and Telecommunication 540,862 3,464,249 39, ,261 Financial Institutions 22,488 1, ,801 Real Estate and Rental Services 39,633 58,346 1,081 18,832 Professional Services Educational Services 60,745 11, ,036 Health and Social Services 37,702 62, ,222 Others 3,381,821 4,103,598 93,102 2,948,899 Total 7,266,694 9,240, ,856 5,269, Movements in value adjustments and provisions Current Period Opening Provision for Provision Other Balance Period Reversals Adjustments(*) Closing Balance 1 Specific Provisions 5,269,669 2,512,542 2,582,570 78,746 5,278,387 2 General Provisions 3,215, ,877 55,973 16,232 3,673,669 Opening Provision for Provision Other Balance Period Reversals Adjustments(*) Closing Balance 1 Specific Provisions 4,645,986 3,318,987 2,826, ,930 5,269,669 2 General Provisions 3,027, ,321 47,251 21,487 3,215,533 (*) Includes foreign exchange differences, mergers, acquisitions and disposals of subsidiaries. 50
60 4.2.8 Exposures subject to countercyclical capital buffer Country Current Period Banking Book Trading Book Total Turkey 191,461, , ,103,328 Romania 6,289,347-6,289,347 the Netherlands 2,952,594-2,952,594 Switzerland 1,966,739-1,966,739 Germany 1,364,358-1,364,358 Malta 1,034,696-1,034,696 United Kingdom 918,835 14, ,027 United States of America 841, ,583 United Arab Emirates 667, ,167 Other 3,719,762-3,719,762 Total 211,216, , ,872,601 Country Banking Book Trading Book Total Turkey 181,046, , ,438,117 Romania 4,800,305-4,800,305 the Netherlands 2,857,402-2,857,402 Malta 1,547,367-1,547,367 Switzerland 1,500, ,500,739 United Kingdom 1,298,948-1,298,948 United States of America 782, ,401 Germany 738, ,573 NCTR 568, ,039 Belgium 358, ,115 Other 2,376, ,376,747 Total 197,874, , ,266, Consolidated currency risk Foreign currency open position limit is set in compliance with the legal standard ratio of net foreign currency position. As of 31 December 2017, the Bank and its financial affiliates net on balance sheet foreign currency short position amounts to TL 23,229,929 thousands (31 December 2016: TL 16,885,902 thousands), net off-balance sheet foreign currency long position amounts to TL 25,574,862 thousands (31 December 2016: TL 18,057,131 thousands), while net foreign currency long open position amounts to TL 2,344,933 thousands (31 December 2016: TL 1,171,229 thousands). The foreign currency position risk is measured by standard method and value-at-risk (VaR) model. Measurements by standard method are carried out monthly, whereas measurements by VaR are done daily for the Bank. The foreign currency exchange risk is managed through transaction, dealer, desk and stop-loss limits approved by the board of directors for the trading portfolio beside the foreign currency net position standard ratio and the VaR limit. 51
61 The Bank s effective exchange rates at the date of balance sheet and for the last five working days of the period announced by the Bank in TL are as follows: USD EUR The Bank s foreign currency purchase rate at balance sheet date Foreign currency rates for the days before balance sheet date; Day Day Day Day Day Last 30-days arithmetical average rate
62 The Bank s consolidated currency risk EUR USD Other FCs Total Current Period Assets Cash (Cash on Hand, Money in Transit, Purchased Cheques) and Balances with the 8,403,527 10,548,794 7,015,352 25,967,673 Central Bank of Turkey Banks 10,840,068 6,183,992 1,435,556 18,459,616 Financial Assets at Fair Value through Profit/Loss 106, ,437 10, ,484 Interbank Money Market Placements Financial Assets Available-for-Sale 3,059, ,507-4,055,456 Loans (*) 40,596,335 45,724,612 4,854,448 91,175,395 Investments in Associates, Affiliates and Joint-Ventures 1, ,313 Investments Held-to-Maturity - 11,413,578-11,413,578 Derivative Financial Assets Held for Hedging Purpose 4, ,659 2, ,062 Tangible Assets 122, , ,706 Intangible Assets Other Assets (**) 4,170,032 1,806, ,771 6,140,553 Total Assets 67,304,347 77,110,589 13,540, ,955,836 Liabilities Bank Deposits 443, , ,524 1,187,871 Foreign Currency Deposits 35,610,479 66,271,231 7,305, ,187,043 Interbank Money Market Takings 588,771 4,162, ,751,071 Other Fundings 14,548,040 31,248, ,618 45,970,461 Securities Issued (***) 2,500,436 12,023, ,939 15,480,924 Miscellaneous Payables 157, ,348 92, ,775 Derivative Financial Liabilities Held for Hedging Purpose 37,792 21, ,323 Other Liabilities (****) 731, ,124 2,297,544 3,757,297 Total Liabilities 54,617, ,526,334 11,041, ,185,765 Net On Balance Sheet Position 12,686,356 (38,415,745) 2,499,460 (23,229,929) Net Off-Balance Sheet Position (9,949,701) 37,114,158 (1,589,595) 25,574,862 Derivative Assets 11,968,644 79,250,502 5,366,884 96,586,030 Derivative Liabilities (21,918,345) (42,136,344) (6,956,479) (71,011,168) Non-Cash Loans Total Assets 54,860,658 83,730,189 6,039, ,630,179 Total Liabilities 50,388, ,038,005 9,089, ,516,081 Net On Balance Sheet Position 4,472,210 (18,307,816) (3,050,296) (16,885,902) Net Off-Balance Sheet Position (3,601,299) 18,158,120 3,500,310 18,057,131 Derivative Assets 18,444,171 61,491,621 6,826,814 86,762,606 Derivative Liabilities (22,045,470) (43,333,501) (3,326,504) (68,705,475) Non-Cash Loans (*) The foreign currency-indexed loans amounting TL 6,145,144 thousands included under TL loans in the accompanying consolidated financial statements are presented above under the related foreign currency code. (**) The foreign currency indexed factoring receivables amounting TL 282,716 thousands included under TL assets in the accompanying consolidated financial statements are presented above under the related foreign currency code. (***) Includes subordinated securities issued and presented under subordinated debts in balance sheet. (****) The gold deposits of TL 2,194,714 thousands included under deposits in the accompanying consolidated financial statements are presented above under other liabilities. 53
63 Current Period Türkiye Garanti Bankası AŞ and Its Financial Affiliates 4.4 Consolidated interest rate risk The interest rate risk resulting from balance sheet maturity mismatch presents the possible losses that may arise due to the changes in interest rates of interest sensitive assets and liabilities in the on- and offbalance sheet. Interest sensitivity of assets, liabilities and off-balance sheet items is evaluated during the Weekly Assesment Commitee and Assets-Liabilities Committee meetings taking into consideration the developments in market conditions. The Bank s interest rate risk is measured by using, economic value, economic capital, net interest income, income at risk, market price sensitivity of marketable securities portfolio, duration-gap and sensitivity analysis. The results are supported by the sensitivity and scenario analysis performed periodically due to the possible instabilities in the markets. Furthermore, the interest rate risk is monitored according to the limits approved by the board of directors Interest rate sensitivity of assets, liabilities and off balance sheet items (based on repricing dates) Up to 1 Month 1-3 Months 3-12 Months 1-5 Years 5 Years and Over Non-Interest Bearing (*) Assets Cash (Cash on Hand, Money in Transit, Purchased Cheques) and Balances with 15,356, ,247,034 33,603,641 the Central Bank of Turkey Banks 6,674,295 1,086,847 2,853, ,516 19,206 8,695,457 19,470,343 Financial Assets at Fair Value through Profit/Loss 43, , , ,685 18,939 1,957,448 2,877,813 Interbank Money Market Placements 3, ,353 Financial Assets Available-for-Sale 3,369,418 5,915,862 6,882,925 3,610,964 3,818,557 2,680,262 26,277,988 Loans 56,204,934 26,102,731 68,187,866 61,641,322 12,394,601 4,821, ,353,285 Investments Held-to-Maturity 417,769 2,557,519 6,615,860 3,706,564 7,446,829 3,569,999 24,314,540 Other Assets 1,468,583 1,466,149 2,586,527 2,849, ,430 11,787,524 20,430,704 Total Assets 83,538,775 37,457,041 87,282,189 72,323,542 23,970,562 51,759, ,331,667 Total Liabilities Bank Deposits 412, , , ,676 1,625,822 Other Deposits 111,791,881 21,066,467 18,103,418 1,527,939 15,910 46,642, ,147,738 Interbank Money Market Takings 17,589, , , ,770 51,133 30,241 18,637,856 Miscellaneous Payables ,376,346 10,376,346 Securities Issued (**) 1,882,236 3,084,627 2,058,452 10,437,488 5,762, ,306 23,643,923 Other Fundings 19,202,561 9,712,955 11,732,040 5,769, , ,685 47,104,719 Other Liabilities 5,719 7,353 11, ,769,630 55,795,263 Total Liabilities 150,884,050 34,237,648 32,316,568 18,324,748 6,315, ,253, ,331,667 On Balance Sheet Long Position - 3,219,393 54,965,621 53,998,794 17,654, ,838,724 On Balance Sheet Short Position (67,345,275) (62,493,449) (129,838,724) Off-Balance Sheet Long Position 11,872,825 9,119,489 15,792,731 3,922,311 5,154,466-45,861,822 Off-Balance Sheet Short Position (2,115,278) (4,562,046) (12,408,103) (15,905,631) (10,911,130) - (45,902,188) Total Position (57,587,728) 7,776,836 58,350,249 42,015,474 11,898,252 (62,493,449) (40,366) (*) (**) Interest accruals are included in non-interest bearing column. Includes subordinated securities issued and presented under subordinated debts in balance sheet. 54
64 Up to 1 Month 1-3 Months 3-12 Months 1-5 Years 5 Years and Over Non-Interest Bearing (*) Assets Cash (Cash on Hand, Money in Transit, Purchased Cheques) and Balances 17,892, ,059,042 23,951,474 with the Central Bank of Turkey Banks 6,642,107 2,287,260 3,103,033 21,108-4,827,536 16,881,044 Financial Assets at Fair Value through Profit/Loss 63,776 34,448 17,241 43,336 44,247 3,602,493 3,805,541 Interbank Money Market Placements 373, ,871 Financial Assets Available-for-Sale 2,613,361 5,753,708 5,630,419 3,956,191 4,512,684 1,517,085 23,983,448 Loans 49,351,478 25,521,684 59,026,227 50,347,703 12,807,805 4,354, ,409,096 Investments Held-to-Maturity 499,275 2,002,859 5,554,835 5,329,013 7,297,741 2,425,973 23,109,696 Other Assets 1,296,742 1,263,427 2,189,367 2,932, ,882 10,624,571 18,607,769 Total Assets 78,733,031 36,863,386 75,521,122 62,630,131 24,963,359 33,410, ,121,939 Total Liabilities Bank Deposits 1,253,814 94, , ,817,202 4,487,946 Other Deposits 98,198,502 22,668,701 13,539,995 1,640,164 13,467 38,141, ,201,867 Interbank Money Market Takings 10,487, , , ,140 47,531 10,620 11,230,193 Miscellaneous Payables ,339,748 9,339,748 Securities Issued 676,307 1,760,759 5,012,872 7,843,021 2,098, ,386 17,745,648 Other Fundings 14,334,313 17,633,891 8,921,661 5,207, , ,666 46,581,853 Other Liabilities 4,296 5,577 11, ,513,348 48,534,684 Total Liabilities 124,954,367 42,369,943 28,027,673 14,949,572 2,338,376 99,482, ,121,939 On Balance Sheet Long Position ,493,449 47,680,559 22,624, ,798,991 On Balance Sheet Short Position (46,221,336) (5,506,557) (66,071,098) (117,798,991) Off-Balance Sheet Long Position 8,702,855 11,799,365 12,492,698 5,452,678 4,244,593-42,692,189 Off-Balance Sheet Short Position (2,015,891) (6,163,621) (9,696,072) (13,715,662) (11,205,806) - (42,797,052) Total Position (39,534,372) 129,187 50,290,075 39,417,575 15,663,770 (66,071,098) (104,863) (*) Interest accruals are included in non-interest bearing column. 55
65 4.4.2 Average interest rates on monetary financial instruments (%) Current Period EUR USD JPY TL Assets Cash (Cash on Hand, Money in Transit, Purchased Cheques) and Balances with the Central Bank of Turkey Banks (0.36) Financial Assets at Fair Value through Profit/Loss Interbank Money Market Placements Financial Assets Available-for-Sale Loans Investments Held-to-Maturity Liabilities Bank Deposits Other Deposits Interbank Money Market Takings Miscellaneous Payables Securities Issued Other Fundings EUR USD JPY TL Assets Cash (Cash on Hand, Money in Transit, Purchased Cheques) and Balances with the Central Bank of Turkey Banks (0.35) Financial Assets at Fair Value through Profit/Loss Interbank Money Market Placements Financial Assets Available-for-Sale Loans Investments Held-to-Maturity Liabilities Bank Deposits Other Deposits Interbank Money Market Takings Miscellaneous Payables Securities Issued Other Fundings
66 4.5 Consolidated position risk of equity securities Equity shares in associates and affiliates Accounting policies for equity shares in associates and affiliates are disclosed in Note Comparison of carrying, fair and market values of equity shares Current Period Comparison Equity Securities (shares) Carrying Value Fair Value Market Value 1 Investment in Shares- Grade A 124, Quoted Securities Investment in Shares- Grade B 25, Quoted Securities Investment in Shares- Grade C Quoted Securities Investment in Shares- Grade D Quoted Securities Investment in Shares- Grade E 1, Quoted Securities Investment in Shares- Grade F Quoted Securities Comparison Equity Securities (shares) Carrying Value Fair Value Market Value 1 Investment in Shares- Grade A 124, Quoted Securities Investment in Shares- Grade B 27, Quoted Securities Investment in Shares- Grade C Quoted Securities Investment in Shares- Grade D Quoted Securities Investment in Shares- Grade E 1, Quoted Securities Investment in Shares- Grade F Quoted Securities Realised gains/losses, revaluation surpluses and unrealised gains/losses on equity securities and results included in core and supplementary capitals Revaluation Surpluses Unrealized Gains and Losses Current Period Portfolio Gains/Losses in Current Period Total Amount in Tier I Capital Total Amount in Core Capital Amount in Tier I Capital 1 Private Equity Investments Quoted Shares ,905-14,905 3 Other Shares - 48,372 48, Total - 48,372 48,372 14,905-14,905 57
67 Portfolio Gains/Losses in Current Period Revaluation Surpluses Total Amount in Tier I Capital Total Unrealized Gains and Losses Amount in Core Capital Amount in Tier I Capital 1 Private Equity Investments Quoted Shares ,997-13,997 3 Other Shares - 7,080 7, Total - 7,080 7,080 13,997-13, Capital requirement as per equity shares Current Period Portfolio Carrying Value RWA Total Minimum Capital Requirement 1 Private Equity Investments Quoted Shares Other Shares 152, ,432 12,195 Total 152, ,432 12,195 Portfolio Carrying Value RWA Total (*) Capital Minimum Requirement 1 Private Equity Investments Quoted Shares Other Shares 153, ,857 12,229 Total 153, ,857 12,229 (*) Additional to total RWA as of 31 December 2016, 250% risk weight is applied to TL 1,125,107 thousands according to Regulation on Capital Adequacy Ratio Annex-1 Paragraph 73 and Regulation on Bank Capital Article 9 Paragraph 4 (ç), which is not deducted from Common Equity Tier 1 Capital. 4.6 Consolidated liquidity risk Liquidity risk is managed by asset and liability management department (ALMD) and asset and liability Committee (ALCO) in line with liquidity and funding policies and risk appetite approved by the board of directors in order to take the necessary measures in a timely and correct manner against possible liquidity shortages that may result from market conditions and balance sheet structure. Under stressed conditions, liquidity risk is managed within the contingency funding plan framework. The board of directors reviews the liquidity risk management policy and approves the liquidity and funding policies, ensures the effective of practice of policies and integrations with the Bank s risk management system. The Board of Directors determines the basic metrics in liquidity risk measurement and monitoring. The Board of Directors establishes risk appetite of the Bank in liquidity risk management and identifies the risk limits in accordance with the risk appetite and reviews it regularly. ALCO takes necessary decisions which will be executed by related departments by assessing the liquidity risk that the Bank is exposed to and considering the Bank s strategy and conditions of competition and pursues the implementations. ALMD, performs daily liquidity management by ensuring compliance with regulatory and internal liquidity limits and monitoring related early warning indicators in case of probable liquidity squeezes. The medium and long term liquidity and funding management is performed by ALMD in accordance with ALCO decisions. 58
68 Risk management head defines the Bank s liquidity risk, measures and monitors the risks with liquidity risk measurement methods that are in compliance with international standards, presents measurement results periodically to related departments, committees and senior management. Risk management department coordinates related parties in order to ensure compliance of risk management process in accordance with the Bank s risk profile, operation environment and strategic plan with regulations. Risk management department analyses, develops and revises relevant liquidity risk measurement in accordance with changing market conditions and the Bank s structure. Risk management department reviews assumptions and parameters used in liquidity risk analysis. The liquidity risk analysis and the important liquidity indicators are reported monthly to related senior management. Additionally, analysis and monitored internal ratios related to liquidity risk are presented in ALCO report. Internal liquidity metrics are monitored with limit and alert levels approved by the board of directors and reported regularly to related parties. Decentralized management approach is adopted in liquidity management. Each subsidiary controlled by the Bank performs daily, medium and long term liquidity management independently from the Bank by the authorities in each subsidiary responsible for managing liquidity risk. In addition, within the scope of consolidated risk management, liquidity and funding risk of each subsidiary in control are monitored via the liquidity risk management methods identified by the Bank by considering the operations, risk profile and regulations of the related subsidiary. The Bank's funding management is carried out in compliance with the ALCO decisions. Funding and placement strategies are developed by assessing liquidity. In liquidity risk management actions that will be taken and procedures are determined by considering normal economic conditions and stress conditions. Diversification of assets and liabilities is assured so as to be able to continuously meet the obligations, also taking into account the relevant currencies. Funding sources are monitored actively during identification of concentration risk related to funding. The Bank's funding base of customer deposits, interbank and other borrowing transactions are diversified in order to prevent the concentration of a particular funding source. Factors that could trigger the sudden and significant run off in funds or impair the accessibility of the funding sources are analyzed. Additionally, securities which are eligible as collateral at CBRT issued by Republic of Turkey Treasury and have active secondary market are comprised in the Bank s assets. In the context of TL and foreign currencies liquidity management, the cash flows regarding assets and liabilities are monitored and the required liquidity in future periods is forecasted. In cash flow analysis, stress is applied to items that affect the liquidity by volume and rate of change from a liquidity management point of view. Liquidity risk exposed by the Bank is managed by establishing risk appetite, risk mitigation according to the liquidity and funding policies (diversification of funding sources, holding high quality liquid assets reserve) and effective control environment and closely monitoring by limits. For those risks that cannot be reduced, the adoption of the current level of risk, reduction or termination of the activities that cause the risk is considered. In liquidity risk stress testing framework, the level of the Bank s ability to cover cash outflows in liquidity crisis scenario based on the Bank s current cash flow structure, by high quality liquid assets is calculated. Scenario analysis are performed by assessing changing balance sheet structure, liquidity requirements and market conditions. The results of liquidity risk stress testing are taken into consideration in the assessment of liquidity adequacy and identification of policy regarding liquidity risk and contingency funding plan is prepared within this framework. 59
69 There exists Liquidity Emergency Plan in the Bank including mechanisms to prevent increase in liquidity risk scenarios for different conditions and levels. Available liquidity sources are determined by considering the liquidity squeezes. Within the framework of this plan, the Bank monitors liquidity risk in terms of early warning indicators, and probable scenarios where liquidity risk crisis and possible actions that can be taken. The Bank s liabilities consist of TL and foreign currency funding, of which a large portion is USD/EUR. Deposits and capital constitute most of TL funding. For the reasons like real person customers can not use foreign currency credit but are able to deposit foreign currency funds, TL and foreign currency deposit and credit amount may differ. Long term funding obtained from foreign banks and creditors are mainly in foreign currency. For these reasons overall foreign currency liabilities are usually more than foreign currency liabilities. Unused portion of USD and EUR foreign currency funding is turned to TL via currency swap transactions and used in TL funding. Lines extended by CBRT and BİST aren t used to full extent, unused limits and high quality liquid asset stock is held is kept to use in the case of a liquidity scarcity in market. Also T.C. Eurobonds aren t used to secure funding and kept as reserve to use in the case of a foreign currency liquidity scarcity in market. In TL and foreign currency liquidity management, regulatory ratios, internally set warnings, limits and other liquidity and funding metrics are monitored Liquidity coverage ratio Liquidity Coverage Ratio (LCR), aims for the banks having the ability to cover 30 days of liquidity needs with their own cash and high quality liquid assets that are easy to convert to cash during liquidity shortages in the markets. With that perspective and according to Regulation for Banks Liquidity Coverage Ratio Calculations (the Regulation) terms LCR ratio is calculated by having high quality liquid assets divided by net cash outflows. After a transition period that will end by 1 January 2019, in both bank-only and consolidated basis, LCR ratio should be at least 80% for foreign currency and 100% for total. Items in balance sheet and off balance sheet items are taken into account after being multiplied by the coefficients advised in the Regulation. In both bank-only and consolidated LCR calculations cash inflows are limited by 75% of cash outflows and cash inflows from high quality liquid assets aren t included. High quality liquid assets consist of cash, deposits in central banks and securities considered as high quality liquid assets. Reserve deposits are included in high quality liquid assets, limited by the amount that is allowed by central bank to use in liquidity shortages. High quality liquid assets are composed of 3.86% cash, 53.27% deposits in central banks and 42.87% securities considered as high quality liquid assets. The Bank s main funding sources are deposits, funds borrowed, money market borrowings and securities issued. Consolidated funding source composition as of report date is 66.81% deposits, 21.88% funds borrowed and money market borrowings and 7.87% securities issued. In consolidated LCR calculations, cash outflows are mainly consist of deposits, secured and unsecured borrowings, securities issued and off balace sheet items. The cash flows from derivative financial instruments are included in consolidated LCR calculations according to the Regulation s terms. The Bank also considers changes in fair value of the liabilities that result in margin calls when calculating cash outflows. 60
70 There was an increase in high quality liquid assets in items included in LCR calculations during the period. Current Period Total Unweighted Value (Average) (*) Total Weighted Value (Average) (*) TL+FC FC TL+FC FC High-Quality Liquid Assets 64,790,253 40,139,185 1 Total high-quality liquid assets (HQLA) 64,790,253 40,139,185 Cash Outflows Retail deposits and deposits from small 2 business customers, of which: 135,642,321 66,124,346 12,251,062 6,599,097 3 Stable deposits 26,263, ,749 1,313,169 13,337 4 Less stable deposits 109,378,932 65,857,597 10,937,893 6,585,760 5 Unsecured wholesale funding, of which: 61,137,592 37,122,946 34,871,826 19,709,976 6 Operational deposits Non-operational deposits 44,548,861 28,938,651 21,421,150 13,772,645 8 Unsecured funding 16,588,731 8,184,295 13,450,676 5,937,331 9 Secured wholesale funding Other cash outflows of which: 53,605,853 13,861,660 11,511,430 11,493,014 Outflows related to derivative exposures and 11 other collateral requirements 8,160,609 10,645,765 8,160,609 10,645, Outflows related to restructured financial instruments Payment commitments and other off-balance sheet commitments granted for debts to 45,445,244 3,215,895 3,350, ,249 financial markets 14 Other revocable off-balance sheet commitments and contractual obligations 659, ,474 32,986 22, Other irrevocable or conditionally revocable off-balance sheet obligations 59,639,580 40,843,912 2,981,979 2,042, Total Cash Outflows 61,649,283 39,866,907 Cash Inflows 17 Secured receivables 7, Unsecured receivables 23,650,905 9,432,284 15,575,537 6,682, Other cash inflows 1,636,498 8,248,238 1,631,773 8,244, Total Cash Inflows 25,294,548 17,680,522 17,207,310 14,927,495 Upper Limit Applied Values 21 Total HQLA 64,790,253 40,139, Total Net Cash Outflows 44,441,973 24,939, Liquidity Coverage Ratio (%) (*) The average of last three months month-end consolidated liquidity ratios. The table below presents the last three months consolidated Liquidity Ratios: Period TL+FC FC 31 October % % 30 November % % 31 December % % 61
71 Total Unweighted Value (Average) (*) Total Weighted Value (Average) (*) TL+FC FC TL+FC FC High-Quality Liquid Assets 45,090,574 22,119,347 1 Total high-quality liquid assets (HQLA) 45,090,574 22,119,347 Cash Outflows Retail deposits and deposits from small 2 business customers, of which: 116,761,030 56,119,861 10,456,146 5,602,111 3 Stable deposits 24,399, ,514 1,219,957 9,876 4 Less stable deposits 92,361,892 55,922,347 9,236,189 5,592,235 5 Unsecured wholesale funding, of which: 52,366,443 31,129,537 30,831,694 17,157,234 6 Operational deposits Non-operational deposits 37,094,336 24,296,740 18,652,878 12,182,976 8 Unsecured funding 15,272,107 6,832,797 12,178,816 4,974,258 9 Secured wholesale funding 367, , Other cash outflows of which: 51,791,461 15,362,666 12,104,797 11,314,382 Outflows related to derivative exposures and 11 other collateral requirements 9,048,417 10,460,072 9,048,417 10,460, Outflows related to restructured financial instruments Payment commitments and other off-balance sheet commitments granted for debts to 42,743,044 4,902,594 3,056, ,310 financial markets 14 Other revocable off-balance sheet commitments and contractual obligations 2,145,910 2,004, , , Other irrevocable or conditionally revocable off-balance sheet obligations 55,273,763 38,426,973 2,763,688 1,921, Total Cash Outflows 56,631,043 36,462,706 Cash Inflows 17 Secured receivables 19, Unsecured receivables 20,265,164 7,568,440 13,532,742 5,254, Other cash inflows 1,744,748 5,749,639 1,738,284 5,743, Total Cash Inflows 22,029,440 13,318,079 15,271,026 10,997,895 Upper Limit Applied Values 21 Total HQLA 45,090,574 22,119, Total Net Cash Outflows 41,360,017 25,464, Liquidity Coverage Ratio (%) (*) The average of last three months month-end consolidated liquidity ratios. Period TL+FC FC 31 October % 83.64% 30 November % 95.90% 31 December % 80.63% 62
72 4.6.2 Contractual maturity analysis of liabilities according to remaining maturities Demand Up to 1 Month 1-3 Months 3-12 Months 1-5 Years 5 Years and Over Undistributed (*) Current Period Assets Cash (Cash on Hand, Money in Transit, Purchased Cheques) And Balances with the 7,366,915 26,236, ,603,641 Central Bank Banks 10,284,079 3,139, ,394 1,539,869 4,143,947 19,226-19,470,343 Financial Assets at Fair Value through Profit/Loss 40, , , , , ,692-2,877,813 Interbank Money Market Placements - 3, ,353 Financial Assets Available-for- Sale 274, ,142 16,315 1,302,458 12,784,887 11,354,314-26,277,988 Loans 647,492 37,892,655 19,249,687 56,952,579 85,925,980 23,999,173 4,685, ,353,285 Investments Held-to-Maturity - 1, ,380 1,106,532 3,310,421 9,077,305 10,663,172 24,314,540 Other Assets 2,247,891 2,350,668 1,524,335 2,313,814 3,747, ,385 7,766,147 20,430,704 Total Assets 20,861,306 70,663,534 21,932,527 63,847, ,661,376 45,250,095 23,115, ,331,667 Total Liabilities Bank Deposits 918, , , , ,625,822 Other Deposits 53,366, ,663,125 21,198,227 18,279,358 1,617,338 23, ,147,738 Other Fundings - 1,842, ,616 18,198,270 18,138,380 8,398,683-47,104,719 Interbank Money Market Takings ,614, , , ,770 51,684-18,637,856 Securities Issued (**) - 1,853,586 2,973,024 2,250,354 10,732,278 5,834,681-23,643,923 Miscellaneous Payables 881,474 9,398,989 52,282 43, ,376,346 Other Liabilities (***) 1,781,846 1,515, ,726 1,186, , ,755 50,071,535 55,795,263 Total Liabilities 56,948, ,194,518 25,940,033 40,373,833 31,259,135 14,544,538 50,071, ,331,667 Liquidity Gap (36,086,727) (66,530,984) (4,007,506) 23,473,958 79,402,241 30,705,557 (26,956,539) - Net Off-Balance Sheet Position - (498,276) (173,639) (352,946) 275,705 37,607 - (711,549) Derivative Financial Assets - 77,833,182 28,433,105 32,107,432 5,638,883 1,881, ,894,077 Derivative Financial Liabilities - 78,331,458 28,606,744 32,460,378 5,363,178 1,843, ,605,626 Non-Cash Loans - 8,082,943 4,478,582 6,769,545 1,186, ,692 93,022, ,787,283 Total Assets 17,662,498 56,025,807 21,128,903 54,849, ,224,879 50,385,570 10,844, ,121,939 Total Liabilities 49,705, ,180,029 27,639,427 40,524,381 26,819,626 9,348,265 41,905, ,121,939 Liquidity Gap (32,042,681) (60,154,222) (6,510,524) 14,324,991 74,405,253 41,037,305 (31,060,122) - Net Off-Balance Sheet Position - 526,190 (104,836) 547,096 5,636 87,715-1,061,801 Derivative Financial Assets - 60,394,076 27,198,909 34,159,810 9,584,052 1,610, ,947,580 Derivative Financial Liabilities - 59,867,886 27,303,745 33,612,714 9,578,416 1,523, ,885,779 Non-Cash Loans - 4,255,623 4,910,315 6,374,916 1,089, ,599 89,084, ,937,951 (*) Certain assets on the balance sheet that are necessary for the banking operations but not convertable into cash in short period such as tangible assets, investments in associates and affiliates, stationary supplies, prepaid expenses and loans under followup, are included in this column. (**) Includes subordinated securities issued and presented under subordinated loans debt balance sheet. (***) Shareholders Equity is included in Other liabilities line under Undistributed column. 63
73 Contractual maturity analysis of liabilities according to remaining maturities The remaining maturities table of the contractual liabilities includes the undiscounted future cash outflows for the principal amounts of the Bank and its financial affiliates financial liabilities as per their earliest likely contractual maturities. Current Period Carrying Value Nominal Principal Outflow Demand Up to 1 Month 1-3 Months 3-12 Months 1-5 Years 5 Years and Over Bank Deposits 1,625,822 1,623, , , , , Other Deposits 199,147, ,282,621 53,366, ,196,406 21,053,390 18,037,402 1,606,260 23,148 Other Fundings 47,104,719 46,940,914-1,755, ,686 18,174,300 18,111,911 8,343,385 Interbank Money Market Takings 18,637,856 18,607, ,589, , , ,770 51,133 Securities Issued 23,643,923 23,225,618-1,844,478 2,944,922 2,198,156 10,475,247 5,762,815 Total 290,160, ,679,962 54,284, ,692,108 24,920,244 38,820,817 30,782,188 14,180,481 Carrying Value Nominal Principal Outflow Demand Up to 1 Month 1-3 Months 3-12 Months 1-5 Years 5 Years and Over Bank Deposits 4,487,946 4,480,851 2,912,318 1,151,604 94, , Other Deposits 174,201, ,564,384 43,812,427 91,883,002 22,654,467 13,465,056 1,727,342 22,090 Other Fundings 46,581,853 46,289,185-2,081,588 1,886,656 20,007,331 15,873,073 6,440,537 Interbank Money Market Takings 11,230,193 11,219, ,487, , , ,140 47,531 Securities Issued 17,745,648 17,391, ,177 1,683,472 5,012,872 7,955,438 2,098,303 Total 254,247, ,945,344 46,724, ,244,509 26,525,605 39,026,944 25,814,993 8,608,461 64
74 4.7 Consolidated leverage ratio The leverage ratio table prepared in accordance with the communiqué Regulation on Measurement and Assessment of Leverage Ratios of Banks published in the Official Gazette no dated 5 November 2013 is presented below: The Bank s consolidated leverage ratio calculated by taking simple average of end of month leverage ratios for the last three-month periods, is 8.41% (31 December 2016: 8.23%). Main reason for the variance compared to prior period is the increase in balance sheet and off balance sheet exposures lower than the increase in capital. While the capital increased by 15.84% as a result of increase in net profits, the balance sheet exposure increased by 15.33% and the off balance sheet exposure increased by 7.67%. Therefore, the current period leverage ratio increased by 18 basis points compared to prior period. Current Period (***) (***) 1 Total assets in consolidated financial statements prepared in accordance with Turkish Accounting Standards (*) (**) 336,616, ,318,527 2 The difference between total assets prepared in accordance with Turkish Accounting Standards (*) and total assets in consolidated financial statements prepared in accordance with the communiqué Preparation of Consolidated Financial Statements (**) 3,062,255 3,803,412 3 The difference between the amounts of derivative financial instruments and credit derivatives in consolidated financial statements prepared in accordance with the communiqué Preparation of Consolidated Financial Statements and risk amounts of such instruments (10,547,347) (8,436,784) 4 The difference between the amounts of securities or commodity financing transactions in consolidated financial statements prepared in accordance with the communiqué 12,921,783 14,523,665 Preparation of Consolidated Financial Statements and risk amounts of such intruments 5 The difference between the amounts of off-balance items in consolidated financial statements prepared in accordance with the communiqué Preparation of Consolidated 3,765,170 2,550,420 Financial Statements and risk amounts of such items 6 Other differences between the amounts in consolidated financial statements prepared in accordance with the communiqué Preparation of Consolidated Financial Statements and - - risk amounts of such items 7 Total risk amount 480,096, ,189,090 (*) Consolidated financial statements prepared in compliance with the paragraph 6 of article 5 of the communiqué Preparation of Consolidated Financial Statements. (**) For the current period consolidated financial statements prepared in accordance with Turkish Accounting Standards as of 30 September 2017 and for the prior period consolidated financial statements prepared in accordance with Turkish Accounting Standards as of 31 December 2016 are used. (***) Amounts in the table are three-month average amounts. 65
75 Current Period (*) (*) On-balance sheet assets On-balance sheet items (excluding derivative financial instruments and credit 1 derivatives but including collateral) 352,252, ,441,515 2 (Assets deducted in determining Tier I capital) (455,111) (380,379) 3 Total on-balance sheet risks (sum of lines 1 and 2) 351,797, ,061,136 Derivative financial instruments and credit derivatives 4 Replacement cost associated with all derivative financial instruments and credit derivatives 3,061,421 3,494,125 5 Add-on amounts for PFE associated with all derivative financial instruments and credit derivatives 11,169,170 8,482,319 6 Total risks of derivative financial instruments and credit derivatives (sum of lines 4 and 5) 14,230,591 11,976,444 Securities or commodity financing transactions (SCFT) 7 Risks from SCFT assets (excluding on-balance sheet) 2,561,479 1,645,458 8 Risks from brokerage activities related exposures Total risks related with securities or commodity financing transactions (sum of lines 7 and 8) 2,561,479 1,645,458 Other off-balance sheet transactions 10 Gross notional amounts of off-balance sheet transactions 115,272, ,056, (Adjustments for conversion to credit equivalent amounts) (3,765,174) (2,550,420) 12 Total risks of off-balance sheet items (sum of lines 10 and 11) 111,507, ,506,052 Capital and total risks 13 Tier I capital 40,355,639 34,836, Total risks (sum of lines 3, 6, 9 and 12) 480,096, ,189,090 Leverage ratio 15 Leverage ratio 8.41% 8.23% (*) Amounts in the table are three-month average amounts. 4.8 Fair values of financial assets and liabilities Carrying Value Fair Value Current Period Current Period Financial Assets 329,714, ,623, ,642, ,919,196 Interbank Money Market Placements 3, ,871 3, ,871 Banks (*) 49,765,564 37,747,565 49,765,564 37,747,565 Financial Assets Available-for-Sale 26,277,988 23,983,448 26,277,988 23,983,448 Investments Held-to-Maturity 24,314,540 23,109,696 24,600,253 22,799,307 Loans 229,353, ,409, ,995, ,015,005 Financial Liabilities 300,536, ,587, ,536, ,587,255 Bank Deposits 1,625,822 4,487,946 1,625,822 4,487,946 Other Deposits 199,147, ,201, ,147, ,201,867 Other Fundings from Financial Institutions 65,742,575 57,812,046 65,742,575 57,812,046 Securities Issued (**) 23,643,923 17,745,648 23,643,923 17,745,648 Miscellaneous Payables 10,376,346 9,339,748 10,376,346 9,339,748 (*) Including the balances at the Central Bank of Turkey. (**) Including subordinated securities issued and presented under subordinated debts in balance sheet. 66
76 Fair values of financial assets available-for-sale and investments held-to-maturity are derived from market prices or in case of absence of such prices, market prices of other securities quoted in similar qualified markets and having substantially similar characteristics in terms of interest, maturity and other conditions. Fair values of loans are calculated discounting future cash flows at current market interest rates for fixed-rate loans. The carrying values of floating-rate loans are deemed an approximation for their fair values. Fair values of other financial assets and liabilities represent the total acquisition costs and accrued interest. The table below analyses the financial instruments carried at fair value, by valuation method: Current Period Level 1 Level 2 Level 3 Total Financial Assets Available-for-Sale 23,786,851 2,384, ,573 26,277,988 Financial Assets Held for Trading 928, , ,824 Derivative Financial Assets Held for Trading 1,205 1,945,784-1,946,989 Derivative Financial Assets Held for Risk Management - 670, ,720 Financial Assets at Fair Value 24,716,076 5,001, ,290 29,826,521 Derivative Financial Liabilities Held for Trading 230 2,898,592-2,898,822 Funds Borrowed - 9,228,338-9,228,338 Derivative Financial Liabilities Held for Risk Management - 198, ,826 Financial Liabilities at Fair Value ,325,756-12,325,986 Level 1 Level 2 Level 3 Total Financial Assets Available-for-Sale 23,120, , ,629 23,983,448 Financial Assets Held for Trading 191, ,828 Derivative Financial Assets Held for Trading 12,449 3,601,264-3,613,713 Derivative Financial Assets Held for Risk Management - 666, ,295 Financial Assets at Fair Value 23,324,913 4,513, ,629 28,455,284 Derivative Financial Liabilities Held for Trading 977 3,713,008-3,713,985 Funds Borrowed - 1,763,177-1,763,177 Derivative Financial Liabilities Held for Risk Management - 343, ,314 Financial Liabilities at Fair Value 977 5,819,499-5,820,476 Level 1 : quoted prices (unadjusted) in active markets for identical assets or liabilities Level 2 : inputs other than quoted prices included within Level 1 that are observable for the asset or liability, either directly (as prices) or indirectly (derived from prices) Level 3: inputs for the asset or liability that are not based on observable market data (unobservable inputs) The movement of financial assets in Level 3 is presented below. Current Period Balances at Beginning of Period 616, ,698 Purchases During the Period 41,085 96,517 Disposals Through Sale/Redemptions (495,861) (83,451) Valuation Effect (3,805) (6,335) Transfers (48,758) 36,200 Balances at End of Period 109, , Transactions carried out on behalf of customers and items held in trust None. 67
77 4.10 Risk management objectives and policies The notes under this caption are prepared as per the Regulation on Calculation of Risk Management Disclosures published in the Official Gazette no dated 23 October Risk management strategy and weighted amounts Risk management strategy The Bank s risk management strategy is to ensure that risk management culture is recognized and risk management principles are widely embraced throughout the Bank and its affiliates, an integrated risk management system is established which pursues risk-return-capital relationship. Essential principles are adopted in order to ensure that policies determined to assess and manage risks the Bank is exposed to, are kept updated, adapted to changing conditions, applied and managed. It is the ultimate responsibility of the senior management to apply and improve risk management strategies, policies and procedures that are approved by the board of directors, inform the board of directors about the important risks the Bank is exposed to, assess internal control, internal audit and risk reports with regard to the Banks departments and to eliminate the risks, deficiencies or defects identified in these departments or to take the necessary precautionary actions to prevent those risks, deficiencies and defects and participate in the determination of risk limits. Policies and procedures regarding risk management are established for consolidated affiliates. Policies and procedures are prepared in compliance with applicable legislations that the affiliate subject to and the parent Bank s risk management strategy, reviewed regularly and revised if necessary. The parent Bank ensures that risk management system is applied in affiliates where risks are defined, measured, monitored and controlled. Risk management activities are structured under the responsibility of the board of directors. The Risk Committee composed of the members of the board is responsible to oversee the Bank s risk management policies and practices, including the alignment with its strategic objectives and management's ability to assess and manage the various risks present in its activities including capital adequacy and planning and liquidity adequacy, as well as all other risk management functions envisioned under the applicable laws and regulations. Upper level management is responsible against the board of directors for the monitoring and management of risks that their departments are exposed to. Accordingly, the Risk Management, which performs risk management functions, reports to the board of directors via the Risk Committee, whereas the Internal Audit Department, performing internal audit functions, the Internal Control Unit, performing internal control functions, and the Compliance Department, which implements compliance controls and performs activities to prevent laundering proceeds of crime, and financing of terrorism, report directly to the board of directors. The Bank s main approach for the implementation of risk management model is establishing risk culture throughout the Bank, and aims that the importance of risk management for maintaining business operations is understood and risk awareness and sensitivity is ensured for decision making and implementation mechanisms process by all employees. The Bank measures and monitors risks that exposed to, considering methods suitable with international standards, compliant with legislation. Risk measuring and reporting are performed via advanced methods and risk management softwares. Risk based detailed reports are prepared for management of significant risks, in order to determine strategies and take decisions, in this scope, periodic and nonperiodic reports are prepared for board of directors, relevant committees and senoir management. The Bank s risk appetite framework determines the risk level that the board of directors is prepared to accept in order to accomplish the goals and strategies with due consideration to the capacity of the institution to safely absorbs those risks and the Bank monitors regularly risk appetite metrics regarding capital, liquidity, income recurrence and risk based limits. Risks that the Bank is exposed is managed by 68
78 providing effective control environment and monitoring limits. Unmitigated risks are either accepted with current risk levels or decreasing/ terminating the activity that causes the risk. The Risk Management function conducts the implementation of internal capital adequacy assessment report, to be sent to the BRSA by coordinating relevant parties. Stress test report is reported to the BRSA, which evaluates how adverse effects on macroeconomic parameters, in the scope of determined scenarios, affect the Bank s three year budget plan and results, and certain ratios, including capital adequacy. Training programs for employees, risk reports to the board of directors, senior management and committees, risk appetite framework established by the Bank and internal capital adequacy assessment process generate significant inputs to ensure that risk management culture is widely embraced Risk weighted amounts Minimum Risk Weighted Amounts Capital Requirements Current Period Current Period 1 Credit risk (excluding counterparty credit risk) (CCR) (*) 241,262, ,091,394 19,300,998 2 Of which standardised approach (SA) 241,262, ,091,394 19,300,998 3 Of which internal rating-based (IRB) approach Counterparty credit risk 3,837,586 5,680, ,007 5 Of which standardised approach for counterpary credit risk (SA-CCR) 3,837,586 5,680, ,007 6 Of which internal model method (IMM) Equity position in banking book under basic risk weighting or internal rating-based Equity investments in funds look-through approach Equity investments in funds mandate-based approach 4, Equity investments in funds 1250% risk weighting approach Settlement risk Securitisation exposures in banking book Of which IRB ratings-based approach (RBA) Of which IRB supervisory formula approach (SFA) Of which SA/simplified supervisory formula approach (SSFA) Market risk 6,748,950 6,136, , Of which standardised approach (SA) 6,748,950 6,136, , Of which internal model approaches (IMM) Operational risk 25,033,623 21,096,899 2,002, Of which basic indicator approach 25,033,623 21,096,899 2,002, Of which standardised approach Of which advanced measurement approach Amounts below the thresholds for deduction from capital (subject to 250% risk weight) 1,137,058 3,420,013 90, Floor adjustment Total ( ) 278,024, ,425,540 22,241,967 (*) Excluding equity investments in funds and amounts below the thresholds for deductions from capital. 69
79 Linkages between financial statements and risk amounts Differences and matching between asset and liabilities carrying values in financial statements and risk amounts in capital adequacy calculation Current Period Carrying values in financial statements prepared as per TAS (*) Carrying values of items in accordance with Turkish Accounting Standards Carrying values in consolidated financial statements prepared as per TAS but in compliance with the communiqué Preparation of Consolidated Financial Statements Subject to credit risk Subject to counterparty credit risk Subject to market risk (**) Not subject to capital requirements or subject to deduction from capital Assets Cash (Cash on Hand, Money in Transit, Purchased Cheques) and 39,220,034 33,603,641 33,603, Balances With Central Bank of Turkey Financial Assets Held for Trading 3,114,332 2,877,813 72,794 1,873,995 2,081,173 - Financial Assets at Fair Value Through Profit or Loss Banks 11,553,963 19,470,343 19,470, Interbank Money Markets Placements 7,313 3,353-3, Financial Assets Available-for-Sale 24,699,789 26,277,988 26,104,810 14,788, ,784 1,394 Loans 215,442, ,353, ,322, ,879 Factoring Receivables 3,378,320 3,379,768 3,379, Investment Held-to-Maturity 23,025,486 24,314,540 24,314,540 1,010, Investment in Associates 37,291 35,751 35, Investment in Subsidiaries 3, , , Investment in Joint-Ventures Lease Receivables 5,775,351 5,788,436 5,788, Derivative Financial Assets Held for Risk Management 570, , , Tangible Assets 5,490,232 4,096,651 3,965, ,914 Intangible Assets 116, ,308 24, ,284 Investment Property 327, , , Tax Asset 880, , , ,381 Assets Held for Sale and Assets of Discontinued Operations 835, , , Other Assets 2,138,656 4,100,751 4,100, Total Assets 336,616, ,331, ,154,764 18,347,921 2,252, ,852 Liabilities Deposits 195,155, ,773, ,773,560 Derivative Financial Liabilities Held for Trading 2,294,937 2,898, ,898,822 Funds Borrowed 42,757,908 47,104,719-11,838,445-35,266,274 Interbank Money Markets 18,505,682 18,637,856-1,746,412 16,474 16,891,444 70
80 Securities Issued 19,347,705 20,794, ,794,452 Funds Miscellaneous Payables 10,274,769 10,376, ,376,346 Other External Fundings Payable 983,676 3,080, ,116 3,052,234 Factoring Payables Lease Payables Derivative Financial Liabilities Held for Risk Management 235, , ,826 Provisions 3,050,325 6,848, ,848,102 Tax Liability 478,457 1,163, ,163,162 Liabilities for Assets Held for Sale and Assets of Discontinued Operations Subortinated Debts 2,715,786 2,849, ,849,471 Shareholders Equity 40,816,704 41,606, ,606,001 Total Liabilities 336,616, ,331,667-13,584,857 44, ,718,694 (*) As per financial statements prepared in compliance with the paragraph 6 of article 5 of the communiqué Preparation of Consolidated Financial Statements as of 30 September (**) Disclosed based on gross position amounts subject to general market risk and specific risk. Carrying values in financial statements prepared as per TAS (*) Carrying values of items in accordance with Turkish Accounting Standards Carrying values in consolidated financial statements prepared as per TAS but in compliance with the communiqué Preparation of Consolidated Financial Statements Subject to credit risk Subject to counterparty credit risk Subject to market risk (**) Not subject to capital requirements or subject to deduction from capital (***) Assets Cash (Cash on Hand, Money in Transit, Purchased Cheques) and Balances With 33,734,687 23,951,474 23,951, Central Bank of Turkey Financial Assets Held for Trading 1,835,133 3,805,541 7,842 3,577,256 1,491,646 - Financial Assets at Fair Value Through Profit or Loss Banks 11,877,548 16,881,044 16,112, ,540,185 Interbank Money Markets Placements 318, , ,691 22, Financial Assets Available-for-Sale 23,179,823 23,983,448 22,878,689 5,699,440 1,081,227 23,532 Loans 182,659, ,409, ,372, ,994 Factoring Receivables 2,149,726 2,851,223 2,851, Investment Held-to-Maturity 21,306,528 23,109,696 23,109,696 8,308, Investment in Associates 37,261 37,261 36, Investment in Subsidiaries 4, ,858 1,240, Investment in Joint-Ventures Lease Receivables 5,462,940 5,794,260 5,794,
81 Derivative Financial Assets Held for Risk Management 283, , , Tangible Assets 4,567,214 3,680,621 3,473, ,614 Intangible Assets 106, ,653 25, ,983 Investment Property 537, , , Tax Asset 879, , , ,167 Assets Held for Sale and Assets of Discontinued Operations 490, , , ,325 Other Assets 1,612,144 3,725,080 3,644, ,041 Total Assets 291,042, ,121, ,276,004 18,273,909 2,572,873 2,223,104 Liabilities Deposits 167,133, ,689, ,689,813 Derivative Financial Liabilities Held for Trading 1,812,567 3,713, ,713,985 Funds Borrowed 39,334,000 46,581,853-5,798,862-40,782,991 Interbank Money Markets 18,678,332 11,230,193-7,813,821 26,027 3,416,372 Securities Issued 15,128,623 17,745, ,745,648 Funds Miscellaneous Payables 9,228,088 9,339, ,339,748 Other External Fundings Payable 1,472,437 3,170, ,136 3,149,203 Factoring Payables Lease Payables Derivative Financial Liabilities Held for Risk Management 514, , ,314 Provisions 1,831,781 5,032, ,032,873 Tax Liability 171, , ,266 Liabilities for Assets Held for Sale and Assets of Discontinued Operations Subortinated Debts Shareholders Equity 35,737,747 35,795, ,795,907 Total Liabilities 291,042, ,121,939-13,612,683 47, ,488,120 (*) As per financial statements prepared in compliance with the paragraph 6 of article 5 of the communiqué Preparation of Consolidated Financial Statements as of 30 September (**) (***) Disclosed based on gross position amounts subject to general market risk and specific risk. According to the Bank Capital Regulation article 10 paragraph 4, which published on Official Gazette dated 5 September 2013 with no , the banks also calculate their consolidated capital as if their investments in insurance companies are not consolidated as per 9th article s 4th paragraph s (c) and (ç) items. Lesser of consolidated capital calculated according to 1st and 4th paragraphs is considered the consolidated capital according to this regulation. The consolidated capital calculated without including insurance affiliate is less than the consolidated capital calculated including insurance affiliate. Therefore, the carrying value of the insurance company not subjected to regulatory consolidation is represented under the column "not subject to capital requirements or subject to deduction from capital". 72
82 Major items causing differences between assets and liabilities carrying values in financial statements and risk amounts in capital adequacy calculation Current Period Total Credit risk Counterparty credit risk Market risk (*) Carrying Value of Assets in Accordance 1 with Communiqué Preparation of 339,991, ,339,999 2,533,156 2,252,957 Consolidated Financial Statements Carrying Value of Debt Instruments Subject Counterparty Credit Risk in 2 Accordance with Communiqué 15,814,765 15,814,765 15,814,765 - Preparation of Consolidated Financial Statements Carrying Value of Liabilities Subject to 3 Counterparty Credit Risk in Accordance with Communiqué Preparation of 13,584,857-13,584,857 16,474 Consolidated Financial Statements Carrying Value of Other Liabilities in 4 Accordance with Communiqué Preparation of Consolidated Financial 28, ,116 Statements 5 Total Net Amount Under Regulatory Consolidation 342,192, ,154,764 4,763,064 2,208,367 6 Off-balance Sheet Amounts (**) 300,558,195 44,034,598 1,911, ,242,558 7 Credit Risk Mitigation - (20,912,222) (28,948) - 8 Repurchase Transactions Valuation Adjustments ,923-9 Risk Amounts 642,751, ,277,140 7,575, ,450,925 Total Credit risk Counterparty credit risk Market risk (*) 1 Carrying Value of Assets in Accordance with Communiqué Preparation of 295,871, ,248,342 4,246,247 2,572,873 Consolidated Financial Statements 2 Carrying Value of Debt Instruments Subject Counterparty Credit Risk in Accordance with Communiqué 14,027,662 14,027,662 14,027,662 - Preparation of Consolidated Financial Statements 3 Carrying Value of Liabilities Subject to Counterparty Credit Risk in Accordance with Communiqué Preparation of 13,612,683-13,612,683 - Consolidated Financial Statements 4 Carrying Value of Other Liabilities in Accordance with Communiqué Preparation of Consolidated Financial 21, ,163 Statements 5 Total Net Amount Under Regulatory Consolidation 296,265, ,276,004 4,661,226 2,525,710 6 Off-balance Sheet Amounts (**) 265,731,181 41,073,373 1,802, ,812,704 7 Credit Risk Mitigation - (18,684,545) (9,751) - 8 Repurchase Transactions Valuation Adjustments - - 1,495,079-9 Risk Amounts 561,966, ,664,832 7,949, ,338,414 (*) Disclosed based on gross position amounts subject to general market risk and specific risk. (**) The amounts present the balances of the off-balance sheet items subject to capital adequacy regulation. 73
83 Explanations on differences between carrying values in financial statements and risk amounts in capital adequacy calculation of assets and liabilities There is no material differences between the carrying values in financial statements and the risk amounts in capital adequacy calculation of assets and liabilities Consolidated credit risk General information on consolidated credit risk General qualitative information on consolidated credit risk The parent bank's credit risk management policies; under the relevant legislation in line with the bank's credit strategy approved by the Board are created based on the prudence, sustainability and customer's credit worthiness principles. Diversification to avoid concentrations are performed while determining the Bank s credit risk profile. Credit portfolios are evaluated depending upon the credit type, managed aggregately during their life cycle. Customer selection is made in accordance with the policies and strategies, affordability of the borrower to fulfil on a timely basis all financial obligations with his expected cash flows from foreseeable specific transactions or from its regular operations; without depending upon guarantors, bails or pledged assets is predicated. Necessary risk rating/scoring models are developed for the different portfolios of the Bank. These models are created by ensuring the best separation of the customers in terms of their credibility and grading them using the objective criteria. The outputs of the internal rating and scoring models that developed based on the each portfolio, as well as an important part of the loan approval process, but also these models are used measuring the default risk of the customer and the portfolio, doing analysis regarding expected loss, internal capital and risk-based analyses. The general risk policy including the risk appetite and indicators is determined by the board of directors. Risk management is handled, in order to reach the determined targets, by carrying out a continuous monitoring process with a proper classification of risks and customers in scope of the effective management mentality. The limit framework and delegation rules are specified by establishing proper decision systems in order to assess the risks correctly. Optimum limit levels are determined by taking into account the loss and returns during the limit setting process. The security intelligence and analysis are done in order to measure the creditworthiness of the customer that will be entered in a credit relationship. Before the credit decisions, customer analysis is examined and evaluated by producing all factors (qualitative and quantitative data) that effected and will be effected the historical, current and future performance of the customer. Credit risk management is a structured process where credit risks are consistently assessed, quantified and monitored. In order to take the right decision, during the credit process which begins with the application of the customer and includes the phases of determination of the customer s credibility, collateralization, loan configuration, approval and usage, monitoring and closing the exposure, all required information and documents intended to identify the customer are collected in a centralized database, with this information the customer s financial strength is analysed, credit risk analysis is done, are graded according to customer segment and activity fields and the information is kept updated by inquiring the customers. Before a loan is granted, it is ensured that risks are well-understood, sufficient evaluation has been done and after the loan is granted the loan is monitored, controlled and reported. Credit risk is managed on a portfolio basis considering the risk/return balance and asset quality of the Bank in the scope of the principles specified in the credit risk policy documents. Furthermore, loan based assessment, allocation and monitoring are carried out within the framework of related processes by related units in the Credit Group. Credit proposals, on the basis of the determined amount and in the framework of levels of authority, are concluded after being evaluated by the Regional Offices, Loans units of Headquarter, if required by the credit committee and the board of directors. The credit approval authority can be transferred starting from the board of directors. The authorities of the Headquarter and Credit Regional Offices are notified in written and transfer of authority is done. 74
84 Each unit operating in credit risk management is responsible for identifying risks arising from its own process, activities and systems, informing senior management and taking necessary action to reduce risk level. Risk management activities are conducted in accordance with the Bank's risk appetite and capacity by using risk measurement and management tools within the policies which is established by the board of directors. In this context, organizational structure related to credit risk management and control functions are detailed below: Units within the scope of Credit Risk Management; Corporate and Special Loans, Commercial Loans, Featured Collections, Commercial Products Collection, Bank and Country Risk, Retail and SME Loans Risk Strategies, Retail and SME Loans Evaluation, Retail Products Collection, Risk Planning Monitoring and Reporting, Risk Analytics, Technology and Innovation, Market Risk and Credit Risk Control and Region Coordination. In addition, decisions regarding the credit policy in the corporate governance framework are taken by the relevant committees. In this context, there are Corporate and Commercial Loans Risk Committee, Retail Loans Risk Committee, Risk Management Committee and Board of Risk Committee. Allocated limits and conditions that exceeding the limits with their usage, evaluations regarding major risks and non-performing loans with high risk, information regarding NPLs, the data regarding the portfolios of subsidiaries are reported to senior management on a regular basis. The Risk Management function measures, monitors and reports credit risks by using the Bank s probability of defaults obtained from the Bank s rating models, loss that is caused by defaulted customer and credit conversion factors. Bank s internal capital is calculated and adequacy is assesed by considering stress tests and scenario anaylsis. Also, the limits are determined for credit portfolios by considering optimum risk return balance and credit concentrations are monitored. For credit risk, on-site and centralized controls of guarantees and contract are carried out by employees of the Internal Control Center. In this context, it is implemented a strategy which covers all branches. Internal control activities are carried out under the control programs prepared for the designated checkpoints and methodologies Credit quality of consolidated assets Current Period Gross carrying value in consolidated financial statements prepared as pertas Allowances/amortisation and impairments Net values Defaulted Non-defaulted 1 Loans 6,865, ,541,848 5,150, ,256,173 2 Debt securities - 50,317,658-50,317,658 3 Off-balance sheet exposures 370,339 70,349, ,417 70,592,657 4 Total 7,235, ,209,241 5,278, ,166,488 Gross carrying value in consolidated financial statements prepared as pertas Allowances/amortisation and impairments Net values Defaulted Non-defaulted 1 Loans 6,910, ,574,041 5,135, ,349,372 2 Debt securities - 45,895,535-45,895,535 3 Off-balance sheet exposures 355,861 68,228, ,609 68,449,562 4 Total 7,266, ,697,886 5,270, ,694,469 75
85 Changes in stock of default loans and debt securities Current Period 1 Defaulted loans and debt securities at end of the previous reporting period 6,910,833 6,090,168 2 Loans and debt securities defaulted since the last reporting period 3,049,823 4,227,196 3 Receivables back to non-defaulted status Amounts written off 1,295,891 1,687,658 5 Other changes 1,799,470 1,718,873 6 Defaulted loans and debt securities at end of the reporting period 6,865,295 6,910, Additional information on credit quality of consolidated assets Qualitative disclosures related to the credit quality of assets Taking into consideration the general economic outlook, sector specific situations and possible regulation changes, the Bank determines the provision rates that will be applied and the collateral types that will be taken into account in the calculations; provided that those rates cannot be lower than what is determined in the related regulation. Related decisions are applied after the approval of the Bank s Risk Management Committee. A refinancing/restructuring refers to; extending a new loan for the purpose of repayment of a part or whole of the outstanding loans or related interest payments granted previously or, amending the conditions of such outstanding loans in order to facilitate the repayment capacity; due to current or foreseeable financial difficulties of the borrower or the related risk group Breakdown of exposures by geographical areas, industry and ageing Disclosed under section 4.2 credit risk Exposures provisioned against by major regions and sectors Current Period Loans Under Specific Loans Under Specific Write-Offs Follow-Up Provisions Follow-Up Provisions Write-Offs Domestic 5,712,104 4,445,293 1,045,411 5,699,448 4,437,990 1,078,118 European Union (EU) Countries 931, , , , , ,057 OECD Countries 98,470 63, ,053 75,525 7 Off-Shore Banking Regions 71,710 71,710-74,413 74,413 2,459 USA, Canada 15,740 14,468-26,114 20,446 6,800 Other Countries 35,562 29,930 30,892 76,511 65, ,217 Total 6,865,295 5,150,970 1,295,891 6,910,833 5,135,502 1,687,658 76
86 Current Period Loans Under Follow-Up Specific Provisions Write-Offs Agriculture 160, , ,169 Farming and Stockbreeding 156,568 97, ,314 Forestry 2,410 1,615 3,370 Fishery 1,621 1, Manufacturing 912, , ,793 Mining and Quarrying 88,013 65,284 15,595 Production 656, , ,364 Electricity, Gas and Water 167,955 84, Construction 495, ,018 66,461 Services 2,227,221 1,353, ,555 Wholesale and Retail Trade 1,126, , ,443 Accomodation and Dining 216,329 85,017 25,455 Transportation and Telecommunication 740, ,144 40,655 Financial Institutions 27,458 20, Real Estate and Rental Services 42,480 21, Professional Services 4,737 1, Educational Services 40,685 30, Health and Social Services 28,543 18,758 8,459 Others 3,069,091 2,740, ,913 Total 6,865,295 5,150,970 1,295,891 Loans Under Follow-Up Specific Provisions Write-Offs Agriculture 182, ,866 10,942 Farming and Stockbreeding 178, ,925 10,591 Forestry 2,340 1, Fishery 2,369 1, Manufacturing 1,086, , ,201 Mining and Quarrying 76,432 56, ,351 Production 859, , ,285 Electricity, Gas and Water 150,717 70, Construction 517, ,852 75,499 Services 2,054,471 1,222, ,090 Wholesale and Retail Trade 1,161, , ,745 Accomodation and Dining 194,674 80,912 25,342 Transportation and Telecommunication 539, ,100 33,587 Financial Institutions 22,308 19,766 2,246 Real Estate and Rental Services 36,832 18,749 4,507 Professional Services 4,091 1, Educational Services 59,857 32,978 1,472 Health and Social Services 36,154 24,475 6,170 Others 3,069,392 2,745, ,926 Total 6,910,833 5,135,502 1,687,658 77

87 Ageing of past-due exposures Current Period Up to 3 Months 3-12 Months 1-3 Years 3-5 Years 5 Years and Over Corporate and Commercial Loans 581, ,120 1,882, , ,413 Retail Loans 213, , , , ,796 Credit Cards 96, , , , ,997 Others 17,937 37,149 91,587 10,815 3,608 Total 909,245 1,450,008 2,937, , ,814 Up to 3 Months 3-12 Months 1-3 Years 3-5 Years 5 Years and Over Corporate and Commercial Loans 418,035 1,433,176 1,239, , ,668 Retail Loans 260, , , , ,804 Credit Cards 130, , , , ,155 Others 3,942 27,888 55,434 10,334 2,646 Total 812,893 2,295,868 2,181, , , Consolidated credit risk mitigation Qualitative disclosure on consolidated credit risk mitigation techniques Parent bank assesses the cash flow of the activity or investment subject to credit as the primary repayment source during the credit assignment process. Calculating the value of the collateral depends on margins determined according to market and FX risks. Standard margins in use throughout the Bank are specific to type of the collateral and changes according to the currency of the collateral. If credit assignment is conditioned to a collateral extension, the data of the collaterals must be entered to the banking information system. Operational transactions are handled by centralized Operation unit (ABACUS). During the credit utilization, compliance of all conditions between credit decision and credit utilization (such as collateral conditions) are controlled systematically. The Bank monitors up to date value of the collaterals by type. Credit monitoring process involves the control of the balance between the value of the collateral and risk besides creditworthiness of the customer. The Bank s credit risk exposure and mitigation techniques used in order to reduce the exposure level are taken into account according to the principles stated in the related regulation. The Bank applies credit risk mitigation according to the comprehensive method that includes risk mitigation calculations considering the volatility-adjusted values of financial collaterals The standardized risk weights are applied to the rest of the loans and receivables that remained unprotected after credit risk mitigation techniques. Financial collaterals, that are composed of cash or cash equivalents, real estate mortgages, high quality securities and Credit Guarantee Fund suretyship having Treasury guarantee, have been used in credit risk mitigation Consolidated credit risk mitigation techniques Current Period Exposures unsecured: carrying amount as per TAS Exposures secured by collateral Collateralized amount of exposures secured by collateral 78 Exposures secured by financial guarantees Collateralized amount of exposures secured by financial guarantees Exposures secured by credit derivatives Collateralized amount of exposures secured by credit derivatives 1 Loans 248,903,161 39,353,012 34,304,927 11,427,381 11,427, Debt securities 50,317, Total 299,220,819 39,353,012 34,304,927 11,427,381 11,427, Of which defaulted 6,755, ,045 8,
88 Exposures unsecured: carrying amount as per TAS Exposures secured by collateral Collateralized amount of exposures secured by collateral Exposures secured by financial guarantees Collateralized amount of exposures secured by financial guarantees Exposures secured by credit derivatives Collateralized amount of exposures secured by credit derivatives 1 Loans 195,545,999 51,803,373 42,649, Debt securities 45,895, Total 241,441,534 51,803,373 42,649, Of which defaulted 6,866,835 43,998 14, Consolidated credit risk under standardised approach Qualitative disclosures on banks use of external credit ratings under the standardised approach for credit risk An international rating firm, Fitch Ratings external risk ratings are used to determine the risk weights of the risk categories as per the Article 6 of the "Regulation on Measurement and Assessment of Capital Adequacy Ratios of Banks". The international risk ratings are used for the exposures to central governments and central banks, whereas for central governments and central banks that are not rated by Fitch Ratings, the published country ratings as announced by the Organisation for Economic Cooperation and Development (OECD) are used. According to the regulation on capital adequacy, external risk ratings are used only for the exposures to banks and brokerage houses and to corporates where the counterparties are resident in abroad, to determine their risk weights. Where the counterparties are domestic, the related exposures are included in the calculation of capital adequacy as unrated. In the determination of risk weights; if a relevant rating is available then such rating, but if it is an unrated exposure then the rating available for the issuer is used. Rating notes issued by Fitch Ratings are presented in the table below, as per credit quality levels and risk weights per risk classes: Credit Quality Level Fitch Ratings long term credit rating Exposures to Central Governments or Central Banks Risk Classes Exposures to Banks and Brokerage Houses Exposures with Original Maturities Less Than 3 Months Exposures with Original Maturities More Than 3 Months Exposures to Corporates 1 AAA to AA- 0% 20% 20% 20% 2 A+ to A- 20% 20% 50% 50% 3 BBB+ to BBB- 50% 20% 50% 100% 4 BB+ to BB- 100% 50% 100% 100% 5 B+ to B- 100% 50% 100% 150% 6 CCC+ and below 150% 150% 150% 150% 79
89 Consolidated credit risk exposure and credit risk mitigation techniques Current Period Exposures before CCF and CRM Exposures post-ccf and CRM RWA and RWA density Risk Classes On-balance sheet amount Off-balance sheet amount On-balance sheet amount Off-balance sheet amount RWA RWA density 1 Exposures to sovereigns and their central banks 81,704, ,554 93,044,942 91,577 12,733,203 14% 2 Exposures to regional and local governments 122,898 3, ,620 1,695 60,658 50% Exposures to 3 administrative bodies and non-commercial entities 299,434 65, ,431 16, , % 4 Exposures to multilateral development banks 202, , Exposures to international organizations Exposures to banks and brokerage houses 20,702,340 17,085,257 16,279,490 2,228,308 9,811,319 53% 7 Exposures to corporates 121,902,879 53,142, ,143,606 22,189, ,334,858 99% 8 Retail exposures 77,406,533 46,090,805 71,466,831 4,143,535 56,705,522 75% 9 Exposures secured by residential property 20,531, ,465 20,517,716 56,942 7,201,113 35% 10 Exposures secured by commercial property 16,583,733 2,153,453 16,349,582 1,381,721 10,919,725 62% 11 Past-due items 1,161, ,160,452-1,028,608 89% 12 Exposures in high-risk categories 590, , ,312 45, , % Exposures in the form of 13 bonds secured by mortgages Short term exposures to 14 banks, brokerage houses and corporates Exposures in the form of 15 collective investment undertakings 44,516-44,516-4,890 11% 16 Shares 164, , , % 17 Other exposures 10,283,383-10,283,383-7,156,628 70% 18 Total 351,699, ,928, ,666,955 30,155, ,267,369 80
90 Exposures before CCF and CRM Exposures post-ccf and CRM RWA and RWA density Risk Classes On-balance sheet amount Off-balance sheet amount On-balance sheet amount Off-balance sheet amount RWA RWA density 1 Exposures to sovereigns and their central banks 62,991, ,372 62,991, ,694 12,214,626 19% 2 Exposures to regional and local governments 131,400 2, ,824 1,255 61,449 47% Exposures to 3 administrative bodies and non-commercial entities 62,244 5,646 62,244 1,884 64, % 4 Exposures to multilateral development banks 190, ,237-55,402 29% 5 Exposures to international organizations Exposures to banks and brokerage houses 22,550,426 14,968,656 18,321,242 2,249,912 8,408,466 41% 7 Exposures to corporates 109,256,649 53,142, ,264,656 21,288, ,080,583 97% 8 Retail exposures 62,900,760 41,762,190 62,488,339 3,636,124 49,592,183 75% 9 Exposures secured by residential property 19,318, ,697 19,313,597 77,622 6,786,927 35% 10 Exposures secured by commercial property 16,338,647 1,655,679 16,323, ,619 11,054,150 64% 11 Past-due items 1,065,373 1,363 1,064, ,208 83% 12 Exposures in high-risk categories 837, , ,664 69,524 1,296, % Exposures in the form of 13 bonds secured by mortgages Short term exposures to 14 banks, brokerage houses and corporates Exposures in the form of 15 collective investment undertakings Shares 218, , ,935 83% 17 Other exposures 9,494,987-9,494,987-6,410,522 68% 18 Total 305,356, ,828, ,698,818 28,598, ,091,394 81
91 Consolidated exposures by asset classes and risk weights 35% Regulatory portfolio Current Period 0% 10% 20% secured by property mortgage 50% 75% 100% 150% 200% Others Total risk amount (post-ccf and CRM) Exposures to sovereigns and their central banks 80,351,650-33,729-49,365-12,701, ,136,519 Exposures to regional and local government , ,315 Exposures to administrative bodies and non-commercial , ,850 entities Exposures to multilateral development banks 202, ,781 Exposures to international organizations Exposures to banks and brokerage houses - - 7,669,767-5,121,332-5,716, ,507,798 7 Exposures to corporates ,348-3,229, ,624, ,333,325 8 Retail exposures ,078 75,601, ,610, Exposures secured by residential property ,574, ,574,658 Exposures secured by commercial property ,623,154-4,108, ,731, Past-due items , , ,160, Exposures in high-risk categories ,175-63, , ,758 Exposures in the form of bonds secured by mortgages Short term exposures to banks, brokerage houses and corporates Exposures in the form of collective investment 39, , ,516 undertakings 16 Shares , , Other exposures 3,126, ,156, ,283, Total 83,720,569-8,183,149 20,574,658 22,509,081 75,601, ,752, , ,822,317 82
92 Regulatory portfolio 0% 10% 20% 35% secured by property mortgage 50% 75% 100% 150% 200% Others Total risk amount (post-ccf and CRM) Exposures to sovereigns and their central banks 38,851,453-38,642-24,413, ,303,884 Exposures to regional and local government , , ,079 Exposures to administrative bodies and non-commercial , ,128 entities Exposures to multilateral development banks ,386-57, ,237 Exposures to international organizations Exposures to banks and brokerage houses - - 6,476,701-13,962, , ,571,154 7 Exposures to corporates ,924-6,026, ,952, ,553,028 8 Retail exposures ,265 66,120, ,124, Exposures secured by residential property ,391, ,391,219 Exposures secured by commercial property ,459,341-4,824, ,283, Past-due items , , ,064, Exposures in high-risk 30,017 64, ,274 categories ,188 Exposures in the form of bonds secured by mortgages Short term exposures to banks, brokerage houses and corporates Exposures in the form of collective investment undertakings 16 Shares 37, , , Other exposures 3,082,509-2, ,410, ,494, Total 41,971,019-7,236,697 19,391,219 57,432,520 66,120, ,333, , ,296,824 83

93 Consolidated counterparty credit risk Qualitative disclosure on consolidated counterparty credit risk Counterparty credit risk management policies include evaluating and monitoring risk developments, taking necessary measures, setting risk limits, ensuring that the risks remain within the limits, and establishing required reporting, control and audit mechanisms by using the methods aligned with both international standards and local regulations. The policies regarding counterparty credit risk measurement, monitoring, and limit settings are defined by the board of directors. Counterparty credit risk arising from derivative transactions is periodically being monitored and reported by the Market Risk and Credit Risk Control units on product, country, counterparty and counterparty type basis. International framework agreements (ISDA, CSA, GMRA, etc.) are being used through collateral and margin call mechanisms in order to mitigate the counterparty credit risk Consolidated counterparty credit risk (CCR) approach analysis Current Period Replacement cost Potential future exposure EEPE(Effective Expected Positive Exposure) Alpha used for computing regulatory EAD EAD post- CRM 1 Standardised Approach - CCR (for derivatives) 2,516,682 1,911, ,399,294 2,225,032 Internal Model Method (for derivative financial instruments, repo transactions, securities or 2 commodity lending or borrowing transactions, long settlement transactions and securities financing transactions) Simple Approach for credit risk mitigation (for repo transactions, securities or 3 commodity lending or borrowing transactions, long - - settlement transactions and securities financing transactions) Comprehensive Approach for credit risk mitigation (for repo transactions, securities 4 or commodity lending or borrowing transactions, long 3,176, ,160 settlement transactions and securities financing transactions) Value-at-Risk (VaR) for repo transactions, securities or commodity lending or 5 borrowing transactions, long - - settlement transactions and securities financing transactions 84 6 Total 2,404,192 RWA

94 Replacement cost Potential future exposure 85 EEPE(Effective Expected Positive Exposure) Alpha used for computing regulatory EAD EAD post- CRM 1 Standardised Approach - CCR (for derivatives) 4,220,220 1,802, ,013,287 3,165,331 Internal Model Method (for derivative financial instruments, repo transactions, securities or 2 commodity lending or borrowing transactions, long settlement transactions and securities financing transactions) 3 Simple Approach for credit risk mitigation (for repo transactions, securities or commodity lending or borrowing transactions, long - - settlement transactions and securities financing transactions) 4 Comprehensive Approach for credit risk mitigation (for repo transactions, securities or commodity lending or borrowing transactions, long 1,936, ,068 settlement transactions and securities financing transactions) 5 Value-at-Risk (VaR) for repo transactions, securities or commodity lending or borrowing transactions, long - - settlement transactions and securities financing transactions 6 Total 3,759, Consolidated capital requirement for credit valuation adjustment (CVA) EAD post- CRM Current Period RWA EAD post- CRM Total portfolios subject to the Advanced CVA capital obligation (i) VaR component (including the 3 multiplier) (ii) Stressed VaR component (including the 3 multiplier) All portfolios subject to the Standardised CVA capital obligation 4,359,261 1,433,394 6,013,287 1,921,460 4 Total subject to the CVA capital obligation 4,359,261 1,433,394 6,013,287 1,921,460 RWA RWA
(Convenience Translation of Financial Statements and Related Disclosures and Footnotes Originally Issued in Turkish)
") ( and Related Disclosures and Footnotes ) TÜRKİYE GARANTİ BANKASI ANONİM ŞİRKETİ AND ITS FINANCIAL AFFILIATES CONSOLIDATED INTERIM FINANCIAL REPORT AS OF AND FOR THE NINE-MONTH PERIOD ENDED 30 SEPTEMBER
( and Related Disclosures and Footnotes ) TÜRKİYE GARANTİ BANKASI ANONİM ŞİRKETİ AND ITS FINANCIAL AFFILIATES CONSOLIDATED INTERIM FINANCIAL REPORT AS OF AND FOR THE NINE-MONTH PERIOD ENDED 30 SEPTEMBER
Türkiye Garanti Bankası Anonim Şirketi and Its Financial Subsidiaries
 ( ) Türkiye Garanti Bankası Anonim Şirketi and Its Financial Subsidiaries Publicly Announced Consolidated Financial Statements, Related Disclosures and Independent Auditors Limited Review Report Thereon
Türkiye Garanti Bankası Anonim Şirketi
 ( ) Türkiye Garanti Bankası Anonim Şirketi Publicly Announced Consolidated Financial Statements, Related Disclosures and Independent Auditors Limited Review Report Thereon as of and for the Three-Month
Türkiye Garanti Bankası Anonim Şirketi and Its Financial Subsidiaries
 ( ) Türkiye Garanti Bankası Anonim Şirketi and Its Financial Subsidiaries Publicly Announced Consolidated Financial Statements, Related Disclosures and Independent Auditors Limited Review Report Thereon
Consolidated Financial Statements. With Independent Auditors Report Thereon
 ( ) Türkiye Garanti Bankası Anonim Şirketi And Its Financial Affiliates Consolidated Financial Statements As of and For the Year Ended 31 December 2015 ( and Related Disclosures and Footnotes ) With Independent
Consolidated Financial Statements
 ( ) Türkiye Garanti Bankası Anonim Şirketi And Its Financial Affiliates Consolidated Financial Statements As of and For the Nine-Month Period Ended 30 September 2014 ( and Related Disclosures and Footnotes
(Convenience Translation of Financial Statements and Related Disclosures and Footnotes Originally Issued in Turkish)
") ( and Related Disclosures and Footnotes ) TÜRKİYE GARANTİ BANKASI ANONİM ŞİRKETİ AND ITS FINANCIAL AFFILIATES CONSOLIDATED INTERIM FINANCIAL REPORT AS OF AND FOR THE THREE-MONTH PERIOD ENDED 31 MARCH 2017
( and Related Disclosures and Footnotes ) TÜRKİYE GARANTİ BANKASI ANONİM ŞİRKETİ AND ITS FINANCIAL AFFILIATES CONSOLIDATED INTERIM FINANCIAL REPORT AS OF AND FOR THE THREE-MONTH PERIOD ENDED 31 MARCH 2017
Türkiye Garanti Bankası Anonim Şirketi and Its Financial Affiliates Consolidated Financial Report as of and for the Year Ended 31 December 2009
 Türkiye Garanti Bankası Anonim Şirketi and Its Financial Affiliates Consolidated Financial Report as of and for the Year Ended 31 December 2009 Levent Nispetiye Mah.Aytar Cad. No:2 Beşiktaş 34340 Istanbul
Türkiye Garanti Bankası Anonim Şirketi
 ( ) Türkiye Garanti Bankası Anonim Şirketi Unconsolidated Financial Statements As of and For the Year Ended 31 December 2014 ( and Related Disclosures and Footnotes ) With Independent Auditors Report Thereon
Türkiye Garanti Bankası Anonim Şirketi
 ( Originally Issued in Turkish, See Note 3.1.1) Türkiye Garanti Bankası Anonim Şirketi Unconsolidated Financial Statements As of and For the Year Ended 31 December 2013 ( and Related Disclosures and Footnotes
Türkiye Garanti Bankası Anonim Şirketi
 ( Originally Issued in Turkish, See Note 3.1.1) Türkiye Garanti Bankası Anonim Şirketi Unconsolidated Financial Statements As of and For the Year Ended 31 December 2010 ( and Related Disclosures and Footnotes
Türkiye Garanti Bankası Anonim Şirketi
 ( Originally Issued in Turkish, See Note 3.1.1) Türkiye Garanti Bankası Anonim Şirketi Unconsolidated Financial Statements As of and For the Three-Month Period Ended 31 March 2010 ( and Related Disclosures
Financial Statements
 Financial Statements I. Balance sheets (Statements of financial position) II. Statements of off-balance sheet items III. Income statements IV. Statements of income and expenses recognized under equity
BANK MELLAT, HEAD OFFICE: TAHRAN-IRAN İSTANBUL TURKEY MAIN, ANKARA AND İZMİR BRANCHES INDEPENDENT AUDITOR S REPORT, FINANCIAL STATEMENTS AND NOTES
 BANK MELLAT, HEAD OFFICE: TAHRAN-IRAN İSTANBUL TURKEY MAIN, ANKARA AND İZMİR BRANCHES INDEPENDENT AUDITOR S REPORT, FINANCIAL STATEMENTS AND NOTES FOR THE YEAR ENDED 31 DECEMBER 2017 (TRANSLATED INTO ENGLISH
TOTAL ASSETS
 UNCONSOLIDATED BALANCE SHEET (STATEMENT OF FINANCIAL POSITION) AT 30 SEPTEMBER 2015 Audited 31 December 2014 ASSETS Note Ref. TL FC Total TL FC Total I. CASH AND BALANCES WITH THE CENTRAL BANK (1) 28.229
TÜRKİYE SINAİ KALKINMA BANKASI A.Ş. UNCONSOLIDATED BALANCE SHEET (STATEMENT OF FINANCIAL POSITION) AT 31 MARCH
 AT 31 MARCH") UNCONSOLIDATED BALANCE SHEET (STATEMENT OF FINANCIAL POSITION) AT 31 MARCH 2015 31 Mart 2016 Audited 31 December 2015 ASSETS Note Ref. TL FC Total TL FC Total I. CASH AND BALANCES WITH THE CENTRAL BANK
UNCONSOLIDATED BALANCE SHEET (STATEMENT OF FINANCIAL POSITION) AT 31 MARCH 2015 31 Mart 2016 Audited 31 December 2015 ASSETS Note Ref. TL FC Total TL FC Total I. CASH AND BALANCES WITH THE CENTRAL BANK
ASSETS TL FC Total TL FC Total
 UNCONSOLIDATED BALANCE SHEET (STATEMENT OF FINANCIAL POSITION) AT 31 DECEMBER 2015 ASSETS TL FC Total TL FC Total I. CASH AND BALANCES WITH THE CENTRAL BANK 40.438 770.676 811.114 31.636 476.152 507.788
PASHA YATIRIM BANKASI A.Ş.
 UNCONSOLIDATED FINANCIAL STATEMENTS AND INDEPENDENT AUDITOR S REPORT, ORIGINALLY ISSUED IN TURKISH, SEE NOTE I OF SECTION THREE PUBLICLY ANNOUNCED UNCONSOLIDATED FINANCIAL STATEMENTS TOGETHER WITH REVIEW
The accompanying notes are an integral part of these unconsolidated financial statements.
 UNCONSOLIDATED BALANCE SHEET AS OF 31 MARCH 2016 I. BALANCE SHEET (STATEMENT OF FINANCIAL POSITION) Audited 31 March 2017 31 December 2016 ASSETS Note TRY FC Total TRY FC Total I. CASH AND BALANCES WITH
STANDARD CHARTERED YATIRIM BANKASI TÜRK A.Ş.
 (CONVENIENCE TRANSLATION OF FINANCIAL STATEMENTS AND RELATED DISCLOSURES AND FOOTNOTES ORIGINALLY ISSUED IN TURKISH, SEE SECTION 6.1) STANDARD CHARTERED YATIRIM BANKASI TÜRK A.Ş. Unconsolidated Interim
ICBC Turkey Bank Anonim Şirketi
 (Convenience Translation of Consolidated Interim Financial Statements and Related Disclosures and Footnotes Originally Issued in Turkish, See Note I in Section Three) ICBC Turkey Bank Anonim Şirketi Consolidated
Consolidated Financial Statements. With Independent Auditors Report Thereon
 Türkiye Garanti Bankası Anonim Şirketi And Its Financial Affiliates Consolidated Financial Statements As of and For the Year Ended 31 December 2008 ( and Related Disclosures and Footnotes Originally Issued
T.C. ZİRAAT BANKASI A.Ş. UNCONSOLIDATED BALANCE SHEET (FINANCIAL POSITION TABLE)
") EK1-A Current Period Prior Period ASSETS Dipnot ( 31 / 03 / 2011 ) ( 31 / 12 / 2010 ) TL FC Total TL FC Total I. CASH BALANCES WITH THE CENTRAL BANK OF TURKEY (1) 9,336,766 2,565,388 11,902,154 7,652,000
EK1-A Current Period Prior Period ASSETS Dipnot ( 31 / 03 / 2011 ) ( 31 / 12 / 2010 ) TL FC Total TL FC Total I. CASH BALANCES WITH THE CENTRAL BANK OF TURKEY (1) 9,336,766 2,565,388 11,902,154 7,652,000
(CONVENIENCE TRANSLATION OF FINANCIAL STATEMENTS)
") BALANCE SHEET AS OF SEPTEMBER 30, 2018 (STATEMENT OF FINANCIAL POSITION) I. BALANCE SHEET ASSETS 30.09.2018 I. FINANCIAL ASSETS (Net) 36.351.297 34.145.223 70.496.520 1.1 Cash and cash equivalents 2.216.435
BALANCE SHEET AS OF SEPTEMBER 30, 2018 (STATEMENT OF FINANCIAL POSITION) I. BALANCE SHEET ASSETS 30.09.2018 I. FINANCIAL ASSETS (Net) 36.351.297 34.145.223 70.496.520 1.1 Cash and cash equivalents 2.216.435
(CONVENIENCE TRANSLATION OF FINANCIAL STATEMENTS)
") BALANCE SHEET AS OF DECEMBER 31, 2018 (STATEMENT OF FINANCIAL POSITION) I. BALANCE SHEET ASSETS 31.12.2018 I. FINANCIAL ASSETS (Net) 26.600.080 27.411.488 54.011.568 1.1 Cash and cash equivalents 2.537.892
BALANCE SHEET AS OF DECEMBER 31, 2018 (STATEMENT OF FINANCIAL POSITION) I. BALANCE SHEET ASSETS 31.12.2018 I. FINANCIAL ASSETS (Net) 26.600.080 27.411.488 54.011.568 1.1 Cash and cash equivalents 2.537.892
(CONVENIENCE TRANSLATION OF FINANCIAL STATEMENTS)
") BALANCE SHEET AS OF DECEMBER 31, 2018 (STATEMENT OF FINANCIAL POSITION) I. BALANCE SHEET ASSETS 31.12.2018 I. FINANCIAL ASSETS (Net) 26.245.952 27.373.211 53.619.163 1.1 Cash and cash equivalents 2.125.340
BALANCE SHEET AS OF DECEMBER 31, 2018 (STATEMENT OF FINANCIAL POSITION) I. BALANCE SHEET ASSETS 31.12.2018 I. FINANCIAL ASSETS (Net) 26.245.952 27.373.211 53.619.163 1.1 Cash and cash equivalents 2.125.340
STANDARD CHARTERED YATIRIM BANKASI TÜRK A.Ş.
 (CONVENIENCE TRANSLATION OF FINANCIAL STATEMENTS AND RELATED DISCLOSURES AND FOOTNOTES ORIGINALLY ISSUED IN TURKISH, SEE SECTION 3.1) STANDARD CHARTERED YATIRIM BANKASI TÜRK A.Ş. Unconsolidated Interim
ICBC Turkey Bank Anonim Şirketi
 (Convenience Translation of Consolidated Interim Financial Statements and Related Disclosures and Footnotes Originally Issued in Turkish, See Note I in Section Three) ICBC Turkey Bank Anonim Şirketi Consolidated
STANDARD CHARTERED YATIRIM BANKASI TÜRK A.Ş.
 (CONVENIENCE TRANSLATION OF FINANCIAL STATEMENTS AND RELATED DISCLOSURES AND ) STANDARD CHARTERED YATIRIM BANKASI TÜRK A.Ş. Unconsolidated Financial Report As of and For the Three-Month Period Ended 31
STANDARD CHARTERED YATIRIM BANKASI TÜRK A.Ş.
 (CONVENIENCE TRANSLATION OF FINANCIAL STATEMENTS AND RELATED DISCLOSURES AND FOOTNOTES ORIGINALLY ISSUED IN TURKISH, SEE SECTION 3.1) STANDARD CHARTERED YATIRIM BANKASI TÜRK A.Ş. Unconsolidated Financial
Tekstil Bankası Anonim Şirketi
 (Convenience Translation of Consolidated Financial Report Originally Issued in Turkish) Tekstil Bankası Anonim Şirketi Publicly Announced Consolidated Financial Statements and Related Disclosures Prepared
T.C. ZİRAAT BANKASI A.Ş. UNCONSOLIDATED STATEMENT OF CASH FLOWS
 ATTACHMENT 1-E T.C. ZİRAAT BANKASI A.Ş. UNCONSOLIDATED STATEMENT OF CASH FLOWS A. CASH FLOWS FROM BANKING OPERATIONS Note (01/01/2007-30/06/2007) (01/04/2006-30/06/2006) 1.1 Operating profit before changes
CONVENIENCE TRANSLATION OF PUBLICLY ANNOUNCED CONSOLIDATED FINANCIAL STATEMENTS AND REVIEW REPORT AT 30 JUNE 2018, SEE NOTE I OF SECTION THREE HSBC
 AND REVIEW REPORT AT 30 JUNE 2018, SEE NOTE I OF SECTION THREE HSBC BANK A.Ş. PUBLICLY ANNOUNCED TOGETHER WITH REVIEW REPORT AT 30 JUNE 2018 SECTION ONE General Information I. The Parent Bank s foundation
ODEA BANK A.Ş. UNCONSOLIDATED FINANCIAL STATEMENTS AND RELATED DISCLOSURES AT JUNE 30, 2015 TOGETHER WITH INDEPENDENT AUDITOR S LIMITED REVIEW REPORT
 ODEA BANK A.Ş. UNCONSOLIDATED FINANCIAL STATEMENTS AND RELATED DISCLOSURES AT JUNE 30, 2015 TOGETHER WITH INDEPENDENT AUDITOR S LIMITED REVIEW REPORT (Convenience translation of unconsolidated financial
T.C. ZİRAAT BANKASI A.Ş. UNCONSOLIDATED BALANCE SHEET
 T.C. ZİRAAT BANKASI A.Ş. UNCONSOLIDATED BALANCE SHEET ASSETS Note ( 30 / 09 / 2008 ) ( 31 / 12 / 2007 ) TRY FC Total TRY FC Total I. CASH AND BALANCES WITH THE CENTRAL BANK OF TURKEY (1) 3,861,387 1,581,144
Türkiye İş Bankası Anonim Şirketi
 (Convenience Translation of Unconsolidated Interim Financial Statements and Related Disclosures and Footnotes Originally Issued in Turkish, See Note I in Section Three) Türkiye İş Bankası Anonim Şirketi
AKBANK T.A.Ş. PUBLICLY ANNOUNCED CONSOLIDATED FINANCIAL STATEMENTS AND RELATED DISCLOSURES AT 30 SEPTEMBER 2018 TOGETHER WITH AUDITOR S REVIEW REPORT
 PUBLICLY ANNOUNCED CONSOLIDATED FINANCIAL STATEMENTS AND RELATED DISCLOSURES AT 30 SEPTEMBER 2018 TOGETHER WITH AUDITOR S REVIEW REPORT (Convenience translation of publicly announced consolidated financial
LIMITED REVIEW REPORT, CONSOLIDATED FINANCIAL STATEMENTS AND FOOTNOTES FOR THE INTERIM PERIOD 1 JANUARY 30 SEPTEMBER 2015
 LIMITED REVIEW REPORT, CONSOLIDATED FINANCIAL STATEMENTS AND FOOTNOTES FOR THE INTERIM PERIOD (Convenience Translation of Financial Statements and Related Disclosures and Footnotes Originally Issued in
TÜRKİYE İŞ BANKASI ANONİM ŞİRKETİ THE UNCONSOLIDATED INTERIM FINANCIAL REPORT AS AT AND FOR THE THREE-MONTH PERIOD ENDED 31 MARCH 2016
 TÜRKİYE İŞ BANKASI ANONİM ŞİRKETİ THE UNCONSOLIDATED INTERIM FINANCIAL REPORT AS AT AND FOR THE THREE-MONTH PERIOD ENDED 31 MARCH 2016 Headquarters Address: İş Kuleleri, 34330, Levent/İstanbul Telephone:
CONVENIENCE TRANSLATION OF PUBLICLY ANNOUNCED UNCONSOLIDATED FINANCIAL STATEMENTS AND REVIEW REPORT AT 31 MARCH 2018, SEE NOTE I OF SECTION THREE
 UNCONSOLIDATED FINANCIAL STATEMENTS AND REVIEW REPORT AT, SEE NOTE I OF SECTION THREE PUBLICLY ANNOUNCED UNCONSOLIDATED FINANCIAL STATEMENTS TOGETHER WITH REVIEW REPORT AT SECTION ONE Page General Information
FİBABANKA A.Ş. AND ITS SUBSIDIARY
 LIMITED REVIEW REPORT, CONSOLIDATED FINANCIAL STATEMENTS AND FOOTNOTES FOR THE INTERIM PERIOD 1 JANUARY 30 SEPTEMBER 2014 (Convenience Translation of Financial Statements and Related Disclosures and Footnotes
TÜRKİYE İŞ BANKASI ANONİM ŞİRKETİ THE UNCONSOLIDATED INTERIM FINANCIAL REPORT AS AT AND FOR THE SIX-MONTH PERIOD ENDED 30 JUNE 2016
 TÜRKİYE İŞ BANKASI ANONİM ŞİRKETİ THE UNCONSOLIDATED INTERIM FINANCIAL REPORT AS AT AND FOR THE SIX-MONTH PERIOD ENDED 30 JUNE 2016 Headquarters Address: İş Kuleleri, 34330, Levent/İstanbul Telephone:
633,338 (808,045) (24,898) 45, ,353 (738,014)
 (24,898) 45, ,353 (738,014)") T.C. ZİRAAT BANKASI A.Ş. CONSOLIDATED STATEMENT OF PROFIT AND LOSS ITEMS ACCOUNTED UNDER SHAREHOLDERS' EQUITY AUDI TED PROFIT AND LOSS ACCOUNTED UNDER SHAREHOLDERS` EQUITY CURRENT PERI OD PRI OR PERI OD
T.C. ZİRAAT BANKASI A.Ş. CONSOLIDATED STATEMENT OF PROFIT AND LOSS ITEMS ACCOUNTED UNDER SHAREHOLDERS' EQUITY AUDI TED PROFIT AND LOSS ACCOUNTED UNDER SHAREHOLDERS` EQUITY CURRENT PERI OD PRI OR PERI OD
FİBABANKA A.Ş. AND ITS SUBSIDIARY
 INDEPENDENT AUDITOR'S REPORT, CONSOLIDATED FINANCIAL STATEMENTS AND FOOTNOTES AS OF AND FOR THE YEAR ENDED 1 JANUARY 31 DECEMBER 2014 (Convenience Translation of Financial Statements and Related Disclosures
LIMITED REVIEW REPORT, CONSOLIDATED FINANCIAL STATEMENTS AND FOOTNOTES FOR THE INTERIM PERIOD 1 JANUARY 30 JUNE 2015
 LIMITED REVIEW REPORT, CONSOLIDATED FINANCIAL STATEMENTS AND FOOTNOTES FOR THE INTERIM PERIOD (Convenience Translation of Financial Statements and Related Disclosures and Footnotes Originally Issued in
Türkiye Garanti Bankası Anonim Şirketi
 ( Originally Issued in Turkish, See Note 3.1.1) Türkiye Garanti Bankası Anonim Şirketi Unconsolidated Interim Financial Statements As of and For the Three Month Ended 31 March 2005 ( and Related Disclosures
III. BANKS RECEIVABLES FROM REVERSE REPURCHASE TOTAL ASSETS
 BALANCE SHEET AS OF 31 DECEMBER 2016 ASSETS Notes 31 December 2016 31 December 2015 TL FC TOTAL TL FC TOTAL I. CASH, CASH EQUIVALENTS AND CENTRAL BANK - - - - - - II. FINANCIAL ASSETS AT FAIR VALUE THROUGH
Türkiye Vakıflar Bankası Türk Anonim Ortaklığı
 ( ) Türkiye Vakıflar Bankası Türk Anonim Ortaklığı Unconsolidated Financial Statements As at and for the Year Ended 31 December 2013 With Independent Auditors Report Thereon Akis Bağımsız Denetim ve Serbest
Vakıf Katılım Bankası Anonim Şirketi
 Vakıf Katılım Bankası Anonim Şirketi Publicly announced consolidated financial statements and related disclosures at September 30, 2018 together with independent auditor s limited review report (Convenience
PUBLICLY ANNOUNCED UNCONSOLIDATED FINANCIAL STATEMENTS AND RELATED DISCLOSURES AT 30 JUNE 2018 TOGETHER WITH AUDITOR S REVİEW REPORT
 PUBLICLY ANNOUNCED UNCONSOLIDATED FINANCIAL STATEMENTS AND RELATED DISCLOSURES AT 30 JUNE 2018 TOGETHER WITH AUDITOR S REVİEW REPORT (Convenience translation of publicly announced unconsolidated financial
Türkiye İş Bankası Anonim Şirketi
 (Convenience Translation of Unconsolidated Interim Financial Statements and Related Disclosures and Footnotes Originally Issued in Turkish, See Note I in Section Three) Türkiye İş Bankası Anonim Şirketi
LIMITED REVIEW REPORT, CONSOLIDATED FINANCIAL STATEMENTS AND FOOTNOTES FOR THE INTERIM PERIOD 1 JANUARY 31 MARCH 2014
 LIMITED REVIEW REPORT, CONSOLIDATED FINANCIAL STATEMENTS AND FOOTNOTES FOR THE INTERIM PERIOD 1 JANUARY 31 MARCH 2014 (Convenience Translation of Financial Statements and Related Disclosures and Footnotes
TÜRK EKONOMİ BANKASI A.Ş.
 CONVENIENCE TRANSLATION OF PUBLICLY ANNOUNCED UNCONSOLIDATED INTERIM FINANCIAL STATEMENTS AND REVIEW REPORT ORIGINALLY ISSUED IN TURKISH, SEE NOTE I. OF SECTION THREE PUBLICLY ANNOUNCED UNCONSOLIDATED
Alternatifbank A.Ş. 26 April 2017
 (Convenience Translation of Unconsolidated Interim Financial Statements and Related Disclosures and Footnotes Originally Issued in Turkish, See Note I in Section Three) Alternatifbank A.Ş. Unconsolidated
TÜRK EKONOMİ BANKASI A.Ş. PUBLICLY ANNOUNCED CONSOLIDATED FINANCIAL STATEMENTS AND RELATED DISCLOSURES FOR THE PERIOD FROM 1 JANUARY TO 31 MARCH 2018
 CONVENIENCE TRANSLATION OF PUBLICLY ANNOUNCED CONSOLIDATED INTERIM FINANCIAL STATEMENTS AND REVIEW REPORT ORIGINALLY ISSUED IN TURKISH, SEE NOTE I. OF SECTION THREE PUBLICLY ANNOUNCED CONSOLIDATED FINANCIAL
LIMITED REVIEW REPORT, CONSOLIDATED FINANCIAL STATEMENTS AND FOOTNOTES FOR THE INTERIM PERIOD 1 JANUARY 31 MARCH 2016
 LIMITED REVIEW REPORT, CONSOLIDATED FINANCIAL STATEMENTS AND FOOTNOTES FOR THE INTERIM PERIOD (Convenience Translation of Financial Statements and Related Disclosures and Footnotes Originally Issued in
咇l咇m nk 咇.Ş. n咇咇l. 咇 咇 咇 n 咇咇 n 咇 m咇 n n咇 咇 l n 咇l咇m nk 咇.Ş. m咇 咇 n l m n n m 咇 n咇 n 咇咇 n l 咇 n n 咇 n 咇mm 咇n n 咇n n咇 咇 l n 咇咇l n n. n 咇 m n 咇 n 咇 l n
 INDEPENDENT AUDITORS REPORT, UNCONSOLIDATED FINANCIAL STATEMENTS AND NOTES TO THE FINANCIAL STATEMENTS FOR THE PERIOD 1 JANUARY- 31 DECEMBER 2006 咇l咇m nk 咇.Ş. n咇咇l. 咇 咇 咇 n 咇咇 n 咇 m咇 n n咇 咇 l n 咇l咇m nk
TÜRKİYE VAKIFLAR BANKASI TÜRK ANONİM ORTAKLIĞI UNCONSOLIDATED FINANCIAL REPORT AS AT AND FOR THE THREE-MONTH PERIOD ENDED MARCH 31, 2018
 TÜRKİYE VAKIFLAR BANKASI TÜRK ANONİM ORTAKLIĞI UNCONSOLIDATED FINANCIAL STATEMENTS AND RELATED DISCLOSURES AT MARCH 31, 2018 TOGETHER WITH THE REVIEW REPORT (Convenience Translation of Publicly Announced
Türkiye Finans Katılım Bankası Anonim Şirketi. Unconsolidated Financial Statements As of and For the Three-Month Period Ended 31 March 2015
 Türkiye Finans Katılım Bankası Anonim Şirketi Unconsolidated Financial Statements As of and For the Three-Month Period Ended 31 March 2015 ( and Related Disclosures and Footnotes Originally Issued in Turkish)
III. BANKS RECEIVABLES FROM REVERSE REPURCHASE TOTAL ASSETS
 BALANCE SHEET AS OF 30 JUNE 2016 ASSETS Notes 30 June 2016 31 December 2015 Audited TL FC TOTAL TL FC TOTAL I. CASH, CASH EQUIVALENTS AND CENTRAL BANK - - - - - - II. FINANCIAL ASSETS AT FAIR VALUE THROUGH
III. BANKS RECEIVABLES FROM REVERSE REPURCHASE TOTAL ASSETS
 BALANCE SHEET AS OF 30 SEPTEMBER 2016 ASSETS Notes 30 September 2016 31 December 2015 Audited TL FC TOTAL TL FC TOTAL I. CASH, CASH EQUIVALENTS AND CENTRAL BANK - - - - - - II. FINANCIAL ASSETS AT FAIR
BANK MELLAT, MERKEZİ: TAHRAN-İRAN İSTANBUL TÜRKİYE MERKEZ, ANKARA VE İZMİR ŞUBELERİ
 BANK MELLAT, MERKEZİ: TAHRAN-İRAN İSTANBUL TÜRKİYE MERKEZ, ANKARA VE İZMİR ŞUBELERİ INDEPENDENT AUDITOR S REPORT, UNCONSOLIDATED FINANCIAL STATEMENTS AND NOTES FOR THE YEAR ENDED DECEMBER 31, 2010 Translated
Interim Review Report on Consolidated Interim Financial Statements
 FİBABANKA A.Ş. AND ITS SUBSIDIARY INDEPENDENT AUDITOR S LIMITED REVIEW REPORT, CONSOLIDATED INTERIM FINANCIAL STATEMENTS AND RELATED DISCLOSURES FOR THE SIX MONTHS PERIOD ENDED 30 JUNE 2018 (Convenience
KUVEYT TÜRK KATILIM BANKASI A.Ş.
 KUVEYT TÜRK KATILIM BANKASI A.Ş. UNCONSOLIDATED FINANCIAL STATEMENTS AS OF AND FOR THE PERIOD ENDED 1 JANUARY-31 MARCH 2018 WITH INDEPENDENT AUDITOR S LIMITED REVIEW REPORT (CONVENIENCE TRANSLATION OF
TÜRKİYE VAKIFLAR BANKASI TÜRK ANONIM ORTAKLIĞI
 TÜRKİYE VAKIFLAR BANKASI TÜRK ANONIM ORTAKLIĞI PUBLICLY ANNOUNCED UNCONSOLIDATED FINANCIAL STATEMENTS TOGETHER WITH INDEPENDENT AUDITOR S REPORT AT 31 DECEMBER 2014 (Convenience Translation of Publicly
Turk Ekonomi Bankasi Anonim Sirketi
 Turk Ekonomi Bankasi Anonim Sirketi Unconsolidated Financial Statements As of March 31, 2005 Together With Review Report (CONVENIENCE TRANSLATION OF A REPORT AND FINANCIAL STATEMENTS ORIGINALLY ISSUED
PUBLICLY ANNOUNCED UNCONSOLIDATED FINANCIAL STATEMENTS AND RELATED DISCLOSURES AT 30 JUNE 2017 TOGETHER WITH AUDITOR S REVIEW REPORT
 PUBLICLY ANNOUNCED UNCONSOLIDATED FINANCIAL STATEMENTS AND RELATED DISCLOSURES AT 30 JUNE 2017 TOGETHER WITH AUDITOR S REVIEW REPORT (Convenience translation of publicly announced unconsolidated financial
Türkiye İş Bankası Anonim Şirketi
 (Convenience Translation of Unconsolidated Interim Financial Statements and Related Disclosures and Footnotes Originally Issued in Turkish, See Note I in Section Three) Türkiye İş Bankası Anonim Şirketi
KUVEYT TÜRK KATILIM BANKASI A.Ş.
 KUVEYT TÜRK KATILIM BANKASI A.Ş. UNCONSOLIDATED FINANCIAL STATEMENTS AS OF AND FOR THE INTERIM PERIOD ENDED 1 JANUARY-30 SEPTEMBER 2018 WITH INDEPENDENT AUDITOR S LIMITED REVIEW REPORT (CONVENIENCE TRANSLATION
Şeker Finansman Anonim Şirketi (Formerly title Şeker Mortgage Finansman Anonim Şirketi)
") Şeker Finansman Anonim Şirketi (Formerly title Şeker Mortgage Finansman Anonim Şirketi) Financial Statements As At and For the Year Ended 31 December 2017 With Independent Auditor s Report INDEX: Statement
Şeker Finansman Anonim Şirketi (Formerly title Şeker Mortgage Finansman Anonim Şirketi) Financial Statements As At and For the Year Ended 31 December 2017 With Independent Auditor s Report INDEX: Statement
AKBANK T.A.Ş. PUBLICLY ANNOUNCED CONSOLIDATED FINANCIAL STATEMENTS TOGETHER WITH REVIEW REPORT AT 30 JUNE 2007
 CONVENIENCE TRANSLATION OF PUBLICLY ANNOUNCED CONSOLIDATED FINANCIAL STATEMENTS AND REVIEW REPORT ORIGINALLY ISSUED IN TURKISH, SEE NOTE I.b OF SECTION THREE PUBLICLY ANNOUNCED CONSOLIDATED FINANCIAL STATEMENTS
Türkiye Vakıflar Bankası Türk Anonim Ortaklığı
 (s ) Türkiye Vakıflar Bankası Türk Anonim Ortaklığı As at and for the Year Ended 31 December 2008 (s and Related Disclosures and Footnotes Originally Issued in Turkish) With Independent Auditors Report
CONVENIENCE TRANSLATION PUBLICLY ANNOUNCED UNCONSOLIDATED
 CONVENIENCE TRANSLATION OF PUBLICLY ANNOUNCED UNCONSOLIDATED INTERIM FINANCIAL STATEMENTS AND REVIEW REPORT ORIGINALLY ISSUED IN TURKISH, SEE NOTE I. OF SECTION THREE PUBLICLY ANNOUNCED UNCONSOLIDATED
Alternatifbank A.Ş. 27 October 2017
 (Convenience Translation of Unconsolidated Interim Financial Statements and Related Disclosures and Footnotes Originally Issued in Turkish, See Note I in Section Three) Alternatifbank A.Ş. Unconsolidated
INDEPENDENT AUDITOR S REVIEW REPORT, UNCONSOLIDATED FINANCIAL STATEMENTS AND NOTES FOR THE PERIOD ENDED SEPTEMBER 30, 2015
 INDEPENDENT AUDITOR S REVIEW REPORT, UNCONSOLIDATED FINANCIAL STATEMENTS AND NOTES FOR THE PERIOD ENDED SEPTEMBER 30, 2015 Convenience translation of the Independent Auditor s Report originally issued
AKBANK T.A.Ş. PUBLICLY ANNOUNCED CONSOLIDATED FINANCIAL STATEMENTS TOGETHER WITH REVIEW REPORT AT 31 MARCH 2007
 CONVENIENCE TRANSLATION OF PUBLICLY ANNOUNCED CONSOLIDATED FINANCIAL STATEMENTS AND REVIEW REPORT ORIGINALLY ISSUED IN TURKISH, SEE NOTE I.b OF SECTION THREE PUBLICLY ANNOUNCED CONSOLIDATED FINANCIAL STATEMENTS
 TÜRKİYE VAKIFLAR BANKASI TÜRK ANONİM ORTAKLIĞI UNCONSOLIDATED FINANCIAL STATEMENTS AND RELATED DISCLOSURES AT DECEMBER 31, 2017 TOGETHER WITH INDEPENDENT AUDITORS REPORT (Convenience Translation of Publicly
(Convenience Translation of Financial Statements and Related Disclosures and Footnotes Originally Issued in Turkish, See Section 3 Note I)
") (s ) Türkiye Vakıflar Bankası Türk Anonim Ortaklığı Interim Financial Statements As of and for the Three-Month Period Ended 31 March 2008 With Independent Auditors Review Report Thereon Akis Bağımsız Denetim
(s ) Türkiye Vakıflar Bankası Türk Anonim Ortaklığı Interim Financial Statements As of and for the Three-Month Period Ended 31 March 2008 With Independent Auditors Review Report Thereon Akis Bağımsız Denetim
TÜRK EKONOMİ BANKASI A.Ş.
 CONVENIENCE TRANSLATION OF PUBLICLY ANNOUNCED UNCONSOLIDATED FINANCIAL STATEMENTS AND AUDITOR REPORT ORIGINALLY ISSUED IN TURKISH, SEE NOTE I. OF SECTION THREE PUBLICLY ANNOUNCED UNCONSOLIDATED FINANCIAL
Türkiye Vakıflar Bankası Türk Anonim Ortaklığı
 (Convenience Translation of Unconsolidated Interim Financial Statements and Related Disclosures and Footnotes ) Unconsolidated Interim Financial Report As at and for the Six-Month Period Ended 30 June
(Convenience Translation of Financial Statements and Related Disclosures and Footnotes Originally Issued in Turkish, See Section 3 Note I)
") ( ) Türkiye Vakıflar Bankası Türk Anonim Ortaklığı and Its Financial Subsidiaries Consolidated Interim Financial Statements As at and for the Six-Month Period Ended 30 June 2009 With Independent Auditors
( ) Türkiye Vakıflar Bankası Türk Anonim Ortaklığı and Its Financial Subsidiaries Consolidated Interim Financial Statements As at and for the Six-Month Period Ended 30 June 2009 With Independent Auditors
ODEA BANK A.Ş. UNCONSOLIDATED FINANCIAL STATEMENTS AND RELATED DISCLOSURES AT SEPTEMBER 30, 2018 TOGETHER WITH AUDITOR S LIMITED REVIEW REPORT
 ODEA BANK A.Ş. UNCONSOLIDATED FINANCIAL STATEMENTS AND RELATED DISCLOSURES AT SEPTEMBER 30, 2018 TOGETHER WITH AUDITOR S LIMITED REVIEW REPORT (Convenience translation of unconsolidated financial statements
Consolidated Interim Financial Statements as of and for the Three-Month Period Ended 31 March 2017
 (Convenience Translation of Consolidated Interim Financial Statements and Related Disclosures and Footnotes Originally Issued in Turkish, See Note 1.b of section three) ING Bank A.Ş. and Its Financial
TÜRKİYE VAKIFLAR BANKASI TÜRK ANONİM ORTAKLIĞI UNCONSOLIDATED FINANCIAL REPORT AS AT AND FOR THE SIX-MONTH PERIOD ENDED JUNE 30, 2018
 TÜRKİYE VAKIFLAR BANKASI TÜRK ANONİM ORTAKLIĞI UNCONSOLIDATED FINANCIAL STATEMENTS AND RELATED DISCLOSURES AT JUNE 30, 2018 TOGETHER WITH REVIEW REPORT (Convenience Translation of Publicly Announced Unconsolidated
KUVEYT TÜRK KATILIM BANKASI ANONİM ŞİRKETİ
 KUVEYT TÜRK KATILIM BANKASI ANONİM ŞİRKETİ INDEPENDENT AUDITOR S LIMITED REVIEW REPORT, UNCONSOLIDATED FINANCIAL STATEMENTS AND NOTES FOR THE PERIOD 1 JANUARY-31 MARCH 2016 Translated into English from
Tekstil Bankası Anonim Şirketi
 (Convenience Translation of Consolidated Financial Report Originally Issued in Turkish) Tekstil Bankası Anonim Şirketi Consolidated financial statements as at and for the period ended 30 September 2013
KUVEYT TÜRK KATILIM BANKASI A.Ş.
 KUVEYT TÜRK KATILIM BANKASI A.Ş. CONSOLIDATED FINANCIAL STATEMENTS AS OF AND FOR THE PERIOD ENDED 1 JANUARY-31 MARCH 2018 WITH INDEPENDENT AUDITOR S LIMITED REVIEW REPORT (CONVENIENCE TRANSLATION OF CONSOLIDATED
ŞEKER MORTGAGE FİNANSMAN ANONİM ŞİRKETİ STATEMENT OF FINANCIAL POSITION (BALANCE SHEET) AS AT 30 JUNE 2015
 AS AT 30 JUNE 2015") Statement of Financial Position (Balance Sheet) 1-2 Statement of Off-Balance Sheet Items 3 Statement of Profit or Loss 4 Statement of Profit or Loss and Other Comprehensive Income 5 Statement of Changes
Statement of Financial Position (Balance Sheet) 1-2 Statement of Off-Balance Sheet Items 3 Statement of Profit or Loss 4 Statement of Profit or Loss and Other Comprehensive Income 5 Statement of Changes
KUVEYT TÜRK KATILIM BANKASI ANONİM ŞİRKETİ
 KUVEYT TÜRK KATILIM BANKASI ANONİM ŞİRKETİ INDEPENDENT AUDITOR S LIMITED REVIEW REPORT, UNCONSOLIDATED FINANCIAL STATEMENTS AND NOTES FOR THE PERIOD 1 JANUARY-31 MARCH 2015 Translated into English from
FİNANSBANK ANONİM ŞİRKETİ AND IT S FINANCIAL SUBSIDIARIES
 AND IT S FINANCIAL SUBSIDIARIES INDEPENDENT AUDITOR S REPORT, CONSOLIDATED FINANCIAL STATEMENTS AND NOTES FOR THE YEAR ENDED DECEMBER 31, 2012 Translated into English from the Original Turkish Report To
TÜRK EKONOMİ BANKASI A.Ş.
 CONVENIENCE TRANSLATION OF PUBLICLY ANNOUNCED UNCONSOLIDATED INTERIM FINANCIAL STATEMENTS AND REVIEW REPORT ORIGINALLY ISSUED IN TURKISH, SEE NOTE I. OF SECTION THREE PUBLICLY ANNOUNCED UNCONSOLIDATED
FİNANSBANK ANONİM ŞİRKETİ AND ITS FINANCIAL SUBSIDIARIES
 FİNANSBANK ANONİM ŞİRKETİ AND ITS FINANCIAL SUBSIDIARIES INDEPENDENT AUDITORS REPORT, CONSOLIDATED FINANCIAL STATEMENTS AND NOTES FOR THE YEAR ENDED MARCH 31, 2008 Translated into English from the Original
AKBANK T.A.Ş. PUBLICLY ANNOUNCED CONSOLIDATED FINANCIAL STATEMENTS AND RELATED DISCLOSURES AT 31 MARCH 2017 TOGETHER WITH AUDITOR S REVIEW REPORT
 PUBLICLY ANNOUNCED CONSOLIDATED FINANCIAL STATEMENTS AND RELATED DISCLOSURES AT 31 MARCH 2017 TOGETHER WITH AUDITOR S REVIEW REPORT (Convenience translation of publicly announced consolidated financial
ŞEKER MORTGAGE FİNANSMAN ANONİM ŞİRKETİ STATEMENT OF FINANCIAL POSITION (BALANCE SHEET) AS AT 31 DECEMBER 2015
 AS AT 31 DECEMBER 2015") Statement of Financial Position (Balance Sheet) 1-2 Statement of Off-Balance Sheet Items 3 Statement of Profit or Loss 4 Statement of Profit or Loss and Other Comprehensive Income 5 Statement of Changes
Statement of Financial Position (Balance Sheet) 1-2 Statement of Off-Balance Sheet Items 3 Statement of Profit or Loss 4 Statement of Profit or Loss and Other Comprehensive Income 5 Statement of Changes
KUVEYT TÜRK KATILIM BANKASI ANONİM ŞİRKETİ
 KUVEYT TÜRK KATILIM BANKASI ANONİM ŞİRKETİ INDEPENDENT AUDITOR S LIMITED REVIEW REPORT, UNCONSOLIDATED FINANCIAL STATEMENTS AND NOTES FOR THE INTERIM PERIOD 1 JANUARY-30 SEPTEMBER 2015 Translated into
TÜRKİYE İŞ BANKASI ANONİM ŞİRKETİ THE CONSOLIDATED FINANCIAL REPORT AS OF AND FOR THE YEAR ENDED 31 DECEMBER 2014
 TÜRKİYE İŞ BANKASI ANONİM ŞİRKETİ THE CONSOLIDATED FINANCIAL REPORT AS OF AND FOR THE YEAR ENDED 31 DECEMBER 2014 Headquarters Address: İş Kuleleri, 34330, Levent/İstanbul Telephone: 0212 316 00 00 Fax:
TURKLAND BANK ANONİM ŞİRKETİ
 INDEPENDENT AUDITOR S LIMITED REVIEW REPORT, UNCONSOLIDATED FINANCIAL STATEMENTS AND NOTES FOR THE PERIOD ENDED SEPTEMBER 30, 2012 Translated into English from the original Turkish report and financial
KUVEYT TÜRK KATILIM BANKASI ANONİM ŞİRKETİ AND ITS FINANCIAL SUBSIDIARIES
 KUVEYT TÜRK KATILIM BANKASI ANONİM ŞİRKETİ AND ITS FINANCIAL SUBSIDIARIES INDEPENDENT AUDITOR S REPORT, CONSOLIDATED FINANCIAL STATEMENTS AND NOTES FOR THE YEAR ENDED 31 DECEMBER 2015 Translated into English
AKBANK T.A.Ş. PUBLICLY ANNOUNCED CONSOLIDATED FINANCIAL STATEMENTS AND RELATED DISCLOSURES AT 30 SEPTEMBER 2017 TOGETHER WITH AUDITOR S REVIEW REPORT
 PUBLICLY ANNOUNCED CONSOLIDATED FINANCIAL STATEMENTS AND RELATED DISCLOSURES AT 30 SEPTEMBER 2017 TOGETHER WITH AUDITOR S REVIEW REPORT (Convenience translation of publicly announced consolidated financial
CONVENIENCE TRANSLATION OF PUBLICLY ANNOUNCED CONSOLIDATED FINANCIAL STATEMENTS AND REVIEW REPORT AT 30 SEPTEMBER 2018, SEE NOTE I OF SECTION THREE
 AND REVIEW REPORT, SEE NOTE I OF SECTION THREE HSBC BANK A.Ş. PUBLICLY ANNOUNCED TOGETHER WITH REVIEW REPORT AUDITOR S REVIEW REPORT ON INTERIM FINANCIAL INFORMATION (Convenience translation of the independent