Building sustainable shareholder value
|
|
|
- Coral Lloyd
- 5 years ago
- Views:
Transcription


1 Building sustainable shareholder value Fourth Quarter,


2 CAPITAL MANAGEMENT SUSTAINABILTY BUSINESS OVERVIEW ASSET PORTFOLIO 2

3 CAPITAL MANAGEMENT SUSTAINABILTY BUSINESS OVERVIEW ASSET PORTFOLIO 3
, as of")
4 THE WORLD OF A $27 billion 1 leading international financial services organization operating through a balanced and diversified model focused on creating shareholder value now and in the future 1 Market capitalization (C$), as of December 31, 4
5 THE SUN LIFE STORY We have four strong pillars that can each compete, win and grow in their respective sectors and which leverage each other Bound together by a strong balance sheet and risk culture, including no direct U.S. Variable Annuity or Long-Term Care Building on momentum created by past organic investments and acquisitions that will help drive earnings growth 5
6 CONTINUING THE JOURNEY Our ambition is to be ONE OF THE BEST insurance and asset management companies globally Each pillar viewed as one of the best in its markets Top Quartile Client Experience Disproportionate Share of Top Talent Top Quartile Total Shareholder Return 6


7 AMBITION TO BE ONE OF THE BEST INSURANCE AND ASSET MANAGEMENT COMPANIES IN THE WORLD CAN AM A Leader in Insurance and Wealth Solutions in our Canadian Home Market A Leader in Global Asset Management A growth strategy focused on high ROE and strong capital generation through leading positions in attractive markets globally A Leader in U.S. Group Benefits A Leader in Asia through Distribution Excellence in Higher Growth Markets US ASIA MEDIUM-TERM FINANCIAL OBJECTIVES 1 Average underlying EPS growth per annum: 8-10% -- Underlying ROE: 12-14% -- Dividend payout ratio: 40-50% 1 The objectives are forward-looking non-ifrs financial measures based on underlying net income and are not earnings guidance. See Medium-Term Financial Objectives in the appendix to these slides. 7
8 DELIVERING VALUE TO SHAREHOLDERS 2,185 2,305 NET INCOME 1 (C$ MILLIONS) 2,485 2,335 CAGR 9%* 2,149 2,546 2,522 2,947 SLF Inc. TSX Global Lifecos TOTAL SHAREHOLDER RETURN FIVE YEARS AS OF DECEMBER 31, (ANNUALIZED RETURN) U.S. Lifecos Canadian Lifecos Reported Net Income Underlying Net Income Source: Bloomberg 0% 1% 2% 3% 4% 5% 6% 7% 8% Companies included in these peer groups are listed in the appendix 1 Underlying Net Income represents a non-ifrs financial measure. See Use of Non-IFRS Financial Measures and Reconciliation of Net Income measures in the appendix to these slides. * Compound Annual Growth Rate ( CAGR ) for Underlying Net Income. 8
9 BALANCED AND DIVERSIFIED BUSINESS BUSINESS DIVERSIFICATION UNDERLYING NET INCOME 1* GEOGRAPHIC DIVERSIFICATION UNDERLYING NET INCOME 1 * GROUP INSURANCE 19% RUN-OFF 12% INDIVIDUAL INSURANCE 28% ASSET MANAGEMENT 29% WEALTH 12% SLF U.S. 16% SLF ASIA 17% SLF U.K. 5% SLF CANADA 33% SLF ASSET MANAGEMENT 29% * Excludes Corporate Support No direct U.S. Variable Annuity or Long-Term Care Exposure Relatively low market risk exposure 144% LICAT Ratio (SLF Inc.) $2.5B of Holdco 2 cash, 21.2% financial leverage ratio 2 Strong risk management culture Balanced and diversified portfolio to deliver across cycles 1 Represents a non-ifrs financial measure. See Use of Non-IFRS Financial Measures and Reconciliation of Net Income measures in the appendix to these slides. 2 Holdco refers to Sun Life Financial Inc. and its wholly-owned holding companies 9
10 BUSINESS GROUP PERFORMANCE REPORTED NET INCOME(LOSS) (C$ MILLIONS) UNDERLYING NET INCOME 1 (C$ MILLIONS) Impact of currency increased reported net income by $18M Impact of currency increased underlying net income by $16M CAN US AM ASIA CAN US AM ASIA (63) Represents a Non-IFRS financial measure. See Use of Non-IFRS Financial Measures and Reconciliation of Net Income measures in the appendix to these slides. 10
11 SLF CANADA: GROWING EARNINGS POWER 18 and HIGHLIGHTS Achieved underlying net income exceeding $1B and reaching leadership position in most markets Launched Lumino Health, the first-of-its-kind digital health network for Canadians Continued to provide personalized, digital nudges to plan members in Canada; In-plan deposit activity up 24% to over $900 million in Sun Life Global Investments assets under management 1 ( AUM ) of $23 billion Maintained #1 position in workplace solutions including reaching over $97 billion Group Retirement Services AUM Group Benefits business in-force of $10.6 billion 152,560 ASSETS UNDER MANAGEMENT 1 (C$ MILLIONS) 165, , , UNDERLYING NET INCOME 1 (C$ MILLIONS) , Represents a non-ifrs financial measure. See Use of Non-IFRS Financial Measures and Reconciliation of Net Income measures in the appendix to these slides. 11
12 SLF ASSET MANAGEMENT: WELL POSITIONED FOR GROWTH UNDERLYING NET INCOME 1 (C$ MILLIONS) and HIGHLIGHTS Announced an agreement to merge our North American real estate investment manager, Bentall Kennedy, with GreenOak Real Estate and take a majority stake in the combined entity 2 Strong investment performance, with 78%, 79% and 94% of MFS's U.S. retail fund assets ranked in the top half of their Lipper categories based on three-, five-, and ten-year performance, respectively Pre-tax net operating profit margin ratio for MFS of 38% MFS AUM 1 C$584 billion SLIM AUM 1 C$66 billion Active management in public markets A broad range of equity and fixed income products Solution-based opportunities (multi-sector, target date funds) 1 Represents a non-ifrs financial measure. See Use of Non-IFRS Financial Measures and Reconciliation of Net Income measures in the appendix to these slides. 2 This statement is a forward-looking statement within the meaning of applicable securities laws. See Forward-Looking Statements and Risk Factors in the appendix to these slides 12
13 SLF U.S.: EXECUTION ON KEY INITIATIVES 18 & HIGHLIGHTS Reached a milestone for total Group Benefits sales at US$1.0 billion for the first time, an increase of 16% over 2017 Created FullscopeRMS brand in the U.S. to offer our comprehensive suite of capabilities for employee health plans and other insurance providers Acquired Maxwell Health, an innovative insurtech start-up with an employee benefits platform that makes benefits and HR administration simple for employers and their employees After-tax profit margin for Group Benefits of 6.7% 1,2 SLF U.S. s stop-loss business achieved 16% yearover-year growth in business-in-force 1, reaching US$1.6 billion UNDERLYING NET INCOME 1 (US$ MILLIONS) % AFTER- TAX PROFIT MARGIN FOR GROUP BENEFITS 1,2 3.5% 5.0% 6.7% Represents Non-IFRS financial measures. See Use of Non-IFRS Financial Measures and Reconciliation of Net Income measures in the appendix to these slides. 2 After-tax profit margin for SLF U.S. Group Benefits calculated on underlying net income as a percentage of net premiums on a trailing four quarters basis. 13
14 SLF ASIA: DISTRIBUTION EXCELLENCE IN HIGHER GROWTH MARKETS UNDERLYING NET INCOME 1 (C$ MILLIONS) & HIGHLIGHTS Completed a strategic investment in Bowtie Life Insurance Company Ltd., the first virtual insurer in Hong Kong approved under the Fast Track process 2 Bancassurance sales in India more than quadrupled in after establishing our relationship with HDFC Bank Limited, the largest bank in India's private sector Hong Kong MPF earned key industry awards that demonstrate we are providing relevant and value-added service to Clients, including: the top ranking in Mercer's latest MPF Provider Satisfaction Rankings the Sun Life Rainbow MPF Scheme was rated #1 by MPF Ratings INSURANCE & WEALTH AUM 1 INDIVIDUAL INSURANCE SALES 1,3 (C$ MILLIONS) INDIVIDUAL INSURANCE SALES 1 (C$ MILLIONS) INTERNATIONAL AUM 1 $ 68B $ 16B +4.8% YoY* * Year over Year ( YoY ) 1 Represents Non-IFRS financial measures. See Use of Non-IFRS Financial Measures and Reconciliation of Net Income measures in the appendix to these slides. 2 Fast Track process refers to the pilot launched by the Insurance Authority of Hong Kong on September 29, It is a fast track for application for authorizations of new insurers owning and operating solely digital distribution channels Sales from joint ventures are based on our proportionate equity interest

15 SLF ASIA: MARKET PRESENCE Presence in seven high growth markets, including Asia s two largest economies India & China. Access to Singapore & Dubai through International High Net Worth business 17% Total Company Underlying Net Income 1 from Asia* India China Hong Kong Vietnam Philippines Malaysia Indonesia * Based on Full Year ; excluding Corporate Support. SLF Asia underlying net income includes the results of International. 1 Represents Non-IFRS financial measures. See Use of Non-IFRS Financial Measures and Reconciliation of Net Income measures in the appendix to these slides. 15
16 CAPITAL MANAGEMENT SUSTAINABILTY BUSINESS OVERVIEW ASSET PORTFOLIO 16
17 OVERVIEW OF LICAT CAPITAL FRAMEWORK TOTAL RATIO Available Capital + Surplus Allowance Base Solvency Buffer TOTAL RATIO (SLF Inc.) = 144% AVAILABLE CAPITAL SURPLUS ALLOWANCE + ELIGIBLE DEPOSITS Similar to MCCSR Retained earnings / common and preferred equity continue to be largest components Main changes relate to adjustments and deductions to Tier 1 capital (+) Accumulated OCI (+) Value of Joint Ventures (-) Non-temporary DTAs Essentially the provisions for adverse + deviation (PfADs) for non-economic risks Insurance (mortality, morbidity, lapse) + interest Discounted at the rate used in the valuation of actuarial liabilities BASE SOLVENCY BUFFER Sum of aggregate capital required for: credit, market, insurance, segregated fund and operational risk Total solvency requirements for a 1:200 year tail event, with some allowance for diversification Discounted on a basis prescribed by OSFI, then grossed up by a scalar of 1.05 Total Capital Resources 17


18 CAPITAL GENERATION PROVIDES GOOD CAPITAL FLEXIBILITY Funding Organic Growth Strong Capital Generation Target Dividend Payout ratio of 40-50% M&A Opportunities Capital Flexibility Share buybacks Capital deployment priorities unchanged Target minimum cash at the holding company of $500 million Capital generation equal to or greater than $700 million Cash generation largely unaffected by LICAT 18

19 FINANCIAL FLEXIBILITY UNDER CAPITAL MODEL LICAT of 131% SLA $2.5 billion cash at holding company SLF SLA - External Capital Securities Outstanding First Call Subordinated Debt Coupon Balance Date CLI Series 2 Sub Debenture 6.30% $ May-28 $150 Innovative Tier 1 Securities SLEECS Series B 7.09% $ Jun-32 SLEECS Series % $ Dec-19 $699 LICAT 144% Leverage 21.2% Leverage Capacity to 25/30%: ~$1.4/$3.6B SLF Asset Management MFS Sun Life Investment Management SLF - External Capital Securities Outstanding First Call Subordinated Debt Coupon Balance Date SLF T2B (Series ) 5.40% $ May-37 SLF T2B (Series ) 2.77% $ May-19 SLF T2B (Series ) 2.60% $ Sep-20 SLF T2B (Series ) 3.10% $ Feb-21 SLF T2B (Series ) 3.05% $ Sep-23 SLF T2B (Series ) 2.75% $ Nov-22 $2,889 Preferred Shareholders' Equity SLF Series % $ Mar-14 SLF Series % $ Sep-14 SLF Series % $ Mar-15 SLF Series % $ Dec-15 SLF Series % $ Mar-16 SLF Class A, Series 8R 2.28% $ Jun-20 SLF Class A, Series 9QR Floating $ Jun-20 SLF Class A, Series 10R 2.84% $ Sep-21 SLF Class A, Series 11QR Floating $26 30-Sep-21 SLF Class A, Series 12R 3.81% $ Dec-21 $2,257 U.K. Canada Bermuda Asia U.S. Branch Book value excl. from LICAT ALL CAPITAL SECURITIES CONTINUE TO QUALIFY UNDER LICAT Capitalized to meet local capital rules All information as at December 31, ; all dollar amounts are in C$ unless otherwise stated 19
20 STRONG OPERATING AND FINANCIAL LEVERAGE Operating Leverage Tier 2 Tier 1 Tier 1 Operating Leverage Debt (C$ millions) Debt supporting reserve financing Senior Debt 599 Bilateral Senior Financing 1 2,066 Total Operating Leverage Debt 2,665 Capital (C$ millions) Subordinated Debt 3,039 SLEECS (Innovative Tier 1 Securities) 699 Preferred Shareholders Equity 2,257 Total Capital Securities 5,995 Common Shareholders Equity and Par 2 22,313 Total Capital 28,308 Financial Leverage Ratio 3, % 21.2% 1 As of December 31, as disclosed in SLF Inc. s Financial Statements. 2 Participating policyholders equity and non-controlling interest. 3 Represents a non-ifrs financial measure. See Use of Non-IFRS Financial Measures and Reconciliation of Net Income measures in the appendix to these slides. 20
21 CAPITAL FRAMEWORK COMPARISON - METRICS Capital Metrics and Targets Total Ratio Tier 1 Ratio (MCCSR)/ Core Ratio (LICAT) Minimum Target Ratios MCCSR Available Capital Required Capital Tier 1 Available Capital Required Capital Total Ratio 120% Core Ratio 60% LICAT Available Capital + Surplus Allowance (SA) + Eligible Deposits (ED) Base Solvency Buffer Tier 1 Available Capital + 70% x (SA + ED) Base Solvency Buffer Total Ratio 90% Core Ratio 55%* Supervisory Target Ratios** Total Ratio 150% Core Ratio 105% Total Ratio 100% Core Ratio 70% * Regulated insurance holding companies and non-operating insurance companies are subject to a minimum target of 50% ** Not applicable to regulated insurance holding companies and non-operating insurance companies 21
22 CAPITAL FRAMEWORK COMPARISON AVAILABLE CAPITAL Available Capital MCCSR LICAT Valuation Basis: Invested Assets Generally market value Generally market value Valuation Basis: Accounting Assets and Liabilities Valuation Basis: Actuarial Liabilities CALM CALM Goodwill Deducted Deducted Intangible Assets Limited recognition Deducted Deferred Tax Assets (DTAs) Included Limited recognition Debt AOCI Deducted Included Substantial Investments (incl. Joint Ventures) IFRS Deducted IFRS Included Non-life financial subsidiaries Deducted Deducted Encumbered real estate Included Limited recognition 22
23 CAPITAL FRAMEWORK COMPARISON REQUIRED CAPITAL Required Capital MCCSR LICAT Calibration of target requirements Credit Risk Not specified Factor based Conditional tail expectation of CTE(99), calibrated on a 1-year horizon including a terminal provision Factor based where factors vary by rating and duration Interest Rate Risk Factor based Stressed cash flows Other Market Risk Factor based Shocked asset value Mortality, Morbidity, Longevity Risks Factor based Stressed cash flows Lapse Risk Segregated Fund Guarantee Risk Modelled as an additional margin on assumptions Factor based or internal model Stressed cash flows Same as MCCSR but adjusted to align to new supervisory target Expense Risk Not required Stressed cash flows Operational Risk Implicit gross-up Factor based Participating Account Credit Reduced factors Cash flow based; limit on credit Aggregation and Diversification Benefits Implicit aggregation benefit for mortality and morbidity risks Within insurance risks and interest rate risk, and across risks (subject to 20% limit); Participating account separate 23
24 CAPITAL MANAGEMENT SUSTAINABILTY BUSINESS OVERVIEW ASSET PORTFOLIO 24
25 HIGH QUALITY, WELL DIVERSIFIED INVESTMENT PORTFOLIO Investment Properties 5% Equity Securities 3% Mortgages and Loans 31% INVESTED ASSETS Other 1 6% $151.7 billion Cash, cash equivalents and short-term securities 6% Debt Securities 49% BBB, 27% A, 29% DEBT SECURITIES BY RATING BB and Lower, 1% 99% Investment Grade* AAA, 21% AA, 22% COMPETITIVE ADVANTAGES Leading non-public portfolio with significant origination capabilities Strengthened real estate and commercial mortgage capabilities with Bentall Kennedy acquisition in 2015 Deep credit research resulting in strong credit experience * BBB and higher 1 Consists of: Other invested assets (3%), Policy loans (2%), Derivative assets (1%) for both and As of December 31, 25
26 CAPITAL MANAGEMENT SUSTAINABILTY BUSINESS OVERVIEW ASSET PORTFOLIO 26


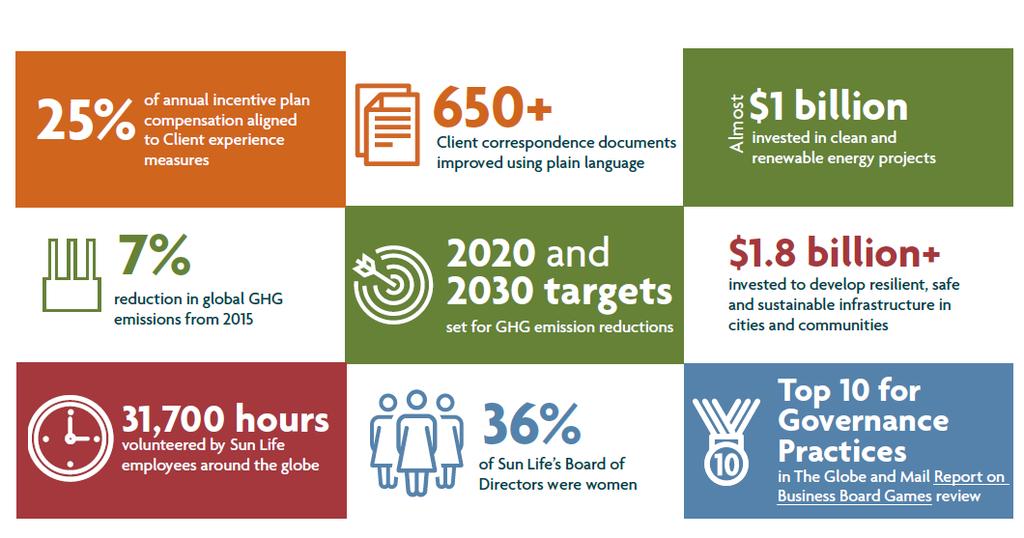


27 SUSTAINABILITY PRINCIPLES AND HIGHLIGHTS SUSTAINABILITY PRINCIPLES SUSTAINABILITY HIGHLIGHTS* * Based on Sun Life s 2017 Sustainability Report 27
28 In this presentation, Sun Life Financial Inc., ( SLF Inc. ) its subsidiaries and, where applicable, its joint ventures and associates are referred to as we, us, our and the Company and Sun Life Assurance Company of Canada is referred to as SLA. Use of Non-IFRS Financial Measures We report certain financial information using non-ifrs financial measures, as we believe that these measure provide information that is useful to investors in understanding our performance and facilitate a comparison of our quarterly and full year results from period to period. These non-ifrs financial measures do not have any standardized meaning and may not be comparable with similar measures used by other companies. For certain non-ifrs financial measures, there are no directly comparable amounts under IFRS. These non- IFRS financial measures should not be viewed as alternatives to measures of financial performance determined in accordance with IFRS. Additional information concerning these non-ifrs financial measures and reconciliations to the closest IFRS measures are available in section M - Non-IFRS Financial Measures of the Earnings News Release. Non-IFRS Financial Measures and reconciliations are also included in our annual and interim MD&A and the Supplementary Financial Information packages that are available on under Investors Financial results & reports. Non-IFRS measures Underlying net income (loss) and financial measures based on underlying net income (loss), including underlying EPS or underlying loss per share, and underlying ROE, are non-ifrs financial measures. Underlying net income (loss) removes from reported net income (loss) the impact of the following items that create volatility in our results under IFRS and when removed assist in explaining our results from period to period: (a) (b) (c) market related impacts that differ from our best estimate assumptions, which include: (i) impact of returns in equity markets, net of hedging, and which also includes the impact of the basis risk inherent in our hedging program, which is the difference between the return on underlying funds of products that provide benefit guarantees and the return on the derivative assets used to hedge those benefit guarantees; (ii) the impact of changes in interest rates in the reporting period and on the value of derivative instruments used in our hedging programs including changes in credit and swap spreads, and any changes to the assumed fixed income reinvestment rates in determining the actuarial liabilities; and (iii) the impact of changes in the fair value of investment properties in the reporting period; assumption changes and management actions, which include: (i) the impact of revisions to the methods and assumptions used in determining our liabilities for insurance contracts and investment contracts and (ii) the impact on insurance contracts and investment contracts of actions taken by management in the current reporting period, referred to as management actions which include, for example, changes in the prices of in-force products, new or revised reinsurance on in-force business, and material changes to investment policies for assets supporting our liabilities; and other adjustments: (i) certain hedges in SLF Canada that do not qualify for hedge accounting - this adjustment enhances the comparability of our net income from period to period, as it reduces volatility to the extent it will be offset over the duration of the hedges; (ii) fair value adjustments on MFS's share-based payment awards that are settled with MFS s own shares and accounted for as liabilities and measured at fair value each reporting period until they are vested, exercised and repurchased - this adjustment enhances the comparability of MFS s results with publicly traded asset managers in the United States; (iii) acquisition, integration and restructuring costs (including impacts related to acquiring and integrating acquisitions); and (iv) other items that are unusual or exceptional in nature. Underlying EPS also excludes the dilutive impact of convertible instruments. All factors discussed in this presentation that impact our underlying net income are also applicable to reported net income. All EPS measures in this presentation refer to fully diluted EPS, unless otherwise stated. As noted above, underlying EPS exclude the dilutive impact of convertible instruments. Other non-ifrs financial measures that we use include reported ROE, adjusted revenue, administrative services only ( ASO ) premium and deposit equivalents, mutual fund assets and sales, managed fund assets and sales, insurance and health sales, premiums and deposits, adjusted premiums and deposits, assets under management ( AUM ), assets under administration, pre-tax net operating profit margin ratio for MFS, measures based on a currency adjusted basis, financial leverage ratio, dividend payout ratio, impact of foreign exchange, real estate market sensitivities, assumption changes and management actions, value of new business, after-tax profit margin for SLF U.S. Group Benefits and effective income tax rate on an underlying net income basis. Reconciliation of Select Net Income Measures 18 Q Common shareholders' reported net income (loss) Impact of certain hedges that do not qualify for hedge accounting (1) (1) 2 Fair value adjustments on share-based payment awards at MFS 28 (10) (34) Acquisition, integration and restructuring (25) (11) (60) U.S. tax reform - - (251) Net equity market impact (143) 5 19 Net interest rate impact (41) 14 (110) Net increases (decrease) in the fair value of real estate Assumption changes and management actions 13 (166) (34) Common shareholders' underlying net income (loss)
29 Forward-Looking Statements From time to time, the Company makes written or oral forward-looking statements within the meaning of certain securities laws, including the safe harbour provisions of the United States Private Securities Litigation Reform Act of 1995 and applicable Canadian securities legislation. Forward-looking statements contained in this presentation include statements (i) relating to our strategies, (ii) relating to our growth initiatives and other business objectives, (iii) relating to the expected impact of the U.S. tax reform on the Company's tax expense, (iv) relating to the merger of Bentall Kennedy and GreenOak and our acquisition of a majority stake in the combined entity, (v) relating to our expected tax range for future years (vi) that are predictive in nature or that depend upon or refer to future events or conditions, and (vii) that include words such as achieve, aim, ambition, anticipate, aspiration, assumption, believe, could, estimate, expect, goal, initiatives, intend, may, objective, outlook, plan, project, seek, should, strategy, strive, target, will, and similar expressions. Forward-looking statements include the information concerning our possible or assumed future results of operations. These statements represent our current expectations, estimates, and projections regarding future events and are not historical facts. Forward-looking statements are not a guarantee of future performance and involve risks and uncertainties that are difficult to predict. Future results and shareholder value may differ materially from those expressed in these forward-looking statements due to, among other factors, the matters set out in our Management s Discussion and Analysis for the period ended December 31, under the headings C - Profitability 4 - U.S. tax reform, C - Profitability Income taxes, E - Financial Strength and H - Risk Management and in SLF Inc. s AIF under the heading Risk Factors and the factors detailed in SLF Inc. s other filings with Canadian and U.S. securities regulators, which are available for review at and respectively. Risk Factors Important risk factors that could cause our assumptions and estimates, and expectations and projections to be inaccurate and our actual results or events to differ materially from those expressed in or implied by the forward-looking statements contained in this presentation, are set out below. The realization of our forward-looking statements, essentially depends on our business performance which, in turn, is subject to many risks. Factors that could cause actual results to differ materially from expectations include, but are not limited to: credit risks - related to issuers of securities held in our investment portfolio, debtors, structured securities, reinsurers, counterparties, other financial institutions and other entities; market risks - related to the performance of equity markets; changes or volatility in interest rates or credit spreads or swap spreads; real estate investments; and fluctuations in foreign currency exchange rates; insurance risks - related to policyholder behaviour; mortality experience, morbidity experience and longevity; product design and pricing; the impact of higher-than-expected future expenses; and the availability, cost and effectiveness of reinsurance; business and strategic risks - related to global economic and political conditions; the design and implementation of business strategies; changes in distribution channels or Client behaviour including risks relating to market conduct by intermediaries and agents; the impact of competition; the performance of our investments and investment portfolios managed for Clients such as segregated and mutual funds; changes in the legal or regulatory environment, including capital requirements and tax laws; the environment, environmental laws and regulations; tax matters, including estimates and judgments used in calculating taxes; our international operations, including our joint ventures; market conditions that affect our capital position or ability to raise capital; downgrades in financial strength or credit ratings; and the impact of mergers, acquisitions and divestitures; operational risks - related to breaches or failure of information system security and privacy, including cyber-attacks; our ability to attract and retain employees; legal, regulatory compliance and market conduct, including the impact of regulatory inquiries and investigations; the execution and integration of mergers, acquisitions, strategic investments and divestitures; our information technology infrastructure; a failure of information systems and Internet-enabled technology; dependence on third-party relationships, including outsourcing arrangements; business continuity; model errors; information management; and liquidity risks the possibility that we will not be able to fund all cash outflow commitments as they fall due. The following risk factors are related to the merger of Bentall Kennedy and GreenOak and our acquisition of a majority stake in the combined entity that could have a material adverse effect on our forward-looking statements: (1) the ability of the parties to complete the transaction; (2) failure of the parties to obtain necessary consents and approvals or to otherwise satisfy the conditions to the completion of the transaction in a timely manner, or at all; (3) our ability to realize the financial and strategic benefits of the transaction; (4) failure to effectively or efficiently reorganize the operations of Bentall Kennedy and GreenOak after the transaction has closed; and (5) the impact of the announcement of the transaction and the dedication of the Company s resources to completing the transaction on Bentall Kennedy and GreenOak. These risks all could have an impact on our business relationships (including with future and prospective employees, Clients, distributors and partners) and could have a material adverse effect on our current and future operations, financial conditions and prospects. The Company does not undertake any obligation to update or revise its forward-looking statements to reflect events or circumstances after the date of this presentation or to reflect the occurrence of unanticipated events, except as required by law. Currency Unless otherwise noted, all amounts are in Canadian dollars. Peer Groups included in TSR chart Canadian Lifecos Manulife Financial Corporation, Great-West Life & Industrial Alliance; U.S. Insurers Hartford Financial Services Group, Lincoln National Corporation, MetLife Inc., Principal Financial Group, Inc., Prudential Financial, Inc., Unum Group & Voya; Global Lifecos All Canadian & U.S. Lifecos,, AXA SA, Prudential PLC, Allianz SE, Aviva PLC, Zurich Insurance Group, Assicurazioni Generali SpA, AIA Group Ltd., China Life Insurance Co. Ltd & Ping An Insurance Group 29
BMO Fixed Income Conference
 BMO Fixed Income Conference Marlene Van den Hoogen Treasurer and Head of Capital Planning June 14, 2018 KEY MESSAGES 1 2 3 4 Four at-scale, competitive pillars with strong growth prospects Culture change
BMO FIXED INCOME INSURANCE CONFERENCE. June 15, 2017 Marlene Van den Hoogen Treasurer and Head of Capital Planning
 BMO FIXED INCOME INSURANCE CONFERENCE June 15, 2017 Marlene Van den Hoogen Treasurer and Head of Capital Planning Forward-Looking Statements From time to time, the Company makes written or oral forward-looking
Financial & Operating results
 Q2 18 Financial & Operating results For the period ended June 30, Sun Life Financial Inc. (unaudited) Forward-looking statements Certain statements in this presentation and certain oral statements made
FINANCIAL & OPERATING RESULTS
 FINANCIAL & OPERATING RESULTS FOR THE PERIOD ENDED September 30, Inc. (unaudited) Life s brighter under the sun Forward-looking statements Certain statements in this presentation and certain oral statements
FINANCIAL & OPERATING RESULTS
 FINANCIAL & OPERATING RESULTS FOR THE PERIOD ENDED JUNE 30, Inc. (unaudited) Life s brighter under the sun Forward-looking statements Certain statements in this presentation and certain oral statements
BUILDING SUSTAINABLE SHAREHOLDER VALUE. Third Quarter, 2017
 BUILDING SUSTAINABLE SHAREHOLDER VALUE Third Quarter, 2017 BUSINESS OVERVIEW SUN LIFE FINANCIAL IN 2017 A $30 billion 1 leading, international financial services provider operating through a balanced and
Financial and operating results
 Financial and operating results For the period ended December 31, Supplementary Financial Information Sun Life Financial Inc. (Unaudited) ` SUPPLEMENTARY FINANCIAL INFORMATION TABLE OF CONTENTS Page Page
Financial and operating results
 Financial and operating results For the period ended December 31, Supplementary Financial Information Sun Life Financial Inc. (Unaudited) ` SUPPLEMENTARY FINANCIAL INFORMATION TABLE OF CONTENTS Page Page
Q SHAREHOLDERS REPORT SUN LIFE FINANCIAL INC. For the period ended March 31, sunlife.com
 Q1 2018 SHAREHOLDERS REPORT SUN LIFE FINANCIAL INC. For the period ended March 31, 2018 sunlife.com CANADIAN RESIDENTS PARTICIPATING IN THE SHARE ACCOUNT Shareholders holding shares in the Canadian Share
Q SHAREHOLDERS REPORT SUN LIFE FINANCIAL INC. For the period ended March 31, sunlife.com
 Q1 2016 SHAREHOLDERS REPORT SUN LIFE FINANCIAL INC. For the period ended March 31, 2016 sunlife.com CANADIAN RESIDENTS PARTICIPATING IN THE SHARE ACCOUNT Shareholders holding shares in the Canadian Share
Q3 16 BUILDING SUSTAINABLE SHAREHOLDER VALUE. Life s brighter under the sun
 16 BUILDING SUSTAINABLE SHAREHOLDER VALUE Life s brighter under the sun BUSINESS OVERVIEW Life s brighter under the sun SUN LIFE FINANCIAL SUN LIFE FINANCIAL IN A $26 billion (1) leading, international
BMO Capital Markets 2018 Fixed Income Financial Services Conference. Gord Menzie, SVP, Corporate Finance & Treasury
 BMO Capital Markets 2018 Fixed Income Financial Services Conference Gord Menzie, SVP, Corporate Finance & Treasury Cautionary notes CAUTIONARY NOTE REGARDING FORWARD-LOOKING INFORMATION This document may
BMO Capital Markets Fixed Income Insurance Conference June Gord Menzie Senior Vice-President, Corporate Finance and Treasury
 1 BMO Capital Markets Fixed Income Insurance Conference June 2014 Gord Menzie Senior Vice-President, Corporate Finance and Treasury BMO Capital Markets Fixed Income Insurance Conference 2014 2 Cautionary
Overview: Background:
 2017 Embedded Value Report for Manulife s Insurance 1 Businesses (Excludes the value of in-force business for Wealth and Asset Management, Bank and Property and Casualty Reinsurance businesses) Dated April
On target. Delivering growth. Manulife Financial Corporation Annual Report
 On target. Delivering growth. Manulife Financial Corporation 2013 Annual Report Annual and Special Meeting May 1st, 2014 Caution regarding forward-looking statements This document contains forward-looking
Quarterly Report to Shareholders. Second Quarter Results
 Quarterly Report to Shareholders Second Quarter Results For the period ended, 2017 E1138(6/17)-6/17 Quarterly Report to Shareholders For cautionary notes regarding forward-looking information and non-ifrs
Quarterly Report to Shareholders. Third Quarter Results
 Quarterly Report to Shareholders Third Quarter Results For the period ended September 30, 2017 E1138(9/17)-9/17 Quarterly Report to Shareholders For cautionary notes regarding forward-looking information
Quarterly Report to Shareholders. First Quarter Results
 Quarterly Report to Shareholders First Quarter Results For the period ended, 2017 E1138(3/17)-3/17 Quarterly Report to Shareholders For cautionary notes regarding forward-looking information and non-ifrs
Delivering on our Commitments Today and Tomorrow. Investor Presentation
 Delivering on our Commitments Today and Tomorrow Investor Presentation CAUTIONARY NOTE REGARDING FORWARD-LOOKING INFORMATION This document may contain forward-looking statements. Forward-looking statements
Stewart McIlwraith, CFA
 Rating Report Sun Life Financial Inc. and Affiliates Ratings Stewart McIlwraith, CFA +1 416 597 7395 smcilwraith@dbrs.com Komal Rizvi, ASA +1 416 597 7403 krizvi@dbrs.com Issuer Obligation Rating Rating
2016 Embedded Value Report for Manulife s Insurance and Other Wealth Businesses (Excludes the value of in-force business for Wealth and Asset
 2016 Embedded Value Report for Manulife s Insurance and Other Wealth Businesses (Excludes the value of in-force business for Wealth and Asset Management, Bank and Property and Casualty Reinsurance businesses)
Manulife Financial Corporation Management s Discussion & Analysis. For the year ended December 31, 2017
 Manulife Financial Corporation Management s Discussion & Analysis For the year ended December 31, 2017 Caution regarding forward-looking statements From time to time, Manulife Financial Corporation ( MFC
Building on our STRENGTHS. Investing in our FUTURE.
 Building on our STRENGTHS. Investing in our FUTURE. Scotiabank Financials Summit Paul Mahon, President & CEO Great-West Lifeco Toronto September 8, 2016 CAUTIONARY NOTE REGARDING FORWARD-LOOKING INFORMATION
Management s Discussion and Analysis. For the year 2017
 Management s Discussion and Analysis For the year MANAGEMENT S DISCUSSION AND ANALYSIS FOR THE PERIOD ENDED DECEMBER 31, DATED: FEBRUARY 8, 2018 This Management s Discussion and Analysis (MD&A) presents
Manulife Financial Corporation Management s Discussion & Analysis. For the year ended December 31, 2016
 Manulife Financial Corporation Management s Discussion & Analysis For the year ended December 31, 2016 Caution Regarding Forward-Looking Statements From time to time, Manulife Financial Corporation ( MFC
Quarterly Information for Analysts and Investors Q1 2018
 Quarterly Information for Analysts and Investors Q1 2018 Cautionary notes CAUTIONARY NOTE REGARDING FORWARD-LOOKING INFORMATION This document may contain forward-looking statements. Forward-looking statements
Quarterly Report to Shareholders. Second Quarter Results
 Quarterly Report to Shareholders Second Quarter Results For the period ended, E1138(6/18)-6/18 Quarterly Report to Shareholders For cautionary notes regarding forward-looking information and non-ifrs financial
Gord Menzie SVP Corporate Finance & Treasury
 Gord Menzie SVP Corporate Finance & Treasury 5 th Annual BMO Capital Markets Fixed Income Insurance Conference Toronto June 16, 2016 Cautionary notes CAUTIONARY NOTE REGARDING FORWARD-LOOKING INFORMATION
Great-West Lifeco reports fourth quarter 2018 net earnings of $710 million; announces 6% dividend increase
 RELEASE TSX:GWO Readers are referred to the cautionary notes regarding Forward-Looking Information and Non-IFRS Financial Measures at the end of this release. All figures are expressed in Canadian dollars,
Manulife Financial Corporation Third Quarter
 Manulife reports 3Q16 net income of $1.1 billion and core earnings of $1 billion, strong growth in Asia, and positive net flows in Wealth and Asset Management TORONTO Manulife Financial Corporation ( MFC
Quarterly Information for Analysts and Investors Q2 2018
 Quarterly Information for Analysts and Investors Q2 2018 Cautionary notes CAUTIONARY NOTE REGARDING FORWARD-LOOKING INFORMATION This document may contain forward-looking statements. Forward-looking statements
2015 Embedded Value Report for Manulife s Insurance and Other Wealth Business (Excludes our Wealth and Asset Management, Bank and Property and
 2015 Embedded Value Report for Manulife s Insurance and Other Wealth Business (Excludes our Wealth and Asset Management, Bank and Property and Casualty Reinsurance businesses) Background: Embedded Value
Management s Discussion and Analysis. For the year 2016
 Management s Discussion and Analysis For the year MANAGEMENT S DISCUSSION AND ANALYSIS FOR THE PERIOD ENDED DECEMBER 31, DATED: FEBRUARY 9, 2017 This Management s Discussion and Analysis (MD&A) presents
TD Bank Group Reports Third Quarter 2018 Results Earnings News Release Three and Nine months ended July 31, 2018
 TD Bank Group Reports Third Quarter 208 Results Earnings News Release Three and Nine months ended July 3, 208 This quarterly Earnings News Release should be read in conjunction with the Bank's unaudited
Q Supplemental Information Package For Analysts and Investors (Unaudited)
") Q4 2014 Supplemental Information Package For Analysts and Investors (Unaudited) CAUTIONARY NOTE REGARDING NON-IFRS FINANCIAL MEASURES This document contains some non-ifrs financial measures. Terms by which
Q4 2014 Supplemental Information Package For Analysts and Investors (Unaudited) CAUTIONARY NOTE REGARDING NON-IFRS FINANCIAL MEASURES This document contains some non-ifrs financial measures. Terms by which
TD Bank Group Reports Fourth Quarter and Fiscal 2018 Results Earnings News Release Three and Twelve months ended October 31, 2018
 TD Bank Group Reports Fourth Quarter and Fiscal 2018 Results Earnings News Release Three and Twelve months ended October 31, 2018 This quarterly earnings news release should be read in conjunction with
Q Supplemental Information Package For Analysts and Investors (Unaudited)
") For Analysts and Investors (Unaudited) CAUTIONARY NOTE REGARDING NON-IFRS FINANCIAL MEASURES This document contains some non-ifrs financial measures. Terms by which non-ifrs financial measures are identified
For Analysts and Investors (Unaudited) CAUTIONARY NOTE REGARDING NON-IFRS FINANCIAL MEASURES This document contains some non-ifrs financial measures. Terms by which non-ifrs financial measures are identified
Great-West Lifeco reports first quarter 2018 net earnings of $731 million, up 24% from the first quarter of 2017
 RELEASE TSX:GWO Readers are referred to the cautionary notes regarding Forward-Looking Information and Non-IFRS Financial Measures at the end of this release. All figures are expressed in Canadian dollars,
MANAGEMENT S DISCUSSION AND ANALYSIS
 T h e G r e a t - W e s t L i f e A s s u r a n c e C o m p a n y M a n a g e m e n t s D i s c u s s i o n a n d A n a l y s i s 2010 Table of Contents 2 Consolidated Operating Results 8 Consolidated
Supplemental Information Package For Analysts and Investors (Unaudited) Q1 2016
 Q1 2016") Supplemental Information Package For Analysts and Investors (Unaudited) Q1 2016 CAUTIONARY NOTE REGARDING NON-IFRS FINANCIAL MEASURES This document contains some non-ifrs financial measures. Terms by which
Supplemental Information Package For Analysts and Investors (Unaudited) Q1 2016 CAUTIONARY NOTE REGARDING NON-IFRS FINANCIAL MEASURES This document contains some non-ifrs financial measures. Terms by which
FINANCIAL INFORMATION PACKAGE
 www.inalco.com FINANCIAL INFORMATION PACKAGE FOR THE FIRST QUARTER OF 2009 As at March 3, 2009 A PARTNER YOU CAN TRUST. SRM-58A(9) (09-04) TABLE OF CONTENTS PAGE HIGHLIGHTS PROFITABILITY 3 SPECIFIED ITEMS
Hema Singh
 Rating Report Sun Life Financial Inc. and Affiliates Ratings Hema Singh +1 212 806 3275 hsingh@dbrs.com Marcos T. Alvarez, MBA +1 416 597 7553 malverez@dbrs.com Issuer Obligation Rating Rating Action Trend
Quarterly Information for Analysts and Investors Q3 2018
 Quarterly Information for Analysts and Investors Q3 2018 Cautionary notes CAUTIONARY NOTE REGARDING FORWARD-LOOKING INFORMATION This document may contain forward-looking information. Forward-looking information
TD Bank Group Reports Fourth Quarter and Fiscal 2017 Results Earnings News Release Three and Twelve months ended October 31, 2017
 TD Bank Group Reports Fourth Quarter and Fiscal 2017 Results Earnings News Release Three and Twelve months ended October 31, 2017 This quarterly earnings news release should be read in conjunction with
LICAT Overview. December 1 st, Jacques Tremblay, FCIA, FSA, MAAA
 LICAT Overview December 1 st, 2017 Jacques Tremblay, FCIA, FSA, MAAA 1. Introduction Choosing a risk based capital framework Will the new LICAT fit the bill for Caribbean regulators? Versions of MCCSR
Statistical Information Package Q3 2017
 Statistical Information Package Q3 2017 TABLE OF CONTENTS Page Page Financial Reporting Structure 1 Asset Information Notes to Readers 2 Asset Composition and Quality Financial Highlights 3 Portfolio Composition
Statistical Information Package Q4 2018
 Statistical Information Package Q4 2018 TABLE OF CONTENTS Page Page Notes to Readers 1 Asset Information Financial Highlights 2 Asset Composition and Quality Portfolio Composition 26 Fixed Income Securities
Statistical Information Package Q2 2017
 Statistical Information Package Q2 2017 TABLE OF CONTENTS Page Page Financial Reporting Structure 1 Asset Information Notes to Readers 2 Asset Composition and Quality Financial Highlights 3 Portfolio Composition
Great-West Lifeco reports fourth quarter 2017 results; announces 6% dividend increase. Sales grow 13% and adjusted net earnings up 5% year-over-year
 RELEASE TSX:GWO Readers are referred to the cautionary notes regarding Forward-Looking Information and Non-IFRS Financial Measures at the end of this release. All figures are expressed in Canadian dollars,
Quarterly Information. For Analysts and Investors Q3 2015
 Quarterly Information For Analysts and Investors Q3 2015 CAUTIONARY NOTE REGARDING FORWARD-LOOKING INFORMATION This document contains some forward-looking statements about the Company, including its business
Statistical Information Package Q4 2016
 Statistical Information Package Q4 2016 TABLE OF CONTENTS Page Page Financial Reporting Structure 1 Asset Information Notes to Readers 2 Asset Composition and Quality Financial Highlights 3 Portfolio Composition
TD Bank Group Reports First Quarter 2018 Results Report to Shareholders Three months ended January 31, 2018
 TD Bank Group Reports First Quarter 208 Results Report to Shareholders Three months ended January 3, 208 The financial information in this document is reported in Canadian dollars, and is based on the
SUN LIFE INVESTMENT MANAGEMENT INVESTOR DAY. OCTOBER 20th, 2016
 SUN LIFE INVESTMENT MANAGEMENT INVESTOR DAY OCTOBER 20th, 2016 Forward-looking statements Certain statements in the presentations prepared for the Sun Life Financial Investor Day 2016 held on October 20,
TD Bank Group Reports First Quarter 2018 Results Earnings News Release Three months ended January 31, 2018
 TD Bank Group Reports First Quarter 208 Results Earnings News Release Three months ended January 3, 208 This quarterly earnings news release should be read in conjunction with the Bank's unaudited first
Statistical Information Package Q3 2016
 Statistical Information Package Q3 2016 TABLE OF CONTENTS Page Page Financial Reporting Structure 1 Asset Information Notes to Readers 2 Asset Composition and Quality Financial Highlights 3 Portfolio Composition
Statistical Information Package Q1 2017
 Statistical Information Package Q1 2017 TABLE OF CONTENTS Page Page Financial Reporting Structure 1 Asset Information Notes to Readers 2 Asset Composition and Quality Financial Highlights 3 Portfolio Composition
Statistical Information Package Q2 2018
 Statistical Information Package Q2 2018 TABLE OF CONTENTS Page Page Notes to Readers 1 Asset Information Financial Highlights 2 Asset Composition and Quality Portfolio Composition 26 Fixed Income Securities
PRUDENTIAL FINANCIAL, INC.
 PRUDENTIAL FINANCIAL, INC. 2017 FINANCIAL OUTLOOK CONFERENCE CALL PRESENTATION DECEMBER 15, 2016 BUILDING PRUDENTIAL S INVESTOR VALUE PROPOSITION Achieve Key Financial Objectives Maintain differentiated
Statistical Information Package Updated Q4 2017
 Statistical Information Package Updated Q4 2017 Based on new Reporting Segments effective January 1, 2018 * * The previously announced organization changes made to our Wealth and Asset Management businesses
TD Bank Group Reports First Quarter 2019 Results
 TD Bank Group Reports First Quarter 2019 Results Earnings News Release Three months ended January 31, 2019 This quarterly Earnings News Release should be read in conjunction with the Bank's unaudited first
Third Quarter 2016 Financial & Operating Results. November 10, 2016
 Third Quarter 2016 Financial & Operating Results November 10, 2016 Caution regarding forward-looking statements From time to time, MFC makes written and/or oral forward-looking statements, including in
Supplemental Information Package For Analysts and Investors (Unaudited) Q3 2017
 Q3 2017") Supplemental Information Package For Analysts and Investors (Unaudited) Q3 2017 Delivering on our Commitments Today and Tomorrow Cautionary Note regarding Non-IFRS Financial Measures This document contains
Supplemental Information Package For Analysts and Investors (Unaudited) Q3 2017 Delivering on our Commitments Today and Tomorrow Cautionary Note regarding Non-IFRS Financial Measures This document contains
Credit Opinion: Sun Life Financial, Inc.
 Credit Opinion: Sun Life Financial, Inc. Global Credit Research - 23 Jul 2015 Toronto, Ontario, Canada Ratings Category Moody's Rating Rating Outlook STA Pref. Stock Baa2 (hyb) Sun Life Assurance Company
PRUDENTIAL FINANCIAL, INC.
 PRUDENTIAL FINANCIAL, INC. 2019 FINANCIAL OUTLOOK CONFERENCE CALL PRESENTATION DECEMBER 6, 2018 UNLOCKING GROWTH BY BRINGING FINANCIAL OPPORTUNITY TO MORE CUSTOMERS Differentiated Business Mix Leading
BMO Financial Group Reports Fourth Quarter and Fiscal 2018 Results
 BMO Financial Group Reports Fourth Quarter and Fiscal 2018 Results Fourth Quarter 2018 Earnings Release Financial Results Highlights Fourth Quarter 2018 Compared with Fourth Quarter 2017: Net income of
TD Bank Group Reports Third Quarter 2017 Results Report to Shareholders Three and Nine months ended July 31, 2017
 TD Bank Group Reports Third Quarter 2017 Results Report to Shareholders Three and Nine months ended July 31, 2017 The financial information in this document is reported in Canadian dollars, and is based
DBS AND MANULIFE FORM 15-YEAR REGIONAL LIFE BANCASSURANCE PARTNERSHIP *** SINGAPORE/ TORONTO, 8 April 2015 DBS Bank Ltd and Manulife Financial Asia
 News Release DBS AND MANULIFE FORM 15-YEAR REGIONAL LIFE BANCASSURANCE PARTNERSHIP *** SINGAPORE/ TORONTO, 8 April 2015 DBS Bank Ltd and Financial Asia Limited are pleased to announce that they have entered
Manulife Investor Day 2018 A bold and exciting future
 C$ unless otherwise stated TSX/NYSE/PSE: MFC SEHK: 945 For Immediate Release June 27, 2018 Manulife Investor Day 2018 A bold and exciting future TORONTO Manulife Financial Corporation ( Manulife or the
Quarterly Information. For Analysts and Investors Q2 2015
 Quarterly Information For Analysts and Investors Q2 2015 CAUTIONARY NOTE REGARDING FORWARD-LOOKING INFORMATION This document contains some forward-looking statements about the Company, including its business
Statistical Information Package Q1 2018
 Statistical Information Package Q1 2018 TABLE OF CONTENTS Page Page Notes to Readers 1 Asset Information Financial Highlights 2 Asset Composition and Quality Portfolio Composition 26 Fixed Income Securities
Manulife Financial Corporation. First Quarter Report to Shareholders. Three months ended. March 31, manulife.com johnhancock.
 Manulife Financial Corporation First Quarter Report to Shareholders Three months ended March 31, 2018 manulife.com johnhancock.com Manulife reports 1Q18 net income of $1.4 billion, core earnings of $1.3
Session 032 PD - Life Insurance Capital Framework in Canada. Moderator: Benjamin L. Marshall, FSA, CERA, FCIA, MAAA
 Session 032 PD - Life Insurance Capital Framework in Canada Moderator: Benjamin L. Marshall, FSA, CERA, FCIA, MAAA Presenters: Henri Boudreau Lisa Marie Peterson, FSA, FCIA SOA Antitrust Compliance Guidelines
PRUDENTIAL FINANCIAL, INC.
 PRUDENTIAL FINANCIAL, INC. 2016 FINANCIAL OUTLOOK CONFERENCE CALL PRESENTATION DECEMBER 10, 2015 BUILDING PRUDENTIAL S INVESTOR VALUE PROPOSITION Achieve Key Financial Objectives Maintain 13% 14% ROE over
C$ unless otherwise stated TSX/NYSE/PSE: MFC SEHK: 945
 C$ unless otherwise stated TSX/NYSE/PSE: MFC SEHK: 945 For Immediate Release February 7, 2018 The quarterly earnings news release for Manulife Financial Corporation ( Manulife or the Company ) should be
Session 31PD: Life Insurance Capital Framework in Canada. Moderator: Presenters: Ritchie Hok FSA Lisa Marie Peterson FSA,FCIA
 Session 31PD: Life Insurance Capital Framework in Canada Moderator: Presenters: Ritchie Hok FSA Lisa Marie Peterson FSA,FCIA SOA Antitrust Disclaimer SOA Presentation Disclaimer A New Chapter in Capital
FOURTH QUARTER 2017 EARNINGS RELEASE
 FOURTH QUARTER 2017 EARNINGS RELEASE ROYAL BANK OF CANADA REPORTS FOURTH QUARTER AND 2017 RESULTS All amounts are in Canadian dollars and are based on our audited Annual and unaudited Interim Consolidated
First Canadian Insurance Corporation 30/09/2018 Canadian/Foreign Insurer/Society CONSOLIDATED FINANCIAL STATEMENTS ASSETS ($'000)
") 20.010 Canadian/Foreign Insurer/Society ASSETS Opening Prior Year Restated Total Vested in Total Vested in Total Trust Trust Vested in Trust (01) (02) (03) (04) (05) (06) Cash and Cash Equivalents 010
20.010 Canadian/Foreign Insurer/Society ASSETS Opening Prior Year Restated Total Vested in Total Vested in Total Trust Trust Vested in Trust (01) (02) (03) (04) (05) (06) Cash and Cash Equivalents 010
Q QUARTERLY INFORMATION. For Analysts and Investors
 Q3 2013 QUARTERLY INFORMATION For Analysts and Investors CAUTIONARY NOTE REGARDING FORWARD-LOOKING INFORMATION This document contains some forward-looking statements about the Company, including its business
Fourth Quarter 2017 Financial & Operating Results. February 8, 2018
 Fourth Quarter Financial & Operating Results February 8, 2018 Caution regarding forward-looking statements From time to time, Manulife Financial Corporation ( MFC ) makes written and/or oral forward-looking
Supplemental Financial Information
 Supplemental Financial Information For the First Quarter Ended January, 08 For further information, please contact: Investor Relations Department Gillian Manning 46-08-900 www.td.com/investor Basis of
Financial Information Package
 Financial Information Package For the First Quarter of 2013 As at March 31, 2013 SRM158A-2(13-03) A partner you can trust. GENERAL INFORMATION Industrial Alliance Insurance and Financial Services Inc.
Annual Meetings Delivering on our Commitments Today and Tomorrow
 Annual Meetings 2017 Delivering on our Commitments Today and Tomorrow CAUTIONARY NOTE REGARDING FORWARD-LOOKING INFORMATION In the course of today s meetings, representatives of the Companies may, in their
Fourth Quarter and Full Year 2016 Financial & Operating Results. February 9, 2017
 Fourth Quarter and Full Year 2016 Financial & Operating Results February 9, 2017 Caution regarding forward-looking statements From time to time, MFC makes written and/or oral forward-looking statements,
Manulife reports 1Q18 net income of $1.4 billion, core earnings of $1.3 billion and a LICAT capital ratio of 129%
 C$ unless otherwise stated TSX/NYSE/PSE: MFC SEHK: 945 For Immediate Release May 2, 2018 The quarterly earnings news release for Manulife Financial Corporation ( Manulife or the Company ) should be read
2015 Financialfacts. London Life participating life insurance ACCOUNTABILITY STRENGTH PERFORMANCE
 2015 Financialfacts London Life participating life insurance ACCOUNTABILITY STRENGTH PERFORMANCE This guide provides key financial facts about the management, strength and performance of the London Life
Prudential plc 2007 Full Year Results. 14 March 2008
 Prudential plc 2007 Full Year Results 14 March 2008 This statement may contain certain forward-looking statements with respect to certain of Prudential's plans and its current goals and expectations relating
Financialfacts. London Life participating life insurance. Accountability Strength Performance
 2013 Financialfacts London Life participating life insurance Accountability Strength Performance This guide provides key financial facts about the management, strength and performance of the London Life
Manulife reports 2Q18 net income of $1.3 billion, and core earnings of $1.4 billion with double-digit growth across all operating segments
 C$ unless otherwise stated TSX/NYSE/PSE: MFC SEHK: 945 For Immediate Release August 8, 2018 The quarterly earnings news release for Manulife Financial Corporation ( Manulife or the Company ) should be
Principal Financial Group
 Credit Suisse Financial Services Forum February 2015 Principal Financial Group Terry Lillis Executive Vice President & Chief Financial Officer Use of Non GAAP Financial Measures A non GAAP financial measure
Second Quarter Financial & Operating Results. August 9, 2018
 Second Quarter 2018 Financial & Operating Results August 9, 2018 Caution regarding forward-looking statements From time to time, Manulife makes written and/or oral forward-looking statements, including
European Embedded Value (EEV) basis results
 basis results") European Embedded Value (EEV) basis results Page Post-tax operating profit based on longer-term investment returns 1 Post-tax summarised consolidated income statement 2 Movement in shareholders equity
European Embedded Value (EEV) basis results Page Post-tax operating profit based on longer-term investment returns 1 Post-tax summarised consolidated income statement 2 Movement in shareholders equity
2016 SUN LIFE FINANCIAL INC. ANNUAL REPORT. Life s brighter under the sun SU N LI F E FI NAN CIAL I N C. AN N UAL R E PO RT 201 6
 2016 SUN LIFE FINANCIAL INC. ANNUAL REPORT Life s brighter under the sun SU N LI F E FI NAN CIAL I N C. AN N UAL R E PO RT 201 6 M17-009_Annual_Report_English_Covers.indd 3 2017-03-06 4:29 PM TABLE OF
Framework for a New Standard Approach to Setting Capital Requirements. Joint Committee of OSFI, AMF, and Assuris
 Framework for a New Standard Approach to Setting Capital Requirements Joint Committee of OSFI, AMF, and Assuris Table of Contents Background... 3 Minimum Continuing Capital and Surplus Requirements (MCCSR)...
Fourth Quarter 2017 Earnings Release
 Fourth Quarter 2017 Earnings Release BMO Financial Group Reports Net Income of $5.35 Billion, up 16%, for Fiscal 2017 Financial Results Highlights: Fourth Quarter 2017 Compared with Fourth Quarter 2016:
Focus on fee business driving growth and performance
 Focus on fee business driving growth and performance This presentation may contain certain forward-looking statements with respect to certain of Standard Life's plans and its current goals and expectations
Sun Life Financial Inc. And Its Operating Subsidiaries
 Sun Life Financial Inc. And Its Operating Subsidiaries Primary Credit Analyst: Donald H Chu, CFA, Toronto (1) 416-507-2506; donald.chu@standardandpoors.com Secondary Contacts: Peggy H Poon, CFA, New York
Voya Financial. Positioned for Leadership Sale of CBVA & Annuities. December 21, 2017
 Voya Financial Positioned for Leadership Sale of CBVA & Annuities December 2, 207 Forward-Looking and Other Cautionary Statements This presentation and the remarks made orally contain forward-looking statements.
TD Bank Group Reports Second Quarter 2015 Results
 2 nd Quarter 2015 Earnings News Release Three and Six months ended April 30, 2015 TD Bank Group Reports Second Quarter 2015 Results This quarterly earnings news release should be read in conjunction with
Statistical Information Package Q2 2015
 Statistical Information Package Q 05 TABLE OF CONTENTS Page Page Financial Reporting Structure Asset Information Notes to Readers Asset Composition and Quality Financial Highlights 3 Portfolio Composition
Standardized Approach for Calculating the Solvency Buffer for Market Risk. Joint Committee of OSFI, AMF, and Assuris.
 Standardized Approach for Calculating the Solvency Buffer for Market Risk Joint Committee of OSFI, AMF, and Assuris November 2008 DRAFT FOR COMMENT TABLE OF CONTENTS Introduction...3 Approach to Market