FLEXIBLE MODELING OF MULTIVARIATE RISKS IN PRICING MARGIN PROTECTION INSURANCE: MODELING PORTFOLIO RISKS WITH MIXTURES OF MIXTURES
|
|
|
- Giles Scott
- 5 years ago
- Views:
Transcription
1 FLEXIBLE MODELING OF MULTIVARIATE RISKS IN PRICING MARGIN PROTECTION INSURANCE: MODELING PORTFOLIO RISKS WITH MIXTURES OF MIXTURES SEYYED ALI ZEYTOON NEJAD MOOSAVIAN North Carolina State University Selected Paper prepared for presentation at the 2017 Agricultural & Applied Economics Association Annual Meeting, Chicago, Illinois, July 30-August 1 Copyright 2017 by Seyyed Ali Zeytoon Nejad Moosavian. All rights reserved. Readers may make verbatim copies of this document for non-commercial purposes by any means, provided that this copyright notice appears on all such copies. 1
2 FLEXIBLE MODELING OF MULTIVARIATE RISKS IN PRICING MARGIN PROTECTION INSURANCE: MODELING PORTFOLIO RISKS WITH MIXTURES OF MIXTURES Abstract: SEYYED ALI ZEYTOON NEJAD MOOSAVIAN North Carolina State University Margin Protection Programs (MPPs) are relatively new insurance plans that have been introduced and made available by the USDA s Risk Management Agency (RMA). These programs were initially implemented for livestock and dairy producers, and were subsequently extended to cover other agricultural products such as corn, rice, soybeans, and wheat. The attractiveness of these risk management instruments lies in the fact that the financial stability of agricultural production and farming operations is more dependent on margins than solely revenues. This paper examines the structure and rating of margin protection insurance policies. In particular, the paper considers a broad class of high-dimensional copula models that parameterize the dependence among multivariate sources of risks. To efficiently and accurately determine actuarially fair policy premiums, it is necessary to first model the joint distribution function of input and output prices. This task can be effectively carried out using copula methods. A variety of copula methods, including Archimedean Copulas (ACs), Mixture Copulas (MCs), and Vine Copulas (VCs) are used to analyze the dependence structure between revenues and input costs. In terms of methodology, flexible mixtures of parametric distributions are applied to characterize marginal densities, and likewise flexible mixtures of alternative copulas are used to model dependence. This paper also argues that the rating methodology that accounts for irregular and anomalous features of dependence such as asymmetry, non-linearity, nonellipticity, and tail dependence between input prices and output prices can result in more accurate premiums, and therefore can increase the hedging effectiveness of the MPPs. Goodness-of-fit tests generally reject conventional approaches based upon log-normally distributed marginals and Gaussian copulas. In this paper, several reasons are identified to explain why the common methods being currently employed to determine policy premiums might not be adequate, realistic, or sufficiently flexible to take into account the multivariate aspects of risks involved in farming operations. To this end, the present paper investigates the underlying assumptions based on which the MPP policy premiums are determined. It is argued that assumptions made in pricing risks may induce important distortions in the production and marketing decisions of producers. It is also noted that precise measurement of the marginal densities for individual random variables is essential for accurately pricing a portfolio of multivariate risks. Finally, implications for the ever-expanding offerings of publicly-subsidized agricultural insurance mechanisms are offered. Key Words: Insurance, Mixture Distribution, Vine Copulas, Margin Protection Programs, Livestock Gross Margin, Nonlinear Time Series Models, Dependence Modeling, Tail Dependence, Output Prices, and Input Prices JEL Classification: C58, G13, G22, Q11, Q12, Q13, Q18 Introduction: Farming is a financially risky enterprise. Most agricultural production is subject to unexpected changes of weather as well as shifts in supply and demand for outputs and inputs. These two sets of factors often lead to uncertain quantities of inputs and yields as well as fluctuating input and output market prices. The U.S. federal crop insurance program provides U.S. farmers with a wide variety of risk management tools to address potential losses due to the above-mentioned reasons. Margin Protection Programs are new insurance plans that have relatively recently been introduced and made available by the USDA s Risk Management Agency (RMA). These plans were initially implemented for livestock and dairy producers, and were subsequently extended to cover other agricultural products such as corn, rice, soybeans, and wheat. Typically, MP programs provide farmers with coverage against unanticipated, financially adverse declines in their margins (i.e., expected revenues minus expected input costs). The attractiveness of this risk management instrument lies in the fact that the financial stability of farming operations is more dependent on operating margins than simply revenues, which neglects production costs, which is 2
3 the case for Revenue Protection plans. Despite this, a MP plan can be purchased separately from, or in conjunction with, other available plans of insurance such as Yield Protection (YP) and Revenue Protection (RP). This paper examines the structure and rating of margin protection insurance policies. More specifically, the paper considers a broad class of high-dimensional copula models that parameterize the dependence among multivariate sources of risks. Furthermore, several reasons are identified to explain why the common methods currently employed to determine policy premiums might not be adequate, realistic, or sufficiently flexible to take into account the multivariate aspects of risks involved in the applicable farming operations. A variety of copula methods, including Archimedean Copulas (ACs), Mixture Copulas (MCs), and Vine Copulas (VCs) are used to analyze the dependence structure between revenues and input costs. The federal outlays of the U.S. federal crop insurance program have surpassed those of the commodity support programs. Thus, the U.S. federal crop insurance program is now the predominant mechanism of support to U.S. agricultural producers as well as the main farm safety net and subsidy program. In order for the U.S. federal crop insurance program to be able to function financially well, there needs to be empirical analysis for determining important policy-related parameters such as premium rates, expected yields, expected prices, optimal levels of coverage, and even optimal forms of insurance plans. The administration of the USDA s Risk Management Agency that manages the U.S. crop insurance program has always reached out to empirical analysts in academia and industry to aid in the development of new analytical techniques that can improve the accuracy and precision of insurance programs, which in turn will lead to reduce taxpayer costs. According to Goodwin (2015), one of the finest examples of the engagement of government and academic researchers is perhaps the federal crop insurance program. The U.S. crop insurance program was initially established in 1938, providing only one form of insurance (a yield protection insurance called Multiple Peril Crop Insurance), and has subsequently continued to expand and to take on new and diverse forms of insurance coverage. Revenue Protection programs were introduced to the market in 1997 initially for major crops. A revenue-based protection policy, in effect, combines together the production guarantee component of crop insurance and a price guarantee to create a target revenue guarantee (Shields, 2015). Starting in 2002, a new risk management tool, called Livestock Gross Margin (LGM), was made available to cattle feeders. LGM for cattle is in fact a livestock insurance product that protects a gross margin rather than a selling price, which is the case for Livestock Risk Protection (LRP). In 2008, the LGM program for dairy producers was made available for sale. In 2014, another similar program called Margin Protection Program for dairy producers (MPP-Dairy) was introduced. 1 Starting in the 2016 crop year, the USDA s RMA made available a new crop insurance coverage option that provides producers with coverage against an unexpected decrease in their operating margin. As described above, the U.S. crop insurance program has always continued to expand and to take on new and diverse forms of insurance coverage. These developments and changes have brought about a variety of new empirical challenges to model the existing insurance plans as well as a necessity for modeling new insurance plans. The general, historical trend of the introduction of new types of insurance programs made available by RMA indicates that its initial programs dealt mostly with one random variable (e.g., yield in Actual Production History (APH) program); however afterwards, the insurance program types have tended to include two random variables (e.g., revenue as the product of yield and sale price for RP program), and subsequently the more recent insurance programs have primarily involved more than two random variables (e.g., three random variables for most LGM programs, or up to five random variables for MPP for grains). Reviewing the historical trend of the introduction of new crop insurance types implies that there has been an emergence of desire for portfolio risks management, leading to the introduction of different forms of margin protection insurance programs. 1. The LGM-Dairy and MPP-Dairy differ in terms of four aspects: flexibility, subsidies, risk protection, and availability, whose discussion is beyond the scope of the present paper. Bozic (2014) provides a comprehensive, intuitive explanation of these differences. 3
4 MPP 2 is a variant of insurance where a margin guarantee is insured, and decreases in revenue (which, depending on the specified type of the insurance, could be due to decreases in yields and/or output prices) and/or increases in costs (which can only be due to increases in specific input prices) can trigger an indemnity. In particular, margin is determined by subtracting revenue from total costs. Total revenue is indeed the product of two dependent random variables - yield and output price. Total cost is the product of certain allowed levels of a number of inputs and their corresponding prices. Thus, there are several random variables involved in the process of computing a margin. Developing a clear understanding of the dependence structure among multiple random variables involved in an insurance plan is a crucial prerequisite to accurately analyze how financially healthy the insurance plan of interest is likely to function and how the insurance premium should be priced. To this end, flexible modeling of multivariate sources of risks through copula models would shed light on how dependently the multivariate sources of the risks could behave. Indeed, this task can be done through two separate steps: (1) estimating marginal distributions of the random variables, and (2) modeling the dependence among the random variables. Afterwards, one can estimate the joint distribution of the random variables being studied. The present paper is essentially concerned with flexible modeling of multivariate risks in pricing MPP insurance plans, and is an attempt to model portfolio risks with mixtures of mixtures, which employs flexible mixtures of parametric distributions to characterize marginal densities, and applies flexible mixtures of alternative copulas to model dependence. As an empirical application, the joint behavior of random variables involved in the LGM insurance programs are studied, and in particular, the multivariate distribution of the random variables involved with the LGM-Cattle insurance plan are modeled using copula-based methods. The primary data to be used is daily spot prices of inputs and output from 2004 to 2015 from Commodity Research Bureau (CRB). The fundamental idea here is that as long as the assumption that random variables are multivariate normally distributed holds, Pearson s linear-association view of dependence would work properly. However, many important aspects of dependence are not fully captured in the conventional thinking of dependence (i.e., solely linear association). It is evident that independence implies a lack of correlation, but the converse is not true since the notion of correlation takes only linear relationships into account. Whilst straightforward and convenient, the assumption of multivariate normality (which implicitly assumes normal marginals as well as the Gaussian copula and no tail dependence consequently) is in some cases quite unrealistic and may lead to a rating method that produces actuarially unfair premium rates. As a result, in this paper, the effect of such departures from multivariate normality on Margin Protection (MP) insurance premiums will be examined. Assumptions and premises made about the nature of dependencies among different sources of risk, such as yield quantity, output price, and inputs prices, in the empirical modeling of an insurance policy could have significant implications for the resulting values of the parameters and operation of the entire program. In other words, making an invalid assumption about dependence among random variables could simply lead to misleading implications for the parameters estimated. As a result, the present paper first calls into question the current rating method of MP insurance program and its underlying questionable assumptions, and then proposes a new rating method, based on empirical copula models, by which the current rating method should be replaced. To efficiently and accurately determine actuarially fair policy premiums, 3 it is necessary to first model the joint distribution function of input and output prices. This task can be effectively undertaken using copula methods. 2. In this paper, the term Margin Protection Program (MPP) is used as an umbrella term that encompasses any insurance programs providing a margin-based policy. Typically, such programs guarantee certain components (quantities and/or prices) of both output revenues as well as input costs. Examples of such insurance programs include LGM-Cattle, LGM-Swine, LGM-Dairy, MPP-Dairy, MPP-Grains, etc. 3. Although farmers do not pay actuarially fair premium rates, the actuarial soundness of the insurance premiums of the U.S. federal crop program is still of crucial importance. This is primarily because actuarially fair premiums will guarantee the financial health of the program, leaving less necessity for federal ad hoc assistance, which in turn would increase costs to taxpayers. In fact, this is the reason why the current law requires that RMA strive for actuarial soundness for the entire federal crop insurance program (that is, indemnities should equal total premiums, including premium subsidies), as Shields (2015) mentions. One reasonable, fair way to achieve the actuarial soundness for the entire program is to adhere to the actuarially fair premiums for each of the individual insurance programs. As a result, RMA must set premium rates to only cover expected losses and a reasonable reserve. The agency is also required to conduct periodic reviews of its rate-setting methodology, which sets premium rates according to the average historical rate of loss (e.g., if policies pay out 10% of their value, on average, then the rate should be 10%) as 4
5 Copula models allow for capturing interesting features (e.g., nonlinearity in dependence and tail dependence) existing in the dependence among variables being studied. Tail dependence for a pair of random variables describes their dependence structure concentrated in the tail of multivariate distributions. This paper will also demonstrate that the rating methodology that accounts for tail dependence between input prices and output prices can result in more accurate premiums in the context of U.S. agricultural markets, and therefore can increase the hedging effectiveness 4 of MP insurance plan in the mentioned markets. Copula modeling not only relaxes the two unrealistic assumptions of linear dependency and no-tail-dependence among random variables of interest (for our case here, prices and quantities) in some circumstances, 5 it also allows us to take advantage of any types of distribution for modeling marginals, which in turn improves the predictability power of a multivariate distribution as a whole. Without copulas, we are usually limited to using normal or student s t distributions, which may or may not explain well the relative frequency of the observations at hand. However, copulas will help us have a freer choice of distributions for marginals towards achieving better fits for the marginals of interest. These two advantages will help us attain better fits, more predictive and more realistic models, and as consequence, actuarially fairer premiums. In terms of methodology, flexible mixtures of parametric distributions to characterize marginal densities and likewise flexible mixtures of alternative copulas are applied to model dependence. Goodness-of-fit tests generally reject conventional approaches based upon log-normally distributed marginals and Gaussian copulas. Implications for the ever-expanding offerings of publicly-subsidized agricultural insurance mechanisms are offered. Finally, it is demonstrated that assumptions made in pricing risks may induce important distortions in the production and marketing decisions of producers. More formally, the objectives of the study are to model the MP insurance program and illustrate how the MP insurance premiums should be priced. Accordingly, the research questions that the present paper is to answer are as follows: How is the structure of the MP insurance? How should the MP insurance premium be priced? What are the implicit assumptions underlying the current rating method of MP insurance? Are these assumptions valid or violated? What are the economic consequences of the violation of these assumptions? The reason why the US Federal Crop Insurance program and in particular the above-mentioned research questions merit attention is multifold. First of all, this paper attends to the U.S. federal crop insurance program because this program is currently the primary mechanism of support to agricultural producers in the United States, and that the total liability covered by the program is so large that frequently exceeds 100 billion dollars. Thus, the precision and accuracy of the rating methods of insurance premium rates are of crucial importance. In addition, the U.S. federal government costs for crop insurance have increased substantially during the last decade. After ranging between $2.1 billion and $3.9 billion during , costs rose to $7 billion in 2009, and to $14.1 billion in In the 2014 farm bill (P.L ), the U.S. Congress expanded the federal crop insurance program by authorizing additional policies and requiring examination of potential new insurance products (Shields, 2015). Thus, the second reason why the present paper examines the structure and rating of the MP insurance programs is partly because these insurance programs are a group of these relatively newly introduced insurance programs, and since then, different variants of margin-based programs have been being introduced to the crop insurance market. Additionally, much of the attention to the U.S. federal crop insurance program has thus far been and appears to continue to be paid to the RP insurance program (in part because of its large share in the entire program), and the Shields (2015) reports. It should also be noted that any market distortion in the crop insurance market and any departure from actuarially fair premium rates would result in loss of market efficiency and welfare loss for the economy as a whole (i.e., a deadweight loss). These are in fact the reasons why crop insurance premiums should be rated actuarially fairly. 4. Hedging effectiveness can be defined as the extent to which a hedge transaction or contract results in offsetting changes in fair outcome, value, or cash flow that the transaction was intended to provide. When one estimates the dependence between revenue and costs more accurately, then the insurance plan that provides this service and hedges against the risk of ending up with an unacceptable margin will create a higher level of hedging effectiveness. 5. Section 3 will introduce additional interesting features (such as asymmetry in dependence and non-ellipticity in dependence) that can also be captured using copula models. However, the assumption of multivariate normality cannot account for such interesting features, which in many applications are realistic. 5
6 MP program has not received much attention until relatively recently. Furthermore, this type of insurance is financially attractive since the financial stability of farming operations depends more on operating margins than solely revenues. Moreover, the MP insurance program is theoretically interesting because of the fact that there are comparably more random variables involved in the modeling of this insurance, compared to those of RP insurance. In terms of the novelty of the ideas and methods being addressed and used in this paper, as far as the author is aware, it is the first time that a study models portfolio risks using mixtures of mixtures in the context of crop insurance, although it can also be applied for any sort of portfolio analyses. Additionally, although there have recently been very few studies, perhaps one or two, in the area of MP for the dairy market 6, the empirical application of the present paper is the first one that studies the MP insurance program in the context of the U.S. cattle production market (the LGM-Cattle program). Findings of this study are expected to contribute to the existing knowledge and sizable, growing literature on the U.S. federal crop insurance program, and more specifically on the limited literature on the newly-introduced MP insurance programs. The findings of the paper will also aid in the shaping of agricultural economic policies and interventions to enhance the status of agricultural production in the U.S. economy. The paper is organized as follows. The next section is devoted to the introduction of MP insurance programs, and explains how they work. It also examines the current method of rating premiums in some of these programs, investigates the implicit assumptions underlying those methods, and scrutinizes the validity of the mentioned assumptions for the case of the U.S. cattle market. Section three discusses copula and copula modeling in greater details. Section four reviews the existing literature on copula modeling and its application in insurance and more specifically in MP insurance programs. In section five, empirical applications and some quantitative investigations will be presented, indicating why copula-based modeling is needed to model MP insurance. Naturally, a conclusion will follow bringing the main points together and discussing plans for future research. Lastly, the paper will end with appendices to explain the procedures and methods in greater details. 2. Margin Protection Programs: Margin Protection Programs 7 are relatively new insurance plans that have been introduced and made available by the USDA s Risk Management Agency (RMA). Margin-based insurance programs were initially implemented for cattle, swine, and dairy producers, and were subsequently extended to cover other agricultural products such as corn, rice, soybeans, and wheat. Two notable examples of margin protection insurance plans are Livestock Gross Margin for Cattle (LGM-Cattle), which provides producers with coverage against unanticipated, financially adverse declines in their gross margin (i.e., market value of livestock minus feeder cattle and feed costs on cattle), and Margin Protection Program for Grains (MPP-Grains), which provides farmers with coverage against unanticipated, financially adverse declines in their area-based operating margins (i.e., expected area revenues minus expected area input costs). The attractiveness of these types of risk management instruments lies in the fact that the financial stability of agricultural production and farming operations is more dependent on margins than solely revenues, which neglect to consider production costs, which is the case for Livestock Risk Protection (LRP) plans and Revenue Protection (RP) plans. Typically, a MPP is an insurance plan that uses estimates of average revenue and input costs to establish the amount of coverage and indemnity payments. As such, a generic form of expected margin is as follows: 6. The program is called Livestock Gross Margin insurance plan for dairy producers (for short, LGM-Dairy), which is separate from Livestock Gross Margin insurance plan available for cattle feeders (for short, LGM-Cattle). 7. Once again, it is important to remind that, in this paper, the term Margin Protection Program (MPP) is used as an umbrella term that encompasses any insurance programs providing a margin-based policy. Typically, such programs guarantee select components (quantities and/or prices) of both output revenues as well as input costs. Examples include LGM-Cattle, LGM-Swine, LGM-Dairy, MPP-Dairy, MPP-Grains, etc. 6
7 Expected Margin = Expected Revenue - Expected Costs EM = ER - EC EM ( P Projected y Y ) ( P Pr ojected x X Allowed ) (1) ER EC where P Y, Y, P X, X denote output price, yield, a vector of input prices, and a vector of inputs, respectively. This equation represents a generic mathematical form for expected margin. Depending on the insurance plan designed by the insurer, Y could be identified as a random variable, meaning that a certain level of production quantity is guaranteed by the insurer (as it is the case in MPP-Grains), or it could be treated as a pre-determinant variable, meaning that an allowed level of it is considered in computing the margin, no matter what the realized level turns out to be (as it is the case in LGM-Cattle). Also, depending upon the insurance plan designed by the insurer, output and input prices could be futures prices, options prices, spot prices, etc. Additionally, X is a vectors of input quantities, and depending on the insurance plan designed by the insurer, certain allowed levels of a number of inputs are considered as pre-determined variables, meaning that the allowed levels are considered in computing the margin of interest, no matter what the realized levels turn out to be (e.g., the number of inputs involved in LGM-Cattle is two, while the number of inputs involved in most MPP-Grains is five) 8. Finally, P y and P x are output prices and a vector of input prices, respectively, and they are identified as random variables, meaning that a certain level of each is guaranteed by the insurer. To the extent that a farmer s realized margin is lower than the expected, which could be due to a decrease in revenue (e.g., owing to decreases in output prices) and/or an increase in input costs (i.e., owing to increases in input prices), MP insurance will cover a portion of that shortfall, depending upon the coverage purchased. This way, farmers can lock their margins by locking their output and input prices, and thereby hedge their risks through purchasing MP insurance. One may argue that farmers can simply hedge the risks they are exposed to more freely using futures markets (by taking long and short positions in the market) and using options markets (through buying put and call options in the market), which raises the question why farmers need crop insurance to hedge their risks. Implicit in this type of argument is the assumption that all the risks a typical farmer may encounter are solely price risks, and that as long as the price variables are locked through available options and futures contracts, farmers have hedged against their risks. However, the truth of the matter is that although these two types of contracts (options and futures contracts) can be thought of as two substitutes or alternatives for crop insurance to hedge risk, they should not still be regarded as perfect substitutes for this purpose. This is because, for instance for the case of RP programs, which constitute the largest set of U.S. federal crop insurance programs, buyers have a right to receive fixed revenue, which is the multiplication of output price times yield quantity. That is, such an insurance plan deals with not only price risk, but also yield variability, and the latter cannot be addressed in the setting of options and futures markets. A second reason why the U.S. federal crop insurance plans as a means of hedging risk are preferred by farmers to other risk-hedging alternatives has to do with the fact that the crop insurance plans are provided along with subsidies as a form of national protection for crop production. An added attractiveness of the crop insurance plans is that the premium to be paid for such programs are due and payable after the crop has been harvested, which gives farmers an additional advantage when one takes into account the time value of money and potential liquidityrelated issues that a typical farmer might be faced with. Additionally, we can add the ease of use and the simplicity of management of hedging risks through insurance plans, compared to those through options and futures markets, for farmers, allowing for smaller sizes of operations, which are typically relatively smaller than the minimum volumes required by CME Group, as well as the lower opportunity cost they incur when hedging through insurance 8. Zeytoon Nejad (2017) models MPP-Grains using copula methods, and provides empirical applications for the US crop insurance program. 7
8 plans as other potential reasons that make the crop insurance plans a more preferred way for farmers to hedge their risks. Indeed, MP insurance provides coverage against multiple dependent sources of risk, i.e., change in yield (which is, for example, the case for MPP-Grains), output price, and input prices. MP insurance is a variant of insurance where a margin guarantee is insured, and decreases in revenue (which could be due to decreases in yields and/or output prices) and/or increases in costs (which can only be due to increases in specific input prices) can trigger an indemnity. In general, a typical MPP indemnity is paid when: Expected Revenue Expected Cost Realized Revenue Realized Cost ( P Projected Projected Allowed Realized Realized Allowed y Y Px X ) Exante ( Py Y Px X ) Ex post (2) Expected Margin Realized Margin A set of margin protection insurance plans made available by the USDA s RMA is the Livestock Gross Margin (LGM) insurance program, which provides protection against loss of gross margin or price declines for cattle, swine, and dairy. The LGM program for cattle feeders is called LGM-Cattle. By definition, gross margin for LGM-Cattle equals the market value of livestock minus feeder cattle and feed costs on cattle. This insurance plan is available in 20 states. The LGM products provide protection when feed costs rise or output prices for cattle fall below a guaranteed level. In this insurance program, input and output quantities are pre-determined, but prices are guaranteed. For instance, expected gross margin per head of cattle for a month for a yearling finishing operation is computed based on the following equation, in which the variables Y and X s are some pre-determined weights and only P s are guaranteed. EM Y LiveCattle P LiveCattle X FeederCatt le P FeederCatt le X Corn P Corn (3) The multivariate nature of risk involved in the MP insurance program as well as the existing types of dependencies (non-linearities, tail dependence, etc.) among the aforementioned variables, such as yield quantity, output price, and inputs prices in all types of margin protection programs, requires us to model the joint behavior of the variables in a realistic, reasonable manner, through which we can subsequently design rating methods of MP insurance program. This task can be effectively undertaken through copula-based models, which is to be explained in greater detail in the next section. 3. Copula-Based Modeling: The study of copulas and their applications in statistics is a rather modern phenomenon (Nelsen, 2006). In the past few decades, there has been a rapidly growing interest in the theory of copulas and their applications in statistics, probability, finance, and economics. Some of these applications in finance and economics include: the economics of insurance (e.g., rating insurance premiums); financial econometrics (e.g., modeling dynamic processes, time-varying copula models, and volatility); the economics of risk and modeling risk (e.g., credit risk management, investment risk management, stock portfolio risk management, modeling market risk, and operational risk); macroeconomics (e.g., studying microeconomic origins of macroeconomic tail risks) 9, to name but a handful. 10 This section aims to 9. As an example, Acemoglu et al. (2017) apply copula-based models to investigate microeconomic origins of macroeconomic tail risks, and explain the different nature of large economic downturns from regular business-cycle fluctuations. 10. There are many other examples of copula applications. The applications of copula have been widely expanding to different economics branches and areas. 8
9 discuss (1) the basic properties of copulas, (2) methods for constructing copulas, and (3) the role that copulas play in modeling and in the study of dependence. Copulas can be defined in two ways: Copulas are functions that join or couple multivariate distribution functions to their one-dimensional marginal distribution functions. Copulas are multivariate distribution functions whose one-dimensional marginal distributions are uniform on the interval (0,1). According to Nelson (2006), copulas are of interest to scholars who are interested in applications of statistics and probability for two main reasons: Copulas are a way of studying scale-free measures of dependence. Copulas are a starting point for constructing families of bivariate distributions, sometimes with a view to simulations. As Nelson (2006) puts it, the word copula is a Latin noun that means a link, tie, or bond, and was first employed by Sklar (1959) in the well-know Sklar s theorem to describe the functions that join together onedimensional distribution functions to form multivariate distribution function. 11 As such, the theoretical foundation for the application of copulas has primarily been introduced by Sklar s theorem (1959), which states every multivariate cumulative distribution function (CDF) of form: F( x, x2,..., xk ) P[ X1 x1, X 2 x2,..., X x 1 k k ] (4) of a random vector [ X can be expressed in terms of its marginals and a copula 1, X 2,..., X k ] Fi ( x) P[ X i x] function C. Indeed, F( x, x2,..., xk ) C( F1 ( x1 ), F2 ( x2),..., F ( x )) 1 k k (5) A k-dimensional copula, C(u 1, u 2,, u k ), is a multivariate cumulative distribution function defined in the unit hypercube I=[0,1] k with uniform marginal distributions in U(0,1). If the marginals are continuous, then there is a unique copula associated with the multivariate cumulative distribution function F, and the copula can be obtained as follows: C( u, u,..., u ) F( F ( u ), F ( u ),..., F ( u k k k )) (6) Similarly, if the multivariate distribution has a density f(x 1, x 2,, x k ), and this is available, it holds further that: f ( x, x2,..., xk ) c( F1 ( x1 ), F2 ( x2),..., Fk ( xk )). f1( x1 ). f2( x2)... f 1 k k and c(.) is known as copula density function, and it is obtained as follows: ( f ( F1 ( u1), F2 ( u2),..., Fk ( uk )) c u1, u2,..., uk ) 1 1 f (( F ( u )). f (( F ( u ))..... f (( F 1 ( u )) k k k ( x ) (7) f ( F 1 1 ( u ), F 1 k i1 1 2 f ( F i ( u ),..., F 2 1 i ( u )) i 1 k ( u )) k (8) 11. It is also important to note that, as Nelsen (2007) states, the study of copulas and the role they play in probability, statistics, and stochastic processes is a subject still in its infancy. There are many open problems and much work to be done. 9
10 Considering the fact that there is a collection of copulas, then, as a consequence of Sklar s theorem, there would be a collection of bivariate or multivariate distributions with whatever marginal distribution one desires (Nelsen, 2006), which can clearly be useful in modeling and simulation. In addition, by dint of Sklar s theorem, the non-parametric nature of the dependence between two random variables can be expressed by the copula. As a result, the study of concepts and measures of non-parametric dependence is equivalent to a study of properties of copulas, and for such a study, it is to our advantage to have a wide variety of copulas available to apply (Nelson, 2006). In general, there are several methods of constructing bivariate copulas, of which four are briefly explained here (Nelson, 2006): The inversion method: In this method, Sklar s theorem is utilized, together with the corollary C(u,v)=H(F (-1) (u),g (-1) (v)), to produce copulas directly from joint distribution functions. Geometric methods: In these methods, one can construct singular copulas whose support lies in a specific set and copulas with sections given by simple functions such as polynomials. The algebraic method: In this method, copulas are constructed from relationships involving the bivariate and marginal distribution functions. Another general method: In this method, bivariate and multivariate Archimedean copulas are constructed at will using the Archimedean copula theorem, which briefly says C(u,v)= (-1) ( (u) + (v)), where (v)=-ln(t), and (t)=1+(1-)(1-t)/t, and is the Archimedean family dependence parameter. In this method, one only needs to find functions that will serve as generators, that is, continuous decreasing convex functions from I=[0,1] to [0,] with (1)=0, and define the corresponding copulas via the aforementioned theorem. In particular, for the purpose of the present paper, margin is determined by subtracting revenue from total costs. Total revenue is indeed the product of two dependent random variables - yield and output price. Total cost is the product of some allowed levels of a number of inputs and their corresponding prices. Thus, there are several random variables involved in the process of computing a margin. As empirical economists, we usually define such dependences in linear terms, typically represented by the coefficient of correlation (as a measure of linear association). However, dependence is a much broader concept than linear association. According to Goodwin (2015), a comprehensive understanding of the notion of dependence is key to understanding multivariate ordering and modeling. He also adds that dependence modeling exemplifies the rapidly developing opportunities for applying state-of-the-art analytics to real-world policy issues of importance to contemporary agricultural economics. Notwithstanding that the differences between correlation (in the sense of linear association) and dependence (association in its broad sense) have long been acknowledged, empirical methods that account for the differences have mostly emerged relatively recently and are still regarded as rather modern analytical developments. Copulas enable us to model univariate marginal distributions separately from dependence structure among them. In the past few decades, there has been a rapidly growing interest in copulas and their applications in statistics, probability, finance, and economics. In the crop-insurance empirical literature, copula models have been heavily used in the design and rating of insurance contracts, especially those of RP programs, in which the typical negative correlation of output prices and yields plays a critical role in analyzing and pricing revenue risk. Copula models allow for capturing nonlinearities existing in the dependence among variables being studied. Tail dependence (i.e., extremal dependency) for a pair of random variables describes their dependence structure (i.e., co-movements or association) concentrated in the tail of multivariate distributions. To efficiently and accurately determine actuarially fair policy premiums, it is necessary to first model the joint distribution function of input and output prices. This task can be effectively carried out using copula methods. This paper will also demonstrate that the rating methodology that accounts for tail dependence between input prices and output prices 10
11 can result in more accurate premiums in the context of U.S. agricultural markets, and therefore can increase the hedging effectiveness of MP insurance plans in the mentioned markets. In fact, when one takes into account nonlinearity in dependence, asymmetry in dependence, and non-ellipticity 12 in dependence among dependent random variables of interest as well as the potential tail dependence existing among them, then the computed policy premium obtained from such a comprehensive estimation that accounts for all of these interesting features will be a more accurate premium than those obtained from and estimated under the unrealistic assumptions of linear, asymmetric, elliptical dependency, and no-tail-dependence. As pointed out above, copula-based modeling allows us to take into account nonlinearity and tail dependence among two or more dependent variables. Then, it will be possible to characterize the accurate policy premium which is not necessarily the same as the premium that is obtained under the unrealistic assumptions discussed above. In other words, it could be either larger or smaller than the premium obtained under the unrealistic assumptions, since it is free of those a priori assumptions. Copula modeling not only relaxes the four unrealistic assumptions of linear, asymmetric, elliptical dependency and no-tail-dependence among random variables of interest (for our case here, prices and quantities) in some circumstances, it also allows us to take advantage of any types of distribution for modeling marginals. Without copulas, we are usually limited to using normal or student s t distributions, which may or may not explain well the frequency of the observations at hand. However, copulas will help us have a freer choice of distributions for marginals towards achieving better fits for the marginals of interest. In the absence of copulas, in short, we are limited to only a few choices for marginals, and also required to impose unrealistic assumptions about dependence. However, copula modeling enables us to not just work with dependence towards obtaining a better fit by capturing the optimal dependence structure using some measures of fit, it also enables us to work with various marginal distributions towards obtaining better fits for marginals separately. These two advantages will help us attain better fits, more predictive and more realistic models, and as consequence, actuarially fairer premiums. In the applied literature, a number of parametric families of copulas have been employed to model the joint behavior of random variables. One of the most commonly used copula families in the applied literature are elliptical copulas 13, such as Gaussian copula, Student s t copulas 14, and symmetric generalized hyperbolic copula. In the past, copula models only allowed the modeling of elliptical dependence structures (i.e., Gaussian and Student-t copulas) in high dimensional spaces. These elliptical dependence structures are typically very restrictive, and do not allow for dependence asymmetries where correlations are different on the upper tail and/or lower tail, nor they allow for nonlinearity and non-ellipticity in dependence. 15 Another copula family that has overcome these drawbacks to some extent, and have been widely used in the applied literature is the family of Archimedean copulas, such as Clayton (which allows for the occurrence of extreme downside events, aka lower tail dependence), Gumbel (which allows for the occurrence of extreme upside events, aka upper tail dependence), Joe, and Ali Mikhail Haq. Even Archimedean copulas do not allow for different dependency structures between pairs of variables in high dimensions, since they typically depend only upon a single parameter of the generator function, and as a result, they 12. Ellipticity in dependence is theoretically a separate feature from asymmetry in dependence. For instance, Frank copula is symmetric, but it is not elliptical. Multivariate normality, which by construction assumes an elliptical copula (Gaussian copula), cannot account for potential nonellipticities in dependence. 13. Some prefer to refer to this family of copulas as meta-elliptical copulas, arguing that the contour lines of these copulas are not elliptical, but in fact the contour lines of the density functions of their corresponding distributions are elliptical. 14. It is important to make a clear distinction between symmetry and ellipticity. Moosavian (2017a) uses the multivariate skewed t-distribution to model price risks. He clarifies that although the multivariate skewed t-distribution is elliptical, it is not symmetric. However, multivariate student s t density function is both symmetric and elliptical. 15. Another problem with the class of elliptical distributions is that, in most cases, these copulas cannot be given an explicit functional form, due to the fact that the CDF and the inverse marginal CDFs and PDFs usually do not have closed-form functional forms, and usually have integral representations. Moosavian (2017b) make a comparison between copula families, and bring up the strengths and drawbacks of each family. 11
12 become inflexible in high dimensions. 16 An additional problem with the use of Archimedean copulas in high dimensions has to do with the fact that the rendered dependency is symmetric with respect to the permutation of variables, which means the distribution is exchangeable (Okhrin and Ristig, 2012). The property of permutationsymmetry is a severe restriction in more than two dimensions. Usually, this symmetry is not plausible when modeling a high-dimensional dataset. However, Hierarchical (aka Nested) Archimedean Copulas (HACs) overcome this problem by considering the compositions of simple Archimedean copulas, as introduced by Joe (1997). The general notion of HACs is to define multivariate copulas by nesting different lower-dimensional Archimedean copulas, which can somewhat overcome the permutation-symmetry in high dimensions. After all, HACs have serious shortcomings as well. Nicklas (2013) points out to the drawbacks as follows: For any hierarchical structure and any selection of Archimedean copulas, the conditions on the composite generator functions have to be verified separately. 17 He also adds that these conditions can be highly limiting and restrictive. As a result, the restriction to one copula family for all copulas in the hierarchy greatly limits the applicability of HACs. However, the recent development of vine copulas (aka pair-copula construction) has enabled dependence modelers to flexibly model the dependence structure for portfolio risks in high dimensions without suffering from the above-mentioned weaknesses. Considering the discussion above, and given the nature of the joint behavior in the context of MP insurance plans, which typically deals with a number of random variables, vine copulas would be a very useful approach to flexibly modeling the dependence structure of sources of risks in such a high dimensional space. Bedford and Cooke (2002) introduce vines as a new graphical model for dependent random variables. Vines are indeed a new graphical model to generalize the Markov trees which are often used in modeling highdimensional distributions. As Bedford and Cooke (2002) explain, vines differ from Markov trees and Bayesian belief nets in that the concept of conditional independence is weakened to allow for various forms of conditional dependence. Vine copulas (VCs) overcome the limitations of the elliptical and Archimedean copula families, and those of HACs. VCs are capable of modeling complex dependency constructions and patterns by taking advantage of a wide variety of bivariate copulas as building blocks for higher-dimensional distributions (Brechmann and Schepsmeier, 2013). According to Kramer and Schepsmeier (2011), the dependency structure and pattern are defined by the bivariate copulas and a nested set of trees. Comparing to other competing copula approaches, vine approach is more flexible, since one can select bivariate copulas from a rich variety of (parametric) families, including, but not limited to, elliptical, Archimedean, mixture copulas (e.g., BB1, BB6, and so on), etc. Model estimation in the vine approach has two stages: (1) determining the dependency structure of the data on the basis of graph theory, and (2) doing statistical inference (maximum-likelihood, Bayesian approach, etc.) to fit bivariate copulas. Vine copula models can be estimated in either of two ways, which are sequential maximum likelihood estimation or joint maximum likelihood estimation. Considering matters in a bivariate setting, a bivariate copula function C: [0,1] 2 R is a distribution on [0,1] 2 with uniform marginals. A bivariate distribution F has marginal distributions F 1 and F 2. Sklar's Theorem (1959) states that there exists a two dimensional copula C(u 1,u 2 ), such that (x 1,x 2 ) 2 ϵ R 2 : F(x 1,x 2 ) = C(F 1 (x 1 ),F 2 (x 2 )) (9) 16. Archimedean copulas are popular among researchers because they allow for modeling dependence structure in arbitrarily high dimensions with only one dependence parameter, which governs the strength of dependence between any two variables in all the 2-dimentional spaces spanned by the two variables. As such, Archimedean copulas are most useful in the context of bivariate cases or in applications where we expect all pairs to have similar dependencies. Employing Archimedean copulas for high-dimensional analyses could result in issues associated with the curse of dimensionality. The fact that Archimedean copulas have only one dependence parameter (for all pairs of variables) is both a blessing (as it simplifies matters) and a curse (as it causes inflexibility). 17. As Nicklas (2013) explains, the conditions are only easy to verify if all Archimedean copulas in the hierarchy belong to a special Archimedean family. For instance, if all copulas in the structure are of Gumbel type, of Clayton type, or of Frank type, one only has to check that the dependence parameters decrease with the hierarchy level (Aas and Berg, 2009). Moreover, by making model comparisons, Fischer et al. (2009) and Aas and Berg (2009) showed that HAC models could perform worse than other competing dependence structures in some circumstances. 12
13 The copula C is unique if F 1 and F 2 are continuous. It further holds that the corresponding 2-dimensional copula density is: c 12 ( u, u which implies the following joint and conditional densities: 1 2 ) C ( u, u ) u u (10) f ( x1, x2) c12( F1 ( x1 ), F2 ( x2)) f1( x1 ) f2( x2) 1 2 (11) f ( x2 x1 ) c12( F1 ( x1 ), F2 ( x2)) f2( x2) f ( x 1,..., x d (12) Now, a multivariate density of form ) can be represented as a product of pair copula densities and marginal densities. A 3-dimensional example of this result is as follows: where f f ( x1, x2, x3) f3 12( x3 x1, x2) f21 ( x2 x1 ) f1( x1 ) f (13) 21 ( x x2 x ) c ( F ( x ), F ( x )) f ( ) (14) ( x3 x1, x2) c13 2 ( F1 2 ( x1 x2), F3 2 ( x3 x2)) f3 2 ( x3 2) (15) 3 12 x f ( x3 x2) c23( F2 ( x2), F3 ( x3)) f3( 3) (16) 3 2 x f ( x 1,..., x d As a result, the multivariate density ) can be decomposed and represented as: f(x 1,x 2,x 3 ) = f 1 (x 1 ) f 2 (x 2 ) f 3 (x 3 ) (marginals) (17). c 12 (F 1 (x 1 ),F 2 (x 2 )). c 23 (F 2 (x 2 ), F 3 (x 3 )) (unconditional pairs). c 13 2 (F 1 2 (x 1 x 2 ),F 3 2 (x 3 x 2 )) (conditional pairs) Following Joe (1996), Bedford and Cooke (2001), Aas et al. (2009), Czado (2010), Brechmann and Schepsmeier (2013), and Kramer and Schepsmeier (2011), a generic form of Pair-Copula Construction (PCC) in a d-dimensional space will be as follows: d 1 d j d 1,..., xd ) ci,( i j) ( i1),...,( i j1) fk ( xk ) j1 i1 k1 f ( x (18) Pair copula densities Marginal densities c for i, j, i1,..., ik with i j and i... ik where c ( F( x x,..., x ), F( x x,..., x )) : i, j i1,..., ik i, j i1,..., ik i i1 ik j i 1 ik 1. It is important to note that the decomposition is not unique, and that Bedford and Cooke (2001) introduce a graphical structure called Regular Vine (R-Vine) structure to help organize the decomposition. For instance, a 5-dimensional regular vine structure can be represented as the following: 13
14 Figure 1: An Example of a Non-Classified Regular Vine in Five Dimensions Source: The Example is Taken from Kramer and Schepsmeier (2011) Kurowicka and Cooke (2006) make a distinction between two special cases of vine copulas: the Canonical Vine (for short, C-Vine), in which each tree has a unique node that is linked to all other nodes, and the Drawable Vine (for short, D-Vine), in which each tree is a path. Figure 2 exhibits example representations of C-vine and D-vine for a 4- dimensional density of the following form: f 1234 f1 f2 f3 f4 c12 c13 c14 c231 c241 c34 12 (19) Figure 2: Examples of a C- and D-vines Structures in Four Dimensions C-Vine D-Vine Source: Examples are Taken from Kramer and Schepsmeier (2011) Following Kramer and Schepsmeier (2011), it will be more intuitive and helpful to put the preceding equation in the following form: f (20) f f f f c c c34 12 c c c Nodes in T 1 Edges in T 1 Nodes in T 2 Edges in T 2 Nodes in T 3 Edge in T 3 14
15 The main difference between the C-vine and the D-vine is in the decomposition they use to represent a multivariate density function as combinations of pair-copula construction (PCC). In fact, the C-vine relates a single variable to all other variables, as shown above in figure 2 on the panel on left, while a D-vine has pairwise combinations variables in the initial level of the tree, and each tree is a path, as shown on the panel on right. The multivariate copulas obtained from C-vine and D-vine structures and their pair-copula constructions are finally called C-vine and D-vine copulas. According to Brechmann and Schepsmeier (2013), these copulas generally create highly flexible copula-based models, since bivariate copulas can easily accommodate complex dependence structures such as asymmetric dependence or strong joint tail behavior 18. These copulas can somewhat accommodate other possible features such as non-zero-tail-dependence, nonlinearity, and non-ellipticity in dependence. To sum up, compared to the elliptical copula family, bivariate Archimedean copula family, and hierarchical Archimedean copulas, vine copulas are superior in that are explicit (they have explicit functional forms), their conditioning mechanism yields simulation algorithms as well, models are easily constructed (any pair copula works), they are highly flexible, and they accommodate positive/negative dependence, upper/lower tail dependence, as well as asymmetries, non-linearities, and non-ellipticities in dependence. As Brechmann and Schepsmeier (2013) put it, there are several steps that need to be taken for fitting a vine copula model. As the first step, an appropriate vine tree structure has to be identified out of all possible pair-copula constructions. Such a vine tree structure could either be given by the data itself, or, in other contexts, has to be chosen manually or through expert knowledge. For a given vine structure, adequate copulas have to be selected. As the next step, the copulas in the vine structure chosen must be estimated. Tables 1 and 2 in appendix 2 summarize the main properties and dependence parameters of a set of elliptical and Archimedean copulas which are widely used as pair-copula building blocks. In the final step, the estimated copula-based model needs to be evaluated and compared to alternatives models. The workflow shown in Figure 3 summarizes, in a visual form, these steps of data analysis and model building for vine-copula-based models. Figure 3: Workflow of Data Analysis and Model Building in Vine-Copula Modeling Source: Brechmann and Schepsmeier (2013) 4. Literature Review: In the past two decades, there has been a sizeable body of empirical literature devoted to examining various aspects of the U.S. crop insurance program. One aspect that has received considerable attention has been how different crop insurance plans should be rated. In this section, the existing literature on the U.S. crop insurance program is reviewed with an emphasis on Revenue Protection plans, Margin Protection plans, and copula methods. A select set of studies have been reviewed from the crop insurance literature, primarily concerning the structure and rating of these insurance plans. The information and knowledge gained from this part will be used to first identify the existing gaps in the respective literature and also to build up a theoretical framework to pursue the main purpose of the present paper. Chen and Goodwin (2010) design and propose multiyear crop insurance contracts that provide lower premium rates, and can be attractive for farmers. They use simulations to show that actuarially fair premium rates 18. For more information on these two features, you can see Joe, Li, and Nikoloulopoulos
16 for the multiyear plans were lower than corresponding single-year plans. They also investigate correlation patterns at county level in Iowa, seeing that correlation patterns vary from county to county, mostly due to heterogeneous weather patterns and geographical locations, as they argue. Moreover, they study the dependence using copula methods. They mention that the copula method provides better estimate of the dependence than Pearson correlation coefficient. They also provide an example of multiyear insurance contract design for Adair County in Iowa to show the details. They also exemplify how farmers can obtain partial payment each year and total indemnity at the end of the insurance contract term. They predict that the proposed multiyear plans will be an interesting insurance plan to both government agencies and farmers. Goodwin and Hungerford (2015) estimate copula-based models of systemic risk in U.S. agriculture and provide implications for crop insurance and reinsurance contracts. They evaluate the suitability of the current actuarial practices applied in rating revenue protection plans and the validity of the assumption of a Gaussian copula model to the pricing of dependent risks in the context of revenue protection insurance. They consider a number of alternative copula models and use combinations of pair-wise copulas of conditional distributions to model several sources of risk. Their findings and computed model-fitting criteria indicate that their approach is generally preferred to the conventional ones in the applications they examined. They also demonstrate that taking alternative approaches to modeling dependencies in a portfolio of risks may have significant implications for premium rates in crop insurance, which in turn can naturally have significant influence on the production and marketing decisions of producers. Ramsey et al. (2016) propose a new type of crop revenue insurance program called Exotic Price Coverage (EPC) and detail the construction and rating of the aforementioned insurance type. They argue that this is a more general type of price replacement feature where the payout on the insurance policy is made on an order statistic or an average of prices, compared to the current form of Revenue Protection programs, which are sold with a harvest price replacement feature that pays out on lost yields at the higher of a realized or projected harvest price. This type of insurance can be regarded as one of the add ons to insurance policies with revenue guarantees that are exotic functions of prices. They go on to say that price coverage is one area where private insurers have the flexibility to furnish products beyond those offered under the federal crop insurance program. They also compare the EPC program with the RP program, and bring up deficiencies in conventional modeling approaches. As they state, common methods may not be flexible enough to account for multivariate aspects of risks. They model the within contract serial dependence of futures prices and state that this modeling is a prerequisite for pricing exotic coverage. In his study, they use copula methods and specifically elliptical and hierarchical Archimedean copulas, and show that it is possible to characterize underlying dependence structures and quantify the risk associated with these types of insurance offerings through copula modeling. They finally conclude that exotic price coverage is one possible avenue for private insurers to play a bigger role in agricultural insurance in the United States. Zhu et al. (2008) study the Whole-Farm Insurance (WFI) plan, which provides overall coverage to all of a farm s crops 19, and evaluate and model the risks of corn and soybean production by focusing on the risk of revenue variability that comes from variations in either prices, or yields, or both. They model yield through a family of Beta distributions, and model price shocks by the log-normal distribution. In order to characterize the behavior of the multivariate risk due to yield risk and price risk, which are usually highly correlated, they apply a copula approach and use various copula models and investigate their suitability in modeling yield and price risks. Finally, they illustrate their proposed copula approach with simulated data to calculate the premium rate of the whole farm insurance. Their results indicate that WFI is superior to crop-specific insurance since it is a more efficient risk management tool with actuarially fair premiums 36% cheaper than those for the combination of the corresponding crop-specific contracts at the same protection level. Their findings indicate that the efficiency and accuracy of modeling cross-crop yield and price associations and rating of whole-farm insurance contracts can be improved by 19. The idea of whole-farm insurance is to pool all of a farm s insurable risks into a single insurance policy that provides cheaper premium rate at the same protection level against the gross farm revenue losses. 16
17 using the copula approach that they employ. Their simulation results also suggest that the crop producers would switch from purchasing the crop-specific revenue insurance contracts to the WFI contract if the WFI were offered. Additionally, they state that the social planner should take finding into consideration when the crop insurance program is designed, since this way, the subsidy plan in the crop insurance program would favor crop producers who purchase whole-farm contracts, which subsequently would improve the efficiency of crop insurance program. Ahmed and Goodwin (2015) use copula-based modeling to examine the dependence structure among spatially distinct agricultural commodity markets. They argue that such modeling will measure the speed of volatility transmission from one market to another. They have applied copula-based models that consider the multivariate joint distribution of food grain prices from different markets. In their analysis, they study three of the most traded food grains (rice, wheat and corn). Their findings imply that Gaussian copulas show statistically significant dependence for most price pairs between markets, but with small Kendall s tau values, which imply low dependence among markets. Considering the fact that Gaussian copulas, by construction, do not capture tail dependence, they employ other copulas than Gaussian that are capable of capturing tail dependence. As a result, they find a significant improvement in Kendall s tau values, implying a strong dependence. They finally conclude that identifying and understanding this high level of dependence among markets could serve as a risk management tool in future policy formulation and in price forecasting for both speculators in the commodity futures markets and policy-makers in food-importing countries. Chen and Chen (2016) analyze energy and agricultural commodity markets with the policy mandated using a vine copula-based ARMA-EGARCH model. That is, they analyze the dependence structure of commodities with the policy effect of the Energy Independence and Security Act of 2007 along the biofuel supply chain in the U.S. agricultural market. They refer to EISA of 2007 which targets an increase in ethanol production to 36 billion gallons per year by They argue that since biofuels are mainly produced from agricultural commodities, increasing demand for biofuels would have an impact on agricultural commodity prices. They mention that linear models of relationships among crude oil prices and prices of agricultural commodities are not appropriate choices to explain the asymmetric dependency among these prices. They use daily futures data from January 1st, 2003 until December 31st, 2012 to examine linkages among crude oil futures, corn futures, soybean futures, soybean meal futures, rice futures, and wheat futures markets in the United States. In modeling the dependency of agricultural futures price returns in the United States, they use the skewed student s t to describe the marginal distribution and vine copulas to build the joint distribution of residuals according to the lowest AIC values. They propose that vinecopula modeling can provide a flexible measurement to capture an asymmetric dependence among the mentioned commodities. In fact, they employ vine copulas to better capture an asymmetric dependence among commodities using five U.S. agricultural commodities and crude oil. Their empirical results show that vine copula-based ARMA- EGARCH(1,1) is an appropriate model to analyze returns dependency of crude oil and agricultural commodities before EISA. Based on their findings on the relationship among energy and agricultural commodities, they finally suggest that policymakers and industry participants should formulate and implement appropriate strategies for risk management, hedging strategies, and asset pricing. Bozic et al. (2014) provide a model that accounts for nonlinear dependence in pricing margin insurance for dairy farmers. In particular, they focus on the Livestock Gross Margin Insurance for Dairy Cattle (LGM-Dairy), and examine the assumptions underlying the current method being used to determine LGM-Dairy premiums. They analyze the dependence structure through copula methods. They find that there is a significant relationship between milk and feed prices that increases with time-to-maturity and severity of negative price shocks. They state that a common theme in financial and actuarial applications and in agricultural crop revenue insurance is that tail dependence increases the risk to the underwriter and results in higher insurance premiums. However, they claim that they present the first case ever in which tail dependence may actually reduce actuarially fair premiums for an agricultural risk insurance product. Their argument seems to be valid if one takes into account the natural hedge inherent in the computation of a margin that usually occurs when prices of both inputs and outputs move together. 17
18 They also challenge the assumptions underpinning the univariate marginal distributions used in the rating method, specifically those of no-biases in futures prices or implied volatilities inferred from option premiums, and those of marginal distributions being log-normal. They finally conclude that rating methodology that accounts for tail dependence between milk and feed prices extends the optimal hedging horizon and increases hedging effectiveness of the LGM-Dairy program. Gosh et al. (2013) propose a framework for optimal model mixing in a cross-validation context. Using two objective functions in the optimization process for optimal mixing weights of copulas in an out-of-sample framework allows for defining and designing specifications that are both efficient and flexible compared to the single copula distributions. Using data on corn from for 602 counties in the Mid-west area two different efficient methods are proposed to generate the optimal mixtures using the cross validation approach. They use a resampling technique to check for the significance of the expected indemnities. The optimal mixture models that they apply indicate that the mixture between the Archimedean families rank best. One remarkable observation that can be noticed in this literature review section is that in cases where an insurance plan somehow includes several variables (potentially moving in the opposite direction i.e., there is a natural hedge) (e.g., the LGM-Dairy insurance as studied by Buzic et al., 2014), or several periods (during which fluctuations occurring in the opposite direction offset each other i.e., there is a natural hedge), or several products being insured altogether (among which price fluctuations could occur in the opposite direction offsetting each other i.e., there is a type of hedge) (e.g., Whole Farm Insurance as studied by Zhu et al., 2008), then risk and subsequently the related risk premium reduces and a higher level of hedging effectiveness can be attained. The intuitive economic root causes of such phenomena could be explained through potential reasons such as natural hedge, movement of prices together (in the same or opposite direction), diversification, different desired weather conditions for different crops, etc. This result is in essence very similar to the general idea and the key insight of the modern portfolio theory (MPT) put forth by Harry Markowitz, which suggests that diversification reduces the overall risk of a (all-weather) portfolio to the systematic risk in the market. To conclude, it should be noted that much of the attention to the U.S. federal crop insurance program has been paid to Revenue Protection insurance programs thus far, and Margin Protection programs have not received much attention yet. As such, this is the identified lack in the existing literature that the present paper is to fill in. Further, MP insurance plans are financially attractive since the financial stability of farming operations depends more on operating margins than solely revenues. It is also theoretically interesting because there are comparably more random variables involved in the modeling of this insurance, compared to those of RP insurance plans. While copula-based modeling through mixtures of mixtures and vine copulas can bring us numerous desired properties, such as be a high degree of flexibility and a great power of predictability of joint behaviors of and dependence among random variables, they have been barely utilized in the context of crop insurance. Therefore, the present paper aims to model portfolio risks using mixtures of mixtures in the context of crop insurance program. 5. Empirical Application: In this section, some quantitative investigations and empirical applications will be supplied so as to provide empirical evidence to support why copula-based modeling should be utilized to model MP insurance premiums, and also to propose a new method that better suit the nature of MPP than the conventional method of modeling dependence in rating MP premiums. Conducting this task (obtaining better fitted models of dependence than the conventional models) will be the ending point of the present paper, and next potential steps to advance this study (such as studying indemnities and premiums under the alternative and proposed methods, and showing how accounting for irregular dependence features such as tail dependence between input prices and output prices can result in higher levels of accuracy in rating premiums, and therefore higher levels of hedging effectiveness of MPP 18
19 in the mentioned markets) will be left for future research to be pursued later. The variables to be studied in this paper are as follows: the output prices and input prices that are relevant to the production of livestock. In particular, the LGM-Cattle plan is to be studied in greater details in this paper. The primary data to be used is daily spot prices of the related inputs and output from 2004 to 2015 from Commodity Research Bureau (CRB), and the variables of interest, in particular, include live cattle price, feeder cattle price, corn price, soybean price, and soymeal price. These are variables that are identified and insured in LGM programs. Prices will be studied in the form of price relative deviates (price shocks). The first empirical application models the multivariate distribution of the five random variables mentioned above. The second empirical application models the first three random variables introduced above, which are particularly relevant to the LGM-Cattle insurance plan. As noted earlier, in studying risks involved in an insurance plan, often, we are not interested merely in a single random variable, but instead we are often interested in the joint behavior of several random variables, which can be captured by a multivariate distribution function. Covariance and correlation matrices are two instruments that exhibit the linear association of the random variables involved. It is generally difficult to obtain much information by just inspecting the covariance matrix, since it depends on the variances of the random variables as well as the strength of the linear relationship between them. To gain a better understanding of the relationships between the random variables, it is more informative to examine their sample correlation matrix instead, since it only depends on the strength of the linear relationship between them, and not the variances anymore (Ruppert, 2011). Tables 1 and 2 in appendix 1 present the tables of the summary statistics as well as the table of the coefficients of correlation for the variables under study. 20 Nonetheless, a coefficient of correlation is only a summary statistic of the linear relationship between variables. Since it is only a single numerical value, it does not reveal any information on how the dependence is distributed. As a consequence of this shortcoming, interesting features, such as nonlinearities, asymmetry, and nonellipticity in dependence, and/or tail dependence (i.e., the joint behavior of extreme values) still remain unrevealed and hidden when only correlations are estimated and examined. 21 A possible solution to overcome this shortcoming is drawing the so-called scatterplot matrix. Despite the fact that lack of non-linearities, asymmetries, non-ellipticity, and tail dependence are typical of some contexts, they still should not be taken for granted. Rather, one should always look at the scatterplot matrix to investigate these features. The primary advantage of the assumption of multivariate normality (whose dependence parameter is the so called Pearson s coefficient of correlation) lies in the fact that it simplifies many useful probability applications and calculations. For instance, it is often argued that if the returns on a set of financial assets have a multivariate normal distribution, then it can be said that the return on any portfolio formed from a combination of these financial assets will subsequently be normally distributed. In fact, this is because the return on the portfolio is indeed the weighted average of the returns on the financial assets. Therefore, the normal distribution could be used, for instance, to find the probability of some loss, say 5%, of the portfolio. These types of calculations have important applications in finding a Value-at-Risk (VaR) (Ruppert, 2011). 22 However, the validity of the multivariate normality assumption should not be taken for granted. Instead, one should always check whether or not it holds, as there are many contexts in which the validity of this assumption is under question. 20. As for the table of summary statistics, it is important to note that although the magnitude of the average price deviates seem to be trivial, they are in fact average daily price deviates, and as a result, even such seemingly small deviates are absolutely considerable if one takes into account the compounding nature of price increases over time. 21. To examine whether extreme values tend to occur together in the same period (here, on the same day), one can take advantage of scatterplots. Tail independence in the context of multiple random variables can be seen in a scatterplot matrix by noticing that the outliers have tendency to lie along x- and y-axes. On the other hand, tail dependence occurs when outliers tend to occur together, that is, in the upper-right and lower-left corners, instead of being concentrated along the axes. In short, when the outliers lie along x- and y-axes, it is said that the scatterplot indicates tail independence, while when the outliers are concentrated in the upper-right and lower-left corners, it is said that the scatterplot implies tail dependence. 22. A stock portfolio provides a fine example to illustrate the notion of dependence. A portfolio is riskier if large negative returns on its individual assets tend to occur together on the same days. 19
, such as t-distributions for marginals together with a t-copula to join the marginals.")
20 If the only problem under such circumstances (violations of the multivariate normality assumption) is the existence of heavy tails, then one can apply alternatives, which include heavy-tailed multivariate distributions (to account for outliers), such as t-distributions for marginals together with a t-copula to join the marginals. However, if the extent of the problem is beyond the existence of heavy tails, and extends to include tail dependence, nonlinearities, asymmetries, and/or non-ellipticities in dependence, then the best alternative to multivariate normal distribution is the copula-based modeling of the joint behavior of the random variables of interest. As noted above, a solution to reveal these irregular and anomalous features in dependence is drawing the so-called scatterplot matrix. A scatterplot matrix is a matrix of scatterplots, each of which is a scatterplot for each pair of random variables. A scatterplot matrix is a good starting point to look at the above-mentioned interesting features of dependence. Figure 4 depicts a scatterplot matrix for five of the random variables involved in the LGM insurance premiums calculations. Figure 4: Scatterplot Matrix for the Random Variables Involved in the LGM Insurance Premium Calculations along with Their Histograms and Fitted Normal Densities This scatterplot matrix exhibits several features, which typically cannot be captured by the coefficient of correlation. These features include asymmetries in dependence, non-linearities in dependence, non-ellipticity in dependence, and tail dependencies, 23 which indicate why one should not assume multivariate normality when modeling the joint behavior of such random variables. In addition, figure 5 demonstrates the scatterplot matrix of the random variables involved in the LGM insurance premium calculations together with the corresponding Q-Q plots of each pair of the 23. Considering the fact that the number of observations in this empirical application is quite large (2997), and that the dot points on the scatterplot matrix are rather large, clearly observing some of the above-mentioned interesting features on these scatterplots is hard or impossible. 20

21 variables. A Q Q plot is a graphical method for comparing two univariate distributions by plotting the quantiles of each distribution against those of another. A Q Q plot is usually employed to compare the shapes of two distributions, illustrating how interesting properties such as location, scale, and skewness are alike or different. Q Q plots can also be used to compare the underlying distributions of two random variables, and graphically check whether they follow the same distribution or not. The Q-Q plots reported in the following scatterplot matrix imply that, except for few cases such as the pair of corn and soybean, almost all the variables follow different underlying distributions, implicitly suggesting that their marginal distributions should be modeled using various parametric distributions, which can be taken as an additional piece of evidence suggesting why we need copula methods for modeling dependence among the random variables at hand, as the alternative models such as multivariate t distributions only accommodate modeling of marginals following the same parametric distribution family (only student s t marginals). Figure 5: Scatterplot Matrix for the Random Variables Involved in the LGM Insurance Premium Calculations Together with Q-Q Plots for Each Pair of Variables Another reason why one cannot always utilize multivariate normal distribution to model the joint behavior of a set of random variables lies in the fact that there are many cases where marginals are not normally distributed, which implies that a vector of the random variables involved will not have a multivariate normal distribution. According to Ruppert (2011), usually, the marginal distributions of financial times-series are not well fit by normal distribution. Under such circumstances, one needs to resort to copula-based modeling, which can accommodate non-normal marginals. This is one of the primary reasons why copulas are a popular method for modeling multivariate distributions. Figures 6 and 7 provide evidence on non-normality of the marginals being examined in the empirical application of the present paper; that is, they demonstrate that almost none of the marginals can be fit well by a (single) normal distribution. Figure 6 depicts the histograms of the marginals along with the fitted normal densities 21
22 of the five variables being investigated, and makes it evident that, in most case, the marginals are not well fit by normal distribution. Figure 7 shows the Q-Q plots of the sample quantiles versus theoretical normal quantiles for the marginals, which indicates non-normality of the marginals. The existence of these non-normal marginals can be considered as an additional piece of evidence to support the idea why one needs to take advantage of copula-based modeling for rating MP insurance premiums. Figure 6: Histograms and Fitted Normal Densities for Five Variables Involved in the LGM Insurance 22
23 Figure 7: Results of the Q-Q Plots of the Sample Quantiles vs. Theoretical Normal Quantiles for the Marginals Corn Price Deviate Feeder Cattle Price Deviate Live Cattle Price Deviate Soymeal Price Deviate Soybean Price Deviate 23
24 The Q-Q plot is a graphical tool to assess whether a set of data plausibly comes from some theoretical distribution such as a Normal. To check the validity of the assumption of multivariate normality which assumes marginal variables are normally distributed, we used Normal Q-Q plots to check the assumption. While straightforward, a Q- Q plot is only a visual check, and as such, it should not be regarded as a formal proof. More formally, one can test normality of marginals using the Shapiro-Wilk (SW) normality test, as it has been done below in table 1. Table 1: Results of Shapiro-Wilk (SW) Normality Test Shapiro-Wilk Normality Test Results Variable $d_corn $d_fcat $d_lcat $d_soymeal $d_soybean Statistic and p-value Test Result W = , p-value < 2.2e-16 Normality is rejected W = , p-value < 2.2e-16 Normality is rejected W = , p-value < 2.2e-16 Normality is rejected W = , p-value < 2.2e-16 Normality is rejected W = , p-value < 2.2e-16 Normality is rejected The W statistic of the Shapiro-Wilk test of normality tests the null hypothesis that the population is normally distributed. Thus, when the p-value is less than a selected significance level, then the null hypothesis is rejected, implying that there is statistically significant evidence that the data tested are not from an underlying normally distributed population, i.e., the data are non-normal. 24 Now that it has been verified none of the marginals can be well fit by a single normal distribution, it seems reasonable to conjecture that these single-normal fits can be improved by fitting mixtures of normal distributions through the flexibility that such a mixture estimation method can potentially bring about. Typically, in a mixture of two normal distributions, each distribution can explain well one of the underlying sub-populations, through which, for instance, one can capture the mean of the whole population well, and another can capture the variance of the whole population well, which could overall improve the predictability power of the marginals and consequently that of the multivariate model of interest as a whole. In general, when the objective of estimation is to describe the distribution of a single variable, there might arise cases where the data at hand is not representative of well-known distributions. One possibility to deal with such a situation is to resort to a nonparametric method, such as kernel density estimation, to describe the distribution, so as to generate a smoothed, numerical approximation to the unknown distribution function. However, this approach might not be the best and the most succinct way to describe an unknown underlying distribution. Rather, a finite mixture model (FMM) provides a parametric alternative that describes the unknown distribution in terms of mixtures of well-known distributions. FMMs provide modelers with a flexible estimation framework for analyzing and modeling a wide variety of data. FMMs have several advantages, some of which are as follows. A FMM permits researchers to evaluate the probabilities of events or simulate draws from the unknown distribution (Kessler and McDowell, 2012). In addition, FMMs allow for a parametric modeling approach to one-dimensional cluster analysis. An additional benefit of using a model-based approach to clustering (such as FMM) is that it permits estimation and hypothesis testing within the framework of standard statistical theory (McLachlan and Basford 1988). Furthermore, in the context of regression analysis, FMMs provide a mechanism that can take into account unobserved heterogeneity in the data. Some important categories of the data (e.g., age group, region, and gender) are not always measured. These latent classification variables can cause over-dispersion, under-dispersion, or 24. Some argue that the SW test could be statistically significant from a normal distribution in any large samples, which is due to the fact that the test is biased by sample size. As such, they suggest that an examination of the associated Q Q plots needs to be done for verification in addition to the SW normality test. This task was conducted in the present paper before the SW normality test, verifying that the data are non-normal. 24
25 heteroscedasticity in a standard, traditional model. However, FMMs overcome these issues through the high flexibility they possess by construction (Kessler and McDowell, 2012). In modeling joint behaviors of random variables, quite often, there is a delicate trade-off between flexibility and tractability. In this paper, the objective of the analysis is to attain as much flexibility as possible both in representing the marginals (through mixtures of normal distributions), as well as in representing the joint distribution of dependent random variables, here input prices and output prices (through mixture copulas and vine copulas), while still preserving a tractable approach to estimation and inference, in order to avoid the curse of dimensionality that a high-dimensional multivariate problem could typically present. In principle, with adequate data compared to the dimension of the multivariate data, a mixture model can fit a data set arbitrarily well and capture most of its features (Tran et al., 2014). Regardless of the modeler s purpose of employing mixture models, the theory of FMMs is based on the assumption that each of subpopulations follows a particular parametric form of distribution, and often this form is univariate normal (Benaglia et al., 2009). With regards to the computational procedures of FMM, the FMM method applies the fitted component distributions and the estimated mixing probabilities to calculate a posterior probability of component membership. An observation is assigned membership to the component with the maximum posterior probability. A FMM estimates two sets of parameters. One set consists of the parameters of the several separate distributions, and another set comprises the mixture parameter, which indeed estimates the probabilities of component membership for each observation (Benaglia et al., 2009). FMMs are typically estimated with the Expectation-Maximization (EM) algorithm within a maximum likelihood framework (Dempster, Laird, and Rubin 1977) and with Markov Chain Monte Carlo (MCMC) sampling (Diebolt and Robert 1994) within a Bayesian framework (Leisch, 2004). Consider a generic FMM with K components of the following form: K h( y x, ) f ( y x, ) k k1 k K 0, 1 k1 k k (19) ( 1 k 1 k where y is a dependent variable with conditional density function h, and x is a vector of independent variables, and π k is the prior probability of component k, and k is the component specific parameter vector for the density function f, and,,,,, ) is the vector of all parameters. If f is a univariate normal density with component- 2 specific mean and component-specific variance, then (, 2 ) will be the vector of component-specific x k parameters (Leisch, 2004). k Figure 8 depicts the mixtures of normal distributions fitted for the five variables being examined, and table 2 reports the corresponding details related to the fitted single, individual, and mixture distributions. Also, figure 1 in appendix 2 demonstrates these fitted mixtures of normal in greater detail. Table 2 summarizes the goodness-of-fit measures for the fitted mixture, single, and individual normal curves of the random variables involved in the LGM insurance premium calculations. As the table reports, the measures of goodness-of-fit (AIC, BIC, and LLF) associated with the three mixture models are superior to those of their corresponding singular normal distributions. This suggests that the use of the mixtures of normal distributions will improve the predictability power of the marginals, which in turn enhances the predictability power of the multivariate model of random variables involved in the rating process of the LGM insurance premiums. k k k 25

26 Figure 8: Results of the Fitted Mixtures of Normal Distributions for the Marginals Table 2: The Summary Table of the Goodness-of-Fit Measures for the Fitted Mixture, Single, and Individual Normal Curves of the Random Variables Involved in the LGM Insurance Premium Calculations Corn Corn Soybean Soybean Soymeal Soymeal Feeder Feeder Live Price Price Price Price Price Price Cattle Cattle Cattle (Mixture (Single (Mixture (Single (Mixture (Single Price Price Price of Normal) of Normal) of Normal) (Mixture (Single (Mixture Normals) Normals) Normals) Normal) Normal) Normal) Goodnessof-Fit Measures Live Cattle Price (Single Normal) AIC BIC LLF After obtaining better fits of marginals, now we can turn our attention to modeling the dependence among the random variables at hand. In appendix 1, tables 3 through 5 and figure 1 report the results of modeling the dependence among the variables of interest using select, conventional copula models, including Normal, t, Gumbel, and Clayton copulas. Tables 8, 9, and 10 in appendix 2 provide the properties of these copula functions in brief. In 26
27 the empirical applications of this paper, multivariate normal and t are treated as benchmarks to make comparisons with the fitted vine-copula models. As explained in section 3, the present paper proposes the use of mixture copulas and vine copulas to model dependence among variables involved in MP insurance plans, because of the numerous advantages of these copulas, which were introduced in section 3. Figure 2 in appendix 2 exhibits a snapshot of a visual comparison of some select bivariate copulas as a step of choosing the best copula families in the vine-copula model estimation, which occurs as the underlying computational processes in the statistical software R when selecting the best vine structures based on some optimization algorithms. Figure 3 in appendix 2 and its associated tables show pair-copula constructions (PCCs), R-vine trees, C-vine trees, D-vine trees, measures of goodness-of-fit (GOF), model selection, and parameter estimation for the five-dimensional empirical application. Figure 4 in appendix 2 and its associated tables present the similar reports for the case of the three-dimensional empirical application. Finally, figure 5 in appendix 2 demonstrates general 3-dimensional plots of the three-variable model, which is simulated from the three-dimensional R-vine model estimated. Such simulations can be later used for estimating actuarially fair premiums, as the continuation of the present research. After all, conducting this task is left for future research purposes. According to the Akaike Information Criterion (AIC), Bayesian Information Criterion (BIC), and Log-Likelihood Function (LLF) criterion, the mixture copulas and the vine-copula models estimated, (i.e., some mixture copulas were used as some of the building blocks of the vine-copula models), outperform the corresponding Gaussian and t copula models. Among the vine-copula models estimated for the 5-variable model, table 3 shows that based on all the three GOF criteria, R-vine is preferred to D-vine, and D-vine is preferred to C- vine. For the 3-variable model, based on all the AIC and LLF criteria, R-vine is preferred to D-vine, and D-vine is preferred to C-vine. However, based on the BIC criterion, D-vine is preferred C-vine, and C-vine is preferred to R- vine. This difference in model selection based on AIC and BIC (both of which are penalized-likelihood criteria) occurs as a result of the fact that the BIC criterion penalizes model complexity more heavily than the AIC criterion. Table 3: The Summary Table of the Goodness-of-Fit Measures for Different Vine Copula Models for the 3-Variable Model and the 5-Variable Model Model The 5-Variable Model The 3-Variable Model Vine/Criteria AIC BIC LLF AIC BIC LLF R-Vine C-Vine D-Vine Test Result Based on all the three GOF criteria, R-vine is preferred to D-vine, and D-vine is preferred to C-vine. Based on all the AIC and LLF criteria, R-vine is preferred to D-vine, and D-vine is preferred to C-vine. However, based on the BIC criterion, D-vine is preferred C-vine, and C-vine is preferred to R-vine. The AIC and BIC are often used for comparing non-nested models. However, it is important to note that both of the C-vine and D-vine are special cases of a more general unclassified structure called R-vine, and as such, vine models are nested versions of each other. Hence, these models should be compared by a statistical test that is designed for comparing nested models. In short, the Vuong closeness test is likelihood-ratio-based test for model selection between two models that can be nested, non-nested or overlapping. The null hypothesis of the Vuong test is that the two models being compared are equally close to the true data generating process. The alternative hypothesis is that one of the models is closer that the other. Table 4 reports the results of the Vuong test for the 5-varibale model as well as the 3-variable model. 27
28 Table 4: The Results of Vuong Test for the Vine Copula Models Estimated 5-Variable Model 3-Variable Model C5 vs. D5 C5 vs. R5 D5 vs. R5 C3 vs. D3 C3 vs. R3 D3 vs. R3 Vuong test Vuong test Vuong test Vuong test Vuong test Vuong test statistic statistic statistic statistic statistic statistic statistic.akaike statistic.akaike statistic.akaike statistic.akaike statistic.akaike statistic.akaike statistic.schwarz statistic.schwarz statistic.schwarz statistic.schwarz statistic.schwarz statistic.schwarz p.value p.value p.value p.value p.value p.value p.value.akaike p.value.akaike p.value.akaike p.value.akaike p.value.akaike p.value.akaike p.value.schwarz p.value.schwarz p.value.schwarz p.value.schwarz p.value.schwarz p.value.schwarz D preferred R preferred R preferred D preferred R preferred R preferred Statistically significant Statistically significant NOT statistically significant NOT statistically significant NOT statistically significant NOT statistically significant Note: statistic: test statistics without correction - statistic.akaike: test statistic with Akaike correction - statistic.schwarz: test statistic with Schwarz correction - p.value: p-values of tests without correction - p.value.akaike: p-values of tests with Akaike correction - p.value.schwarz: p-values of tests with Schwarz correction As with the AIC and BIC, the Vuong test statistic could be corrected for the number of parameters used in the models to be compared. Two possible corrections have been suggested in the literature, which are called the Akaike correction and the Schwarz correction, which correspond to the penalty terms in the AIC and the BIC, respectively (rdrr.io, 2017). In short, table 4 reports the results of the Vuong test for the 5-varibale model and those for the 3- variable model, showing that for both models, the results of the Vuong tests indicate that R-vine is preferred. The relatively better performance of R-vine copula models can be attributed to the more flexibility that R-vine models exhibit, primarily because of their less restricted choice of tree structures when optimizing the structure to better model dependence. To sum up, the mixtures-of-mixtures approach proposed in the present paper brings about two sets of advantages. With respect to marginals, using mixture marginal distributions is a parametric alternative for nonparametric distributions, and allows to flexibly model unknown marginal distributions in the form of mixtures of well-known distributions, which in turn allows to evaluate the probabilities of events or simulate draws from the unknown distribution. It also allows for a (semi-)parametric modeling approach to one-dimensional cluster analysis of sub-populations in the marginals, which permits estimation and hypothesis testing within the framework of standard statistical theory. Taking this estimation approach to modeling marginals also enables researchers to easily characterize existing sub-populations in the marginals by classifying observations, and estimate sub-populationspecific parameters. With respect to dependence, using mixtures of copulas within the framework of vine copula models enables dependence modelers to effectively deal with high-dimensional problems, and easily accommodate complex dependence structures such as asymmetric, nonlinear, and non-elliptical dependence and/or strong joint tail behavior. Compared to their other alternatives for modeling high dimensions, the use of mixture copulas within the framework of vine copulas are superior in that they can end up with explicit functional forms; their conditioning mechanism yields simulation algorithms as well; and their models are easily constructed. Additionally, they are highly flexible compared to their competing methods, since one can select bivariate copulas from a rich variety of 28
29 (parametric) families, including, but not limited to, elliptical, Archimedean, mixture copulas (e.g., BB1, BB6, and so on), etc. As a result, they accommodate positive/negative dependence, upper/lower tail dependence, as well as asymmetries, non-linearities, and non-ellipticities in dependence. These numerous significant advantages make the method of mixtures-of-mixtures (MOM) a very suitable and beneficial approach to modeling dependence in high dimensional spaces. Examining the structure and rating of margin protection insurance policies and modeling them through high-dimensional copula models help efficiently and accurately determine actuarially fair policy premiums. In particular, employing flexible mixtures of parametric distributions together with flexible mixtures of alternative copulas is an appropriate and advantageous approach to modeling dependence for such a high dimensional problem. This is primarily because the rating methodology that accounts for tail dependence, non-linearity, asymmetry, and non-ellipticity in dependence between input prices and output prices can result in better fits and consequently more accurate premiums, and therefore can increase the hedging effectiveness of the MPPs. As shown in the empirical application of this paper, goodness-of-fit tests affirm that the mixtures-of-mixtures method outperform conventional approaches (which are based upon single marginal distributions and the Gaussian copula model). Specifically, among the various types of vine copula models estimated, the results of the Vuong tests indicate that the R-vine model is preferred. The relatively better performance of R-vine copula models can be attributed to the higher degree of flexibility that these models exhibit, primarily because of their less restricted choice of tree structures when optimizing the structure towards attaining the best model of dependence. In fact, there are several reasons to explain why the conventional approaches to determining policy premiums might not be adequate, realistic, or sufficiently flexible to take into account the multivariate aspects of risks involved in farming operations. These include failure to allow for flexibility in modeling marginals as well as failure to account for abnormal and irregular features in dependence such as non-linearity, asymmetry, nonellipticity and tail dependence between input prices and output prices, which are typical of some contexts. As a result, the underlying assumptions based on which the MPP policy premiums are determined are in question in some circumstances, and normal and usual features of dependence should not be taken for granted. Working on such questionable assumptions and fragile premises when pricing margin protection insurance coverage could induce important distortions in the production and marketing decisions of farmers and producers. The U.S. federal crop insurance program is currently the primary mechanism of support to agricultural producers in the United States. The total liability covered by the program is so large that frequently exceeds 100 billion dollars. Thus, the precision and accuracy of the rating methods of insurance premium rates provided by this huge federal program are of crucial importance, as even small deviations from actuarially fair premiums could result in significant distortions from socially desired outcomes, given the extremely large scale of the program as a whole. Assumptions and premises made about the nature of dependencies among different sources of risk, such as variations in output prices and inputs prices and their joint behaviors, in the empirical modeling of an insurance policy could have significant implications for the resulting values of the parameters and operation of the entire program. That is, making an invalid assumption about dependence among random variables could simply lead to misleading implications for the parameters estimated. The mixtures-of-mixtures method proposed in this paper allows modelers to take into account irregular dependence features (i.e., nonlinearity, asymmetry, and non-ellipticity in dependence as well tail dependence) among two or more dependent variables, and also enables modelers to flexibly model marginal distributions of interest by taking advantage of any parametric distribution or any mixtures of parametric distributions for modeling marginals. 25 Then, it will be possible to characterize the accurate policy premium which is not necessarily the same as the premium that is obtained under the unrealistic assumptions about the dependence features. Put differently, it could be either greater or smaller than the premium obtained under the 25. Without copulas, modelers are usually limited to using normal or student s t distributions, which may or may not explain well the frequency of the observations at hand. This freer choice of parametric distributions for modeling marginals will help modelers attain better fits, more predictive and more realistic models, and as a consequence, actuarially fairer premiums. 29
30 unrealistic assumptions, since it is free of those a priori assumptions. 26 Conducting this task is left to be pursued later in future research. Hence, developing a clear understanding of the dependence structure among multiple random variables involved in MP insurance plans is a crucial prerequisite to accurately analyze how financially healthy the insurance plan of interest is likely to function and how the insurance premium should be priced. To this end, the mixtures-of-mixtures method to model multivariate sources of risks would shed light on how dependently the multivariate sources of the risks could behave. Findings of the present paper contribute to the existing knowledge and sizable, growing literature on the U.S. federal crop insurance program, and more specifically on the limited literature on the newly-introduced MP insurance programs. The findings of the paper also aid in the shaping of agricultural economic policies and interventions to enhance the status of agricultural production in the U.S. economy. 6. Conclusion: The U.S. federal crop insurance program is currently the primary mechanism of support to agricultural producers in the United States. The total liability covered by the program is so large that frequently exceeds 100 billion dollars. Thus, the precision and accuracy of the rating methods of the insurance premiums of this huge federal program are of crucial importance, as even small deviations from actuarially fair premiums could result in significant distortions from socially desired outcomes, given the extremely large scale of the program as a whole. Margin Protection Programs (MPPs) are relatively new insurance plans that have been introduced and made available by the USDA s Risk Management Agency (RMA). The attractiveness of these risk management instruments lies in the fact that the financial stability of agricultural production and farming operations is more dependent on margins than solely revenues. This paper examines the structure and rating of margin protection insurance policies. To efficiently and accurately determine actuarially fair policy premiums of MP insurance plans, it is necessary to first model the joint distribution function of input and output prices. The present paper proposes that this task can be effectively carried out using the mixtures-of-mixtures method. The mixtures-of-mixtures method proposed in this paper allows modelers to take into account irregular dependence features (i.e., nonlinearity, asymmetry, and non-ellipticity in dependence as well tail dependence) between two or more dependent variables, and also enables modelers to flexibly model marginal distributions of interest by taking advantage of any mixtures of parametric distributions for modeling marginals. Thereby, it will be possible to characterize the accurate policy premium which does not necessarily turn out to be the same as the premium that is obtained under the unrealistic assumptions about the dependence features (i.e., using the conventional methods). Conducting this last task is left to be pursued in future research later on. 27 Hence, developing a clear understanding of the dependence structure among multiple random variables involved in MP insurance plans is a crucial prerequisite to accurately analyze how financially healthy the insurance plan of interest is likely to function, and how the insurance premium should be priced. To this end, the mixtures-of-mixtures method to model multivariate sources of risks would shed light on how dependently the multivariate sources of the risks 26. The existence of any sizable tail dependence between an input price and the output price, ceteris paribus, will result in a natural hedge, and thereby, accounting for such a tail dependence tends to estimate an actuarially fair premium rate that is lower than that computed using the conventional method (i.e., computed based on the assumption of multivariate normality, which by construction has zero tail dependence). On the other hand, the existence of any sizable upper tail dependence between two input prices, ceteris paribus, will result in a higher degree of risk, and thereby, accounting for such a tail dependence tends to estimate an actuarially fair premium rate that is greater than that computed using the conventional method (i.e., computed on the basis of the assumption of multivariate normality, which has no tail dependence). 27. The next potential steps to advance this study (such as studying indemnities and premiums under the alternative methods, and showing how accounting for irregular dependence features such as tail dependence between input prices and output prices can result in higher levels of accuracy in rating premiums, and therefore higher levels of hedging effectiveness of MPP in the mentioned markets, and showing in what ways failure to account for the irregular dependence features can result in market distortions and inefficiencies) will be left for future research to be pursued later on. 30
31 could behave. In terms of the novelty of the ideas and methods being addressed and used in this paper, as far as the author is aware, it is the first time that a study models portfolio risks using mixtures of mixtures in the context of crop insurance, although it can also be applied for any sort of portfolio analyses. Additionally, though there have recently been very few studies, perhaps one or two, in the area of MP for the dairy market, the empirical application of the present paper is the first one that studies the MP insurance program in the context of the U.S. cattle production market (the LGM-Cattle program). Empirical applications are presented to provide empirical evidence supporting why copula-based modeling should be utilized to model MP insurance premiums. Vine copulas generally create highly flexible copula-based models, since bivariate copulas can easily accommodate complex dependence structures such as asymmetric dependence or strong joint tail behavior. These copula models can accommodate other possible features such as nonzero-tail-dependence, nonlinearity, and non-ellipticity in dependence. According to the results from the empirical applications, the AIC and BIC and LLF criteria confirm that the mixtures-of-mixtures model estimated, i.e. the mixture marginals together with mixture copula within the framework of vine copula models estimated, outperform the corresponding single normal marginals and Gaussian copula models. In sum, the mixtures-of-mixtures approach proposed in the present paper brings about two sets of advantages. As for marginals, using mixture marginal distributions is a parametric alternative for non-parametric distributions, and allows to flexibly model unknown marginal distributions in form of mixtures of well-known distributions, which in turn permits to evaluate the probabilities of events or simulate draws from the unknown distribution, and also allows for a (semi-)parametric modeling approach to one-dimensional cluster analysis of subpopulations in the marginals, which permits and facilitates estimation and hypothesis testing within the framework of standard statistical theory. Taking this estimation approach to modeling marginals also enables researchers to easily characterize existing sub-populations in the marginals by classifying observations, and estimate subpopulation-specific parameters. As for dependence, using mixtures of copulas in the context of vine copulas allows dependence modelers to effectively deal with high-dimensional problems, and easily accommodate complex dependence structures such as asymmetric, nonlinear, and non-elliptical dependence and/or strong joint tail behavior. Compared to their other alternatives for modeling high dimensions, mixture copulas and vine copulas are superior in that have explicit functional forms; their conditioning mechanism yields simulation algorithms as well; and that their models are easily constructed. Additionally, they are highly flexible compared to their competing methods, since one can select bivariate copulas from a rich variety of parametric families, including, but not limited to, elliptical, Archimedean, mixture copulas (e.g., BB1, BB6, and so on), etc., and as a result, they accommodate positive/negative dependence, upper/lower tail dependence, as well as asymmetries, non-linearities, and nonellipticities in dependence. In particular, among the various types of vine copula models estimated, the results of the GOF tests and Vuong tests indicate that the R-vine model is preferred to the C-vine and D-vine models for the empirical application of the present paper. The relatively better performance of R-vine copula models can be attributed to the higher degree of flexibility that these models exhibit, primarily because of their less restricted choice of tree structures when optimizing the dependence structure towards attaining the best model of dependence. To conclude, these numerous massive advantages make the method of mixtures-of-mixtures (MOM) a very suitable and beneficial approach to modeling dependence in high dimensions. The method of mixtures of mixtures as a rating methodology can account for tail dependence, non-linearity, asymmetry, and non-ellipticity in dependence between input prices and output prices, which in turn can result in better fits and consequently more accurate premiums, and therefore can increase the hedging effectiveness of the MPPs. As shown in the empirical applications of this paper, goodness-of-fit tests affirm that the mixtures-of-mixtures method outperform the conventional approaches (which are based on single marginal distributions and the Gaussian copula model). In fact, there are several reasons to explain why the conventional approaches to determining policy premiums might not be adequate, realistic, or sufficiently flexible to take into account the multivariate aspects of risks involved in farming operations. These include failure to allow for flexibility in modeling marginals as well as failure to account for 31
32 abnormal and irregular features in dependence such as non-linearity, asymmetry, non-ellipticity and tail dependence between input prices and output prices, which are typical of some contexts. As a result, the underlying assumptions based on which the MPP policy premiums are determined are in question in some circumstances, and normal and usual features of dependence should not be taken for granted. Working on such fragile assumptions and questionable premises when pricing margin protection insurance coverage could induce important distortions in the production and marketing decisions of farmers and producers. Findings of the present paper contribute to the existing knowledge and sizable, growing literature on the U.S. federal crop insurance program, and more specifically on the limited literature on the newly-introduced MP insurance programs. The findings also aid in the designing of new MP insurance programs, and in the shaping of agricultural economic policies and interventions to enhance the status of agricultural production in the U.S. economy. References: Aas, K., Czado, C., Frigessi, A., & Bakken, H. (2009). Pair-copula constructions of multiple dependence. Insurance: Mathematics and economics, 44(2), Ahmed, M., & Goodwin, B. (2015). Copula-Based Modeling of Dependence Structure among International Food Grain Markets. In 2015 AAEA & WAEA Joint Annual Meeting, July 26-28, San Francisco, California (No ). Agricultural and Applied Economics Association & Western Agricultural Economics Association. Akaike, H. (1998). Information theory and an extension of the maximum likelihood principle. In Selected Papers of Hirotugu Akaike (pp ). Springer New York. Bedford, T., & Cooke, R. M. (2001). Probability density decomposition for conditionally dependent random variables modeled by vines. Annals of Mathematics and Artificial intelligence, 32(1), Bedford, T., & Cooke, R. M. (2002). Vines: A new graphical model for dependent random variables. Annals of Statistics, Benaglia, T., Chauveau, D., Hunter, D., & Young, D. (2009). mixtools: An R package for analyzing finite mixture models. Journal of Statistical Software, 32(6), BERG, D. (2008). USING COPULAS An introduction for practitioners. Norwegian ASTIN Society, Oslo, Norway. Bozic, M. (2014). LGM-Dairy vs. Margin Protection Program: What would work better for you? Dairy Star. Bozic, M., Newton, J., Thraen, C. S., & Gould, B. W. (2014). Tails Curtailed: Accounting for Nonlinear Dependence in Pricing Margin Insurance for Dairy Farmers. American Journal of Agricultural Economics, 96(4), Brechmann, E. C., & Schepsmeier, U. (2013). Modeling dependence with C-and D-vine copulas: The R-package CDVine. Journal of Statistical Software, 52(3), Chen, K. J., & Chen, K. H. (2016). Analysis of Energy and Agricultural Commodity Markets with the Policy Mandated: A Vine Copula-based ARMA-EGARCH Model. In 2016 Annual Meeting, July 31-August 2, 2016, Boston, Massachusetts (No ). Agricultural and Applied Economics Association. Chen, Y. E., & Goodwin, B. K. (2010). The design of multiyear crop insurance contracts. In American Agricultural and Applied Economics Association annual meeting, July (pp ). Erhardt, T. M., Czado, C., & Schepsmeier, U. (2015). R vine models for spatial time series with an application to daily mean temperature. Biometrics, 71(2), Goodwin, B. K., & Hungerford, A. H. (2015). Copula-based models of systemic risk in US. Goodwin, B., and A. Hungerford. (2015). Copula Based Models of Systemic Risk in U.S. Agriculture: Implications for Crop Insurance and Reinsurance Contracts. American Journal of Agricultural Economics 97: Goodwin, B.K., and A.P. Ker. (1998). Nonparametric Estimation of Crop Yield Distributions: Implications for Rating Group Risk Crop Insurance Contracts. American Journal of Agricultural Economics 80: Goodwin, B.K., M.C. Roberts, and K.H. Coble. (2000). Measurement of Price Risk in Revenue Insurance: Implications of Distributional Assumptions. Journal of Agricultural and Resource Economics 25: Joe, H. (1996). Families of m-variate distributions with given margins and m (m-1)/2 bivariate dependence parameters. Lecture Notes-Monograph Series, Joe, H., Li, H., & Nikoloulopoulos, A. K. (2010). Tail dependence functions and vine copulas. Journal of Multivariate Analysis, 101(1),
33 Kessler, D., & McDowell, A. (2012). Introducing the FMM procedure for finite mixture models. In Proceedings of the SAS Global Forum. Krämer, N., & Schepsmeier, U. (2011). Introduction to vine copulas. In NIPS Workshop, Granada. Kurowicka, D., & Cooke, R. M. (2006). Uncertainty analysis with high dimensional dependence modelling. John Wiley & Sons. Leisch, F. (2004). Flexmix: A general framework for finite mixture models and latent glass regression in R. Malsiner-Walli, G., Frühwirth-Schnatter, S., & Grün, B. (2017). Identifying mixtures of mixtures using bayesian estimation. Journal of Computational and Graphical Statistics, 26(2), Moosavian, SAZN. (2017a). Statistical Modeling of Price Risks Using the Multivariate Skewed t-distribution. Manuscript in preparation. Moosavian, SAZN. (2017b). An Atlas of Copula Families: A Guide for Academics and Practitioners. Manuscript in preparation. Nelsen, R. (1998). An Introduction to Copulas. New York: Springer Verlag. Nelson, C.H. (1990). The Influence of Distributional Assumptions on the Calculation of Crop Insurance Premia. North Central Journal of Agricultural Economics 12: Nicklas, S. (2013). Pair Constructions for High-Dimensional Dependence Models in Discrete and Continuous Time (Doctoral dissertation, Universität zu Köln). Okhrin, O., & Ristig, A. (2012). Hierarchical Archimedean copulae: the HAC package (No ). SFB 649 Discussion Paper. Okhrin, O., & Ristig, A. (2012). Hierarchical Archimedean copulae: the HAC package (No ). SFB 649 Discussion Paper. Ramsey, A., Goodwin, B., Ghosh, S. (2016). Rating Exotic Price Coverage in Crop Revenue Insurance. Paper in preparation. Ramsey, F., & Goodwin, B. (2015). Rating Exotic Price Coverage in Crop Revenue Insurance. In 2015 AAEA & WAEA Joint Annual Meeting, July 26-28, San Francisco, California (No ). Agricultural and Applied Economics Association & Western Agricultural Economics Association. Rdrr.io (2017). VineCopula documentation built on May 30, Available at: Risk Management Agency (2017). Livestock Gross Margin Cattle. Available at: Risk Management Agency (2017). Margin Protection for Corn, Rice, Soybeans and Wheat. Available at: Risk Management Agency Federal Crop Insurance Corporation Commodity Year Statistics for 2015: Nationwide Summary By Insurance Plan. Ruppert, D. (2011). Statistics and data analysis for financial engineering (pp ). New York: Springer. Schepsmeier, U., Brechmann, E. C., & Erhardt, M. T. (2015). Package CDVine. Schepsmeier, U., Stoeber, J., Brechmann, E. C., Graeler, B., Nagler, T., Erhardt, T.,... & Killiches, M. (2017). Package VineCopula. Schwarz, G. (1978). Estimating the dimension of a model. The annals of statistics, 6(2), Segers J. (2013). Copulas: An Introduction Part II: Models - Columbia University. Available at: Sklar, A. (1959). Distribution functions of n dimensions and margins. Publications of the Institute of Statistics of the University of Paris, 8, Tran, M. N., Giordani, P., Mun, X., Kohn, R., & Pitt, M. K. (2014). Copula-type estimators for flexible multivariate density modeling using mixtures. Journal of Computational and Graphical Statistics, 23(4), Vuong, Q. H. (1989). Likelihood ratio tests for model selection and non-nested hypotheses. Econometrica: Journal of the Econometric Society, Zeytoon Nejad, S.A. (2017). Copula-Based, Non-linear Modeling of Input Prices and Output Prices for Rating Margin Protection Insurance Coverage: Case of US Grains Markets. Manuscript in preparation. Zhu, Y., Ghosh, S. K., & Goodwin, B. K. (2008, July). Modeling Dependence in the Design of Whole Farm Insurance Contract, A Copula-Based Model Approach. In annual meetings of the American Agricultural Economics Association, Orlando, FL (pp ). 33
34 Appendix 1: Quantitative Investigations on Variables Involved in LGM Protection Insurance Results from Benchmark, Baseline, and Conventional Methods Table 1: Table of Summary Statistics of the Variables of Interest Variable N Mean Std Dev Minimum Maximum p_corn p_fcat p_lcat p_soymeal p_soybean d_corn d_fcat d_lcat d_soymeal d_soybean Table 2: Correlation Matrix of the Variables of Interest Correlation Matrix d_corn d_fcat d_lcat d_soymeal d_soybean d_corn d_fcat d_lcat d_soymeal d_soybean Figure 1: Scatterplot Matrix for the Random Variables Involved in the LGM Insurance Premium Calculations along with Their Histograms and Fitted Normal Densities 34
35 Table 3: Pearson s, Kendall s, and Spearman s Correlation Matrices of the Variables of Interest in the Original Data The COPULA Procedure Model Fit Summary Number of Observations 2997 Data Set WORK.DATA Copula Type Normal Correlation Matrix d_corn d_fcat d_lcat d_soymeal d_soybean d_corn d_fcat d_lcat d_soymeal d_soybean Kendall Correlation Matrix d_corn d_fcat d_lcat d_soymeal d_soybean d_corn d_fcat d_lcat d_soymeal d_soybean Spearman Correlation Matrix d_corn d_fcat d_lcat d_soymeal d_soybean d_corn d_fcat d_lcat d_soymeal d_soybean
 The COPULA")
36 Figure 2: Simulated Normal Copula with Uniform Marginals Scatterplot Matrix of the Original Data Transformed into Uniform Marginals (Copula) The COPULA Procedure 36
37 Table 4: Results for the Fitted t Copula to the Data The COPULA Procedure Model Fit Summary Number of Observations 2997 Data Set WORK.DATA Copula Type T Log Likelihood 2048 Maximum Absolute Gradient E-6 Number of Iterations 10 Optimization Method Newton-Raphson AIC SBC Algorithm converged. Parameter Estimates Parameter Estimate Standard Error t Value Approx Pr > t DF <.0001 Correlation Matrix d_corn d_fcat d_lcat d_soymeal d_soybean d_corn d_fcat d_lcat d_soymeal d_soybean Kendall Correlation Matrix d_corn d_fcat d_lcat d_soymeal d_soybean d_corn d_fcat d_lcat d_soymeal d_soybean
38 Table 5: Results for the Fitted Gumbel and Clayton Copula Models to the Data The COPULA Procedure Model Fit Summary Number of Observations 2997 Data Set WORK.DATA Copula Type Gumbel Log Likelihood Maximum Absolute Gradient E-7 Number of Iterations 5 Optimization Method Newton-Raphson AIC SBC Algorithm converged. Parameter Estimates Parameter Estimate Standard Error t Value Approx Pr > t Theta <.0001 The COPULA Procedure Model Fit Summary Number of Observations 2997 Data Set WORK.DATA Copula Type Clayton Log Likelihood Maximum Absolute Gradient E-10 Number of Iterations 5 Optimization Method Newton-Raphson AIC SBC Algorithm converged. Parameter Estimates Parameter Estimate Standard Error t Value Approx Pr > t Theta <


39 Appendix 2: Quantitative Investigations on Variables Involved in LGM Protection Insurance Results from the Proposed Methods by the Present Paper Figure 1: Results of the Fitted Mixtures of Normal Distributions for the Marginals 39
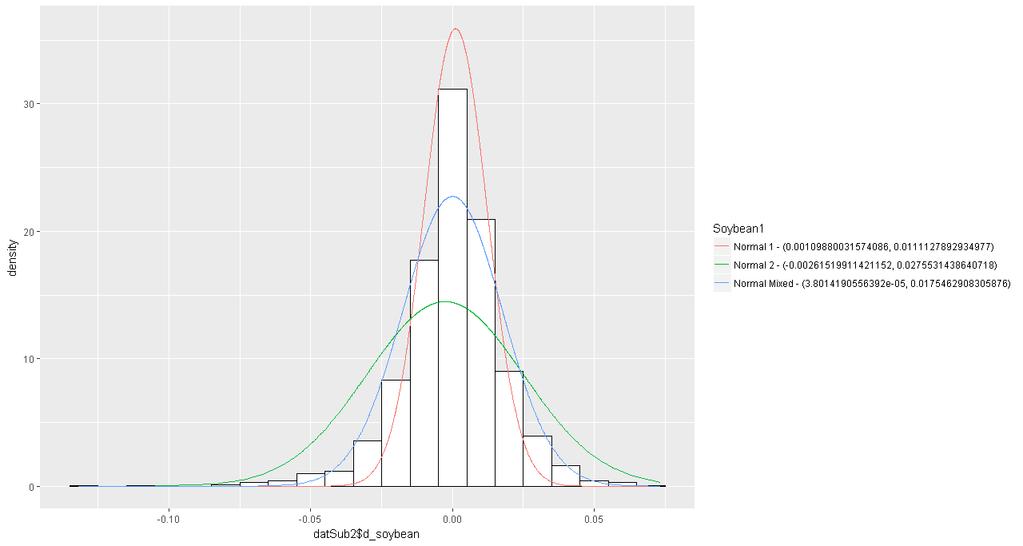
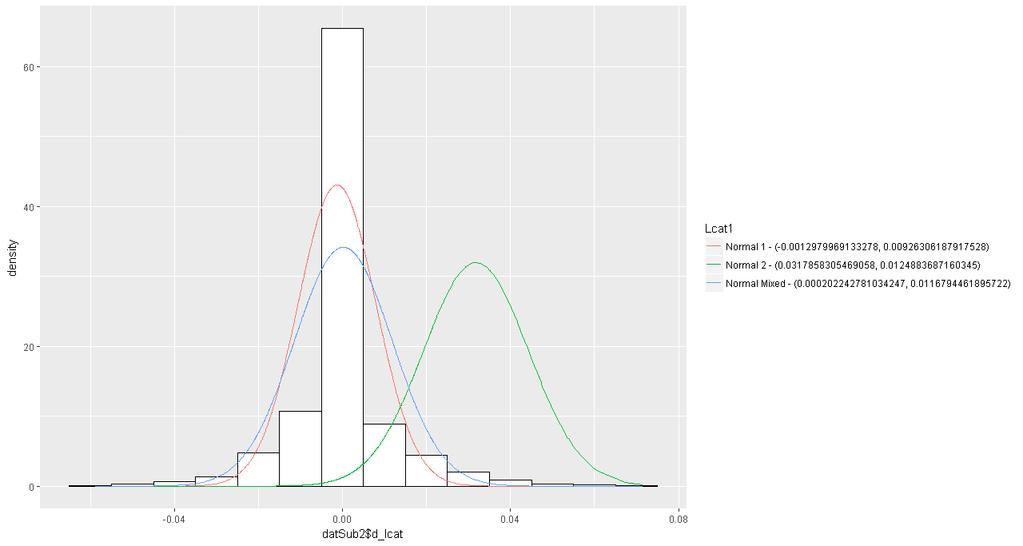
40 40

41 Table 1: Summary Table of the Estimated Parameters of the Mixture, Single, and Individual Normal Curves (mu, sigma, and lambda) 41


42 Figure 2: Underlying Process for Comparing Select Bivariate Copulas to Choose the Best Copula Families 42
43 Figure 3: Pair-Copula Constructions (PCCs), R-Vine Trees, C-Vine Trees, D-Vine Trees, Measures of Goodnessof-Fit, Model Selection, and Parameter Estimation for the Five-Dimensional Empirical Application (The Five-Variable Model) Optimized R-Vine Tree Configuration and Estimated Parameters Table 2: Summary Table of the Estimated Dependence Parameters in R-vine Structure Tree Edge # Family Family Name Par Par2 1 3,2 2 t ,3 224 Tawn2_ ,1 2 t ,4 2 t ,2 ; 3 1 N ,3 ; Tawn2_ ,1 ; 5 2 t ,2 ; 1,3 14 Gumbel_180(SG) ,3 ; 5,1 14 SG ,2 ; 5,1,3 0 I - - Type: R-vine LLF: AIC: BIC: : d_corn 2: d_fcat 3:d_lcat 4:d_soymeal 5:d_soybean 43
44 Optimized C-Vine Tree Configuration and Estimated Parameters Table 3: Summary Table of the Estimated Dependence Parameters in C-vine Structure Tree Edge # Family Family Par Par2 Name 1 1,2 1 Gaussian ,3 5 Frank ,4 2 t ,5 2 t ,2 ; 1,3 2 t ,2 ; 1,4 14 SG ,2 ; 1,5 14 SG ,3 ; 5,2 3 Clayton ,4 ; 3,2 3 Clayton ,3 ; 5,1,2 2 t : d_corn 2: d_fcat 3:d_lcat 4:d_soymeal 5:d_soybean 44
45 Optimized D-Vine Tree Configuration and Estimated Parameters Table 4: Summary Table of the Estimated Dependence Parameters in D-vine Structure Tree Edge # Family Family Name Par par2 1 1,2 1 Gaussian ,3 2 t ,4 3 Clayton ,5 2 t ,5 ; 3,4 5 Frank ,4 ; 2,3 16 SJ ,3 ; 1,2 24 Gumbel_ ,4 ; 3,2 2 t ,3 ; 2,5 2 t ,1 ; 2,3,4 2 t : d_corn 2: d_fcat 3:d_lcat 4:d_soymeal 5:d_soybean 45
46 Figure 4: Pair-Copula Constructions (PCCs), R-Vine Trees, C-Vine Trees, D-Vine Trees, Measures of Goodnessof-Fit, Model Selection, and Parameter Estimation for the Three-Dimensional Empirical Application (The Three-Variable Model) Optimized R-Vine Tree Configuration and Estimated Parameters Table 5: Summary Table of the Estimated Dependence Parameters in R-vine Structure Tree Edge # Family Family Name Par Par2 1 3,1 134 Tawn_ ,2 2 t ,1 ; 3 1 Gaussian Type: R-vine LLF: AIC: BIC: : d_corn 2: d_fcat 3:d_lcat 46
47 Optimized C-Vine Tree Configuration and Estimated Parameters Table 6: Summary Table of the Estimated Dependence Parameters in C-vine Structure Tree Edge # Family Family Name Par par2 1 1,2 1 Gaussian ,3 5 Frank ,2 ; 3 2 t : d_corn 2: d_fcat 3:d_lcat 47
48 Optimized D-Vine Tree Configuration and Estimated Parameters Table 7: Summary Table of the Estimated Dependence Parameters in D-vine Structure Tree Edge # Family Family Name Par par2 1 1,2 1 Gaussian ,3 2 Frank ,3 ; 2 5 t : d_corn 2: d_fcat 3:d_lcat 48

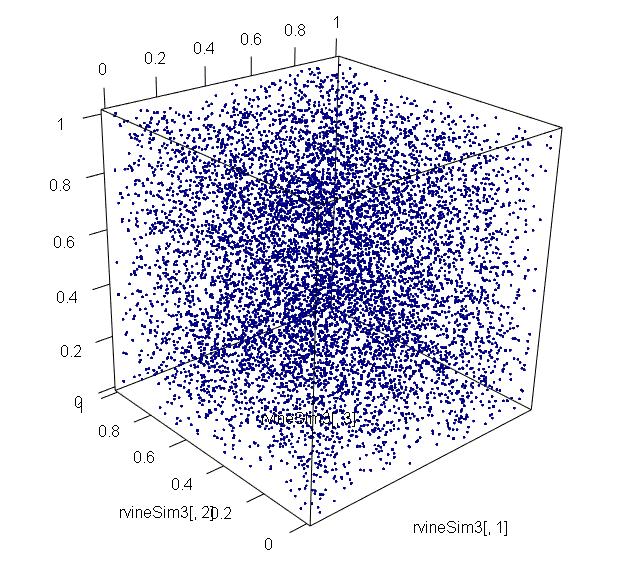
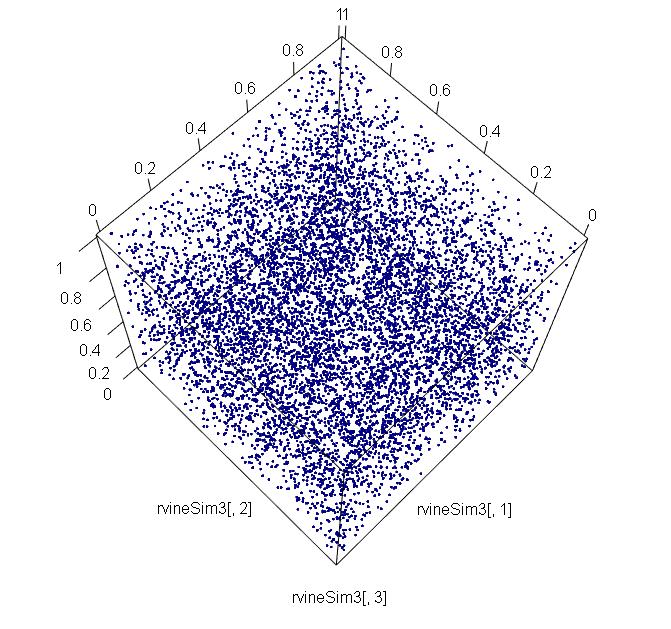
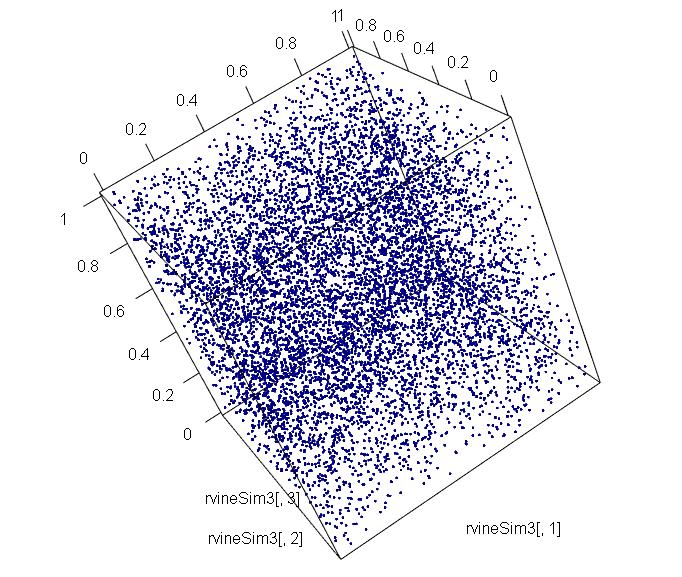
49 Figure 5: General 3D Plots of the Three-Variable Model Simulated from the Three-Dimensional Model Estimated 49
Vine-copula Based Models for Farmland Portfolio Management
 Vine-copula Based Models for Farmland Portfolio Management Xiaoguang Feng Graduate Student Department of Economics Iowa State University xgfeng@iastate.edu Dermot J. Hayes Pioneer Chair of Agribusiness
INTERNATIONAL JOURNAL FOR INNOVATIVE RESEARCH IN MULTIDISCIPLINARY FIELD ISSN Volume - 3, Issue - 2, Feb
 Copula Approach: Correlation Between Bond Market and Stock Market, Between Developed and Emerging Economies Shalini Agnihotri LaL Bahadur Shastri Institute of Management, Delhi, India. Email - agnihotri123shalini@gmail.com
MEASURING PORTFOLIO RISKS USING CONDITIONAL COPULA-AR-GARCH MODEL
 MEASURING PORTFOLIO RISKS USING CONDITIONAL COPULA-AR-GARCH MODEL Isariya Suttakulpiboon MSc in Risk Management and Insurance Georgia State University, 30303 Atlanta, Georgia Email: suttakul.i@gmail.com,
Introduction to vine copulas
 Introduction to vine copulas Nicole Krämer & Ulf Schepsmeier Technische Universität München [kraemer, schepsmeier]@ma.tum.de NIPS Workshop, Granada, December 18, 2011 Krämer & Schepsmeier (TUM) Introduction
Rating Exotic Price Coverage in Crop Revenue Insurance
 Rating Exotic Price Coverage in Crop Revenue Insurance Ford Ramsey North Carolina State University aframsey@ncsu.edu Barry Goodwin North Carolina State University barry_ goodwin@ncsu.edu Selected Paper
2. Copula Methods Background
 1. Introduction Stock futures markets provide a channel for stock holders potentially transfer risks. Effectiveness of such a hedging strategy relies heavily on the accuracy of hedge ratio estimation.
Catastrophic crop insurance effectiveness: does it make a difference how yield losses are conditioned?
 Paper prepared for the 23 rd EAAE Seminar PRICE VOLATILITY AND FARM INCOME STABILISATION Modelling Outcomes and Assessing Market and Policy Based Responses Dublin, February 23-24, 202 Catastrophic crop
Asymmetric Price Transmission: A Copula Approach
 Asymmetric Price Transmission: A Copula Approach Feng Qiu University of Alberta Barry Goodwin North Carolina State University August, 212 Prepared for the AAEA meeting in Seattle Outline Asymmetric price
PROBLEMS OF WORLD AGRICULTURE
 Scientific Journal Warsaw University of Life Sciences SGGW PROBLEMS OF WORLD AGRICULTURE Volume 13 (XXVIII) Number 4 Warsaw University of Life Sciences Press Warsaw 013 Pawe Kobus 1 Department of Agricultural
Chapter 2 Uncertainty Analysis and Sampling Techniques
 Chapter 2 Uncertainty Analysis and Sampling Techniques The probabilistic or stochastic modeling (Fig. 2.) iterative loop in the stochastic optimization procedure (Fig..4 in Chap. ) involves:. Specifying
Operational Risk Modeling
 Operational Risk Modeling RMA Training (part 2) March 213 Presented by Nikolay Hovhannisyan Nikolay_hovhannisyan@mckinsey.com OH - 1 About the Speaker Senior Expert McKinsey & Co Implemented Operational
PORTFOLIO MODELLING USING THE THEORY OF COPULA IN LATVIAN AND AMERICAN EQUITY MARKET
 PORTFOLIO MODELLING USING THE THEORY OF COPULA IN LATVIAN AND AMERICAN EQUITY MARKET Vladimirs Jansons Konstantins Kozlovskis Natala Lace Faculty of Engineering Economics Riga Technical University Kalku
Dependence of commodity spot-futures markets: Helping investors turn profits. Sana BEN KEBAIER PhD Student
 Dependence of commodity spot-futures markets: Helping investors turn profits Sana BEN KEBAIER PhD Student 1 Growth rate of commodity futures open interest Source: CFTC Data Open interest doubels for: corn
Key Words: emerging markets, copulas, tail dependence, Value-at-Risk JEL Classification: C51, C52, C14, G17
 RISK MANAGEMENT WITH TAIL COPULAS FOR EMERGING MARKET PORTFOLIOS Svetlana Borovkova Vrije Universiteit Amsterdam Faculty of Economics and Business Administration De Boelelaan 1105, 1081 HV Amsterdam, The
Modeling Crop prices through a Burr distribution and. Analysis of Correlation between Crop Prices and Yields. using a Copula method
 Modeling Crop prices through a Burr distribution and Analysis of Correlation between Crop Prices and Yields using a Copula method Hernan A. Tejeda Graduate Research Assistant North Carolina State University
Agricultural Outlook Forum Presented: Thursday, February 19, 2004 IMPLICATIONS OF EXTENDING CROP INSURANCE TO LIVESTOCK
 Agricultural Outlook Forum Presented: Thursday, February 19, 2004 IMPLICATIONS OF EXTENDING CROP INSURANCE TO LIVESTOCK Bruce A. Babcock Center for Agricultural and Rural Development Iowa State University
Managing Feed and Milk Price Risk: Futures Markets and Insurance Alternatives
 Managing Feed and Milk Price Risk: Futures Markets and Insurance Alternatives Dillon M. Feuz Department of Applied Economics Utah State University 3530 Old Main Hill Logan, UT 84322-3530 435-797-2296 dillon.feuz@usu.edu
Catastrophe Reinsurance Pricing
 Catastrophe Reinsurance Pricing Science, Art or Both? By Joseph Qiu, Ming Li, Qin Wang and Bo Wang Insurers using catastrophe reinsurance, a critical financial management tool with complex pricing, can
Somali Ghosh Department of Agricultural Economics Texas A&M University 2124 TAMU College Station, TX
 Efficient Estimation of Copula Mixture Models: An Application to the Rating of Crop Revenue Insurance Somali Ghosh Department of Agricultural Economics Texas A&M University 2124 TAMU College Station, TX
MODELING DEPENDENCY RELATIONSHIPS WITH COPULAS
 MODELING DEPENDENCY RELATIONSHIPS WITH COPULAS Joseph Atwood jatwood@montana.edu and David Buschena buschena.@montana.edu SCC-76 Annual Meeting, Gulf Shores, March 2007 REINSURANCE COMPANY REQUIREMENT
Extreme Return-Volume Dependence in East-Asian. Stock Markets: A Copula Approach
 Extreme Return-Volume Dependence in East-Asian Stock Markets: A Copula Approach Cathy Ning a and Tony S. Wirjanto b a Department of Economics, Ryerson University, 350 Victoria Street, Toronto, ON Canada,
A Skewed Truncated Cauchy Logistic. Distribution and its Moments
 International Mathematical Forum, Vol. 11, 2016, no. 20, 975-988 HIKARI Ltd, www.m-hikari.com http://dx.doi.org/10.12988/imf.2016.6791 A Skewed Truncated Cauchy Logistic Distribution and its Moments Zahra
Statistical Modeling Techniques for Reserve Ranges: A Simulation Approach
 Statistical Modeling Techniques for Reserve Ranges: A Simulation Approach by Chandu C. Patel, FCAS, MAAA KPMG Peat Marwick LLP Alfred Raws III, ACAS, FSA, MAAA KPMG Peat Marwick LLP STATISTICAL MODELING
Reinsuring Group Revenue Insurance with. Exchange-Provided Revenue Contracts. Bruce A. Babcock, Dermot J. Hayes, and Steven Griffin
 Reinsuring Group Revenue Insurance with Exchange-Provided Revenue Contracts Bruce A. Babcock, Dermot J. Hayes, and Steven Griffin CARD Working Paper 99-WP 212 Center for Agricultural and Rural Development
Asset Allocation Model with Tail Risk Parity
 Proceedings of the Asia Pacific Industrial Engineering & Management Systems Conference 2017 Asset Allocation Model with Tail Risk Parity Hirotaka Kato Graduate School of Science and Technology Keio University,
PORTFOLIO OPTIMIZATION UNDER MARKET UPTURN AND MARKET DOWNTURN: EMPIRICAL EVIDENCE FROM THE ASEAN-5
 PORTFOLIO OPTIMIZATION UNDER MARKET UPTURN AND MARKET DOWNTURN: EMPIRICAL EVIDENCE FROM THE ASEAN-5 Paweeya Thongkamhong Jirakom Sirisrisakulchai Faculty of Economic, Faculty of Economic, Chiang Mai University
Subject CS1 Actuarial Statistics 1 Core Principles. Syllabus. for the 2019 exams. 1 June 2018
 ` Subject CS1 Actuarial Statistics 1 Core Principles Syllabus for the 2019 exams 1 June 2018 Copyright in this Core Reading is the property of the Institute and Faculty of Actuaries who are the sole distributors.
Optimal Coverage Level and Producer Participation in Supplemental Coverage Option in Yield and Revenue Protection Crop Insurance.
 Optimal Coverage Level and Producer Participation in Supplemental Coverage Option in Yield and Revenue Protection Crop Insurance Shyam Adhikari Associate Director Aon Benfield Selected Paper prepared for
Modeling of Price. Ximing Wu Texas A&M University
 Modeling of Price Ximing Wu Texas A&M University As revenue is given by price times yield, farmers income risk comes from risk in yield and output price. Their net profit also depends on input price, but
An Empirical Analysis of the Dependence Structure of International Equity and Bond Markets Using Regime-switching Copula Model
 An Empirical Analysis of the Dependence Structure of International Equity and Bond Markets Using Regime-switching Copula Model Yuko Otani and Junichi Imai Abstract In this paper, we perform an empirical
UPDATED IAA EDUCATION SYLLABUS
 II. UPDATED IAA EDUCATION SYLLABUS A. Supporting Learning Areas 1. STATISTICS Aim: To enable students to apply core statistical techniques to actuarial applications in insurance, pensions and emerging
Dependence Structure and Extreme Comovements in International Equity and Bond Markets
 Dependence Structure and Extreme Comovements in International Equity and Bond Markets René Garcia Edhec Business School, Université de Montréal, CIRANO and CIREQ Georges Tsafack Suffolk University Measuring
Working Paper October Book Review of
 Working Paper 04-06 October 2004 Book Review of Credit Risk: Pricing, Measurement, and Management by Darrell Duffie and Kenneth J. Singleton 2003, Princeton University Press, 396 pages Reviewer: Georges
Development of a Market Benchmark Price for AgMAS Performance Evaluations. Darrel L. Good, Scott H. Irwin, and Thomas E. Jackson
 Development of a Market Benchmark Price for AgMAS Performance Evaluations by Darrel L. Good, Scott H. Irwin, and Thomas E. Jackson Development of a Market Benchmark Price for AgMAS Performance Evaluations
Modeling Dependence in the Design of Whole Farm Insurance Contract A Copula-Based Model Approach
 Modeling Dependence in the Design of Whole Farm Insurance Contract A Copula-Based Model Approach Ying Zhu Department of Agricultural and Resource Economics North Carolina State University yzhu@ncsu.edu
PRE CONFERENCE WORKSHOP 3
 PRE CONFERENCE WORKSHOP 3 Stress testing operational risk for capital planning and capital adequacy PART 2: Monday, March 18th, 2013, New York Presenter: Alexander Cavallo, NORTHERN TRUST 1 Disclaimer
Risk Measurement of Multivariate Credit Portfolio based on M-Copula Functions*
 based on M-Copula Functions* 1 Network Management Center,Hohhot Vocational College Inner Mongolia, 010051, China E-mail: wangxjhvc@163.com In order to accurately connect the marginal distribution of portfolio
Measuring Risk Dependencies in the Solvency II-Framework. Robert Danilo Molinari Tristan Nguyen WHL Graduate School of Business and Economics
 Measuring Risk Dependencies in the Solvency II-Framework Robert Danilo Molinari Tristan Nguyen WHL Graduate School of Business and Economics 1 Overview 1. Introduction 2. Dependency ratios 3. Copulas 4.
Chapter 1 Microeconomics of Consumer Theory
 Chapter Microeconomics of Consumer Theory The two broad categories of decision-makers in an economy are consumers and firms. Each individual in each of these groups makes its decisions in order to achieve
Publication date: 12-Nov-2001 Reprinted from RatingsDirect
 Publication date: 12-Nov-2001 Reprinted from RatingsDirect Commentary CDO Evaluator Applies Correlation and Monte Carlo Simulation to the Art of Determining Portfolio Quality Analyst: Sten Bergman, New
Chapter 6 Firms: Labor Demand, Investment Demand, and Aggregate Supply
 Chapter 6 Firms: Labor Demand, Investment Demand, and Aggregate Supply We have studied in depth the consumers side of the macroeconomy. We now turn to a study of the firms side of the macroeconomy. Continuing
Market Risk Analysis Volume I
 Market Risk Analysis Volume I Quantitative Methods in Finance Carol Alexander John Wiley & Sons, Ltd List of Figures List of Tables List of Examples Foreword Preface to Volume I xiii xvi xvii xix xxiii
Adjusted Gross Revenue Pilot Insurance Program: Rating Procedure (Report prepared for the Risk Management Agency Board of Directors) J.
 J.") Staff Paper Adjusted Gross Revenue Pilot Insurance Program: Rating Procedure (Report prepared for the Risk Management Agency Board of Directors) J. Roy Black Staff Paper 2000-51 December, 2000 Department
Staff Paper Adjusted Gross Revenue Pilot Insurance Program: Rating Procedure (Report prepared for the Risk Management Agency Board of Directors) J. Roy Black Staff Paper 2000-51 December, 2000 Department
Module 12. Alternative Yield and Price Risk Management Tools for Wheat
 Topics Module 12 Alternative Yield and Price Risk Management Tools for Wheat George Flaskerud, North Dakota State University Bruce A. Babcock, Iowa State University Art Barnaby, Kansas State University
Crop Insurance for Milk? Dairy-Revenue Protection
 Crop Insurance for Milk? Dairy-Revenue Protection Dr. John Newton jnewton@fb.org American Farm Bureau Federation 1 Congress Projected Annual Average Crop Market Value Dairy is the 3 rd Biggest Crop Billion
Todd D. Davis John D. Anderson Robert E. Young. Selected Paper prepared for presentation at the. Agricultural and Applied Economics Association s
 Evaluating the Interaction between Farm Programs with Crop Insurance and Producers Risk Preferences Todd D. Davis John D. Anderson Robert E. Young Selected Paper prepared for presentation at the Agricultural
OPTIMAL PORTFOLIO OF THE GOVERNMENT PENSION INVESTMENT FUND BASED ON THE SYSTEMIC RISK EVALUATED BY A NEW ASYMMETRIC COPULA
 Advances in Science, Technology and Environmentology Special Issue on the Financial & Pension Mathematical Science Vol. B13 (2016.3), 21 38 OPTIMAL PORTFOLIO OF THE GOVERNMENT PENSION INVESTMENT FUND BASED
Farm Level Impacts of a Revenue Based Policy in the 2007 Farm Bill
 Farm Level Impacts of a Revenue Based Policy in the 27 Farm Bill Lindsey M. Higgins, James W. Richardson, Joe L. Outlaw, and J. Marc Raulston Department of Agricultural Economics Texas A&M University College
Market Risk Analysis Volume II. Practical Financial Econometrics
 Market Risk Analysis Volume II Practical Financial Econometrics Carol Alexander John Wiley & Sons, Ltd List of Figures List of Tables List of Examples Foreword Preface to Volume II xiii xvii xx xxii xxvi
Probability and distributions
 2 Probability and distributions The concepts of randomness and probability are central to statistics. It is an empirical fact that most experiments and investigations are not perfectly reproducible. The
Copula-Based Pairs Trading Strategy
 Copula-Based Pairs Trading Strategy Wenjun Xie and Yuan Wu Division of Banking and Finance, Nanyang Business School, Nanyang Technological University, Singapore ABSTRACT Pairs trading is a technique that
[D7] PROBABILITY DISTRIBUTION OF OUTSTANDING LIABILITY FROM INDIVIDUAL PAYMENTS DATA Contributed by T S Wright
![[D7] PROBABILITY DISTRIBUTION OF OUTSTANDING LIABILITY FROM INDIVIDUAL PAYMENTS DATA Contributed by T S Wright](/thumbs/92/107898301.jpg "[D7] PROBABILITY DISTRIBUTION OF OUTSTANDING LIABILITY FROM INDIVIDUAL PAYMENTS DATA Contributed by T S Wright") Faculty and Institute of Actuaries Claims Reserving Manual v.2 (09/1997) Section D7 [D7] PROBABILITY DISTRIBUTION OF OUTSTANDING LIABILITY FROM INDIVIDUAL PAYMENTS DATA Contributed by T S Wright 1. Introduction
Faculty and Institute of Actuaries Claims Reserving Manual v.2 (09/1997) Section D7 [D7] PROBABILITY DISTRIBUTION OF OUTSTANDING LIABILITY FROM INDIVIDUAL PAYMENTS DATA Contributed by T S Wright 1. Introduction
ABSTRACT. RAMSEY, AUSTIN FORD. Empirical Studies in Policy, Prices, and Risk. (Under the direction of Barry Goodwin and Sujit Ghosh.
 ABSTRACT RAMSEY, AUSTIN FORD. Empirical Studies in Policy, Prices, and Risk. (Under the direction of Barry Goodwin and Sujit Ghosh.) This dissertation is composed of essays that explore aspects of agricultural
Master s in Financial Engineering Foundations of Buy-Side Finance: Quantitative Risk and Portfolio Management. > Teaching > Courses
 Master s in Financial Engineering Foundations of Buy-Side Finance: Quantitative Risk and Portfolio Management www.symmys.com > Teaching > Courses Spring 2008, Monday 7:10 pm 9:30 pm, Room 303 Attilio Meucci
Lecture 1: The Econometrics of Financial Returns
 Lecture 1: The Econometrics of Financial Returns Prof. Massimo Guidolin 20192 Financial Econometrics Winter/Spring 2016 Overview General goals of the course and definition of risk(s) Predicting asset returns:
Random Variables and Probability Distributions
 Chapter 3 Random Variables and Probability Distributions Chapter Three Random Variables and Probability Distributions 3. Introduction An event is defined as the possible outcome of an experiment. In engineering
Factors to Consider in Selecting a Crop Insurance Policy. Lawrence L. Falconer and Keith H. Coble 1. Introduction
 Factors to Consider in Selecting a Crop Insurance Policy Lawrence L. Falconer and Keith H. Coble 1 Introduction Cotton producers are exposed to significant risks throughout the production year. These risks
Copulas and credit risk models: some potential developments
 Copulas and credit risk models: some potential developments Fernando Moreira CRC Credit Risk Models 1-Day Conference 15 December 2014 Objectives of this presentation To point out some limitations in some
Comparative Analyses of Expected Shortfall and Value-at-Risk under Market Stress
 Comparative Analyses of Shortfall and Value-at-Risk under Market Stress Yasuhiro Yamai Bank of Japan Toshinao Yoshiba Bank of Japan ABSTRACT In this paper, we compare Value-at-Risk VaR) and expected shortfall
Bloomberg. Portfolio Value-at-Risk. Sridhar Gollamudi & Bryan Weber. September 22, Version 1.0
 Portfolio Value-at-Risk Sridhar Gollamudi & Bryan Weber September 22, 2011 Version 1.0 Table of Contents 1 Portfolio Value-at-Risk 2 2 Fundamental Factor Models 3 3 Valuation methodology 5 3.1 Linear factor
INCREASING THE RATE OF CAPITAL FORMATION (Investment Policy Report)
") policies can increase our supply of goods and services, improve our efficiency in using the Nation's human resources, and help people lead more satisfying lives. INCREASING THE RATE OF CAPITAL FORMATION
policies can increase our supply of goods and services, improve our efficiency in using the Nation's human resources, and help people lead more satisfying lives. INCREASING THE RATE OF CAPITAL FORMATION
This item is the archived peer-reviewed author-version of:
 This item is the archived peer-reviewed author-version of: Impact of probability distributions on real options valuation Reference: Peters Linda.- Impact of probability distributions on real options valuation
Dealing with Downside Risk in Energy Markets: Futures versus Exchange-Traded Funds. Panit Arunanondchai
 Dealing with Downside Risk in Energy Markets: Futures versus Exchange-Traded Funds Panit Arunanondchai Ph.D. Candidate in Agribusiness and Managerial Economics Department of Agricultural Economics, Texas
Tail Risk, Systemic Risk and Copulas
 Tail Risk, Systemic Risk and Copulas 2010 CAS Annual Meeting Andy Staudt 09 November 2010 2010 Towers Watson. All rights reserved. Outline Introduction Motivation flawed assumptions, not flawed models
3.4 Copula approach for modeling default dependency. Two aspects of modeling the default times of several obligors
 3.4 Copula approach for modeling default dependency Two aspects of modeling the default times of several obligors 1. Default dynamics of a single obligor. 2. Model the dependence structure of defaults
Correlation and Diversification in Integrated Risk Models
 Correlation and Diversification in Integrated Risk Models Alexander J. McNeil Department of Actuarial Mathematics and Statistics Heriot-Watt University, Edinburgh A.J.McNeil@hw.ac.uk www.ma.hw.ac.uk/ mcneil
ADVANCED OPERATIONAL RISK MODELLING IN BANKS AND INSURANCE COMPANIES
 Small business banking and financing: a global perspective Cagliari, 25-26 May 2007 ADVANCED OPERATIONAL RISK MODELLING IN BANKS AND INSURANCE COMPANIES C. Angela, R. Bisignani, G. Masala, M. Micocci 1
Sharpe Ratio over investment Horizon
 Sharpe Ratio over investment Horizon Ziemowit Bednarek, Pratish Patel and Cyrus Ramezani December 8, 2014 ABSTRACT Both building blocks of the Sharpe ratio the expected return and the expected volatility
Measurement of Price Risk in Revenue Insurance: 1 Introduction Implications of Distributional Assumptions A variety of crop revenue insurance programs
 Measurement of Price Risk in Revenue Insurance: Implications of Distributional Assumptions Matthew C. Roberts, Barry K. Goodwin, and Keith Coble May 14, 1998 Abstract A variety of crop revenue insurance
Course information FN3142 Quantitative finance
 Course information 015 16 FN314 Quantitative finance This course is aimed at students interested in obtaining a thorough grounding in market finance and related empirical methods. Prerequisite If taken
Asymmetric Information in Cotton Insurance Markets: Evidence from Texas
 1 AAEA Selected Paper AAEA Meetings, Long Beach, California, July 27-31, 2002 Asymmetric Information in Cotton Insurance Markets: Evidence from Texas Shiva S. Makki The Ohio State University and Economic
Uncertainty Analysis with UNICORN
 Uncertainty Analysis with UNICORN D.A.Ababei D.Kurowicka R.M.Cooke D.A.Ababei@ewi.tudelft.nl D.Kurowicka@ewi.tudelft.nl R.M.Cooke@ewi.tudelft.nl Delft Institute for Applied Mathematics Delft University
Subject CS2A Risk Modelling and Survival Analysis Core Principles
 ` Subject CS2A Risk Modelling and Survival Analysis Core Principles Syllabus for the 2019 exams 1 June 2018 Copyright in this Core Reading is the property of the Institute and Faculty of Actuaries who
Lazard Insights. The Art and Science of Volatility Prediction. Introduction. Summary. Stephen Marra, CFA, Director, Portfolio Manager/Analyst
 Lazard Insights The Art and Science of Volatility Prediction Stephen Marra, CFA, Director, Portfolio Manager/Analyst Summary Statistical properties of volatility make this variable forecastable to some
IEOR E4602: Quantitative Risk Management
 IEOR E4602: Quantitative Risk Management Basic Concepts and Techniques of Risk Management Martin Haugh Department of Industrial Engineering and Operations Research Columbia University Email: martin.b.haugh@gmail.com
Bivariate Birnbaum-Saunders Distribution
 Department of Mathematics & Statistics Indian Institute of Technology Kanpur January 2nd. 2013 Outline 1 Collaborators 2 3 Birnbaum-Saunders Distribution: Introduction & Properties 4 5 Outline 1 Collaborators
1.1 Some Apparently Simple Questions 0:2. q =p :
 Chapter 1 Introduction 1.1 Some Apparently Simple Questions Consider the constant elasticity demand function 0:2 q =p : This is a function because for each price p there is an unique quantity demanded
Modeling Co-movements and Tail Dependency in the International Stock Market via Copulae
 Modeling Co-movements and Tail Dependency in the International Stock Market via Copulae Katja Ignatieva, Eckhard Platen Bachelier Finance Society World Congress 22-26 June 2010, Toronto K. Ignatieva, E.
The Role of Market Prices by
 The Role of Market Prices by Rollo L. Ehrich University of Wyoming The primary function of both cash and futures prices is the coordination of economic activity. Prices are the signals that guide business
An Introduction to Copulas with Applications
 An Introduction to Copulas with Applications Svenska Aktuarieföreningen Stockholm 4-3- Boualem Djehiche, KTH & Skandia Liv Henrik Hult, University of Copenhagen I Introduction II Introduction to copulas
Revenue Equivalence and Income Taxation
 Journal of Economics and Finance Volume 24 Number 1 Spring 2000 Pages 56-63 Revenue Equivalence and Income Taxation Veronika Grimm and Ulrich Schmidt* Abstract This paper considers the classical independent
Axioma Research Paper No January, Multi-Portfolio Optimization and Fairness in Allocation of Trades
 Axioma Research Paper No. 013 January, 2009 Multi-Portfolio Optimization and Fairness in Allocation of Trades When trades from separately managed accounts are pooled for execution, the realized market-impact
Operational risk Dependencies and the Determination of Risk Capital
 Operational risk Dependencies and the Determination of Risk Capital Stefan Mittnik Chair of Financial Econometrics, LMU Munich & CEQURA finmetrics@stat.uni-muenchen.de Sandra Paterlini EBS Universität
Methods and Procedures. Abstract
 ARE CURRENT CROP AND REVENUE INSURANCE PRODUCTS MEETING THE NEEDS OF TEXAS COTTON PRODUCERS J. E. Field, S. K. Misra and O. Ramirez Agricultural and Applied Economics Department Lubbock, TX Abstract An
Towards the end of 2012, at the
 Changes Are Coming to U.S. Dairy Policy Joseph V. Balagtas, Daniel A. Sumner, and Jisang Yu Dairy farms have faced bouts of very low margins of milk prices over feed costs, and new subsidies propose to
درس هفتم یادگیري ماشین. (Machine Learning) دانشگاه فردوسی مشهد دانشکده مهندسی رضا منصفی
 دانشگاه فردوسی مشهد دانشکده مهندسی رضا منصفی") یادگیري ماشین توزیع هاي نمونه و تخمین نقطه اي پارامترها Sampling Distributions and Point Estimation of Parameter (Machine Learning) دانشگاه فردوسی مشهد دانشکده مهندسی رضا منصفی درس هفتم 1 Outline Introduction
یادگیري ماشین توزیع هاي نمونه و تخمین نقطه اي پارامترها Sampling Distributions and Point Estimation of Parameter (Machine Learning) دانشگاه فردوسی مشهد دانشکده مهندسی رضا منصفی درس هفتم 1 Outline Introduction
Evaluating Alternative Safety Net Programs in Alberta: A Firm-level Simulation Analysis. Scott R. Jeffrey and Frank S. Novak.
 RURAL ECONOMY Evaluating Alternative Safety Net Programs in Alberta: A Firm-level Simulation Analysis Scott R. Jeffrey and Frank S. Novak Staff Paper 99-03 STAFF PAPER Department of Rural Economy Faculty
Hedging Effectiveness around USDA Crop Reports by Andrew McKenzie and Navinderpal Singh
 Hedging Effectiveness around USDA Crop Reports by Andrew McKenzie and Navinderpal Singh Suggested citation format: McKenzie, A., and N. Singh. 2008. Hedging Effectiveness around USDA Crop Reports. Proceedings
ESTIMATION OF MODIFIED MEASURE OF SKEWNESS. Elsayed Ali Habib *
 Electronic Journal of Applied Statistical Analysis EJASA, Electron. J. App. Stat. Anal. (2011), Vol. 4, Issue 1, 56 70 e-issn 2070-5948, DOI 10.1285/i20705948v4n1p56 2008 Università del Salento http://siba-ese.unile.it/index.php/ejasa/index
Pricing & Risk Management of Synthetic CDOs
 Pricing & Risk Management of Synthetic CDOs Jaffar Hussain* j.hussain@alahli.com September 2006 Abstract The purpose of this paper is to analyze the risks of synthetic CDO structures and their sensitivity
The mean-variance portfolio choice framework and its generalizations
 The mean-variance portfolio choice framework and its generalizations Prof. Massimo Guidolin 20135 Theory of Finance, Part I (Sept. October) Fall 2014 Outline and objectives The backward, three-step solution
Leasing and Debt in Agriculture: A Quantile Regression Approach
 Leasing and Debt in Agriculture: A Quantile Regression Approach Farzad Taheripour, Ani L. Katchova, and Peter J. Barry May 15, 2002 Contact Author: Ani L. Katchova University of Illinois at Urbana-Champaign
PARAMETRIC AND NON-PARAMETRIC BOOTSTRAP: A SIMULATION STUDY FOR A LINEAR REGRESSION WITH RESIDUALS FROM A MIXTURE OF LAPLACE DISTRIBUTIONS
 PARAMETRIC AND NON-PARAMETRIC BOOTSTRAP: A SIMULATION STUDY FOR A LINEAR REGRESSION WITH RESIDUALS FROM A MIXTURE OF LAPLACE DISTRIBUTIONS Melfi Alrasheedi School of Business, King Faisal University, Saudi
This article is the second of a two-part series addressing credit risk
 DOWN ON THE FARM Stress-Testing Net cash farm income of U.S. farmers in 1999, thanks to record level direct government payments received from Washington, was virtually identical to the $57.5 billion achieved
Program on Dairy Markets and Policy Information Letter Series
 Program on Dairy Markets and Policy Information Letter Series MILC Sign-up, LGM-Dairy, and Planning for the October 2011 to September 2012 Fiscal Year Information Letter Number 11-01 September 2011 Andrew
Getting Started with CGE Modeling
 Getting Started with CGE Modeling Lecture Notes for Economics 8433 Thomas F. Rutherford University of Colorado January 24, 2000 1 A Quick Introduction to CGE Modeling When a students begins to learn general
Proposed Farm Bill Impact On The Optimal Hedge Ratios For Crops. Trang Tran. Keith H. Coble. Ardian Harri. Barry J. Barnett. John M.
 Proposed Farm Bill Impact On The Optimal Hedge Ratios For Crops Trang Tran Keith H. Coble Ardian Harri Barry J. Barnett John M. Riley Department of Agricultural Economics Mississippi State University Selected
Crop Insurance and Disaster Assistance
 Crop Insurance and Disaster Assistance Joy Harwood, Economic Research Service, USDA James L. Novak, Auburn University Background The 1996 Federal Agricultural Improvement and Reform (FAIR) Act implemented
Measuring Risk in Canadian Portfolios: Is There a Better Way?
 J.P. Morgan Asset Management (Canada) Measuring Risk in Canadian Portfolios: Is There a Better Way? May 2010 On the Non-Normality of Asset Classes Serial Correlation Fat left tails Converging Correlations
CFA Level I - LOS Changes
 CFA Level I - LOS Changes 2018-2019 Topic LOS Level I - 2018 (529 LOS) LOS Level I - 2019 (525 LOS) Compared Ethics 1.1.a explain ethics 1.1.a explain ethics Ethics Ethics 1.1.b 1.1.c describe the role