Rating Exotic Price Coverage in Crop Revenue Insurance
|
|
|
- Dora Newman
- 5 years ago
- Views:
Transcription
1 Rating Exotic Price Coverage in Crop Revenue Insurance Ford Ramsey North Carolina State University Barry Goodwin North Carolina State University barry_ Selected Paper prepared for presentation at the 2015 Agricultural and Applied Economics Association and Western Agricultural Economics Association Annual Meeting, San Francisco, CA, July Copyright 2015 by Ford Ramsey and Barry Goodwin. All rights reserved. Readers may make verbatim copies of this document for non commercial purposes by any means, provided that this copyright notice appears on all such copies. 1
2 Crop revenue coverage has continued to expand since its introduction in the 1990s and now accounts for roughly 85 percent of the $110 billion total insured value in the federal crop insurance program. The vast majority of this type of insurance is sold with a harvest price replacement feature that pays indemnities on lost yields at the higher of the projected or the realized harvest price. Because of the public private nature of the heavily subsidized program, private companies that market and service the insurance policies cannot compete on insurance offerings covered under the federal program. Terms of coverage and premium rates are identical across these companies or approved insurance providers. One dimension of the federal program that offers potential for more flexible private products is the price dimension: the manner in which prices that determine insurance guarantees are set. In the federal program, price discovery for most major crops in important growing areas is determined using a planting time futures price (typically the February average) of a harvest time futures contract (typically the October average of a November or December contract). However, a one size fits all approach to establishing price guarantees may not align with the needs of individual producers. A form of insurance that provides flexibility around this point involves establishing coverage on the basis of a maximum of prices observed over a fixed interval. For example, one might envision coverage that establishes a projected price guarantee using the highest observed value of a futures contract between January and May. Coverage could also be based on other functions of prices like geometric or arithmetic averages. There are a number of conceptual approaches to measuring the risks associated with averages and order statistics. Options on extrema are often termed exotic options. The pricing of such exotics is an important area of financial research that requires the analyst to grapple with a number of dependencies. Zhang [8] provides a clear overview of the pricing of exotic options. It is possible to approach this problem in the crop insurance context by considering individual months. This leads to a multivariate distribution with important dependencies among the individual monthly average prices. Alternatively, one may approach the problem in terms of the joint distribution of the maximum over an interval and the harvest time price. In this paper, we model the joint distributions using copula functions that capture tail dependence. Though we have made some assumptions on the form of the copula for convenience, it would be relatively easy to draw on a wide variety of copulas. Higher ordered but less flexible multivariate copulas that incorporate dependencies among a range of individual quotes spread over time are considered. Initial results indicate that dependence structures for policies with exotic price coverage are complex. However, it is possible to price these policies in a simple way using available financial and statistical tools. These policies provide an appealing alternative to standard revenue insurance offered under the federal crop insurance program. 1 Pricing Revenue Insurance As the federal crop insurance program has grown in size, farmers have migrated toward the purchase of revenue insurance policies. Traditional insurance against crop yields does not necessarily protect the farmer from low prices. Though prices and yields typically have an inverse relationship, often termed the natural hedge, it is possible for simultaneous declines to occur. Revenue insurance allows the farmer to protect himself from falling yields and falling prices. The most recent Farm Bill expanded federal crop insurance by adding a Supplemental Coverage Option on top of existing revenue insurance policies and calling for the development of additional insurance programs. One of the most widespread revenue insurance products is revenue protection (RP) insurance. Coverage is available for both enterprise and whole farm units. The premium on these policies is calculated using the planting time futures price but includes an adjustment to account for the possibility of a higher harvest time price. For crop insurance to be actuarially sound, policies must be priced accurately. Ideally, pricing would occur at the actuarially fair rate where the premium on the policy is equal to expected loss. The true expected loss is rarely known and must be estimated. This estimation process depends on probability distributions of, in the case of revenue insurance, both yields and prices. We abstract from consideration of the relationship between yields and prices to focus explicitly on dependence in prices alone. As noted, this is one dimension where private insurance companies can offer policies that differ from those stipulated under Federal crop insurance. There are several reasons why such policies may be more attractive from the farmer s perspective. From a behavioral standpoint, the purchase of insurance policies based on maxima are no regret. The farmer is paid at the best possible price over the interval. In the case of coverage that depends on an average of prices, the distributions of such averages may have favorable properties. The average of many independent and identically distributed random variables will have a smaller variance that the individual random variables themselves. Policies built around these averages could offer a cheaper way for farmer s to insure against price risk. There may also be complex interactions between these types of policies and the type of 2
3 expectations specifications described by Just and Rausser [5]. When estimating probability distributions in the context of price risk, it is possible to take either financial or purely statistical approaches. Financial pricing (market based) typically relies on financial theory for the distribution of prices. The Risk Management Agency (RMA) has employed this technique in their ratemaking. For example, volatility may be estimated from observed futures prices and then used in simulations under the assumption that prices are distributed lognormally. The assumption of lognormality follows the use of the Black Scholes model. In contrast to financial pricing, we make use of what might be termed a purely statistical approach. No underlying distribution of prices is assumed. Distributions are chosen based on fit criteria and the statistical properties of prices. While we primarily consider statistical approaches in this paper aside from our copula simulations we are engaged in a broader effort to rate exotic price coverage under both paradigms. 2 Statistical Approaches To measure price risk under the types of exotic price coverage we propose, it is necessary to be able to accurately estimate joint distributions of several statistics that are functions of prices. Actuarial soundness of the insurance program depends on this assessment. Because our present application uses a statistical approach, we do not rely on economic theory that would imply distributional assumptions for prices. The accuracy of the statistical approach depends on its flexibility. We would like to be able to capture idiosyncrasies in the marginal distributions and dependence structures of these functions of prices. In our first pricing exercise, we estimate eight different models using a variety of univariate distributions. The goodness of fit of these models is captured by statistics that are functions of the likelihood or the empirical cumulative distribution function. Given a vector of data x of size n, and a distribution function with k parameters, the formulas in Table 1 are used to calculate the fit statistics. The first three statistics are based on the likelihood function L, while the latter three are based on comparison of the empirical distribution function (EDF ) and the cumulative distribution function (CDF ). Fit Criteria Statistic Acronym Formula Akaike Information Criterion AIC 2 log (L) + 2p Corrected Akaike Information Criterion AICC 2 log (L) + 2np n p 1 Scwarz Bayesian Information Criterion BIC 2 log (L) + p log (n) Kolmogorov Smirnov KS sup x EDF CDF Anderson Darling AD n (EDF CDF ) 2 CDF (1 CDF ) dcdf Cramér von Mises CvM n (EDF CDF )2 dcdf Table 1: Fit Statistics and Formulas The first eight models do not capture joint dependence between monthly average prices. We also estimate four models based on copulas, allowing us to account for this structure. Copulas have recently seen increased application in crop insurance. Goodwin and Hungerford [3] applied copula models to investigate dependence between yields and prices. A copula is a function that joins two or more marginal distributions to form a single joint distribution. Comprehensive treatments of the theory of copulas can be found in Cherubini, Luciano, and Vecchiato [2] and Joe [4] while one of the earliest works on copulas was by Sklar [7]. In what follows, we make use of the Student s t or t copula, which is a member of the elliptical copula family. This copula is a generalization of a multivariate t distribution and is able to capture dependence in extreme values of prices. The t copula is C(u) = F 1 v (u1) F 1 v (un Γ( v+n 2 ) ( 1 + x P 1 ) v+n 2 x dx (1) Γ v 2 (πv)n P v where v is the degrees of freedom, P is the correlation matrix, d is the number of dimensions of the copula, Γ( ) is the gamma function, x is a vector of data, and Fv 1 are the marginal quantile functions. It is well known that the Gaussian copula is tail independent. The t copula is tail dependent and is generally more flexible than the Gaussian in terms of the dependence structures it can capture. However, it does impose symmetry in the tails of the distribution. A brief overview of the features of the t copula is given by McNeil and 3
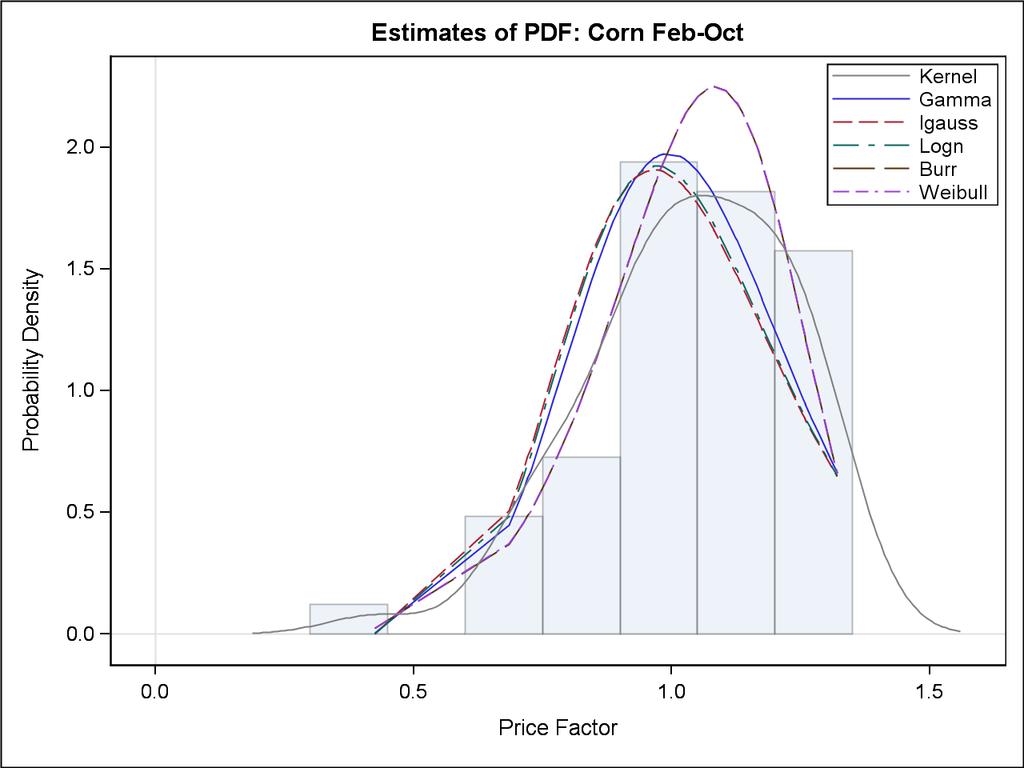
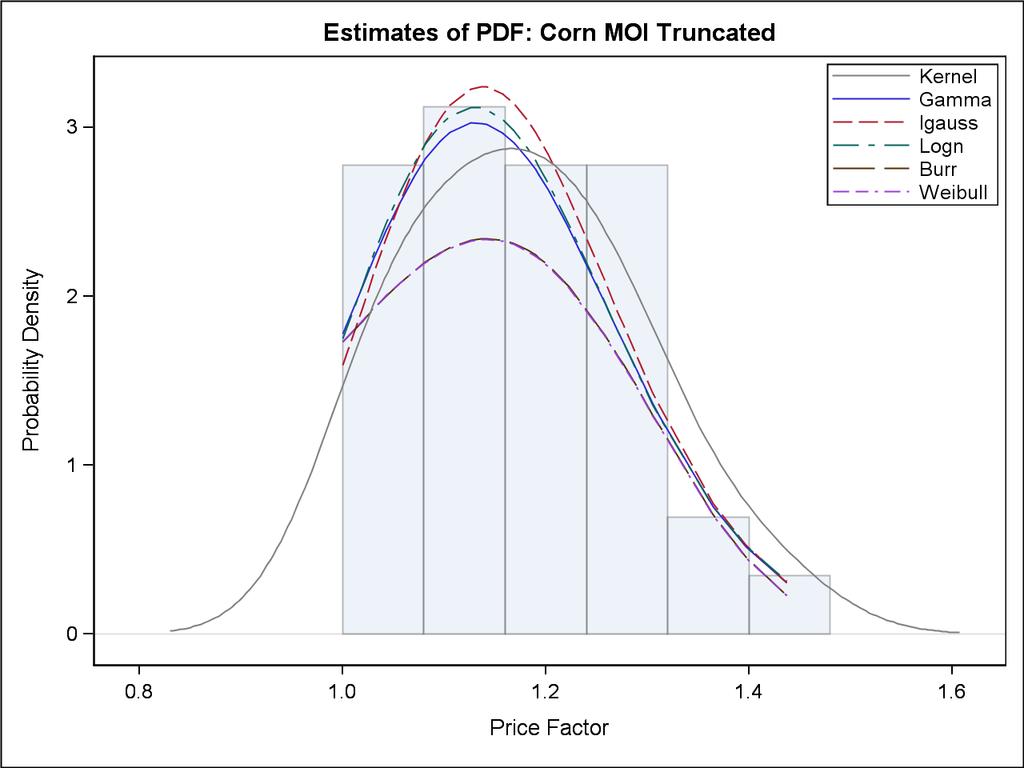
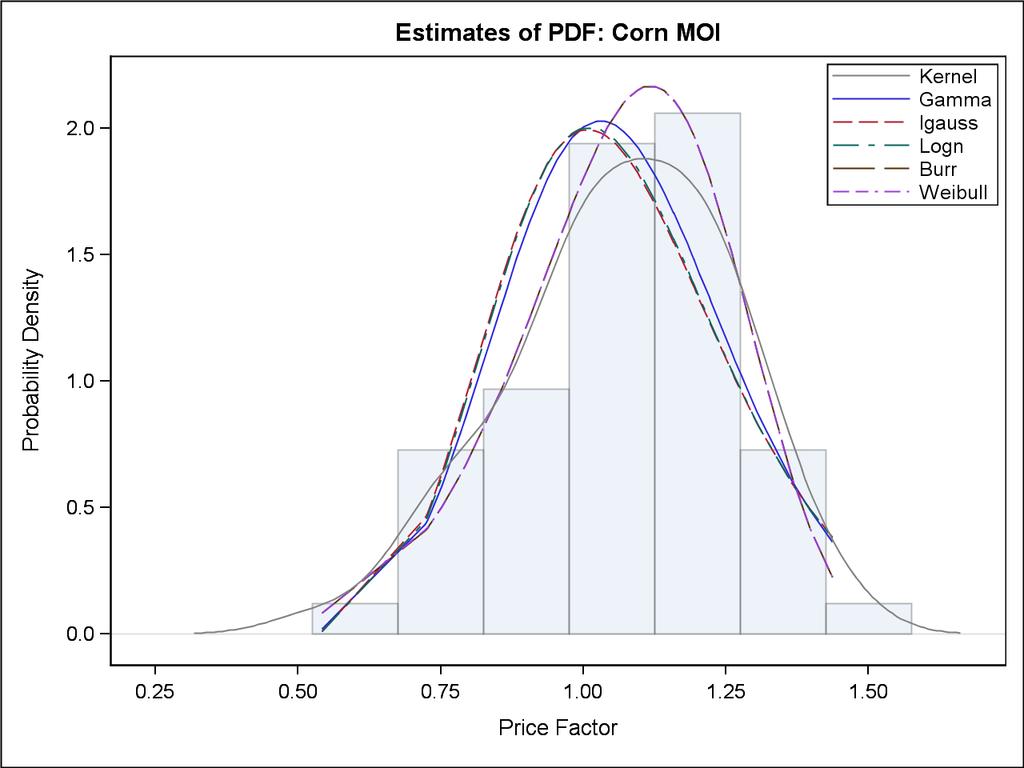
4 Demarta [6]. While this paper concentrates on a single copula, there are other copulas that could be applied to this problem and we plan to investigate this issue. 3 Maximum Over an Interval The data consists of monthly averages for corn and soybean futures contracts from 1960 to 2014 from the Chicago Board of Trade. Two types of price instruments are considered. Under the first, the insurer pays the higher of the February or October average futures price. Under the second price instrument, the insurer pays the higher of the average contract price in October or the maximum of the average prices in January, February, March, or April. We will refer to the first instrument as the Feb Oct instrument and the second as the Maximum Over Interval (MOI) instrument. Prices are normalized about one so that the price charged for coverage is The normalizations used to construct the price factors (PF) are Coverage Price = (P F 1) Commodity Price (2) P F =1 + log P F P O (3) P F =1 + log max(p J, P F, P M, P A ) P O (4) where PF is the price factor for a given year and P ( ) is the monthly average price in January, February, March, April, or October. The construction in equation 3 is used for the Feb Oct instrument and equation 4 for the MOI instrument. Because we do not rely on an assumed distribution of prices, we first fit various probability distributions to these price factors. There are two types of price instruments and two commodities, giving four models. We also varied the observable history of prices. Each of the four previously mentioned models was applied to both the full history of prices and a truncated history of prices. In the latter case, the history of price factors is left truncated at one. This accounts for the possibility that the price factors may not be observable to certain parties when the price factor is less than one. After varying the data history, there are a total of eight models estimated in this initial exercise. Burr, inverse Gaussian, lognormal, gamma, and Weibull distributions were fit to each set of price factors. These distributions were chosen because they can capture various types of tail behavior. Estimates of the probability density functions for each model are given in Figure 1. A comparison of the estimated cumulative distribution functions with the empirical CDF is shown in Figure 2. The effect of truncation depends largely on the choice of underlying distribution. Lognormal and inverse Gaussian distributions for truncated data tend to have over accentuated modes. The Weibull distribution is fairly consistent across truncated and full data situations. The best distribution for each model was selected according to fit statistics including the Akaike information criterion (AIC), corrected Akaike information criterion (AICC), Schwarz Bayesian information criterion (BIC), Kolmogorov-Smirnov statistic (KS), Anderson-Darling statistic (AD), and Cramér-von Mises statistic (CvM). Fit statistics for each model with a Feb Oct price instrument are shown in Table 3. Table 4 contains fit statistics for the models with MOI price instruments. In most cases the Weibull distribution has best fit. The primary exception is the estimate using the full history for the MOI contract for soybeans. In this case the gamma distribution fits best. For some models the Burr distribution is selected for several criteria. In the cases where it is not clear which distribution is best, we default to the Weibull distribution. Table 2 gives the parameter estimates for the best distribution for each model. (5) Parameter Estimates Price Factor Parameter Estimate Standard Error t Value Approx Pr > t Corn Feb-Oct Truncated Corn Feb-Oct Soybeans Feb-Oct Truncated Theta <.0001 Tau Theta <.0001 Tau <.0001 Theta <.0001 Tau
5 Parameter Estimates Price Factor Parameter Estimate Standard Error t Value Approx Pr > t Soybeans Feb-Oct Corn MOI Truncated Corn MOI Soybeans MOI Truncated Soybeans MOI Theta <.0001 Tau <.0001 Theta <.0001 Tau Theta <.0001 Tau <.0001 Theta <.0001 Tau Theta <.0001 Alpha <.0001 Table 2: Parameter Estimates for Selected Distributions In addition to the eight models given above, we also generate four models based on copulas. We consider both price instruments and both crops. The exercise for pricing the copula based models is slightly different from previous methods. Instead of fitting distributions to observed price factors, we model the joint distribution of the average prices from each month. Price factors are generated through simulation following estimation of the copulas. This modeling approach is able to capture additional information and incorporate it into the estimation process. Accounting for dependence among monthly average prices suggests increased accuracy in ratemaking. We fit a t copula to both corn and soybean average monthly futures prices for January, February, March, April and October. The empirical CDF was used to transform the data prior to estimation. Parameter estimates and correlation matrices for each crop are shown in Table5. Correlation between October and the other months is generally stronger for corn than soybeans. Correlation among the first four months of the year is fairly similar across crops. Scatter diagrams are shown in Figures 3 and 4. Note that in these diagrams p0 denotes the October price, p9 the January price, p8 the February price, and so on. The degrees of freedom parameter v that is estimated for each copula is also a general measure of dependence structures. As the degrees of freedom increase, the t copula converges to the Gaussian copula. Less degrees of freedom implies an increase in the probability that an extreme event will occur. The degrees of freedom estimates of for corn and for soybeans suggest that the probability of a tail event is greater for soybeans. For the first eight models, pricing is accomplished via simulation with 10,000 draws taken from the quantile function of the best fitting distribution. Table 6 gives the mean of all price factors and the mean of price factors greater than one. Standard deviations for each group are also shown. For the copula models, 10,000 draws are taken from the copulas and then raw prices are constructed assuming that prices follow a lognormal distribution with a mean of 400 and variance of 0.2. To make the price factors from the copula models comparable with those from the initial eight models, add one to each factor. Initial results show that the way coverage is constructed, and the assumptions embedded in the parameters, can have a significant effect on the pricing of insurance contracts. In many cases, the mean price factors for the copula based models and the initial eight models are considerably different. This difference is economically significant when viewed with respect to the amount of money in crop insurance programs. These types of insurance contracts may also be appealing to private insurers. However, the viability of exotic price coverage in crop insurance will ultimately depend on proper assessment of risk. 5
6 Table 3: Fit Statistics for Feb-Oct Price Factors All Fit Statistics: Corn Feb-Oct Truncated Igauss Logn * Burr * * Weibull * * * * All Fit Statistics: Corn Feb-Oct Gamma Igauss Logn Burr * * * Weibull * * * * All Fit Statistics: Soybeans Feb-Oct Truncated Igauss Logn * Burr Weibull * * * * * * All Fit Statistics: Soybeans Feb-Oct Gamma Igauss Logn Burr * * * * Weibull * * *
7 Table 4: Fit Statistics for MOI Price Factors All Fit Statistics: Corn MOI Truncated Gamma Igauss Logn Burr * Weibull * * * * * * All Fit Statistics: Corn MOI Gamma Igauss Logn Burr * * Weibull * * * * * All Fit Statistics: Soybeans MOI Truncated Gamma Igauss Logn Burr Weibull * * * * * * * All Fit Statistics: Soybeans MOI Gamma * * * Igauss Logn Burr * * * * Weibull

8 Figure 1: PDF Plots 8
9 Figure 2: CDF Plots 9
10 Parameter Estimates: Corn Parameter Estimate Standard Error t Value Approx Pr > t DF Parameter Estimates: Soybeans Parameter Estimate Standard Error t Value Approx Pr > t DF Correlation Matrix: Corn Oct Apr Mar Feb Jan Oct Apr Mar Feb Jan Correlation Matrix: Soybeans Oct Apr Mar Feb Jan Oct Apr Mar Feb Jan Table 5: Copula Parameter Estimates and Correlation Matrices 10
11 Figure 3: Copula Scatter Diagrams 11
12 Figure 4: Copula Scatter Diagrams 12
13 Pricing Estimates from Initial Eight Models Model Mean PF Mean PF 1 SD PF SD PF 1 Corn Feb-Oct Truncated Corn Feb-Oct Soybeans Feb-Oct Truncated Soybeans Feb-Oct Corn MOI Truncated Corn MOI Soybeans MOI Truncated Soybeans MOI Table 6 Pricing Estimates from Copula Based Models Model Mean Feb-Oct PF Mean MOI PF SD Feb-Oct PF SD MOI PF Corn Copula Soybeans Copula Table 7 4 Conclusion Though we have only examined price instruments based on a maximum of prices over an interval, similar application of these techniques will also allow us to price contracts based on averages of prices. The statistical approach to this problem shows that these contracts can be constructed fairly easily. In forthcoming work we will expand on these issues, consider different types of policies, and also compare statistical approaches with financial approaches based on asset pricing theory (e.g Black Scholes). In addition to developing these types of crop insurance policies, it would be useful to have a better understanding of the way that farmers choose insurance policies and manage risk. The expected utility model has received some criticism based on several studies showing observed behavior that does not conform to its predictions. As described by Buschena [1], choice patterns may violate transitivity and individuals views of risk may depend on reference points. In either case, challenges to the expected utility model will have implications for crop insurance programs. We would be interested in seeing how the demand for various types of policies could change under different modeling approaches and assumptions. References [1] David Buschena. Non Expected Utility: What Do the Anomalies Mean for Risk in Agriculture? In Richard Just and Rulon Pope, editors, A Comprehensive Assessment of the Role of Risk in U.S. Agriculture, pages Kluwer, Boston, [2] Umberto Cherubini, Elisa Luciano, and Walter Vecchiato. Copula methods in finance. John Wiley and Sons, Chichester, [3] Barry Goodwin and Ashley Hungerford. Copula Based Models of Systemic Risk in U.S. Agriculture: Implications for Crop Insurance and Reinsurance Contracts. American Journal of Agricultural Economics, 97(3): , [4] Harry Joe. Multivariate Models and Dependence Concepts. Chapman and Hall, London, [5] Richard Just and Gordon Rausser. Conceptual Foundations of Expectations and Implications for Estimation of Risk Behavior. In Richard Just and Rulon Pope, editors, A Comprehensive Assessment of the Role of Risk in U.S. Agriculture, pages Kluwer, Boston,
14 [6] Alexander McNeil and Stefano Demarta. The t Copula and Related Copulas. International Statistical Review, 73(1): , [7] Abe Sklar. Distribution Functions in n Dimensions and Their Margins. Statistics Publications, University of Paris, 8: , [8] Peter Zhang. Exotic Options. World Scientific, Singapore,
MEASURING PORTFOLIO RISKS USING CONDITIONAL COPULA-AR-GARCH MODEL
 MEASURING PORTFOLIO RISKS USING CONDITIONAL COPULA-AR-GARCH MODEL Isariya Suttakulpiboon MSc in Risk Management and Insurance Georgia State University, 30303 Atlanta, Georgia Email: suttakul.i@gmail.com,
Modeling Dependence in the Design of Whole Farm Insurance Contract A Copula-Based Model Approach
 Modeling Dependence in the Design of Whole Farm Insurance Contract A Copula-Based Model Approach Ying Zhu Department of Agricultural and Resource Economics North Carolina State University yzhu@ncsu.edu
Vine-copula Based Models for Farmland Portfolio Management
 Vine-copula Based Models for Farmland Portfolio Management Xiaoguang Feng Graduate Student Department of Economics Iowa State University xgfeng@iastate.edu Dermot J. Hayes Pioneer Chair of Agribusiness
PORTFOLIO OPTIMIZATION AND SHARPE RATIO BASED ON COPULA APPROACH
 VOLUME 6, 01 PORTFOLIO OPTIMIZATION AND SHARPE RATIO BASED ON COPULA APPROACH Mária Bohdalová I, Michal Gregu II Comenius University in Bratislava, Slovakia In this paper we will discuss the allocation
2. Copula Methods Background
 1. Introduction Stock futures markets provide a channel for stock holders potentially transfer risks. Effectiveness of such a hedging strategy relies heavily on the accuracy of hedge ratio estimation.
Loss Simulation Model Testing and Enhancement
 Loss Simulation Model Testing and Enhancement Casualty Loss Reserve Seminar By Kailan Shang Sept. 2011 Agenda Research Overview Model Testing Real Data Model Enhancement Further Development Enterprise
Financial Models with Levy Processes and Volatility Clustering
 Financial Models with Levy Processes and Volatility Clustering SVETLOZAR T. RACHEV # YOUNG SHIN ICIM MICHELE LEONARDO BIANCHI* FRANK J. FABOZZI WILEY John Wiley & Sons, Inc. Contents Preface About the
Asymmetric Price Transmission: A Copula Approach
 Asymmetric Price Transmission: A Copula Approach Feng Qiu University of Alberta Barry Goodwin North Carolina State University August, 212 Prepared for the AAEA meeting in Seattle Outline Asymmetric price
Copulas and credit risk models: some potential developments
 Copulas and credit risk models: some potential developments Fernando Moreira CRC Credit Risk Models 1-Day Conference 15 December 2014 Objectives of this presentation To point out some limitations in some
Modeling Co-movements and Tail Dependency in the International Stock Market via Copulae
 Modeling Co-movements and Tail Dependency in the International Stock Market via Copulae Katja Ignatieva, Eckhard Platen Bachelier Finance Society World Congress 22-26 June 2010, Toronto K. Ignatieva, E.
Optimal Coverage Level and Producer Participation in Supplemental Coverage Option in Yield and Revenue Protection Crop Insurance.
 Optimal Coverage Level and Producer Participation in Supplemental Coverage Option in Yield and Revenue Protection Crop Insurance Shyam Adhikari Associate Director Aon Benfield Selected Paper prepared for
Frequency Distribution Models 1- Probability Density Function (PDF)
") Models 1- Probability Density Function (PDF) What is a PDF model? A mathematical equation that describes the frequency curve or probability distribution of a data set. Why modeling? It represents and summarizes
Models 1- Probability Density Function (PDF) What is a PDF model? A mathematical equation that describes the frequency curve or probability distribution of a data set. Why modeling? It represents and summarizes
MODELING DEPENDENCY RELATIONSHIPS WITH COPULAS
 MODELING DEPENDENCY RELATIONSHIPS WITH COPULAS Joseph Atwood jatwood@montana.edu and David Buschena buschena.@montana.edu SCC-76 Annual Meeting, Gulf Shores, March 2007 REINSURANCE COMPANY REQUIREMENT
Fitting financial time series returns distributions: a mixture normality approach
 Fitting financial time series returns distributions: a mixture normality approach Riccardo Bramante and Diego Zappa * Abstract Value at Risk has emerged as a useful tool to risk management. A relevant
Cambridge University Press Risk Modelling in General Insurance: From Principles to Practice Roger J. Gray and Susan M.
 adjustment coefficient, 272 and Cramér Lundberg approximation, 302 existence, 279 and Lundberg s inequality, 272 numerical methods for, 303 properties, 272 and reinsurance (case study), 348 statistical
INTERNATIONAL JOURNAL FOR INNOVATIVE RESEARCH IN MULTIDISCIPLINARY FIELD ISSN Volume - 3, Issue - 2, Feb
 Copula Approach: Correlation Between Bond Market and Stock Market, Between Developed and Emerging Economies Shalini Agnihotri LaL Bahadur Shastri Institute of Management, Delhi, India. Email - agnihotri123shalini@gmail.com
PROBLEMS OF WORLD AGRICULTURE
 Scientific Journal Warsaw University of Life Sciences SGGW PROBLEMS OF WORLD AGRICULTURE Volume 13 (XXVIII) Number 4 Warsaw University of Life Sciences Press Warsaw 013 Pawe Kobus 1 Department of Agricultural
**BEGINNING OF EXAMINATION** A random sample of five observations from a population is:
 **BEGINNING OF EXAMINATION** 1. You are given: (i) A random sample of five observations from a population is: 0.2 0.7 0.9 1.1 1.3 (ii) You use the Kolmogorov-Smirnov test for testing the null hypothesis,
Master s in Financial Engineering Foundations of Buy-Side Finance: Quantitative Risk and Portfolio Management. > Teaching > Courses
 Master s in Financial Engineering Foundations of Buy-Side Finance: Quantitative Risk and Portfolio Management www.symmys.com > Teaching > Courses Spring 2008, Monday 7:10 pm 9:30 pm, Room 303 Attilio Meucci
A Copula-GARCH Model of Conditional Dependencies: Estimating Tehran Market Stock. Exchange Value-at-Risk
 Journal of Statistical and Econometric Methods, vol.2, no.2, 2013, 39-50 ISSN: 1792-6602 (print), 1792-6939 (online) Scienpress Ltd, 2013 A Copula-GARCH Model of Conditional Dependencies: Estimating Tehran
Modeling Crop prices through a Burr distribution and. Analysis of Correlation between Crop Prices and Yields. using a Copula method
 Modeling Crop prices through a Burr distribution and Analysis of Correlation between Crop Prices and Yields using a Copula method Hernan A. Tejeda Graduate Research Assistant North Carolina State University
Market Volatility and Risk Proxies
 Market Volatility and Risk Proxies... an introduction to the concepts 019 Gary R. Evans. This slide set by Gary R. Evans is licensed under a Creative Commons Attribution-NonCommercial-ShareAlike 4.0 International
Centre for Computational Finance and Economic Agents WP Working Paper Series. Steven Simon and Wing Lon Ng
 Centre for Computational Finance and Economic Agents WP033-08 Working Paper Series Steven Simon and Wing Lon Ng The Effect of the Real-Estate Downturn on the Link between REIT s and the Stock Market October
A New Hybrid Estimation Method for the Generalized Pareto Distribution
 A New Hybrid Estimation Method for the Generalized Pareto Distribution Chunlin Wang Department of Mathematics and Statistics University of Calgary May 18, 2011 A New Hybrid Estimation Method for the GPD
Pricing Multi-asset Equity Options Driven by a Multidimensional Variance Gamma Process Under Nonlinear Dependence Structures
 Pricing Multi-asset Equity Options Driven by a Multidimensional Variance Gamma Process Under Nonlinear Dependence Structures Komang Dharmawan Department of Mathematics, Udayana University, Indonesia. Orcid:
TITLE: EVALUATION OF OPTIMUM REGRET DECISIONS IN CROP SELLING 1
 TITLE: EVALUATION OF OPTIMUM REGRET DECISIONS IN CROP SELLING 1 AUTHORS: Lynn Lutgen 2, Univ. of Nebraska, 217 Filley Hall, Lincoln, NE 68583-0922 Glenn A. Helmers 2, Univ. of Nebraska, 205B Filley Hall,
Operational Risk Modeling
 Operational Risk Modeling RMA Training (part 2) March 213 Presented by Nikolay Hovhannisyan Nikolay_hovhannisyan@mckinsey.com OH - 1 About the Speaker Senior Expert McKinsey & Co Implemented Operational
Joseph O. Marker Marker Actuarial Services, LLC and University of Michigan CLRS 2011 Meeting. J. Marker, LSMWP, CLRS 1
 Joseph O. Marker Marker Actuarial Services, LLC and University of Michigan CLRS 2011 Meeting J. Marker, LSMWP, CLRS 1 Expected vs Actual Distribu3on Test distribu+ons of: Number of claims (frequency) Size
Catastrophic crop insurance effectiveness: does it make a difference how yield losses are conditioned?
 Paper prepared for the 23 rd EAAE Seminar PRICE VOLATILITY AND FARM INCOME STABILISATION Modelling Outcomes and Assessing Market and Policy Based Responses Dublin, February 23-24, 202 Catastrophic crop
Subject CS1 Actuarial Statistics 1 Core Principles. Syllabus. for the 2019 exams. 1 June 2018
 ` Subject CS1 Actuarial Statistics 1 Core Principles Syllabus for the 2019 exams 1 June 2018 Copyright in this Core Reading is the property of the Institute and Faculty of Actuaries who are the sole distributors.
Extreme Return-Volume Dependence in East-Asian. Stock Markets: A Copula Approach
 Extreme Return-Volume Dependence in East-Asian Stock Markets: A Copula Approach Cathy Ning a and Tony S. Wirjanto b a Department of Economics, Ryerson University, 350 Victoria Street, Toronto, ON Canada,
Market Risk Analysis Volume IV. Value-at-Risk Models
 Market Risk Analysis Volume IV Value-at-Risk Models Carol Alexander John Wiley & Sons, Ltd List of Figures List of Tables List of Examples Foreword Preface to Volume IV xiii xvi xxi xxv xxix IV.l Value
Economic Capital Modeling with SAS Econometrics
 Paper SAS2114-2018 Economic Capital Modeling with SAS Econometrics Mahesh V. Joshi, SAS Institute Inc. ABSTRACT A statistical approach to developing an economic capital model requires estimation of the
Dependence Structure between TOURISM and TRANS Sector Indices of the Stock Exchange of Thailand
 Thai Journal of Mathematics (2014) 199 210 Special Issue on : Copula Mathematics and Econometrics http://thaijmath.in.cmu.ac.th Online ISSN 1686-0209 Dependence Structure between TOURISM and TRANS Sector
CAS Course 3 - Actuarial Models
 CAS Course 3 - Actuarial Models Before commencing study for this four-hour, multiple-choice examination, candidates should read the introduction to Materials for Study. Items marked with a bold W are available
A Comparison Between Skew-logistic and Skew-normal Distributions
 MATEMATIKA, 2015, Volume 31, Number 1, 15 24 c UTM Centre for Industrial and Applied Mathematics A Comparison Between Skew-logistic and Skew-normal Distributions 1 Ramin Kazemi and 2 Monireh Noorizadeh
Modelling Operational Risk using Extreme Value Theory and Skew t-copulas via Bayesian Inference using SAS
 Paper 3359-2015 Modelling Operational Risk using Extreme Value Theory and Skew t-copulas via Bayesian Inference using SAS ABSTRACT Betty Johanna Garzon Rozo, Business School, The University of Edinburgh,
Market Risk Analysis Volume I
 Market Risk Analysis Volume I Quantitative Methods in Finance Carol Alexander John Wiley & Sons, Ltd List of Figures List of Tables List of Examples Foreword Preface to Volume I xiii xvi xvii xix xxiii
Analysis of truncated data with application to the operational risk estimation
 Analysis of truncated data with application to the operational risk estimation Petr Volf 1 Abstract. Researchers interested in the estimation of operational risk often face problems arising from the structure
Catastrophe Risk Capital Charge: Evidence from the Thai Non-Life Insurance Industry
 American Journal of Economics 2015, 5(5): 488-494 DOI: 10.5923/j.economics.20150505.08 Catastrophe Risk Capital Charge: Evidence from the Thai Non-Life Insurance Industry Thitivadee Chaiyawat *, Pojjanart
Dynamic Copula Methods in Finance
 Dynamic Copula Methods in Finance Umberto Cherubini Fabio Gofobi Sabriea Mulinacci Silvia Romageoli A John Wiley & Sons, Ltd., Publication Contents Preface ix 1 Correlation Risk in Finance 1 1.1 Correlation
Using Fractals to Improve Currency Risk Management Strategies
 Using Fractals to Improve Currency Risk Management Strategies Michael K. Lauren Operational Analysis Section Defence Technology Agency New Zealand m.lauren@dta.mil.nz Dr_Michael_Lauren@hotmail.com Abstract
CFA Level I - LOS Changes
 CFA Level I - LOS Changes 2018-2019 Topic LOS Level I - 2018 (529 LOS) LOS Level I - 2019 (525 LOS) Compared Ethics 1.1.a explain ethics 1.1.a explain ethics Ethics Ethics 1.1.b 1.1.c describe the role
A Skewed Truncated Cauchy Logistic. Distribution and its Moments
 International Mathematical Forum, Vol. 11, 2016, no. 20, 975-988 HIKARI Ltd, www.m-hikari.com http://dx.doi.org/10.12988/imf.2016.6791 A Skewed Truncated Cauchy Logistic Distribution and its Moments Zahra
AMSTERDAM BOSTON HEIDELBERG LONDON NEW YORK OXFORD PARIS SAN DIEGO SAN FRANCISCO SINGAPORE SYDNEY TOKYO Academic Press is an Imprint of Elsevier
 Computational Finance Using C and C# Derivatives and Valuation SECOND EDITION George Levy ELSEVIER AMSTERDAM BOSTON HEIDELBERG LONDON NEW YORK OXFORD PARIS SAN DIEGO SAN FRANCISCO SINGAPORE SYDNEY TOKYO
Distortion operator of uncertainty claim pricing using weibull distortion operator
 ISSN: 2455-216X Impact Factor: RJIF 5.12 www.allnationaljournal.com Volume 4; Issue 3; September 2018; Page No. 25-30 Distortion operator of uncertainty claim pricing using weibull distortion operator
Understanding Cotton Producer s Crop Insurance Choices Under the 2014 Farm Bill
 Understanding Cotton Producer s Crop Insurance Choices Under the 2014 Farm Bill Corresponding Author: Kishor P. Luitel Department of Agricultural and Applied Economics Texas Tech University Lubbock, Texas.
Financial Time Series and Their Characteristics
 Financial Time Series and Their Characteristics Egon Zakrajšek Division of Monetary Affairs Federal Reserve Board Summer School in Financial Mathematics Faculty of Mathematics & Physics University of Ljubljana
Todd D. Davis John D. Anderson Robert E. Young. Selected Paper prepared for presentation at the. Agricultural and Applied Economics Association s
 Evaluating the Interaction between Farm Programs with Crop Insurance and Producers Risk Preferences Todd D. Davis John D. Anderson Robert E. Young Selected Paper prepared for presentation at the Agricultural
ABSTRACT. RAMSEY, AUSTIN FORD. Empirical Studies in Policy, Prices, and Risk. (Under the direction of Barry Goodwin and Sujit Ghosh.
 ABSTRACT RAMSEY, AUSTIN FORD. Empirical Studies in Policy, Prices, and Risk. (Under the direction of Barry Goodwin and Sujit Ghosh.) This dissertation is composed of essays that explore aspects of agricultural
Describing Uncertain Variables
 Describing Uncertain Variables L7 Uncertainty in Variables Uncertainty in concepts and models Uncertainty in variables Lack of precision Lack of knowledge Variability in space/time Describing Uncertainty
Market risk measurement in practice
 Lecture notes on risk management, public policy, and the financial system Allan M. Malz Columbia University 2018 Allan M. Malz Last updated: October 23, 2018 2/32 Outline Nonlinearity in market risk Market
Financial Risk Management
 Financial Risk Management Professor: Thierry Roncalli Evry University Assistant: Enareta Kurtbegu Evry University Tutorial exercices #3 1 Maximum likelihood of the exponential distribution 1. We assume
PORTFOLIO OPTIMIZATION UNDER MARKET UPTURN AND MARKET DOWNTURN: EMPIRICAL EVIDENCE FROM THE ASEAN-5
 PORTFOLIO OPTIMIZATION UNDER MARKET UPTURN AND MARKET DOWNTURN: EMPIRICAL EVIDENCE FROM THE ASEAN-5 Paweeya Thongkamhong Jirakom Sirisrisakulchai Faculty of Economic, Faculty of Economic, Chiang Mai University
Lindner, Szimayer: A Limit Theorem for Copulas
 Lindner, Szimayer: A Limit Theorem for Copulas Sonderforschungsbereich 386, Paper 433 (2005) Online unter: http://epub.ub.uni-muenchen.de/ Projektpartner A Limit Theorem for Copulas Alexander Lindner Alexander
SYLLABUS OF BASIC EDUCATION SPRING 2018 Construction and Evaluation of Actuarial Models Exam 4
 The syllabus for this exam is defined in the form of learning objectives that set forth, usually in broad terms, what the candidate should be able to do in actual practice. Please check the Syllabus Updates
CFA Level I - LOS Changes
 CFA Level I - LOS Changes 2017-2018 Topic LOS Level I - 2017 (534 LOS) LOS Level I - 2018 (529 LOS) Compared Ethics 1.1.a explain ethics 1.1.a explain ethics Ethics 1.1.b describe the role of a code of
Dealing with Downside Risk in Energy Markets: Futures versus Exchange-Traded Funds. Panit Arunanondchai
 Dealing with Downside Risk in Energy Markets: Futures versus Exchange-Traded Funds Panit Arunanondchai Ph.D. Candidate in Agribusiness and Managerial Economics Department of Agricultural Economics, Texas
Statistical Modeling Techniques for Reserve Ranges: A Simulation Approach
 Statistical Modeling Techniques for Reserve Ranges: A Simulation Approach by Chandu C. Patel, FCAS, MAAA KPMG Peat Marwick LLP Alfred Raws III, ACAS, FSA, MAAA KPMG Peat Marwick LLP STATISTICAL MODELING
A UNIFIED APPROACH FOR PROBABILITY DISTRIBUTION FITTING WITH FITDISTRPLUS
 A UNIFIED APPROACH FOR PROBABILITY DISTRIBUTION FITTING WITH FITDISTRPLUS M-L. Delignette-Muller 1, C. Dutang 2,3 1 VetAgro Sud Campus Vétérinaire - Lyon 2 ISFA - Lyon, 3 AXA GRM - Paris, 1/15 12/08/2011
Page 2 Vol. 10 Issue 7 (Ver 1.0) August 2010
 August 2010") Page 2 Vol. 1 Issue 7 (Ver 1.) August 21 GJMBR Classification FOR:1525,1523,2243 JEL:E58,E51,E44,G1,G24,G21 P a g e 4 Vol. 1 Issue 7 (Ver 1.) August 21 variables rather than financial marginal variables
Page 2 Vol. 1 Issue 7 (Ver 1.) August 21 GJMBR Classification FOR:1525,1523,2243 JEL:E58,E51,E44,G1,G24,G21 P a g e 4 Vol. 1 Issue 7 (Ver 1.) August 21 variables rather than financial marginal variables
EXTREME CYBER RISKS AND THE NON-DIVERSIFICATION TRAP
 EXTREME CYBER RISKS AND THE NON-DIVERSIFICATION TRAP Martin Eling Werner Schnell 1 This Version: August 2017 Preliminary version Please do not cite or distribute ABSTRACT As research shows heavy tailedness
Innovative Hedging and Financial Services: Using Price Protection to Enhance the Availability of Agricultural Credit
 Innovative Hedging and Financial Services: Using Price Protection to Enhance the Availability of Agricultural Credit by Francesco Braga and Brian Gear Suggested citation format: Braga, F., and B. Gear.
Value at Risk with Stable Distributions
 Value at Risk with Stable Distributions Tecnológico de Monterrey, Guadalajara Ramona Serrano B Introduction The core activity of financial institutions is risk management. Calculate capital reserves given
FAV i R This paper is produced mechanically as part of FAViR. See for more information.
 The POT package By Avraham Adler FAV i R This paper is produced mechanically as part of FAViR. See http://www.favir.net for more information. Abstract This paper is intended to briefly demonstrate the
Reinsuring Group Revenue Insurance with. Exchange-Provided Revenue Contracts. Bruce A. Babcock, Dermot J. Hayes, and Steven Griffin
 Reinsuring Group Revenue Insurance with Exchange-Provided Revenue Contracts Bruce A. Babcock, Dermot J. Hayes, and Steven Griffin CARD Working Paper 99-WP 212 Center for Agricultural and Rural Development
Proposed Farm Bill Impact On The Optimal Hedge Ratios For Crops. Trang Tran. Keith H. Coble. Ardian Harri. Barry J. Barnett. John M.
 Proposed Farm Bill Impact On The Optimal Hedge Ratios For Crops Trang Tran Keith H. Coble Ardian Harri Barry J. Barnett John M. Riley Department of Agricultural Economics Mississippi State University Selected
Selecting Copulas for Risk Management
 Selecting Copulas for Risk Management Erik Kole a, Kees Koedijk b,c, and Marno Verbeek b a Econometric Institute, Erasmus School of Economics and Business Economics, Erasmus University Rotterdam, The Netherlands
KARACHI UNIVERSITY BUSINESS SCHOOL UNIVERSITY OF KARACHI BS (BBA) VI
 VI") 88 P a g e B S ( B B A ) S y l l a b u s KARACHI UNIVERSITY BUSINESS SCHOOL UNIVERSITY OF KARACHI BS (BBA) VI Course Title : STATISTICS Course Number : BA(BS) 532 Credit Hours : 03 Course 1. Statistical
88 P a g e B S ( B B A ) S y l l a b u s KARACHI UNIVERSITY BUSINESS SCHOOL UNIVERSITY OF KARACHI BS (BBA) VI Course Title : STATISTICS Course Number : BA(BS) 532 Credit Hours : 03 Course 1. Statistical
P VaR0.01 (X) > 2 VaR 0.01 (X). (10 p) Problem 4
 > 2 VaR 0.01 (X). (10 p) Problem 4") KTH Mathematics Examination in SF2980 Risk Management, December 13, 2012, 8:00 13:00. Examiner : Filip indskog, tel. 790 7217, e-mail: lindskog@kth.se Allowed technical aids and literature : a calculator,
KTH Mathematics Examination in SF2980 Risk Management, December 13, 2012, 8:00 13:00. Examiner : Filip indskog, tel. 790 7217, e-mail: lindskog@kth.se Allowed technical aids and literature : a calculator,
Financial Econometrics Notes. Kevin Sheppard University of Oxford
 Financial Econometrics Notes Kevin Sheppard University of Oxford Monday 15 th January, 2018 2 This version: 22:52, Monday 15 th January, 2018 2018 Kevin Sheppard ii Contents 1 Probability, Random Variables
Tail Risk, Systemic Risk and Copulas
 Tail Risk, Systemic Risk and Copulas 2010 CAS Annual Meeting Andy Staudt 09 November 2010 2010 Towers Watson. All rights reserved. Outline Introduction Motivation flawed assumptions, not flawed models
Measuring Asymmetric Price Transmission in the U.S. Hog/Pork Markets: A Dynamic Conditional Copula Approach. Feng Qiu and Barry K.
 Measuring Asymmetric Price Transmission in the U.S. Hog/Pork Markets: A Dynamic Conditional Copula Approach by Feng Qiu and Barry K. Goodwin Suggested citation format: Qiu, F., and B. K. Goodwin. 213.
Spot/Futures coupled model for commodity pricing 1
 6th St.Petersburg Worshop on Simulation (29) 1-3 Spot/Futures coupled model for commodity pricing 1 Isabel B. Cabrera 2, Manuel L. Esquível 3 Abstract We propose, study and show how to price with a model
FLEXIBLE MODELING OF MULTIVARIATE RISKS IN PRICING MARGIN PROTECTION INSURANCE: MODELING PORTFOLIO RISKS WITH MIXTURES OF MIXTURES
 FLEXIBLE MODELING OF MULTIVARIATE RISKS IN PRICING MARGIN PROTECTION INSURANCE: MODELING PORTFOLIO RISKS WITH MIXTURES OF MIXTURES SEYYED ALI ZEYTOON NEJAD MOOSAVIAN North Carolina State University szeytoo@ncsu.edu
Market Risk Analysis Volume II. Practical Financial Econometrics
 Market Risk Analysis Volume II Practical Financial Econometrics Carol Alexander John Wiley & Sons, Ltd List of Figures List of Tables List of Examples Foreword Preface to Volume II xiii xvii xx xxii xxvi
Farmland Values, Government Payments, and the Overall Risk to U.S. Agriculture: A Structural Equation-Latent Variable Model
 Farmland Values, Government Payments, and the Overall Risk to U.S. Agriculture: A Structural Equation-Latent Variable Model Ashok K. Mishra 1 and Cheikhna Dedah 1 Associate Professor and graduate student,
Integration & Aggregation in Risk Management: An Insurance Perspective
 Integration & Aggregation in Risk Management: An Insurance Perspective Stephen Mildenhall Aon Re Services May 2, 2005 Overview Similarities and Differences Between Risks What is Risk? Source-Based vs.
Can we use kernel smoothing to estimate Value at Risk and Tail Value at Risk?
 Can we use kernel smoothing to estimate Value at Risk and Tail Value at Risk? Ramon Alemany, Catalina Bolancé and Montserrat Guillén Riskcenter - IREA Universitat de Barcelona http://www.ub.edu/riskcenter
Analysis of the Oil Spills from Tanker Ships. Ringo Ching and T. L. Yip
 Analysis of the Oil Spills from Tanker Ships Ringo Ching and T. L. Yip The Data Included accidents in which International Oil Pollution Compensation (IOPC) Funds were involved, up to October 2009 In this
Mathematics of Finance Final Preparation December 19. To be thoroughly prepared for the final exam, you should
 Mathematics of Finance Final Preparation December 19 To be thoroughly prepared for the final exam, you should 1. know how to do the homework problems. 2. be able to provide (correct and complete!) definitions
Analyzing Oil Futures with a Dynamic Nelson-Siegel Model
 Analyzing Oil Futures with a Dynamic Nelson-Siegel Model NIELS STRANGE HANSEN & ASGER LUNDE DEPARTMENT OF ECONOMICS AND BUSINESS, BUSINESS AND SOCIAL SCIENCES, AARHUS UNIVERSITY AND CENTER FOR RESEARCH
Institute of Actuaries of India Subject CT6 Statistical Methods
 Institute of Actuaries of India Subject CT6 Statistical Methods For 2014 Examinations Aim The aim of the Statistical Methods subject is to provide a further grounding in mathematical and statistical techniques
Certified Quantitative Financial Modeling Professional VS-1243
 Certified Quantitative Financial Modeling Professional VS-1243 Certified Quantitative Financial Modeling Professional Certification Code VS-1243 Vskills certification for Quantitative Financial Modeling
Correlation and Diversification in Integrated Risk Models
 Correlation and Diversification in Integrated Risk Models Alexander J. McNeil Department of Actuarial Mathematics and Statistics Heriot-Watt University, Edinburgh A.J.McNeil@hw.ac.uk www.ma.hw.ac.uk/ mcneil
An Insight Into Heavy-Tailed Distribution
 An Insight Into Heavy-Tailed Distribution Annapurna Ravi Ferry Butar Butar ABSTRACT The heavy-tailed distribution provides a much better fit to financial data than the normal distribution. Modeling heavy-tailed
Publication date: 12-Nov-2001 Reprinted from RatingsDirect
 Publication date: 12-Nov-2001 Reprinted from RatingsDirect Commentary CDO Evaluator Applies Correlation and Monte Carlo Simulation to the Art of Determining Portfolio Quality Analyst: Sten Bergman, New
An Introduction to Copulas with Applications
 An Introduction to Copulas with Applications Svenska Aktuarieföreningen Stockholm 4-3- Boualem Djehiche, KTH & Skandia Liv Henrik Hult, University of Copenhagen I Introduction II Introduction to copulas
Business Statistics 41000: Probability 3
 Business Statistics 41000: Probability 3 Drew D. Creal University of Chicago, Booth School of Business February 7 and 8, 2014 1 Class information Drew D. Creal Email: dcreal@chicagobooth.edu Office: 404
Sample Size for Assessing Agreement between Two Methods of Measurement by Bland Altman Method
 Meng-Jie Lu 1 / Wei-Hua Zhong 1 / Yu-Xiu Liu 1 / Hua-Zhang Miao 1 / Yong-Chang Li 1 / Mu-Huo Ji 2 Sample Size for Assessing Agreement between Two Methods of Measurement by Bland Altman Method Abstract:
Statistics and Finance
 David Ruppert Statistics and Finance An Introduction Springer Notation... xxi 1 Introduction... 1 1.1 References... 5 2 Probability and Statistical Models... 7 2.1 Introduction... 7 2.2 Axioms of Probability...
Bloomberg. Portfolio Value-at-Risk. Sridhar Gollamudi & Bryan Weber. September 22, Version 1.0
 Portfolio Value-at-Risk Sridhar Gollamudi & Bryan Weber September 22, 2011 Version 1.0 Table of Contents 1 Portfolio Value-at-Risk 2 2 Fundamental Factor Models 3 3 Valuation methodology 5 3.1 Linear factor
And The Winner Is? How to Pick a Better Model
 And The Winner Is? How to Pick a Better Model Part 2 Goodness-of-Fit and Internal Stability Dan Tevet, FCAS, MAAA Goodness-of-Fit Trying to answer question: How well does our model fit the data? Can be
Application of statistical methods in the determination of health loss distribution and health claims behaviour
 Mathematical Statistics Stockholm University Application of statistical methods in the determination of health loss distribution and health claims behaviour Vasileios Keisoglou Examensarbete 2005:8 Postal
Random Variables and Probability Distributions
 Chapter 3 Random Variables and Probability Distributions Chapter Three Random Variables and Probability Distributions 3. Introduction An event is defined as the possible outcome of an experiment. In engineering
Empirical Issues in Crop Reinsurance Decisions. Prepared as a Selected Paper for the AAEA Annual Meetings
 Empirical Issues in Crop Reinsurance Decisions Prepared as a Selected Paper for the AAEA Annual Meetings by Govindaray Nayak Agricorp Ltd. Guelph, Ontario Canada and Calum Turvey Department of Agricultural
Copula-Based Pairs Trading Strategy
 Copula-Based Pairs Trading Strategy Wenjun Xie and Yuan Wu Division of Banking and Finance, Nanyang Business School, Nanyang Technological University, Singapore ABSTRACT Pairs trading is a technique that
Evaluating the Use of Futures Prices to Forecast the Farm Level U.S. Corn Price
 Evaluating the Use of Futures Prices to Forecast the Farm Level U.S. Corn Price By Linwood Hoffman and Michael Beachler 1 U.S. Department of Agriculture Economic Research Service Market and Trade Economics
SECOND EDITION. MARY R. HARDY University of Waterloo, Ontario. HOWARD R. WATERS Heriot-Watt University, Edinburgh
 ACTUARIAL MATHEMATICS FOR LIFE CONTINGENT RISKS SECOND EDITION DAVID C. M. DICKSON University of Melbourne MARY R. HARDY University of Waterloo, Ontario HOWARD R. WATERS Heriot-Watt University, Edinburgh
Edgeworth Binomial Trees
 Mark Rubinstein Paul Stephens Professor of Applied Investment Analysis University of California, Berkeley a version published in the Journal of Derivatives (Spring 1998) Abstract This paper develops a