Yield Curve and Predicted GDP Growth, September 2017
|
|
|
- Kathryn Scott
- 5 years ago
- Views:
Transcription
1 1 6 Yield Curve and Predicted GDP Growth, September 2017 Latest Data Archives Covering September 23, 2017 October 20, 2017 Highlights October September August 3-month Treasury bill rate (percent) year Treasury bond rate (percent) Yield curve slope (basis points) Prediction for GDP growth (percent) Probability of recession in 1 year (percent) Overview of the Latest Yield Curve Figures As the fourth quarter begins and the Federal Open Market Committee (FOMC) commences balance sheet normalization, the yield curve has shifted upward in nearly parallel fashion. Both short and long rates rose, with the three-month (constant maturity) Treasury bill rate rising to 1.10 percent (for the week ending October 20), up from September s 1.04 percent and August s 1.01 percent. The 10-year rate (also constant maturity) increased by 7 basis points to 2.33 percent, up from September s 2.26 percent, which itself was 7 basis points above August s 2.19 percent. The shift in the long rate was enough to bump the slope up to 123 basis points, just above September s 122 basis points and 5 basis points above August s 118 basis points. The minimal change in the slope meant only a small change in expectations of growth. Using past values of the spread and GDP growth suggests that real GDP will grow at about a 1.4 percentage rate over the next year, just up from the 1.3 percentage rate estimated in September and August. Although the time horizons do not match exactly, the forecast, like other forecasts, does show moderate growth.
2 2 6 The slightly steeper yield curve did lead to a slightly decreased probability of recession, but the change was minor. Using the yield curve to predict whether or not the economy will be in recession in the future, we estimate the expected chance of the economy being in a recession next October at 11.8 percent, just down from September s 12.0 percent, which was a drop from the August probability of 12.5 percent. So the yield curve is optimistic about the recovery continuing, even if it is somewhat pessimistic with regard to the pace of growth over the next year.
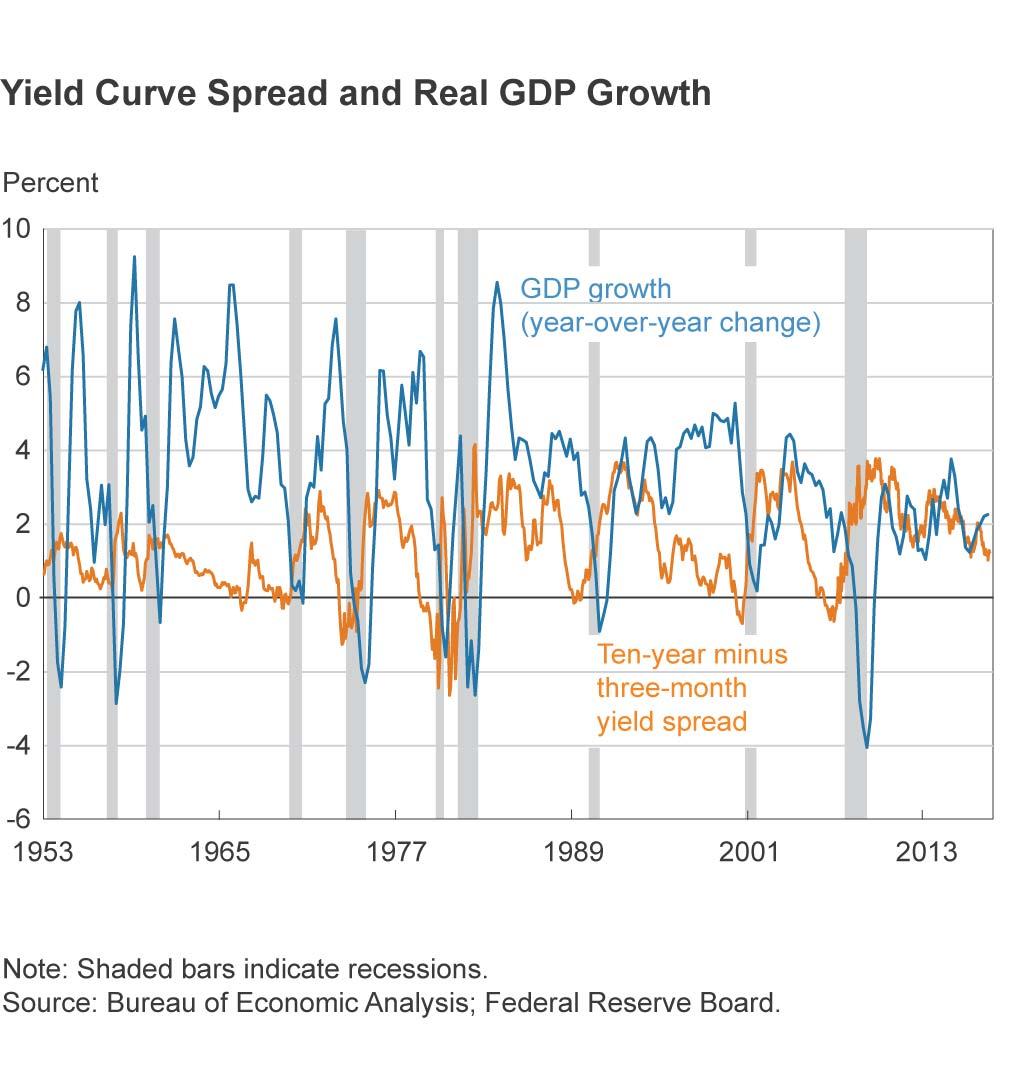
3 3 6 The Yield Curve as a Predictor of Economic Growth The slope of the yield curve the difference between the yields on short- and long-term maturity bonds has achieved some notoriety as a simple forecaster of economic growth. The rule of thumb is that an inverted yield curve (short rates above long rates) indicates a recession in about a year, and yield curve inversions have preceded each of the last seven recessions (as defined by the NBER ). One of the recessions predicted by the yield curve was the most recent one. The yield curve inverted in August 2006, a bit more than a year before the current recession started in December There have been two notable false positives: an inversion in late 1966 and a very flat curve in late More generally, a flat curve indicates weak growth and, conversely, a steep curve indicates strong growth. One measure of slope, the spread between ten-year Treasury bonds and three-month Treasury bills, bears out this relation, particularly when real GDP growth is lagged a year to line up growth with the spread that predicts it.
4 4 6

5 5 6 Predicting GDP Growth We use past values of the yield spread and GDP growth to project what real GDP will be in the future. We typically calculate and post the prediction for real GDP growth one year forward. Predicting the Probability of Recession While we can use the yield curve to predict whether future GDP growth will be above or below average, it does not do so well in predicting an actual number, especially in the case of recessions. Alternatively, we can employ features of the yield curve to predict whether or not the economy will be in a recession at a given point in the future. Typically, we calculate and post the probability of recession one year forward. Of course, it might not be advisable to take these numbers quite so literally, for two reasons. First, this probability is itself subject to error, as is the case with all statistical estimates. Second, other researchers have postulated that the underlying determinants of the yield spread today are materially different from the determinants that generated yield spreads during prior decades. (For a recent example, see Recessions Probabilities. ) Differences could arise from changes in international capital flows and inflation expectations, for example. The bottom line is that yield curves
6 6 6 contain important information for business cycle analysis, but, like other indicators, should be interpreted with caution. For more detail on these and other issues related to using the yield curve to predict recessions, see the Commentary Does the Yield Curve Signal Recession? Our friends at the Federal Reserve Bank of New York also maintain a website with much useful information on the topic, including their own estimate of recession probabilities.
In This Issue: September 2013 (August 16, 2013-October 3, 2013)
") September (August 16, -October 3, ) In This Issue: Banking and Financial Markets Banks Planning for a Stronger Economy Tracking Recent Levels of Financial Stress Inflation and Prices Expected Inflation
September (August 16, -October 3, ) In This Issue: Banking and Financial Markets Banks Planning for a Stronger Economy Tracking Recent Levels of Financial Stress Inflation and Prices Expected Inflation
In This Issue: June 2013 (May 10, 2013-June 11, 2013)
") June 13 (May 1, 13-June 11, 13) In This Issue: Banking and Financial Markets Banks Increase their Holdings of Safe Assets Households and Consumers The Ever-Updated Personal Saving Rate Inflation and Prices
June 13 (May 1, 13-June 11, 13) In This Issue: Banking and Financial Markets Banks Increase their Holdings of Safe Assets Households and Consumers The Ever-Updated Personal Saving Rate Inflation and Prices
Assessing the Risk of Yield Curve Inversion
 Assessing the Risk of Yield Curve Inversion James Bullard President and CEO Regional Economic Briefing Dec. 1, 2017 Little Rock, Ark. Any opinions expressed here are my own and do not necessarily reflect
U.S. Monetary Policy: A Case for Caution
 U.S. Monetary Policy: A Case for Caution James Bullard President and CEO Springfield Area Chamber of Commerce Springfield Business Development Corp. Meeting May 11, 2018 Springfield, Mo. Any opinions expressed
Assessing the Risk of Yield Curve Inversion: An Update
 Assessing the Risk of Yield Curve Inversion: An Update James Bullard President and CEO Glasgow-Barren County Chamber of Commerce Quarterly Breakfast July 20, 2018 Glasgow, Ky. Any opinions expressed here
Spotlight on : 10-2 Yield Curve
 RECESSION BAROMETER March 22, 2019 Spotlight on : 10-2 Yield Curve COMMENT: Rates in both the USA and Canada fell sharply on Friday to their lowest levels in the past twelve months. More importantly, the
THE FIVE FINGER GUIDE: ECONOMIC DATA THAT PROVIDE A HEADS-UP TO A U.S. RECESSION
 TD Economics Special Report www.td.com/economics THE FIVE FINGER GUIDE: ECONOMIC DATA THAT PROVIDE A HEADS-UP TO A U.S. RECESSION Recession cries for the U.S. economy reached a feverish pitch among investors
How to Extend the U.S. Expansion: A Suggestion
 How to Extend the U.S. Expansion: A Suggestion James Bullard President and CEO Real Return XII: The Inflation-Linked Products Conference 2018 Sept. 5, 2018 New York, N.Y. Any opinions expressed here are
The Yield Curve and Monetary Policy in 2018
 The Yield Curve and Monetary Policy in 2018 Christopher Waller Executive Vice President and Director of Research Federal Reserve Bank of St. Louis May 22, 2018 The views expressed here are those of the
Economic Environment and FHLB Advance Strategies
 Economic Environment and FHLB Advance Strategies July 26, 2018 This webinar is being recorded Jason Hwang VP / Director, Planning and Research Kevin Martin VP / Manager of Financial Strategies Dan Redmond
What Is the Best Strategy for Extending the U.S. Economy s Expansion?
 What Is the Best Strategy for Extending the U.S. Economy s Expansion? James Bullard President and CEO CFA Society Chicago Distinguished Speaker Series Breakfast Sept. 12, 2018 Chicago, Ill. Any opinions
The Mid-Year Economic Forecast. June 20, 2018
 The Mid-Year Economic Forecast June 20, 2018 Agenda National Economy: On a Solid Footing Construction & Housing: Still Strong Risks: What Could Go Wrong? 2 National Economy On a Solid Footing 3 GDP Grew
Spotlight: The Economic Cycle. April 30, 2018
 Spotlight: The Economic Cycle April 30, 2018 History of recessions This is not a barcode! Although the U.S. has had 48 recessions since 1785, they are becoming shorter and less frequent In 1913, the Federal
pinellasclerk.org/investments
 Section 218.415, Florida Statutes authorizes the governing body of a local government to adopt a written investment plan to govern investment activity. The Board of County Commissioners (Board) adopted
Since early 2011, an important financial metric known as the yield curve has
 A CWP WHITE PAPER July 2018 The Inverted Yield Curve As a Precursor to Recession James M. Walden, CFA Director of Investments Summary The yield curve has inverted prior to each of the five most recent
What Does a Humped Yield Curve Mean for Future Stock Market Returns
 What Does a Humped Yield Curve Mean for Future Stock Market Returns February 11, 2019 by Bryce Coward of Knowledge Leaders Capital As many commentators have pointed out, the yield curve has developed a
2.1%, 2% Canada s yield curve: Should we be worrying? Economic and Financial Analysis
 Economic and Financial Analysis Article Global Economics Canada s yield curve: Should we be worrying? Canada s 10-2 year treasury yield spread has being flattening since the beginning of 2017. But now
Yield Curve Inversion: Not What it Appears
 Yield Curve Inversion: Not What it Appears July 19, 2018 by Steven Vannelli of Knowledge Leaders Capital There has been considerable discussion lately about the slowly inverting yield curve and what it
The Yield Curve WHAT IT IS AND WHY IT MATTERS. UWA Student Managed Investment Fund ECONOMICS TEAM ALEX DYKES ARKA CHANDA ANDRE CHINNERY
 The Yield Curve WHAT IT IS AND WHY IT MATTERS UWA Student Managed Investment Fund ECONOMICS TEAM ALEX DYKES ARKA CHANDA ANDRE CHINNERY What is it? The Yield Curve: What It Is and Why It Matters The yield
Diffusion indices of forecast risks in Summary of Economic Projections From September 2016 FOMC to September 2018 FOMC.
 Trend Macrolytics, LLC Donald Luskin, Chief Investment Officer
Questions and Answers
 Questions and Answers Ch 1 (continued) Q1: MCQ Aggregate Demand 1) The aggregate demand curve shows A) total expenditures at different levels of national income. B) the quantity of real GDP demanded at
Economic & Revenue Forecast Tracking
 Economic & Revenue Forecast Tracking April 2011 Employment and Financial Statement Data through 03/11 503-378-3455 OEA.info@state.or.us http://www.oregon.gov/das/oea/index.shtml A. Macroeconomic Environment
What is a yield curve, and why are stock investors interested in its shape?
 The Flat-Out Truth November 2018 What is a yield curve, and why are stock investors interested in its shape? A yield curve gives a snapshot of how yields vary across bonds of similar credit quality, but
The Yield Curve as a Predictor of Economic Activity the Case of the EU- 15
 The Yield Curve as a Predictor of Economic Activity the Case of the EU- 15 Jana Hvozdenska Masaryk University Faculty of Economics and Administration, Department of Finance Lipova 41a Brno, 602 00 Czech
Threading the Needle. Esther L. George President and Chief Executive Officer Federal Reserve Bank of Kansas City
 Threading the Needle Esther L. George President and Chief Executive Officer Federal Reserve Bank of Kansas City July 17, 2018 Federal Reserve Bank of Kansas City Agricultural Symposium Kansas City, Mo.
YIELD CURVE INVERSION: A CLEAR BUT UNLIKELY DANGER
 1-year minus -year UST (%) INVESTMENT STRATEGY COMMENTARY YIELD CURVE INVERSION: A CLEAR BUT UNLIKELY DANGER December 4, 17 Investors focus on the yield curve with good reason an inverted curve has historically
The following pages explain some commonly used bond terminology, and provide information on how bond returns are generated.
 1 2 3 Corporate bonds play an important role in a diversified portfolio. The opportunity to receive regular income streams from corporate bonds can be appealing to investors, and the focus on capital preservation
Diffusion indices of forecast risks in Summary of Economic Projections From September 2016 FOMC to June 2018 FOMC. Mar '17 FOMC
 Trend Macrolytics, LLC Donald Luskin, Chief Investment Officer
Appendix 1: Materials used by Mr. Kos
 Presentation Materials (PDF) Pages 192 to 203 of the Transcript Appendix 1: Materials used by Mr. Kos Page 1 Top panel Title: Current U.S. 3-Month Deposit Rates and Rates Implied by Traded Forward Rate
MULTIPLE CHOICE. Choose the one alternative that best completes the statement or answers the question.
 Econ 330 Spring 2015: EXAM 1 Name ID Section Number MULTIPLE CHOICE. Choose the one alternative that best completes the statement or answers the question. 1) If during the past decade the average rate
After the Rate Increase, What Then?
 After the Rate Increase, What Then? Robert Eisenbeis, Ph.D. Vice Chairman & Chief Monetary Economist Bob.Eisenbeis@Cumber.com What the FOMC Did At Dec Meeting The Fed made the first step towards normalization
Empire State Manufacturing Survey.
 February 218 Empire State Manufacturing Survey Business activity continued to expand in New York State, according to firms responding to the February 218 Empire State Manufacturing Survey. The headline
Forecast evaluation report October 2017 Robert Chote, Chairman, Office for Budget Responsibility
 Forecast evaluation report October 2017 Robert Chote, Chairman, Office for Budget Responsibility Good afternoon everyone. My name is Robert Chote, chairman of the OBR, and I would like to welcome you to
DECEMBER 7, 2018 Market Commentary by Scott J. Brown, Ph.D., Chief Economist
 DECEMBER 7, 2018 Market Commentary by Scott J. Brown, Ph.D., Chief Economist Two key issues rattled stock market investors: trade policy and the yield curve. The weekend meeting between President Trump
Is the Flattening Yield Curve Sending a Message?
 Is the Flattening Yield Curve Sending a Message? FEBRUARY 2018 Sean Simko, ChFC Managing Director SEI Fixed Income Portfolio Management SEI Fixed Income Portfolio Management (SFIPM) manages fixed-income
Advisory Service. Trends. January 2019 Research Report
 Advisory Service Trends January 2019 Research Report Table of Contents Summary: Fed Policy, Inflation, Capital Markets Pages 3-4 Quantitative Tightening, Agenda, Why? Page 5 Excess Reserves, Inflation
U.S. Business Cycle Report
 U.S. Business Cycle Report April 2019 Nick Reece, CFA Senior Financial Analyst, Merk Investments LLC SPX Index (S&P 500 Index) Why is the Business Cycle Important? S&P 500 (log scale) and official National
RESPONSES TO SURVEY OF
 RESPONSES TO SURVEY OF MARKET PARTICIPANTS Markets Group, Federal Reserve Bank of New York RESPONSES TO SURVEY OF a v JANUARY Distributed: 1/18/ Received by: 1/22/ The Survey of Market Participants is
March 2008 Third District Housing Market Conditions Nathan Brownback
 March 28 Third District Housing Market Conditions Nathan Brownback By many measures, the economy of the Third District closely tracks the national economy. Thus far in the current housing cycle, this appears
Five Forecasters: Few Warning Signs
 KEY TAKEAWAYS Five Forecasters: Few Warning Signs September 28, 2016 by Burt White of LPL Financial Our Five Forecasters are collectively sending mostly mid-cycle signals. The Leading Economic Index, yield
Where Is the Global Economy Going?
 Key Points Where Is the Global Economy Going? July 28, 2018 by Vitali Kalesnik Michele Mazzoleni Jim Masturzo of Research Affiliates Investors are wise to look at more granular classifications of the business
Interpreting Treasury Yield Trends Sam Park October 2004
 Interpreting Treasury Yield Trends Sam Park October 2004 Treasury Yield Overview Treasury securities vary according to maturity ranging from short-term (e.g. three-month Treasury bills) to long-term (e.g.
Getting ahead of the (yield) curve
 curve") Capital market insights Conversation guide May 2018 Getting ahead of the (yield) curve The yield curve has been a hot topic in the financial media recently. It is one of the best indicators of future economic
Capital market insights Conversation guide May 2018 Getting ahead of the (yield) curve The yield curve has been a hot topic in the financial media recently. It is one of the best indicators of future economic
Empire State Manufacturing Survey
 November 216 Empire State Manufacturing Survey Business activity stabilized in New York State, according to firms responding to the November 216 Empire State Manufacturing Survey. The headline general
Aggregate Demand and Aggregate Supply
 Aggregate Demand and Aggregate Supply Aggregate Demand and Aggregate Supply The Learning Objectives in this presentation are covered in Chapter 20: Aggregate Demand and Aggregate Supply LEARNING OBJECTIVES
Global Macroeconomic Monthly Review
 Global Macroeconomic Monthly Review April 2019 Dr. Gil Michael Bufman, Chief Economist Arie Tal, Research Economist Economics Department, Capital Markets Division 1 Please see disclaimer on the last page
Consensus Forecast 2010 and 2011
 Consensus Forecast 2010 and 2011 Seventeenth Annual Automotive Outlook Symposium Detroit, Michigan June 4, 2010 William Strauss Senior Economist and Economic Advisor Federal Reserve Bank of Chicago Review
Remarks on the 2018 U.S. Macroeconomic Outlook
 Remarks on the 2018 U.S. Macroeconomic Outlook James Bullard President and CEO 29th Annual Economic Outlook Conference Gatton College of Business and Economics University of Kentucky Feb. 6, 2018 Lexington,
When Will U.S. Inflation Return to Target?
 When Will U.S. Inflation Return to Target? James Bullard President and CEO Economic Update Breakfast Nov. 14, 2017 Louisville, Ky. Any opinions expressed here are my own and do not necessarily reflect
Econ 302 Spring Don t forget to download a copy of the Homework Cover Sheet. Mark the location where you handed in your work.
 Econ 302 Spring 2004 Don t forget to download a copy of the Homework Cover Sheet. Mark the location where you handed in your work. Homework #4; Chapter 10. This homework has three parts (A, B, C). Each
ICS Commentary - U.S. Employment Cost Index, Q Latest ECI figures reveal labor market anemic ; private-sector employees faring better
 Nov. 1, 2010 ICS Commentary - U.S. Employment Cost Index, Q3 2010 Latest ECI figures reveal labor market anemic ; private-sector employees faring better Growth rates of U.S. employment costs for the third
Business cycle investing
 Business cycle investing White paper Business cycle investing Learn how the business cycle influences investment performance and how investors can identify potential return opportunities. Key highlights
The aggregate supply curve shows the relationship between the aggregate price level and the quantity of aggregate output in the economy.
 Chapter 32 The aggregate supply curve shows the relationship between the aggregate price level and the quantity of aggregate output in the economy. GDP Deflator can be used as a measure of the price level
Economic Outlook Survey
 Economic Outlook Survey 3rd quarter executive summary The CPA Outlook Index The CPA Outlook Index (CPAOI) is a broad-based indicator of the strength of U.S. business activity and economic direction that
2015: FINALLY, A STRONG YEAR
 2015: FINALLY, A STRONG YEAR A Cushman & Wakefield Research Publication U.S. GDP GROWTH IS ACCELERATING 4% 3.5% Percent Change Annual Rate 2% 0% -2% -4% -5.4% -0.5% 1.3% 3.9% 1.7% 3.9% 2.7% 2.5% -1.5%
The Conference Board Australia Business Cycle Indicators SM AUSTRALIA LEADING ECONOMIC INDICATORS AND RELATED COMPOSITE INDEXES FOR SEPTEMBER 2008
 FOR RELEASE: 6:00 P.M. ET, MONDAY, NOVEMBER 24, 2008 The Conference Board Australia Business Cycle Indicators SM AUSTRALIA LEADING ECONOMIC INDICATORS AND RELATED COMPOSITE INDEXES FOR SEPTEMBER 2008 The
August Macro Update: Slowing Growth in Employment and Consumption
 August Macro Update: Slowing Growth in Employment and Consumption August 5, 2017 by Urban Carmel of The Fat Pitch The bond market agrees with the macro data. The yield curve has 'inverted' (10 year yields
= C + I + G + NX = Y 80r
 Economics 285 Chris Georges Help With ractice roblems 5 Chapter 12: 1. Questions For Review numbers 1,4 (p. 362). 1. We want to explain why an increase in the general price level () would cause equilibrium
Vancity Investment Management
 Vancity Investment Management RESPONSIBLE INVESTING NEWSLETTER FEBRUARY 2018 IA CLARINGTON INHANCE SRI FUNDS Building safety in Bangladesh: More work to be done Workers in the garment industry have historically
FOR RELEASE: 10:00 A.M. AEST, THURSDAY, APRIL 30, 2009
 FOR RELEASE: 10:00 A.M. AEST, THURSDAY, APRIL 30, 2009 The Conference Board Australia Business Cycle Indicators SM THE CONFERENCE BOARD LEADING ECONOMIC INDEX (LEI) FOR AUSTRALIA AND RELATED COMPOSITE
The NBER s Business-Cycle Dating Procedure
 The NBER s Business-Cycle Dating Procedure Business Cycle Dating Committee, National Bureau of Economic Research Robert Hall, Chair Martin Feldstein, President, NBER Jeffrey Frankel Robert Gordon Christina
U.S. Business Cycle Chart Book
 U.S. Business Cycle Chart Book February 2019 Nick Reece, CFA Senior Financial Analyst, Merk Investments LLC SPX Index (S&P 500 Index) Why is the Business Cycle Important? S&P 500 (log scale) and official
Are Financial Markets Signalling Recession? August 2018
 Are Financial Markets Signalling Recession? August 2018 Executive Summary The flattening of the US yield curve has led some to forecast a US recession (with an inverted curve seen as an accurate recession
Bond Basics June 2006
 Yield Curve Basics The yield curve, a graph that depicts the relationship between bond yields and maturities, is an important tool in fixed-income investing. Investors use the yield curve as a reference
General Economic Outlook Recession! Will it be Short and Shallow?
 General Economic Outlook Recession! Will it be Short and Shallow? Larry DeBoer January 2002 We re in a recession. The National Bureau of Economic Research (NBER), the quasiofficial arbiter of business
FRBSF Economic Letter
 FRBSF Economic Letter 2018-07 March 5, 2018 Research from Federal Reserve Bank of San Francisco Economic Forecasts with the Yield Curve Michael D. Bauer and Thomas M. Mertens The term spread the difference
Choose the one alternative that best completes the statement or answers the question.
 Econ 330 Spring 2017: EXAM 1 Name ID Section Number MULTIPLE CHOICE. Choose the one alternative that best completes the statement or answers the question. 1) If market participants notice that a variable
RESPONSES TO SURVEY OF
 RESPONSES TO SURVEY OF PRIMARY DEALERS Markets Group, Federal Reserve Bank of New York RESPONSES TO SURVEY OF a v JANUARY Distributed: 1/18/ Received by: 1/22/ The Survey of Primary Dealers is formulated
Diffusion indices of forecast risks in Summary of Economic Projections From September 2016 FOMC to December 2018 FOMC.
 Trend Macrolytics, LLC Donald Luskin, Chief Investment Officer Thomas
The Economy Is Fine. Trade War Rhetoric Is The Main Risk
 The Economy Is Fine. Trade War Rhetoric Is The Main Risk July 6, 2018 by Urban Carmel of The Fat Pitch Summary: The macro data from the past month continues to mostly point to positive growth. On balance,
RESPONSES TO SURVEY OF
 RESPONSES TO SURVEY OF MARKET PARTICIPANTS Markets Group, Federal Reserve Bank of New York RESPONSES TO SURVEY OF a v November 2016 JANUARY Distributed: 1/17/ Received by: 1/22/ The Survey of Market Participants
ECONOMIC AND MARKET COMMENTARY OUR MISSION
 ECONOMIC AND MARKET COMMENTARY OUR MISSION Smith Shellnut Wilson is a registered investment adviser* specializing in managing investment portfolios for banks, individuals, corporations, foundations and
The Flattening Yield Curve
 The Flattening Yield Curve January 9, 2019 Harvey looks at the yield curve today through the lens of his 1986 pioneering work on yield-curve inversions and their foreshadowing of economic downturns. Harvey,
FINALTERM EXAMINATION Fall 2009 MGT411- Money & Banking (Session - 3) Time: 120 min Marks: 87
 Time: 120 min Marks: 87") FINALTERM EXAMINATION Fall 2009 MGT411- Money & Banking (Session - 3) Time: 120 min Marks: 87 Question No: 1 ( Marks: 1 ) - Please choose one If more students didn't pay back their student loans then which
FINALTERM EXAMINATION Fall 2009 MGT411- Money & Banking (Session - 3) Time: 120 min Marks: 87 Question No: 1 ( Marks: 1 ) - Please choose one If more students didn't pay back their student loans then which
Economic recovery dashboard
 CURRENT AS OF OCTOBER 31, 2009 Economic recovery dashboard Summary of current state Market indicators Most indicators changed little over the previous month. VIX increased, closing the month at 30.69,
Illinois Economic and Fiscal Policy Report
 STATE OF ILLINOIS EXECUTIVE OFFICE OF THE GOVERNOR GOVERNOR S OFFICE OF MANAGEMENT AND BUDGET SPRINGFIELD 62706 BRUCE RAUNER GOVERNOR November 15, 2018 Illinois Economic and Fiscal Policy Report HANS ZIGMUND
The labor market has continued to strengthen and economic activity has been expanding at a moderate pace this year.
 Current Economic Climate Overview The Federal Reserve publishes a report (known as the Beige Book) eight times per year that summarizes current economic conditions throughout the twelve Federal Reserve
1. When the Federal government uses taxation and spending actions to stimulate the economy it is conducting:
 1. When the Federal government uses taxation and spending actions to stimulate the economy it is conducting: A. Fiscal policy B. Incomes policy C. Monetary policy D. Employment policy 2. When the Federal
RESPONSES TO SURVEY OF
 RESPONSES TO SURVEY OF PRIMARY DEALERS Markets Group, Federal Reserve Bank of New York RESPONSES TO SURVEY OF a v November 2016 JANUARY Distributed: 1/17/ Received by: 1/22/ The Survey of Primary Dealers
Resilience of Convertibles in Economic Recessions
 2017 Inc. October 2017 Resilience of Convertibles in Economic Recessions By: Ethan Ganz, Portfolio Manager As Q3 2017 came to a close, equity investors booked another quarter of impressive returns, with
Business cycle investing
 +5+5+5+8++15 +11 U+15 Business cycle investing White paper Business cycle investing Learn how the business cycle influences investment performance and how investors can identify potential return opportunities.
Monetary Policy as the Economy Approaches the Fed s Dual Mandate
 EMBARGOED UNTIL Wednesday, February 15, 2017 at 1:10 P.M., U.S. Eastern Time OR UPON DELIVERY Monetary Policy as the Economy Approaches the Fed s Dual Mandate Eric S. Rosengren President & Chief Executive
Market Commentary for Q2 2018
 Market Commentary for Q2 2018 Our Commitment to You: Periodically, it is helpful to the people we service, our clients, to re-affirm who we are at Crew Capital Mgmt. We don t just manage money. We help
Chapter 7 Selected Answers
 Chapter 7 Selected Answers Problem 7.1: a) When Clorox buy back some of its bonds, fewer bonds are available at each interest rate, so that the borrowing curve in Figure 7.1.1 shifts leftward from Use
Questions and Answers
 Questions and Answers Chapter 1 Q1: MCQ Aggregate demand 1. The aggregate demand curve: A) is up-sloping because a higher price level is necessary to make production profitable as production costs rise.
CHAPTER 15. The Term Structure of Interest Rates INVESTMENTS BODIE, KANE, MARCUS
 CHAPTER 15 The Term Structure of Interest Rates McGraw-Hill/Irwin Copyright 2011 by The McGraw-Hill Companies, Inc. All rights reserved. 15-2 Overview of Term Structure The yield curve is a graph that
The Economic Outlook and The Fed s Roles in Monetary Policy and Financial Stability
 1 The Economic Outlook and The Fed s Roles in Monetary Policy and Financial Stability Main Line Chamber of Commerce Economic Forecast Breakfast Philadelphia Country Club, Gladwyne, PA January 8, 2008 Charles
Interest Rate Environment and FHLB Advance Strategies
 Interest Rate Environment and FHLB Advance Strategies Jason Hwang Director, Financial Strategies, Research, and Membership Applications Kevin Martin Manager, Member Financial Strategies September 22, 2015
Market Focus. Credit cycle: rising default rate. Where do we stand in the default rate cycle? Credit fundamentals are deteriorating
 At the beginning of 215, we began forecasting the end of the credit cycle. Since then, corporate fundamentals, rating trends, and default rate data have all deteriorated. Moody s speculative default rate
ANOTHER TOUGH WEEK COMMENTARY REASSURANCE KEY TAKEAWAYS LPL RESEARCH WEEKLY MARKET. October
 LPL RESEARCH WEEKLY MARKET COMMENTARY October 29 2018 ANOTHER TOUGH WEEK John Lynch Chief Investment Strategist, LPL Financial Jeffrey Buchbinder, CFA Equity Strategist, LPL Financial Ryan Detrick, CMT
The Disconnect Continues
 The Disconnect Continues Richard Bernstein June 3, 2011 Our strategies focus on finding disconnects between investor sentiment and the reality of improvement or deterioration in fundamentals. The current
Outlook for the Hawai'i Economy
 Outlook for the Hawai'i Economy May 3, 2001 Dr. Carl Bonham University of Hawai'i Economic Research Organization Summary The Hawaii economy entered 2001 in its best shape in more than a decade. While the
2018 Kansas City Economic Forecast. Mid-Year Update Greater Kansas City Chamber of Commerce June 15, 2018
 2018 Kansas City Economic Forecast Mid-Year Update Greater Kansas City Chamber of Commerce June 15, 2018 Status of the U.S. Economy By many measures the economy is approaching maximum capacity. 160,000
The Macroeconomic Outlook
 The Macroeconomic Outlook 2 nd Quarter, 2018 Ramirez & Co., Inc. 61 Broadway, 29th Floor New York, NY 10006 (800) 888-4086 Synopsis Almost a decade after the onset of the Great Contraction of 2007 2009,
10-Year Treasury Yield Upshifts past 3% as Fear of Curve Inversion Grows
 10-Year Treasury Yield Upshifts past 3% as Fear of Curve Inversion Grows May 3, 2018 by Charles Roth of Thornburg Investment Management Stocks slide on rising rates and yield curve inversion concerns,
Cycle Watch: U.S. Economic Expansion Reaches Historic Point
 : U.S. Economic Expansion Reaches Historic Point YIELD CURVE STOCK MARKET Predictive power High Low False positives 10% of the time 67% of the time Where are we now Yield curve spread below 100 bps can
Economic Update. September By Andrew Kohl
 9/24/18 Economic Update By Andrew Kohl Andrew Kohl Chief Investment Officer Commentary The stock market continues its march forward and is back to all-time highs. The S&P 500 has gained over 9% thus far
Business Cycles. Trends and cycles. Overview. Trends and cycles. Chris Edmond NYU Stern. Spring Start by looking at quarterly US real GDP
 Trends and cycles Business Cycles Start by looking at quarterly US real Chris Edmond NYU Stern Spring 2007 1 3 Overview Trends and cycles Business cycle properties does not grow smoothly: booms and recessions
file:///c:/users/cathy/appdata/local/microsoft/windows/temporary Int...
 1 of 5 9/25/17, 8:57 AM A Publication of the National Association of Manufacturers September 25, 2017 As expected, the Federal Reserve opted to not raise short-term interest rates at its September 19 20
Money & Capital Markets Exam 1: Chapters 1, 2, 3, 4, 5 & 6. Name. Multiple Choice: 4 points each
 Money & Capital Markets Exam 1: Chapters 1, 2, 3, 4, 5 & 6 Name Multiple Choice: 4 points each MULTIPLE CHOICE. Choose the one alternative that best completes the statement or answers the question. 1)