FY2017 Results. Norio Tadakawa. February 8, Corporate Executive Officer, CFO Shiseido Company, Limited
|
|
|
- Marcus Gibbs
- 5 years ago
- Views:
Transcription
1 FY2017 Results Norio Tadakawa February 8, 2018 Corporate Executive Officer, CFO Shiseido Company, Limited
2 In this document, statements other than historical facts are forward-looking statements that reflect our plans and expectations. These forward-looking statements involve risks, uncertainties and other factors that may cause actual results and achievements to differ from those anticipated in these statements.
3 FY2017 Sales and Profit Soared to New Historic Highs Net sales exceeded 1 trillion, three years ahead of schedule. Operating profit doubled year on year, and operating profitability reached 8%. Results were much higher than planned due to bold marketing investment and structural reform. Net sales: 1,005.1 billion YoY change in local currency: +16.0% YoY change in yen: +18.2% Trend toward double-digit growth in Japan Business (YoY change: +13.1%) Sales expansion through borderless marketing (China: +20.1% / TR +73.8%) Growth of prestige brands into pillar of global business (+19%) Operating income: 80.4 billion YoY change: % YoY difference: billion (*Past high: 63.5 billion) Significant improvement of cost structure due to increase in sales through strengthening of investment (reduction of cost, personnel expenses, and cost ratio) Improved profitability of Prestige and other core brands Significant improvement of profitability in Japan, China, the rest of Asia and TR Net income attributable to owners of parent: 22.7 billion YoY change: billion EBITDA: billion YoY change: billion Interest-bearing debt ratio: 15.4% Interest-bearing debt to EBITDA ratio: 0.5 * FY2007 3
4 Summary of FY2017 Results (Billion yen) FY2017 % of Net Sales FY2016 % of Net Sales YoY Change YoY Change % YoY Change in Local Currency % Difference from Nov. Forecasts Net Sales 1, Cost of Sales ー SG&A ー Operating Income Ordinary Income Extraordinary Income/Loss (net) Net Income Attributable to Owners of Parent ーー EBITDA ー Exchange rates: USD 1 = JPY (+3.0%), EUR 1 = JPY (+5.2%), CNY 1 = JPY 16.6 (+1.5%) ROE: 5.6% *1. The + and - symbols in YoY Change indicate increase and decrease in amount, respectively. *2. Gain on transfer of intellectual property rights in connection with the Jean Paul GAULTIER and gain on sale of land at the former Kamakura Factory were included under extraordinary income for FY
5 Consolidated Statements of Cash Flows Cash Flows Generated by Improved Earning Power 94.3 Consolidated Cash Flows Free Cash Flows Cash Flows from Operating Activities 95.4billion Cash Flows from Investing Activities billion Free Cash Flows 94.3 billion Cash Flows from Financing Activities billion Effect of Exchange Rate Changes on Cash and Cash Equivalents 2.5 billion FY2014 FY2015 FY2016 FY2017 Consolidated Cash Flows 43.7 billion * FY2016 and FY2017 Japan: January to December; Overseas: January to December FY2015 Japan: April to December; Overseas: January to December FY2014 Japan: April to March; Overseas: January to December 5
6 Increase of 7.5 yen in Annual Dividend FY2017 Dividend per Share YoY Change Change from Previous Announcement (August 9, 2017) Interim 12.5 yen +2.5 yen ー Year-End 15.0 yen +5.0 yen +2.5 yen Annual 27.5 yen +7.5 yen +2.5 yen 6
7 Growth Momentum Accelerated Net sales in FY2017 Contribution of new brands Laura Mercier Dolce&Gabbana Impact of foreign currency exchange and others* Growth +18.2% (Billion yen) Growth of existing businesses , Growth +11% FY2016 FY2017 * Impact of foreign currency exchange and others includes impact of foreign currency billion yen, and the impact of the previous year s sales of Jean Paul GAULTIER: -3.5 billion yen. 7
8 Sales Growth in All Regions Expansion of Market Share, Outpacing Market Growth YoY breakdown of change in net sales by reportable segment Top: YoY change (billion yen) Middle: YoY change in local currency Bottom: <Market growth rate> Japan % <Approx. +2%> China % <High single-digit growth rate> Asia Pacific % <High single-digit growth rate> Americas % <Mid single-digit growth rate> EMEA % <Mid single-digit growth rate> Travel Retail % Professional % Impact of foreign currency exchange and other* , % FY2016 FY2017 *1. The year-on-year change, and year-on-year change in local currency terms for each business were calculated based on the actual exchange rates. *2. See Supplemental Data 11 for details about segment classifications. *3. Impact of foreign currency exchange and other includes impact of foreign currency billion yen and sales of Other as a reportable segment. *4. Market data is according to Euromonitor International. 8
9 Sales Growth in All Businesses Development of Prestige into Core Business YoY breakdown of change in net sales by business Prestige first strategy produced dramatic global growth +25% Fragrance % <Mid single-digit growth rate> Cosmetics % <Mid single-digit growth rate> Personal care % <Mid single-digit growth rate> Professional % Impact of foreign currency exchange and other* ( ) Prestige % <Mid single-digit growth rate> Top: YoY change (billion yen) Middle: YoY change in local currency Bottom: <Market growth rate> 1, % FY2016 FY2017 *1. The year-on-year change, and year-on-year change in local currency terms for each business were calculated based on the initially assumed exchange rates. *2. Impact of foreign currency exchange and other includes impact of foreign currency billion as well as Other business and the difference between the assumed rates and the actual rates. *3. Market data is according to Euromonitor International. 9
10 Operating Income Increased in All Regions, with Significant Contributions from Japan, China Businesses and Travel Retail YoY breakdown of change in operating income by reportable segment Top: YoY change (billion yen) Bottom: <Operating Profitability (%)> Japan <18.0%> China +7.7 <7.8%> Asia Pacific +4.7 <10.3%> Americas +2.5 <-6.5%> EMEA +3.5 <-2.3%> Travel Retail +7.0 <27.6%> Professional +1.9 <6.1%> Increase in elimination of unrealized profit not reflected in each region, etc. Adjustments and other <8.0%> 36.8 <4.3%> FY2016 *1. See Supplemental Data 11 for details about segment classifications. *2. Adjustments and other includes results of Other as a reportable segment. FY
11 Japan: 13.1% Growth, Profitability Up to 18% (Billion yen) FY2017 % of Net Sales FY2016 % of Net Sales YoY Change YoY Change % Prestige Cosmetics Specialty Stores Cosmetics Personal Care Others* Japan (Billion yen) FY2017 FY2016 YoY Change YoY Change % Operating Income Operating Profitability (%) pt Income Before Amortization of Goodwill, etc Operating Profitability (%) pt *1. In line with the management system of Japan, THE GINZA, etc. which were previously included in Others of Japan business, are classified as Prestige starting from FY2017. In addition, Shiseido Amenity Goods Co., Ltd., which was included in Personal Care, is now classified as Others. *2. See Supplemental Data 11 for details about changes in reportable segments. *3. Others include Healthcare Business, Shiseido Amenity Goods Co., Ltd. and others. *4. % of Net Sales indicates percentage of Japan business sales. *5. Operating profitability is calculated using net sales including intersegment transactions. 11
12 Store Sales: 17% Growth in Fourth Quarter Market in Japan (annual) - Growth of the cosmetics market: approx. +2% (Shiseido estimate) Shiseido (annual) - YoY change in store sales: +12% Inbound sales: +70% year on year, to 58.5 billion Growth in sales to Japanese consumers: +5% year on year +17 (%) Growth from store sales Growth of sales to Japanese consumers Market growth Q1 Q2 Q3 Q4 12
13 China: 20.1% Growth, Profitability of 7.8% (Billion yen) FY2017 % of Net Sales FY2016 % of Net Sales YoY Change YoY Change in Local Currency % Prestige Cosmetics Personal Care Others China (Billion yen) FY2017 FY2016 YoY Change YoY Change % Operating Income Operating Profitability (%) pt Income Before Amortization of Goodwill, etc Operating Profitability (%) pt *1. See Supplemental Data 11 for details about changes in reportable segments. *2. Operating profitability is calculated using net sales including intersegment transaction. 13
14 China: Great Leap Forward in Prestige Sales by business In local currency terms YoY Changes in Quarterly Stores Sales in FY2017 Prestige Cosmetics Personal Care (%) +78 China (excl. Hong Kong) Annual+18 Annual Annual Annual+8 0 Q1 Q2 Q3 Q4 14
15 Asia Pacific: Achievement of Double-Digit Growth and Double-Digit Profitability (Billion yen) FY2017 FY2016 YoY Change YoY Change in Local Currency % Asia Pacific (Billion yen) FY2017 FY2016 YoY Change YoY Change % Operating Income Operating Profitability (%) pt Income Before Amortization of Goodwill, etc Operating Profitability (%) pt *1. See Supplemental Data 11 for details about changes in reportable segments. *2. Operating profitability is calculated using net sales including intersegment transactions. 15
16 Asia Pacific: Great Leap Forward in South Korea Sales by country / region In local currency terms YoY Changes in Quarterly Stores Sales of Prestige in FY2017 (%) South Korea Taiwan Thailand Annual Annual+4 Annual+5 0 Q1 Q2 Q3 Q4 16
17 Americas: 6.6% Growth; Improvement in Profitability (Billion yen) FY2017 FY2016 YoY Change YoY Change % YoY Change in Local Currency % Americas * The year-on-year change in real terms excluding the acquisition of Laura Mercier and the licensing of Dolce&Gabbana is -12%. (Billion yen) FY2017 FY2016 YoY Change YoY Change % Operating Income ー Operating Profitability (%) pt Income Before Amortization of Goodwill, etc ー Operating Profitability (%) pt Both positive and negative tendencies in stores, depending on the brand: Changes in the market and in consumers are accelerating NARS and Clé de Peau Beauté are performing well bareminerals struggling *1. See Supplemental Data 11 for details about changes in reportable segment. *2. Operating profitability is calculated using net sales including intersegment transaction. *3. Effective from FY2017, bareminerals, NARS etc. in the U.K. included in the Americas Business under the Company s previous segment classification structure have been included in the EMEA Business. Effective from FY2017, the Fragrance business in Latin America included in the EMEA Business under the Company s previous segment classification structure has been included in the Americas Business. 17
18 Americas: Start of Turnaround of bareminerals Bare Escentuals Sales In local currency terms +7 Annual -13 YoY Changes in Quarterly Stores Sales in FY2017 (%) 0 Q1 Q2 Q3 Q4 Annual Annual -12 Total Bare Escentuals sales EC EC other than sales 18
19 EMEA: 30% Growth, Achieved Profitability (Billion yen) FY2017 FY2016 YoY Change YoY Change % YoY Change in Local Currency % EMEA * The year-on-year change in real terms excluding the licensing of Dolce&Gabbana is +7%. (Billion yen) FY2017 FY2016 YoY Change YoY Change % Operating Income ー Operating Profitability (%) pt Income Before Amortization of Goodwill, etc ー Operating Profitability (%) pt Existing Businesses grew +7% NARS and narciso rodriguez performed strongly Dolce&Gabbana Store sales regained momentum Office integration was completed *1. See Supplemental Data 11 for details about changes in reportable segment. *2. Operating profitability is calculated using net sales including intersegment transaction. *3. Effective from FY2017, bareminerals, NARS etc. in the U.K. included in the Americas Business under the Company s previous segment classification structure have been included in the EMEA Business. Effective from FY2017, the Fragrance business in Latin America included in the EMEA Business under the Company s previous segment classification structure has been included in the Americas Business. *4. Method for calculating Income Before Amortization of Goodwill, etc. was revised from the first half of FY
20 Dolce&Gabbana: Back on Growth Path Dolce&Gabbana Sales In local currency terms YoY Changes in Quarterly Stores Sales in FY2017 (%) Annual -4 Travel Retail EMEA EMEA America Annual -10 Annual -7 0 Q1 Q2 Q3 Q4 20
21 Travel Retail: Dramatic Growth in Sales and Profit (Billion yen) FY2017 FY2016 YoY Change YoY Change % YoY Change in Local Currency % Travel Retail (Billion yen) FY2017 FY2016 YoY Change YoY Change % Operating Income Operating Profitability (%) pt Income Before Amortization of Goodwill, etc Operating Profitability (%) pt Sales of Clé de Peau Beauté, NARS and ANESSA doubled year on year Proactive marketing including advertising and promotions at airports (Strengthening of investment) Strengthening of relationships with operators Strengthening of organizational functions and human resources * Operating profitability is calculated using net sales including intersegment transaction. 21
22 Significant Improvement in Cost Structure Trend Toward Sustainable Improvement in Profitability Actual cost structure % 23.7% 23.0% Cost of Goods Sold Marketing Costs 23.8% 25.0% 24.4% 4.6% 5.4% 5.4% (excl. beauty consultants-related personnel expenses) Brand Development / Research & Development 25.7% 25.2% 23.8% Personnel (incl. beauty consultants-related personnel expenses) Other SGA Expenses 17.2% 16.0% 15.4% 4.3% 4.7% 8.0% FY2016 FY2017 FY2017 Operating Income Actual Plan Actual 22

23 Speed and Growth Progress of Global Management Masahiko Uotani February 8, 2018 Representative Director, President and CEO Shiseido Company, Limited

24 From Sell-In to Sell-Out Focus Aggressive investment in marketing and R&D Enhancing brand equity Increasing store sales Improvement of market inventory turnover Increasing shipment Improvement of cost structure 24
25 Bold Marketing Investment Total over 110 billion
 Brand Development / Research & Development Personnel (incl. POS Personnel) Other SGA Expenses Operating Income 2014 2017 26")
26 Improvement of Cost Structure Driven By Strong Sales Growth 25.2% 23.0% Cost of Goods Sold 23.2% 3.8% 24.4% 5.4% Marketing Investment (excl. POS Personnel) Brand Development / Research & Development Personnel (incl. POS Personnel) Other SGA Expenses Operating Income
27 Road to Success: 3 Years of Reform Net Sales Growth rate including effect of acquisitions (In local currency terms) Net Sales Organic growth rate excluding effect of acquisitions (In local currency terms) Net Sales (Billion yen) Operating Income (Billion yen) CAGR % +5% +4% (Billion yen) +16% +11% +0.1% -0.4% +1% 1, FY2012 (Ended March 2013) FY2013 (Ended March 2014) FY2014 (Ended March 2015) FY FY2016 FY2017 * The sales growth for FY2013 excludes the impact of last-minute demand ahead of the consumption tax hike. The sales growth for FY2014 excludes the impact of the rebound after the consumption tax hike, market inventory optimization in China and Asia, and distribution center problems in the Americas. 27

28 2017: Growth Driven by All Regions Americas +6.6% EMEA +30.0% China +20.1% Japan +13.1% APAC +11.2% TR +73.8% (FY2017 Net sales: YoY change in local currency ) 28

29 To Be a Global Winner with Global Matrix Organization 29


30 Global Utilization of Trends, Knowledge and Cutting-Edge Research EMEA Fragrance Americas Digital/Makeup Japan Skincare Centers of Excellence R&D Base 30


31 Prestige First Strategy 31
32 Acceleration of Growth in Prestige Market Cosmetics +4% Fragrance 15% +14% Personal Care +6% 6% 14% Sales Growth Professional 1% +2% Prestige 64% +16% CAGR 32
33 Prestige + Fragrance: Sales Up 1.5 Times, Share in Total Sales: More Than 50% 3% Others 5% Professional 9% Personal Care +2% +6% Others Professional Personal Care Cosmetics 7% 6% 10% 34% 30% 11% Cosmetics Fragrance +4% +14% Fragrance 9% 42% Prestige +16% Prestige 34% CAGR 33
 Up more than 45 billion")
34 CAGR +15% FY2017 Sales Over 130 billion Sales Growth ( ) Up more than 45 billion 34

 Up more than")
35 CAGR +33% FY2017 Sales Over 100 billion Sales Growth ( ) Up more than 60 billion 35


36 M&A and License Agreement FY2017 Sales FY2017 Sales 19 billion 50 billion 36
37 Selection and Concentration through Business Transfer and Withdrawal AYURA KINARI Chromatography business Zotos RéVive Business in Greece Business in Turkey Za business in India Termination of distribution agreements with Burberry 37

38 Integration of Japan HQ and Sales for Streamlined Operations 38
39 Japan Business: Upturn in Share +7% +3% +10% Growth Rate 0% CAGR Plan +3% Actual +8% /3 2015/12 (Adjusted) Net Sales Growth Rate Net Sales * Figures from FY2008 to FY2015/3 are based on disclosed figures for the April to March cycle (growth rate, net sales). Figures for FY2015/12 (Adjusted) are actual results from January to December Figures from the FY2015/12 (Adjusted) to FY2017 are based on disclosed figures (growth rate, net sales). 39


40 Shift to Brand-Centric Management and Sales 40

41 Be a Winner through Consumer-Oriented Marketing 41


42 Win in 3 Skin Categories Trends of Total Market Shares in 3 Skin Categories *1,*2 Shiseido Group Company A Company B *1. Skincare, base makeup and sun care *2. According to research by Shiseido
 Sales in FY2017: over 50 billion")

43 Growth into 50 Billion Brand (Billion yen) Sales in FY2017: over 50 billion Sales Growth Up more than 18 billion CAGR +14%


44 Facial Expression Project Creation of New Market and Expansion of Contact Points with Consumers Shipments of ELIXIR and SHISEIDO VITAL-PERFECTION (June December 2017, Japan, China, Asia Pacific and TR) Approx.1.7million units Brisk sales of cosmetics brands at specialty stores and department stores Demand among various age groups Broad reach through appeal on both emotional and functional levels 44

45 Top Share in Base Makeup MAQuillAGE Base Makeup CAGR +14% Shares of Base Makeup 12-month Moving Average* Shiseido Group Company A Company B * According to research by Shiseido, based on sales amount 45


46 Brand Channel Reform Breakdown of Legacy Issues Multi-channel Flagship Store 46
47 Strengthening of Digital Communication and E-Commerce Trend of Shiseido s E-commerce Sales (watashi+, EC retailers, etc.) No.1 Share of E-commerce Cosmetics Market * * According to research by Shiseido

48 Successfully Capturing Inbound Demand (Billion yen) Trend of Inbound Sales (Adjusted)

* *Source: Japan National Tourism Organization")
49 Borderless Marketing: Shiseido s Unique Strength Japan Travel Retail China Focus on Chinese tourists Number of Chinese travelers abroad: 130 million Chinese visitors to Japan: 9.59 million (2017)* *Source: Japan National Tourism Organization (JNTO), China + Hong Kong 49


50 Personal Care Business: Improvement of Profitability Operating Profitability of Personal Care Business Operating Profitability FY2017 OP Margin 10+%
51 Japan: Sustainable High Profitability towards the Next Three Years Net Sales Operating Income Operating Profitability (%) 18.0% (Billion yen)

52 China: Towards Region-Led Operations Transfer of business management and marketing functions Enhancement of R&D functions Hiring of local talent 52

53 Bold Marketing Investment in Prestige and E-Commerce to Tap into High Growth Potential Sales Trend of China Prestige Business CAGR +41% +59% +33%


54 New Growth Drivers: IPSA, NARS Trend of IPSA Sales CAGR +66% IPSA: Strengthening marketing investment and opening new stores NARS: Entry into Mainland China market Opening of 4 stores, strong sales in FY


55 Expansion of E-Commerce Strategic Partnerships Trend of E-commerce Sales EC ratio 26% 23% Approx. 15% Up around 60% Up more than 50% Up more than 35%


56 Faltering Cosmetics Business Actions to Improve Profitability Rebranding Strengthening of investment in digital marketing Improvement from negative growth to 5% growth in sales (FY2017) Revision of distribution contract system Narrowing down the number of stores Shift to self-selection channels Reduction of fixed costs 56
 30.0 4.")
57 Hong Kong: Sustainable Sales Growth and High Profitability (Billion yen) Sales Operating Income
58 China: Significant Improvement of Profitability towards the Next Three Years Net Sales Operating Income Operating Profitability (%) 7.8% (Billion yen)

59 Asia Pacific: Establishment of Regional Headquarters Localization of marketing Transfer of head office functions, recruitment of diverse talent 59
 (Billion yen) Cosmetics & Personal Care 27.5 22.")
60 Strengthening of Made-in-Japan Brands Prestige Prestige CAGR +13% Cosmetics & Personal Care CAGR +5% Prestige Sales Cosmetics & Personal Care Sales (2017 internal plan rate) (Billion yen) Cosmetics & Personal Care

 11.5 0.")
61 South Korea: Expansion of Share and Achievement of Profitability Net Sales Operating Income (Billion yen)

62 Americas: Strengthening of Human Resources and Organization Integration and reinforcement of organizations Recruitment of highly professional and experienced talent Improvement of efficiency through shared services 62
 Review of brand strategy, products and advertising Closedown of around 100 boutiques in North America Strengthening")
63 Fresh Start through Structural Reform Development of achievable revival plan by new president Impairment loss of 70.9 billion (FY2017) Review of brand strategy, products and advertising Closedown of around 100 boutiques in North America Strengthening of digital marketing 63


64 Strengthening of Makeup Brands Acquisition of Integration into Shiseido Group Realization of Group synergies in R&D, production, and marketing Review of products and advertising Global expansion 64

65 Hub for Digital Professionals Digital Center of Excellence Enrollment of 1,500 employees annually in Digital Academy Formulation of global E-commerce strategy Establishment of global E-commerce platform Data analysis and sharing 65


66 Acquisition of Promising Cutting-Edge Technologies and Talents 66
67 Americas: Improvement of Profitability through Structural Reform Net Sales Operating Income Operating Profitability (%) (Billion yen) %


68 EMEA: Integration of Cosmetics and Fragrance Organizations Integration of regional headquarters One Country, One Company Organizational integration in UK, the largest market in Europe Establishment of Shiseido Group Middle East Improvement of profitability through back office integration and shared services SAP, logistics system integration Launch of new management; Franck Marilly appointed President of Shiseido Group EMEA 68

69 License Agreement Strengthening of marketing investment Integration of organizations and functions Shift to in-house production, and reinforcement of supply chain Turn to positive in-store sales from Q
70 EMEA: Recovery of Profitability towards the Next Three Years (Billion yen) Net Sales Operating Income Operating Profitability (%) %

71 Travel Retail: Transfer of Headquarters Functions to Asia Strengthening of organization and talent with travel retail business experience Chinese tourists: Expanding contact points and sales 71
 2014-2017 CAGR +50% 44.")
72 Expansion of Growth through Aggressive Investment (Billion yen) CAGR +50%

73 Building of Trust with Operators 73
74 TR: Acceleration of Growth Momentum towards the Next Three Years Net Sales Operating Income Operating Profitability (%) 27.6% (Billion yen)


75 Review of Costs to Fund Investment Marketing Investment Total over 110 billion Effect of cost structure reform Total 63.3 billion 75

76 The Power of People Drives Sustainable Growth 76


77 Dialogue with 65,000 Employees: Successful Initiatives Driven by Front Line 77


78 People First Leadership development - Training and development program - Comeback of study abroad program - Recruitment of professional talent - Global mobility Talent management - Introduction of performance management English mandate 1,700 employees currently learning English Flexible working styles 78


79 A Multitude of Remarkable Awards 79


80 Promotion of Gender Diversity Women in Leadership GLOBAL % 69% JAPAN 27% 30% MSCI Japan Empowering Women Index(WIN) Gender Diversity Score #1 80

81 Diversity and Empowerment 81


82 Business Reform with Bottom-Up Approach Rejuvenate, Shiseido 82

83 83
84 Ensuring Sustainable Growth Continuous Enhancements Issues to Tackle Global Prestige First Strategy Sustainable profitability in Japan Significant improvement of profitability and acceleration of growth in China Travel retail & borderless marketing Digital communication & E-commerce Technology Innovation Development of human resources and organizations ESG management Supply chain management Profitability in Americas Turnaround of bareminerals Building a new business model Profitability in EMEA Strengthening of fragrance brand portfolio HUMBLE CONFIDENCE 84
85 Acceleration of Growth Momentum Net Sales Growth rate including effect of acquisitions (In local currency terms) Net Sales Organic growth rate excluding effect of acquisitions (In local currency terms) Net Sales Operating Income +4% +5% CAGR +9% 1, % +11% (Billion yen) OP Margin 10+% 80.4 OP Margin 8% FY2015 FY2016 FY2017 FY2020 * The sales growth for FY2015 excludes the impact of the rebound after the consumption tax hike, market inventory optimization in China and Asia, and distribution center problems in the Americas. 85


86 86
87
88 Supplemental Data 1: FY2017 Results of Sales by Reportable Segment (Billion yen) FY2017 % of Net Sales FY2016 % of Net Sales YoY Change YoY Change % YoY Change in Local Currency % Japan China Asia Pacific Americas EMEA *1, *1, 3 Travel Retail Professional Other Total 1, *1. Effective from FY2017, bareminerals, NARS etc. in the U.K. included in the Americas Business under the Company s previous segment classification structure have been included in the EMEA Business. Effective from FY2017, the Fragrance business in Latin America included in the EMEA Business under the Company s previous segment classification structure has been included in the Americas Business. *2. Year-on-year percentage change of sales of existing business is -12% excluding the acquisition of Laura Mercier, and the licensing of Dolce&Gabbana. *3. Year-on-year percentage change of sales of existing business is +7% excluding the licensing of Dolce&Gabbana. *4. See Supplemental Data 11 for details about changes in reportable segment. 88


89 Supplemental Data 2: Japan: Strong Sales Growth of Major Brands Store Sales of Major Brands Major brands Prestige*1 Cosmetics Personal Care*2 Above the previous year *1. Including sales at specialty stores *2. Shipment from wholesalers to retailers Below the previous year Unchanged from the previous year 89
90 Supplemental Data 3: Professional (Billion yen) FY2017 FY2016 YoY Change YoY Change % YoY Change in Local Currency % Professional (Billion yen) FY2017 FY2016 YoY Change YoY Change % Operating Income Operating Profitability (%) pt Income Before Amortization of Goodwill, etc Operating Profitability (%) pt *1. See Supplemental Data 11 for details on changes in reportable segments. *2. Operating profitability is calculated using net sales including intersegment transactions. 90
91 Supplemental Data 4: FY2017 Results of Operating Income by Reportable Segment (Billion yen) FY2017 Operating Profitability % FY2016 Operating Profitability % YoY Change YoY Change % Japan China Asia Pacific Americas ー EMEA ー Travel Retail Professional Other ー Subtotal Adjustments -8.7 ー 0.7 ー -9.4 ー Total *1. Operating profitability is calculated using net sales including intersegment transactions. *2. See Supplemental Data 11 for information about segment changes. 91
92 Supplemental Data 5: Lower fixed-cost ratio as a result of higher sales Progress toward ideal cost structure (Billion yen) FY2017 % of Net Sales Change in % of Net Sales YoY Change % YoY Change Change Excluding Impact of Foreign Currency Exchange SG&A Marketing Costs Brand Development Cost and R&D Expenses Personnel Expenses Other Expenses *1. The + and - symbols in YoY Change are used to indicate increase and decrease in amount and as a percentage of net sales, respectively. *2. Marketing Costs includes POS personnel expenses. 92
93 Supplemental Data 6: Other Income and Expenses and Extraordinary Income and Losses Other Income and Expenses Extraordinary Income and Losses (Billion yen) FY2017 FY2016 Interest Income Interest Expense Net Interest Income and Expense Foreign Exchange Gain/Loss (Billion yen) FY2017 FY2016 Gain on Transfer of Business Gain/Loss on Sales or Disposal of Property, Plant and Equipment Gain/Loss on Sales of Investments in Securities and Loss on Revaluation of Investments in Securities Structural Reform Expenses, etc Impairment Loss Voluntary Product Recall- Related Expenses Other Information Security Expenses Total Total *1. Gain on Transfer of Business: Transfer of intellectual property rights associated with the Jean Paul GAULTIER brand in 2016 *2. Gain/Loss on Sales or Disposal of Property, Plant and Equipment: Sale of land at the former Kamakura factory in 2016 *3. Structural Reform Expenses, etc.: Early retirement premiums that were being pursued in all regions, etc. 93
94 Supplemental Data 7: Consolidated Balance Sheets (Billion yen) Total Current Assets Cash, Time Deposits and Short-Term Investments in Securities Notes & Accounts Receivable Dec. 31, 2017 Change from Dec. 31, 2016 Excl. Impact of Impact of Foreign Foreign Currency Currency Exchange Exchange Inventories Total Fixed Assets Property, Plant and Equipment Intangible Assets Investments and Other Assets Total Assets Exchange Rates: Dec. 31, 2016: USD 1= JPY 116.5; EUR 1 = JPY 122.7; CNY 1 = JPY 16.8 Dec. 31, 2017: USD 1= JPY 113.1; EUR 1 = JPY 135.0; CNY 1 = JPY 17.3 Change Excl. Impact of Dec. 31, from Impact of Foreign 2017 Dec. 31, Foreign Currency 2016 Currency Exchange (Billion yen) Exchange Total Liabilities Notes & Accounts Payable and Other Payables Interest-Bearing Debt Long-term Payables Liability for Retirement Benefits Total Net Assets Shareholders Equity ー ー Accumulated Other Comprehensive ー ー Income Non-Controlling Interests ー ー Total Liabilities and Net Assets Equity Ratio: 44.6% * Main line items only Interest-Bearing Debt Ratio: 15.4% (Excluding long-term payables related to payment for the D&G trademark right) 94
95 Supplemental Data 8: Net Income Attributable to Owners of Parent and Comprehensive Income FY2017 FY2016 (Billion yen) Net Income before Income Taxes Income Taxes (Tax Rate) 13.2 (34.2) 15.9 (32.0) Net Income Attributable to Non-Controlling Interests Net Income Attributable to Owners of Parent FY2017 FY2016 Comprehensive Income

 Integrated purchasing of materials")


 Shared services Systems integration and")

 Strategic purchasing activities")

96 Supplemental Data 9: Cost Structure Reform Exceeded Initial Plan by Global Initiatives Withdraw from unprofitable businesses (in Greece, Turkey, and other countries) Integrated purchasing of materials Efficiency improvement of supply chain Outer circle: FY2017 Middle circle: FY2016 Inner circle: FY2015 Operations in Japan Operations in Americas Operations in China Operations in EMEA Full use of shared and competitive purchasing for sales promotion materials Revised lease contracts Strengthened supplier negotiation Outsourced distribution Effect of the cost structure reform Cumulative total for the three years: 63.3 billion (FY2017: 11.8 billion) Shared services Systems integration and consolidation Outsourcing Reducing extra sales promotion materials 63.3 billion Optimized product specifications (reviewed materials part by part) Strategic purchasing activities Enhanced cost management process Selection and concentration for sales promotion materials Global purchasing 33.8 billion 22.0 billion 11.8 billion 14.5 billion 7.5 billion FY2015 FY2016 FY billion 22.0 billion 7.5 billion 96
97 Supplemental Data 10: Capital Expenditures, Depreciation and Amortization (Billion yen) FY2017 FY2016 Capital Expenditures* Property, Plant and Equipment Intangible Assets, etc Depreciation and Amortization Property, Plant and Equipment Intangible Assets, etc R&D Expenses * Investments in capital expenditures; property, plant and equipment; intangible fixed assets (excl. goodwill, right of trademark, etc.); and long-term prepaid expenses 97
98 Supplemental Data 11: Main Constituents of Old and New Segments 2016 Segments Major Businesses (December 31, 2016) 2017 Segments Major Businesses (December 31, 2017) Japan Overall business in Japan, TR in Japan (Excluding BE and LM) Japan Overall business in Japan, TR in Japan (Excluding BE and PF) China Overall business in China (Excluding BE, LM, and TR) China Overall business in China (Excluding BE, LM, TR, and PF) Asia Pacific Overall business in Asia and Oceania excluding Japan and China (Excluding BE, LM, and TR) Asia Pacific Overall business in Asia and Oceania excluding Japan and China (Excluding BE, LM, TR, and PF) Americas Overall business in the Americas, BE, LM, and ZOTOS (Excluding TR) Americas Overall business in the Americas (Excluding TR and PF) EMEA Overall business in EMEA and fragrances* 2 (Excluding BE, LM, and TR) EMEA Overall business in EMEA (Excluding LM and TR) Travel Retail Overall business at duty-free shops worldwide outside Japan (Excluding TR in fragrances* 2 ) Travel Retail Overall business at duty-free shops all over the world outside Japan (Excluding TR in fragrances* 2 ) BE: Bare Escentuals LM: Laura Mercier and RéVive TR: Travel Retail Business PF: Professional Business EMEA: Europe, the Middle East, and Africa Professional Other Overall Professional Business all over the world Production Business, Frontier Science Business, restaurant operation, and others *1. Starting from the current fiscal year, the Professional Business, which was previously included in each business excluding EMEA and TR, is included in the Professional Business. *2. Fragrances Business exclude SHISEIDO fragrance and include Dolce&Gabbana, ISSEY MIYAKE, and narciso rodriguez. *3. Effective from FY2017, bareminerals, NARS etc. in the U.K. included in the Americas Business under the Company s previous segment classification structure have been included in the EMEA Business. Effective from FY2017, the Fragrance business in Latin America included in the EMEA Business under the Company s previous segment classification structure has been included in the Americas Business. 98
99 Supplemental Data 12: Changes in Financial Indicators and Other Figures 2012/3 2013/3 2014/3 2015/3 2015/ / /12 Irregular Account Settlement *2 After Adjustment Financial indicators Share price indicators Operating profitability % EBITDA margin % EPS BPS ,060 Cash dividend per share ROE % Interest-bearing debt ratio *1 % Payout ratio % PER Times PBR Times Market capitalization Billion yen , , ,175.4 Year-end share price 1,428 1,327 1,816 2,133 2,529-2,959 5,446 Rate of increase/decrease % (For reference) TOPIX(year-end) , , , , , , Rate of increase/decrease % /3 2013/3 2014/3 2015/3 2015/ / /12 Strategic shareholdings Irregular Account Settlement *2 After Adjustment Number of holdings companies Amount Billion yen *1. Interest-bearing debt ratio = Interest-bearing debt / Invested capital Invested capital = Interest - bearing debt + Total net assets *2. FY2015 Japan: April to December; Overseas: January to December 99
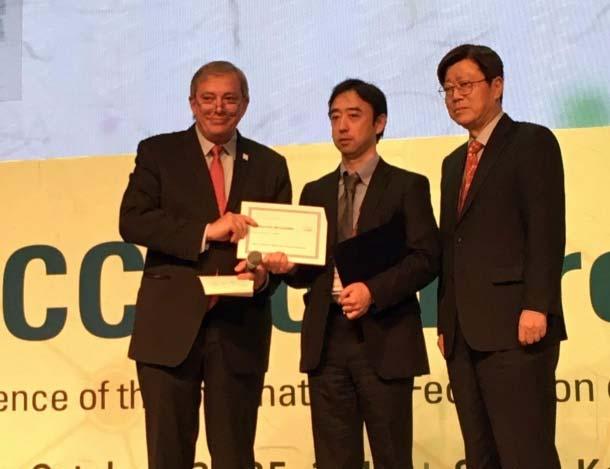
100 Supplemental Data 13: Major Public Announcements News Releases November 2017: Shiseido Releases a New IoT Skincare System, Optune, that Delivers Personalized Skincare November 2017: Notice of Transfer of Prestige Skincare Brand RéVive November 2017: Shiseido Announces Appointment of Franck Marilly as President & CEO of Shiseido Group EMEA November 2017: Louis Desazars to Depart as President and CEO of Shiseido Group EMEA November 2017: Shiseido Americas Acquires Giaran, Inc. November 2017: Shiseido Company, Limited Reveals an Innovative Neuroscience Inspired Skincare Range from Brand SHISEIDO October 2017: October 2017: October 2017: Notice of Transfer of Zotos International, Inc. Shiseido Wins Top Award at IFSCC Conference 2017 in Seoul Shiseido Establishes a New Factory in Ohtawara City, Tochigi Prefecture October 2017: Notice of Abolishment of the Counselor/Adviser System, and Partial Change of the Corporate Officer System September 2017: Notice and Apology Regarding Voluntary Recall of INTEGRATE Killer Wink Gel Liner September 2017: SHISEIDO Launches a New Cream with Recognized Anti-Wrinkle and Whitening Effects Second launch under Shiseido Facial Expression Project. Industry first! Release of quasi-drug anti-wrinkle and whitening cream August 2017: Notice of Transfer of Chromatography Business July 2017: Notice and Apology Regarding Voluntary Recall of Shiseido Group Products (Sunscreens) July 2017: Notice and Apology Regarding Voluntary Recall of Body Wash Products 100
101 Supplemental Data 14: Major Public Announcements News Releases May 2017: April 2017: April 2017: April 2017: March 2017: Notice of Transfer of Shares, etc. in a Subsidiary (KINARI Inc.) Launch of the Shiseido Facial Expression Project New Initiatives Started on April 20, 2017 to Help Women Enrich Their Facial Expressions with Technologies for Improving Skin Wrinkles New Efficacy! Birth of an Enriched Beauty Cream, a Quasi-Drug Containing Retinol That Improves Even Deep Wrinkles ELIXIR SUPERIEUR Enriched Wrinkle Cream S Shiseido to Terminate Global Distribution Agreements with Burberry Aiming at Selection and Concentration of Business Operations Shiseido Japan to Start the Brand Business of Laura Mercier, a U.S. Makeup Brand, in Japan February 2017: Recognition of Effect and Efficacy in Improving Skin Wrinkles with Retinol Acting Ingredient Acquired for the First Time in Japan Deep Wrinkles Improved in Nine Weeks February 2017: Notice of Completion of the Setup of Joint Venture, KODOMOLOGY Co., Ltd. to Promote Childcare Business January 2017: Notice of Acquisition of a U.S.-based Start-up, MATCHCo. Obtaining a Smartphone App-based Technology to Formulate Customized Foundation 101
FY2017 Third Quarter Results and Full-Year Forecast
 Third Quarter Results and Full-Year Forecast November 9, 2017 Norio Tadakawa Corporate Officer, CFO Shiseido Company, Limited In this document, statements other than historical facts are forward-looking
FY2017 First Half Results
 FY2017 First Half Results August 9, 2017 Norio Tadakawa Corporate Officer, CFO Shiseido Company, Limited In this document, statements other than historical facts are forward-looking statements that reflect
Results for FY2016 and Forecast for FY2017
 Results for FY2016 and Forecast for FY2017 February 9, 2017 Norio Tadakawa Corporate Officer, CFO Shiseido Company, Limited FY2016: Executive Summary Net sales: 850.3 billion YoY change in local currency:
FY2018 First Quarter Results
 First Quarter Results Norio Tadakawa May 11, 2018 Corporate Executive Officer, CFO Shiseido Company, Limited In this document, statements other than historical facts are forward-looking statements that
Consolidated Settlement of Accounts for the First Nine Months of the Fiscal Year Ending December 31, 2017 [Japanese Standards]
![Consolidated Settlement of Accounts for the First Nine Months of the Fiscal Year Ending December 31, 2017 [Japanese Standards]](/thumbs/73/69406348.jpg "Consolidated Settlement of Accounts for the First Nine Months of the Fiscal Year Ending December 31, 2017 [Japanese Standards]") Shiseido Company, Limited (4911) Consolidated Settlement of Accounts for the First Nine Months of the Fiscal Year Ending December 31, 2017 The figures for these financial statements are prepared in accordance
Shiseido Company, Limited (4911) Consolidated Settlement of Accounts for the First Nine Months of the Fiscal Year Ending December 31, 2017 The figures for these financial statements are prepared in accordance
Results for FY2016 and Forecast for FY2017
 Results for FY2016 and Forecast for FY2017 February 9, 2017 Norio Tadakawa Corporate Officer, CFO Shiseido Company, Limited FY2016: Executive Summary Net sales: 850.3 billion YoY change in local currency:
Consolidated Settlement of Accounts for the First Half of the Fiscal Year Ending December 31, 2018 [Japanese Standards]
![Consolidated Settlement of Accounts for the First Half of the Fiscal Year Ending December 31, 2018 [Japanese Standards]](/thumbs/87/97238154.jpg "Consolidated Settlement of Accounts for the First Half of the Fiscal Year Ending December 31, 2018 [Japanese Standards]") Shiseido Company, Limited (4911) Consolidated Settlement of Accounts for the First Half of the Fiscal Year Ending December 31, 2018 The figures for these financial statements are prepared in accordance
Shiseido Company, Limited (4911) Consolidated Settlement of Accounts for the First Half of the Fiscal Year Ending December 31, 2018 The figures for these financial statements are prepared in accordance
Consolidated Settlement of Accounts for the Fiscal Year Ended December 31, 2017 [Japanese Standards]
![Consolidated Settlement of Accounts for the Fiscal Year Ended December 31, 2017 [Japanese Standards]](/thumbs/82/85892545.jpg "Consolidated Settlement of Accounts for the Fiscal Year Ended December 31, 2017 [Japanese Standards]") Shiseido Company, Limited (4911) Consolidated Settlement of Accounts for the December 31, 2017 The figures for these financial statements are prepared in accordance with the accounting principles based
Shiseido Company, Limited (4911) Consolidated Settlement of Accounts for the December 31, 2017 The figures for these financial statements are prepared in accordance with the accounting principles based
FY2016 First Half Results and Full-Year Forecast
 FY2016 First Half Results and Full-Year Forecast August 9, 2016 Masahiko Uotani President and Group CEO FY2016 1H Results 1 FY2016 1H Results: Executive Summary Back on growth track, with zero growth behind
FY2016 First Half Results and Full-Year Forecast. August 9, Masahiko Uotani. President and Group CEO. FY2016 1H Results
 First Half Results and Full-Year Forecast August 9, 2016 Masahiko Uotani President and Group CEO 1H Results 1 1H Results: Executive Summary Back on growth track, with zero growth behind us Sustained growth
Consolidated Settlement of Accounts for the First Half of the Fiscal Year Ending December 31, 2016
 Shiseido Company, Limited (4911) Consolidated Settlement of Accounts for the First Half of the Fiscal Year Ending December 31, 2016 The figures for these financial statements are prepared in accordance
FY2018 First Half Results
 FY2018 First Half Results Norio Tadakawa August 8, 2018 Corporate Executive Officer, CFO Shiseido Company, Limited In this document, statements other than historical facts are forward-looking statements
I would like to review our business results for the first quarter of fiscal 2016 and explain our outlook for fiscal 2016.
 I would like to review our business results for the first quarter of fiscal 2016 and explain our outlook for fiscal 2016. 1 2 First, to sum up first-quarter results, all figures for sales and income at
Consolidated Settlement of Accounts for the Fiscal Year Ended December 31, 2016
 Shiseido Company, Limited (4911) Consolidated Settlement of Accounts for the December 31, 2016 The figures for these financial statements are prepared in accordance with the accounting principles based
Consolidated Settlement of Accounts for. the First Two Quarters of the Fiscal Year Ending December 31, 2015
 Shiseido Company, Limited (4911) Consolidated Settlement of Accounts for the First Two Quarters of the Fiscal Year Ending December 31, 2015 The figures for these financial statements are prepared in accordance
FY2014 First Half Results
 は FY2014 First Half s October 31, 2014 Norio Tadakawa Corporate Officer, CFO Shiseido Co., Ltd. In this document, statements other than historical facts are forward-looking statements that reflect our
Enhancing cash flow management and capital efficiency toward increased corporate value over the medium-to-long term
 FINANCIAL STRATEGY Message from the CFO Enhancing cash flow management and capital efficiency toward increased corporate value over the medium-to-long term Norio Tadakawa Corporate Executive Officer Chief
Financial Results for FY2015
 Financial Results for FY2015 February 9, 2016 Norio Tadakawa Corporate Officer, CFO Shiseido Co., Ltd. 1 Fiscal Years FY2015 Domestic 1 : Apr.-Dec. 2015, Overseas: Jan.-Dec. 2015 FY2014 Domestic 1 : Apr.
Results for Year Ended March 2013 Outlook for Year Ending March 2014
 SHISEIDO Co., Ltd. Results for Year Ended March 2013 Outlook for Year Ending March 2014 2013-4-26 In this document, statements other than historical facts are forward-looking statements that reflect our
Consolidated Settlement of Accounts for the First 2 Quarters Ended September 30, 2013 [Japanese Standards]
![Consolidated Settlement of Accounts for the First 2 Quarters Ended September 30, 2013 [Japanese Standards]](/thumbs/92/108990988.jpg "Consolidated Settlement of Accounts for the First 2 Quarters Ended September 30, 2013 [Japanese Standards]") The figures for these Financial Statements are prepared in accordance with the accounting principles based on Japanese law. Accordingly, they do not necessarily match the figures in the Annual Report issued
The figures for these Financial Statements are prepared in accordance with the accounting principles based on Japanese law. Accordingly, they do not necessarily match the figures in the Annual Report issued
Consolidated Settlement of Accounts for the First 2 Quarters of the Fiscal Year Ending March 31, 2015 [Japanese Standards]
![Consolidated Settlement of Accounts for the First 2 Quarters of the Fiscal Year Ending March 31, 2015 [Japanese Standards]](/thumbs/84/89184789.jpg "Consolidated Settlement of Accounts for the First 2 Quarters of the Fiscal Year Ending March 31, 2015 [Japanese Standards]") The figures for these Financial Statements are prepared in accordance with the accounting principles based on Japanese law. Accordingly, they do not necessarily match the figures in the Annual Report issued
The figures for these Financial Statements are prepared in accordance with the accounting principles based on Japanese law. Accordingly, they do not necessarily match the figures in the Annual Report issued
Results for the Nine Months of Fiscal 2011: Supplementary Materials POLA ORBIS HOLDINGS INC. DIRECTOR OF FINANCE/MANAGEMENT PLANNING DIV.
 Results for the Nine Months of Fiscal 2011: Supplementary Materials POLA ORBIS HOLDINGS INC. DIRECTOR OF FINANCE/MANAGEMENT PLANNING DIV. Naoki Kume This report contains projections of performance and
First Quarter Results and Outlook
 SHISEIDO Co., Ltd. FY2013 First Quarter Results and Outlook July 31, 2013 In this document, statements other than historical facts are forward-looking statements that reflect our plans and expectations.
First-Half Results and Full-Year Outlook for the Fiscal Year Ending March Shinzo Maeda President & CEO Shiseido Co., Ltd. 1
 First-Half Results and Full-Year Outlook for the Fiscal Year Ending March 2010 Shinzo Maeda President & CEO Shiseido Co., Ltd. 1 First-Half Results for the year ended March 2010 Results YoY change Local
Consolidated Settlement of Accounts for the Nine Months Ended December 31, 2009
 The figures for these Financial Statements are prepared in accordance with the accounting principles based on Japanese law. Accordingly, they do not necessarily match the figures in the Annual Report issued
Results for Year Ended March 2013 Outlook for Year Ending March 2014
 My name is Shinzo Maeda, Chairman and President of Shiseido. SHISEIDO Co., Ltd. Results for Year Ended March 2013 Outlook for Year Ending March 2014 Before we begin, I would like to talk a little about
First Three Quarters Results and Outlook
 SHISEIDO Co., Ltd. First Three Quarters Results and Outlook 2014-1-31 In this document, statements other than historical facts are forward-looking statements that reflect our plans and expectations. These
Summary of Financial Results For the Fiscal Year Ended December 31, 2015 (Consolidated)
") Summary of Financial Results For the Fiscal Year Ended December 31, 2015 (Consolidated) These financial statements have been prepared in accordance with accounting principles and practices generally accepted
Summary of Financial Results For the Fiscal Year Ended December 31, 2015 (Consolidated) These financial statements have been prepared in accordance with accounting principles and practices generally accepted
Summary of Financial Results For the Nine Months of the Fiscal Year Ending December 31, 2016 (Consolidated)
") Summary of Financial Results For the Nine Months of the Fiscal Year Ending December 31, 2016 (Consolidated) These financial statements have been prepared in accordance with accounting principles and practices
Summary of Financial Results For the Nine Months of the Fiscal Year Ending December 31, 2016 (Consolidated) These financial statements have been prepared in accordance with accounting principles and practices
Facing rea. Shiseido has been beauty for over 140 expectations for gro
 Facing rea Shiseido has been beauty for over 140 expectations for gro 2 lity. helping consumers pursue years, but it has not met wth. Position Annual Sales 5th* in the World * WWD Beauty Inc. ranking among
Fiscal Year Ending March 31, 2019 Second Quarter Business Results Presentation. Wacoal Holdings Corp. November 2018
 Fiscal Year Ending March 31, 2019 Second Quarter Business Results Presentation Wacoal Holdings Corp. November 2018 1 Contents FY2019 2Q Financial Results Summary FY2019 Business Results Forecast Comprehensive
Summary of Financial Results For the Fiscal Year Ended December 31, 2016 (Consolidated)
") Summary of Financial Results For the Fiscal Year Ended December 31, 2016 (Consolidated) These financial statements have been prepared in accordance with accounting principles and practices generally accepted
Summary of Financial Results For the Fiscal Year Ended December 31, 2016 (Consolidated) These financial statements have been prepared in accordance with accounting principles and practices generally accepted
Flash Report for the 3rd Quarter of the Fiscal Year Ending December 31, 2018 [Japan GAAP] (on a consolidated basis)
![Flash Report for the 3rd Quarter of the Fiscal Year Ending December 31, 2018 [Japan GAAP] (on a consolidated basis)](/thumbs/92/110340460.jpg "Flash Report for the 3rd Quarter of the Fiscal Year Ending December 31, 2018 [Japan GAAP] (on a consolidated basis)") This document has been translated from the Japanese original document for reference purposes only. In the event of any discrepancy between this translated document and the Japanese original, the original
This document has been translated from the Japanese original document for reference purposes only. In the event of any discrepancy between this translated document and the Japanese original, the original
Consolidated Settlement of Accounts for the Fiscal Year Ended March 31, 2010
 The figures for these Financial Statements are prepared in accordance with the accounting principles based on Japanese law. Accordingly, they do not necessarily match the figures in the Annual Report issued
Fourth quarter and full-year report 2018
 Fourth quarter and full-year report Stockholm, January 25, 2019 Fourth quarter highlights Sales as reported increased by 10% YoY and sales adjusted for comparable units and currency increased by 4%. Networks
FY09 Summary of Financial Results (Consolidated) April 30, 2010
 April 30, 2010") FY09 Summary of Financial Results (Consolidated) April 30, 2010 Company Name Wacom Co., Ltd. (Code Number: 6727 TSE1) (URL http://www.wacom.co.jp) Representative: Masahiko Yamada, CEO TEL: 03-5309-1500
FY09 Summary of Financial Results (Consolidated) April 30, 2010 Company Name Wacom Co., Ltd. (Code Number: 6727 TSE1) (URL http://www.wacom.co.jp) Representative: Masahiko Yamada, CEO TEL: 03-5309-1500
Third Quarter of the Fiscal Year Ending December 31, 2016 Unicharm Presentation Materials for Investor Meeting
 Third Quarter of the Fiscal Year Ending December 31, 2016 Unicharm Presentation Materials for Investor Meeting November 4, 2016 Takahisa Takahara President and CEO Unicharm Corporation Projections stated
Consolidated Settlement of Accounts for the First Quarter Ended June 30, 2009
 The figures for these Financial Statements are prepared in accordance with the accounting principles based on Japanese law. Accordingly, they do not necessarily match the figures in the Annual Report issued
New Medium and Long-term Business Plan
 To Everyone February 10, 2017 Company Name: NICCA CHEMICAL CO., LTD. Representative: Yasumasa Emori, President (Stock Exchange Code: 4463 TSE 1 st Section and NSE 1 st Section) Inquiries: Shoya Sawasaki
Fourth quarter and full-year report 2017 Stockholm, January 31, 2018
 Fourth quarter and full-year report Stockholm, January 31, 2018 FOURTH QUARTER HIGHLIGHTS See page > > Reported sales decreased by -12%. Sales adjusted for comparable units and currency declined by -7%
Supplemental Documents for Fiscal Year May 15, 2015 Nippon Suisan Kaisha, Ltd.
 Supplemental Documents for Fiscal Year 214 May 15, 215 Nippon Suisan Kaisha, Ltd. Overview of FY214 Both revenue and income increased in Marine Products and Food Products. Revenue and income decreased
Driving growth and productivity
 Driving growth and productivity AUTHENTIC BRITISH HERITAGE ROOTED IN OUTERWEAR ONE GLOBAL BRAND DIVERSIFIED BUSINESS MODEL BROAD APPEAL ACROSS GENDERS AND GENERATIONS FOUNDATIONS LAID FOR THE FUTURE STRONG
Summary of Financial Statements (Consolidated) for the Fiscal Year Ended December 31, 2018 (Japanese GAAP)
 for the Fiscal Year Ended December 31, 2018 (Japanese GAAP)") Note; This document is a partial translation of "Kessan Tanshin" for the Fiscal Year Ended December 31, 2018 and is provided solely for reference purposes. In the event of any inconsistency between the
Note; This document is a partial translation of "Kessan Tanshin" for the Fiscal Year Ended December 31, 2018 and is provided solely for reference purposes. In the event of any inconsistency between the
Interim Results. For the six months ended June 30, 2011
 Interim Results For the six months ended June 30, 2011 Agenda Business and Financial Highlights Business Overview Financial Overview Concluding Remarks 2 Business Highlights in 1H 2011 Significant sales
Highlights for FY2005
 Highlights for FY2005 April 24, 2006 Motoki Ozaki President and CEO Kao Corporation This is a translation of materials used for the analyst meeting held in Japan on April 24, 2006. These presentation materials
2,033.8 Billions of yen Billions of cigarettes Billions of cigarettes Billions of yen 8.7 % 20.3 % 33, yen up 32.
 Financial Highlights Japan Tobacco Inc. and Consolidated Subsidiaries / Fiscal year ended March 31, 2012 Business Scale JT Group Sales Volume Japanese Domestic Tobacco Business 108.4 Billions of cigarettes
Summary of Financial Results for the Fiscal Year Ended March 31, 2006 (Consolidated)
") K O S É May 10, 2006 Summary of Financial Results for the Fiscal Year Ended March 31, 2006 (Consolidated) Company name: KOSÉ Corporation Stock code: 4922 Stock Exchange listing: Tokyo Stock Exchange, First
K O S É May 10, 2006 Summary of Financial Results for the Fiscal Year Ended March 31, 2006 (Consolidated) Company name: KOSÉ Corporation Stock code: 4922 Stock Exchange listing: Tokyo Stock Exchange, First
CMIC HOLDINGS Co., Ltd. Consolidated Financial Results
 (Note) This translation is prepared and provided for readers' convenience only. In the event of any discrepancy between this translated document and the original Japanese document, the original document
Second Quarter Financial Results Fiscal Year 2018 (Ending March 2019)
") Second Quarter Financial Results Fiscal Year 2018 (Ending March 2019) October 30, 2018 SEIKO EPSON CORPORATION 2018. All rights reserved. 1 Disclaimer regarding forward-looking statements The foregoing
Second Quarter Financial Results Fiscal Year 2018 (Ending March 2019) October 30, 2018 SEIKO EPSON CORPORATION 2018. All rights reserved. 1 Disclaimer regarding forward-looking statements The foregoing
Topics. 1. Full Year FY2017 Performance P Q FY2017 Performance P FY2018 Consolidated Performance Forecast & Shareholder returns
 Topics 1. Full Year FY2017 Performance P.2 2. 4Q FY2017 Performance P.14 3. FY2018 Consolidated Performance Forecast & Shareholder returns P.23 4. Business Overview P.26 5. Supplementary Materials P.44
Kao Corporation News Release January 22, 2007
 Summary of Consolidated Business Results for the Third Quarter Ended December 31, 2006 Tokyo, January 22, 2007 Kao Corporation today announced its consolidated business results for the nine months ended
Highlights for FY2013
 Highlights for FY2013 (Ended December 31, 2013) February 4, 2014 Kao Corporation Michitaka Sawada President and CEO These presentation materials are available on our website in PDF format: http://www.kao.com/jp/en/corp_ir/presentations.html
CA Cheuvreux Autumn Conference. Mr Jean Paul AGON Chief Executive Officer. September 30 th, September 30th,
 CA Cheuvreux Autumn Conference September 30 th, 2010 Mr Jean Paul AGON Chief Executive Officer September 30th, 2010 1 A few figures 1 st cosmetics group worldwide 23 international brands 17.5 billion euros
THE GLOBAL HOUSE OF PRESTIGE BEAUTY FABRIZIO FREDA NOVEMBER 13, 2018 PRESIDENT AND CHIEF EXECUTIVE OFFICER
 THE GLOBAL HOUSE OF PRESTIGE BEAUTY NOVEMBER 13, 2018 FABRIZIO FREDA PRESIDENT AND CHIEF EXECUTIVE OFFICER FORWARD-LOOKING INFORMATION Statements in this presentation may constitute forward-looking statements
Consolidated Financial Results for the Six Months Ended June 30, 2018 and FY2018 Forecast
 Consolidated Financial Results for the Six Months Ended June 30, 2018 and FY2018 Forecast Kenichi Yamauchi Executive Officer Senior Vice President, Accounting & Finance Kao Corporation July 26, 2018 These
(3) Consolidated Cash flow Position Cash flows from Operating activities Cash flows from investing activities Cash flows from Financing activities Cas
 Consolidated Cash flow Position Cash flows from Operating activities Cash flows from investing activities Cash flows from Financing activities Cas") Note; This document is a partial translation of "Kessan Tanshin" for the Fiscal Year Ended December 31, 2017 and is provided solely for reference purposes. In the event of any inconsistency between the
Note; This document is a partial translation of "Kessan Tanshin" for the Fiscal Year Ended December 31, 2017 and is provided solely for reference purposes. In the event of any inconsistency between the
Summary of Financial Results for FY2016
 Summary of Financial Results for FY2016 Recruit Holdings Co., Ltd. Results for FY2016 Consolidated Earnings Summary Consolidated net sales increased by 15.8% year-on-year to 1,839.9 billion yen. EBITDA
Important notice. Consolidated Financial Results for FY2014 and Guidance for FY2015. François-Xavier Roger Chief Financial Officer
 Consolidated Financial Results for FY2014 and Guidance for FY2015 François-Xavier Roger Chief Financial Officer May 15, 2015 Important notice Forward-Looking Statements This presentation contains forward-looking
Kao Corporation News Release July 24, 2006
 Summary of Consolidated Business Results for the First Quarter Ended June 30, 2006 Tokyo, July 24, 2006 today announced its consolidated business results for the three months ended June 30, 2006, the first
FamilyMart UNY Holdings Co., Ltd. Fiscal 2016 Financial Review
 FamilyMart UNY Holdings Co., Ltd. Fiscal 2016 Financial Review April 2017 Cautionary Statement: This report contains forward-looking statements, including the Company s strategies, future business plans,
Analyst and Investor Briefing on the Third Quarter of Fiscal Year Ending March 31, 2016 (FY2016.3) February 5, 2016
 February 5, 2016") Yama ha Corporati on Analyst and Investor Briefing on the Third Quarter of Fiscal Year Ending March 31, 2016 (FY2016.3) February 5, 2016 Overview of Performance in the Third Quarter (October-December)
Yama ha Corporati on Analyst and Investor Briefing on the Third Quarter of Fiscal Year Ending March 31, 2016 (FY2016.3) February 5, 2016 Overview of Performance in the Third Quarter (October-December)
OMRON CORPORATION FINANCIAL FACT BOOK 2018
 OMRON CORPORATION FINANCIAL FACT BOOK 218 CONTENTS Page Sales Data Net Sales P.1 Foreign Exchange Rates Sales by Business Segment P.2 Sales by Region P.3 Profit Data Gross Profit, Gross Profit / Net Sales
Tokyo (first section) Yoshihito Yamada, President and CEO
 Yoshihito Yamada, President and CEO") Summary of Consolidated Financial Results for the Third Quarter of the Fiscal Year Ending March 31, 2018 (U.S. GAAP) January 30, 2018 OMRON Corporation (6645) Exchanges Listed: Tokyo (first section) URL:
Summary of Consolidated Financial Results for the Third Quarter of the Fiscal Year Ending March 31, 2018 (U.S. GAAP) January 30, 2018 OMRON Corporation (6645) Exchanges Listed: Tokyo (first section) URL:
Presentation for Institutional Investors (FY16 1 st Half)
") Nippon Paint Holdings Co., Ltd. Presentation for Institutional Investors (FY16 1 st Half) November 17, 2016 Nippon Paint Holdings Co., Ltd. Tetsushi Tado, President & CEO Table of Contents 1.Financial
Nippon Paint Holdings Co., Ltd. Presentation for Institutional Investors (FY16 1 st Half) November 17, 2016 Nippon Paint Holdings Co., Ltd. Tetsushi Tado, President & CEO Table of Contents 1.Financial
Consolidated Financial Results for the Fiscal Year Ended March 31, 2018 [Japanese GAAP]
![Consolidated Financial Results for the Fiscal Year Ended March 31, 2018 [Japanese GAAP]](/thumbs/87/97109926.jpg "Consolidated Financial Results for the Fiscal Year Ended March 31, 2018 [Japanese GAAP]") This is an abridged translation of the original document in Japanese and is intended for reference purposes only. In the event of any discrepancy between this translated document and the Japanese original,
This is an abridged translation of the original document in Japanese and is intended for reference purposes only. In the event of any discrepancy between this translated document and the Japanese original,
Financial Results for the Fiscal Year Ended December, Lion Corporation Itsuo Hama Representative Director and President, Executive Officer
 February 10, 2017 Financial Results for the Fiscal Year Ended December, 2016 Lion Corporation Itsuo Hama Representative Director and President, Executive Officer Contents Financial Results for 2016 Financial
INTERVIEW WITH THE PRESIDENT
 INTERVIEW WITH THE PRESIDENT In addition to promoting Value and Network Management by leveraging our strengths, we will increase capital efficiency with the aim of enhancing corporate value. Naoki Izumiya
(1) Consolidated operating results (cumulative) (% of change from previous year) Net sales Operating profit Ordinary profit
 Consolidated operating results (cumulative) (% of change from previous year) Net sales Operating profit Ordinary profit") (English Translation) This English translation is an abridged version of the original document in Japanese. In the event of any discrepancy, the Japanese version prevails. Summary of Consolidated Financial
(English Translation) This English translation is an abridged version of the original document in Japanese. In the event of any discrepancy, the Japanese version prevails. Summary of Consolidated Financial
Agenda. 1. Highlights FY 2012 Results. 2. Operational Performance Priorities for Financials. 5. Conclusion
 1MARCH 2013 Legal Disclaimer Information in this presentation may involve guidance, expectations, beliefs, plans, intentions or strategies regarding the future. These forward-looking statements involve
Consolidated Financial Results For the Third Quarter of the Fiscal Year Ending March 31, 2018 (For the First Nine Months Ended December 31, 2017)
") Consolidated Financial Results For the Third Quarter of the Fiscal Year Ending March 31, 2018 (For the First Nine Months Ended December 31, 2017) Prepared in Conformity with Generally Accepted Accounting
Consolidated Financial Results For the Third Quarter of the Fiscal Year Ending March 31, 2018 (For the First Nine Months Ended December 31, 2017) Prepared in Conformity with Generally Accepted Accounting
INTERIM RESULTS FOR THE SIX MONTHS ENDED 30 SEPTEMBER 2016
 INTERIM RESULTS FOR THE SIX MONTHS ENDED 30 SEPTEMBER 2016 1 CHRISTOPHER BAILEY CHIEF CREATIVE AND CHIEF EXECUTIVE OFFICER introduction FINANCIAL REVIEW Five key strategies September show and Festive QUESTIONS
Lenovo Group Limited. 2005/06 3Q Results. January 26, Lenovo
 Lenovo Group Limited 2005/06 3Q Results January 26, 2006 1 Lenovo Financial Summary 2Q 2005/06 3Q 2005/06 YTD 2005/06 HK$ mn Y/Y HK$ mn Y/Y HK$ mn Y/Y Turnover 28,494 404% 31,066 392% 79,173 344% GP %
Financial Information
 Financial Information Contents 055 056 058 070 Balance Sheets 072 Statements of Income 073 Statements of Changes in Equity 074 Statements of Cash Flows 075 Notes to 102 Independent Auditors Report 056
OMRON CORPORATION FINANCIAL FACT BOOK 2017
 OMRON CORPORATION FINANCIAL FACT BOOK 217 CONTENTS Page Sales Data Net Sales P.1 Foreign Exchange Rates Sales by Business Segment P.2 Sales by Region P.3 Profit Data Gross Profit, Gross Profit / Net Sales
Summary of Consolidated Financial Results [ IFRS ] for the First Nine Months of the Fiscal Year Ending March 31, 2018 February 6, 2018
![Summary of Consolidated Financial Results [ IFRS ] for the First Nine Months of the Fiscal Year Ending March 31, 2018 February 6, 2018](/thumbs/89/98907676.jpg "Summary of Consolidated Financial Results [ IFRS ] for the First Nine Months of the Fiscal Year Ending March 31, 2018 February 6, 2018") Summary of Consolidated Financial Results [ IFRS ] for the First Nine Months of the Fiscal Year Ending March 31, 2018 February 6, 2018 Listed company name : Sysmex Corporation Code : 6869 Listed stock
Summary of Consolidated Financial Results [ IFRS ] for the First Nine Months of the Fiscal Year Ending March 31, 2018 February 6, 2018 Listed company name : Sysmex Corporation Code : 6869 Listed stock
Henkel AG & Co. KGaA. Klaus Keutmann Frankfurt,
 Henkel AG & Co. KGaA Klaus Keutmann Frankfurt, 21.01.2015 Disclaimer This information contains forward-looking statements which are based on current estimates and assumptions made by the corporate management
Announcement of Financial Results for the 1st Quarter of the Fiscal Year Ending February 28, 2013 (FY2012) July 18, 2012
 July 18, 2012") Announcement of Financial Results for the 1st Quarter of the Fiscal Year Ending February 28, 2013 (FY2012) July 18, 2012 I. Summary of Financial Results for the 1st Quarter of the Fiscal Year Ending February
Announcement of Financial Results for the 1st Quarter of the Fiscal Year Ending February 28, 2013 (FY2012) July 18, 2012 I. Summary of Financial Results for the 1st Quarter of the Fiscal Year Ending February
Summary of Consolidated Financial Results for the First Three Months of the Fiscal Year Ending March 31, 2015 August 5, 2014
 Summary of Consolidated Financial Results for the First Three Months of the Fiscal Year Ending March 31, 2015 August 5, 2014 Listed company name : Sysmex Corporation Code : 6869 Listed stock exchanges
Financial Report for the Third Quarter of the Fiscal Year Ending March 31, 2018 (FY2017) [J-GAAP] (Consolidated)
![Financial Report for the Third Quarter of the Fiscal Year Ending March 31, 2018 (FY2017) [J-GAAP] (Consolidated)](/thumbs/83/87456144.jpg "Financial Report for the Third Quarter of the Fiscal Year Ending March 31, 2018 (FY2017) [J-GAAP] (Consolidated)") Financial Report for the Third Quarter of the Fiscal Year Ending March 31, 2018 (FY2017) [J-GAAP] (Consolidated) February 7, 2018 This document has been translated from the Japanese original, for reference
Financial Report for the Third Quarter of the Fiscal Year Ending March 31, 2018 (FY2017) [J-GAAP] (Consolidated) February 7, 2018 This document has been translated from the Japanese original, for reference
FINANCIAL SUMMARY FOR THE FIRST QUARTER ENDED JUNE 30, 2009
 Company Name: ANRITSU CORPORATION (Code Number:6754) Listed at : Tokyo Stock Exchange URL http://www.anritsu.co.jp/ Representative: Hiromichi Toda ; President and Director Contact Person: Tetsuo Kawabe
Consolidated Financial Results for the Fiscal Year Ended September 30, 2018 (FY9/18)
") Company name: Consolidated Financial Results for the Fiscal Year Ended September 30, 2018 () November 13, 2018 Evolable Asia Corp. Stock Exchange Listing: Stock Code: 6191 URL http://www.evolableasia.com
Company name: Consolidated Financial Results for the Fiscal Year Ended September 30, 2018 () November 13, 2018 Evolable Asia Corp. Stock Exchange Listing: Stock Code: 6191 URL http://www.evolableasia.com
Financial Results for the Fiscal Year Ended March 2016
 Financial Results for the Fiscal Year Ended March 2016 (From April 2015 to March 2016) May 12, 2016 President Takashi Tanaka KDDI Corporation KDDI would like to extend its sincere condolences to the people
Interim results. for the half-year ended 30 September 2010
 Interim results for the half-year ended 30 September 2010 Agenda Results Highlights Strategic Review and Future Prospects 2 1. Results Highlights (million ) Net sales Operating profit Net profit 1 400
Consolidated Financial Results for the Six Months Ended June 30, 2017 [IFRS]
![Consolidated Financial Results for the Six Months Ended June 30, 2017 [IFRS]](/thumbs/82/85721626.jpg "Consolidated Financial Results for the Six Months Ended June 30, 2017 [IFRS]") Consolidated Financial Results for the Six Months Ended June 30, 2017 [IFRS] July 27, 2017 Company name: Kao Corporation Tokyo Stock Exchange in Japan Stock code: 4452 (URL: http://www.kao.com/jp/en/corp_ir/investors.html)
Consolidated Financial Results for the Six Months Ended June 30, 2017 [IFRS] July 27, 2017 Company name: Kao Corporation Tokyo Stock Exchange in Japan Stock code: 4452 (URL: http://www.kao.com/jp/en/corp_ir/investors.html)
TSI Group Medium-term Management Plan FY2013 to
 TSI Group Medium-term Management Plan FY2013 to 2015 2013.4.18 TSI HOLDINGS CO., LTD. Disclaimer This Medium-term Management Plan is based on the TSI Group Medium-term Management Plan for the FY2012 to
Summary of Financial Results for the Year Ended March 2018 [Japanese Standards] (Consolidated)
![Summary of Financial Results for the Year Ended March 2018 [Japanese Standards] (Consolidated)](/thumbs/95/126498549.jpg "Summary of Financial Results for the Year Ended March 2018 [Japanese Standards] (Consolidated)") Summary of Financial Results for the Year Ended March 2018 [Japanese Standards] (Consolidated) MAY 11, 2018 Listed Company Name: Aoyama Trading Co., Ltd. Listed Exchange: Tokyo Stock Exchange Code: 8219
Summary of Financial Results for the Year Ended March 2018 [Japanese Standards] (Consolidated) MAY 11, 2018 Listed Company Name: Aoyama Trading Co., Ltd. Listed Exchange: Tokyo Stock Exchange Code: 8219
Business Results First Six Months of Fiscal Year Ending March 31, 2015
 Business Results First Six Months of Fiscal Year Ending March 31, 215 Sysmex Corporation Hisashi Ietsugu, Chairman and CEO November 6, 214 Contents Chapter 1 Financial Highlights for the First Six Months
attributable to Sales revenue Profit before tax Net profit shareholders of income Cookpad Inc. Fiscal year ended million yen %
 This is a translation of the original Japanese document. If there are any discrepancies between this and the original, the original Japanese document prevails. Cookpad Inc. Consolidated Earnings Results
Financial Overview for Fiscal Year ended December 2017
 0 Financial Overview for Fiscal Year ended December 2017 February 6, 2018 Akihiro Kobayashi President & Chief Operating Officer Kobayashi Pharmaceutical Co., Ltd. Table of Contents 1/37 11 Consolidated
News Contact: Investor Relations: Rainey Mancini (212)
") 767 Fifth Avenue New York, NY 10153 News Contact: Investor Relations: Rainey Mancini (212) 284-3049 Media Relations: Alexandra Trower (212) 572-4430 THE ESTÉE LAUDER COMPANIES DELIVERS OUTSTANDING FISCAL
767 Fifth Avenue New York, NY 10153 News Contact: Investor Relations: Rainey Mancini (212) 284-3049 Media Relations: Alexandra Trower (212) 572-4430 THE ESTÉE LAUDER COMPANIES DELIVERS OUTSTANDING FISCAL
Profile. Contents. Shiseido commenced operations as Japan s first Westernstyle. pharmacy in Tokyo s Ginza district in 1872, a time when
 Profile Shiseido commenced operations as Japan s first Westernstyle pharmacy in Tokyo s Ginza district in 1872, a time when Chinese herbal remedies were the mainstream in Japan. The name Shiseido derives
Strong performance, delivering a record free cash flow Full Year Results 2012
 Strong performance, delivering a record free cash flow Full Year Results 2012 Vernier, 5 th February 2013 Gilles Andrier CEO Full Year Results 2012 Financial Highlights Sales CHF 4.3 billion, up 6.6% in
KONE Result presentation 2017 JANUARY 25, 2018 HENRIK EHRNROOTH, PRESIDENT & CEO ILKKA HARA, CFO
 KONE Result presentation 2017 JANUARY 25, 2018 HENRIK EHRNROOTH, PRESIDENT & CEO ILKKA HARA, CFO Q4 2017 Highlights Orders received grew in all regions and their margin stabilized in the fourth quarter
MONCLER S.P.A.: THE BOARD OF DIRECTORS APPROVES THE HALF-YEAR FINANCIAL REPORT AS OF 30 JUNE
 _ MONCLER S.P.A.: THE BOARD OF DIRECTORS APPROVES THE HALF-YEAR FINANCIAL REPORT AS OF 30 JUNE 2018 1 STRONG DOUBLE-DIGIT REVENUE GROWTH CONTINUED (+27% AT CONST. EXCH. RATES) WITH THE STRENGTHENING OF
H1/2018 Results u-blox Holding AG
 H1/2018 Results August 24, 2018 Thomas Seiler, CEO Roland Jud, CFO Disclaimer This presentation contains certain forward-looking statements. Such forward-looking statements reflect the current views of
Disclosure Statement. Page 2
 Disclosure Statement Page 2 This presentation and the accompanying slides (the Presentation ) which have been prepared by Samsonite International S.A. ( Samsonite or the Company ) do not constitute any
All integration targets achieved entering a new era of profitable growth. Full Year 2010 Results
 All integration targets achieved entering a new era of profitable growth Full Year 2010 Results Vernier, 8 February 2011 Gilles Andrier CEO Full Year 2010 Results Financial Highlights Sales CHF 4.2 billion,
Summary of Consolidated Financial Results [ IFRS ] for the First Nine Months of the Fiscal Year Ending March 31, 2019 February 6, 2019
![Summary of Consolidated Financial Results [ IFRS ] for the First Nine Months of the Fiscal Year Ending March 31, 2019 February 6, 2019](/thumbs/95/123620491.jpg "Summary of Consolidated Financial Results [ IFRS ] for the First Nine Months of the Fiscal Year Ending March 31, 2019 February 6, 2019") Summary of Consolidated Financial Results [ IFRS ] for the First Nine Months of the Fiscal Year Ending March 31, 2019 February 6, 2019 Listed company name : Sysmex Corporation Code : 6869 Listed stock
Summary of Consolidated Financial Results [ IFRS ] for the First Nine Months of the Fiscal Year Ending March 31, 2019 February 6, 2019 Listed company name : Sysmex Corporation Code : 6869 Listed stock
Mizuno Corporation The 103rd Period (Year ended March 31, 2016)
") Mizuno Corporation The 103rd Period (Year ended March 31, 2016) 4th Quarter Financial Report May 10, 2016 This report includes forecasts based on our assumptions, outlook and plans for the future as of
Mizuno Corporation The 103rd Period (Year ended March 31, 2016) 4th Quarter Financial Report May 10, 2016 This report includes forecasts based on our assumptions, outlook and plans for the future as of
Lenovo Group Limited 聯想集團有限公司 (Incorporated in Hong Kong with limited liability) (Stock Code: 992) FY2015/16 FIRST QUARTER RESULTS ANNOUNCEMENT
 (Stock Code: 992) FY2015/16 FIRST QUARTER RESULTS ANNOUNCEMENT") Hong Kong Exchanges and Clearing Limited and The Stock Exchange of Hong Kong Limited take no responsibility for the contents of this announcement, make no representation as to its accuracy or completeness
Hong Kong Exchanges and Clearing Limited and The Stock Exchange of Hong Kong Limited take no responsibility for the contents of this announcement, make no representation as to its accuracy or completeness