68,679 8,408 10,142. Fact book. Financial highlights Net debt. Sales revenue EBITDA. ArcelorMittal Fact book 2017
|
|
|
- Calvin Franklin
- 5 years ago
- Views:
Transcription

1
2 Table Of Contents Fact book 1 Financial highlights 5 Key operational overview 7 Crude steel production quarterly by segment 11 Steel shipments 14 Sales by destination 19 Capital expenditure 23 Iron ore production and shipment by geography 26 Coal production and shipment by geography 30 Reserves and resources 33 Raw material consumption 38 Sustainability performance and data charts 39 Key financial and operational information 43 Quarterly condensed income statement 47 Operating footprint 49 Property, plant and equipment 50 NAFTA 52 Brazil 54 Europe 56 ACIS 59 Mining 61 Production facilities 63 Steel making process 85 Products and services 87 Glossary 88 Disclaimer 96
 EBITDA 8,408 (US$ millions) Net debt 10,142 (US$ millions) annualreview2017.")
3 Fact book Details of our steel and mining operations, financials, production facilities and shareholder information. Financial highlights 2017 Sales revenue 68,679 (US$ millions) EBITDA 8,408 (US$ millions) Net debt 10,142 (US$ millions) annualreview2017.arcelormittal.com ArcelorMittal
4 EBITDA EBITDA by segment (US$ millions)* Capex Capital expenditure by segment (US$ millions) Mining: 16% NAFTA: 20% Mining: 18% NAFTA: 17% ACIS: 12% Total 8,408 Brazil: 11% ACIS: 15% Total 2,819 Brazil: 9% Europe: 41% Europe: 41% * % figures presented exclude holding and service companies and eliminations. Crude steel production Crude steel production by segment (Mt) Steel shipments Steel shipments by product (Mt) ACIS: 16% NAFTA: 25% Long: 29% Pipes & Tubes: 2% Total 93.1 Total 85.2 Europe: 47% Brazil: 12% Flat: 69% annualreview2017.arcelormittal.com ArcelorMittal
: 38% Total 58.")

5 Mining operations Own iron ore production by region (Mt) Iron ore shipments market priced, captive & strategic contracts (Mt) Asia, CIS & Other: 22% Strategic contracts: 1% Africa: 3% Europe: 3% Total 57.4 Captive (Cost plus basis): 38% Total 58.8 South America: 6% North America: 66% Market Priced: 61% Sustainability performance Our role in creating high quality, sustainable lifestyles. Financials In 2017 we exceeded our financial targets and materially improved our balance sheet strength. annualreview2017.arcelormittal.com ArcelorMittal


6 Industrial assets Achievable Capacity (113Mt as per 20F) Blast furnace facilities and electric arc furnaces ACIS: 17% NAFTA: 25% 12 6 Brazil: 11% Total 100% Europe: 47% Blast furnaces Electric arc furnaces Automotives We further improved our already best-in-class suite of automotive solutions. Production facilities With steelmaking plants in 19 countries, our operations are truly global. annualreview2017.arcelormittal.com ArcelorMittal
7 Financial highlights Highlights for 2013, 2014, 2015, 2016 and Health and safety Lost time injury frequency rate (LTIF) ArcelorMittal steel operations (millions of metric tonnes) Production of steel products Change year/year 3.3% 2.1% (0.7)% (1.9)% 2.6 % Shipments of steel products Change year/year 0.5% 3.0% (0.6)% (0.8)% 1.6 % ArcelorMittal mining operations (millions of metric tonnes) Mining production Iron ore: Own production Long-term contract Total iron ore production Coal: Own production Long-term contract Total coal production Mining shipments Iron ore: External sales - Third party Internal sales - Market-priced Internal sales - Cost-plus basis Strategic contracts Total iron ore shipments Coal: External sales - Third party Internal sales - Market-priced Internal sales - Cost-plus basis Strategic contracts Total coal shipments ArcelorMittal financials (US$ millions) Sales 79,440 79,282 63,578 56,791 68,679 2 EBITDA 6,888 7,237 5,231 6,255 8,408 Operating income/(loss) 1,197 3,034 (4,161) 4,161 5,434 Net income/(loss) attributable to equity holders of the parent (2,545) (1,086) (7,946) 1,779 4,568 Net cash provided by operating activities 4,296 3,870 2,151 2,708 4,563 annualreview2017.arcelormittal.com ArcelorMittal
8 Net cash used in investing activities (2,877) (3,077) (2,170) (1,143) (2,830) Net cash (used in) provided by financing activities 241 (2,750) 395 (2,926) (1,731) Cash and cash equivalents and restricted cash 6,232 4,016 4,102 2,615 2,786 Property, plant and equipment 51,364 46,593 35,780 34,831 36,971 Total assets 112,308 99,179 76,846 75,142 85,297 Short-term debt and current portion of long-term debt 4,092 2,522 2,308 1,885 2,785 Long-term debt, net of current portion 18,219 17,275 17,478 11,789 10,143 Equity attributable to the equity holders of the parent 49,793 42,086 25,272 30,135 38,789 Net debt 3 16,079 15,781 15,684 11,059 10,142 ArcelorMittal financials per share (US$) 4 ArcelorMittal average share price Book value per share Basic earnings/(loss) per share 4 (3.40) (1.43) (10.29) ArcelorMittal ratios EBITDA margin 8.7% 9.1% 8.2% 11.0% 12.2 % Operating margin 1.5% 3.8% (6.5)% 7.3% 7.9 % EBITDA per tonne Sources: ArcelorMittal and NYSE 1 LTIF refers to lost time injury frequency rate defined as lost time injuries per worked hours; based on own personnel and contractors. 2 EBITDA defined as operating income plus depreciation, impairment expenses, restructuring and exceptional charges/ (income). 3 Net debt: long-term debt, plus short term debt, less cash and cash equivalents, restricted cash and short-term investments (excluding those held as part of assets/liabilities held for sale). 4 Following the Company s equity offering in April 2016, the earnings (loss) per share for prior periods have been recast in accordance with IFRS for the years ended December 31, 2015, 2014 and 2013, respectively, to include the bonus element derived from the 35% discount to the theoretical ex-right price included in the subscription price. Following the completion of the Company's share consolidation of each three existing shares into one share without nominal value on May 22, 2017, the earnings (loss) per share, corresponding basic and diluted weighted average common shares outstanding, book value per share and average share price for the years ended December 31, 2016, 2015, 2014 and 2013, respectively, have been recast in accordance with IFRS. annualreview2017.arcelormittal.com ArcelorMittal
9 Key operational overview Segment annually ( ) and quarterly ( ) Crude steel production (000's MT) Q 16 2Q 16 3Q 16 4Q 16 1Q 17 2Q 17 3Q 17 4Q 17 NAFTA 24,914 25,036 22,795 22,208 23,480 5,644 5,735 5,632 5,197 6,216 5,762 5,904 5,598 Brazil 9,987 10,524 11,612 11,133 11,210 2,667 2,800 2,888 2,778 2,710 2,714 2,797 2,989 Europe 41,923 43,419 43,853 42,635 43,768 11,171 10,720 10,571 10,173 11,212 10,997 11,248 10,311 ACIS 14,362 14,148 14,219 14,792 14,678 3,668 3,926 3,552 3,646 3,492 3,685 3,669 3,832 Total 91,186 93,127 92,479 90,767 93,136 23,150 23,181 22,643 21,793 23,630 23,158 23,618 22,730 Steel shipments* (000's MT) NAFTA 22,500 23,074 21,306 21,281 21,834 5,463 5,443 5,364 5,011 5,610 5,419 5,655 5,150 Brazil 9,797 10,376 11,540 10,753 10,840 2,472 2,689 2,751 2,841 2,226 2,622 2,940 3,052 Europe 38,269 39,639 40,676 40,247 40,941 10,444 10,886 9,382 9,535 10,208 10,466 10,116 10,151 ACIS 12,422 12,833 12,485 13,271 13,094 3,315 3,453 3,408 3,095 3,221 3,257 3,362 3,254 Total 82,610 85,125 84,586 83,934 85,242 21,472 22,101 20,316 20,045 21,058 21,483 21,705 20,996 Average steel selling price (US$/tonne) NAFTA Brazil Europe ACIS Total Revenue (US$ millions) NAFTA 19,645 21,162 17,293 15,806 17,997 3,822 3,920 4,269 3,795 4,458 4,607 4,636 4,296 Brazil 10,148 10,037 8,503 6,223 7,755 1,255 1,488 1,729 1,751 1,610 1,834 2,059 2,252 Europe 40,507 39,552 31,893 29,272 36,208 7,151 7,810 7,172 7,139 8,222 9,180 9,196 9,610 ACIS 8,419 8,268 6,128 5,885 7,621 1,192 1,581 1,586 1,526 1,807 1,834 1,941 2,039 Mining 5,766 4,970 3,387 3,114 4, ,030 1,015 1, Holding and service companies and eliminations (5,045) (4,707) (3,626) (3,509) (4,935) (621) (865) (1,042) (981) (1,041) (1,226) (1,222) (1,446) Total 79,440 79,282 63,578 56,791 68,679 13,399 14,743 14,523 14,126 16,086 17,244 17,639 17,710 EBITDA (US$ millions) NAFTA 1,397 1, ,719 1, Brazil 1,895 1,845 1, Europe 1,621 2,304 2,393 2,503 3, ACIS , Mining 1,980 1, , Holding and service companies and eliminations (319) (69) (63) (279) (279) (79) (86) (124) 10 (119) (30) (87) (43) annualreview2017.arcelormittal.com ArcelorMittal
10 Q 16 2Q 16 3Q 16 4Q 16 1Q 17 2Q 17 3Q 17 4Q 17 Total 6,888 7,237 5,231 6,255 8, ,770 1,897 1,661 2,231 2,112 1,924 2,141 Operating income/(loss) (US$ millions) NAFTA (705) 2,002 1, , Brazil 1,204 1, Europe (985) ,270 2, ACIS (457) 95 (624) (15) (92) Mining 1, (3,522) (2) Holding and service companies and eliminations (371) (137) (109) (302) (306) (88) (92) (126) 4 (125) (35) (93) (53) Total 1,197 3,034 (4,161) 4,161 5, ,873 1, ,576 1,390 1,234 1,234 Steel EBITDA/tonne (US$/tonne) NAFTA Brazil Europe ACIS Total** EBITDA/tonne (US$/tonne) NAFTA Brazil Europe ACIS Total*** * ArcelorMittal Downstream Solutions shipments are eliminated in consolidation as they primarily represent shipments originating from other ArcelorMittal operating subsidiaries. ** Average steel EBITDA/tonne is calculated as group EBITDA less mining divided by total steel shipments. *** EBITDA/tonne is calculated as group EBITDA divided by total steel shipments. annualreview2017.arcelormittal.com ArcelorMittal
11 Revenue by segment 2017 (US$ millions) % figures presented exclude holding and service companies and eliminations (4,935) Steel shipments by segment 2017 (000's MT) % figures presented exclude eliminations (1,467) ACIS: 10% Mining: 6% NAFTA: 24% ACIS: 15% NAFTA: 25% Total 68,679 Total 85,242 Brazil: 11% Brazil: 13% Europe: 49% Europe: 47% (US$ millions) 2017 % NAFTA 17, Brazil 7, Europe 36, ACIS 7, 's MT 2017 % NAFTA 21, Brazil 10, Europe 40, ACIS 13, Mining 4,033 6 annualreview2017.arcelormittal.com ArcelorMittal
12 EBITDA by segment 2017 (US$ millions)* EBITDA/tonne by segment (US$/tonne) % Figures presented exclude holding and service companies and eliminations Mining: 16% NAFTA: 20% ACIS: 12% Total 8,408 Brazil: 11% Europe: 41% US$ millions 2017 % NAFTA 1, Brazil Europe 3, ACIS 1, Mining 1, US$/tonne NAFTA Brazil Europe ACIS Total annualreview2017.arcelormittal.com ArcelorMittal
13 Crude steel production quarterly by segment Segment annually and quarterly (2016 and 2017) 000's MT Q 16 2Q 16 3Q 16 4Q 16 1Q 17 2Q 17 3Q 17 4Q 17 NAFTA 22,208 23,480 5,644 5,735 5,632 5,197 6,216 5,762 5,904 5,598 Brazil 11,133 11,210 2,667 2,800 2,888 2,778 2,710 2,714 2,797 2,989 Europe 42,635 43,768 11,171 10,720 10,571 10,173 11,212 10,997 11,248 10,311 ACIS 14,792 14,678 3,668 3,926 3,552 3,646 3,492 3,685 3,669 3,832 Total 90,767 93,136 23,150 23,181 22,643 21,793 23,630 23,158 23,618 22,730 Source: ArcelorMittal estimates. Crude steel production by process and segment 's MT Blast oxygen furnace Electric arc furnace Open hearth furnace Total crude steel NAFTA 17,237 6,243-23,480 Brazil 8,176 3,034-11,210 Europe 35,691 6,278 1,799 43,768 ACIS 12,529 1,099 1,050 14,678 Total 73,632 16,656 2,849 93,136 Source: ArcelorMittal estimates. annualreview2017.arcelormittal.com ArcelorMittal
14 Crude steel production by segment 2017 (000's MT) Crude steel production by segment (2016 and 2017 quarterly) (000's MT) ACIS: 16% NAFTA: 25% 3,668 3,926 3,552 3,646 3,492 3,685 3,669 3,832 Total 93,136 11,171 10,720 10,571 10,173 11,212 10,997 11,248 10,311 Brazil: 12% 2,667 2,800 2,888 2,778 2,710 2,714 2,797 2,989 Europe: 47% 5,644 5,735 5,632 5,197 6,216 5,762 5,904 5,598 1Q 16 2Q 16 3Q 16 4Q 16 1Q 17 2Q 17 3Q 17 4Q 's MT 2017 % NAFTA 23, Brazil 11, Europe 43, ACIS 14, Total 93, 's MT 1Q 16 2Q 16 3Q 16 4Q 16 1Q 17 2Q 17 3Q 17 4Q 17 NAFTA 5,644 5,735 5,632 5,197 6,216 5,762 5,904 5,598 Brazil 2,667 2,800 2,888 2,778 2,710 2,714 2,797 2,989 Europe 11,171 10,720 10,571 10,173 11,212 10,997 11,248 10,311 ACIS 3,668 3,926 3,552 3,646 3,492 3,685 3,669 3,832 Total 23,150 23,181 22,643 21,793 23,630 23,158 23,618 22,730 Source: ArcelorMittal estimates. annualreview2017.arcelormittal.com ArcelorMittal
15 Crude steel production by process 2017 (000's MT) Crude steel production by region 2017 (000's MT) EAF: 18% Open Hearth: 3% CIS & Central Asia: 10% Africa: 6% North America: 25% Total 93,136 Central & East Europe: 12% Total 93,136 South America: 12% BOF: 79% West Europe: 35% 000's MT 2017 % Blast oxygen furnace (BOF) 73, Electric arc furnace (EAF) 16, Open hearth furnace 2,849 3 Total 93, MMt 2017 % North America 23, South America 11, West Europe 32, Central and East Europe 10, CIS and Central Asia 9, Africa 5,332 6 Total 93, Source: ArcelorMittal estimates. annualreview2017.arcelormittal.com ArcelorMittal
16 Steel shipments Segment and product types annually and quarterly (2016 and 2017) 000's MT Q 16 2Q 16 3Q 16 4Q 16 1Q 17 2Q 17 3Q 17 4Q 17 Flat 18,207 18,926 4,567 4,641 4,698 4,301 4,944 4,748 4,820 4,414 Long 3,647 3,530 1, NAFTA 21,281 21,834 5,463 5,443 5,364 5,011 5,610 5,419 5,655 5,150 Flat 6,689 6,762 1,455 1,627 1,730 1,877 1,364 1,682 1,766 1,950 Long 4,064 4,100 1,009 1,065 1, ,181 1,108 Brazil 10,753 10,840 2,472 2,689 2,751 2,841 2,226 2,622 2,940 3,052 Flat 27,971 29,255 7,332 7,536 6,562 6,541 7,377 7,482 7,098 7,298 Long 12,114 11,494 3,064 3,316 2,767 2,967 2,806 2,913 2,954 2,821 Europe 40,247 40,941 10,444 10,886 9,382 9,535 10,208 10,466 10,116 10,151 CIS 9,181 8,837 2,202 2,322 2,459 2,198 2,119 2,212 2,297 2,209 South Africa 4,087 4,256 1,112 1, ,102 1,045 1,065 1,044 ACIS 13,271 13,094 3,315 3,453 3,408 3,095 3,221 3,257 3,362 3,254 Total 83,934 85,242 21,472 22,101 20,316 20,045 21,058 21,483 21,705 20,996 Note: Others and eliminations line are not presented in the table. annualreview2017.arcelormittal.com ArcelorMittal
17 Steel shipments by product 2017 (000's MT) Steel shipments by region 2017 (000's MT) Long: 29% Pipes & Tubes: 2% Africa: 5% Asia, CIS & Other: 10% North America: 25% Total 85,242 Total 85,242 Flat: 69% Europe: 47% South America: 13% 000's MT 2017 % Flat Products 59, Long Products 24, Pipes and Tubes 1,373 2 Total 85, 's MT 2017 % North America 21, South America 10, Europe 40, Africa 4,256 5 Asia CIS and Other 8, Total* 85, *Total group shipments include intersegment elimination Source: ArcelorMittal estimates. annualreview2017.arcelormittal.com ArcelorMittal
18 Product type and segment NAFTA steel shipments by product type 2017 Brazil steel shipments by product type 2017 Other: 11% Other: 8% Semis: 1% HR: 27% Semis: 0% HR: 22% WR: 4% Bars: 7% Sections: 2% WR: 13% CR: 4% Slabs: 16% CR: 15% Bars: 18% Coated: 7% Coated: 19% Slabs: 26% Product type % Hot rolled products (HR) 27 Cold rolled products (CR) 15 Coated 19 Slabs 16 Bars & rebars (Bars) 7 Wire rod/wire products (WR) 4 Semis 1 Other products 11 Total NAFTA 100 Product type % Hot rolled products (HR) 22 Cold rolled products (CR) 4 Coated 7 Slabs 26 Bars & rebars (Bars) 18 Wire rod/wire products (WR) 13 Sections 2 Semis - Other products 8 Total Brazil 100 annualreview2017.arcelormittal.com ArcelorMittal
19 Europe steel shipments by product type 2017 ACIS steel shipments by product type 2017 Other: 13% Other: 6% Semis: 2% HR: 26% Semis: 14% HR: 26% Sections: 9% Sections: 3% WR: 8% CR: 9% WR: 10% CR: 8% Bars: 5% Coated: 28% Bars: 25% Coated: 8% Product type % Hot rolled products (HR) 26 Cold rolled products (CR) 9 Coated 28 Bars & rebars (Bars) 5 Wire rod/wire products (WR) 8 Sections 9 Semis 2 Other products 13 Total Europe 100 Product type % Hot rolled products (HR) 26 Cold rolled products (CR) 8 Coated 8 Bars & rebars (Bars) 25 Wire rod/wire products (WR) 10 Sections 3 Semis 14 Other products 6 Total ACIS 100 annualreview2017.arcelormittal.com ArcelorMittal
20 Group steel shipments by product type 2017 Other: 10% Semis: 4% HR: 27% Sections: 5% WR: 8% Bars: 10% CR: 10% Slabs: 6% Coated: 20% Product type % Hot rolled products (HR) 27 Cold rolled products (CR) 10 Coated 20 Slabs 6 Bars & rebars (Bars) 10 Wire rod/wire products (WR) 8 Sections 5 Semis 4 Other products 10 Group Total 100 annualreview2017.arcelormittal.com ArcelorMittal
21 Sales by destination (US$ millions) Americas United States 13,619 12,284 14,367 Brazil 3,809 3,506 4,149 Canada 2,913 2,818 3,034 Mexico 1,913 1,806 2,251 Argentina 1, ,230 Venezuela 1, Others Total Americas 25,909 22,207 26,036 Europe Germany 5,473 4,768 5,933 France 3,743 3,655 4,051 Spain 3,406 3,015 3,751 Poland 3,023 2,997 3,746 Italy 2,278 2,067 2,711 Turkey 1,962 1,789 1,937 United Kingdom 1,246 1,159 1,370 Czech Republic 1,476 1,107 1,400 Netherlands 867 1,030 1,117 Belgium 1, ,129 Russia ,204 Romania Others 4,024 3,886 4,948 Total Europe 29,827 27,616 33,918 Asia & Africa South Africa 2,111 2,026 2,560 Egypt Morocco Rest of Africa ,033 China Kazakhstan South Korea India Rest of Asia 2,397 2,119 2,790 Total Asia & Africa 7,842 6,968 8,725 annualreview2017.arcelormittal.com ArcelorMittal
22 (US$ millions) Total 63,578 56,791 68,679 Sources: ArcelorMittal estimates. Sales by destination group (US$ millions) Sales by destination Americas (US$ billions) 15 Asia & Africa: 13% 12.5 Total 68,679 Americas: 38% Europe: 49% 0 US Brazil Canada Mexico Argentina Venezuela Others (US$ millions) 2017 % Americas 26, Europe 33, Asia & Africa 8, (US$ millions) 2017 United States (US) 14,367 Brazil 4,149 Canada 3,034 Mexico 2,251 Argentina 1,230 Venezuela 68 Others 937 Total Americas 26,036 annualreview2017.arcelormittal.com ArcelorMittal
23 Sales by destination - Europe (US$ billions) Sales by destination - Asia & Africa (US$ billions) Germany France Spain Poland Italy Turkey UK Czech Rep. Netherlands Belgium Russia Romania Others 0 S Africa Egypt Morocco Rest Africa China Kazakhstan S Korea India Rest Asia (US$ millions) 2017 Germany 5,933 France 4,051 Spain 3,751 Poland 3,746 Italy 2,711 Turkey 1,937 United Kingdom (UK) 1,370 Czech Republic 1,400 Netherlands 1,117 Belgium 1,129 (US$ millions) 2017 South Africa 2,560 Egypt 310 Morocco 596 Rest of Africa 1,033 China 622 Kazakhstan 392 South Korea 259 India 163 Rest of Asia 2,790 Total Asia & Africa 8,725 Russia 1,204 Romania 621 Others 4,948 Total Europe 33,918 annualreview2017.arcelormittal.com ArcelorMittal
24 Group sales by market As shown by the following graph, ArcelorMittal has a diversified portfolio of steel and mining engineering, construction, energy and machinery products to meet a wide range of customer needs across many steel-consuming industries, including automotive, appliance, engineering, construction, energy and machinery. The table below presents sales to external customers. Group sales by market (US$ millions) Mining, chem. & water: 1% Other steel***: 13% Packaging: 3% Primary**: 12% Other sales****: 7% Total 68,679 Distribution*: 28% Market sectors (US$ millions) % Distribution* 28 Construction 18 Automotive 18 Primary transformation** 12 Packaging 3 Other steel sales*** 13 Mining, chemicals and water 1 Construction: 18% Other sales**** 7 Auto: 18% Total 100 *Distribution represents the Company s sales to external distributors and processing facilities. **Primary Transformation includes steel production, re-rollers and pickling, coaters, pipes and tubes and wire and cable. ***Other steel sales mainly represents metal processing, machinery, electrical equipment and domestic appliances. ****Other sales mainly represent slag, waste, sale of energy and transport services. annualreview2017.arcelormittal.com ArcelorMittal
25 Capital expenditure Segment annually and quarterly (2016 and 2017) (US$ millions) Q 16 2Q 16 3Q 16 4Q 16 1Q 17 2Q 17 3Q 17 4Q 17 NAFTA Brazil Europe 951 1, ACIS Mining Group 2,444 2, ,036 Note: Others and eliminations line are not presented in the table Capital expenditure 2017 by segment Mining: 18% NAFTA: 17% (US$ millions) 2017 % NAFTA Brazil ACIS: 15% Total 2,819 Brazil: 9% Europe 1, ACIS Mining Group 2, Europe: 41% Capital expenditure projects The Company s capital expenditures were $2.8 billion, $2.4 billion and $2.7 billion for the years ended December 31, 2017, 2016 and 2015, respectively. The following tables summarize the Company s principal investment projects involving significant capital expenditure completed in 2017 and those that are currently ongoing. annualreview2017.arcelormittal.com ArcelorMittal
26 Completed projects in most recent quarters Region Site Project Capacity/particulars Actual completion Note # NAFTA AM/NS Calvert Phase 2: Slab yard expansion (Bay 5) Increase coil production level from 4.6 million tonnes/year to 5.3 million tonnes/year coils Q NAFTA ArcelorMittal Dofasco (Canada) Phase 2: Convert the current galvanizing line #4 to a Galvalume line Allow the galvaline #4 to produce 160 thousand tonnes galvalume and 128 thousand Q tonnes galvanize and closure of galvanize line #1 (capacity 170 thousand tonnes of galvalume) Europe ArcelorMittal Krakow (Poland) HSM extension HDG increase Increase HRC capacity by 0.9 million tonnes/year Increasing HDG capacity by 0.4 million tonnes/year Q Q Ongoing projects 3 Region Site Project Capacity/particulars Forecast completion Note # Europe Gent & Liège (Europe Flat Automotive UHSS Program) Gent: Upgrade HSM and new furnace Liège: Annealing line transformation Increase ~400 thousand tonnes in Ultra High Strength Steel capabilities Q Europe ArcelorMittal Differdange Modernisation of finishing of Grey rolling mill" Revamp finishing to achieve full capacity of Grey mill at 850 thousand tonnes per year Q ACIS ArcelorMittal Kryvyi Rih New LF&CC 2&3 Facilities upgrade to switch from ingot to continuous caster route. Additional billets of 290 thousand tonnes over ingot route through yield increase Q NAFTA Indiana Harbor Indiana Harbor footprint optimization project Restoration of 80 HSM and upgrades at Indiana Harbor finishing Europe Sosnowiec (Poland) Modernization of Wire Rod Mill Upgrade rolling technology improving the mix of HAV products and increase volume by 90 thousand tonnes 2019 NAFTA Mexico Build new HSM Production capacity of 2.5 million tonnes per year NAFTA Burns Harbor New walking beam furnaces Two new walking beam reheat furnaces bringing benefits on productivity, quality and operational 2021 cost Brazil ArcelorMittal Vega Do Sul (Brazil) Expansion project Increase hot dipped galvanizing (HDG) capacity by 0.6 million tonnes/year and cold rolling (CR) capacity by 0.7 million tonnes/year On hold Brazil Juiz de Fora (Brazil) Melt shop expansion Increase in melt shop capacity by 0.2 million tonnes/year On hold 1 Brazil Monlevade (Brazil) Sinter plant, blast furnace and melt shop Increase in liquid steel capacity by 1.2 million tonnes/year; Sinter feed capacity of 2.3 million tonnes/year On hold Mining Liberia Phase 2 expansion project Increase production capacity to 15 million tonnes/year Under review 4 annualreview2017.arcelormittal.com ArcelorMittal
27 1 Although the Monlevade wire rod expansion project and Juiz de Fora rebar expansion were completed in 2015, and Juiz de Fora melt shop is currently on hold and is expected to be completed upon Brazil domestic market recovery, the Company does not expect to increase shipments until domestic demand improves. 2 In support of the Company s Action 2020 program that was launched at its fourth quarter and full-year 2015 earnings announcement, the footprint optimization project at ArcelorMittal Indiana Harbor is now complete, which has resulted in structural changes required to improve asset and cost optimization. The plan involved idling redundant operations including the #1 aluminize line, 84 hot strip mill ("HSM"), and #5 continuous galvanizing line ("CGL") and No.2 steel shop (idled in the second quarter of 2017) whilst making further planned investments totaling ~$200 million including a new caster at No.3 steelshop (completed in the fourth quarter of 2016), restoration of the 80 HSM and Indiana Harbor finishing are ongoing. The full project scope is expected to be completed in Ongoing projects refer to projects for which construction has begun (excluding various projects that are under development), even if such projects have been placed on hold pending improved operating conditions. 4 ArcelorMittal Liberia is moving ore extraction from its depleting DSO (direct shipping ore) deposit at Tokadeh to the nearby, low strip ratio and highergrade DSO Gangra deposit where planned ramp up has progressed, reaching a 5 million tonnes run rate at the end of December Following a period of exploration cessation caused by the onset of Ebola, ArcelorMittal Liberia recommenced drilling for DSO resource extensions in late During 2016, the operation at Tokadeh was right-sized to focus on its natural Atlantic markets. The nearby Gangra deposit has been developed as part of the staged approach as opposed to the originally planned phase 2 step up to 15Mtpa of concentrate sinter fine ore product that was delayed in August 2014 due to the declaration of force majeure by contractors following the Ebola virus outbreak, and then reassessed following rapid iron ore price declines over the period since. The Gangra mine, haul road and related existing plant and equipment upgrades are nearing completion. ArcelorMittal remains committed to Liberia where it operates a full value chain of mine, rail and port and where it has been operating the mine on a DSO basis since The Company believes that ArcelorMittal Liberia presents a strong, competitive source of product ore for the international market based on continuing DSO mining and then moving to a long-term sinter feed concentration phase. 5 On September 28, 2017, ArcelorMittal announced a major $1 billion, three-year investment program at its Mexican operations, which is focused on building ArcelorMittal Mexico s downstream capabilities, sustaining the competitiveness of its mining operations and modernizing its existing asset base. The program is designed to enable ArcelorMittal Mexico to meet the anticipated increased demand requirements from domestic customers, realize in full ArcelorMittal Mexico s production capacity of 5.3 million tonnes and significantly enhance the proportion of higher-value added products in its product mix, in-line with the Company s Action 2020 strategic plan. The main investment will be the construction of a new HSM. Construction will take approximately three years and, upon completion, will enable ArcelorMittal Mexico to produce approximately 2.5 million tonnes of flat rolled steel, approximately 1.8 million tonnes of long steel and the remainder made up of semi-finished slabs. Coils from the new HSM will be supplied to domestic, non-auto, general industry customers. The project commenced late in the fourth quarter of 2017 and is expected to be completed in the second quarter of The Company expects capital expenditures of approximately $350 million with respect to this program in annualreview2017.arcelormittal.com ArcelorMittal
28 Iron ore production and shipment by geography Production by mine annually ( ) and quarterly (2017) (millions of metric tonnes) 1 Mine Type Product Q 17 2Q 17 3Q 17 4Q 17 Kazakhstan Lisakovski Open Pit Concentrate Kentube Open Pit Concentrate Atasu Underground Lump & fines Atansore Open Pit Lump & Fines Ukraine Kryviy Rih Open Pit Concentrate Kryviy Rih Underground Lump & sinter feed Algeria Ouenza Open Pit Fines Bosnia Omarska Open Pit Concentrate & lump Mexico Peña Colorada Open Pit Concentrate & Pellets Las Truchas Open Pit Concentrate, lump & fines Volcan Open Pit Concentrate Canada QCM (Mount Wright) Open Pit Concentrate & Pellets USA Hibbing Open Pit Pellets Minorca Open Pit Pellets Brazil Serra Azul Open Pit Lump & fines Andrade Open Pit Fines Liberia Own production South Africa Sishen Open Pit Lump & fines Thabazimbi Open Pit Lump & fines USA annualreview2017.arcelormittal.com ArcelorMittal
29 Mine Type Product Q 17 2Q 17 3Q 17 4Q 17 3 Cleveland Cliffs Open Pit Pellets Strategic contracts Total Own iron ore production ( ) (millions of metric tonnes) Total iron ore production by country 2017 (millions of metric tonnes) Brazil: 6% USA: 13% Liberia: 3% Kazakhstan: 5% Ukraine: 17% Units Total 57.4 Bosnia: 3% 20 Mexico: 9% Canada: 44% (Millions of metric tonnes) (Millions of metric tonnes) 2017 % Kazakhstan Ukraine Bosnia Mexico Canada USA Brazil Liberia Total of all finished production of fines, concentrate, pellets and lumps. 2 Includes own mines and share of production from Hibbing (United States, 62.30%) and Peña (Mexico, 50%). 3 Consists of a long-term supply contract with Cliffs Natural Resources, which expired in the first quarter of The production for year ended 2015 includes purchases under strategic agreements with Sishen Iron Ore Company (Proprietary) Limited s ( SIOC ) Kumba and Thabazimbi mines (South Africa). On November 6, 2015, ArcelorMittal announced that an agreement had been reached with SIOC to amend the pricing mechanism terms of the current iron ore supply agreement related to Kumba from a cost-based price to an Export Parity Price ( EPP ) with effect from October 1, The EPP is calculated on the basis of the Platts 62% Fe CFR China Fines Index (the Index price ) and, at certain price levels, ArcelorMittal receives a discounted price. As a result of this amendment, the contract related to Kumba is no longer considered as a strategic contract in annualreview2017.arcelormittal.com ArcelorMittal
30 5 On January , ArcelorMittal had completed the sale of a 21% controlling stake in ArcelorMittal Tebessa, which holds two iron ore mines in Quenza and Boukhadra, Tebessa to Sider and Ferphos Group, two Algerian state-owned entities. Iron ore production by region annually ( ) and quarterly (2017) (Production million tonnes) 1 Mine Type Product Q 17 2Q 17 3Q 17 4Q 17 North America 2 Open Pit Concentrate, lump, fines and Pellets South America Open pit Lump and fines Europe Open pit Concentrate and lump Africa Open Pit/Underground Fines Asia, CIS & Other Open Pit/Underground Concentrate, lump, fines and sinter feed Own production North America 3 Open Pit Pellets Africa 4 Open Pit Lump and Fines Strategic contracts Total Own iron ore production by region 2017 (million tonnes) (million tonnes) 2016 % Asia, CIS & Other: 22% 2 North America South America Africa: 3% Europe: 3% Total 57.4 Europe Africa Asia, CIS & Other South America: 6% North America: 66% 1 Total of all finished production of fines, concentrate, pellets and lumps. 2 Includes own mines and share of production from Hibbing (United States, 62.30%) and Peña (Mexico, 50%). 3 Consists of a long-term supply contract with Cliffs Natural Resources, which expired in the first quarter of The production for year ended 2015 includes purchases under strategic agreements with Sishen Iron Ore Company (Proprietary) Limited s ( SIOC ) Kumba and Thabazimbi mines (South Africa). On November 6, 2015, ArcelorMittal announced that an agreement had been reached with SIOC to amend the pricing mechanism terms of the current iron ore supply agreement related to Kumba from a cost-based price to an Export Parity Price ( EPP ) with effect from October 1, The EPP is calculated on the basis of the Platts 62% Fe CFR China Fines Index (the Index price ) and, at certain price levels, ArcelorMittal receives a discounted price. As a result of this amendment, the contract related to Kumba was no longer considered as a strategic contract in annualreview2017.arcelormittal.com ArcelorMittal
31 Iron ore shipments annually ( ) and quarterly (2017) Millions of metric tonnes Q 17 2Q 17 3Q 17 4Q 17 External Sales - Third party Internal sales - Market Priced Total market priced shipments Captive (Cost plus basis) Total Shipments Strategic contracts Total shipments including strategic contracts Iron ore shipments 2017 Market priced, captive and strategic contracts (millions of metric tonnes) External sales - third party and internal sales - market priced (millions of metric tonnes) Strategic contracts: 1% Captive (Cost plus basis): 38% Total 58.8 Total 35.7 External Sales - Third party: 33% Market Priced: 61% Internal sales - Market Priced: 67% Millions of metric tonnes 2017 % Market Priced Captive (Cost plus basis) Millions of metric tonnes 2017 % External Sales - Third party Internal sales - Market Priced Strategic contracts There are three categories of sales: 1) External sales : mined product sold to third parties at market price; 2) Market-priced tonnes : internal sales of mined product to ArcelorMittal facilities and reported at prevailing market prices; 3) Cost-plus tonnes - internal sales of mined product to ArcelorMittal facilities on a cost-plus basis. The determinant of whether internal sales are reported at market price or cost-plus is whether the raw material could practically be sold to third parties (i.e. there is a potential market for the product and logistics exist to access that market). annualreview2017.arcelormittal.com ArcelorMittal
32 Coal production and shipment by geography Coal production by mine (millions of metric tonnes) Mine Q 17 2Q 17 3Q 17 4Q 17 USA - Midvol/Concept Russia - Kuzbass Kazakhstan - Karaganda Own production South Africa - Tshikondeni USA - Madison Strategic contracts Total Includes strategic agreement prices on a fixed-price basis. Coal production by region annually ( ) and quarterly (2017) Mine Q 17 2Q 17 3Q 17 4Q 17 North America Asia, CIS & Other Own production North America Africa Strategic contracts Group Includes strategic agreement - prices on a fixed price basis. annualreview2017.arcelormittal.com ArcelorMittal
33 Own coal production by mine (millions of metric tonnes) (Millions of metric tonnes) 2017 % USA - Midvol/Concept Total 6.3 USA - Midvol/Concept: 32% Kazakhstan - Karaganda Kazakhstan - Karaganda: 68% Coal shipments annually ( ) and quarterly (2017) Millions of metric tonnes Q 17 2Q 17 3Q 17 4Q 17 External Sales - Third party Internal sales - Market Priced Total market priced shipments Captive (Cost plus basis) Total Shipments Strategic contracts Total shipments including strategic contracts annualreview2017.arcelormittal.com ArcelorMittal
34 Coal shipments 2017 (million of metric tones) Coal shipments 2017 (external sales -third party and internal sales at market price) (million of metric tones) Captive (Cost plus basis): 56% Total 6.3 Market priced: 44% Internal sales at market price: 61% Total 2.8 External sales - Third party: 39% (Millions of metric tonnes) 2017 % Market priced Captive (Cost plus basis) (Millions of metric tonnes) 2017 % External sales - Third party Internal sales at market price There are three categories of sales: 1) External sales : mined product sold to third parties at market price; 2) Market-priced tonnes : internal sales of mined product to ArcelorMittal facilities and reported at prevailing market prices; 3) Cost-plus tonnes - internal sales of mined product to ArcelorMittal facilities on a cost-plus basis. The determinant of whether internal sales are reported at market price or cost-plus is whether the raw material could practically be sold to third parties (i.e. there is a potential market for the product and logistics exist to access that market). annualreview2017.arcelormittal.com ArcelorMittal
35 Reserves and resources ArcelorMittal has both iron ore and metallurgical coal reserves. The Company s iron ore mining operations are located in the United States, Canada, Mexico, Brazil, Liberia, Bosnia, Ukraine and Kazakhstan. The Company s metallurgical coal mining operations are located in the United States and Kazakhstan. Except as otherwise indicated, the estimates of proven and probable ore reserves at the Company s mines and projects and the estimates of the mine life included in this annual report have been prepared by ArcelorMittal experienced engineers and geologists. In 2017, Roscoe Postle Associates Inc. prepared the updated 2016 estimates of iron ore reserves included in this annual report for the open pit operations at the Mary River Mine, Baffinland, Canada. The reserves for Las Truchas (Mexico, excluding Peña Colorada) were estimated in 2017 by Gustavson Associates. The reserve estimates as of December 31, 2016 and 2017 were prepared in compliance with the requirements of SEC Industry Guide 7. In Eastern Europe (Bosnia) and the CIS, ArcelorMittal has conducted in-house and independent reconciliations of ore reserve estimate classifications based on SEC Industry Guide 7 and standards used by the State Committee on Reserves, known as the GKZ, or its national equivalent, in the former Soviet Union countries. The GKZ, or its national equivalent, constitutes the legal framework for ore reserve reporting in former Soviet Union countries where ArcelorMittal operates mines. On the basis of these reconciliations, ArcelorMittal s ore reserves have been estimated by applying mine planning, technical and economic assessments defined as categories A, B and C1 according to the GKZ standards. In general, provided Guide 7 s economic criteria are met (which is the case here), A+B is equivalent to proven and C1 is equivalent to probable. Reserves are the part of a mineral deposit that could be economically and legally extracted or produced at the time of the reserve determination. Proven reserves are reserves for which (a) quantity is computed from dimensions revealed in outcrops, trenches, working or drill holes; grade and/or quality are computed from the results of detailed sampling; and (b) the sites for inspection, sampling and measurement are spaced so closely and the geologic character is so well defined that size, shape, depth and mineral content of reserves are wellestablished. Probable reserves are reserves for which quantity and grade and/or quality are computed from information similar to that used for proven reserves, but the sites for inspection, sampling and measurement are farther apart or are otherwise less adequately spaced. The degree of assurance, although lower than that for proven reserves, is high enough to assume continuity between points of observation. The demonstration of economic viability is established through the application of a life of mine plan for each operation or project providing a positive net present value on a cash-forward looking basis. Economic viability is demonstrated using forecasts of operating and capital costs based on historical performance, with forward adjustments based on planned process improvements, changes in production volumes and in fixed and variable proportions of costs, and forecasted fluctuations in costs of raw material, supplies, energy and wages. Ore reserve estimates are updated annually in order to reflect new geological information and current mine plan and business strategies. The Company s reserve estimates are of in-place material after adjustments for mining depletion and mining losses and recoveries, with no adjustments made for metal losses due to processing. For a description of risks relating to reserves and reserve estimates, see Item 3.D Key information Risk factors Risks related to ArcelorMittal ArcelorMittal s reserve estimates may materially differ from mineral quantities that it may be able to actually recover; ArcelorMittal s estimates of mine life may prove inaccurate; and market price fluctuations and changes in operating and capital costs may render certain ore reserves uneconomical to mine of the Company's annual report on Form 20-F. Detailed independent verifications of the methods and procedures used are conducted on a regular basis by external consultants and sites are reviewed on a rotating basis. In 2016, the 2015 year end iron ore reserve estimates were independently audited and validated by annualreview2017.arcelormittal.com ArcelorMittal
36 Roscoe Postle Associates Inc. for the Company s Las Truchas and Peña Colorada mines in Mexico, and no material changes to the 2015 year-end iron ore reserve estimates were recommended. The 2016 year end reserve estimates for the Kazakhstan coal operations were independently audited by SRK Consulting (UK) Limited who recommended changes that are currently being implemented. SRK Consulting (UK) Limited also completed the 2017 year end independent audits of the reserve estimates for ArcelorMittal Princeton coal operations in the United States and for ArcelorMittal Krivyi Rih iron ore operations in Ukraine, and recommended certain changes that are reflected in the 2017 year end reserve estimates. These audit reports confirmed the estimated coal and iron ore quantities respectively, within planned areas of extraction. ArcelorMittal owns less than 100% of certain mining operations; reserve estimates have not been adjusted to reflect ownership interests and therefore reflect 100% of reserves of each mine. Please see the table below for ArcelorMittal s ownership interest in each mine. All of the reserves presented are estimates at December 31, 2017 (unless otherwise stated). Mine life is derived from the life of mine plans and corresponds to the duration of the mine production scheduled from ore reserve estimates only. The Company s mineral leases are of sufficient duration (or convey a legal right to renew for sufficient duration) to enable all ore reserves on the leased properties to be mined in accordance with current production schedules. The Company s ore reserves may include areas where some additional approvals remain outstanding but where, based on the technical investigations the Company carries out as part of its mine planning process and its knowledge and experience of the approvals process, the Company expects that such approvals will be obtained as part of the normal course of business and within the timeframe required by the current life of mine schedule. The reported iron ore and coal reserves contained in this annual report do not exceed the quantities that the Company estimates could be extracted economically if future prices were at similar levels to the average contracted price for the three years ended December 31, The average iron ore spot reference price for the last three years ( ) was $61.77 tonne (delivered to China, Qingdao 62% Fe US $ per tonne, Metal Bulletin) duly adjusted for quality, Fe content, logistics and other considerations. For the same period, the average coal spot reference price was $140.13/tonne (Premium HCC FOB Aus, Metal Bulletin). The Company establishes optimum design and future operating cut-off grade based on its forecast of commodity prices and operating and sustaining capital costs. The cutoff grade varies from operation to operation and during the life of each operation in order to optimize cash flow, return on investments and the sustainability of the mining operations. Such sustainability in turn depends on expected future operating and capital costs. The reserve base can vary from year to year due to the revision of mine plans in response to market and operational conditions, in particular market price. See Item 3.D Key information Risk factors Risks related to ArcelorMittal ArcelorMittal s reserve estimates may materially differ from mineral quantities that it may be able to actually recover; ArcelorMittal s estimates of mine life may prove inaccurate; and market price fluctuations and changes in operating and capital costs may render certain ore reserves uneconomical to mine. Tonnage and grade estimates are reported as Run of Mine. Tonnage is reported on a wet metric basis. Iron ore reserve estimates The table below details ArcelorMittal s estimated iron ore reserves as of December 31, The classification of the iron ore reserve estimates as proven or probable reflects the variability in the mineralization at the selected cut-off grade, the mining selectivity and the production rate and ability of the operation to blend the different ore types that may occur within each deposit. At ArcelorMittal mining operations, proven iron ore reserve estimates are typically based on drill hole spacing ranging from 25m x 25m to 100m x 100m, and probable iron ore reserve estimates are based on drill hole spacing ranging from 50m x 50m to 300m x 300m. annualreview2017.arcelormittal.com ArcelorMittal
37 As of December 31, 2017 As of December 31, 2016 Proven Ore Reserves Probable Ore Reserves Total Ore Reserves Total Ore Reserves Millions of Tonnes % Fe Millions of Tonnes % Fe Millions of Tonnes % Fe Millions of Tonnes % Fe Canada (Excluding Baffinland) 1, , , Baffinland - Canada Minorca - USA Hibbing - USA Mexico (Excluding Peña Colorada) Peña Colorada - Mexico Brazil Liberia Bosnia Ukraine Open Pit Ukraine Underground Kazakhstan Open Pit Kazakhstan Underground Total , , , Supplemental information on iron ore operations The table below provides supplemental information on the producing mines. Operations/Projects % Ownership In Operation Since 2017 Run of Mine Production 2017 Saleable Production * (Million Tonnes) 1 * (Million Tonnes) Estimated Mine Life (Years) 2 Canada (Excluding Baffinland) Baffinland - Canada Minorca - USA Hibbing - USA Mexico (Excluding Peña Colorada) Pena Colorada - Mexico Brazil Liberia Bosnia Ukraine Open Pit Ukraine Underground Kazakhstan Open Pit Kazakhstan Underground * Represents 100% of production. 1 Saleable production is constituted of a mix of direct shipping ore, concentrate, pellet feed and pellet products which have a typical iron content of 65% to 66% Fe. Exceptions in 2017 included direct shipping ores produced in the Bosnia, Ukraine Underground and Kazakhstan mines which have an iron content ranging between 50% to 60% Fe and are solely annualreview2017.arcelormittal.com ArcelorMittal
38 for internal use at ArcelorMittal s regional steel plants. The direct shipping ore produced from Liberia had an average iron content of approximately 60% Fe in 2017 while the sinter fines produced for external customers in Brazil from the Serra Azul operations averaged approximately 62% Fe and the lumps averaged 58% Fe. 2 The estimated mine life reported in this table corresponds to the duration of the production life of each operation based on the 2017 year-end iron ore reserve estimates only. The production varies for each operation during the mine life and, as a result, mine life is not equal to the total reserve tonnage divided by the 2017 production. Changes in iron ore reserve estimates: 2017 versus 2016 The Company s iron ore reserve estimates had a net decrease of 123 million metric tonnes of Run of Mine between December 31, 2016 and This decrease in reserves was mainly due to 163 million tonnes of mining depletion during However, the downgrading of 28 million tonnes, primarily at the Hibbing operation in the USA (determined by core recovery and modifying factors), was offset by the net upgrading of 68 million tonnes primarily at the Baffinland operation in Canada (new reserve estimation as prepared by Roscoe Postle Associates Inc) and Kryvyi Rih operations in Ukraine (re-evaluation to align with the GKZ and approved mine plans, subsequently audited and confirmed by SRK Consulting (UK) Limited at the end of 2017).There were other minor re-evaluations of the Company s ore reserves, such as the reclassification of the Lisakovsky (Kazakhstan Open Pit) reserves from proven to probable due to modifying factors and additional new areas and new drill results at Las Truchas in Mexico. Overall, the average Fe grade has increased by 0.4% on an absolute basis. Metallurgical Coal Reserve Estimates The table below details ArcelorMittal s estimated metallurgical coal reserves as of December 31, The classification of coal reserve estimates as proven or probable reflects the variability in the coal seams thickness and quality, the mining selectivity and the planned production rate for each deposit. Proven coal reserve estimates are based on drill hole spacing ranging from 50m x 50m to 500m x 500m, and probable coal reserve estimates are based on drill hole spacing ranging from 100m x100m to 1,000m x 1,000m. As of December 31, 2017 As of December 31, 2016 Proven Coal Reserves Probable Coal Reserves Total Coal Reserves Total Coal Reserves ROM Millions of Wet Recoverable Million Tonnes Tonnes Millions of Wet Recoverable Million Tonnes Tonnes Millions of Wet Recoverable Million Tonnes Tonnes Ash (%) Sulfur (%) Volatile (%) Millions of Tonnes Wet Recoverable Million Tonnes Princeton - USA Karaganda - Kazakhstan Total Reserves for the Kazakhstan coal operations result from the 2017 mining depletion of the 2016 reported estimates; the reserves are currently being remodeled from first principle, as recommended in the 2016 SRK Consulting (UK) Limited independent audit report. At the Princeton coal operations in the United States, a new reserve statement has been completed and subsequently audited and confirmed by SRK Consulting (UK) Limited at the end of The table below provides supplemental information on the producing mines. Operations/Projects % Ownership In Operation Since 2017 Run of Mine Production (Million Tonnes) 2017 Wet Recoverable production (Million Tonnes) Estimated Mine Life (Years) 1 Princeton - USA Karaganda - Kazakhstan The estimated mine life reported in this table corresponds to the duration of the production life of each operation based on the 2017 year-end metallurgical coal reserve estimates only. The production varies for each operation during the mine life and as a result, mine life is not equal to the total reserve tonnage divided by the 2017 production. annualreview2017.arcelormittal.com ArcelorMittal
39 Changes in Metallurgical Coal Reserve Estimates: 2017 versus 2016 The Company s metallurgical coal reserve estimates had a net decrease of 30 million tonnes of Run of Mine coal and 14 million tonnes of recoverable coal between December 31, 2016 and 2017 due to the annual mining depletion of 14 million tonnes Run of Mine and a downgrade of 16 million tonnes Run of Mine at the Princeton operations in the United States. This downgrade was primarily due to the sale of a licensed area of reserves and to the re-evaluation of all current and planned mining areas. The reporting of recoverable coal reserves from Kazakhstan excludes the recoverable coal which in theory could be used for metallurgical applications but which in practice is sold and used as thermal coal by ArcelorMittal at its steel plant facilities. annualreview2017.arcelormittal.com ArcelorMittal
40 Raw material consumption Millions of metric tonnes Iron Ore PCI & Coal Coke Scrap & DRI Includes coal only for the steelmaking process and excludes steam coal for power generation. ArcelorMittal's consumption of PCI and Coal was 9.8 million tonnes and 38 million tonnes, respectively for the year ended December 31, annualreview2017.arcelormittal.com ArcelorMittal
41 Sustainability performance and data charts Also see our interactive charts SD data table Metric Unit Performance Crude steel production tonnes (million) Safe, healthy, quality working lives for our people Number of employees - total 209, , ,108 Number of contractors - total 45,914 43,044 43,368 Fatalities - total number Fatalities - steel number Fatalities - mining number Fatalities - own personnel number Fatalities - contractors number Lost-time injury rate - total per million hours worked Lost-time injury rate (mining) per million hours worked Lost-time injury rate (steel) per million hours worked Lost-time injury rate - own personnel per million hours worked Lost-time injury rate - contractors per million hours worked Accident severity rate - total per thousand hours worked Accident severity rate (steel) per thousand hours worked Accident severity rate (mining) per thousand hours worked Absenteeism rate - total % Manager turnover rate % Industrial operations (including mining) certified to OHSAS % Employees covered by collective bargaining agreements % Number of strikes exceeding one week in duration number No. training hours per employee hours Managers that are female: % Vice presidents % 6 6 General Managers % 6 10 Managers % Products that accelerate more sustainable lifestyles Research and development spend $ (million) Number of LCA studies undertaken Products for outcome 2 launched Programmes for outcome 2 in development Products that create sustainable infrastructure Products for outcome 3 launched annualreview2017.arcelormittal.com ArcelorMittal
42 Metric Unit Performance Programmes for outcome 3 in development Efficient use of resources and high recycling rates Raw materials used by weight: - Iron ore million tonnes Pulverised coal injection (PCI) and coal million tonnes Coke million tonnes Scrap and direct reduced iron (DRI) million tonnes Steel scrap recycled million tonnes CO 2 avoided from steel recycled million tonnes Blast furnace slag re-used (total) million tonnes BF slag to cement industry. million tonnes CO 2 avoided from slag re-use in cement industry million tonnes Production residues to landfill/waste (steel) % Production residues to landfill/waste (mining) % Production residues and by-products re-used (steel) % Production residues and by-products re-used (mining) % Trusted user of air, land and water Environmental capital expenditure $ (million) Industrial operations certified to ISO (steel) % Industrial operations certified to ISO (mining) % Air 2 Total dust emissions (steel) thousand tonnes Dust emissions (steel) per tonne kg/tonne of steel NO x (steel) thousand tonnes NO x (steel) per tonne kg/tonne of steel SO x (steel) thousand tonnes SO x (steel) per tonne kg/tonne of steel Total dust emissions (mining) thousand tonnes Total NO x (mining) thousand tonnes Total SO x (mining) thousand tonnes Water Freshwater intake (steel) m 3 per tonne of steel Proportion of water extraction from ground water sources % Water discharge (steel) m 3 per tonne of steel Net water use (steel) 3 m per tonne of steel Responsible energy user that helps create a lower carbon future Energy capital expenditure $ (million) Energy intensity (steel) GJ/t liquid steel Primary energy consumption (steel) * million GJ (PJ) 2,238 2,168 2,214 annualreview2017.arcelormittal.com ArcelorMittal
43 Metric Unit Performance energy recovered and reused on site, as % of total % energy from renewable sources, as % of total % energy sold by type (heat, steam or electricity) as % of total % Total CO2e footprint (steel and mining)* million tonnes CO2e Scope 1 CO2e (steel and mining) million tonnes CO2e Scope 2 CO2e (steel and mining) million tonnes CO2e Scope 3 CO2e (steel and mining) million tonnes CO2e Total CO2e footprint (steel) million tonnes CO2e GHG emissions scope 1 (steel only) million tonnes CO2e GHG emissions scope 2 (steel only) million tonnes CO2e GHG emissions scope 3 (steel only) million tonnes CO2e Total CO2e footprint (mining) million tonnes CO2e GHG emissions scope 1 (mining only) million tonnes CO2e GHG emissions scope 2 (mining only) million tonnes CO2e GHG emissions scope 3 (mining only) million tonnes CO2e CO 2 intensity (steel)* tonnes CO 2 per tonne of steel Carbon footprint intensity improvement since 2007 (target = 8% by 2020) % Supply chains our customers trust Global procurement suppliers evaluated against code for responsible sourcing number Active and welcomed member of the community 9. Pipeline of talented scientists and engineers for the future Community investment spend (including STEM spend) 3 $ (million) of which, voluntary spend $ (million) of which, spend on STEM projects 4 $ (million) Our contribution to society measured, shared and valued 5 Estimated direct economic contribution $ (million) 63,297 56,222 68,143 of which: - Total tax contribution 3,976 4,381 - Corporate Income tax $ (million) Local taxes Payroll taxes 3,193 3,334 - Other taxes including royalties Employee salaries, wages and pensions $ (million) 10,880 7,637 9,046 - Supplier and contractor payments $ (million) 46,569 40,489 50,498 - Capital expenditure $ (million) 2,707 2,444 2,819 - Dividends and payments to creditors $ (million) 1,978 1,417 1,092 Number of country level corporate responsibility/sustainability reports number Country level reports adhering to GRI % Transparent good governance annualreview2017.arcelormittal.com ArcelorMittal
44 Metric Unit Performance Number of Board self-assessments % of employees completed code of business conduct training % % of employees completed anti-corruption training % % of employees completed human rights training % Number of operations with a local confidential whistleblowing system number Whistleblowing complaints received via Internal Audit number *Assured by Deloitte Audit (1) The indicators in this table have been developed over the period in line with the requirements of the Global Reporting Initiative and of the business. All methodologies can be found in the Basis of Reporting. In 2014, we adopted 10 new sustainable development outcomes, and although these indicators were not selected to measure progress against these outcomes, they are listed here under our 10 outcomes. KPIs the company has identified as metrics that are useful for driving and tracking progress, are marked in bold. Environmental data presented in this table are provisional except where assured by Deloitte. (2) From 2014 onwards we report dust, NO x and SO x emissions per tonne of steel produced as a more meaningful indicator than the absolute volume generated - a key performance indicator. (3) In 2017 for the first time we break down community investment spend into that protion which is voluntary and that which is mandatory as a result of contractual agreements with host governments. (4) STEM = Science, technology, engineering and maths. (5) Further details of the estimated direct economic contribution are found in OUTCOME 10, which details our contribution to society. In 2016, the company undertook a review of all the taxes paid at a local level besides income tax. The total tax contribution published here are the result of that work, and represent a wider scope than reported in previous years. Details can be found in our Basis of Reporting. (6) Royalties are reported from 2016 onwards according to the scope of extractive industry reporting under the EU Accounting Directive 2013/34/EU, which is narrower than scope used in previous years. In this report, royalties are now included under 'other taxes'. See Basis of Reporting (7) In 2017, we revised the methodology for calculating CO2e emissions from our mining operations, from an input-output mass balance method, to a method that calculates the actual emissions from specific processes within our mining operations: the combustion of fuels (for transportation, for heating, for power generation etc), utilities (electricity, steam etc) and materials. This change impacted on the 2015 figure we published in previous years, and that we publish in this table. CO2e (mining) data has been within the scope of assurance by Deloitte Audit since annualreview2017.arcelormittal.com ArcelorMittal
45 Key financial and operational information 2017 US$ millions unless otherwise stated NAFTA BRAZIL EUROPE ACIS Mining Total FINANCIAL INFORMATION (AUDITED) Sales 17,997 7,755 36,208 7,621 4,033 68,679 Depreciation (518) (293) (1,201) (313) (416) (2,768) Impairments 1 (206) (206) Operating income 1, , ,434 Operating margin (as a percentage of sales) 6.6 % 9.0 % 6.5 % 6.7 % 24.6 % 7.9 % EBITDA 1, ,560 1,027 1,407 8,408 EBITDA margin (as a percentage of sales) 9.5 % 12.8 % 9.8 % 13.5 % 34.9 % 12.2 % Capital expenditure , ,819 OPERATIONAL INFORMATION (UNAUDITED) Crude steel production (thousand metric tonnes) 23,480 11,210 43,768 14,678 93,136 Steel shipments (thousand metric tonnes) 21,834 10,840 40,941 13,094 85,242 Average steel selling price (US$/t) Employees (Full-Time equivalent) 26,324 18,058 78,643 42,451 30, ,108 Number of employees at 2017 Mining: 15% Others: 1% NAFTA: 13% Brazil: 9% Number of employees % NAFTA 26, Brazil 18,058 9 Europe 78, ACIS: 20% Total 197,108 ACIS 42, Mining 30, Others 1,544 1 Total 197, Europe: 40% Full-time equivalent (excludes others) Impairment charges for 12M 2017 were $206 million related to a downward revision of cash flow projections across all steel facilities in ArcelorMittal South Africa. annualreview2017.arcelormittal.com ArcelorMittal
46 2016 US$ millions unless otherwise stated NAFTA BRAZIL EUROPE ACIS Mining Total FINANCIAL INFORMATION (AUDITED) Sales 15,806 6,223 29,272 5,885 3,114 56,791 Depreciation (549) (258) (1,184) (311) (396) (2,721) Impairments 1 (49) (156) (205) 2 Exceptional income Operating income/(loss) 2, , ,161 Operating margin (as a percentage of sales) 12.7 % 9.9 % 4.3 % 3.6 % 11.8 % 7.3 % EBITDA 1, , ,255 EBITDA margin (as a percentage of sales) 10.9 % 14.0 % 8.6 % 11.5 % 24.5 % 11.0 % Capital expenditure ,444 OPERATIONAL INFORMATION (UNAUDITED) Crude steel production (thousand of metric tonnes) 22,208 11,133 42,635 14,792 n/a 90,767 Steel shipments (thousand of metric tonnes) 21,281 10,753 40,247 13,271 n/a 83,934 Average steel selling price (US$/t) n/a 567 Employees (Full-Time equivalent) 27,233 18,380 80,975 41,989 28, , Impairment charges for 12M 2016 were $205 million of which $49 million related to the sale of ArcelorMittal Zaragoza in Spain an $156 million mainly related to the Vanderbijlpark plant in South Africa 2. Exceptional income for 12M 2016 was $832 million relating to a one-time gain on employee benefits following the singing of the new US labour contract annualreview2017.arcelormittal.com ArcelorMittal
47 2015 US$ millions unless otherwise stated NAFTA BRAZIL EUROPE ACIS Mining Total FINANCIAL INFORMATION (AUDITED) Sales 17,293 8,503 31,893 6,128 3,387 63,578 Depreciation (616) (336) (1,192) (408) (614) (3,192) Impairments 1 (526) (176) (398) (294) (3,370) (4,764) 2 Exceptional charges (454) (91) (632) (239) (1,436) Operating income/(loss) (705) (624) (3,522) (4,161) Operating margin (as a percentage of sales) (4.1)% 7.4 % 0.5 % (10.2)% (104)% (6.5)% EBITDA 891 1,231 2, ,231 EBITDA margin (as a percentage of sales) 5.2 % 14.5 % 7.5 % 5.2 % 13.6 % 8.2 % Capital expenditure , ,707 OPERATIONAL INFORMATION (UNAUDITED) Crude steel production (thousand of metric tonnes) 22,795 11,612 43,853 14,219 n/a 92,479 Steel shipments (thousand of metric tonnes) 21,306 11,540 40,676 12,485 n/a 84,586 Average steel selling price (US$/t) n/a 623 Employees (Full-Time equivalent) 28,861 19,816 83,825 45,291 30, , Impairment charges for 12M 2015 were $4.8 billion relating to: Mining segment ($3.4 billion): consisting of $0.9 billion with respect to goodwill and $2.5 billion primarily related to fixed assets mainly due to a downward revision of cash flow projections relating to the expected persistence of a lower raw material price outlook at: ArcelorMittal Liberia ($1.4 billion); Las Truchas in Mexico ($0.2 billion); ArcelorMittal Serra Azul in Brazil ($0.2 billion); and ArcelorMittal Princeton coal mining operations in the United States ($0.7 billion) Steel segments ($1.4 billion): consisting of fixed asset impairment charges of $0.2 billion related to the intended sale of the Long Carbon facilities in the US (ArcelorMittal La Place, Steelton and Vinton within the NAFTA segment), $0.4 billion primarily in connection with the idling for an indefinite time of the ArcelorMittal Sestao plant in Spain (Europe segment), and $0.8 billion related to: NAFTA: Deployment of asset optimization programs at Indiana Harbor East and West in the United States ($0.3 billion); Brazil: ArcelorMittal Point Lisas in Trinidad and Tobago ($0.2 billion) currently idled; and ACIS: Saldanha plant in South Africa as a result of its revised competitive outlook ($0.3 billion) 2. Exceptional charges for 12M 2015 were $1.4 billion primarily including $1.3 billion inventory related charges following the rapid decline of international steel prices and litigation and other costs in South Africa ($0.1 billion). annualreview2017.arcelormittal.com ArcelorMittal
48 2014 US$ millions unless otherwise stated NAFTA BRAZIL EUROPE ACIS Mining Total FINANCIAL INFORMATION (AUDITED) Sales 21,162 10,037 39,552 8,268 4,970 79,282 Depreciation and impairment (820) (457) (1,567) (525) (766) (4,203) Operating income 386 1, ,034 Operating margin (as a percentage of sales) 1.8 % 13.8 % 1.9 % 1.1 % 11.4 % 3.8 % EBITDA 1,206 1,845 2, ,331 7,237 EBITDA margin (as a percentage of sales) 5.7 % 18.4 % 5.8 % 7.5 % 26.8 % 9.1 % Capital expenditure , ,665 OPERATIONAL INFORMATION (UNAUDITED) Crude steel production (thousand of metric tonnes) 25,036 10,524 43,419 14,148 n/a 93,127 Steel shipments (thousand of metric tonnes) 23,074 10,376 39,639 12,833 n/a 85,125 Average steel selling price (US$/t) n/a 775 Employees 31,410 20,860 86,054 47,445 34, ,327 EBITDA defined as operating income plus depreciation, impairment expenses, restructuring and exceptional charges/(income). Sales amounts are prior to inter-segment eliminations (except for total) and includes non-steel sales. Steel shipments are prior to inter-segment eliminations (except for total). Margin analysis calculated on the unrounded values. Total column includes holding and service companies and eliminations. annualreview2017.arcelormittal.com ArcelorMittal
49 Quarterly condensed income statement Annually and Quarterly (2016 and 2017) In millions of U.S. dollars Q 16 2Q 16 3Q 16 4Q 16 1Q 17 2Q 17 3Q 17 4Q 17 Sales 56,791 68,679 13,399 14,743 14,523 14,126 16,086 17,244 17,639 17,710 Depreciation (2,721) (2,768) (652) (680) (693) (696) (655) (676) (690) (747) Impairment 1 (205) (206) (49) (156) (46) (160) 2 Exceptional income Operating income/(loss) 4,161 5, ,873 1, ,576 1,390 1,234 1,234 Operating margin % 7.3% 7.9% 2.1% 12.7% 8.3% 5.7% 9.8% 8.1% 7.0% 7.0% Income from associates, joint ventures and other investments Net interest expense (1,114) (823) (332) (306) (255) (221) (223) (207) (205) (188) Foreign exchange and other net financing gain/(loss) (942) (52) 9 (450) (223) (278) (133) (261) Income (loss) before taxes and non-controlling interest 2,720 5, , ,306 1,513 1, Current tax (254) (583) (24) (83) (67) (80) (207) (126) (116) (134) Deferred tax (732) 151 (676) (70) (79) 93 (76) (71) Income tax benefit/(expense) (986) (432) (700) (153) (146) 13 (283) (197) (71) 119 Income (loss) including non-controlling interests 1,734 4,575 (424) 1, ,023 1,316 1,207 1,029 Non-controlling interests (income)/loss 45 (7) 8 (20) (9) 66 (21) 6 (2) 10 Net Income/(loss) attributable to the equity holders of the parent 1,779 4,568 (416) 1, ,002 1,322 1,205 1,039 Basic earnings (loss) per common share ($) (0.70) Diluted earnings (loss) per common share ($) 3, (0.70) Weighted average common shares outstanding (in millions) , ,020 1,020 1,020 1,020 1,020 1,020 Adjusted diluted weighted average common shares outstanding (in millions) , ,021 1,021 1,022 1,023 1,023 1,024 EBITDA 4 6,255 8, ,770 1,897 1,661 2,231 2,112 1,924 2,141 EBITDA Margin % 11.0% 12.2% 6.9% 12.0% 13.1% 11.8% 13.9% 12.2% 10.9% 12.1% 1. Impairment charges for 12M 2016 were $205 million of which $49 million related to the sale of ArcelorMittal Zaragoza in Spain and $156 million mainly related to the Vanderbijlpark plant in South Africa. Impairment charges for 12M 2017 were $206 million related to a downward revision of cash flow projections across all steel facilities in ArcelorMittal South Africa. 2. Exceptional income for 12M 2016 was $832 million relating to a one-time gain on employee benefits following the signing of the new US labour contract. 3. Diluted earnings per common share include assumed shares from employee share-based payments and convertible debt (if dilutive) in the weighted average number of common shares outstanding during the periods presented. 4. EBITDA defined as operating income plus depreciation, impairment expenses and exceptional charges/ (income). 5. Following the Company s equity offering in April 2016, the basic and diluted earnings (loss) per share for prior periods have been recasted in accordance with IFRS in the current year for the three months starting 1Q'15 and for the years ended December 31, 2014 and December 31, 2015, to include the bonus element derived from the 35% discount to annualreview2017.arcelormittal.com ArcelorMittal
50 the theoretical ex-right price included in the subscription price. Following the completion of the Company s share consolidation of each three existing shares into one share without nominal value on May 22, 2017, the earnings (loss) per share and corresponding basic and diluted weighted average common shares outstanding have been recosted in accordance with IFRS in the current year for the three months starting 1Q 16 and for the year ended December 31, annualreview2017.arcelormittal.com ArcelorMittal
51 Operating footprint Total achievable crude steel capacity (113 million metric tonnes as per 20F)* ACIS: 17% NAFTA: 25% 113Mt as per 20F % NAFTA 25 EUROPE 47 Brazil: 11% Total 113 BRAZIL 11 ACIS 17 Total 100 Europe: 47% Blast furnace facilities and electric arc furnaces BF Facilities* Number of blast furnaces EAF Facilities** Number of Electric Arc Furnaces ArcelorMittal Group 56 NAFTA 11 USA 7 Canada 3 Mexico 1 EUROPE 27 EUROPE FLAT 22 EUROPE LONG 5 BRAZIL 6 Flat Brazil 3 Long Brazil 3 ACIS 12 ArcelorMittal Group 31 NAFTA 10 USA 2 Canada 4 Lazaro Cardenas 4 EUROPE 13 EUROPE FLAT 5 EUROPE LONG 8 BRAZIL 6 Long Brazil 6 ACIS 2 South Africa 2 South Africa 3 Temirtau 5 Kryvy Rih 4 * In December 2012, the Company announced the long-term idling of the liquid phase at the Florange site in France. Footprint analysis shown above includes two blast furnaces in Florange. ** The 2017 EAF footprint has 5 EAF's less as compared to 2016: 2 EAF's in Vinton (divestment), 1 EAF in LaPlace (divestment), 1 EAF in Zaragoza (divestment) and 1EAF in Zumarraga (closure) annualreview2017.arcelormittal.com ArcelorMittal
52 Property, plant and equipment ArcelorMittal has steel production facilities, as well as iron ore and coal mining operations, in North and South America, Europe, Asia and Africa. All of its operating subsidiaries are substantially owned by ArcelorMittal through intermediate holding companies, and are grouped into the five reportable segments. Unless otherwise stated, ArcelorMittal owns all of the assets described in this section. Steel Production Facilities of ArcelorMittal The following table provides an overview by type of steel facility of the principal production units of ArcelorMittal s operations. While all of the Group s facilities are shown in the tables, only the facilities of significant subsidiaries are described textually for each segment. The facilities included in the tables are listed from upstream to downstream in the steel-making process. Facility Number of facilities Capacity (in million tonnes per year) 1 Production in 2017 (in million tonnes per year) 2 Coke Oven Battery Sinter Plant Blast Furnace Basic Oxygen Furnace (including Tandem Furnace) DRI Plant Electric Arc Furnace Continuous Caster Slabs Hot Rolling Mill Pickling Line Tandem Mill Annealing Line (continuous/batch) Skin Pass Mill Plate Mill Continuous Caster Bloom/Billet Breakdown Mill (Blooming/Slabbing Mill) Billet Rolling Mill Section Mill Bar Mill Wire Rod Mill Hot Dip Galvanizing Line Electro Galvanizing Line Tinplate Mill Tin Free Steel (TFS) Color Coating Line Seamless Pipes Welded Pipes Reflects design capacity and does not take into account other constraints in the production process (such as, upstream and downstream bottlenecks and product mix changes). annualreview2017.arcelormittal.com ArcelorMittal
53 As a result, in some cases, design capacity may be different from the current achievable capacity. 2 Production facility details include the production numbers for each step in the steel-making process. Output from one step in the process is used as input in the next step in the process. Therefore, the sum of the production numbers does not equal the quantity of sellable finished steel products. annualreview2017.arcelormittal.com ArcelorMittal


54 NAFTA NAFTA annualreview2017.arcelormittal.com ArcelorMittal
55 Property, plants and equipment ArcelorMittal s NAFTA segment has production facilities in North America, including the United States, Canada and Mexico. The following table sets forth key items of information regarding ArcelorMittal s principal production locations and production units in the NAFTA segment: Unit Country Locations Type of plant Products 1 Production in 2017 (in million tonnes) ArcelorMittal USA USA Warren, OH Coke-Making Coke n/a ArcelorMittal USA USA Monessen, PA Coke-Making Coke n/a ArcelorMittal USA 2 3 USA East Chicago, IN Integrated Flat 5.0 ArcelorMittal USA USA Burns Harbor, IN Integrated Flat 4.4 ArcelorMittal USA USA Cleveland, OH Integrated Flat 3.2 ArcelorMittal USA USA Riverdale, IL Integrated Flat 0.7 ArcelorMittal USA USA Coatesville, PA Mini-mill Flat 0.4 ArcelorMittal USA USA Columbus, OH Downstream Flat n/a I/N Tek USA New Carlisle, IN Downstream Flat n/a ArcelorMittal USA USA Conshohocken, PA Downstream Flat n/a ArcelorMittal USA USA Weirton, WV Downstream Flat n/a ArcelorMittal USA USA Gary, IN Downstream Flat n/a Double G USA Jackson, MS Downstream Flat n/a ArcelorMittal Dofasco Canada Hamilton Integrated, Mini-mill Flat 3.7 ArcelorMittal Mexico Mexico Lázaro Cárdenas, Celaya Mini-mill, Integrated, and Downstream Flat, Long/ Bar, Wire Rod 3.8 ArcelorMittal Long Products Canada Canada Contrecoeur East, West Mini-mill Long/ Wire Rod, Bars, Slabs 2.0 ArcelorMittal USA USA Steelton, PA Mini-mill Long/ Rail 0.3 ArcelorMittal Tubular Products Canada Brampton Downstream Pipes and Tubes n/a ArcelorMittal Tubular Products Canada London Downstream Pipes and Tubes n/a ArcelorMittal Tubular Products Canada Woodstock Downstream Pipes and Tubes n/a ArcelorMittal Tubular Products Canada Hamilton Downstream Pipes and Tubes n/a ArcelorMittal Tubular Products USA Shelby Downstream Pipes and Tubes n/a ArcelorMittal Tubular Products USA Marion Downstream Pipes and Tubes n/a ArcelorMittal Tubular Products Mexico Monterrey Downstream Pipes and Tubes n/a 1 Note: n/a = not applicable (no crude steel production). 2 Indiana Harbor (East and West). 3 ArcelorMittal USA idled its #2 basic oxygen furnace and its #2 slab caster at Indiana Harbor East (East Chicago) in June annualreview2017.arcelormittal.com ArcelorMittal

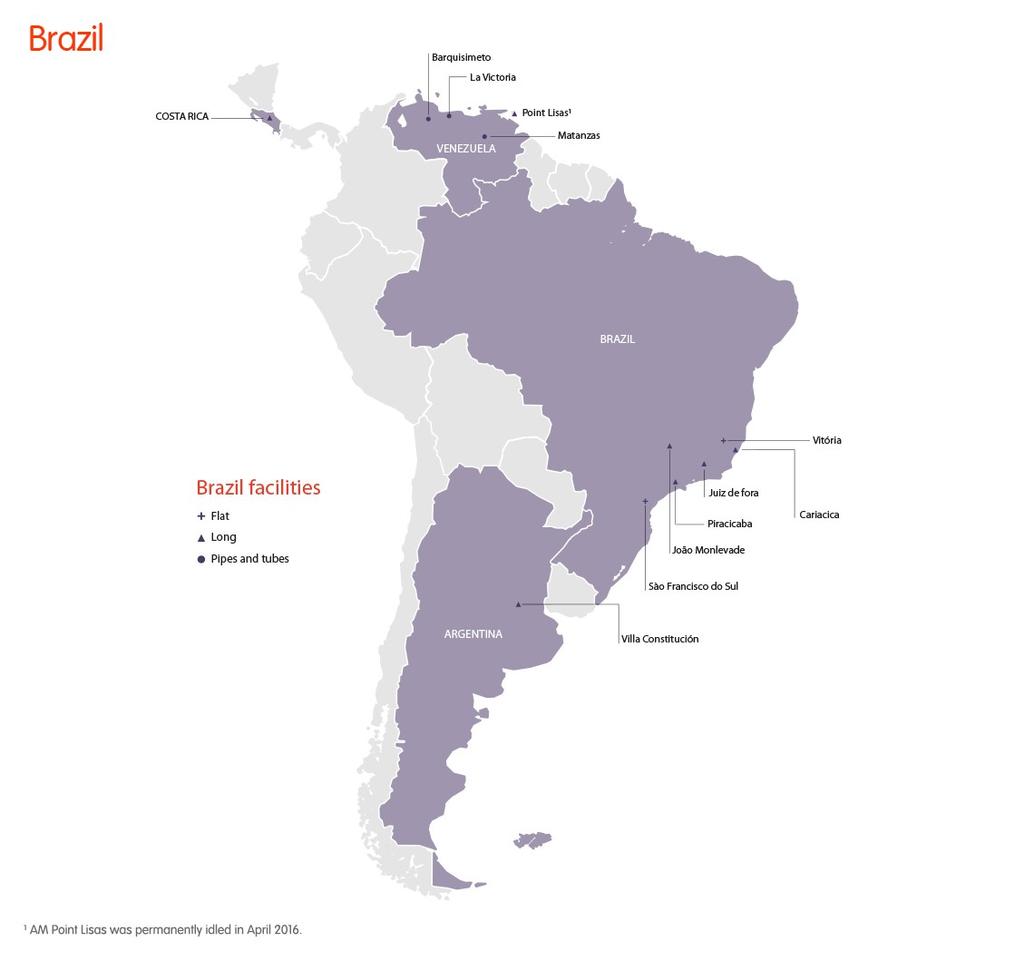

56 Brazil Brazil annualreview2017.arcelormittal.com ArcelorMittal
57 Property, plants and equipment ArcelorMittal s Brazil segment has production facilities in South America, including Brazil, Argentina, Costa Rica and Venezuela. The following table sets forth key items of information regarding ArcelorMittal s principal production locations and production units in the Brazil segment: Unit Country Locations Type of Plant Products 1 Production in 2017 (in million tonnes) Sol Brazil Vitoria Coke-Making Coke n/a ArcelorMittal Tubarão Brazil Vitoria Integrated Flat 7.2 ArcelorMittal Vega Brazil São Francisco do Sul Downstream Flat n/a ArcelorMittal Brasil Brazil João Monlevade Integrated Long/Wire Rod 1.0 Acindar Argentina Villa Constitucion Mini-mill Long/Wire Rod, Bar 1.1 ArcelorMittal Brasil Brazil Juiz de Fora, Piracicaba, Cariacica, Mini-mill Long/Bar, Wire Rod 1.9 ArcelorMittal Costa Rica Costa Rica Costa Rica Downstream Long/Wire Rod n/a Industrias Unicon Venezuela Barquisimeto, Matanzas, La Victoria Downstream Pipes and Tubes n/a 1 Note: n/a = not applicable (no crude steel production). annualreview2017.arcelormittal.com ArcelorMittal


58 Europe Europe annualreview2017.arcelormittal.com ArcelorMittal
59 Property, plants and equipment ArcelorMittal s Europe segment has production facilities in Western Europe, Eastern Europe and North Africa including Germany, Belgium, France, Spain, Italy, Luxembourg, Romania, Poland, Macedonia, Estonia, Czech Republic, Morocco and Bosnia and Herzegovina. Additionally, ArcelorMittal Europe holds the in-house trading and distribution facilities, described below as Distribution Solutions. The following table provide an overview by type of facility of ArcelorMittal s principal production locations and production units in the Europe segment: Unit Country Locations Type of Plant Products Production in 2017 (in million tonnes per year) 1 ArcelorMittal Bremen Germany Bremen, Bottrop Integrated Flat 3.2 ArcelorMittal Eisenhüttenstadt Germany Eisenhüttenstadt Integrated Flat 2.2 ArcelorMittal Belgium Belgium Gent, Geel, Genk, Huy, Liège Integrated and Downstream Flat 5.5 ArcelorMittal Atlantique et Lorraine France Dunkirk, Mardyck, Montataire, Desvres, Florange, Mouzon, Basse- Indre Integrated and Downstream Flat 6.9 ArcelorMittal Méditerranée France Fos-sur-Mer, Saint-Chély Integrated and Downstream Flat 3.8 ArcelorMittal Galati Romania Galati Integrated Flat 2.0 ArcelorMittal España Spain Avilés, Gijón, Etxebarri, Lesaka Integrated and Downstream Flat, Long, Rails, Wire Rod 4.7 ArcelorMittal Poland Poland Krakow, Swietochlowice, Dabrowa Gornicza, Chorzow, Sosnowiec, Zdzieszowice Integrated and Downstream Flat, Long, Coke/Sections, Wire Rod, Sheet Piles, Rails 5.6 ArcelorMittal Sestao Spain Bilbao Mini-mill Flat 0.3 ArcelorMittal Sagunto Spain Sagunto Downstream Flat n/a ArcelorMittal Piombino Italy Avellino, Piombino Downstream Flat n/a ArcelorMittal Dudelange Luxembourg Dudelange Downstream Flat n/a ArcelorMittal Skopje Macedonia Skopje Downstream Flat n/a ArcelorMittal Tallinn Estonia Tallinn Downstream Flat n/a Industeel France, Belgium Charleroi, Le Creusot, Chateauneuf, Saint-Chamond, Seraing, Dunkirk Mini-mill and Downstream Flat 0.4 ArcelorMittal Ostrava Czech Republic Ostrava Integrated Flat, Long 1.8 ArcelorMittal Belval & Differdange Luxembourg Esch-Belval, Differdange, Rodange Mini-mill Long /Sheet Piles, Rails, Sections & Special Sections 2.2 ArcelorMittal Gipuzkoa Spain Olaberría, Bergara Mini-mill Long/Sections 1.0 ArcelorMittal Gandrange France Gandrange Downstream Long/Wire Rod, Bars n/a ArcelorMittal Warszawa Poland Warsaw Mini-mill Long/Bars 0.6 ArcelorMittal Hamburg Germany Hamburg Mini-mill Long/Wire Rods 1.0 ArcelorMittal Duisburg Germany Ruhrort, Hochfeld Integrated Long/Billets, Wire Rod 1.1 ArcelorMittal Hunedoara Romania Hunedoara Mini-mill Long/Sections 0.3 Sonasid Morocco Nador, Jorf Lasfar Mini-mill Long/Wire Rod, Bars, Rebars in Coil 0.5 ArcelorMittal Zenica Bosnia and Herzegovina Zenica Minimill/Integrated Long/Wire Rod, Bars 0.7 ArcelorMittal Tubular Products Galati SRL Romania Galati Downstream Pipes and Tubes n/a annualreview2017.arcelormittal.com ArcelorMittal
60 Unit Country Locations Type of Plant Products Production in 2017 (in million tonnes per year) 1 ArcelorMittal Tubular Products Roman SA ArcelorMittal Tubular Products Iasi SA ArcelorMittal Tubular Products Ostrava a.s. ArcelorMittal Tubular Products Karvina a.s. ArcelorMittal Tubular Products Kraków ArcelorMittal Tubular Products Hautmont ArcelorMittal Tubular Products Vitry ArcelorMittal Tubular Products Chevillon Romania Roman Downstream Pipes and Tubes n/a Romania Iasi Downstream Pipes and Tubes n/a Czech Republic Ostrava Downstream Pipes and Tubes n/a Czech Republic Karvina Downstream Pipes and Tubes n/a Poland Krakow Downstream Pipes and Tubes n/a France Hautmont Downstream Pipes and Tubes n/a France Vitry Downstream Pipes and Tubes n/a France Chevillon Downstream Pipes and Tubes n/a 1 Note: n/a = not applicable (no crude steel production). annualreview2017.arcelormittal.com ArcelorMittal


61 ACIS ACIS annualreview2017.arcelormittal.com ArcelorMittal
62 Property, plants and equipment ArcelorMittal s ACIS segment has production facilities in Asia and Africa, including Kazakhstan, Ukraine and South Africa. Additionally, it has a sales network named ArcelorMittal International. The following tables provide an overview by type of facility of ArcelorMittal s principal production locations and production units in the ACIS segment: Unit Country Locations Type of plants Products Production in 2017 (in million 1 tonnes) ArcelorMittal Temirtau JSC Kazakhstan Termitau Integrated Flat, Long, Pipes and Tubes 4.1 ArcelorMittal Kryvyi Rih Ukraine Kryvyi Rih Integrated Long 5.8 ArcelorMittal South Africa South Africa Vanderbijlpark, Saldanha, Newcastle, Pretoria Integrated Mini-mill Downstream Flat, Long, Pipes and Tubes 4.8 JSC ArcelorMittal Tubular Products Aktau Kazakhstan Aktau Downstream Pipes and Tubes n/a 1 Note: n/a = not applicable (no crude steel production). annualreview2017.arcelormittal.com ArcelorMittal


63 Mining Mining annualreview2017.arcelormittal.com ArcelorMittal
64 Property, plants and equipment ArcelorMittal s mining segment has production facilities in North and South America, Europe, Africa and CIS. The following table provides an overview by type of facility of ArcelorMittal s principal mining operations. Unit Country Locations ArcelorMittal Interest (%) Type of Mine Product Iron Ore ArcelorMittal Mines and Infrastructure Canada Canada Mt Wright and Port Cartier, Qc 85.0 Iron Ore Mine (open pit), railway and port Concentrate and pellets Baffinland Canada Baffin Island, Nunavut Iron Ore Mine (open pit) Lump and fines Minorca Mines USA Virginia, MN Iron Ore Mine (open pit) Pellets Hibbing Taconite Mines USA Hibbing, MN 62.3 Iron Ore Mine (open pit) Pellets ArcelorMittal Mexico Mexico Sonora, Lazaro Cardenas Iron Ore Mine (open pit) Concentrate, lump and fines ArcelorMittal Mexico Peña Colorada Mexico Minatitlán 50.0 Iron Ore Mine (open pit) Concentrate and pellets ArcelorMittal Brasil Andrade Mine Brazil State of Minas Gerais Iron Ore Mine (open pit) Fines ArcelorMittal Mineração Serra Azul Brazil State of Minas Gerais Iron Ore Mine (open pit) Lump and fines ArcelorMittal Prijedor Bosnia and Herzegovina Prijedor 51.0 Iron Ore Mine (open pit) Concentrate and lump ArcelorMittal Kryvyi Rih Ukraine Kryvyi Rih 95.1 Iron Ore Mine (open pit and underground) Concentrate, lump and sinter feed ArcelorMittal Temirtau Kazakhstan Lisakovsk, Kentobe, Atasu, Atansore Iron Ore Mine (open pit and underground) Concentrate, lump and fines ArcelorMittal Liberia Liberia Yekepa 85.0 Iron Ore Mine (open pit) Fines Coal ArcelorMittal Princeton USA McDowell, WV, Tazewell, VA Coal Mine (surface and underground) Coking and PCI coal ArcelorMittal Temirtau Kazakhstan Karaganda Coal Mine (underground) Coking coal and thermal coal 1. The Company's share in Baffinland was decreased from 44.5% to 31.1%. annualreview2017.arcelormittal.com ArcelorMittal
65 Canada Dofasco / Hamilton Crude steel production 2017: 3.7 million tonnes annualreview2017.arcelormittal.com ArcelorMittal
66 Mexico - Lázaro Cárdenas Crude steel production 2017: 3.8 million tonnes (Flat:2.3mt; Long 1.5mt) annualreview2017.arcelormittal.com ArcelorMittal
67 USA - Burns Harbor Crude steel production 2017: 4.4 million tonnes annualreview2017.arcelormittal.com ArcelorMittal
68 USA - Cleveland Crude steel production 2017: 3.2 million tonnes annualreview2017.arcelormittal.com ArcelorMittal
69 USA - Indiana Harbor East and West Crude steel production 2017: 5 million tonnes annualreview2017.arcelormittal.com ArcelorMittal
70 Brazil - CST, sol and Vega do Sul Crude steel production 2017: 7.2 million tonnes annualreview2017.arcelormittal.com ArcelorMittal
71 Kazakhstan - Temirtau Crude steel production 2017: 4.1 million tonnes annualreview2017.arcelormittal.com ArcelorMittal
72 South Africa - Vanderbijlpark Crude steel production 2017: 2.3 million tonnes annualreview2017.arcelormittal.com ArcelorMittal
73 Ukraine - Kryvyi Rih Crude steel production 2017: 5.8 million tonnes annualreview2017.arcelormittal.com ArcelorMittal
74 Belgium - Gent Crude steel production 2017: 5.5 million tonnes annualreview2017.arcelormittal.com ArcelorMittal
75 Belgium - Liège Crude steel production 2017: n/a annualreview2017.arcelormittal.com ArcelorMittal
76 Bosnia - Zenica Crude steel production 2017: 0.7 million tonnes annualreview2017.arcelormittal.com ArcelorMittal
77 France - Dunkerque, Mardyck, Montataire and Desvres Crude steel production 2017: 6.9 million tonnes annualreview2017.arcelormittal.com ArcelorMittal
78 France - Florange, Mouzon and Dudelange (Luxembourg) Crude steel production 2017: n/a annualreview2017.arcelormittal.com ArcelorMittal
79 France - Fos-sur-Mer Crude steel production 2017: 3.8 million tonnes annualreview2017.arcelormittal.com ArcelorMittal
80 Germany - Bremen Crude steel production 2017: 3.2 million tonnes annualreview2017.arcelormittal.com ArcelorMittal
81 Germany - Ekostahl and Eisenhüttenstadt Crude steel production 2017: 2.2 million tonnes annualreview2017.arcelormittal.com ArcelorMittal
82 Poland - Kraków and Świętochłowice Crude steel production 2017: 1.6 million tonnes annualreview2017.arcelormittal.com ArcelorMittal
83 Romania - Galati Crude steel production 2017: 2.0 million tonnes annualreview2017.arcelormittal.com ArcelorMittal
84 Czech Republic - Ostrava Crude steel production 2017: 1.8 million tonnes annualreview2017.arcelormittal.com ArcelorMittal
85 Poland - Dąbrowa Górnicza, Sosnowiec and ZKZ Crude steel production 2017: 4.0 million tonnes annualreview2017.arcelormittal.com ArcelorMittal
86 Spain - Gijón and Avilés Crude steel production 2017: 4.7 million tonnes annualreview2017.arcelormittal.com ArcelorMittal
87 Steel making process Steel is produced from iron ore or scrap. Iron ore is a mineral aggregate that can be converted economically into iron. The quality of the iron ore is mainly determined by its composition; a high iron content and low sulphur and phosphorus contents are favorable. Iron ore can be found all over the world, but its iron content varies. Steel scrap has been selectively collected for several decades and is recycled as a valuable raw material for steel production. In the steel production, following stages are identified: production of pig iron; production of liquid steel; hot rolling and cold rolling; applying a metallic and/or organic coating. There are two main processes for producing steel: by means of a blast furnace (= indirect reduction) in combination with a converter, or by means of an electric furnace. In the former process, iron ore is the main raw material. In an electric furnace, scrap iron is used and occasionally also sponge iron. Sponge is an intermediate product, which is produced from iron ore by means of direct reduction (= DRI or directly reduced iron) and that is then further reduced and smelted in an electric furnace. annualreview2017.arcelormittal.com ArcelorMittal
88 annualreview2017.arcelormittal.com ArcelorMittal
89 Products and services ArcelorMittal is the only producer offering the full range of steel products and services. From commodity steel to value-added products, from long products to flat, from standard to specialty products, from carbon steel to stainless steel and alloys, ArcelorMittal offers a complete spectrum of steel products and supports it with continuous investment in process and product research. This section provides you with an overview of ArcelorMittal s product portfolio. Consult for an overview of all products. Long and flat carbon steel products View table (PDF, 31KB) annualreview2017.arcelormittal.com ArcelorMittal
90 Glossary 's MT Thousands of metric tonnes. A Alloy Steels Alloy steels have enhanced properties due to the presence of one or more special elements, or to the presence of larger proportions of elements such as manganese and silicon that are present in carbon steels. Apparent Consumption Total shipments minus exports plus imports of steel. B Bar A finished steel product, commonly in flat, square, round or hexagonal shapes. Rolled from billets, bars are produced in two major types, merchant and special. Basic Oxygen Steelmaking The process whereby hot metal and steel scrap are charged into a Basic Oxygen Furnace (BOF). High purity oxygen is then blown into the metal bath, combining with carbon and other elements to reduce the impurities in the molten charge and convert it into steel. Billet A piece of semi-finished iron or steel that is nearly square and is longer than a bloom. Bars and rods are made from billets. Blast Furnace A large cylindrical structure into which iron ore is combined with coke and limestone to produce molten iron. annualreview2017.arcelormittal.com ArcelorMittal
91 Bloom A semi-finished product, large and mostly square in cross-section. Blooms are shaped into girders, beams, and other structural shapes. C Carbon Steels The largest percentage of steel production. Common grades have a carbon content ranging from 0.06% to 1.0%. Coal The primary fuel used by integrated iron and steel producers. Coil A finished steel product such as sheet or strip which has been wound or coiled after rolling. Coke A form of carbonised coal burned in blast furnaces to reduce iron ore pellets or other iron-bearing materials to molten iron. Coke Ovens Ovens where coke is produced. Coal is usually dropped into the ovens through openings in the roof, and heated by gas burning in flues in the walls between ovens within the coke oven battery. After heating for about 18 hours, the end doors are removed and a ram pushes the coke into a quenching car for cooling before delivery to the blast furnace. Cold Rolling The passing of sheet or strip that has previously been hot rolled and pickled through cold rolls, i.e. below the softening temperature of the metal. Cold rolling makes a product that is thinner, smoother, and stronger than can be made by hot rolling alone. Continuous Casting A process for solidifying steel in the form of a continuous strand rather than individual ingots. Molten steel is poured into open bottomed, water-cooled moulds. As the molten steel passes through the mould, the outer shell solidifies. CRC Cold rolled coil (see Cold Rolling). annualreview2017.arcelormittal.com ArcelorMittal
92 Crude Steel Steel in the first solid state after melting, suitable for further processing or for sale. Synonymous to raw steel. D Direct Reduction A family of processes for making iron from ore without exceeding the melting temperature. No blast furnace is needed. E Electrical Steels Specially manufactured cold rolled sheet and strip containing silicon, processed to develop definite magnetic characteristics for use by the electrical industry. Electric Arc Furnace An electric furnace used to melt steel scrap or direct reduced iron. or EUR Euro. F Flat Products A term referring to a class of products including sheet, strip and plate that are made from slabs. G Galvanised Steel Produced when hot or cold rolled sheet or strip is coated with zinc either by the hot dipping or electrolytic deposition process. Zinc coating applied by the hot dip method is normally heavy enough to resist corrosion without additional protective coating. Materials electrolytically galvanised are not used for corrosion resistant applications without subsequent chemical treatment and painting, except in mild corrosive conditions, due to the thin coating of zinc. Galvanise is a pure zinc coating. A special heat-treating process converts the pure zinc coating to a zinc/iron alloy coating, and the product is known as Galvanneal. annualreview2017.arcelormittal.com ArcelorMittal
93 H HDG Hot Dip Galvanised (see Galvanised Steel). Hot Metal Molten iron produced in the blast furnace. Hot Rolling Rolling semi-finished steel after it has been reheated. HRC Hot Rolled Coil (see Hot Rolling). I Inferred mineral resources An inferred mineral resource is that part of a mineral resource for which quantity and grade or quality can be estimated on the basis of geological evidence and limited sampling and reasonably assumed, but not verified, geological and grade continuity. The estimate is based on limited information and sampling through appropriate techniques from locations such as outcrops, trenches, pits, workings and drill holes. Integrated Steelmaker A producer that converts iron ore into semi-finished or finished steel products. Traditionally, this process required coke ovens, blast furnaces, steelmaking furnaces, and rolling mills. A growing number of integrated mills use the direct reduction process to produce sponge iron without coke ovens and blast furnaces. Iron Ore The primary raw material in the manufacture of steel. L Ladle Metallurgy The process whereby conditions (temperature, pressure and chemistry) are controlled within the ladle of the steelmaking furnace to improve productivity in preceding and subsequent steps and the quality of the final product. annualreview2017.arcelormittal.com ArcelorMittal
94 Limestone Used by the steel industry to remove impurities from the iron made in blast furnaces. Magnesiumcontaining limestone, called dolomite, is also sometimes used in the purifying process. Line Pipe Used for transportation of gas, oil or water generally in a pipeline or utility distribution system. M Mechanical Tubing Welded or seamless tubing produced in a large number of shapes to closer tolerances than other pipe. Mini-mill A small non-integrated or semi-integrated steel plant, generally based on electric arc furnace steelmaking. Mini-mills produce rods, bars, small structural shapes and fl at rolled products. N Net Debt Net debt refers to long-term debt, plus short-term debt, less cash and cash equivalents. Net Ton See Ton. O Oil Country Tubular Goods (OCTG) Pipe used in wells in oil and gas industries, consisting of casing, tubing, and drill pipe. Casing is the structural retainer for the walls; tubing is used within casing oil wells to convey oil to ground level; drill pipe is used to transmit power to a rotary drilling tool below ground level. Open Hearth Process A process for making steel from molten iron and scrap. The open hearth process has been replaced by the basic oxygen process in most modern facilities. annualreview2017.arcelormittal.com ArcelorMittal
95 P Pellets An enriched form of iron ore shaped into small balls. Pig Iron High carbon iron made by the reduction of iron ore in the blast furnace. Plate A flat rolled product rolled from slabs or ingots, of greater thickness than sheet or strip. R Rolling Mill Equipment that reduces and transforms the shape of semi-finished or intermediate steel products by passing the material through a gap between rolls that is smaller than the entering materials. S Semi-Finished Products Products such as slabs, billets, and blooms which must be rolled or otherwise processed to create usable steel shapes. Sheet A flat rolled product over 12 inches in width and of less thickness than plate. Sheet Piling Rolled sections with interlocking joints (continuous throughout the entire length of the piece) on each edge to permit being driven edge-to-edge to form continuous walls for retaining earth or water. Sintering A process which combines ores too fine for efficient blast furnace use with flux stone. The mixture is heated to form lumps, which allow better draft in the blast furnace. Slab A wide semi-finished product made from an ingot or by continuous casting. Flat rolled steel products are made from slabs. annualreview2017.arcelormittal.com ArcelorMittal
96 Sponge Iron The product of the direct reduction process. Also known as direct reduced iron (DRI). Stainless Steels Stainless steels offer a superior corrosion resistance due to the addition of chromium and/or nickel to the molten steel. Standard Pipe Used for low-pressure conveyance of air, steam, gas, water, oil or other fluids and for mechanical applications. Used primarily in machinery, buildings, sprinkler systems, irrigation systems, and water wells rather than in pipelines or distribution systems. Strip A flat rolled product customarily narrower in width than sheet, and often produced to more closely controlled thicknesses. Structural Pipe And Tubing Welded or seamless pipe and tubing generally used for structural or load-bearing purposes above ground by the construction industry, as well as for structural members in ships, trucks, and farm equipment. Structural Shapes Rolled flange sections, sections welded from plates, and special sections with at least one dimension of their cross-section three inches or greater. Included are angles, beams, channels, tees and zeds. T Tin Coated Steel Cold rolled sheet, strip, or plate coated with tin or chromium. Tonne (T) A metric tonne, equivalent to 1,000 kilograms or 2,204.6 pounds or short ton. Ton (t) a) A unit of weight in the US Customary System equal to 2,240 pounds. Also known as long ton. b) A unit of weight in the US Customary System equal to 2,000 pounds. Also known as short ton. Also known as net ton. U annualreview2017.arcelormittal.com ArcelorMittal
97 US$ or $ US Dollar. W Wet Recoverable The quantity of iron ore or coal recovered after the material from the mine has gone through a preparation and/or concentration process excluding drying. Wire: Drawn And/Or Rolled The broad range of products produced by cold reducing hot rolled steel through a die, series of dies, or through rolls to improve surface finish, dimensional accuracy, and physical properties. Wire Rods Coiled bars of up to 18.5 millimetres in diameter, used mainly in the production of wire. annualreview2017.arcelormittal.com ArcelorMittal
98 Disclaimer Forward-Looking Statements This document may contain forward-looking information and statements about ArcelorMittal and its subsidiaries. These statements include financial projections and estimates and their underlying assumptions, statements regarding plans, objectives and expectations with respect to future operations, products and services, and statements regarding future performance. Forward-looking statements may be identified by the words believe, expect, anticipate, target or similar expressions. Although ArcelorMittal s management believes that the expectations reflected in such forward-looking statements are reasonable, investors and holders of ArcelorMittal s securities are cautioned that forward-looking information and statements are subject to numerous risks and uncertainties, many of which are difficult to predict and generally beyond the control of ArcelorMittal, that could cause actual results and developments to differ materially and adversely from those expressed in, or implied or projected by, the forward-looking information and statements. These risks and uncertainties include those discussed or identified in the documents filed with or furnished to the Luxembourg Stock Market Authority for the Financial Markets (Commission de Surveillance du Secteur Financier) and the U.S. Securities and Exchange Commission (the SEC ). ArcelorMittal undertakes no obligation to publicly update its forward-looking statements, whether as a result of new information, future events, or otherwise. Non-GAAP Measures This document may include supplemental financial measures that are or may be non-gaap financial measures, as defined in the rules of the SEC. They may exclude or include amounts that are included or excluded, as applicable, in the calculation of the most directly comparable financial measures calculated in accordance with IFRS. Accordingly, they should be considered in conjunction with ArcelorMittal's consolidated financial statements prepared in accordance with IFRS, which are available in the documents filed or furnished by ArcelorMittal with the SEC, including its annual report on Form 20-F and its interim financial report furnished on Form 6-K. A reconciliation of non-gaap measures to IFRS is available on the ArcelorMittal website. Published in April 2018 To download the fact book for 2017, visit our download centre. To download a copy of the previous fact book, visit our financial report centre. For more information on the company visit the ArcelorMittal website or download the IR app. Any comments please contact Hetal.patel@arcelormittal.com Photo credits: Mark Mercer Additional photography: Wili.lu; ArcelorMittal photo library annualreview2017.arcelormittal.com ArcelorMittal

 published in the Fact book")
99 Deloitte. Deloitte Audit Société à responsabilité limitée 560, rue de Neudorf L-2220 Luxembourg B.P L-1011 Luxembourg Tel: www. delo itte. I u Independent assurance report on selected environmental peñormance indicators published in the Fact book 2017 of ArcelorMittal, Société Anonyme, for the year ended December 31, 2017 To the Management of ArcelorMittal, Société Anonyme 24-26, boulevard d'avranches L-1160 Luxembourg Grand-Duchy of Luxembourg Objectives and scope of work performed This report has been prepared in accordance with the terms of our engagement letter dated February 27, 2018 to provide limited assurance on selected environmental performance indicators (the "Indicators") published in the Fact book 2017 of ArcelorMittal, Société Anonyme, (the "Company", "ArcelorMittal" or "Group") for the year ended December 31, 2017 (the "Report"). The selected environmental performance indicators under our assurance scope and marked with a "*" on the Sustainability Performance pages of the Report, are the following: - Primary energy consumption - Total C02e emissions (steel and mining) - C02e emissions per tonne of steel The Indicators have been defined following ArcelorMittal's Basis of Reporting ( and they have been selected by the Management of the Company. Société à responsabilité limitée au capital de RCS Luxembourg B Autorisation d'établissement:


100 Deloitte. Responsibility of the Management of the Company The Management of the Company is responsible for the preparation of the Report in accordance with ArcelorMittal's Basis of Reporting and for the information and statements contained within it. The Management is responsible for determining the Company's sustainability objectives and for establishing and maintaining appropriate performance management and internal control systems from which the reported information is derived. Our Independence and Quality Control We have complied with the independence and other ethical requirements of the Code of Ethics for Professional Accountants issued by the International Ethics Standards Board for Accountants, as adopted for the audit profession in Luxembourg by the Commission de Surveillance du Secteur Financier ("the Code"). The Code is founded on fundamental principles of integrity, objectivity, professional competence and due care, confidentiality and professional behaviour. Deloitte Audit applies International Standard on Quality Control 1 and accordingly maintains a comprehensive system of quality control including documented policies and procedures regarding compliance with ethical requirements, professional standards and applicable legal and regulatory requirements. Responsibility of the Réviseur d'entreprises Agréé Our responsibility is to conduct a limited assurance engagement solely on the Indicators selected by the Company and draw conclusions on the work we performed. We carried out our procedures on the Indicators in accordance with the International Standard on Assurance Engagements 3000 (Revised) "Assurance Engagements Other Than Audits or Reviews of Historical Financial Information" ("ISAE 3000 Revised"). To achieve limited assurance the ISAE 3000 Revised requires that we review the processes, systems and competencies used to compile the Indicators on which we provide limited assurance. This is designed to give a similar level of assurance to that obtained in the review of interim financial information. lt does not include detailed testing of source data or the operating effectiveness of processes and internal controls.


101 Deloitte. ln order to draw our conclusion on the Report, we undertook the following procedures: Interviewed a selection of ArcelorMittal senior management who have operational responsibility for corporate responsibility matters, including the group Corporate Responsibility team, data owners and those with operational responsibility for sustainability performance related to the selected Indicators Visited eleven sites across the world to review the systems to capture, collate and process source data for the Indicators listed above. The sites visited to examine relevant 2017 data and processes were: - Temirtau (ArcelorMittal Temirtau), Kazakhstan - Atasu (ArcelorMittal Temirtau), Kazakhstan - Abaiskaya (ArcelorMittal Temirtau), Kazakhstan - Lenina (ArcelorMittal Temirtau), Kazakhstan - Shakhtinskaya (ArcelorMittal Temirtau), Kazakhstan - Cleveland (ArcelorMittal Cleveland), USA - Indiana East (ArcelorMittal Indiana Harbour), USA - Indiana West (ArcelorMittal Indiana Harbour), USA - Avilés-Gijón (ArcelorMittal Asturias), Spain - Dabrowa Górnicza (ArcelorMittal Poland), Poland - Zenica (ArcelorMittal Zenica), Bosnia and Herzegovina Obtained an understanding through inquiries, analytical reviews, observation and other applicable evidence gathering procedures on a sample basis on the key structures, systems, processes, procedures and internal controls relating to - the selected key performance indicators - collation, aggregation, validation and reporting of performance data for the selected Indicators.


102 Deloitte. Limitations The scope of our work has been limited to the aforementioned selected Indicators. Our conclusion below covers therefore only these Indicators and not all indicators presented or any other information included in the Report. The process an organisation adopts to define, gather and report data on its non-financial performance is not subject to the formal processes adopted for financial reporting. Therefore, data of this nature is subject to variations in definitions, collection and reporting methodology with no consistent, accepted standard. This may result in non-comparable information between organisations and from year to year within an organisation as methodologies develop. The accuracy and completeness of the information disclosed in the Report are subject to inherent limitations given their nature and the methods for determining, calculating or estimating such information. Our independent assurance report should therefore be read in connection with the Company's definitions of indicators as included in the Basis of Reporting document, which is available on A limited assurance engagement is substantially less in scope than a reasonable assurance engagement and consequently does not enable us to obtain assurance that we would become aware of all significant matters that might be identified in a reasonable assurance engagement. Accordingly, we do not express an audit opinion. Conclusion Based on the procedures performed and evidence obtained, we are not aware of any material amendments that need to be made to the assessment of the selected environmental performance Indicators, marked with a "*" on the Sustainability Performance pages of the Report, for them to be in accordance with ArcelorMittal's Basis of Reporting. For Deloitte Audit, Société à responsabilité limitée Cabinet de révision agréé Jean-Pierre Agazzi, Réviseur d'entreprises Agréé Partner April 30, 2018

103
ArcelorMittal reports third quarter 2017 results
 ArcelorMittal reports third quarter 2017 results Luxembourg, November 10, 2017 - ArcelorMittal (referred to as ArcelorMittal or the Company ) (MT (New York, Amsterdam, Paris, Luxembourg), MTS (Madrid)),
ArcelorMittal reports fourth quarter 2017 and full year 2017 results
 ArcelorMittal reports fourth quarter 2017 and full year 2017 results Luxembourg, January 31, 2018 - ArcelorMittal (referred to as ArcelorMittal or the Company ) (MT (New York, Amsterdam, Paris, Luxembourg),
press release ArcelorMittal reports second quarter 2017 and half year 2017 results
 press release ArcelorMittal reports second quarter 2017 and half year 2017 results Luxembourg, July 27, 2017 - ArcelorMittal (referred to as ArcelorMittal or the Company ) (MT (New York, Amsterdam, Paris,
ArcelorMittal reports results for the first quarter 2018
 ArcelorMittal reports results for the first quarter 2018 Luxembourg, May 11, 2018 - ArcelorMittal (referred to as ArcelorMittal or the Company ) (MT (New York, Amsterdam, Paris, Luxembourg), MTS (Madrid)),
(USDm) unless otherwise shown 1Q 17 4Q 16 3Q 16 2Q 16 1Q 16
 unless otherwise shown 1Q 17 4Q 16 3Q 16 2Q 16 1Q 16") press release ArcelorMittal reports results for the first quarter 2017 Luxembourg, May 12, 2017 - ArcelorMittal (referred to as ArcelorMittal or the Company ) (MT (New York, Amsterdam, Paris, Luxembourg),
press release ArcelorMittal reports results for the first quarter 2017 Luxembourg, May 12, 2017 - ArcelorMittal (referred to as ArcelorMittal or the Company ) (MT (New York, Amsterdam, Paris, Luxembourg),
The Company has continued to make progress on its strategic objectives during 2016, including:
 press release ArcelorMittal reports fourth quarter 2016 and full year 2016 results Luxembourg, February 10, 2017 - ArcelorMittal (referred to as ArcelorMittal or the Company ) (MT (New York, Amsterdam,
news release ArcelorMittal reports second quarter 2013 and half year 2013 results
 news release ArcelorMittal reports second quarter 2013 and half year 2013 results Luxembourg, August 1, 2013 - ArcelorMittal (referred to as ArcelorMittal or the Company ) (MT (New York, Amsterdam, Paris,
ArcelorMittal reports fourth quarter 2018 and full year 2018 results
 ArcelorMittal reports fourth quarter 2018 and full year 2018 results Luxembourg, February 7, 2019 - ArcelorMittal (referred to as ArcelorMittal or the Company ) (MT (New York, Amsterdam, Paris, Luxembourg),
ArcelorMittal Fact Book
 ArcelorMittal Fact Book 2006 ArcelorMittal Fact Book 2006 01 02 At a glance 04 Company Profile 08 Highlights 10 Market and Industry 12 Key Figures 13 Steel Consumption and Markets 15 Steel Production by
ArcelorMittal results for the first quarter 2015
 ArcelorMittal results for the first quarter 2015 Luxembourg, May 7, 2015 - ArcelorMittal (referred to as ArcelorMittal or the Company ) (MT (New York, Amsterdam, Paris, Luxembourg), MTS (Madrid)), the
ThyssenKrupp Steel, London, August ThyssenKrupp Steel
 , London, August 2008 0 , London, August 2008 28 Disclaimer The information set forth and included in this presentation is not provided in connection with an offer or solicitation for the purchase or sale
Unveiling a mining giant and expansion in Canada. Steve Wood, Vice-President Iron Ore Americas RBC Iron Ore Investor Day April 10, 2012
 Unveiling a mining giant and expansion in Canada Steve Wood, Vice-President Iron Ore Americas RBC Iron Ore Investor Day April 10, 2012 0 Disclaimer Forward-Looking Statements This document may contain
Safety performance. Safety performance significantly better than industry average. AM/NS Calvert vs. industry average (TRIR*)
") ArcelorMittal North America and AM/NS Calvert Robrecht Himpe, Chief Executive Officer March 6-7, 2017 Disclaimer Forward-Looking Statements This document may contain forward-looking information and statements
ArcelorMittal North America and AM/NS Calvert Robrecht Himpe, Chief Executive Officer March 6-7, 2017 Disclaimer Forward-Looking Statements This document may contain forward-looking information and statements
4Q10 and 2010 Full Year Results
 4Q1 and 21 Full Year Results Mr. Lakshmi Mittal, Chairman and CEO Mr. Aditya Mittal, CFO 8 February 211 Disclaimer Forward-Looking Statements This document may contain forward-looking information and statements
Investor Presentation January 2016
 Investor Presentation Forward-Looking Statements This presentation contains certain forward-looking statements and information relating to S.A. and its subsidiaries (collectively, ) that are based on the
1H 2017 Financial Results. Lakshmi N. Mittal - Chairman & Chief Executive Officer Aditya Mittal - Group CFO & CEO ArcelorMittal Europe
 1H 2017 Financial Results Lakshmi N. Mittal - Chairman & Chief Executive Officer Aditya Mittal - Group CFO & CEO ArcelorMittal Europe 27 July 2017 0 Disclaimer Forward-Looking Statements This document
3Q 2017 Financial Results
 3Q 2017 Financial Results 10 November 2017 0 Disclaimer Forward-Looking Statements This document may contain forward-looking information and statements about ArcelorMittal and its subsidiaries. These statements
news release ARCELORMITTAL REPORTS FIRST QUARTER 2010 RESULTS
 news release ARCELORMITTAL REPORTS FIRST QUARTER 2010 RESULTS Luxembourg, April 29, 2010 - ArcelorMittal (referred to as ArcelorMittal, or the Company ) (MT (New York, Amsterdam, Brussels, Luxembourg,
Delivering growth in the new steel horizon
 Delivering growth in the new steel horizon Michel Wurth Member of Group Management Board 24 September 2008 Disclaimer Forward-Looking Statements This document may contain forward-looking information and
press release ArcelorMittal results for the first quarter 2014
 press release ArcelorMittal results for the first quarter 2014 Luxembourg, - ArcelorMittal (referred to as ArcelorMittal or the Company ) (MT (New York, Amsterdam, Paris, Luxembourg), MTS (Madrid)), the
Investor Day 2014: Strategic progress Mining exploiting our potential
 Investor Day 2014: Strategic progress Mining exploiting our potential Bill Scotting, EVP and CEO Mining 10 March 2014 Mary River iron ore project, Baffinland Disclaimer Forward-Looking Statements This
Strategic progress Mining exploiting our potential
 Macquarie Global Iron Ore Conference Strategic progress Mining exploiting our potential Bill Scotting, CEO Mining 27 June 2014 Disclaimer Forward-Looking Statements This presentation may contain forward-looking
Longbow Basic Materials Conference. March 2011
 Longbow Basic Materials Conference March 211 Disclaimer Forward-Looking Statements This document may contain forward-looking information and statements about ArcelorMittal and its subsidiaries. These statements
news release ARCELORMITTAL REPORTS FULL YEAR AND FOURTH QUARTER 2010 RESULTS
 news release ARCELORMITTAL REPORTS FULL YEAR AND FOURTH QUARTER 2010 RESULTS Luxembourg, February 8, 2011 - ArcelorMittal (referred to as ArcelorMittal or the Company ) (MT (New York, Amsterdam, Paris,
Third quarter r esults results th November 2008
 Third quarter results 2008 5th November 2008 Disclaimer Forward-Looking Statements This document may contain forward-looking information and statements about ArcelorMittal and its subsidiaries. These statements
Second Quarter 2018 Questions and Answers
 Second Quarter 2018 Questions and Answers Page 1 Forward-Looking Statements This document may contain forward-looking information and statements about ArcelorMittal and its subsidiaries. These statements
Cautious optimism. Lakshmi N Mittal Chairman and CEO of ArcelorMittal
 Cautious optimism In recent years we have adapted our footprint to new demand realities, intensified our efforts to control costs and invested in our key franchise businesses. I am happy to report that
Winning in the post crisis world
 Winning in the post crisis world Sudhir Maheshwari Credit Suisse Metals and Mining conference - 22 September 2010 - London Photo: Getty Images Disclaimer Forward-Looking Statements This document may contain
ArcelorMittal NEUTRAL ZACKS CONSENSUS ESTIMATES (MT-NYSE)
") December 17, 2014 ArcelorMittal (MT-NYSE) Current Recommendation Prior Recommendation Underperform Date of Last Change 06/25/2014 Current Price (12/16/14) $10.69 Target Price $11.00 NEUTRAL SUMMARY We
December 17, 2014 ArcelorMittal (MT-NYSE) Current Recommendation Prior Recommendation Underperform Date of Last Change 06/25/2014 Current Price (12/16/14) $10.69 Target Price $11.00 NEUTRAL SUMMARY We
Investor Presentation October 2016
 Investor Presentation Forward-Looking Statements This presentation contains certain forward-looking statements and information relating to S.A. and its subsidiaries (collectively, ) that are based on the
Full Year 2017 Financial Results Lakshmi N. Mittal, Chairman and Chief Executive Officer Aditya Mittal, Chief Financial Officer
 Full Year 2017 Financial Results Lakshmi N. Mittal, Chairman and Chief Executive Officer Aditya Mittal, Chief Financial Officer 31 January 2018 Disclaimer Forward-Looking Statements This document may contain
2Q 2013 Results. Lakshmi N Mittal, Chairman and Chief Executive Officer Aditya Mittal, Chief Financial Officer. 1 August 2013
 2Q 213 Results Lakshmi N Mittal, Chairman and Chief Executive Officer Aditya Mittal, Chief Financial Officer 1 August 213 Disclaimer Forward-Looking Statements This document may contain forward-looking
First Quarter Questions and Answers
 First Quarter 2015 Questions and Answers Forward-Looking Statements This document may contain forward-looking information and statements about ArcelorMittal and its subsidiaries. These statements include
Investor Roadshow Post 4Q10 Results. February 2011
 Investor Roadshow Post 4Q1 Results February 211 Disclaimer Forward-Looking Statements This document may contain forward-looking information and statements about ArcelorMittal and its subsidiaries. These
Investor Presentation. March 2018
 Investor Presentation As of March 7, 2018 Forward-Looking Statements This presentation contains certain forward-looking statements and information relating to S.A. and its subsidiaries (collectively, )
Media Presentation. 11th February 2009
 Fourth quarter and annual results 2008 Media Presentation 11th February 2009 Disclaimer Forward-Looking Statements This document may contain forward-looking information and statements about ArcelorMittal
Cliffs Natural Resources Inc. Reports First-Quarter 2011 Results
 Cliffs Natural Resources Inc. Reports First-Quarter 2011 Results - Revenue Increases 63% over Last Year to a First-Quarter Record of $1.2 Billion; Net Income Reaches $423 Million, or $3.11 Per Diluted
Q3 Post Results Roadshow
 Q3 Post Results Roadshow October 2010 Photo: Getty Images Disclaimer Forward-Looking Statements This document may contain forward-looking information and statements about ArcelorMittal and its subsidiaries.
Investor Presentation. Heavy plate rolling mill starts operating in July at the Ouro Branco mill (MG)
") Investor Presentation Heavy plate rolling mill starts operating in July at the Ouro Branco mill (MG) Agenda Outlook Gerdau Highlights 2 Economic Outlook GDP Growth 2014 2015f 2016f World 3.4% 3.1% 3.4%
Investor Presentation Heavy plate rolling mill starts operating in July at the Ouro Branco mill (MG) Agenda Outlook Gerdau Highlights 2 Economic Outlook GDP Growth 2014 2015f 2016f World 3.4% 3.1% 3.4%
Investor Day 2014: Strategic progress Adding value in steel
 Investor Day 2014: Strategic progress Adding value in steel Lakshmi Mittal, Chairman and CEO 10 March 2014 Disclaimer Forward-Looking Statements This presentation may contain forward-looking information
Q208 results presentation. July 2008
 Q208 results presentation July 2008 Disclaimer Forward-Looking Statements This document may contain forward-looking information and statements about ArcelorMittal and its subsidiaries. These statements
Iron Ore & Steel Derivatives Let the Battle Begin
 Iron Ore & Steel Derivatives Let the Battle Begin Topics Raw Material Price Volatility Financial Hedging Attributes Iron Ore World Steel Exchange Scrap Presented by: DATE: Tuesday November 30, 2010 Patrick
Report on Payments to Governments in respect of Extractive Activities
 Report on Payments to Governments in respect of Extractive Activities Year ended December 31, 2016 Table of contents Introduction... 2 Basis of preparation... 2 Overview of payments... 3 Payments per government
Investor Presentation. Heavy plate rolling mill starts operating in July at the Ouro Branco mill (MG)
") Investor Presentation Heavy plate rolling mill starts operating in July at the Ouro Branco mill (MG) Agenda Outlook Gerdau Highlights 2 Economic outlook GDP Growth 2014 2015f 2016f World 3.4% 3.1% 3.2%
Investor Presentation Heavy plate rolling mill starts operating in July at the Ouro Branco mill (MG) Agenda Outlook Gerdau Highlights 2 Economic outlook GDP Growth 2014 2015f 2016f World 3.4% 3.1% 3.2%
MECHEL REPORTS THE 9M 2017 FINANCIAL RESULTS
 MECHEL REPORTS THE 9M 2017 FINANCIAL RESULTS Consolidated revenue 222.8 bln rubles (+13% compared to 9M2016) EBITDA * - 59.1 bln rubles (+42% compared to 9M2016) Net profit, attributable to equity shareholders
Annual Financial Results. for the twelve months ended 31 December 2009
 Annual Financial Results for the twelve months ended 31 December 2009 1 Introduction and overview Nonkululeko Nyembezi-Heita, CEO 2 Overview (2009 vs 2008) Headline loss of R440m Headline loss per share
Investor Presentation August 2018
 Investor Presentation As of August 22, 2018 Forward-Looking Statements This presentation contains certain forward-looking statements and information relating to S.A. and its subsidiaries (collectively,
Investor Presentation. June 2018
 Investor Presentation As of June 1, 2018 Forward-Looking Statements This presentation contains certain forward-looking statements and information relating to S.A. and its subsidiaries (collectively, )
4Q2010 Conference Call Gerdau S.A. Consolidated IFRS
 4Q2010 Conference Call Gerdau S.A. Consolidated IFRS André Gerdau Johannpeter President and CEO Osvaldo B. Schirmer Vice-President and IRO March 3, 2011 1 Global Context 2010 vs. 2009 Growth of 15% in
3rd Basic Materials Seminar, Exane BNP Paribas, London, March 19, ThyssenKrupp
 3rd Basic Materials Seminar, Exane BNP Paribas, London, March 19, 2008 0 3rd Basic Materials Seminar, Exane BNP Paribas, London, March 19, 2008 1 Agenda Peter Urban Vice Chairman and CFO Steel AG Overview
Emerging markets and mining growth
 Emerging markets and mining growth Aditya Mittal CFO and member of Group Management Board Plant Tour Brazil - 24-26 March 21 Disclaimer Forward-Looking Statements This document may contain forward-looking
ArcelorMittal at a glance. June 2009
 ArcelorMittal at a glance June 2009 The world s number one steel company With around 316,000 employees in 2008 in more than 60 countries and an industrial presence in 20 countries, ArcelorMittal is the
Facing the challenges
 Facing the challenges Whilst 2012 was a very difficult year, we have addressed the main challenges facing us. As a result we are in a stronger position, ready to provide excellent steel solutions to our
Erdemir Group 2009 Consolidated Financial Results
 Erdemir Group 2009 Consolidated Financial Results 22 February 2010 1 /28 DISCLAIMER Ereğli Demir Çelik Fabrikaları T.A.Ş. (Erdemir) may, when necessary, make written or verbal announcements about forward-looking
Mining Strategic Progress - Exploiting our potential ArcelorMittal Mines Canada, June 29, 2015 Simon Wandke, Vice President Commercial
 Mining Strategic Progress - Exploiting our potential ArcelorMittal Mines Canada, June 29, 2015 Simon Wandke, Vice President Commercial Disclaimer Forward-Looking Statements This document may contain forward-looking
8th Annual Global Industrials and Materials Summit. Daniel Fairclough, Head of Investor Relations Lisa Fortuna, Manager Investor Relations
 8th Annual Global Industrials and Materials Summit Jet Vapor Deposition (JVD) line in Liège (Belgium) Daniel Fairclough, Head of Investor Relations Lisa Fortuna, Manager Investor Relations 8 June 2017
Ternium Announces Fourth Quarter and Full Year 2012 Results
 Sebastián Martí Ternium - Investor Relations +1 (866) 890 0443 +54 (11) 4018 2389 www.ternium.com Ternium Announces Fourth Quarter and Full Year 2012 Results Luxembourg, February 20, 2013 Ternium S.A.
Investor Presentation. Heavy plate rolling mill starts operating in July at the Ouro Branco mill (MG)
") Investor Presentation Heavy plate rolling mill starts operating in July at the Ouro Branco mill (MG) Agenda Outlook Gerdau Highlights 2 Economic Outlook GDP Growth 2014 2015f 2016f World 3.4% 3.1% 3.4%
Investor Presentation Heavy plate rolling mill starts operating in July at the Ouro Branco mill (MG) Agenda Outlook Gerdau Highlights 2 Economic Outlook GDP Growth 2014 2015f 2016f World 3.4% 3.1% 3.4%
Investor Presentation
 Investor Presentation 2017 www.gerdau.com 1 Outlook Gerdau Highlights 2 Better outlook for steel consumption Region / Country (in mt and %) 2017f 17/16 World 1,535 1.3% European Union 158 0.5% NAFTA 135
Cliffs Natural Resources Inc. Reports Third-Quarter Results. Reports Realized Pricing of $101 Per Ton in U.S. Iron Ore in Q3 2014
 NEWS RELEASE Cliffs Natural Resources Inc. Reports Third-Quarter Results Reports Adjusted EBITDA 1 of $233 million and Adjusted Earnings 2 of $0.21 per diluted share Reports Realized Pricing of $101 Per
Section 232 Tariffs on Steel and Aluminum Products. Presentation to the National Association of Steel Pipe Distributors Timothy C.
 Section 232 Tariffs on Steel and Aluminum Products Presentation to the National Association of Steel Pipe Distributors Timothy C. Brightbill What Is Section 232? Under Section 232 of the Trade Expansion
Investor Presentation
 Investor Presentation 2017 www.gerdau.com 1 Outlook Gerdau Highlights 2 Better outlook for steel consumption Region / Country (in mt and %) 2017f 17/16 World 1,535 1.3% European Union 158 0.5% NAFTA 135
Financial results for the year ended December 2013
 Financial results for the year ended December 2013 Agenda OVERVIEW Results overview and recent developments Results analysis Steel market overview Operating results Finance Other key issues and outlook
1H 2018 Financial Results Lakshmi N. Mittal, Chairman and Chief Executive Officer Aditya Mittal, President and Chief Financial Officer
 (photo; steel construction in the City of London, June 2018) 1H 2018 Financial Results Lakshmi N. Mittal, Chairman and Chief Executive Officer Aditya Mittal, President and Chief Financial Officer August
MECHEL REPORTS THE 9M 2018 FINANCIAL RESULTS
 MECHEL REPORTS THE 9M 2018 FINANCIAL RESULTS Consolidated revenue 237.0 bln rubles (+6% compared to 9M 2017) EBITDA * 60.6 bln rubles (+3% compared to 9M 2017) Profit attributable to equity shareholders
4Q10 and 2010 Full Year Results
 4Q10 and 2010 Full Year Results Mr. Lakshmi Mittal, Chairman and CEO Mr. Aditya Mittal, CFO 8 February 2011 Disclaimer Forward-Looking Statements This document may contain forward-looking information and
Global Natural Resources Conference 15 November 2017
 Global Natural Resources Conference 15 November 2017 Daniel Fairclough Member of the Group Management Committee - Head of Investor Relations Hetal Patel General Manager Investor Relations Valérie Mella
Investor Presentation. January 2019
 Investor Presentation January 2019 As Ternium of January I 2019 25, 2019 1 Forward-Looking Statements This presentation contains certain forward-looking statements and information relating to Ternium S.A.
Investor Presentation. February 2008
 Investor Presentation February 2008 1 1 Highlights Among the most competitive steel companies in the world Strong low cost structure as a result of diversified production processes and multiple raw material
Introduction 2. Basis of preparation 2. Overview of payments 4. Payments per government and project 5
 Table of content Introduction 2 Basis of preparation 2 Overview of payments 4 Payments per government and project 5 Bosnia and Herzegovina 5 Brazil 6 Canada 7 Kazakhstan 8 Liberia 9 Mexico 10 Romania 11
O.P. Jindal Group and JSW Group Overview
 July 01, 20091 Group Overview 2 O.P. Jindal Group and JSW Group Overview P R Jindal Sajjan Jindal Ratan Jindal Naveen Jindal Jindal Saw Jindal Stainless Jindal Steel & Power Ltd. Power Steel Infrastructure
ArcelorMittal Flat Europe Europe s leading steel franchise
 ArcelorMittal Flat Europe Europe s leading steel franchise - Geert van Poelvoorde, CEO ArcelorMittal Europe Flat Products Jet Vapor Deposition (JVD) line in Liège (Belgium) Investor Visit Ghent, 3-4 July
JSW reports flat sales in Q3 FY
 Press Release 28.01.2009 JSW reports flat sales in Q3 FY 2008-09 JSW reported flat sales in the 3rd quarter when the world steel demand and prices fell significantly mainly due to change in the product
Resilience and potential in emerging markets - Africa & CIS (ACIS) case study
 case study") Resilience and potential in emerging markets - & CIS (ACIS) case study Christophe Cornier - Member of the Group Management Board 16 September 2009 Investor day London & New York Disclaimer Forward-Looking
Resilience and potential in emerging markets - & CIS (ACIS) case study Christophe Cornier - Member of the Group Management Board 16 September 2009 Investor day London & New York Disclaimer Forward-Looking
THE PREMIUM REVIEW conference Paris
 30 November 2016 THE PREMIUM REVIEW conference Paris Michel Wurth, Member of the Board Disclaimer Forward-Looking Statements This document may contain forward-looking information and statements about ArcelorMittal
FY 2017 RESULTS PRESENTATION
 FY 2017 RESULTS PRESENTATION April 5, 2018 Disclaimer This presentation does not constitute or form part of and should not be construed as, an offer to sell or issue or the solicitation of an offer to
MAGNITOGORSK IRON & STEEL WORKS. Magnitogorsk Steel (MMK) Q2 and H IFRS Financial Results Presentation
 Q2 and H IFRS Financial Results Presentation") MAGNITOGORSK IRON & STEEL WORKS Magnitogorsk Steel (MMK) and H1 212 IFRS Financial Results Presentation MMK Group Highlights Financials Revenue USD 2,516 mln 4% growth q-o-q Operating profit USD 95 mln
MAGNITOGORSK IRON & STEEL WORKS Magnitogorsk Steel (MMK) and H1 212 IFRS Financial Results Presentation MMK Group Highlights Financials Revenue USD 2,516 mln 4% growth q-o-q Operating profit USD 95 mln
12th Basic Materials Seminar
 12th Basic Materials Seminar Jet Vapor Deposition (JVD) line in Liège (Belgium) Daniel Fairclough, Member of the Group Mgt Committee & Head of IR Hetal Patel, General Manager Investor Relations Valérie
Ternium Announces Third Quarter and First Nine Months of 2013 Results
 Sebastián Martí Ternium - Investor Relations +1 (866) 890 0443 +54 (11) 4018 2389 www.ternium.com Ternium Announces Third Quarter and First Nine Months of 2013 Results Luxembourg, November 5, 2013 Ternium
IFRS Financial Statements for Q4 and FY 2014
 214 ACHIEVEMENTS 1 Record > 1.6 bln USD EBITDA MMK MC Dynamics, mln USD 2 577 2 5 2 Net debt down 1 bln USD -2% 2 63 2 3 FCF yield 37% 1 5 4 Lost opportunity of FMG stake sale in early 214 1 5 Social life:
Fourth Quarter 2018 Financial Results
 Fourth Quarter 2018 Financial Results January 28, 2019 C r e a t i n g I n n o v a t i v e S t e e l S o l u t i o n s AK Steel Executive Management Team Roger Newport Kirk Reich Jaime Vasquez Chief Executive
Transforming tomorrow
 Transforming tomorrow Bank of America Merrill Lynch Global Metals and Mining Conference May 2010 Disclaimer Forward-Looking Statements This document may contain forward-looking information and statements
18th European CEO Conference 15 June Lakshmi N. Mittal Chairman and Chief Executive Officer
 18th European CEO Conference 15 June 2016 Lakshmi N. Mittal Chairman and Chief Executive Officer Disclaimer Forward-Looking Statements This document may contain forward-looking information and statements
2QFY14 Results Presentation
 2QFY14 Results Presentation 1 Key highlights 3QFY14 Standalone performance Consolidated performance Key update Highest ever Crude Steel production: 3.19 million tonnes Gross Turnover: `12,651 crores Net
Annual F inancial Financial Results 2008
 Annual Financial Results 2008 16 February 2009 Disclaimer Our presentation contains some forward looking statements with respect to the financial Our presentation contains some forward looking statements
2016 Global Steel and Mining Conference
 2016 Global Steel and Mining Conference London, 12th September 2016 Daniel Fairclough Member of the Group Management Committee Corporate Finance & Investor Relations Disclaimer Forward-Looking Statements
: Sumitomo Metal Industries, Ltd. Consolidated Financial Situation and Business Results for the Third Quarter of FY 2009 (ending March 31, 2010)
") Sumitomo Metal Industries, Ltd. Consolidated Financial Situation and Business Results for the Third Quarter of FY 2009 (ending March 31, 2010) The following information was originally prepared and published
Sumitomo Metal Industries, Ltd. Consolidated Financial Situation and Business Results for the Third Quarter of FY 2009 (ending March 31, 2010) The following information was originally prepared and published
Investor Presentation. March 2019
 Investor Presentation March 2019 As Ternium of March I 11, 2019 2019 1 Forward-Looking Statements This presentation contains certain forward-looking statements and information relating to Ternium S.A.
2016 ANNUAL RESULTS 14 FEBRUARY 2017
 2016 ANNUAL RESULTS 14 FEBRUARY 2017 DISCLAIMER Certain statements made in this presentation constitute forward-looking statements. Forward-looking statements are typically identified by the use of forward-looking
Annual Financial Results
 Mittal Steel South Africa Limited Annual Financial Results for the 12 months ended December 2006 market & operations Rick Reato Introduction and Overview Earnings remain strong at R4.6bn - Earnings per
Investor Presentation. November 2017
 Investor Presentation As of November 21, 2017 Forward-Looking Statements This presentation contains certain forward-looking statements and information relating to S.A. and its subsidiaries (collectively,
TERNIUM INVESTOR DAY Solomon R. Guggenheim Museum June 18, 2015
 TERNIUM INVESTOR DAY 2015 Solomon R. Guggenheim Museum June 18, 2015 TERNIUM l Investor Day June 18, 2015 Forward-Looking Statements This presentation contains certain forward-looking statements and information
Agenda. Overview. Key Highlights. Performance Review. Projects Update and Guidance. Steel Scenario
 May 2011 Agenda Overview Key Highlights Performance Review Projects Update and Guidance Steel Scenario 2 JSW Group Overview A USD 7 billion group with diversified interests in Steel, Energy, Minerals and
Ternium Announces Third Quarter and First Nine Months of 2018 Results
 Sebastián Martí Ternium - Investor Relations +1 (866) 890 0443 +54 (11) 4018 8389 www.ternium.com Ternium Announces Third Quarter and First Nine Months of 2018 Results Luxembourg, October 30, 2018 Ternium
Novolipetsk Steel (NLMK) Duferco Joint Venture
 Duferco Joint Venture") NLMK Novolipetsk Steel (NLMK) Duferco Joint Venture November 2006-1- Disclaimer This document is confidential and has been prepared by NLMK (the Company ) solely for use at the investor presentation of
NLMK Novolipetsk Steel (NLMK) Duferco Joint Venture November 2006-1- Disclaimer This document is confidential and has been prepared by NLMK (the Company ) solely for use at the investor presentation of
1Q 2013 Results. Lakshmi N Mittal, Chairman and Chief Executive Officer Aditya Mittal, Chief Financial Officer. 10 May 2013
 1Q 213 Results Lakshmi N Mittal, Chairman and Chief Executive Officer Aditya Mittal, Chief Financial Officer 1 May 213 Disclaimer Forward-Looking Statements This document may contain forward-looking information
Fourth quarter and annual results th February 2008
 Fourth quarter and annual results 2007 13th February 2008 Disclaimer Forward-Looking Statements This document may contain forward-looking information and statements about ArcelorMittal and its subsidiaries.
Financial results. For the six months ended 30 June 2017
 Financial results For the six months ended 3 June 217 Disclaimer Forward-looking statements This presentation includes forward-looking information and statements about ArcelorMittal South Africa ( AMSA
Investor Presentation
 Investor Presentation 2017 www.gerdau.com 1 Outlook Gerdau Highlights 2 Region / Country (in Mt and %) 2017f 17/16 World 1,622 7.0% European Union 162 2.5% Better outlook for steel consumption NAFTA 139
3 rd Steel & Metals Fieldtrip 1-3 October 2012
 3 rd Steel & Metals Fieldtrip 1-3 October 2012 Hetal Patel, General Manager Investor Relations Valérie Mella, Investor Relations Munich, 1 st October 2012 Disclaimer Forward-Looking Statements This document