Swartland Municipality
|
|
|
- Randolf York
- 5 years ago
- Views:
Transcription


1 Swartland Municipality Integrated Development Plan for COUNCIL S SUSTAINABLE LONG TERM STRATEGY FOURTH REVISION 26 May 2016
2 NTEGRATED DEVELOPMENT PLAN FOR Compiled in terms of the Local Government: Municipal Systems Act, 2000 (Act 32 of 2000) Adopted by the Municipal Council on 26 May 2016 The Integrated Development Plan is the Municipality s principal five year strategic plan that deals with the most critical development needs of the municipal area (external focus) as well as the most critical governance needs of the organisation (internal focus). The Integrated Development Plan is adopted by the council within one year after a municipal election and remains in force for the council s elected term (a period of five years); is drafted and reviewed annually in consultation with the local community as well as interested organs of state and other role players; guides and informs all planning and development, and all decisions with regard to planning, management and development; forms the framework and basis for the municipality s medium term expenditure framework, annual budgets and performance management system; and seeks to promote integration by balancing the economic, ecological and social pillars of sustainability without compromising the institutional capacity required in the implementation, and by coordinating actions across sectors and spheres of government. AREA PLANS FOR 2016/2017 The five area plans, i.e. Swartland North (Moorreesburg and Koringberg), Swartland East (Riebeek Wes and Riebeek Kasteel), Swartland West (Darling and Yzerfontein), Swartland South (Abbotsdale, Chatsworth, Riverlands and Kalbaskraal) and Swartland Central (Malmesbury) form attachments to this IDP and should be regarded as part and parcel of this plan. It is therefore important to note that the Area Plans contain information used in defining the Municipality s long term strategy, but which is not duplicated in the IDP. The Area Plans form the basis for dialogue between the Municipality and Ward Committees regarding the identification of priorities and budget requests.
3 CONTENTS Section Page Changes made to the document FOREWORD BY THE EXECUTIVE MAYOR FOREWORD BY THE MUNICIPAL MANAGER CHAPTER 1: INTRODUCTION AND BACKGROUND Swartland municipal area at a glance 1 Replaced on 26 May Context Integrated Development Planning Legal status of the IDP The third generation IDP Annual review of the IDP Relationship between the IDP, budget, performance management and 8 risk management --- Section 1.8 (Performance management for councillors) deleted on 28 May The IDP and area plans 8 CHAPTER 2: THE PLANNING PROCESS Roles and responsibilities Five year cycle of the IDP First year process followed Annual process followed in 2015/ Replaced on 26 May 2016 CHAPTER 3: THE ORGANISATION Section 53 role clarification The council and council committees 15 Updated on 28 May The administration 18 CHAPTER 4: INTERGOVERNMENTAL POLICY ALIGNMENT Sustainable Development Goals 19 Replaced on 26 May National policy directives Section (a) (The 12 Outcomes adopted by the Cabinet Lekgotla in January 2010) deleted on 28 May Section (c) (National Spatial Development Perspective (NSDP) ) deleted on 28 May 2015 (a) National Development Plan (NDP) - November Added on 30 May 2013 (b) Medium-Term Strategic Framework (MTSF): Added on 28 May 2015 (c) Back to Basics Approach - September Added on 28 May Provincial policy directives 29 (a) Western Cape s Provincial Strategic Plan: Revised on 28 May 2015 (b) Western Cape Provincial Spatial Development Framework - March Added on 30 May 2014
4 Section Page Changes made to the document 4.4 District Municipality IDP 36 Replaced on 26 May Alignment between national, provincial and local government strategic plans 37 Revised on 28 May 2015 CHAPTER 5: SECTORAL PLANS IN TERMS OF SECTION 26 OF THE MUNICIPAL SYSTEMS ACT Spatial Development Framework - Synopsis 39 Revised on 28 May Long Term Financial Plan 59 Replaced on 26 May Disaster Management Plan 64 CHAPTER 6: STATUS QUO Current reality 70 (a) Services backlogs 70 Updated on 26 May 2016 (b) Indigent households access to free basic services 73 Updated on 26 May 2016 (c) Prioritisation of services by ward committees 73 Revised on 30 May 2014 (d) Major restraining factors Opportunities 75 (a) Growth potential of towns Study (November 2013) 75 Added on 30 May 2014 (b) Regional Socio-Economic Project (RSEP) 78 Added on 30 May 2014 (c) The widening of the N7 78 Revised on 30 May 2014 (d) New road link between the R45 (Malmesbury/Paarl) and the R45 79 (Malmesbury/Hopefield) --- Section (e) (Extension of PPC) deleted on 26 May 2016 (e) Swartland regional shopping mall 79 Revised on 28 May 2015 (f) West Coast FET College Campus in Malmesbury 80 Updated on 26 May 2016 (g) Expansion of the SASKO plant in Malmesbury 80 Added on 30 May 2014 (h) Expansion of Darling Creamery 80 Added on 30 May 2014 (i) New McDonalds in Malmesbury 80 Added on 30 May Section (j) (Possible new airport) deleted on 26 May 2016 (j) Proximity to the Cape Metropole 81 (k) Industrial development zone - Saldanha Bay 81 (l) Indoor community sport centre Wesbank 82 (m) Development of new sport fields in Riebeek West 82 (n) Urban renewal project in Malmesbury 82 (o) National Department of Environmental Affairs - EPWP project 83 (p) Conservation and tourism initiative - Dassen Island 83 (q) Klipfontein development 84 Added on 28 May 2015 (r) Expansion of a piggery on the farm Kleine Rondeboschje 84 Added on 26 May 2016 (s) Upgrading and expansion of the De Bron Shopping Centre 84 Added on 26 May 2016 (t) New Datacentre at Yzerfontein 84 Added on 26 May 2016 (u) New private hospital in Malmesbury 84 Added on 26 May 2016
5 Section Page Changes made to the document (v) Widening of the Diep River bridge 84 Added on 26 May 2016 (w) Truck stop Moorreesburg 84 Added on 26 May Intergovernmental initiatives 85 (a) Regional Socio-Economic Programme (RSEP) 85 Added on 28 May 2015 (b) Comprehensive Rural Development Programme (CRDP) 88 Added on 28 May Challenges 89 (a) Economic decline and poverty 89 (b) Local economic development (LED) 91 Replaced on 26 May 2016 (c) Climate change 101 (d) Migration patterns 102 CHAPTER 7: THE STRATEGY 103 Revised on 28 May Vision, mission and slogan Leadership philosophy and values Terminology used Background to the Strategy The Municipality s five year strategy 108 Revised on 26 May Section 7.6 (Financial implications of the strategy) deleted on 26 May Special strategic measures for the 2016/2017 financial year 126 Added on 26 May Implementation of the strategy General indicators in terms of the Municipal Planning and Performance Management Regulations, Added on 30 May 2014 CHAPTER 8: EXPENDITURE FRAMEWORKS: ALL SPHERES OF GOVERNMENT 129 Updated on 26 May Provincial spending in the Swartland municipal area Swartland allocations in terms of the Division of Revenue Bill (DORA) of February Swartland allocations in terms of Provincial Gazette Extraordinary 7576 of March Swartland Municipality s five year capital budget per department Swartland Municipality s five year capital budget per IDP strategic 139 outcome 8.6 Ten largest capital projects / Swartland Municipality s five year operating budget per IDP strategic 140 outcome 8.8 Swartland Municipality s human settlements pipeline 142
6 Section Page Changes made to the document ANNEXURE 1: SWARTLAND PROFILE 143 Updated on 26 May Demographics Social development and well-being Access to housing Access to municipal services Economic performance Section 1.6 (National Development Plan 2030 targets vs Swartland current status) deleted on 26 May 2016 ANNEXURE 2: EXTERNAL ANALYSIS Client satisfaction survey 158 Added on 28 May Area plans Public perception survey 161 Added on 30 May 2014 ANNEXURE 3: STATUS OF SECTOR PLANS AND POLICIES 164 Updated on 26 May 2016
7 FOREWORD BY THE EXECUTIVE MAYOR Many of our citizens exist in a self-perpetuating poverty trap. Very young and poor single mothers struggle to provide nutrition and basic healthcare for their children, often unaware of the basic services available to them. The inadequate availability of skills makes it hard to attract jobs to economically depressed areas, which, in turn, deprives people of employment and leaves them dependant on the state. Low incomes, poor living conditions and inadequate education levels increases the vulnerability of the poor to diseases such as HIV / Aids and tuberculosis. After 16 years of democracy inequalities are growing, our life-supporting ecosystems continue to deteriorate at an alarming rate, unemployment remains high and poverty remains widespread and persists alongside affluence. Local government is judged by its ability to deliver services, promote socio-economic development and govern effectively. As Mayor I am aware of the numerous responsibilities bestowed on the Council to bring about fundamental changes to our region that will have a positive effect on the livelihoods of all our people. Local Government is both the most intimate sphere of government and the one that impacts most on the everyday lives of citizens. With the approval of this third generation Integrated Development Plan (IDP), Swartland Municipality is embarking on a challenging journey. This journey towards excellent local government basically consists of five steps, each representing a level of achievement, from the lowest level of survival to a level of actualisation. I believe, however, that we cannot progress to a next more fulfilling level before the needs of the existing level have been met. The five levels are: 1. Providing excellent, democratic, transparent, and open government with zero tolerance for corruption at any level. 2. Getting the basics right. Provide for the most fundamental needs of our citizens by getting the basic service delivery right. 3. Putting heart into our communities to make them vibrant and safe. Provide excellent community facilities efficiently and effectively in order to provide places and services through which citizens can take their opportunities. 4. Helping our citizens to be successful by enabling opportunities and driving local economic growth. 5. Creating a better future for all by taking a firmly sustainable approach to our environment. From the Municipality s side we will commit to: A professional service to every town, settlement and rural area; create a platform for local economic development that can result in job creation; create opportunities so that ordinary citizens can take responsibility and break free from the cycle of poverty; good financial planning and control, free of any form of corruption; the spending of municipal funds in a responsible and transparent manner; and be a productive workforce with a high work ethic and a high standard of customer care. I wish to invite all of you councillors, officials, citizens, business, government and non-government organisations - to become part of this journey. Join hands with us - LET S MAKE IT HAPPEN! Tijmen van Essen
8 FOREWORD BY THE MUNICIPAL MANAGER Challenges in local government have fundamentally changed the way we go about doing our business. The demands set to municipalities by national and provincial government and in the vast number of applicable Acts and Regulations are high, but the expectations of our community are even higher. According to the 2009 State of Local Government Report most municipalities in South Africa struggle with a number of service delivery and governance problems that include: Huge service delivery and backlog challenges Poor communication and accountability relationships with communities Corruption and fraud Poor financial management Weak civil society formations Insufficient municipal capacity due to lack of scarce skills Although Swartland Municipality is still functioning on a high standard in most respects, we are also faced with serious challenges. We realised that a good strategy is necessary to counter any downward trend regarding the functioning of the Municipality and to move the organisation to even greater achievements. In consultation with a wide spectrum of public stakeholders the Municipality identified the most critical issues and risks that need to be addressed should the organisation wish to survive the challenges and continue to function effectively, efficiently and economical. This process led to the formulation of seven strategic outcomes (what we wish to achieve): A financially sustainable municipality with well-maintained assets Satisfied, involved and well informed clients An effective, efficient, motivated and appropriately skilled work force Access to affordable and reliable municipal infrastructure Sustainable development of the municipal area (with special emphasis on previously neglected areas) A lean, integrated, stable and corruption free organisation Increased community safety through traffic policing, by-law enforcement and disaster management These strategic outcomes form the core of the Municipality s strategy in Chapter 7 of this document. Here the strategic outcomes are unpacked into outputs, actions, processes, key performance indicators and targets. This is what the Municipality will focus on over the five year term of this Integrated Development Plan. The strategy in Chapter 7 will become a standard item on the agenda of Top Management in order to continuously monitor the success of processes, actions and outputs in the achievement of the seven strategic outcomes. I wish to thank every person who contributed to the compilation of this document and especially the strategy in Chapter 7. We now need every role player, whether a councillor, member of the public or an official, to support the Municipality in its difficult journey over the next five years. Joggie Scholtz

9 CHAPTER 1: INTRODUCTION AND BACKGROUND 1.1 Swartland municipal area at a glance [replaced on 26 May 2016] Total municipal area Demographics, km² Population Households Education Poverty Matric pass rate 2014: 88.3% Literacy rate 2011: 78.0% Households earning less than R400 pm in 2011: 12.2% Per capita income 2013: R Access to basic services, 2014 minimum service level Water 99.1% Refuse removal 76.2% Electricity 97.8% Sanitation 90.4% Economy Labour GDP growth % Employment growth % Three largest sectors Finance, insurance, real estate and business services 35.7% Manufacturing 20.1% Agriculture, forestry and fishing 14.3% Health, 2015 Primary health care facilities 5 Immunisation rate 74.9% Maternal mortality ratio (per live births) 0.0 Teenage pregnancies - delivery rate to women U/18 8.2% Safety and security actual number of crimes in 2014/15 Residential burglaries 721 Driving under the influence 125 Drug-related crime Murders 29 Sexual offences 176 Integrated Development Plan for


10 1.2 Context The Integrated Development Plan (IDP) is applicable to the area of jurisdiction of Swartland Municipality. Swartland Municipality is situated in the West Coast District of the Western Cape. The size of the municipal area is km². NORTHERN CAPE WEST COAST CENTRAL KAROO CITY OF CAPE TOWN CAPE WINELANDS OVERBERG EDEN Location in the Western Cape Location in the West Coast District The majority of the municipal area consists of farm-lands, natural areas and coastal areas. The towns and settlements in the area are Malmesbury, Moorreesburg, Darling, Yzerfontein, Riebeek West, Riebeek Kasteel, Koringberg, Ruststasie, Ongegund, Riverlands, Chatsworth, Kalbaskraal and Abbotsdale. More detail on the major towns is provided in the paragraphs below. 2 Integrated Development Plan for

11 MALMESBURY Malmesbury is situated 70 km north of Cape Town on the N7. Malmesbury began as a settlement in 1743 in the wide Diep River valley around a mineral source as well as fountains in the area. The town was officially proclaimed on 21 May 1827 and was named after the Governor of the Cape, Sir Lowry Cole s father-in-law, the first Earl of Malmesbury in England. The town obtained municipal status is Malmesbury fulfils an important urban niche in the region and the province. Its high development potential can be attributed to factors such as its relative accessibility along the N7 road/rail corridor, closeness to Cape Town, a diversified economic base which not only accommodates agriculture, but also welldeveloped industrial and commercial sectors, as well as a supportive infrastructure. The high property values in the Cape Town Metropole and the attraction of a local tranquil atmosphere are moving people to settle here and commute to Cape Town on a daily basis. Malmesbury is home to a number of large companies as well as regional offices of provincial and national government departments. MOORREESBURG Moorreesburg is situated 36 km north of Malmesbury on the N7. The town came into existence due to the establishment of the Dutch Reformed Church in the latter half of the 19th century. The town was named after one of the former ministers of the congregation in Malmesbury, namely Rev. JC le Fèbre Moorrees. Moorreesburg was proclaimed as town in 1898 and received municipal status in The main function of Moorreesburg is that of an agricultural service centre in the heart of a major wheat producing district. Although the economic base of Moorreesburg depends mainly on agriculture there are a growing number of light industries playing a more progressive role in the town s economy. Moorreesburg is the seat of the West Coast District Municipality. The town benefits from its accessible position along the N7-corridor, the railway connection and its central location relative to the West Coast region. The growth potential of the town is further strengthened by good infrastructure, excellent sport facilities and well-known secondary education institutions. Integrated Development Plan for
12 DARLING Darling is situated 78 km north of Cape Town and 37 km west of Malmesbury. By the beginning of the 18th century about 29 farmers lived in an area called Groenkloof and on one of these farms, Langfontein. It is on this farm that Darling was established in The town was named after Charles Henry Darling who came to the Cape in 1851 as Lieutenant Governor. The first erven (between 300 and 400) were auctioned on 5 October The first Dutch Reformed Church was built in 1857, the school in 1896 and the town hall in The economy of Darling is related to agriculture and is sometimes described as the milk and vegetable barn of Cape Town. A number of light industries provide some job opportunities, but tourism is becoming more and more a stronghold in the local urban economy. The particular place identity ( branding ) of Darling is linked with its annual veld-flower and orchid show, art galleries, Evita s Perron and private nature reserves. YZERFONTEIN Yzerfontein is situated 88 km north of Cape Town on the R27 and 63 km west of Malmesbury. In 1739 an area known as Groenekloof (the area from Koeberg in the south to Saldanha in the north) was subdivided into 46 farms of which Yzerfontein was one. The original Yzerfontein town was established in 1935 when a portion of the farm Yzerfontein was subdivided into approximately 330 erven. Between the 1970 s en 1990 s a further 1523 erven were proclaimed. Yzerfontein fast developed into the sought-after coastal town that it is today. Although many of the permanent residents are retired, there are a substantial number of residents working in Cape Town and other centres who travel daily. The economy is based on the development of local tourism, holiday/weekend house developments, as well as a retirement function. With the exception of a few restaurants, cafes and a number of guest houses, the business sector is weakly developed. Purchasing power goes mostly to Darling, Vredenburg and the Metropole. The town has limited harbour facilities which are mainly used for water recreation. RIEBEEK WEST AND RIEBEEK KASTEEL Riebeek Kasteel is situated 88 km north-east of Cape Town and 24 km east of Malmesbury. Riebeek West is 6 km north of Riebeek Kasteel. Willem Adriaan van der Stel who became governor in 1699 opened up a new area for free burghers (which included the Riebeek Valley). He called this area Land of the Waveren. Some of the first farmers were Huguenots. This led to the early establishment of vineyards along with wheat and other fruit crops. The original settlers were joined by others in the 1730's and 40's and the area under the mountain became a sparsely populated farming community. Over the years Riebeek Kasteel became inhabited by wagon makers and other artisans while retired farmers settled in Riebeek West. The towns have a rural village character and a beautiful environment, and this contributes to their popularity as retirement and tourist destinations (especially as weekend and holiday homes). The PPC cement works is situated close to Riebeek-Wes and generated to some extent a mining and related commercial setting. 4 Integrated Development Plan for

13 The municipal area is divided into 12 wards: Integrated Development Plan for
14 1.3 Integrated Development Planning Integrated development planning is the key tool for local government to cope with its role and function in terms of the SA Constitution and other applicable legislation. In contrast to the role municipal strategic planning has played in the past, integrated development planning is now seen as a function of municipal management, as part of an integrated system of planning and delivery. The IDP process is meant to arrive at decisions on issues such as municipal budget priorities, land management, social and economic development and institutional transformation in a consultative, systematic and strategic manner. The integrated development planning process has to provide a forum for identifying, discussing and resolving the real issues in a municipality (which may be over-arching issues for the whole municipality, as well as issues of specific communities or stakeholder groups) to a level of detail which is required for realistic costing and which helps manage the implementation process without much delay. The Integrated Development Plan (IDP) is the Municipality s principal strategic plan that deals with the most critical development needs of the municipal area (external focus) as well as the most critical governance needs of the organisation (internal focus). The IDP is adopted by the council within one year after a municipal election and remains in force for the council s elected term (a period of five years); is drafted and reviewed annually in consultation with the local community as well as interested organs of state and other role players; guides and informs all planning and development, and all decisions with regard to planning, management and development; forms the framework and basis for the municipality s medium term expenditure framework, annual budgets and performance management system; and seeks to promote integration by balancing the economic, ecological and social pillars of sustainability without compromising the institutional capacity required in the implementation, and by coordinating actions across sectors and spheres of government. 1.4 Legal status of the IDP In terms of Section 35(1) of the Municipal Systems Act No 32 of 2000 an IDP adopted by the council of a municipality- (a) is the principal strategic planning instrument which guides and informs all planning and development, and all decisions with regard to planning, management and development, in the municipality; (b) binds the municipality in the exercise of its executive authority, except to the extent of any inconsistency between a municipality s integrated development plan and national or provincial legislation, in which case such legislation prevails; and (c) binds all other persons to the extent that those parts of the integrated development plan that impose duties or affect the rights of those persons have been passed as a by-law. 1.5 The third generation IDP The first generation IDP s dealt with the period and the second generation IDP s with the period Municipalities entered the third five year IDP cycle with the municipal elections in May The new council that was constituted after the elections immediately started preparing a new five year IDP. This third generation IDP will be effective from 1 July 2012 up to 30 June Integrated Development Plan for
15 Municipalities are encouraged and supported by both national and provincial government to develop realistic and credible IDP s that not only comply with relevant legislation but also - are owned by local leadership, municipal management and community as the single strategic plan to direct resources within the municipality; are driven by the management team and systems within the municipality with implementation regularly monitored during the year through the performance management system; contain a long term development strategy that can guide investment across the municipal area; provide an investment plan for national, provincial and local government and non-governmental stakeholders to enhance and enable joint planning and resource alignment to improve service delivery to all stakeholders; and include local area plans to localise the strategy and implementation of the IDP. 1.6 Annual review of the IDP The IDP has to be reviewed annually. The review process serves as an institutional learning process where stakeholders can meet to discuss the successes and frustrations of the past year. It is not designed to interfere with the long-term strategic orientation of the municipality to accommodate new whims and additional demands. It remains a strategic process of ensuring the institution remains in touch with their intentions and the environment within which it functions. Although the implementation of the IDP is monitored through the performance management system, an annual process is required to check the relevance of the strategic plan within a dynamic environment. The IDP has to be reviewed annually in order to - ensure its relevance as the Municipality s strategic plan; inform other components of the Municipal business process including institutional and financial planning and budgeting; and inform the cyclical inter-governmental planning and budgeting cycle. The purpose of a review is to - reflect and report on progress made with respect to the five year strategy (and key outcomes) in the IDP; make adjustments to the strategy in the 5 year IDP necessary because of changing internal and external circumstances that impact on the appropriateness of the IDP; determine annual targets and activities for the next financial year in line with the five year strategy; and inform the Municipality s financial and institutional planning and most importantly, the drafting of the annual budget. Integrated Development Plan for
16 1.7 Relationship between the IDP, budget, performance management and risk management In terms of the Performance Management Guide for Municipalities, DPLG, 2001 the IDP process and performance management process should appear to be seamlessly integrated. The IDP fulfils the planning stage of performance management. Performance management fulfils the implementation management, monitoring and evaluation of the IDP process. Integrated Development Planning was introduced as the strategic management tool to realise the developmental role of local government. Performance management, on the other hand, is a management tool introduced to facilitate the implementation of the IDP, and as such forms an integral part of the IDP. The budget attaches money to the IDP objectives and this is monitored through the service delivery and budget implementation plan (SDBIP). The budget makes the implementation of the IDP possible and the IDP provides the strategic direction for the budget. Risk Management is one of Management s core responsibilities according to section 62 of the Municipal Finance Management Act (MFMA) and is an integral part of the internal processes of a municipality. It is a systematic process to identify, evaluate and address risks on a continuous basis before such risks can impact negatively on the service delivery capacity of the Swartland Municipality. When properly executed risk management provides reasonable assurance that the institution will be successful in achieving its goals and objectives. In Swartland Municipality risk management is now also fully integrated with the IDP and the risks are linked to the strategic outcomes. [Section 1.8 (Performance management for councillors) deleted on 28 May 2015] 1.8 The IDP and area plans Area plans which are compiled for the different towns and settlements in the Swartland area include: an understanding of social diversity in the community, the assets, vulnerabilities and preferences of these different social groups; an analysis of the services available to these groups, as well as the strengths, weaknesses, opportunities and threats facing the community a consensus on priorities for the relevant ward(s); plans to address these priorities, based on what the ward will do, the support needed from the municipality, and support from other organisations; identification of projects for the IDP; and an action plan for the ward committee to take forward their plan and help communities to reach consensus and to have direction. Area plans help to ensure that the IDP is more targeted and relevant to addressing the priorities of all groups, including the most vulnerable. Area plans provide ward committees with a systematic planning and implementation process to perform their roles and responsibilities. Area plans will also be used by ward committees for monitoring and evaluation which gives the committees an ongoing role through the year. The five area plans, i.e. Swartland North (Moorreesburg and Koringberg), Swartland East (Riebeek Wes and Riebeek Kasteel), Swartland West (Darling and Yzerfontein), Swartland South (Abbotsdale, Chatsworth, Riverlands and Kalbaskraal) and Swartland Central (Malmesbury) form attachments to this IDP and should be regarded as part and parcel of this plan. It is therefore important to note that the Area Plans contain information used in defining the Municipality s long term strategy, but which is not duplicated in the IDP. The Area Plans form the basis for dialogue between the Municipality and Ward Committees regarding the identification of priorities and budget requests. 8 Integrated Development Plan for
17 CHAPTER 2: THE PLANNING PROCESS 2.1 Roles and responsibilities (a) MUNICIPAL COUNCIL The Council is the ultimate decision-making authority. Decisions to approve or amend the municipality's integrated development plan (IDP) may not be delegated and have to be taken by the full Council. (b) EXECUTIVE MAYOR In terms of the Municipal Systems Act and the Municipal Finance Management Act the Executive Mayor must- manage the drafting of the IDP; assign responsibilities in this regard to the municipal manager; submit the draft plan to the municipal council for adoption; and co-ordinate the annual revision of the IDP and determine how the IDP is to be taken into account or revised for the purposes of the budget. (c) SWARTLAND MUNICIPAL ADVISORY FORUM The Swartland Municipal Advisory Forum (SMAF) functions as the IDP Representative Forum and comprises of two members from each ward committee (24 members) as well as any other role players or stakeholders the Executive Mayor wishes to co-opt onto the Forum for one or more meetings or for a specific purpose. The SMAF advises the Executive Mayor on matters relating to the IDP. It does not have any decision making powers. Although ward committees provide for representation of communities on a geographical basis, there are also a number of sector interests not covered by ward committees that play a major role within the municipal area, such as education, business and agriculture. Liaison with and involvement of such sector groups is therefore also crucial in order to get a full picture of the current reality in our area. Liaison with sector groups is done mainly through the SMAF and workshops. (d) WARD COMMITTEES The role of the Ward Committees with respect to the IDP is to - assist the ward councillor (who is the chairperson) in identifying challenges and needs of residents; provide a mechanism for discussion and negotiation between different stakeholders in the ward; interact with other forums and organisations on matters affecting the ward; draw up a ward plan that offers suggestions on how to improve service delivery in the particular ward; disseminate information in the ward; and monitor the implementation process concerning its area. Integrated Development Plan for

18 (e) MUNICIPAL MANAGER The municipal manager, together with the Strategic Manager and Directors, forms the steering committee that is responsible for the design and execution of all arrangements regarding the compilation of the IDP. He also is, subject to the policy directions of the municipal council, responsible and accountable for- the implementation of the IDP and the monitoring of progress with implementation of the plan; and the formation and development of an administration equipped to carry out the task of implementing the IDP. (f) HEADS OF DEPARTMENTS AND OFFICIALS Their role is to - provide relevant technical, sector and financial information for analysis for determining priority issues; contribute technical expertise in the consideration and finalisation of strategies and identification of projects; and provide departmental operational and capital budgetary information. 2.2 Five year cycle of the IDP According to the Municipal Systems Act, every new council that comes into office after the local government elections has to prepare its own IDP which will guide them for the five years that they are in office. The IDP is therefore linked to the five year term of office of councillors. This does however not restrict all proposals in the IDP to five years. The seven outcomes that is part of the Municipality s strategy all have a longer than five year horizon. So too does the spatial strategy. A clear distinction must also be made between the main IDP which is compiled every five years (or if a new council comes into power within the five year period and does not accept the previous council s IDP) and the annual review of the IDP. The annual review is not a replacement of the five year IDP and its purpose is not to interfere with the long-term strategic orientation of the municipality. The annual review reflects and reports on progress made with respect to the five year strategy (and key outcomes) and proposes adjustments to the strategy if necessary because of changing internal and external circumstances that impact on the appropriateness of the IDP. The figure on the right shows the five year process of the IDP. 10 Integrated Development Plan for
19 2.3 First year process followed August 2011 (preparation and process) The Process Plan and time schedule that guided the planning and drafting of this IDP was approved by Council on 25 August. An IDP Indaba was held by the Provincial Government of the Western Cape with municipalities in the West Coast District. The purpose of the Indaba was mainly to provide Provincial guidance and dialogue on provincial policies and programmes and to create a platform for alignment between the three spheres of government. The election of ward committee members commenced. September - December 2011 (analysis and strategy) Analysis and strategizing was done with the involvement of councillors, top and middle management of the Municipality, ward committees and other external stakeholders. The following was done: Activity Date Groups involved Informal discussions regarding the new IDP 6 September Councillors The first ward committee meetings 26 and 29 September Ward committees The Municipality together with the ward committees commenced with 24 to 27 October Ward committees the compilation of area plans covering all 12 wards. Meetings were held with all 12 ward committees to determine their issues and top five priorities. At the meetings the first draft of the Area Plans was also handed out to ward committee members to provide input into the document Internal strategy discussions with all municipal departments Between 30 Top and middle management of the Municipality September and 28 October Internal strategy discussions with the Mayoral Committee 11 October Mayoral Committee members A strategy workshop 1 November Councillors, top management of the Municipality, two members from each ward committee and external stakeholders that represent a wide range of sectoral concerns such as business, industry, agriculture, religion, NGO s, education, government, etc. A final strategy workshop 8 November Mayoral Committee members as well as directors and division heads of the Municipality A working session to formulate a new vision and mission for Swartland. 13 December Mayoral Committee members and top management of the Municipality Integrated Development Plan for
20 As part of the analysis the following two surveys were done: A survey to determine population figures per town was done by Prof Larry Zietsman (a statistics expert) in conjunction with a local town planning firm CK Rumboll and Partners. A client satisfaction sample survey was done by Ekko marketing consultants to determine satisfaction levels with respect to the different municipal services. January - March 2012 (completing the draft documents) The five year capital expenditure framework was finalised. A second IDP Indaba was held on 16 February to focus on improving strategic alignment between municipalities and the province. The IDP document and Area Plans were completed. A second series of workshops were held with ward committees (this time extended to include people from the sectors which ward committee members represent) between 27 February and 5 March to finalise the area plans. An IDP / budget integration meeting was held on 1 March with top management. On 6 March a workshop was held with the NGO sector in Swartland to engage with them on the IDP strategy. The IDP document and Area Plans were submitted to the Mayoral Committee on 20 March and to the Council on 29 March for consideration. A workshop on local economic development was held on 21 March. The program for the day focused on job creation in Swartland and guest speakers included min Alan Winde (MEC Economic Development and Tourism), John Peters (IEDS Director) and Rene Whiteman (DBSA). The afternoon session took the form of an Indaba with contributions by the Municipal Manager (Joggie Scholtz) and the Director Development Services (Johan Steenkamp). Inputs from the workshop and indaba are included in the Strategy in Chapter 7 of this document. April 2012 (community inputs and document refinement) The draft IDP document and Area Plans were made public on 3 and 4 April and the community was invited to submit representations. A public meeting involving all councillors, top management of the Municipality, external stakeholders and the public was held on 19 April to give feedback and to obtain inputs on the draft IDP and annual budget. May - June 2012 (final approval) The IDP document and Area Plans were submitted to the Mayoral Committee on 16 May and to the Council on 31 May for final approval. A copy of the approved IDP was submitted to the MEC for local government as well as Provincial Treasury on 5 June. Notice was given to the public of the adoption of the IDP on 13 and 14 June. A summary of the IDP was also advertised on 13 and 14 June. 12 Integrated Development Plan for
21 2.4 Annual process followed in 2015/2016 [replaced on 26 May 2016] Activity Date Groups involved Preparation and process Approval of the time schedule that guided the revision of the IDP 27 Aug The Council and management of the Municipality Revision of strategy Internal strategy discussions with all municipal departments Sep Management of the Municipality Engagement with PGWC on Joint Planning Initiatives 8 Oct Senior Management of the Municipality and PGWC Strategy discussions with Mayoral Committee 13 Oct Mayoral Committee members Joint Ward Committee and Stakeholder meeting 21 Nov Ward committee members, stakeholders, senior management of the Municipality, councillors, Provincial MEC and officials. Engagement with PGWC on Joint Planning Initiatives 24 Nov Senior Management of the Municipality and PGWC Completing the draft documents Completion of the IDP document and Area Plans February Management of the Municipality Integrated IDP Indaba 2, Mid-Year and MGRO 2 engagements 15 February Senior Management of the Municipality and PGWC Consideration of the IDP document, Area Plans and budget by the Mayoral Committee 16 March Mayoral Committee Approval of the IDP document, Area Plans and budget by the Council 31 March Council as a draft Community inputs and document refinement Publish for public comment and representations the draft budget, IDP 5 & 6 April Swartland community document and Area Plans Swartland Municipal Advisory Forum Meeting (SMAF) 19 April Councillors, management of the Municipality, 2 ward committee members from each ward and invited stakeholders Meeting with the Malmesbury Sakekamer 19 April 96 business leaders Final approval Consideration of the IDP document, Area Plans and budget by the 11 May Mayoral Committee Mayoral Committee Final approval of the IDP document, Area Plans and budget by the Council 26 May Council Integrated Development Plan for
22 CHAPTER 3: THE ORGANISATION 3.1 Section 53 role clarification Section 53 of the Municipal Systems Act (Act 32 of 2000) stipulates inter alia that the respective roles and areas of responsibility of each political structure and political office bearer of the Municipality and of the municipal manager must be defined. The section below is based on the Section 53 role clarification that was approved at the council meeting of May (a) MUNICIPAL COUNCIL Governs by making and administrating laws, raising taxes and taking decisions that affect people s rights; is a tax authority that may raise property taxes and service levies; is the primary decision maker and takes all the decisions of the Municipality except those that are delegated to political structures, political office bearers, individual councillors or officials; can delegate responsibilities and duties for the purposes of fast and effective decision making; must strive towards the constitutional objects of local government; must consult the community with respect to local government matters; and is the only decision maker on non-delegated matters such as the approval of the IDP and budget. (b) EXECUTIVE MAYOR Is the executive and political leader of the Municipality and is in this capacity supported by the mayoral committee; is the social and ceremonial head of the Municipality; must identify the needs of the Municipality and must evaluate progress against key performance indicators; is the defender of the public s right to be heard; has many responsibilities with respect to the annual budget, the budget process, budget control and various other financial matters; and performs the duties and exercise the responsibilities that were delegated to him by the council. (c) MAYORAL COMMITTEE Its members are elected by the Executive Mayor from the ranks of councillors, with the exception of the Deputy Executive Mayor who is elected by the council and is an ex officio member of the mayoral committee; Its functional responsibility area is linked to that of the Executive Mayor to the extent that he must operate together with the members of the mayoral committee; Its primary task is to assist the Executive Mayor in the execution of his powers - it is in fact an extension of the office of Executive Mayor ; and The committee has no powers of its own decision making remains that of the Executive Mayor. 14 Integrated Development Plan for
23 3.2 The council and council committees [updated on 28 May 2015] The council consist of 23 councillors: Executive Mayor: Ald T van Essen DA Deputy Executive Mayor: Ald MSI Goliath DA Speaker: Ald NJA Rust DA WARD COUNCILLORS: Ward 1 Clr M van Zyl DA Ward 5 Clr JH Cleophas DA Ward 9 Clr NS Zatu ANC Ward 2 Clr CH Papers DA Ward 6 Clr M Rangasamy DA Ward 10 Clr L Traut DA Ward 3 Clr M Abrahams DA Ward 7 Clr AC Sedeman DA Ward 11 Ald MSI Goliath DA Ward 4 Clr BJ Stanley DA Ward 8 Ald NJA Rust DA Ward 12 Clr W Wilskut DA Integrated Development Plan for


 and four councillors.")


24 PROPORTIONAL COUNCILLORS: Clr CM Cloete ANC Clr FS Humphreys ANC Clr JI van der Merwe COPE Clr Y Cox-Bruintjies TPICO Clr DB Philander ANC Clr RF van der Westhuizen DA Clr C Fortuin ANC Clr AM Sneewe ANC Ald T van Essen DA Clr BW Geel DA Clr OM Stemele DA MAYORAL COMMITTEE: The Mayoral Committee consists of the Executive Mayor, Deputy Executive Mayor (ex officio) and four councillors. The current members of the mayoral committee are: Ald Tijmen van Essen Executive Mayor Ald Maude Goliath Deputy Executive Mayor Clr Michael Rangasamy Member Clr Reggy vd Westhuizen Member Clr Marlene van Zyl Member Clr Willem Wilskut Member 16 Integrated Development Plan for
25 SECTION 80 PORTFOLIO COMMITTEES: Administration and Finance Committee Development and Protection Services Committee Civil and Electrical Services Committee Clr M Rangasamy (Chairperson from MayCo responsible for Finance) Clr Willem Wilskut (Chairperson from MayCo responsible for Development Services) Clr Reggy vd Westhuizen (Chairperson from MayCo responsible for Technical Services) Clr Marlene van Zyl (Chairperson from MayCo Clr Marlene van Zyl (Chairperson from MayCo responsible for Administration) responsible for Protection Services) Clr Monde Stemele (Deputy Chairperson) Ald Klasie Rust (Deputy Chairperson) Clr Aubrey Sedeman (Deputy Chairperson) Ald Maude Goliath Ald Maude Goliath Ald Maude Goliath Clr Willem Wilskut Clr Monde Stemele Clr Basil Stanley Clr Clive Papers Clr Lionel Traut Clr Ben Geel Ald Klasie Rust Clr Aubrey Sedeman Clr Michael Rangasamy Clr Marlene van Zyl Clr Ben Geel Clr Clive Papers Clr Mogamat-Zain Abrahams Clr Harold Cleophas Clr Reggy van der Westhuizen Clr Basil Stanley Clr Mogamat-Zain Abrahams Clr Lionel Traut Clr Harold Cleophas Clr Colleen Cloete Clr Desmond Philander Clr Nelie Fortuin Clr Felicia Humphreys Clr Annie Sneewe Clr Ntobeko Zatu Clr Yolande Cox-Bruintjies Clr John van der Merwe Clr John van der Merwe Integrated Development Plan for


26 3.3 The Administration The organisational structure and management team are shown below: Joggie Scholtz Municipal Manager At Botha Civil Engineering Services Mark Bolton Financial Services (Acting) Roelof du Toit Electrical Engineering Services Philip Humphreys Protection Services Madelaine Terblanche Corporate Services Johan Steenkamp Development Services Building services Cemeteries Cleaning services Parks and amenities Roads Sewerage Sports facilities Storm water Water Asset and vehicle management Budgeting Credit control Expenditure Income/revenue Property rates Supply chain management Information management Operations, maintenance and construction Planning and design Street lighting Disaster management Fire and emergency services Harbour Yzerfontein Municipal police and traffic services Administration: Properties and contracts Communication and public relations Human resource services Secretariat and record management Building control Caravan park Yzerfontein Community development Housing Occupational and environmental health Planning Valuations 18 Integrated Development Plan for
 were agreed upon in September 2000 when 189 countries, including South Africa, committed themselves")
27 CHAPTER 4: INTERGOVERNMENTAL POLICY ALIGNMENT 4.1 Sustainable Development Goals [replaced on 26 May 2016] The Millennium Developmental Goals (MDGs) were agreed upon in September 2000 when 189 countries, including South Africa, committed themselves to the Millennium Declaration. The final MDGs Report was published in 2015 (available on As the MDGs era comes to a conclusion with the end of 2015, 2016 ushers in the official launch of the bold and transformative 2030 Agenda for Sustainable Development adopted by the United Nations General Assembly on 25 September The 17 Sustainable Development Goals and 169 targets demonstrate the scale and ambition of this new universal Agenda. They seek to build on the MDGs and complete what the MDGs did not achieve. They are integrated and indivisible and balance the three dimensions of sustainable development: the economic, social and environmental. The Goals are the following: 1 End poverty in all its forms everywhere. 2 End hunger, achieve food security and improved nutrition and promote sustainable agriculture. 3 Ensure healthy lives and promote well-being for all at all ages. 4 Ensure inclusive and equitable quality education and promote lifelong learning opportunities for all. 5 Achieve gender equality and empower all women and girls. 6 Ensure availability and sustainable management of water and sanitation for all. 7 Ensure access to affordable, reliable, sustainable and modern energy for all. 8 Promote sustained, inclusive and sustainable economic growth, full and productive employment and decent work for all. 9 Build resilient infrastructure, promote inclusive and sustainable industrialization and foster innovation. 10 Reduce inequality within and among countries. 11 Make cities and human settlements inclusive, safe, resilient and sustainable. 12 Ensure sustainable consumption and production patterns. 13 Take urgent action to combat climate change and its impacts. 14 Conserve and sustainably use the oceans, seas and marine resources for sustainable development. 15 Protect, restore and promote sustainable use of terrestrial ecosystems, sustainably manage forests, combat desertification, and halt and reverse land degradation and halt biodiversity loss. 16 Promote peaceful and inclusive societies for sustainable development, provide access to justice for all and build effective, accountable and inclusive institutions at all levels. 17 Strengthen the means of implementation and revitalize the Global Partnership for Sustainable Development. Integrated Development Plan for
 NATIONAL DEVELOPMENT PLAN (NDP) - NOVEMBER 2011 [added on 30 May 2013] The President appointed a National Planning Commission in May 2010 to draft a vision and plan for")
28 4.2 National policy directives [Section (a) (The 12 outcomes adopted by the Cabinet Lekgotla in January 2010) and Section (c) (National Spatial Development Perspective (NSDP) ) were both deleted on 28 May 2015] (a) NATIONAL DEVELOPMENT PLAN (NDP) - NOVEMBER 2011 [added on 30 May 2013] The President appointed a National Planning Commission in May 2010 to draft a vision and plan for the country. On 9 June 2011 the Commission released a diagnostic document and elements of a vision statement. On 11 November 2011 the vision statement and the plan was released for consideration. The Commission consulted widely on the draft plan. The National Development Plan was handed to President Zuma in August 2012 and was adopted by Cabinet in September An approach to change The plan in brief By 2030 The graphic to the left demonstrates the close link between capabilities, opportunities and employment on social and living conditions. It shows how leadership, an active citizenry and effective government can help drive development in a socially cohesive environment. The plan focuses on the critical capabilities needed to transform the economy and society. Achieving these capabilities is not automatic, nor will they emerge if the country continues on its present trajectory. Rising levels of frustration and impatience suggest that time is of the essence: failure to act will threaten democratic gains. In particular, South Africa must find ways to urgently reduce alarming levels of youth unemployment and to provide young people with broader opportunities. Progress over the next two decades means doing things differently. Given the complexity of national development, the plan sets out six interlinked priorities: Uniting all South Africans around a common programme to achieve prosperity and equity. Promoting active citizenry to strengthen development, democracy and accountability. Bringing about faster economic growth, higher investment and greater labour absorption. Focusing on key capabilities of people and the state. Building a capable and developmental state. Encouraging strong leadership throughout society to work together to solve problems. Eliminate income poverty Reduce the proportion of households with a monthly income below R419 per person (in 2009 prices) from 39% to zero. Reduce inequality The Gini coefficient should fall from 0.69 to 0.6. Enabling milestones Increase employment from 13 million in 2010 to 24 million in Raise per capita income from R in 2010 to R by Integrated Development Plan for
29 Increase the share of national income of the bottom 40% from 6% to 10%. Establish a competitive base of infrastructure, human resources and regulatory frameworks. Ensure that skilled, technical, professional and managerial posts better reflect the country's racial, gender and disability makeup. Broaden ownership of assets to historically disadvantaged groups. Increase the quality of education so that all children have at least two years of preschool education and all children in grade 3 can read and write. Provide affordable access to quality health care while promoting health and wellbeing. Establish effective, safe and affordable public transport. Produce sufficient energy to support industry at competitive prices, ensuring access for poor households, while reducing carbon emissions per unit of power by about one-third. Ensure that all South Africans have access to clean running water in their homes. Make high-speed broadband internet universally available at competitive prices. Realise a food trade surplus, with one-third produced by small-scale farmers or households. Ensure household food and nutrition security. Entrench a social security system covering all working people, with social protection for the poor and other groups in need, such as children and people with disabilities. Realise a developmental, capable and ethical state that treats citizens with dignity. Ensure that all people live safely, with an independent and fair criminal justice system. Broaden social cohesion and unity while redressing the inequities of the past. Play a leading role in continental development, economic integration and human rights. Critical actions 1. A social compact to reduce poverty and inequality, and raise employment and investment. 2. A strategy to address poverty and its impacts by broadening access to employment, strengthening the social wage, improving public transport and raising rural incomes. 3. Steps by the state to professionalise the public service, strengthen accountability, improve coordination and prosecute corruption. 4. Boost private investment in labour-intensive areas, competitiveness and exports, with adjustments to lower the risk of hiring younger workers. 5. An education accountability chain, with lines of responsibility from state to classroom. 6. Phase in national health insurance, with a focus on upgrading public health facilities, producing more health professionals and reducing the relative cost of private health care. 7. Public infrastructure investment at 10% of gross domestic product (GDP), financed through tariffs, public-private partnerships, taxes and loans and focused on transport, energy and water. 8. Interventions to ensure environmental sustainability and resilience to future shocks. 9. New spatial norms and standards densifying cities, improving transport, locating jobs where people live, upgrading informal settlements and fixing housing market gaps. 10. Reduce crime by strengthening criminal justice and improving community environments. Summary of objectives and actions Chapters 3 to 15 deal in detail with objectives and actions for 13 strategic outcomes. The table below contains an excerpt from these chapters and shows objectives and actions under each chapter that impact on local government and to which we can contribute through our existing and planned actions. Integrated Development Plan for
30 Chapter Outcome Objectives impacting on local government and to which we can contribute Related actions (the numbering corresponds with that in the NDP) 3 Economy and employment Public employment programmes should reach 3 Remove the most pressing constraints on 1 million by 2015 and 2 million people by 2030 growth, investment and job creation, including energy generation and distribution, urban planning, etc. 6 Broaden expanded public works programme to cover 2 million fulltime equivalent jobs by Economic infrastructure The proportion of people with access to the 18 Move to less carbon-intensive electricity electricity grid should rise to at least 90% by production through procuring at least 2030, with non-grid options available for the rest. Ensure that all people have access to clean, potable water and that there is enough water MW of renewable energy, increased hydro-imports from the region and increased demand-side measures, including solar water heating. for agriculture and industry, recognising the 29 Establishing a national, regional and trade-offs in the use of water. Reduce water demand in urban areas to 15% below the business-as-usual scenario by Competitively priced and widely available municipal fibre-optic network to provide the backbone for broadband access; driven by private investment, complemented by public funds required to meet social objectives. broadband 5 Environmental sustainability and resilience Absolute reductions in the total volume of waste disposed to landfill each year. At least MW of renewable energy should be contracted by Carbon price, building standards, vehicle emission standards and municipal regulations to achieve scale in stimulating renewable energy, waste recycling and in retrofitting buildings. 6 Inclusive rural economy No direct impact 7 South Africa in the region and the world No direct impact 8 Transforming human settlements Strong and efficient spatial planning system, 42 Reforms to the current planning system for well integrated across the spheres of improved coordination. government Upgrade all informal settlements on suitable, well located land by Develop a strategy for densification of cities and resource allocation to promote better located housing and settlements. More people living closer to their places of 45 Introduce spatial development framework work More jobs in or close to dense, urban townships and norms, including improving the balance between location of jobs and people. 22 Integrated Development Plan for
31 Chapter Outcome 9 Improving education, training and innovation Objectives impacting on local government and to which we can contribute Make early childhood development a top priority among the measures to improve the quality of education and long-term prospects of future generations. Related actions (the numbering corresponds with that in the NDP) 10 Health care for all No direct impact 11 Social protection Ensure progressively and through multiple 79 Pilot mechanisms and incentives to assist the avenues that no one lives below a defined minimum social floor. All children should enjoy services and benefits unemployed to access the labour market. 80 Expand existing public employment initiatives to create opportunities for the unemployed. aimed at facilitating access to nutrition, health care, education, social care and safety. 12 Building safer communities No specific objective Municipalities contribute through traffic policing, by-law enforcement and disaster management 13 Building a capable and developmental state Staff at all levels has the authority, experience, competence and support they need to do their jobs. Relations between national, provincial and local government are improved through a more proactive approach to managing the intergovernmental system. 14 Fighting corruption A corruption-free society, a high adherence to No specific action ethics throughout society and a government that is accountable to its people. 94 Formulate long-term skills development strategies for senior managers, technical professionals and local government staff. 95 Use assessment mechanisms such as exams, group exercises and competency tests to build confidence in recruitment systems. 96 Use placements and secondments to enable staff to develop experience of working in other spheres of government. 97 Use differentiation to ensure a better fit between the capacity and responsibilities of provinces and municipalities. Take a more proactive approach to resolving coordination problems and a more long-term approach to building capacity. 98 Develop regional utilities to deliver some local government services on an agency basis, where municipalities or districts lack capacity. Integrated Development Plan for
32 Chapter Outcome Objectives impacting on local government and to which we can contribute Related actions (the numbering corresponds with that in the NDP) 15 Nation building and social cohesion Target: Our vision is a society where opportunity is not determined by race or birthright; where citizens 115 Improving public services and spaces as well as building integrated housing and sport facilities in communities to ensure accept that they have both rights and sharing of common spaces across race and responsibilities. Most critically, we seek a united, class. prosperous, non-racial, non-sexist and 118 Promote citizen participation in forums such democratic South Africa. as IDPs and Ward Committees. 119 Work towards a social compact for growth, employment and equity. (b) MEDIUM-TERM STRATEGIC FRAMEWORK (MTSF): [added on 28 May 2015] In 2014 the National Cabinet approved the new Medium Term Strategic Framework (MTSF) for 2014 to The Medium Term Strategic Framework (MTSF) is Government s strategic plan for the electoral term. It reflects the commitments made in the election manifesto of the governing party, including the commitment to implement the NDP. The MTSF sets out the actions Government will take and targets to be achieved. It also provides a framework for the other plans of national, provincial and local government. The MTSF is structured around 14 priority outcomes which cover the focus areas identified in the NDP and Government s electoral mandate. These are reflected in the table below. The targets might not all be of relevance to local government, but are nevertheless included for completeness. Priority Outcomes Quality basic education A long and healthy life for all South Africans Targets All children between ages 7 and 15 should be in school and 65% of learners should be in class groups appropriate to their age by % of each age cohort should receive either a National Senior Certificate or an alternative vocational or further education and training qualification by % of learners tested through the Annual National Assessments (ANA) in Grades 3, 6 and 9 should achieve above 50% in both literacy and numeracy by 2019 At the Grade 12 level, the number qualifying for university entrance must be at least by 2019 Construction of 213 clinics and community health centres and 43 hospitals, and refurbishment of over 870 health facilities in 11 NHI pilot districts Doubling of the annual training of doctors locally and abroad to a year Doubling of the number of people on anti-retrovirals from the present 2.4 million to a projected 5.1 million Intensified TB screening and treatment programmes for vulnerable groups, including inmates of correctional services facilities, mineworkers and an estimated people living in mining communities Human Papilloma Virus Vaccine coverage of 90% amongst 9 and 10 year old girls, to significantly reduce their risk of acquiring cervical cancer in future 24 Integrated Development Plan for
33 Priority Outcomes All people in South Africa are and feel safe Decent employment through inclusive growth A skilled and capable workforce to support an inclusive growth path An efficient, competitive and responsive economic infrastructure network Vibrant, equitable, sustainable rural communities contributing towards food security for all Sustainable human settlements and improved quality of household life Targets A reduction in the number of reported contact crimes An increased proportion of citizens feel safe walking alone, during the day or at night, as measured in official surveys An increase in the proportion of households that are satisfied with police services in their area, and with the way courts deal with the perpetrators of crime Improvements in citizens perceptions of levels of crime and progress in reducing crime, as measured in official surveys An improvement in South Africa s ranking on the Transparency International Corruption Perception Index An increase in the GDP growth rate from 2.5% in 2012 to 5% in 2019 An increase in the rate of investment to 25% of GDP in 2019 The share in household income of the poorest 60% of households rising from 5.6% in 2011/12 to 10% in 2019 A decrease in the official unemployment rate from 25% in the first quarter of 2013 to 14% in 2020 An improved interface between SETAs, workplaces and education and training institutions (TVETs, universities and adult education institutions) with work based learning opportunities planned for universities will offer TVET lecturing qualifications by 2017 (currently only one offers such qualifications), and 30% of TVET college lecturers should have work-place exposure every year by 2019 The number of new black entrants into the academic work force will have to increase by at least 100 per annum by 2019 Increasing the electricity generation reserve margin from 1% currently to 19% in 2019 A 5% increase in bulk water resources commissioned in comparison to 2014 An increase in broadband penetration from 33.7% in 2013 to 80% at 5Mbps; 50% at 50Mbps in 2019 Increasing the tonnage moved on rail from 207 million tonnes (Mt) in 2013 to 330 Mt by 2019 Improving the operational performance of sea ports and inland terminals from 28 to 35 average crane moves per hour by 2019 Increase the percentage of productive land owned by previously disadvantaged individuals from 11.5% in 2013 to 20% Ensure that, by 2019, there is a 20% (or 16.2 m ha) increase in percentage ownership of productive land by previously disadvantaged individuals Reduce the percentage of households who are vulnerable to hunger from 11.4% in 2013 to less than 9.5% Reduce the percentage of the population living below the lower bound poverty line (R443 in 2011 prices) from 32.3% to below 22 % Reduce rural unemployment from the current 49% to less than 40% Adequate housing and improved quality living environments, with million more households living in new or improved housing conditions by 2019 A functional and equitable residential property market with a target of new housing units delivered in the affordable gap market by 2019 Enhanced institutional capabilities for effective coordination of spatial investment decisions, with a target of 49 municipalities assigned or accredited with the housing function Integrated Development Plan for
34 Priority Outcomes Responsive, accountable, effective and efficient local government Protect and enhance our environmental assets and natural resources Create a better South Africa and contribute to a better Africa and a better world An efficient, effective and development-oriented public service A comprehensive, responsive and sustainable social protection system A diverse, socially cohesive society with a common national identity Targets The title deeds for all new subsidy units as well the backlog of title deeds in the integrated residential housing programme will be transferred over the next five years Informal settlement upgrading will be expanded to cover households, ensuring basic services and infrastructure in some informal settlements Increase in the percentage of households with access to a functional water service from 85% in 2013 to 90% by 2019 Increase in the percentage of households with access to a functional sanitation service from 84% in 2013 to 90% by 2019, including elimination of bucket sanitation in the formal areas 1.4 million additional households to be connected to the grid between 2014 and 2019, and additional nongrid connections Income support to the unemployed through expansion of the Community Work Programme to reach 1 million participants in 2019 An increase in the level of public trust and confidence in local government from 51% in 2012 to 65% in 2019, as measured by the IPSOS survey An improvement in overall municipal audit outcomes, with at least 75% of municipalities receiving unqualified audits by 2019 Stabilisation and reduction of CO2 (a 34% reduction in emissions of CO2 from business as usual by 2020 (42% by 2025) Implementation of climate change responses in five critical sectors Increasing the percentage of the coastline with at least partial protection from 22.5% in 2013 to 27% in 2019 Increasing the compliance of mines with the National Water Act from 35% in 2013 to 60% in 2019 Ensure FDI inflows by maintaining the investment project pipeline of at least R50 billion Facilitate manufactured value-added exports from IPAP priority sectors to emerging and traditional markets to R5 billion Increase the number of foreign visitor arrivals to close to 44 million by 2016/17 Increase the tourism foreign direct spend (excluding capital expenditure) to R372.1 billion by 2017 Harness the economic strength of countries and groupings of the South by increasing the number of South Africa s bilateral economic cooperation agreements from 49 to 59 No specific targets By 2024, an essential age- and developmentally stage-appropriate package of quality early childhood development (ECD) services is available and accessible to all young children and their caregivers Universal access (at least 95% of eligible people) to social assistance benefits by 2019, notably the child support grant, disability grant and old age pension The proportion of people of the opinion that race relations are improving rises from 40% in 2011 to 65% in 2019 The social cohesion index rises from 80.4% in 2011 to 90% in 2019 The active citizenship index rises from 79% in 2011 to 85% in 2019 The number of people over 18 that belong to a charitable organization rises from 5% in 2011 to 10% in Integrated Development Plan for
35 (c) BACK TO BASICS APPROACH - SEPTEMBER 2014 [added on 28 May 2015] The Minister of Cooperative Governance and Traditional Affairs (COGTA) introduced the Back to Basics approach at the Presidential Local Government Summit on 18 September In presenting the approach the Minister also pronounced the national plan of action to roll-out the programme with the aim of addressing challenges facing municipalities in a sustainable manner. This approach was adopted at the summit as the framework for the implementation of targeted measures towards improving the functioning of municipalities and sustainable provision of services to the citizens. After the summit the National COGTA stated with the task of preparing for the implementation of the approach in each of the nine provinces. These preparations have culminated in the development of the back to basics conceptual framework and the operationalization plan that provides the foundation for the onward implementation of the approach. A Programme for Change At the most basic level National Government will expect municipalities to: 1 Put people and their concerns first and ensure constant contact with communities through effective public participation platforms. The basic measures to be monitored include: Regular ward report backs by councillors Clear engagement platforms with civil society Transparent, responsive and accountable Regular feedback on petitions and complaints The regularity of community satisfaction surveys carried out. 2 Create conditions for decent living by consistently delivering municipal services to the right quality and standard. This includes planning for and delivery of infrastructure and amenities, maintenance and upkeep, including the budgeting to do this. Ensure no failures in services and where there are, restore with urgency. Municipalities are expected to perform the following basic activities, and the performance indicators will measure the ability of our municipalities to do so: Develop fundable consolidated infrastructure plans. Ensure Infrastructure development maintenance (7% OPEX) and reduce losses. Ensure the provision of free basic services and the maintenance of indigent register National and Provincial Rapid Response and technical teams will be established and strengthened and service delivery interruptions will be monitored at a national level. 3 Be well governed and demonstrating good governance and administration - cutting wastage, spending public funds prudently, hiring competent staff, ensuring transparency and accountability. Municipalities will be constantly monitored and evaluated on the following basics: Clear delineation of roles and responsibilities Functional structures. Transparency, accountability and community engagement Proper system of delegation to ensure functional administration The existence and efficiency of anti-corruption measures. The extent to which there is compliance with legislation and the enforcement of by laws. The rate of service delivery protests and approaches to address them. Integrated Development Plan for
36 4 Ensure sound financial management and accounting, and prudently manage resources so as to sustainably deliver services and bring development to communities. Performance against the following basic indicators will be constantly assessed: Proper record keeping and production of annual financial statements. Credit control, internal controls and increased revenue base Wasteful expenditure including monitoring overtime kept to a minimum. Functional Supply Chain Management structures with appropriate oversight The number disclaimers in the last three five years. Whether the budgets are cash backed. 5 Build and maintain sound institutional and administrative capabilities, administered and managed by dedicated and skilled personnel at all levels. The basic requirements to be monitored include: Competent and capable people and performance management. Functional delegations. Regular interactions between management and organised labour. Shared scarce skills services at district level. Realistic organograms aligned to municipal development strategy. Implementable human resources development and management programmes. Immediate National Government priorities for transformation Priority 1: Get all municipalities out of a dysfunctional state and at the very least able to perform the basic functions of local government. This will be done through enforcement of current policies and legislation, and systematically managing performance and accountability, and enforcement of the system for managing consequences. Minimum performance requirements include ensuring the proper functioning of council structures and council processes, and the provision of basic services. Priority 2: Support municipalities that are at a minimum basic level of performance to progress to a higher path. Here the focus will be on building strong municipal administrative systems and processes. It includes ensuring that administrative positions are filled with competent and committed people whose performance is closely monitored. The oversight system for local government must be improved through creating real-time monitoring systems. A targeted, vigorous and brisk response must ensure that corruption and fraud are rooted out. Measures will be taken to ensure that municipalities engage with their communities. Support measures will be put in place to create an enabling environment for local economic development to stimulate competitive, inclusive and sustainable economies. Priority 3: Support and incentivise municipalities that are performing well to remain there. Given that in these municipalities the basics are largely in place, the main focus here will be on transforming the local space economy and integrating and densifying our communities to improve sustainability. Innovative ways will be developed to incentivise those municipalities doing well. Managing performance Good performance in local government is not recognised and rewarded adequately, nor are there sufficient consequences for under-performance. National Government is therefore going to institutionalise a performance management system to effect the changes required in the system. A set of indicators as per the pillars of the Back-to Basics approach will be developed and finalized. 28 Integrated Development Plan for
37 Intergovernmental delivery coordination Strong coordinated planning and implementation IDPs must become National, Provincial and Local action plans National programmes must fit into local plans Coordinated planning and delivery to create decent living and working conditions Concluding comments The back to basics approach relies on municipal political leadership and management to play a significant role. It must release the necessary commitment to change. It calls for national, provincial and local coalitions for change and development. All of us are accountable to change people's lives and create better prospects for the economy. The back to basics approach forms the basis of the Municipal Strategy in Chapter 7 of this document. 4.3 Provincial policy directives (a) WESTERN CAPE S PROVINCIAL STRATEGIC PLAN: [revised on 28 May 2015] The Provincial Strategic Plan constitutes both the Western Cape Government's policy agenda and its roadmap for execution. It builds on the solid foundations of the Provincial Strategic Plan , incorporates the lessons learnt along the way, streamlines and reprioritises the eleven former Provincial Strategic Objectives into five overarching Provincial Strategic Goals, and introduces a number of game-changers to catalyse the realisation of the Provincial Strategic Goals. The Provincial Strategic Plan is in line with National Government's 2012 National Development Plan. The Western Cape Government has also committed itself to support the implementation of the Medium Term Strategic Framework over the five year term. The Medium Term Strategic Framework does not constitute the sum total of what the Western Cape Government does, but it serves as a prioritisation framework, aimed at focusing all government efforts on a set of manageable programmes. The following table contain the five strategic goals together with a summary of objectives, priorities, game-changers and joint planning initiatives: PSG 1: Create opportunities for growth and jobs Objective Productive Sectors Enablers Joint Planning Initiatives 1: Project khulisa ( to grow ) Tourism Oil and Gas Business Process Outsourcing (BPO) Film Agri-processing Renewables Energy Water Broadband Skills Promote economic growth and development by unlocking the potential in aquaculture, agriculture, agro-processing, green economy (energy) and tourism sectors. Boost economic competitiveness and build investor and consumer confidence through capacity- Integrated Development Plan for
38 Objective Productive Sectors Enablers Joint Planning Initiatives PSG 2: Improve education outcomes and opportunities for youth development building in local government, increased production, creating employment opportunities and developing skills. Maximise economic activity and the potential for tourism through infrastructure development. Objectives Priorities Game Changers Joint Planning Initiatives 1. Improve the level of language and mathematics in all schools 2. Increase the number and quality of passes in the National Senior Certificate and equivalent qualifications Update language and mathematics strategies Improve the skills and knowledge of teachers and principals Increase access to e-learning Improve frequency and quality of the monitoring and support services Five year Teacher Development Plan Improve the quality of teaching and career guidance Recruit and retain quality principals and HODs Ensure all learners have access to textbooks 3. Increase the quality of education Improve ECD quality provision in our poorer communities MOD centres in areas of poor retention Provide fee-compensation and increase number of no-fee schools Improve health services and safety at schools After-school programmes for our youth E-learning Improve maths and science results and the retention of maths and science teachers. Enable social upliftment and wellbeing through the promotion of early childhood development, education-, health- and youth life skills programmes. Strengthen partnerships with the private sector to create on-the-job learning opportunities and tailor the curriculum to respond to industry needs. Focus on skills development programmes for the youth, especially in municipal areas where there is a high unemployment rate amongst youth. 30 Integrated Development Plan for
39 Objectives Priorities Game Changers Joint Planning Initiatives 4. Provide more social and economic opportunities for our youth 5. Improve family support to children and youth, and facilitate development PSG 3: Increase wellness, safety and tackle social ills Improve skills development programmes and training Schools of skills Youth cafes Increase access to safe after-school facilities for learning and healthy activities Communicate with parents on roles and responsibilities Coordinate referral pathways for children with behavioural problems Provide psychosocial support programmes in targeted areas Objectives Priorities Game Changers Joint Planning Initiatives 1. Healthy, inclusive and safe communities Community Safety through policing oversight and safety partnerships Strengthen Social Services and Safety Net Increase access to community workers Establish Community Wellness Centers 2. Healthy workforce Promote wellness amongst WCG employees Increase access to Employee Wellness and Assistance Programmes Engage major employees to address wellness of employees 3. Healthy families Promote positive parenting styles Promote positive role of fathers and men in integrated families Increase level of maternal education to promote financial wellness of women in family unit Reducing the impact of alcohol abuse on the population Improve the social fabric through the promotion of education, health and community safety through integrated planning and coordinated responses. Link social interventions to spatial planning and infrastructure development programmes. Reduce the negative impact of substance and alcohol abuse in communities through, amongst others, afterschool support programmes and crime prevention and safety promotion interventions. Address teenage pregnancy and build social cohesion. Integrated Development Plan for
40 Objectives Priorities Game Changers Joint Planning Initiatives 4. Healthy youth Accessible sexual and reproductive health services Educate and empower youth to develop and sustain safe and healthy lifestyle habits Facilitate opportunities for youth to be active and responsible citizens 5. Healthy children Implement a focused programme, tracking pregnant woman from antenatal care schooling Improve access to, uptake and quality of ECD services Provide preventive health services PSG 4: Enable a resilient, sustainable, quality and inclusive living environment Objectives Priorities Game Changers Joint Planning Initiatives 1. Sustainable ecological and agricultural resource- base 2. Improved air quality management and climate change response 3. Create better living conditions for households, especially low income and poor households 4. Sustainable and integrated urban and rural settlements Enhanced management and Water and sanitation for all maintenance of the ecological and New living model (Live-Work-Play) agricultural resource-base Western Cape Sustainable Water Management Plan Implementation of the Western Cape Climate Change Implementation Framework Agricultural Climate Change Response Plan Infrastructure programme (including water and sanitation) Better Living Challenge Live-Work-Play model Increased Housing opportunities Improved Settlement Functionality, Efficiencies and Resilience Develop an integrated approach to planning and implementing human settlement development, infrastructure development (including transport (road) and bulk infrastructure) and budgetary processes. Support the maintenance of ageing infrastructure and reducing backlogs. Attend to regional waste management. Attend to regional air quality management. Develop sustainable water resources and sanitation systems. 32 Integrated Development Plan for
41 PSG 5: Embed good governance and integrated service delivery through partnerships and spatial alignment Objectives Priorities Game Changers Joint Planning Initiatives 1. Enhanced Governance Efficient, effective and responsive provincial and local governance Strategic partnerships 2. Inclusive Society Service interface to enhance integrated service delivery Implement constructive and empowering community engagement 3. Integrated Management Policy alignment, integrated planning, budgeting and implementation M&E system with intergovernmental Spatial governance targeting and performance Broadband Infrastructure Digital Competitiveness Joined-up Government (b) WESTERN CAPE PROVINCIAL SPATIAL DEVELOPMENT FRAMEWORK - MARCH 2014 [added on 30 May 2014] Guiding principles The 2014 PSDF applies the following spatial principles: Spatial justice Sustainability and resilience Spatial efficiency Accessibility Quality and liveability Spatial goals Improve regional planning for and coordination of bulk infrastructure development. Strengthen governance through meaningful public participation and efficient use of ICT technology. Upscale shared services initiatives. To address the spatial challenges identified the PSDF takes the Western Cape on a path towards: more inclusivity, productivity, competitiveness and opportunities in urban and rural space-economies; better protection of spatial assets (e.g. cultural and scenic landscapes) and strengthened resilience of natural and built environments; and improved effectiveness in the governance of urban and rural areas. The spatial vision The PSDF builds on OneCape 2040 s vision of a highly-skilled, innovation driven, resource efficient, connected, high opportunity and collaborative society. For each of these societal attributes aspired to OneCape 2040 identifies thematic big step changes that need to take place. Integrated Development Plan for
42 The PSDF envisages the spatial expression of these themes as follows: Educating Cape: Everyone has access to a good education, and the cities, towns and rural villages are places of innovation and learning. Working Cape: There are livelihood prospects available to urban and rural residents, and opportunities for them to find employment and develop enterprises in these markets. Green Cape: All households can access basic services that are delivered resource efficiently, residents use land and finite resources prudently, and safeguard their ecosystems. Connecting Cape: Urban and rural communities are inclusive, integrated, connected and collaborate. Living Cape: Living and working environments are healthy, safe, enabling and accessible, and all have access to the region s unique lifestyle offering. Leading Cape: Urban and rural areas are effectively managed The spatial agenda To deliver on the WCG s strategic objectives the PSDF focuses on growing the economy, building greater environmental resilience and much better inclusion. To these ends the Provincial spatial agenda may be summarised as follows: Growing the Western Cape economy in partnership with the private sector, non-governmental and community based organisations Using infrastructure investment as primary lever to bring about the required urban and rural spatial transitions Improving oversight of the sustainable use of the western cape s spatial assets The spatial logic The logic underpinning the PSDF s spatial strategy is to: CAPITALISE and build on the Western Cape comparative strengths (e.g. gateway status, knowledge economy, lifestyle offering) and leverage the sustainable use of its unique spatial assets. CONSOLIDATE existing and emerging regional economic nodes as they offer the best prospects to generate jobs and stimulate innovation. CONNECT urban and rural markets and consumers, fragmented settlements and critical biodiversity areas (i.e. freight logistics, public transport, broadband, priority climate change ecological corridors, etc) CLUSTER economic infrastructure and facilities along public transport routes (to maximise the coverage of these public investments) and respond to unique regional identities within the Western Cape. 34 Integrated Development Plan for

43 Interrelated themes The policy framework covers provincial spatial planning s three interrelated themes, namely: 1. Sustainable use of the Western Cape s resources Biodiversity and ecosystem services Soils and mineral resources Resource consumption and disposal Landscape and scenic assets Water 2. Opening-up opportunities in the Provincial space-economy Regional economic infrastructure Rural space-economy Urban space-economy 3. Developing integrated and sustainable settlements Sense of place and settlement patterns Accessibility Land use and density Facilities and social services Informality, housing delivery, inclusion and urban land markets Integrated Development Plan for
44 4.4 District Municipality IDP [replaced on 26 May 2016] STRATEGIC OBJECTIVES AND SUB-OBJECTIVES Objective 1 To ensure the environmental integrity of the district is improved. 2 To pursue economic growth and the facilitation of job opportunities. 3 To promote the social well being of residents, communities and targeted social groups in the district. 4 To provide essential bulk services to the district. 5 To ensure good governance and financial viability. Sub-Objectives a) To formulate, adopt and implement a climate change strategy and plan. b) To formulate, adopt and implement an air quality plan and by-law. c) To produce, implement and monitor coastal management plan. d) To produce, adopt and implement an estuary management plan. e) To implement and monitor the EIA requirements and measures for all capital projects. f) To review the Spatial Development Framework and Plan and implement recommendations and measures which enhance the environmental, social and economic conditions in the WCDM. a) To maintain and develop a series of campaigns to grow and change the visitor profile of the West Coast Region. b) To facilitate and develop an entrepreneurial culture and skills development in the district with specific interventions which support the growth and development of the tourist sector in the district. c) To promote and facilitate financial investment, catalytic business projects, anchor capital projects and EPWP to drive business development, skills development and job creation in the district. d) To work with partners to promote economic growth and encourage business to invest in the West Coast Region. a) To co-ordinate, support, build capacity for and monitor Social and Rural Development in the district. b) To resource and strengthen targeted Social and Rural Development initiatives in the district with targeted support provided to vulnerable social groups like the youth, women, the aged and others. c) To ensure service excellence in the tourist sector of the WCDM through improved awareness, human resource skills and institutional capacity. d) To promote, facilitate, co-ordinate interventions which monitor and improve the health, safety and environmental conditions in the WCDM. a) To revise and update the Bulk Water System Master Plan. b) To implement, maintain and monitor an effective, efficient and cost effective bulk water system. c) To develop, maintain, monitor a regional waste disposal site for Cederberg and Matzikama municipalities. d) To revise, adopt, implement, and monitor the District Integrated Waste Management Plan. e) To revise, adopt, implement, and monitor the District Integrated Transport Plan. f) The effective and efficient maintenance of roads throughout the district. a) To ensure a clean, corruption free and well-managed administration. b) To implement measures that ensure an efficient, effective, accountable and economically viable administration. c) To provide shared inter-governmental support which builds capacity and improves service delivery. d) To improve the well-being and health and safety conditions of staff. e) To promote, practice and monitor sound financial management strategies, systems and practices which ensure regulatory compliance and financial viability. f) To ensure integrated strategic and operational planning. g) To facilitate and strengthen public participation and the process of deepening democracy. h) Optimal internal retention, attraction and development of human resources within the organisation. 36 Integrated Development Plan for
45 4.5 Alignment between national, provincial and local strategic plans [revised on 28 May 2015] SPHERE STRATEGIC DIRECTION RESOURCE ALLOCATION IMPLEMENTATION NATIONAL PROVINCIAL LOCAL National Development Plan Medium Term Strategic Framework Provincial Strategic Plan Provincial Spatial Development Framework Long term Development Strategy Municipal Integrated Development Plan MTEF and Budget MTEF and Budget MTEF and Budget Dept sector plans Dept sector plans Dept sector plans DEVELOPMENTAL IMPACT Integrated Development Plan for
46 Swartland Municipality IDP Outcomes (2012) 1 A financially sustainable municipality with well-maintained assets 2 Satisfied, involved and well informed clients 3 An effective, efficient, motivated and appropriately skilled work force 4 Access to affordable and reliable municipal infrastructure 5 Sustainable development of the municipal area - urban and rural environment 5 Sustainable development of the municipal area economic development 5 Sustainable development of the municipal area Social development 6 A lean, integrated, stable and corruption free organisation 7 Increased community safety through traffic policing, by-law enforcement and disaster management District Municipality IDP (2012) 5 To ensure good governance and financial viability 4 To provide essential bulk services to the district 1 To ensure the environmental integrity of the district is improved 2 To pursue economic growth and the facilitation of job opportunities 3 To promote the social well being of residents, communities and targeted social groups in the district Provincial Strategic Plan ( ) 5 Embed good governance and integrated service delivery through partnerships and spatial alignment 4 Enable a resilient, sustainable, quality and inclusive living environment 4 Enable a resilient, sustainable, quality and inclusive living environment 1 Create opportunities for growth and jobs 2 Improve education outcomes and opportunities for youth development 3 Increase wellness, safety and tackle social ills 5 Embed good governance and integrated service delivery through partnerships and spatial alignment 3 Increase wellness, safety and tackle social ills National Development Plan (2012) Chapter 13: Building a capable and developmental state Chapter 4: Economic infrastructure Chapter 5: Environmental sustainability and resilience Chapter 3: Economy and employment Chapter 6: Inclusive rural economy Chapter 9: Improving education, training and innovation Chapter 8: Transforming human settlements Chapter 9: Improving education, training and innovation Chapter 10: Health care for all Chapter 11: Social protection Chapter 14: Fighting corruption Chapter 15: Nation building and social cohesion Chapter 12: Building safer communities 38 Integrated Development Plan for
47 CHAPTER 5: SECTORAL PLANS IN TERMS OF SECTION 26 OF THE MUNICIPAL SYSTEMS ACT Spatial Development Framework - Synopsis [The synopsis was amended as a result of amendments to the Spatial Development Framework] (a) VISION Balance development and conservation in an economically prosperous Swartland for all. (b) OBJECTIVES Bio-physical: To determine conservation and development borders, overlay zones for natural areas (valleys and mountains), agriculture, water catchment and sources, and heritage areas. Socio-economic: To stimulate the economy by creating meaningful employment opportunities by focussing on regional exports and the creation of tourist, rural, and commercial corridors (i.e. rural development and climate change corridors) thus reducing poverty. Encouraging social upliftment through housing provision and ownership. Built: To provide sufficient bulk infrastructure to service the expanding housing and industrial demand. To be supportive of the rural areas by encouraging transport networks, education and access to information through the electronic media. Protect the integrity of the smaller towns. Support the movement to seek alternative energy generation methods. (c) REGIONAL INTEGRATION The Swartland Municipal area is bounded by the Cape Metropolitan Municipality (CPT) to the south, the Drakenstein Municipality (WC023) on the south eastern boundary, the Bergrivier Municipality (WC013) along the north eastern boundary and the Saldanha Municipality (WC014) on the northern boundary. Swartland is well located in terms of the West Coast Region and in terms of the Cape Metropolitan area and its related markets with good connectivity through existing well developed transports networks that include the R27 along the West Coast, the N7 as the main route to the Northern Cape and Namibia and the R46 and R45 to the Boland and the Witzenberg regions. This high level of accessibility and connectivity provide various options for economic development in the area. Other features within Swartland that also connect with the surrounding regions to support inter-municipal economic and tourism related developments include: The Berg River that form the eastern boundary of the Swartland and support various agriculture and tourism activities along the corridor; Integrated Development Plan for

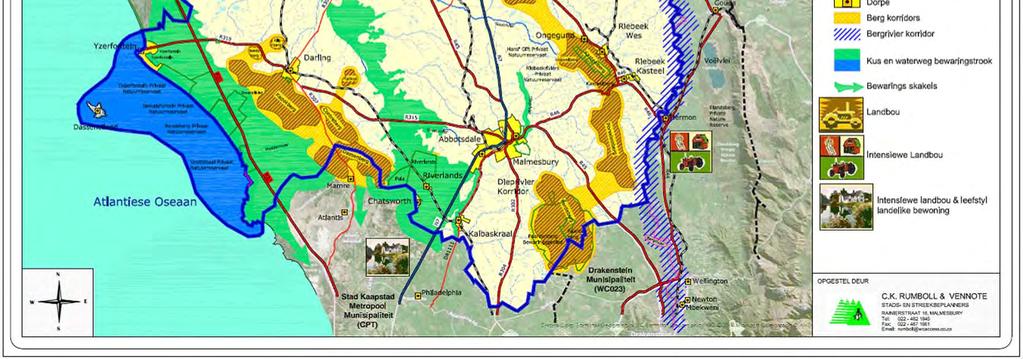
48 40 Integrated Development Plan for
49 Agriculture is one of the main economic sectors in Swartland with connectivity with most of the surrounding municipalities. The activities that occur across the boundaries include extensive agriculture towards the north (Saldanha) and north east (Bergrivier municipality) and more intensive forms of agriculture along the south eastern areas that border Drakenstein. A higher intensity of agricultural uses, such as intensive poultry farms, exists on the southern boundary and into the Cape Town metropolitan area with high connectivity to the markets in the metropole. This intensive rural corridor to the south is further supported by various higher density residential smallholding areas. The West Coast Conservation Corridor that is proposed along the West Coast runs from the West Coast National Park on the northern boundary (Saldanha Municipality) along the Swartland coastline towards the south to the Blaauwberg Conservancy in the Cape Metropolitan area. This forms an important conservation corridor along the West Coast and will provide a conservation link between the three municipal areas involved. Mountain Corridors Swartland municipal area include part of the Darling Hills mountain range inland from the West Coast, which also transgress into the Cape metropolitan area towards the south. This forms an important topographical range along the West Coast in terms of conservation and heritage resources. Another important mountain corridor is located along the eastern side of the Swartland, starting with the Koringberg koppie in the north meandering along the eastern side of the Swartland towards the south also including Tontelberg, Kanonberg, Kasteelberg (Riebeek Valley), Porseleinberg and Perdeberg in the south that falls partly within the Drakenstein municipal area. The Groenrivier corridor along the river in the central area of the Swartland also link with the Cape metropolitan area to the south. (d) NEW DEVELOPMENT AREAS AND DEVELOPMENTS The SDF provides the following directives for the various precincts: Urban precinct The urban precinct comprises of mixed use, residential, business and industrial areas supported by social and bulk infrastructure. The following are proposed: Provide and maintain social infrastructure particularly in Wesbank, Ilinge Lethu, Darling, between Esterhof and Riebeek Kasteel, between Hooikraal, Rosenhof and Moorreesburg, Chatsworth and Riverlands. Provide sufficient bulk infrastructure and services according to development potential of towns: o Electricity: Malmesbury o Water: Yzerfontein, Darling, Koringberg, Riebeek Valley and Malmesbury o Sewerage: Yzerfontein, Darling, Koringberg, Riebeek Valley, Malmesbury, Riverlands and Kalbaskraal Expand residential precincts and provide sufficient integrated housing options according to development potential of towns. Protect and strengthen the cultural and heritage landscape. Promote open space networks including conservation of waterways, Diep River, Platklip, No Go, Darling River, within urban areas with accompanying walkways and cycle paths. Implementation of the first Regional Socio-Economic Program (RSEP) project, which form part of the Violence Prevention through Urban Upgrade (VPUU) program, in Malmesbury to provide the platform for safe and viable economic development opportunities in the previously disadvantaged communities. MAIN STREETS Landscape and redesign main streets to include cycle ways, pedestrian walkways, landscaping and urban design. Integrated Development Plan for
50 CORE URBAN AREAS Enhance core urban areas based on a sense of place, the economic base of the settlement and investment priorities. HOUSING STOCK (Strategy 11) Promote inclusive housing in all developments. Change zoning scheme to support integrated development concept to ensure mixed densities. Earmark Malmesbury (Saamstaan, Ilinge Lethu), Darling, Moorreesburg, Riebeek West and Abbotsdale for subsidised housing projects. Subsidised projects should provide for farm workers. DENSIFICATION Densify within urban core, lower densities on periphery. Work towards densification benchmarks per hectare based on settlement character. Abbotsdale Chatsworth Darling Kalbaskraal Koringberg Malmesbury, Wesbank, Ilinge Lethu Moorreesburg, Hooikraal Riebeek Kasteel Riebeek West, Ongegund Riverlands Yzerfontein 20y y Development of vacant land within the urban edge as per predetermined categories. Consult the Swartland Vacant Land Audit (completed for all the Swartland towns as part of the BESP programme and incorporated in the revision of the Swartland SDF during 2014/2015) for identified areas and the development potential and constraints of these areas. URBAN EDGE AND FUTURE GROWTH DIRECTIONS Urban and settlement edges to maintain critical Swartland character. (Figure 4) Enhance integration and restructuring through densification and urban edge delineation. Agricultural Precinct (Strategy 2) The agricultural precinct comprises of Sandveld sowing and grazing area (Area 14), Koringberg-Rooi Karoo dry land sowing area (Area 15), Koppiesveld, Middle-Swartland sowing area (Area 16), Koeberg, Contreberg, Malmesbury and Voorberg area (Area 17); Paardeberg and Riebeek Valley mixed farming area (Area 18). The following are proposed: Enhance agriculture as significant cultural landscape and gateway into Swartland. Introduce a rural development corridor along N7. Manage environmental and agricultural resources responsibly: o Protect conservation worthy vegetation and natural habitats 42 Integrated Development Plan for
51 o Conserve water resources and catchment areas o Reduce surface and groundwater pollution - allow the Hydrology study of the Swartland, which was conducted as part of the Swartland SDF 2014/2015 revision, to inform decision making regarding potential impact to Aquifers, water catchments, groundwater and related issues in the Swartland. o Manage Steep Slopes and Elevated Areas Enhance food security on different cadastral scales. Support the development of renewable energy resources in the Swartland according to the different renewable energy resources zones that was identified as part of the Swartland SDF revision during 2014/2015. Identify and develop viable land reform (Strategy 12) Provide and support sustainable rural infrastructure and services (Strategy 13). Support effective rural development through the implementation and assistance of the Comprehensive Rural Development Programme (CRDP) initiative of National Government. Do the necessary planning to allow for the required response actions by the Municipality to address climate change vulnerabilities in the Swartland as was identified in a study by Royal Haskoning DHV as part of the revision of the Swartland SDF 2014/2015. In order to address the vulnerabilities in the Swartland Municipality can take certain actions in response to the areas of concern as set out in the above mentioned report. The Municipal responsibilities might include: Municipality to create opportunities and facilitate diversification of economic activities; Spatial planning and building plan approval to protect biodiversity; Municipality should be pro-active to identify alternative water resources, provide incentives for economic activities, adopt technology to allow for use of renewable energy resources and create an environment that is favourable for entrepreneurs; Municipality to implement disaster risk management regulations to address potential future risks related to climate change vulnerabilities. Support water re-use and recycling initiatives; Disincentives in water-intensive activities; Work together with conservation authorities to implement fine scale biodiversity planning in spatial and development planning and identify conservation areas. Improve access to basic services and improve the reliability of supply through the proactive process of identification of alternative resource supply sources, funding schemes and more efficient and environmentally friendly technologies. Natural/Conservation Precinct (Strategy 6) The natural/conservation precinct comprises the Aprilskloof, Kasteelberg, and Riverlands Nature reserve and several private nature reserves along the West Coast. The following are proposed: Protect and strengthen the natural and built environment. Regulate rural development according to bio regional planning initiatives. Permit diversification of land use to provide for promotion of tourism (e.g. eco- and adventure tourism including information centres, overnight accommodation, restaurants, environmental education centres, parking areas, ablution facilities, etc.) Protect and strengthen the visual landscape Integrated Development Plan for
52 CONSERVANCIES Foster voluntary co-operative environmental management through the establishment of conservancies (e.g. Aprilskloof and Riebeek River Conservancy) to protect fynbos remnants, ecological corridors (e.g. Groen, Diep and Berg River) and linkages. DEVELOPMENT LINE Establish, on a case-by-case (i.e. property-by-property) basis, a development line1 to determine the boundary between the agricultural use area and the natural area (i.e. steep mountain-side) within the agricultural and natural precincts. HERITAGE AREAS (Strategy 7) Protect the built environment. Buildings of historic value as per heritage study to become core informants of architectural and landscape guidelines. Consult the Heritage Survey that was completed for the rural areas of the Swartland as part of the SDF revision of 2014/2015 to ensure the continued conservation of the heritage resources in the rural areas. ECOLOGICAL CORRIDORS (Strategy 6) Establish ecological corridors and linkages with sufficient fire breaks, along and between conservation worthy elements, such as: Along rivers and water courses (Groen, Diep and Berg River) implement no development ecological setbacks: o 1:50 and 1:100 year flood-lines o A meter buffer zone from the bank of the river, depending on ecological status of river Remnants and core flora linkages (Kasteelberg, River lands, Pela, Yzerfontein, Paardeberg Nature Reserve). Mountains and hills (Koringberg, Kasteelberg, Porseleinberg and Paardeberg; Darling Hills and Dassenberg). Along the West Coast from southern municipal boundary to northern municipal boundary. Along all road reserves through promotion of indigenous planting or protection of existing indigenous vegetation or tree-lines (e.g. Eucalyptus Trees). In urban areas within urban edge, conserve open spaces and corridors (Malmesbury, Moorreesburg, Darling, and Kalbaskraal) ensure sufficient buffer space to protect water and wetland systems and remove alien vegetation. Coastal Precinct (Strategy 6) The coastal precinct comprises the total coastline, including Dassen Island, crossing the R27 to the Darling Hills. The following is proposed: Permit diversification from agricultural use to provide for promotion of tourism (e.g. eco- and adventure tourism including information centres, overnight accommodation, restaurants, environmental education centres, parking areas, ablution facilities, etc.) and conservation of the coastline. Consult the Coastal Management lines that were prepared for the West Coast district and included in the revision of the Swartland SDF 2014/2015, for development along the coastal areas to allow for responsible coastal management. 1 In accordance with criteria as per Guideline for the Management of Development on Mountains, Hills and Ridges of the Western Cape, 2002 (Western Cape Department of Environment and Cultural Affairs and Sport) 44 Integrated Development Plan for
53 (e) CROSS CUTTING ISSUES Bulk Infrastructure and Services (Strategy 13) Execute municipal core function forming the backbone of the Swartland economy: Provide bulk infrastructure and services according to industrial growth potential of towns and according to Human Settlement Plan and Residential expansion proposed as per urban edge determination. Movement networks and Public Transport (Strategy 5) Transport networks and modes determine accessibility. Transport should be accessible to all as it is an important factor in the economic viability of the region, bringing people to their place of work, education and amenities needed to support the community. GATEWAY AREAS Swartland have five gateways into the municipal area which should be treated as follows: R27 south and north keep natural veldt character N7 north keep agricultural character N7 south introduce agricultural development corridor character N7 between Cape Town and Malmesbury is currently being upgraded to a dual carriageway Hermon/R45 introduce agricultural development node character URBAN AREA Use main and connector routes to integrate previously segregated areas through economic opportunities that are more accessible. Provide supportive pedestrian walkways and crossovers to support economic activities and to strengthen integration. RURAL AREA Roadside developments to adhere to development guidelines i.e. set-back lines, uniform signage and roadway reserves (indigenous vegetation corridors). Local Economic Development (Strategy 1) Facilitate economic development in urban areas: By the creation of secondary nodes within the previously segregated areas of Koringberg, Wesbank, Ilingelethu, Moorreesburg and Darling. Through the implementation of the Regional Socio-Economic Programme (RSEP) where economic and social development is encouraged along identified activity routes and nodes in previously disadvantaged communities, to visually enhance these areas and to create safe viable economic nodes within these areas. Integrated Development Plan for
54 Abbotsdale Chatsworth Darling Kalbaskraal Koringberg Malmesbury Moorreesburg Riebeek-Kasteel Riebeek-Wes Riverlands Yzerfontein Location Strengthen existing node (SEN) SEN Darling North SEN Rautenville Wesbank, Ilinge Lethu Rosenhof Esterhof SEN SEN SEN Create opportunities for formal and informal economic activities such as house and spaza shops and informal markets. Improve transport routes between central business area and segregated residential areas: Wesbank and Malmesbury; Esterhof and Riebeek Kasteel, Moorreesburg and Rosenhof, Darling and Darling North). Create economic opportunities within main activity axis and connector routes i.e. connector between Malmesbury and Wesbank, Riebeek Kasteel and Esterhof and Moorreesburg and Hooikraal. Be supportive to alternative zonings within poorer communities. Facilitate economic growth and development in rural areas: Strengthen growth in areas with economic potential i.e. Riebeek Valley, Moorreesburg, Malmesbury, Darling and N7 rural development corridor. Enhance the agri-industry i.e. agri-processing of on-farm produced products and agri-business in Riebeek Valley, Moorreesburg, Darling and N7 rural development corridor. Grow and diversify agricultural markets and products. Strengthen and develop rural tourism in Koringberg, Riebeek Valley, Darling, Yzerfontein, Riverlands and Chatsworth and Kalbaskraal. Strengthen mobility and economic linkages form East to West (Hermon to Yzerfontein). Industrial Development (Strategy 3) Swartland is strategically located to the Cape Metropole, Cape Winelands and Vredenburg Saldanha area and accessible on the N7, R27 and the R45. The N7 corridor between Malmesbury and the Cape Metropole holds extensive economic benefits. The optimal use of the location of Swartland should be supported by: Expanding industrial precincts in Malmesbury, Moorreesburg, Darling and Riebeek Wes. Locating new industrial areas within walkable distances from residential areas. Providing sufficient infrastructure and services in accordance with industrial growth potential. Supporting sustainable mining development. 46 Integrated Development Plan for
55 Tourism Development (Strategy 4) Incorporate the following tourism strategies in the spatial proposals: Expand existing sources in Swartland i.e. Riebeek Valley, Darling, Koringberg, Riverlands, Chatsworth and Kalbaskraal; Opportunities to be accessible to majority of Swartlanders; Create and promote opportunities (i.e. guest farms, recreation accommodation, resorts) in rural Swartland (wine route, wheat route, Swartland Meander, West Coast Nature Reserve route, Mission station route, Flower route, Agricultural landscape route); Identify specific tourism opportunities in each town and maximize the use of such opportunities through effective marketing; Maintain and upgrade existing tourism roads and services between settlements (i.e. Darling and Malmesbury). Define focus areas for eco-tourism purposes (e.g. information, accommodation, etc.). Integrated Development Plan for
56 48 Integrated Development Plan for


57 Integrated Development Plan for

58 50 Integrated Development Plan for


59 Integrated Development Plan for

60 52 Integrated Development Plan for


61 Integrated Development Plan for

62 54 Integrated Development Plan for

63 Locality of Major Aquifers in the Swartland Region Integrated Development Plan for


64 56 Integrated Development Plan for

65 Integrated Development Plan for

66 58 Integrated Development Plan for
67 5.2 Long Term Financial Plan [replaced on 26 May 2016] A new Long Term Financial Plan was approved by Council on 26 November The recommendations made throughout the Plan are summarised in Section 11. RECOMMENDATIONS FROM THE LONG TERM FINANCIAL STRATEGY NOTE: The sections below refer to the Approved LTFP available at the Department of Financial Services of the Municipality Strategies should be developed to eradicate infrastructure backlogs and current shortage in housing (Sections 2 and 3). Strategies should be developed to ensure the GDP growth remains in line with the rapid growth in population numbers. The increase in the unemployment rate should also be addressed (Section 3). The declining trend in profit percentage derived from electricity services should be corrected by reviewing the tariffs structure and/or by employing cost cutting measures. Possible reduction in distribution losses (which is already very low) or internal consumption (Section 4.2.1). The Water Service is currently operating at a loss which implies that the tariffs are not cost reflective. The entire tariff structure for water should be reviewed. Step tariffs and basic fees (which are currently not charged) are among the alternatives to consider. It should also be noted that that the water charges of Swartland Municipality are currently significantly lower than its major peers. Thus, there is some scope available to increase water charges to a level that is acceptable when compared to other major municipalities (Section 4.2.2). The municipality must investigate why the collection rate of fines are relatively low compared to its major peers. Appropriate measure must be implemented to improve the collection rate of fines (Section 4.4). Further increases in Employee Related Cost, over and above the current levels, should be managed to ensure that this major line item remain within the set limits (Section 5.1). The municipality should review the capital program (and funding sources) to ensure that it does not negatively impact on the sustainability of the municipality. Alternatives to explore include the following (Section 8): o Raise more loans to fund the program. This will require a further study into the level of external funding the municipality can afford (Refer to Section 9); o Cut back on operational expenditure and/or increase internal revenue sources; o Explore further avenues to obtain more grant funding (keeping in mind the additional maintenance expenditure that will still be the liability of the municipality even though the additional acquisition is financed from external sources); and/or o Reduce the capital program to ensure that it is affordable within the limitations of the current structure the municipality is operating in. Depreciation charges recognised in statement of financial performance is currently not cash backed. Thus, assets are being consumed while no cash provision is made to replace assets in future. The municipality should strive to make a contribution to the Capital Replacement Reserve in line with the annual depreciation charge recognised. Strategies should be employed to increase the average useful life of asset. Strategies could include the following (Section 8): o Ensure sufficient levels of funding is allocated to the upkeep of assets (i.e. repairs and maintenance); o Ensure sufficient allocations are made to the renewal/replacement of assets at levels to be determined by the municipality. The renewal/replacement program employed by the municipality should lengthen the average useful life of assets. Integrated Development Plan for
68 Strategies should be developed to mitigate the potential negative financial impact that the transfer of the bulk water service function from the West Coast District Municipality could have on the municipality. The current debt ceiling of the municipality will not accommodate any further material external debt. (Section 9) Cash levels should be maintained at acceptable levels to allow for reserves (i.e. Capital Replacement- and Employee Benefit Reserve) to be created in line with the funding and reserve policy of the municipality. (Section 9) STRATEGIES WHICH SHOULD GUIDE THE BUDGET PROCESS To address the concerns above, Swartland Municipality developed the following strategies which should guide the budget process over the next MTREF period: Concerns Current status Actions Required Target Funding of Infrastructure backlogs Currently new roads are being built Existing infrastructure should be maintained as Norm = 7.5% - 8% instead of maintaining existing infrastructure. a high priority. Speed up routine maintenance to temporarily stop the deterioration of roads and storm water Shortage in Housing GDP growth remains in line with the rapid growth in population numbers. People receiving low cost housing cannot Annual review of the integrated human Annually by May afford to pay for services and qualify for subsidy. Scope for additional equitable settlement plan. Housing pipeline revised. Annually by April share subsidies is limited. Grant funding from government is inadequate for housing demand NOTE: Social housing can only be developed by means of grant funding. Encourage, market and facilitate development of high level housing for residents who can afford to pay for services. (e.g. GAP housing). Sourcing grant funding for the external services of social housing as well. Glen Lilly, Mount Royal, etc. Marketing Plan for Swartland. By June 2017 Marketing of Swartland to attract new economic development - popularised during 2016/ Integrated Development Plan for
69 Concerns Current status Actions Required Target Investigate ways to lower internal consumption of electricity Energy efficient streetlights have been installed. Investigating further measures to lower internal Annually by March usage of electricity, including generation options. All new projects, upgrading and refurbishment must incorporate energy efficiency technologies and measures. Apply for external Energy Efficiency and Demand Side Management funding, upon invitation from Department of Energy. Address the increase in unemployment rate Water Service is currently operating at a loss which implies that the tariffs are not cost reflective. The entire tariff structure for water should be reviewed. During 2014 a new McDonald s and a new West Coast College Campus were established in Malmesbury and major expansions took place at SASKO. Currently basic charges for water are not charged for. Water charges of SM are currently significantly lower than its major peers. Encourage, market and facilitate existing developments with services to increase uptake. Facilitate new businesses to establish in the area - Report to the Mayoral Committee on the number of engagements with potential investors and stakeholders to bring growth to the area and the number of successes. Infrastructure capacity to be available to accommodate development applications. Develop and market SM s industrial areas and infrastructure, to attract businesses from Cape Town and surrounding towns. Evaluate the result of the use of the water demand management devices by comparing the outstanding debt before and after implementation of the daily restrictions. NOTE: In the 2015/16 MTREF budget SM decreased the 6kl free water for all households to 5kl and eventually will phase it out to zero. This will automatically affect the current step tariffs and will be reviewed Annually by June By June 2017 Integrated Development Plan for
70 Concerns Current status Actions Required Target Investigate why the collection rate of Fines are relatively low compared to its major peers. Employee Related Cost, over and above the current levels, should be managed The municipality should review the capital program (and funding sources) to ensure that it does not negatively impact on the sustainability of the municipality. Increase the average useful life of asset. An automatic Number Plate Recognition Vehicle has recently been acquired in Swartland and especially useful when having roadblocks. Currently in process to finalize the having credit and debit card pay points at the different cashiers. Admin mark on E-NATIS, refers to when someone wants to renew a license and the system shows that the person have outstanding fines, etc. Departments must get approval from management to fill posts that become vacant. Due to a lack of cash, very little provision could be made available for the replacement of moveable assets such as vehicles and equipment for the next three years (2015/16 MTREF). Establish a Municipal Court. By June 2017 Regular meetings with Justice and Prosecutor regarding the reduction of unpaid fines. Extra efforts with the execution of warrants. Strictly monitoring and minimizing officer errors by providing the necessary training. NOTE: Be prepared to pay the telephone cost when doing extra by phoning the people with outstanding warrants. Consider scaling down or shutting down auxiliary non-core services. NOTE: Middle management and upwards should also be considered for curtailment and not only lower level employees, which will often affect service delivery directly. Investigate an asset management programme. Reduce the capital program and limit to revenue generating projects to ensure financial sustainability. Annual contribution to the CRR is vital. Prioritize projects and do not neglect the core services and replacement of equipment and assets. Cut back on operational expenditure where possible. Explore further avenues to obtain more grant funding (keeping in mind the additional maintenance expenditure that will still be the liability of the municipality even though the additional acquisition is financed from external sources). Do a thorough inspection of the current assets and fleet to prioritize replacements in the 2016/17 MTREF budget that is essential for service delivery. Norm = 25% - 40% 2014/15 was 27.96% By June Integrated Development Plan for
71 Concerns Current status Actions Required Target Mitigate the potential negative Transfer of bulk water infrastructure assets In order to avoid having to increase the water By June 2017 financial impact that the transfer of from West Coast District Municipality to tariffs over and above the normal increase, the the bulk water service function from Swartland Municipality. the West Coast District Municipality purchase tariff of bulk water must be reduced by WCDM commensurate with the increased cost incurred by Swartland Municipality to pay back the loan. Cash levels should be maintained at acceptable levels to allow for reserves Secure new sources of revenue E.g. annual redemption of loan of R70m over 8% is R9.8million, therefore bulk water purchase tariff to be reduced by 39% to break even. Cash / Cost Coverage Ratio (Excl. Unspent Investigate possible sliding scales for the rent Conditional Grants) tariffs in respect of municipal flats. Norm = 1 3 months 2013/14 6 months 2014/15 6 months Actual Operating Revenue / Budget Operating Revenue Norm = 95% - 100% 2013/ % 2014/ % Secure a cash-funded budget for the 2016 MTREF budget. The policy relating to capital contributions should be scrutinised to ensure that the municipality does not subsidise developers in terms of infrastructure developments. Spend more money on income generated services. Recover operational cost from grants and subsidies or source grants for the operational expenditure i.e. if new sport facilities are built from grant funding. By June 2016 Annually reviewed Integrated Development Plan for
72 5.3 Disaster Management Plan (a) INTRODUCTION Disaster Management has its origin in civil defence which started during the Second World War when communities organised themselves to protect their properties and lives. Since then it evolved into more formal civil defence structures, but always with the emphasis on response. For example, during the 1969 earthquake in Tulbagh and the 1981 flood in Laingsburg, the Defence Force was primarily responsible for the response to the disasters. After the 1994 flood in the Cape Flats, legislation was revised in order to put the emphasis on prevention rather than response. As a result the Disaster Management Act was promulgated in (b) LEGISLATION Three main pieces of legislation regulate Disaster Management in South Africa: The Disaster Management Act (2002) The National Framework on Disaster Management (2005) The Disaster Management Regulations (2005) Disaster Management Volunteer Regulations (2010) From this legislation subsequent policies were drawn up for the West Coast which include the Swartland Municipal area: 1. The Disaster Management Risk Assessment (April 2006) 2. The West Coast Disaster Management Framework (June 2006). The framework consists of four key performance indicators: Institutional capacity Risk assessment Risk reduction Response and recovery and three enablers: Information and communication Training, Education and Awareness Funding (c) THE CORPORATE DISASTER MANAGEMENT PLAN The Corporate Disaster Management Plan is the single disaster management plan for a municipal area called for in Section 53 of the Disaster Management Act: Each municipality must, within the applicable municipal disaster management framework prepare a disaster management plan for its area according to the circumstances prevailing in the area This plan refers to the Municipality (the business) and not the Municipality (the community). In this plan each line function within the municipality will be given specific tasks during a disaster e.g. Finance: to assist with emergency procurement; Human Resources: to employ temporary staff to assist with tasks. The Corporate Disaster Management plan is closely linked to job descriptions of each staff member. 64 Integrated Development Plan for
73 (d) DISASTER MANAGEMENT FRAMEWORK (JUNE 2006) Since the Risk Assessment indicated what was threatening the West Coast and inter alia the Swartland, a framework was developed to strategically address the risks based on the National and Provincial Frameworks. This framework will be updated during the 2012/13 budget year as part of a joint venture between the Provincial Disaster Management Centre and the West Coast Disaster Management Centre as a pilot project for the Western Cape. The complete document is available on the website. The Swartland Municipality has to prepare and execute its disaster management plan within the disaster management framework of the West Coast District Municipality. (e) LINKAGE WITH THE INTEGRATED DEVELOPMENT PLAN OF THE SWARTLAND MUNICIPALITY Both the Municipal Systems Act and the Disaster Management Act require the inclusion of a Disaster Management Plan into the IDP of the Municipality. It would however not be practical to include the complete Disaster Management Plan with all its annexures. The complete plan can therefore be considered as an annexure to the IDP, while a brief summary of the document will be included in the IDP. It is our aim to include disaster risk management in the planning and execution stages of all IDP projects. This will ensure the integration of disaster management into the IDP and will ensure that all plans and projects are focused on contributing to disaster risk reduction and disaster preparedness - thus reducing the impact of disasters on lives, property, community activities, the economy and the environment in the Swartland Municipality. Swartland has its own Disaster Management plan linked to that of the West Coast District Plan. This plan has to be updated during the 2012 /2013 budget year. From the Disaster Management Plan line functions can draw up their own plans and standard operating procedures (SOP's). (f) STANDARD OPERATING PROCEDURES From the Disaster Management plan and the subsequent risk specific plan, each line function that is involved draws up its own procedures to address the various component of the plan. This is done by using a list of instructions that is called standard operating procedures. (g) DISASTER MANAGEMENT CENTRE The West Coast Disaster Management Centre was opened in September The building is located in Moorreesburg. It provides a 24 hour call taking and dispatch facility. An organisational facility is also available that is not only used as a Joint Operation Centre (JOC) during disasters, but also as a venue for planning sessions outside disaster periods. A tactical facility is available as well as offices for various emergency services. The aim is to make it a one stop centre for all incident reporting. This centre is a big advantage to the Swartland Municipality as it is too costly for Swartland to have its own disaster management centre. (h) WHEN IS IT A DISASTER? Disaster means a progressive or sudden, widespread or localised, natural or human-caused occurrence which causes of threatens to cause death, injury or disease, damage to property, infrastructure of the environment, or disruption of the life of a community and is of a magnitude that exceeds the ability of those affected by the disaster to cope with its effects using only their own resources. (Disaster Management Act) In practice this means that when a municipality has reached the end of its own capacity or capability it may declare a local disaster. When a district then gets involved and more than one municipality is involved, a district disaster may be declared. If more than one district has reached its capacity, a provincial disaster may be declared. Integrated Development Plan for
74 (i) DISASTER MANAGEMENT IN THE SWARTLAND The Municipal Disaster Management Plan of Swartland Municipality ( June 2007) consists of the components as indicated in the figure below. Integrated Development Plan (IDP) Swartland Municipality Municipal Disaster Management Plan Disaster Management Framework (WC) Institutional Arrangements for Disaster Management Risk Assessment & Risk Profile Disaster Risk Reduction Plan Early Warning & Preparedness Disaster Preparedness Plan Response & Relief Recovery & Rehabilitation Annexures & References Risk- Specific Plans Discipline Preparedness Plans Other Local Municipality Disaster Management Plans Stakeholder Contact Details List Emergency Notification & Activation Contact List Installation, Facility, event Plans Standard Operating Procedures / Field Operations Guidelines Preparedness Plans Please note: Yellow blocks indicate the core Municipal Disaster Management Plan to be submitted for inclusion in the Municipal IDP (j) RISK ASSESSMENT The West Coast disaster management risk assessment was done in April This assessment indicated the total risk for the West Coast District but also specific risks that were present within each local municipality. The complete document is available on The following disaster risks for the Swartland Municipal area were identified during this assessment process and these risks require preparedness plans: Fire Drought Floods (Severe weather) Road Accidents 66 Integrated Development Plan for
75 Wind HIV/Aids TB The tables below summarize the data received and indicate where either risk reduction and/or preparedness planning is needed. Swartland Municipality Risk prioritisation table Hazard Exposure Severity Probability Actions needed Fires Continuous Moderate Likely Risk reduction interventions and preparedness planning Drought Occasional Extreme Normal Preparedness planning Floods Occasional Insignificant Normal Preparedness planning Tornado Seldom Moderate Unlikely Preparedness planning Risk manageability detail Hazard Awareness Legislative Framework Early warning systems Government response Government resources Existing risk reduction measures Public participation Municipal management capabilities Drought Good Modest Good Modest Modest Modest Modest Modest Floods Modest Modest Modest Modest Modest Good Modest Good Tornado Modest Modest Poor Modest Modest Modest Good Modest Fires Good Modest Modest Poor Poor Modest Modest Modest Relative risk priorities table Hazard Total risk Total risk Relative risk manageability priority Actions needed Drought Tolerable High Safe Preparedness planning Floods Safe High Safe Preparedness planning Tornado Safe Modest Safe Preparedness planning Fires Destructive Modest Tolerable Risk reduction interventions and preparedness planning Integrated Development Plan for
76 West Coast District Municipality Risk prioritisation table Hazard Exposure Severity Probability Actions needed Fires Occasional Moderate Normal Preparedness planning Risk manageability detail Hazard Awareness Legislative Framework Early warning systems Government response Government resources Existing risk reduction measures Public participation Municipal management capabilities Fires Modest Modest Modest Modest Poor Modest Modest Poor Relative risk priorities table Total risk Relative risk Hazard Total risk Actions needed manageability priority Fires Tolerable Modest Safe Preparedness planning (k) NEW RISKS New risks are surfacing all the time. These must still be accommodated in a new risk assessment, e.g.: African Horse Sickness (the West Coast used to be a buffer zone) Municipal elections (l) New Castle Disease Renewable energy sources, e.g. wind farms Rift Valley Fever (Slenkdalkoors) people died as well Social Conflict Urbanisation (Malmesbury according to the Spatial Development Framework) SHARED RESPONSIBILITY FOR DISASTER MANAGEMENT The responsibility for reducing disaster risk, preparing for disasters and responding to disasters is shared among all departments and employees of the Swartland Municipality, all departments and employees of the West Coast District Municipality with service delivery responsibilities within Swartland, all provincial and national organs of state operating within Swartland, all sectors of society within the municipality and perhaps most importantly, all the residents of the municipality. 68 Integrated Development Plan for


77 (m) NODAL POINT FOR DISASTER MANAGEMENT Although the Protection Services Department is assigned with the Disaster Management function and should direct and facilitate the disaster risk management process, it cannot perform the whole spectrum of disaster risk management activities on its own. Disaster risk management is everybody s business. Therefore it is required that each municipal department assigns a person or section within the department to be the nodal point for disaster management activities in that department. The same applies to national and provincial departments operating within the municipality. This activities to be performed within the departments include participation in disaster risk reduction as well as preparedness and response. (n) FUNDING The success and implementation of all the above planning is dependent on adequate funding and the identification of the sources of funding. Funding to reduce risks, to prepare for and respond to disasters should be made available. The figures below indicate how the disaster management plan fits in with the IDP. Integrated Development Plan for
78 CHAPTER 6: STATUS QUO 6.1 Current reality (a) SERVICES BACKLOGS (SEE AREA PLANS FOR DETAIL) [updated on 26 May 2016] Town Moorreesburg WWTW must be upgraded, not sufficient treatment capacity and the infrastructure is obsolete resulting in high maintenance costs and poor performance. Koringberg Riebeek West, Riebeek Kasteel and Ongegund Services and backlogs Sewerage Water Storm water Electricity Streets Obsolete infrastructure, Maintenance to No-Go Replacement of pipe breakages, leaking River. obsolete infrastructure valves, leaking hydrants. Regular blockages and including switchgear and Poorly developed flooding in Rosenhof. low voltage networks. network, shortage in Upgrading of system in Eskom supply capacity shut-off valves. the vicinity of Royal can be increased upon Secondary Chlorination street. application. at reservoirs must be implemented. Sewer reticulation network poorly developed and must be extended. Waste Water Treatment Works is overloaded and must be upgraded. Water borne sewage system must be extended in Riebeek West. Poorly developed network, small diameter pipes, low pressure and flow condition and open ring mains. Sections of the water reticulation network are obsolete and must be upgraded. Secondary Chlorination at reservoirs must be implemented. Poorly developed network, small diameter pipes, low pressure and flow condition and open ring mains. Sections of the water reticulation network are obsolete and must be upgraded. Secondary Chlorination No formal piped storm water drainage system. Many channels are unlined causing erosion and maintenance problems. Poorly developed infrastructure, regular flooding in the surroundings of Dennehof Street and Esterhof. Eskom area of supply. Street lighting inadequate. Eskom area of supply. PPC town s network, capacity for development is limited. Street lighting inadequate. Backlog in resealing program, deterioration of road infrastructure. Backlog in resealing program, deterioration of road infrastructure. Many roads are not constructed with kerbstone and formal sidewalks. Backlog on resealing program, deterioration of road infrastructure. Many roads are not constructed with kerbstone and formal sidewalks. 70 Integrated Development Plan for
79 Darling Town Yzerfontein Riverlands and Chatsworth Services and backlogs Sewerage Water Storm water Electricity Streets at reservoirs must be implemented. Poor condition of Ongegund reservoir and pump station must be upgraded. Regular blockages in Darling North. Waste water treatment works must be upgraded to supply future demand. Water borne sewage system must be extended to the industrial area. Yzerfontein has no formal waste water treatment works with no water borne sewer system. Water borne sewer system must be extended in Chatsworth. WWTW must be upgraded. Poorly developed network, small diameter pipes, low pressure and flow condition and open ring mains. Sections of the water reticulation network are obsolete and must be upgraded. Reservoir capacity must be increased for further developments. Water supply to the industrial area must be increased to supply future demand. Secondary Chlorination at reservoirs must be implemented. Bulk supply system cannot supply in the demand during peak months. Water supply is under pressure due to illegal Poorly developed system in Darling, upgrading of open channels along streets. Many areas have no formal piped system. Many channels are unlined causing erosion and maintenance problems. Poorly developed system in the area of Carter Street, Buitekant Street, 6th Avenue and Felicia Crescent. Formal system limited to housing projects and 5 th Avenue Chatsworth. Regular flooding of residences and erven. Upgrading of storm Replacement of obsolete infrastructure including switchgear, mini- substations and low voltage networks. Development in Yzerfontein subject to: - Eskom application for increased capacity - 2nd supply line and cable. Only smaller developments may continue in the short term. Eskom area of supply. Street lighting inadequate. Backlog of resealing program, deterioration of road infrastructure. Many roads are not constructed with kerbstone and formal sidewalks. Backlog of resealing program, deterioration of road infrastructure. Upgrading of gravel roads. Construction of a bus route in Chatsworth. Integrated Development Plan for
80 Town Kalbaskraal and Abbotsdale Malmesbury Services and backlogs Sewerage Water Storm water Electricity Streets connections and wasteful use of water. water infrastructure (Chatsworth). Reservoir capacity in No formal piped storm Eskom area of supply. Upgrading of gravel must be increased for water drainage system. Street lighting roads. new developments. Channels are not lined inadequate. Secondary Chlorination causing erosion and at reservoirs must be maintenance problems. implemented. Sections of the water Backlog of resealing reticulation network are program, deterioration obsolete and must be of road infrastructure. upgraded. Upgrading of Bokomo / Storage capacity must Voortrekker Road be increased for further intersection. developments. Upgrading of Piketberg / Secondary Chlorination Voortrekker Road at reservoirs must be intersection. implemented. Water borne sewer system must be extended in Kalbaskraal. Sewerage connector in Wesbank in the area of Wistaria Street is under pressure and must be upgraded for further developments. Obsolete infrastructure causing regular blockages. Upgrading of main connectors in Voortrekker Street from swimming pool to Bokomo Road. Maintenance to Ilinge Lethu and Wesbank system, regular blockages. Channel under Voortrekker Street, from post office to Bokomo road. Retention structure in river north of the swimming pool. Maintenance on Diepand Platteklip rivers. Sections of the storm water drainage system are obsolete and must be upgraded. Projects for the upgrading of supply capacity commissioned to make provision for proposed Klipfontein developments. Projects for the upgrading of supply capacity to make provision for the Schoonspruit industrial and De Hoop residential developments to be implemented. Replacement of obsolete infrastructure including switchgear, mini- substations and low voltage networks. 72 Integrated Development Plan for
81 (b) INDIGENT HOUSEHOLDS ACCESS TO FREE BASIC SERVICES [updated on 26 May 2016] In January 2016 the following figures applied to indigent households access to free basic services: Number of indigent households: Number with access to free basic water: Kilolitres per household free: 9 kl Number with access to free basic electricity: ( ) Number provided by ESKOM: KwH per household free: 50 Number with access to free basic sanitation: Number with access to free basic refuse removal: (c) PRIORITISATION OF SERVICES BY WARD COMMITTEES [amended on 30 May 2014] A prioritisation exercise was done during October 2011 with all 12 ward committees. Every ward committee member was asked to indicate on a list of functions his or her top five priorities (numbered in priority order from 1 to 5). To calculate a score per ward, weights were attached to the ratings: Priority ranking Weighted score The total weighted scores per ward are shown in the table below. If these scores are added up, it shows the priorities (from the ward committee members point of view) for the municipal area as a whole, from the highest to the lowest. Lower priorities must not be interpreted as equal to unimportant - it rather indicates that very little or no problems are experienced with those services. The high priorities however need Council s urgent focus and attention. Priority Scores W1 W2 W3 W4 W5 W6 W7 W8 W9 W10 W12 W12 TOTAL Housing Health Education Business and local economic development Public safety / law enforcement Sport and recreation Roads and storm water Community development Cemeteries Fire and emergency services Integrated Development Plan for
82 Priority Scores W1 W2 W3 W4 W5 W6 W7 W8 W9 W10 W12 W12 TOTAL Parks and public amenities Agriculture Sewerage Electricity Street lighting Conservation (natural and built environment) Public transport Refuse removal Water The five most important priorities per ward are shown below [amended on 30 May 2014]. Please note that some ward committees changed their priorities after the above-mentioned exercise, meaning that the priority order in the tables below may differ from the scores in the above-mentioned table. WARD 1 WARD 2 WARD 3 WARD 4 Roads and storm water Housing Housing Education Business and local economic Business and local economic Health Cemeteries development development Housing Education Sport and recreation Health Education Parks and public amenities Cemeteries Sport and recreation Health Public safety / law enforcement Parks and Public Amenities Refuse removal WARD 5 WARD 6 WARD 7 WARD 8 Traffic Circle Business and local economic Housing Safety and Crime Prevention development Public Safety and Law Enforcement Roads and storm water Cemeteries Sustainable Service Delivery Business and Local Economic Health Sport and recreation Local Economic Development Development Fire and Emergency Services Fire and emergency services Community development Create a strategy to encourage a Green movement Conservation Public safety / law enforcement Create a strategy to make Malmesbury a residential destination 74 Integrated Development Plan for
83 WARD 9 WARD 10 WARD 11 WARD 12 Housing Public safety / law enforcement Housing Community Development / Hall Education / Library Health Electricity Fire and Emergency Services Business and local economic Business and local economic Street lighting Sport and Recreation development development Sport and recreation Housing Sport and recreation Maintenance and Upgrading of infrastructure Community Development / Hall Sport and recreation Community development Public Safety (d) MAJOR RESTRAINING FACTORS The following external factors have a massive impact on the finances of the Municipality and limit sustainable service delivery: Eskom s excessive annual tariff increases of between 20% and 30% over the past four years; higher that inflation rate increases in the price of bulk water purchased by the Municipality from the West Coast District Municipality; high salary increases as determined by collective agreements on national level; the retention and attraction of skilled staff; a lack of capacity with respect to sewerage, electricity and bulk water supply; services backlogs in Ward 4 and 7; upgrading and renewal of existing infrastructure; the possible implementation of a one government service which will further paralyse service delivery; and unfunded or underfunded mandates such as libraries, museums, motor licenses, road worthy testing, learners and drivers licenses, veld fires and low cost housing. 6.2 Opportunities (a) GROWTH POTENTIAL OF TOWNS STUDY (NOVEMBER 2013) [added on 30 May 2014] Although the growth potential study was primarily developed as a decision support tool at Provincial level, it can also be applied at municipal level. The composite growth potential and socio-economic needs indices provide municipalities with an overview of the individual settlements located within each municipality contextualised relative to the rest of the Province. In conjunction with the five thematic indices it provides local and district municipalities with a clear picture of the growth potential and socio-economic needs of individual towns and settlements. This can improve understanding of municipal development priorities and needs within the broader Provincial context, and the formulation of strategies and programmes consistent with broader regional and provincial initiatives. It can potentially also support the identification of strategies extending beyond the boundaries of local or district municipalities to address broader regional opportunities and concerns. The GPS also provides a comprehensive profile for each settlement based on 85 individual indicators. The settlement profiles can be used by municipalities to identify specific strengths and weaknesses of a particular settlement. This information can inform strategies and projects aimed at addressing the weaknesses of individual settlements and optimising the strengths in order to unlock opportunities for growth and development. Integrated Development Plan for
84 The GPS determined growth potential and socio-economic needs using quantitative data (e.g. factors relating to socio-economic, economic, physicalenvironmental, infrastructure and institutional aspects). The results of the quantitative analyses were combined with qualitative information (e.g. stakeholder engagements) to identify potential interventions that might unlock latent potential within settlements and regions. The quantitative analysis of growth potential was based on two fundamental and related concepts: inherent preconditions for growth and innovation potential. Five thematic indexes were thus developed as the basis for modelling the growth preconditions (economic, physical, and infrastructure) and innovation potential (institutional and human capital) within each settlement and municipality. The analysis of growth potential must however also be framed within the context of the socio-economic needs within settlements and municipalities. A socio-economic needs index based on the methodology and criteria of a similar index developed by the Western Cape Department of Social Development at municipal and ward level was implemented at settlement level. This index is based on four thematic indexes (i.e. Household Services, Education Level, Housing Needs, and Economic Characteristics). Two variants of this index were developed: one based on real values (number of households in need) and the other on proportional values (proportion of households in need). The results of the quantitative analysis can be summarized by cross-tabulating the classification of settlements according to socio-economic needs and growth potential (see Table below). Towns and settlements in the bottom right of the table are classified as having both very high growth potential and very high socio-economic needs (expressed in absolute terms). Development and investment in these towns will thus have a significant impact to support economic growth and development, and supporting socio-economic development imperatives. Towns and settlements in the bottom left of the table are characterised by a high or very high growth potential but very low socio-economic needs. The type of investment and development in these areas are thus likely to be very different (e.g. investment in tourism infrastructure) from those in the bottom right part of the table. Towns and settlements in the top right section of the table represent areas with high or very high socio-economic needs but with limited growth potential. Towns in this category require a different type of development and investment response than the former two examples. The position of individual settlements in this table does not imply that development and investment will only take place in certain areas and not in others. What it does imply is differentiation in scale and intensity and support tailored according to the governing circumstances in each area. The situation for the Swartland towns is as follows: 76 Integrated Development Plan for
85 Table Socio-economic needs (absolute) cross-tabulated with growth potential of towns in the West Coast District Growth potential High Medium Low Very low Socio-economic needs Very low Low Medium High Very high Bitterfontein Doringbaai Kliprand Nuwerus Rietpoort Strandfontein Aurora Goedverwacht Ebenhaesar Klawer Citrusdal Graafwater Lamberts Bay Clanwilliam Koekenaap Lutzville Vredendal Redelinghuys Vanrhynsdorp Dwarskersbos Eendekuil Elandsbaai Koringberg Paternoster Yzerfontein Darling Hopefield St Helena Bay Velddrift Kalbaskraal Langebaan Piketberg Saldanha/Jacobsbaai Moorreesburg Porterville Riebeek-Kasteel/Riebeek- Wes Very high Malmesbury Vredenburg The main value of the latest Growth Potential of Towns Study (GPS3) is that it combines various, often disparate data sets in a consistent manner to produce a suite of products (maps, tables and graphs) that can be used to inform strategic decisions at various levels (e.g. provincial, regional and local). The GPS3 products should, however, not be used in isolation as it provides only one (quantitative) perspective to growth potential and socioeconomic needs. Some important aspects relating to the growth preconditions and innovation potential of settlements cannot be measured or quantified. It is, for instance, impossible to adequately quantify and model the entrepreneurial spirit of individuals or the vulnerability and resilience of communities. The economic viability of each intervention and project must consequently be assessed taking all the available information into consideration. Integrated Development Plan for
86 (b) REGIONAL SOCIO-ECONOMIC PROJECT (RSEP) [added on 30 May 2014] In January 2014 the Department of the Premier advised that Swartland Municipality had been selected as one of the municipalities to participate in the Western Cape Government s roll-out and implementation of the Regional Socio-Economic Project (RSEP). In parallel with deciding to proceed with the RSEP programme, the Provincial Cabinet also decided to proceed with another initiative known as the Violence Prevention through Urban Upgrade (VPUU) programme. The RSEP and VPUU initiatives were merged into one programme in November The municipalities of Theewaterskloof, Drakenstein, Swartland, Breede Valley and Saldanha Bay were selected to benefit from the programme. According to the Cabinet decision, the first two municipalities will benefit more from the VPUU approach, methodology and funding, while the remaining three will benefit from the RSEP funding (although the approach will also be based on the VPUU methodology). The role of the Provincial Spatial Development Framework (PSDF) in guiding the RSEP/VPUU programme has been captured in the Cabinet decision. The RSEP is aimed at utilising a whole of society approach coupled to a regional planning approach. In terms of the methodology the socio-economic characteristics of communities (regions, towns and neighbourhoods) are analysed and baseline data is established. A regional spatial approach is followed to provide context and to understand the relationships between geographical areas and the various projects. The VPUU Phase 4 project was approved as a recipient of 5 million (approximately R75 million) in funding from the German Development Bank. Provincial counter-funding to the value of R75 million has also been approved for the MTEF period. This funding is intended mainly for the RSEP municipalities. Municipalities will also be required to make a contribution. These funds are intended to be spent over the next four years, although the continuation or expansion of the Programme is anticipated. The following list represents the most important immediate/short term steps required to get the project off the ground: Finalise all agreements (time implications) Establish and resource the Project Office Engage Municipalities (RSEP municipalities to confirm their participation) Obtain agreement on scope, formulation of project plan and implementation plan Develop a matrix for the prioritisation and selection of individual projects Determine a budgeting and implementation strategy Develop a framework for monitoring and evaluation Ensure that the five municipalities make provision for RSEP/VPUU projects in their IDP s and budgets Ensure that the provincial departments make provision for RSEP/VPUU and related planning projects on their Annual Performance Plans and budgets (c) THE WIDENING OF THE N7 [revised on 30 May 2014] This project by SANRAL to double the N7 from the Melkbosstrand Road intersection in the south up to Malmesbury will be done in three phases: The first phase (7 km) is from the Melkbosstrand Road intersection up to the southern Atlantis intersection. An environmental impact study for this phase (which includes public participation) has been completed and approved. The contract for Phase 1 has been awarded and construction is currently in progress. The second phase (18 km) is from the southern Atlantis intersection up to the farm Leliefontein. Consulting engineers have already been appointed for the design of this phase. It is envisaged that construction will commence in the first half of Integrated Development Plan for
87 The third phase (11 km) is from the farm Leliefontein up to the Hopefield intersection just north of Malmesbury. The process of appointing consulting engineers for this phase has already started. It is envisaged that Phase 3 will commence in The environmental consultants have picked up certain constraints during phase 2 which can result in phases within phase 3 being advanced. Phases 2 and 3 are however subject to securing the necessary funds, purchasing of land within the road reserve and the approval of environmental impact studies. The intersections to Melkbosstrand, Atlantis and Hopefield will also be made safer. This project that will take an estimated six years to complete will undoubtedly open up new economic opportunities for Malmesbury and the Swartland. (d) NEW ROAD LINK BETWEEN THE R45 (MALMESBURY/PAARL) AND THE R45 (MALMESBURY/HOPEFIELD) In line with the national and regional planning directives for the development of the Saldanha area, the R45 has been identified by Provincial Government Western Cape (PGWC) as a possible freight route linking the Saldanha area to the N1. The existing R45 from Vredenburg via Hopefield links to the N7 north of Malmesbury. Traffic then has to passes through Malmesbury before heading eastwardly out towards Paarl. To establish a workable link from Saldanha to the N1, a bypass has been identified passing on the northern side of Malmesbury to link the R45 from west of the N7 to the intersection between the R46 and the R45 on the eastern side of the town a new section of road of approximate 6 to 8 km. The PGWC has already appointed BKS (Pty) Ltd for the planning, design and implementation of a Malmesbury bypass. The investigation and planning phase takes on average approximately two years. [Section (e) (EXTENSION OF PPC) deleted on 26 May 2016] (e) SWARTLAND REGIONAL SHOPPING MALL [revised on 28 May 2015] Swartland Municipality decided in 2007 already that the most appropriate site for a regional shopping centre is at the northern side of Malmesbury close to intersection of Voortrekker Road and the N7. The establishment of a regional shopping centre in Malmesbury is still a priority for Council and is regarded as critical to the long term development of the town being the commercial centre of the Swartland. The Council also firmly believes that the abovementioned site is still the most appropriate location for such a development. If a fully-fledged regional centre can be development, it will have the following benefits: The flow of income out of the area as a result of the commercial pull of the Metropole can be reduced. Business can be attracted from outside the area, especially from the north. Specialist services which were previously only provided by the Metropole can now be accessed in the area. The residential attractiveness of the town can be further improved, which can increase the inflow of medium to high income households. In 2011 an application to develop such a shopping centre was turned down by the Department of Environmental Affairs and Development Planning in terms of the National Environmental Act No 107 of The developer has exercised his right to appeal and gained environmental authorisation in May Final land use approval was given by Swartland Municipality early February The proposed regional shopping centre will be developed in five phases consisting of the following: Phase 1 (±10.76 ha): Regional shopping centre, parking and open space corridor (footprint of m²) Integrated Development Plan for
88 Phase 2 (±3.55 ha): Phase 3 (±2.24 ha): Phase 4 (±5.56 ha): Phase 5 (±1.05 ha): Extension to shopping centre and parking (footprint of m²) Life style centre with parking (footprint of m²) Mixed commercial, offices and flats as well as parking (footprint size not yet known) Mixed commercial, offices and flats as well as parking (footprint size not yet known) No date has yet been set for the opening of the proposed regional shopping centre. (f) WEST COAST FET COLLEGE CAMPUS IN MALMESBURY [updated on 26 May 2016] A new campus for the West Coast FET College is currently being built on the land between Loedolf Street, Church Street, Voortrekker Road and the Diep River. Construction will be undertaken in phases and when all the phases are completed the campus will accommodate offices, classrooms, a hall, student centre, public green space, public transport drop-off and dedicated parking areas. The campus will contribute greatly to the community s need for centralised and appropriate tertiary education and it will cause a substantial capital investment in local business as a result of the procurement of goods and material by the college and students. It will not only serve Malmesbury or Swartland but the West Coast region and even the Cape Metropole. The first 16 lecture rooms are in operation. The building value of the lecture rooms amounts to R13 million. The construction of an administrative building to the value of R14.5 million has been completed. Construction of eight classrooms (including computer centre), in total 1240 m² has started. The expected completion date is December Project cost amounts to R12 million. Construction of a new Hospitality School of 720 m² started in March The expected completion date is December Project cost amounts to R12 million. (g) EXPANSION OF THE SASKO PLANT IN MALMESBURY [added on 30 May 2014] The total cost of the expansion of the SASKO plant in Malmesbury that includes the construction of 11 new silo s amounts to R330 million of which R130 million is buildings and the rest equipment. Storage capacity, the in and out storage capacity as well as flour production will all increase by a substantial amount. A number of permanent jobs will be created. (h) EXPANSION OF DARLING CREAMERY [added on 30 May 2014] Darling Creamery currently employs 355 people. The plan is to increase its daily production capacity from litres of milk per day to litres per day. It is estimated that an additional 50 job opportunities will be created as a result of this expansion. (i) NEW MCDONALDS IN MALMESBURY [added on 30 May 2014] The construction work for a new McDonalds at the intersection of Voortrekker Road and Smuts Street Malmesbury has commenced. More than R10 million will be spent on land, services, buildings, landscaping and decor. Approximately 50 new job opportunities will be created. [Section (j) (POSSIBLE NEW AIRPORT) deleted on 26 May 2016] 80 Integrated Development Plan for
89 (j) PROXIMITY TO THE CAPE METROPOLE The strategic location of the Swartland in relation to the Cape Metropole and the existing infrastructure links created by the N7 and the railway line, opens up opportunities form economic growth. Swartland Municipality borders on the municipal area of Cape Town. Towns such as Malmesbury (65 km north of Cape Town) and Darling (70 km north of Cape Town) provide an attractive alternative as business, industrial and residential area. The Swartland offers a relaxed rural lifestyle not far from the attractions of Cape Town. It offers competitive and highly accessible industrial land close to markets and suppliers. There are two main roads cutting through the municipal area: The N7 that links Namibia and Africa in the north to Cape Town in the south and the R27 that links Cape Town with Saldanha and Vredenburg. Secondary roads of regional importance are the R45 that links Vredenburg with Malmesbury and Paarl, the R315 that links Yzerfontein with Darling and Malmesbury and the R46 that links Hermon and the Riebeek Valley with Malmesbury. The railway routes on which cargo and passengers are transported, run from Cape Town or Bellville and enters Swartland at Kalbaskraal where the line splits. One railway line runs north through Moorreesburg and Koringberg and ends in Bitterfontein. A second railway line runs in a westerly direction from Kalbaskraal via Darling to Vredenburg while a third line runs from Paarl to Porterville. The Cape Town and Saldanha Bay harbours and the Cape Town International Airport provide excellent infrastructure for local business. Good residential growth during the past decade in towns such as Malmesbury, Riebeek Kasteel, Riebeek West, Darling and Yzerfontein shows that Swartland is seen as an alternative residential area to the Cape Metropole (especially Malmesbury with its direct N7 link to Cape Town). The development of the N7 corridor between Malmesbury and the Cape Metropole is supported by the following: The main growth direction of the Cape Metropole is to the north; the possible development of a new freight airport in die Swartland area; and growth in agri-processing in the area to the south of Malmesbury in the corridor between Malmesbury and Kalbaskraal. (k) INDUSTRIAL DEVELOPMENT ZONE - SALDANHA BAY The establishment of a niche industrial hub in Saldanha Bay that offers real incentives to investors will contribute significantly to growth in the Western Cape and country. It will also boost the Province s manufacturing position and enable it to become a preferred destination for the oil and gas industry. The feasibility study for this project found that, after 25 years, an IDZ in Saldanha Bay would generate between R11.2 billion and R31.6 billion for the Province s economy each year. It would also create between and sustainable jobs. The study also found that there was sufficient nonenvironmentally sensitive land upon which the development could take place. The Western Cape Provincial Government s contribution to operationalise the Saldanha Bay IDZ over the medium term is as follows: R5 million in the coming year, R5.28 million in year two and R5.57 million in year three. When promulgated, the SEZ legislation currently before national parliament will bolster the IDZ by allowing for additional incentive support. It also reiterates the strong commitment of National Government to advancing the economy and creating jobs through infrastructure-led projects such as the Saldanha Bay IDZ. The Provincial Government has set themselves very tight deadlines and will be requesting national cabinet sign off by the end of the year. Integrated Development Plan for
90 The Provincial Government will also improve the road network that will support the Saldanha IDZ and Port expansion. We have set aside R23.31 million over the medium term for planning and to complete the feasibility study required for this project. (l) INDOOR COMMUNITY SPORT CENTRE WESBANK Hope Through Action (HTA), a UK based welfare organisation, has invested in a community sport centre in Mbekweni (Paarl / Wellington) in Due to the growing success of the facility in Mbekweni, HTA has decided to invest in 3 more such facilities in the Western Cape to develop their plans for the future: Franschhoek (Stellenbosch Municipal Area) Malmesbury (Swartland Municipal Area) Dysseldorp (Oudtshoorn Municipal Area) There is no doubt that young people living in South African townships face a range of challenges in their daily lives and need help to break the cycle of poverty and underachievement. There are many other communities in the Western Cape that HTA believe would benefit from their unique approach of combining a modern sports centre with tightly integrated development programmes. A process of selecting the relevant communities using a formal assessment process was undertaken during 2011 to ensure that their funds are targeted at areas where maximum benefit can be achieved. HTA remains actively involved in the management of the centre after its development, e.g. for Mbekweni Community Sports Centre they ve continued their fundraising so that they can provide more outdoor facilities to complement the indoor centre and to enable HTA to offer different sports and work with more young people. The intension is also to expand their programmes to include practical life skills, and extend the services available from the centre. To support their ambitions they will train more volunteer coaches to deliver their development programmes, so that they can reach more young people and build on the Mbekweni achievements so far. (m) DEVELOPMENT OF NEW SPORT FIELDS IN RIEBEEK WEST In August 2010 an application was submitted to the National Lottery Distribution Trust Fund (NLDTF) for the upgrade of various sport facilities within Swartland. The NLDTF informed the Municipality in October 2011 that a grant of R has been allocated towards Riebeek West Sport Grounds. The new draft Spatial Development Framework contains a development plan for Riebeek West that earmarks the sport grounds for which the grant was allocated for light industrial area. The plan also proposes a new multisport facility on erven 326 and 327 directly southeast of Lang Street. The Municipal Manager thus gave instructions in March 2012 that the NLDTF grant be allocated to the newly planned multisport facility. In the mean time the Municipality also secured a grants of approximately R15 million for the development of this facility. (n) URBAN RENEWAL PROJECT IN MALMESBURY The future of the River Road in Malmesbury will be handled in accordance with the Transport Study to determine whether or not the road is necessary. If the road is not necessary it opens up opportunities to develop the area that would have been taken up by the road. The area concerned has great potential for urban renewal. 82 Integrated Development Plan for
91 (o) NATIONAL DEPARTMENT OF ENVIRONMENTAL AFFAIRS - EPWP PROJECT R11.5 million has been allocated by the Department for an EPWP project that covers the area from the West Coast National Park boundary up to Chapmans Peak. The aim of the project is the clean-up of beaches, maintenance of the dunes and removal of alien vegetation along the coast line. Swartland Municipality currently expects in the region of 10% of the amount for work along the coast line within our municipal area. The Municipality provided the Department with the following requests for possible inclusion in the project: Rehabilitation of the sand dunes in the surroundings of the Yzerfontein Caravan Park; Pearl Bay: Make wooden walkways of the old Jeep tracks and create a walk route; remove alien plants on the dunes; cleaning of beach from Grotto Bay to the boundary of the West Coast National Park north of Yzerfontein; fencing in of beach area near Yzerfontein Caravan Park; construction of public refuse drop-off points along the walk route; maintenance of the existing walk routes and walk ways; repair and placement of information signs; cleaning of river; and help to get an information centre going. Twenty people from Darling s list of unemployed have been employed at R75 per day for the two year period. The project will be executed during the 2011/12 and 2012/13 financial years. (p) CONSERVATION AND TOURISM INITIATIVE - DASSEN ISLAND The following information was obtained from the Cape West Coast Biosphere s comment on the Management Plan for the Dassen Island Nature Reserve dated 13 February 2012: The Protected Area Expansion strategy for Dassen Island Nature Reserve is to establish a Marine Protected Area of a 20 km diameter around the island. It should be considered consolidating the proposed MPA with the Sixteen Mile Beach MPA and creating a single MPA from South Head at the entrance to Saldanha Bay (in the north) to Bok Point (in the south). There is a need to investigate a tourism initiative for Dassen Island, which has a high tourism potential due to the ecological & cultural-historic heritage and its strategic location with regard to other offshore islands such Robben Island. Dassen Island is an extremely sensitive environment, however if strictly controlled and monitored, tourism activities could take place that would not have a significant negative impact. Marine-based tourism (permitted through a system that can generate some revenue for the management of Dassen Island) should be encouraged, as this will not impact directly on the breeding birds. Tourism opportunities for visitors to alight on the island should also be considered, but with limited and strictly controlled access. The Cape West Coast Biosphere Reserve (CWCBR) has a trails and tourism project aimed at product development, job creation and skills development in the ecotourism industry. Dassen Island could be an excellent addition to the five products currently offered by the CWCBR Trails Division, as it would be a unique experience and as an NGO with conservation and sustainability as its core objectives, would ensure that any potential environmental and biodiversity impacts would be minimised. The CWCBR would also ensure that funds from the tourism venture would be ploughed back into the activities on the island e.g. education and research. Integrated Development Plan for
92 (q) KLIPFONTEIN DEVELOPMENT [added on 28 May 2015] The Klipfontein development has been approved by Council in The development consists of erven with various development rights and the first two properties now stand to be developed. These are: A shopping centre A business zoned site of approximately 4 ha has been accommodated on the southern side of the development. The developer has sold the property and development plans for a shopping centre have been compiled. The current proposal is for a shopping centre of ± m² with 860 parking bays. The building plans are expected to be submitted soon. A retirement village A retirement village which will accommodate 500 units is, inter alia, part of the total development. The first phase includes 40 units of which construction will commence in March This phase stands to be completed in March (r) EXPANSION OF A PIGGERY ON THE FARM KLEINE RONDEBOSCHJE [added on 26 May 2016] This project comprises m². Date of the commencement with construction was not yet known by time of writing this report. The estimated cost of the project is R270 million. The owners of the farm were recognised for their work on the KykNet program "Megaboere". (s) UPGRADING AND EXPANSION OF THE DE BRON SHOPPING CENTRE [added on 26 May 2016] The additional floor area constructed during 2016 is 1165 m². 391 m² is however demolished to make place for accessible parking. The expected completion date of the project is November/December Total project cost amounts to 25 million. (t) NEW DATACENTRE AT YZERFONTEIN [added on 26 May 2016] The notarial lease agreement between the Municipality (who owns the land) and the developer of the datacentre has been signed with effect from January The design and planning of the data centre of which the total infrastructure and ICT development cost is estimated at R340 million is in process. (u) NEW PRIVATE HOSPITAL IN MALMESBURY [added on 26 May 2016] An opportunity to establish a private hospital in Malmesbury has been approved but there is still uncertainty about the commencement date of the project or the exact location of the envisaged hospital. (v) WIDENING OF THE DIEPRIVER BRIDGE [added on 26 May 2016] This project with an estimated cost of R15 million will widen the Diep River bridge to three lanes. The project also includes a traffic circle at the entrance road to McDonald's and the upgrading of the Voortrekker - / Bokomo Road intersection. (w) TRUCK STOP MOORREESBURG [added on 26 May 2016] A tender for the purchase of erf 5520 on the N7 in Moorreesburg was awarded during July 2015 for development of a Truck Stop and Service Station, with an estimated development cost of R25 million 84 Integrated Development Plan for
93 6.3 Intergovernmental initiatives (a) REGIONAL SOCIO-ECONOMIC PROGRAMME (RSEP) [added on 28 May 2015] During January 2014 Swartland was chosen by the Western Cape Premier to participate in the Regional Socio-Economic Programme (RSEP). The programme forms part of the Violence Prevention through Urban Upgrade (VPUU) programme where safer living environment are created through urban design and upgrading. The RSEP is an integrated and interdepartmental programme in die Western Cape that will drive socio-economic development and social inclusiveness in the target areas based on the principles of the Provincial Spatial Development Framework. The RSEP is aimed at utilising a whole of society approach coupled to a regional planning approach. In terms of the methodology the socio-economic characteristics of communities (regions, towns and neighbourhoods) are analysed and baseline data is established. A regional spatial approach is followed to provide context and to understand the relationships between geographical areas and the various projects. The VPUU Phase 4 project was approved as a recipient of 5 million (approximately R75 million) in funding from the German Development Bank. Provincial counter-funding to the value of R75 million has also been approved for the MTEF period. This funding is intended mainly for the RSEP municipalities. Municipalities will also be required to make a contribution. These funds are intended to be spent over the next four years, although the continuation or expansion of the Programme is anticipated. The goals of the RSEP can be summarised as follows: Create or contribute to the creation of safe and inspiring suburbs and nodes in poor residential areas; Create or promote the development of community structures that will contribute to a sense of ownership and will encourage social cohesion; Develop a multi-disciplinary approach (all spheres); and Generate socio-economic information. Swartland Municipal Projects The Swartland Municipal project team consists of identified municipal and provincial officials and community members that were selected according to an agreed planning process. Swartland Municipality's first project was identified. The aim of this project is to introduce the RSEP to the community and to develop the programme's credibility within the community. The area in Malmesbury that will be the focus of the RSEP includes Sunnyside, Wesbank, Ilinge Lethu and Saamstaan. The map below is the draft plan for the implementation of the RSEP in Malmesbury. Integrated Development Plan for


94 The main activity routes along which people move as well as specific safe nodes/activity zones on the routes have been identified as focus areas for the RSEP projects with the purpose to make the area safer and more user friendly for the local community. The activity routes correspond with those identified in the Swartland Spatial Development Framework. The following themes must be reflected in the RSEP projects: 86 Integrated Development Plan for
95 Theme 1: Promote outdoor activities, exercise and interaction create activity nodes where exercise apparatus for young and old are provided. Theme 2: Promote creativity and music and ways of giving expression to this provide equipment in areas where expression can be given to music and other creative talents. Theme 3: Promote innovative thoughts, knowledge and discovery provide elements in areas where knowledge can be transferred in an informal, active and enjoyable manner. Theme 4: Promote traditions, culture and tolerance create visual material through which people can learn of each other's cultures and traditions. Theme 5: Promote skills through sport provide well-equipped sport facilities in the nodes in order to develop skills and create safe areas for recreation. Theme 6: Promote business expertise, entrepreneurship and the free market system provide opportunities for training, informal markets and business opportunities along the routes and within the nodes. The preliminary RSEP projects as in February 2015 are the following: Investigate and upgrade pedestrian links between Wesbank and Ilingelethu across the N7 providing dignity and safety. Energy efficient lighting together with improved pedestrian pathways. Placement of refurbished container to serve as contact point with SAPS. Link Alpha Street container with upgrading children's play park. Link Jakaranda Street facility with informal market place. Information of security services to be displayed on the containers. Areas to be fenced. Recreational areas by introducing splash pool/fountains and also introduce trees and other entertaining equipment e.g. tables, benches and braai facilities. Safe playgrounds that are fenced with play equipment for children and gym equipment for youth. Beautification of area with trees and benches. Partnerships with the community to oversee the facilities. Skate board park also included in activity zones. Strategically placed speed bumps and zebra crossings to improve safety of children in Early Childhood Development Centres and schools. Replant trees in Alpha Street in existing tree bowls adjoining existing pedestrian pathways in collaboration with the surrounding community. Combine the planting event with a street festival that will include street sports activities, arts and culture and a community street braai. Community members adjacent to the trees will be motivated and involved to plant the trees and to look after them. Indoor sport centre build by Hope Through Action. Community Centre providing various services to the community. Commercial centre designed with fitted containers. Safe taxi stops and shelters next to corridor routes within the selection area. Improve the quality of life of residents with a strong emphasis to human scale with the planting of trees along corridor routes within the selected area. Defined and marked out circle routes as proposed in original bid. Linked with activity nodes with equipment for exercise and enjoyment by the community. Competition along these routes can be established in future. Provide for public toilets at informal market together with the landscaping to fit the market. Existing road to be upgraded and formalised to create better mobility for the community to and from the Centre. Erect an information board / signage post to communicate local information to the community. Integrated Development Plan for
96 (b) COMPREHENSIVE RURAL DEVELOPMENT PROGRAMME (CRDP) [added on 28 May 2015] The Comprehensive Rural Development Programme (CRDP) was approved by Cabinet in The programme was identified as a strategic priority in the National Government's Medium Term Strategic Framework. The purpose of the programme is to provide effective answers to poverty and food security through a more effective use and management of natural resources in order to create vibrant, equitable and sustainable rural communities. The CRDP must enhance the living standard and prosperity of rural dwellers and must wipe out the injustices of the past. The strategic goal of the CRDP is to facilitate integrated development and social cohesion through a participatory approach and partnerships with all the sectors within the community. The pillars of the Vision 2030 are the following: Unite all South Africans around a common programme to fight poverty and inequality and to foster a spirit of unity; Active citizenry; A growing and inclusive economy; Building capabilities; and Strong leadership throughout society to work together to solve our problems. The objective of a growing and inclusive rural economy is to create an additional direct and indirect work opportunities in the sector by This is supported by: National Outcome 7 - Vibrant, equitable and sustainable rural communities with food security for all. Provincial Strategic Goal 1 Create opportunities for growth and jobs. The Western Cape Provincial Department of Agriculture identified various CRDP rural nodes in the West Coast Region which include, amongst others, Riverlands, Chatsworth (Ward 4), Kalbaskraal and Abbotsdale (Ward 7) within the Swartland municipal area. The programme in the Western Cape comprises the following five phases that will be implemented over a period of 36 months: Phase 1 Constituting an interdepartmental management committee Phase 2 Social facilitating Phase 3 Social upliftment Phase 4 Infrastructure development Phase 5 Economic development The CRDP will follow an interactive approach in which all interest groups will participate to ensure successful implementation. Projects will be identified through inputs of the community. It is important that the Swartland Spatial Development Framework creates the necessary framework within which the projects can be accommodated and supported successfully. The aim of the CRDP is to address the needs of and bring support to Chatsworth, Riverlands and Kalbaskraal where high unemployment and great human distress exist. The intention is that the programme will create the necessary platform and networks within which the private and public sectors can build business and social systems that will make effective rural development a reality. 88 Integrated Development Plan for
97 6.4 Challenges (a) ECONOMIC DECLINE AND POVERTY In South Africa The nature of poverty The National Development Plan of November 2011 places a great emphasis on poverty. According to this plan poverty is still pervasive and South Africa has made insufficient progress in reducing inequality. Millions of people remain unemployed and many working households live close to the poverty line. Slow growth in per capita incomes is one explanation for poverty levels. GDP per capita stagnated at about R between 1967 and 1993 (in 2010 rand). This noticeably improved from 2001 and reached almost R by Average per capita incomes grew by only 2% per annum between 2001 and 2010, dampened recently by the economic downturn. The acceleration of economic growth is not yet sufficiently high or sustained to make a meaningful impact after many years of population growth and economic stagnation. The recession has reduced hard won gains, with per capita income and employment falling by about 4% and 1 million jobs between the last quarter of 2008 and While growth has resumed, the long-term impact of the global economic downturn is still uncertain, as is the path to employment recovery. Although South Africa does not have a single official poverty line, R524 per month per person (in 2008 prices, updated to 2010) can be used as a rough guide. Using this indicator, the proportion of people living below the poverty line was about 53% in 1995 and fell to 48% in This is a very high level of poverty for a middle-income economy. The diffusion of social grants was the most important contributor to falling income poverty from Inequality South Africa is a highly unequal country. Using the Gini-coefficient, inequality worsened from 0.64 to 0.66 in The Gini coefficient measures the inequality as a proportion of its theoretical maximum. The Gini coefficient can range from 0 (no inequality) to 1 (complete inequality). The driver of the increase in inequality has been between-group inequality. For the realisation of the constitutional mandate of "Human dignity, the achievement of equality and the advancement of human rights and freedoms" deliberate programmes that will optimally reduce inequality need to be driven on all fronts and by all social partners. The incomes of both the richest and the poorest 20% of the population rose by about 45% between 1995 and The distribution of income to the richest and poorest sections of society did not change significantly between 1995 and The poorest 20% of the population earns about 2.3% of national income, while the richest 20% earns about 70% of the income. Unemployment Over 25 years, there was no net job creation for a growing African population. Strict unemployment peaked in 2001 at 31%. Broad unemployment, referring to people who would like to work but have become discouraged, is also a critical challenge, mostly affecting young black women living outside of urban areas. Positive and sustained growth between 1997 and 2008 did finally make inroads into unemployment, falling to 23%. The global economic downturn now poses uncertain challenges towards efforts to further reduce unemployment. The table below indicates the unemployment rate by age (%) between 2002 and 2010: Integrated Development Plan for
98 Age group Total Source: Development Indicators based on Labour Force Survey (Sept figures only) In Swartland Poverty rate The poverty rate is the percentage of people living in households with an income less than the poverty income. The poverty rate for Swartland was 32.8% for 2001, 27.6% for 2007 and 26.8 for The 2010 figure is slightly lower than that of the West Coast District (30.4%). Inequality The Gini coefficient for Swartland was 0.58 for 2001, 0.60 for 2007 and 0.58 for Again the 2010 figure is slightly lower than that of the West Coast District (0.6) and that of South Africa (0.66 in 2008). Human Development Index The Human Development Index (HDI) is a composite, relative index that attempts to quantify the extent of human development of a community. It is based on measures of life expectancy, literacy and income. The HDI can assume a maximum level of 1, indicating a high level of human development, and a minimum value of 0. The HDI for Swartland was 0.62 for 2001, 0.64 for 2007 and 0.64 for The 2010 figure is slightly lower than that of the West Coast District (0.65). Unemployment Economically active people (those in the labour force) are those between the ages of 15 and 65 years who chose to participate in the labour market by being willing to supply their labour in exchange for an income. Being economically active does not depend on being employed; as long as there is a desire, willingness and availability to work, even if that desire does not translate into employment, then you are seen as part of the labour force. According to the 2011 Census data Swartland had a labour force of of which (12.7%) were unemployed. This figure differs substantially by population group: unemployment rate within the African population was the highest at 27.7%, followed by the Coloured population at 16.2% and the White population at 1.7%. When looking at the unemployment rates by age, the unemployment rate amongst young people is very high. Unemployment for the age group years is 17.9%. 90 Integrated Development Plan for
![(b) LOCAL ECONOMIC DEVELOPMENT (LED) [replaced on 26 May 2016] Why LED LED is a specialised methodological response to the need to improve performance of the local economy to benefit local citizens.](/docs-images/89/99027790/images/99-0.jpg "LED is defined as an ongoing process by which key stakeholders and institutions from all spheres of society, the public and private sector as well as civil society work jointly to create a unique")

99 (b) LOCAL ECONOMIC DEVELOPMENT (LED) [replaced on 26 May 2016] Why LED LED is a specialised methodological response to the need to improve performance of the local economy to benefit local citizens. LED is defined as an ongoing process by which key stakeholders and institutions from all spheres of society, the public and private sector as well as civil society work jointly to create a unique advantage for the locality and its firms, tackle market failures, remove bureaucratic obstacles for local businesses and strengthen the competitiveness of local firms/smes. Sustainable jobs are created mainly in the private sector, which creates wealth from markets. To grow the economy, businesses need to increase their revenues by competing successfully in markets which are increasingly contested by global competitors. To grow the local economy, competitive local firms need to earn more revenue from external markets and spend much of this locally for more money to flow into the local economy. In addition, improved competitiveness of local firms in local markets ensures that less money flows out of the economy. Distribution within the economy takes place through wages and purchases from other businesses. Firm performance/competitiveness does not just depend on the factors inside the firm. Externalities such as market demand, market competition, supply conditions and local business environmental conditions are also major determinants. This eco-system (see figure to the right) within which the firms find themselves, to a large extent determines how is easy or how difficult it is for an entrepreneur/ firm to succeed. These factors also determine whether a local economy is attractive for investors. Concept of an economic eco-system, which economic development strives to improve Integrated Development Plan for
100 The role of the municipality In support of the National Development Plan and the five strategic goals ( PSGs ) of the Western Cape Government, the Swartland municipality aims to stimulate sustained growth in the Swartland jurisdiction by promoting and implementing a set of mutually supportive economic -, spatial - and social development initiatives. In determining which initiatives will be most beneficial, neither the public sector nor the private sector on their own has all the insights and answers. However by combining insights, power of influence and resources, much more is possible. The Swartland LED Strategy approved by the Mayoral Committee in February 2016 therefore aims to establish improved economic development cooperation amongst stakeholders to systematically identify and utilise more beneficial economic opportunities. Where are we now The LED strategy review process was the culmination of information gathered from many sources including: Mero report, IDP process, 2014 PACA process and 20 interviews with key business leaders in The municipal leadership has maintained ongoing dialogue with organised business. More in depth dialogue with the private sector and municipal leaders has allowed this version of the LED strategy to sharpen its focus on developing and promoting competitive advantage. More attention is placed on what must be done and by whom - to make the strategy easier to execute with success. The main findings are presented as the economy s relative strengths and weaknesses which determine the viable growth options. The stronger the competitive advantages (strengths), the easier it is to attract businesses. The competitive disadvantages (weaknesses) combined with threats, discourage investors. Main Competitive Advantages 1. Strategic location for business 2. Lower costs 3. Lower risk 4. A municipality that values business 5. Growing investor confidence 6. A good place to live Main Competitive Disadvantages (incl. constraints to growth) 1. No industrial land was available (up to August 2015). 2. Limited access to business information. 3. Agriculture employment is declining 4. Appearance of towns 5. Technical skills difficult to attract 6. Shortage of certain types of housing and rentals 7. Red-tape and regulatory uncertainty 8. Safety & security in pockets 9. Transport 10. Limited investment promotion 11. Limitations in schools 12. Facilitation of economic development Threats identified 1. Competitors to Swartland for investment e.g. Atlantis 2. Inadequate marketing 3. New malls will place pressure on existing retail in town/s (Opportunity and a threat) 4. Development that makes towns less attractive 92 Integrated Development Plan for
101 Options for growth The primary factor driving growth in the Swartland is the Cape Town metro growth trend. Both businesses and citizens will increasingly view Swartland as a good place to locate. Similar to growth patterns of towns on the outskirts of other cities world-wide. The benefits include a lifestyle alternative to city life, lower cost structure and good municipal services whilst still having good access to markets in the metro. A secondary factor driving growth is the increasing trade link via the N7 that links Cape Town to Namibia and Angola. An increasing number of trucks delivering to Cape Town need to time their arrival in Cape Town. Delivery points in Cape Town vary, so trucks choose from eight entry points from Malmesbury onwards. A truck stop is planned near Moorreesburg. Since August 2015 the main constraint to growth has been removed. Industrial property has only recently become available again. The fact that the N7 is being upgraded to reduce travel time makes it even more attractive. Some investors are already investing. Others are considering investing here and are likely to become more confident when they fully understand the competitive advantages offered by Swartland. Due to the nature of the factors driving the growth opportunity (proximity to Cape Town and road linkages), most of the growth is expected near Malmesbury. Investment is expected mainly from sectors such as agro-processing, transport and logistics, retirement villages, increased retail and services. This will result in a boost in construction and property markets. Strategy for economic growth and inclusion The strategic rationale follows simple economic development good practice. 1. Strengthen the competitive advantages of Swartland. Make it increasingly attractive as a good place for business to operate from, for their employees to work, live and play. Build on the current advantages including: Easy access to metro markets, good work ethic, lower costs structures, country lifestyle, good government, quicker decisions and social cohesion. 2. Attract business to locate and grow here. Make it quick and easy to invest and expand. The consequence will be growth in employment and more money circulating in the local economy. This money will benefit local businesses in the retail and services sectors. 3. Make local markets work better to increase opportunity for small business. Improve small business access to new market opportunities, access to business development support services and to finance. The municipality cannot provide these services but can assist to facilitate easier access to these services. Market access can be improved by systematic linking of local suppliers to the large public - and private sector buyers. Linking these local firms also to networks of expertise will further enhance their ability to meet the requirements of the large buyers. Businesses linked to lucrative value chains grow faster. 4. Attract more rate paying citizens to live here. Target families who are cost aware and who seek a safer, country lifestyle with good schools. Also tap into the ongoing exodus of retirees from all over the country - escaping specifically from government failure, increasing crime levels and rising cost of living. Besides contributing to municipal financial sustainability, their investment spent in the local economy will provide further increase in money circulating in the local economy. 5. Make it easier for local citizens to access economic opportunity. Support citizens to access new job opportunities and skills development that will qualify them for new job opportunities. Integrated Development Plan for
102 Strategy Priorities / Initiatives Much of the right building blocks for the strategy are already in place. The text in red indicates areas where improvement emphasis is required. Implementation of the strategy therefore requires continuing some good work already in progress, and introducing additional initiatives to fill the gaps. A few new economic development initiatives were selected during the LED strategy review with the aim to achieve maximum impact, quickly and efficiently. Keep in mind some economic development initiatives may take many years to realise impact that is visible. New Initiatives: 1. Stakeholders support development of a more competitive local economy 2. Development of industrial park/s 3. Make Swartland the easiest place to invest in 4. Rejuvenation of Malmesbury and Morreesburg town centres 5. Investment promotion to attract more investment 6. Improve tourism promotion and development 7. Establish a local business opportunity network 8. Establish an employment opportunity and career guidance network 9. Establish a Safety & security stakeholder cooperation system 10. Establish a system to track and manage implementation of development initiatives Existing Initiatives: (b) Regional Socio Economic Project (RSEP) (c) The widening of the N7 (d) New road link between the R45 (Malmesbury/ Paarl) and the R45 (Malmesbury/Hopefield) (e) Extension of PPC (f) Swartland regional shopping mall (g) New West Coast FET College Campus in Malmesbury (h) Expansion of the SASKO plant in Malmesbury (i) Expansion of Darling Creamery (j) New McDonalds in Malmesbury (k) Possible new airport (l) Proximity to the Cape Metropole (m) Industrial development zone Saldanha Bay (n) Indoor community sport centre Wesbank (o) Development of new sport fields in Riebeek West (p) Urban renewal project in Malmesbury (q) National Department of Environmental Affairs EPWP project (r) Conservation and tourism initiative Dassen Island (s) Klipfontein development (a) Regional Socio Economic Programme (RSEP) (b) Comprehensive Rural Development Programme (CRDP) Contribution of LED initiatives to strategic goals Competitive advantages benefit local businesses Local business confidence in municipal area Local businesses promote further local investment Swartland is perceived as a upcoming vibrant place which has been under sold, therefore holds potential. Investors aware & like the competitive advantage Investors decision supported Citizens are aware of development & opportunities Local citizens are qualified for job opportunities Citizens take ownership, develop a sense of place, where it is safe and nice to live Local citizens have increased access to integrated housing Residents like their Swartland lifestyle Residents promote Swartland as a desirable place to live Visitors like their Swartland experience (aware attractive) Goal structure More businesses locate here, invest and grow Local citizens access more economic opportunities More citizens locate, invest and spend here Sustained economic growth (GGP) Improved municipal financial sustainability Increased employment Improved quality of life of employed citizens More citizens live in integrated formal housing (sustainably) Stronger social cohesion Version 5 94 Integrated Development Plan for

103 Institutional capacity for economic development The economy is complex and the right people need to discuss the right topics, without wasting time. Various role players have different interests and therefore different dialogue requirements. When dialogue takes place it needs therefore to be focused and relevant to participant interests. Focussed group dialogues make more sense than large meetings if they are integrated cohesively. To assist in achieving both focus and integration a framework is provided to conceptualise such dialogue as various groups. Capacity and cooperation required to execute Local Economic Development 1 Governance groups oversee on behalf of stakeholders the quality and the integrity of the economic development effort and associated investment. 2 Facilitation groups establish strong stakeholder networks which cooperate to continuously improve the most important parts of the place economy. 3 Planning groups mobilise stakeholder insight, ideas and resources to identify the most promising and pragmatic improvement initiatives. 4 Implementation groups focus on implementation of specific economic development initiatives to unlock new opportunities. 5 Evaluation groups determine the actual results achieved to support learning and improvement. Integrated Development Plan for
104 The Swartland LED institutional capacity or system mapped to these group types. Swartland LED system: Known ED institution infrastructure / Capacity to execute Existing New Possible The current economic development relevant institutional capacity is mapped according to the group types in blue on the diagram on the right. Achieving effective economic development cooperation, integration with such a complex set of organisations is surely a challenge. There may be more efficient ways of organising capacity, but this may be too disruptive from the outset. By providing smart systems and tools for better development cooperation, these groups are likely to firstly perform better and thereafter reorganise themselves more efficiently once the benefits become apparent. Public sector Private sector Governance groups WCDM Council Municipal Council Wards 1,2 committee: Moreesburg & Koringberg Ward 3,12 committee Riebeeck Kasteel and West Ward 5,6 committee Darling & Yzerfontein Ward 4, 7 committee Riverlandse, Chatsworth, Abbotsdale and Kalbaskraal Ward 8,9,10,11 committee Malmesbury Board: Moreesburg sakekamer Board: Malmesbury Sakekamer Boards: Landbou unie X 4 Board: Tourism & bus.yzerfontein Board Tour.& bus. Riebeeck Val. Board: Tourism & bus. Darling Board: Tourism Moorreesburg Board: Tourism West Coast Board: Cape West coast Biospher Facilitation groups Integrated Development SDF development Community development Incl. skills Moreesburg sakekamer Malmesbury Sakekamer? Retail & services? Industry? Property & construction Landbou unie X 4 Tourism & business: Yzerfontein Tourism & busin: Riebeeck Valley Tourism & bus: Darling incl trust Tourism: Moorreesburg Tourism: West Coast Cape West Coast Biosphere Planning groups Swartland municipal advisory forum (SMAF) IDP Economic development Marketing strategy Implement. strategy SDF &LUMS RSEP CRDP Infrastructure development & Services Social development Swartland safety & security Study groups e.g Wingerdbou, Skape, Beeste Agricultural Show Tourism dev. strategy Cape West Coast Biosphere strategy Cape West Coast Biosphere walking trails Implementation groups 1. Stakeholders actively support development of a more competitive local economy 10. Establish a system to track and manage implementation of development initiatives SANRAL: N7 upgrade R45/46 link road Upgrades: Bokomo & Voortrk.weg 2. Develop industrial park/schoonspruit 3. Make Swartland the easiest place to invest in 5. Investment promotion to attract more investment De Hoop Malmesbury West ncl. Mall New housing dev. De Hoop? Regional mall Retirement Village in Klipfontein? Klipfontein mall? Upgrading DE BRON Centre Morreesburg truck stop Abbotsdale clinic & library New high schools: Moorreesburg, Primary: Morreesburg, Chatsworth, Darling, Malmesbury Riebeeck Riool aanleg 4. Rejuvenation of Malmesbury and Moorreesburg town centres Safety & security initiatives 9. Establish a Safety & security stakeholder cooperation system 7. Local business opportunity network 8. Employment opportunity and career guidance network 6. Improve tourism promotion and development 96 Integrated Development Plan for
105 Monitoring and evaluating Monitoring and evaluation of LED progress will be enhanced to speed up learning and skills in LED. A new online monitoring system will be introduced for all local development stakeholders. Whereas the main objective is to learn, it is important to also utilise the opportunity to recognise the champions of success stories. The purpose of evaluation is to measure progress, reflect on what worked as planned and what did not. And then to learn from the new insights gained. Working smarter increases the scale of future results. Without evaluation, mistakes are repeated. Evaluation will be integrated with the monitoring system and will focus on the measurement of actual output, outcomes and impact resulting from economic development Initiatives. To make the evaluation process easier, the LED performance framework provides a default set of performance indicators. Evaluate impact as the variance from trend Source: The DCED standard for measuring results in private sector development Integrated Development Plan for
![LED maturity assessment [replaced on 26 May 2016] The Western Cape Department of Economic Development and Tourism embarked in 2012 on a benchmarking process called LED maturity assessments.](/docs-images/89/99027790/images/106-0.jpg "Benchmarking of LED practices and performances increase awareness and insight of leaders at municipalities about: factors critical to LED success, which aspects of LED practices work in the")
106 LED maturity assessment [replaced on 26 May 2016] The Western Cape Department of Economic Development and Tourism embarked in 2012 on a benchmarking process called LED maturity assessments. Benchmarking of LED practices and performances increase awareness and insight of leaders at municipalities about: factors critical to LED success, which aspects of LED practices work in the municipality and which do not, the root causes of their LED failures, and options to learn from others who have succeeded where they have failed. Overall Performance: Results compared to last year s: Integrated Development Plan for
107 Five consecutive year s LED maturity assessment data is now available. Since measurement has been introduced and awareness around learnings increased, LED has improved significantly at 83% of the municipalities in the province. The assessment results clearly indicate that most municipalities are improving their LED practices. The graphs that follow indicate your municipality s results over the last 5 years, based on the scores achieved during the assessment process. Swartland Municipality is ranked in the mid-high 20% of municipalities in the province. Swartland Performance in Key Areas Swartland performance in relation to other municipalities Swartland performance Performance trends over in five key areas years M&E of outcomes & impact (learning) Governance of LED by business & political leaders Shared vision and focus Understanding the local economy Strategic decision making M&E of outcomes & impact (learning) Governance of LED by business & political leaders Shared vision and focus Understanding the local economy Strategic decision making Facilitate LED Stakeholders participate & contribute to Public.Privatesector champions implement LED Municipal service delivery proficient Facilitate LED Stakeholders participate & contribute to sound Public & Privatesector champions implement LED Municipal service delivery proficient Lead score Average score February 2016 The radar plot indicates the performance of your municipality in relation to the average and the lead scores in the province. Based on the average score, Swartland Municipality is ranked within the mid-high 20% of best performing municipalities. February 2012 February 2013 February 2014 February 2015 February 2016 The radar plot indicates improvement in all the dimensions. Significant improvements are evident in the areas of stakeholder participation and facilitation. A steady and consistent annual improvement in M&E of outcomes and impact indicates that learning and improvement is a key area of focus of the municipality which will receive greater attention in the following months. Governance requires significant attention. Integrated Development Plan for
108 Critique factors Assessment scale Insight and Strategy 100% Shared vision and focus 10% Social context: Status and trends understood 5% LED focus 5% Understanding the local economy 60% A good place for business 5% Competitiveness of key sectors 10% Key local markets 8% Business environment 5% Inter-firm effort to improve and cooperate 5% Competitive location for key sectors / clusters 5% Economic, political and regulatory framework conditions 2% Development orientation of local society 5% Good place to live 5% Good place for poor to access economic opportunity 5% Good for the environment 5% Strategic decision making 30% Reliable planning process / methodology 10% Smart selection of interventions 10% Alignment to leverage support, power and resources 5% Follow-through to implementation 5% Ability to Execute 100% Municipal service delivery proficient 20% Utilisation of municipal resources 10% Municipal ability to execute 10% Public- and private-sector champions implement LED initiatives" 20% LED results to date 5% Process of LED initiative implementation 5% Organisation of capacity to implement LED initiatives 5% Leveraging more resources for LED implementation 5% Stakeholders participate and contribute to sound LED decisions 20% Results achieved from stakeholder participation to date 7% Processes of stakeholder contribution to LED decision making 7% Organisation of stakeholder contribution to LED decision making 6% Facilitate LED 20% LED facilitation results (calculated from other) 5% LED facilitation process 5% Organisation of capacity to facilitate LED 5% What resources are available for LED facilitation 5% Governance of LED by business & political leaders 15% Results of LED governance 5% Process of LED Governance 5% Organisation of LED Governance Capacity 5% Monitoring and Evaluation outcomes and impact (learning) 5% Don t know, don t care about 1 Aware of need to 2 + Trying something 3 + Now know what to do and how 4 + Now starting to do the right things 5 Consistently performing = excellence, best practice To pinpoint the factors of most concern, the 33 detailed factors are colour coded according to the strengths and weaknesses of your latest assessment scores. Achieving a high score is indicated by green shading; whereas a weak score is indicated by varying shades of red. The resulting image is interpreted by identifying the factors in red. These factors represent where improvement is necessary. The recommendations that follow in the next section, aim mainly to address the lower scoring factors. 100 Integrated Development Plan for
109 Recommendations The Municipality is clear about its role within the local economy to create an enabling environment. While significant improvement is evident in most of the areas tested, there are however a few areas that could also be improved. The most notable factor needing attention for this year is: Governance of LED Focus on formalisation of LED governance structure, which include key decision-makers within the municipality, organised business and other key LED partner organisations. (c) CLIMATE CHANGE The information under this heading was obtained from the document A climate change strategy and action plan for the Western Cape issued by the Provincial Government in December Climate change is one of the biggest challenges facing the international community. Although media coverage and talk is generally about the future impacts of climate change, our climate is in fact already changing and a further level of climate change is inevitable. The Western Cape is one of the areas within South Africa that can expect the highest degree of climate change and will be most adversely affected, with the predicted warming and drying conditions being most apparent in the western part of the region. If we continue along a business as usual path using energy in the way that we currently do, we are set to increase our energy consumption in the Western Cape Province from approximately 250 million gigajoule (GJ) in 2004 to 375 million GJ by Our industrial and transport sectors are currently the highest contributors towards this energy consumption. The Western Cape, as is the rest of South Africa, is heavily dependent on fossil fuels for its energy needs which means that we release a disproportionate amount of greenhouse gases for the energy that we use. This will serve as our contribution to climate change and may come back to haunt us in the form of droughts, floods and sea level rise that will cause significant socio-economic challenges. The leading international assessment on the costs of climate change, the Stern Review, estimates that damages from unmitigated climate change could range between 5% and 20% of GDP annually by The Western Cape is particularly vulnerable to the effects of climate change because of our coastal location and the influence of rising sea temperatures on our weather patterns. Since 2001, more than a dozen floods have ravaged our landscape and resources, as have several droughts. We were particularly hard hit in 2007 and 2008, when floods damaged key infrastructure, roads and crops in the province, costing our fiscus in excess of R1 billion each year. Although the scale and exact manifestation of the change is less certain, the application of a range of climate models to the province makes it possible to identify a number of stress factors with likely results: An increase in the annual average temperature of at least 1 C by 2050 (the Intergovernmental Panel on Climate Change (IPCC) Fourth Assessment Report released in February this year shows an expected increase of between 3 and 5 C by 2100). A possible increase in the frequency and intensity of extreme events. An increase in conditions conducive to wildfires (higher temperatures and increased wind velocity) Reduced rainfall in the western parts of the Western Cape. Decreased water resources. Reduced soil moisture from an increase in temperature coupled with a decrease in average precipitation. Temperature impacts on crop activities - crop burn, drought, pests and microbes resulting in yield reductions, and loss of rural livelihoods. Integrated Development Plan for
110 The above statements should not be regarded as forecasts but rather as indications of possible directions and scale of change. The most useful approach is to use these projections as an experimental basis for assessing additional risk - that is, the potential exposure to hazards to life, biodiversity or economic interests that climatic changes on this scale could pose. Vulnerable systems identified as priorities are: Natural systems - water, biodiversity, and coastal and marine systems and resources Economic sectors - agriculture, tourism and fisheries Economic resources and infrastructure - energy, transport, health and air quality The built environment, livelihoods and disasters - social systems and extreme events (floods, fires). Climate change can influence and react with a range of macro-variables. In the Western Cape it can be a driver of internal migration - should rural livelihoods decline - and production patterns. Climate change could interact with demographic and behavioural trends with implications for future health care and community service needs. Increased demands on the province s already-threatened energy security and water supply systems will have economic and social consequences. In addition, the province is likely to be influenced by international climate impacts and responses and the related effect on commodity prices, demand and volumes, requisite changes to production processes and socio-economic factors, including pressure for disaster relief and migration. Various renewable energy initiatives are currently being investigated or planned for the West Coast area. The Council strongly supports renewable energy initiatives and in Chapter 7 of this document (Action Protect environmental quality) it is proposed that a climate change strategy for Swartland be formulated before June (d) MIGRATION PATTERNS Migration constitutes a major challenge for the Swartland as it reflects in-migration of relatively unskilled persons and the out-migration of generally more highly skilled elements of the population better able to compete on merit in the larger labour market and thus also a serious loss for Swartland. No detailed statistics are available on the in- or out-migration of people to and from the Swartland, but the following observations can be made: Migration to the Swartland is a function of the availability of infrastructure, services and job opportunities, but these elements enjoy different priority in the decision making of different population groups. Towns such as Malmesbury in the Swartland offering comparatively high levels of infrastructure provision and perceived generally better employment prospects are likely in relative terms and given a sustained economic growth rate to attract increasing numbers of low income migrants in search of employment and better living conditions. The tendency under the White and Coloured population in the age group 20 to 30 years is to leave Swartland in search of employment elsewhere whereas the African population considers the Swartland as a better option to find employment than their places of origin. A notable trend appears to be the permanent in-migration of both professionals and retired people into the coastal and inland small towns. The relative imbalance in the growth of the higher income and the lower income components of the local population will increase the exposure of Swartland to external funding through the intergovernmental transfer mechanism. The Equitable Shares grant is fast becoming inadequate in relation to the actual costs of providing services. This imbalance can result in upward pressure on local poverty levels with an increasing proportion of local households having to rely on some form of state subsidy or social grant as their means of survival. Actions taken by Swartland to stimulate local economic growth and providing infrastructure and services in themselves create expectations of employment and of a relatively improved quality of life and thus potentially increase in-migration. Although in- and out-migration cannot be stopped, it must still be managed with great care by the Municipality. 102 Integrated Development Plan for
111 CHAPTER 7: THE STRATEGY [The whole Chapter 7 was rearranged and revised on 28 May 2015] 7.1 Vision, Mission and Slogan New vision and mission statements as well as a slogan for Swartland Municipality were formulated in It was circulated to all staff members my means of the Municipality s internal newsletter and they were invited to comment or to give inputs. The final vision, mission and motto are as follows: (a) VISION (an idealized view of where or what an organisation would like to be in the future - where we are going ) Swartland Municipality is a frontline organisation which promotes sustainable development and delivers services effectively and efficiently to all its people by building partnerships with all stakeholders. The key words and phrases in the vision must be interpreted as follows: Municipality: A municipality consists of the political structures, the administration and the community (Systems Act Section 2). Frontline: Dictionary definition: At the forefront of something, leading, foremost, influential, most important (in Afrikaans: toonaangewende) Sustainable development: Development that "meets the needs of the present without compromising the ability of future generations to meet their own needs. It rests on three pillars i.e. economic development, social development and environmental protection. Effectively: A measure of how inputs and outputs relate to the achievement of an institution's strategic objectives and goals. Efficiently: Maximum level of output for a given set of inputs, or the minimum required inputs to produce a given level of output. Partnerships: The purpose of partnerships is the joint creation of prosperity and the fair distribution thereof. Stakeholders: Any person, organisation, company or government body that has some form of interest in the Swartland municipal area. (b) MISSION (an organisation s present business scope and purpose - who we are, what we do and why we are here ) At Swartland Municipality it is our mission to promote social and economic stability and growth through the sustainable delivery of services in terms of our legal powers and functions to all our interested parties. (c) SLOGAN (a brief statement used to express a principle, goal, or ideal) Dedicated to service excellence! Integrated Development Plan for
112 7.2 Leadership philosophy and values (a) LEADERSHIP PHILOSOPHY Through participation, understanding and purposefulness we create an environment in which staff flourish and deliver an outstanding and sustainable service. (b) VALUES Mutual respect Positive attitude Honesty and integrity Self-discipline Solidarity and commitment Support Work in harmony 7.3 Terminology used (a) OUTPUTS AND OUTCOMES Firstly we have to understand the difference between outputs and outcomes. In the Guide to the Outcomes Approach, Presidency, 1 June 2010, outputs and outcomes are defined as follows: Outputs are the results and effectiveness of activities, processes and strategies of a program of the Municipality. It shows the deliverables of programmes and projects. Outputs are used to measure effectiveness. Outcomes are the quality and/or impact of the outputs on achieving the overall objective. It shows the broader consequences of programmes and projects. Outcomes are used to measure efficiency. National Treasury s Framework for Managing Programme Performance Information, May 2007, defines outputs and outcomes as follows: Outputs are the final products, or goods and services produced for delivery. Outputs may be defined as "what we produce or deliver". Outcomes are the medium-term results for specific beneficiaries that are the consequence of achieving specific outputs. Outcomes are "what we wish to achieve". The following figure indicates the meaning of and relationship between outcomes, outputs, actions and inputs: 104 Integrated Development Plan for
113 What we aim to change IMPACT Manage towards achieving results What we wish to achieve OUTCOMES What we produce or deliver OUTPUTS What we do ACTIONS Plan, budget, implement What we use to do the work INPUTS An outcomes approach will ensure that Management of the Municipality is focused on achieving the expected improvements in the effective, efficient and economical functioning of the organisation. It will ensure that the results of what every employee is doing, contributes to improving the functioning of the organisation and the lives of Swartland residents rather that just the carrying out of functions (b) RISKS Risks manifest as negative impacts on goals and objectives or as missed opportunities to enhance institutional performance. Stakeholders expect the Municipality to anticipate and manage risks in order to eliminate waste and inefficiency, reduce shocks and crises and to continuously improve capacity for delivering on their institutionalised mandates. A risk is therefore an event, potential or real, that could have an impact on the institution achieving its objectives. There is a direct correlation between risks and outcomes. You cannot have risks that are not linked to outcomes as it would serve no purpose. Outcomes on the other hand must be linked to risks in order to determine the correct and appropriate management interventions. It is also apparent that risk is measured in terms of the impact that it would have on the achievement of objectives and the likelihood of the risk materialising. The risk rating = impact score X likelihood score. Inherent risks are without any controls and residual risks are with controls. This can graphically be illustrated as follows: Integrated Development Plan for
114 IMPACT 5 Critical 4 Major 3 Moderate 2 Minor Heat Map Insignificant Rare Unlikely Moderat e Likely Commo n LIKELIHOOD Inherent risk ratings Rating Magnitude Response High Unacceptable level of inherent risk. High level of control intervention required to achieve an acceptable level of residual risk Medium Unacceptable level of inherent risk, except under unique circumstances or conditions. Moderate level of control intervention required to achieve an acceptable level of residual risk. 4 6 Low Mostly acceptable level of inherent risk. Medium level of control intervention required. 1-3 Minimum Acceptable level of inherent risk. Low level of control intervention required, if any. Residual risk ratings Rating Magnitude Response High Unacceptable level of residual risk. Implies that the controls are either fundamentally inadequate (poor design) or ineffective (poor implementation). Controls require substantial redesign or a greater emphasis on proper implementation Medium Unacceptable level of residual risk. Implies that the controls are either inadequate (poor design) or ineffective (poor implementation). Controls require some redesign, or a more emphasis on proper implementation. 4 6 Low Mostly acceptable level of residual risk. Requires minimal control improvements. 1-3 Minimum Acceptable level of residual risk. Adequate controls implemented and adhered to. 7.4 Background to the Strategy (a) WHAT IS STRATEGY? Strategy is a systemic process of interconnected activities. Strategic planning is the process by which management of an organisation envision its future and develop the necessary procedures and operations to achieve that future. It is about gap-closing activities that will realise the desired future state sooner and faster. Strategic planning, in order to be effective, must be accepted by all those personnel who will ultimately be expected to implement, to monitor, and who will be held responsible for the results of the plan. Things will not happen because leadership said so. In reality things happen because there is an understanding of why things need to change and of what leadership is aiming for. 106 Integrated Development Plan for
115 (b) STRATEGY WORKSHOP - 9 NOVEMBER 2010 The development of a new five year strategy for Swartland Municipality started with this strategy workshop. Present at this strategy workshop were the executive mayoral committee members as well as all directors and division heads. During the workshop participants were asked to write down the one issue that concerns them the most about the Municipality. The key issues listed clearly fell into seven groups that deal with the Municipality s - financial situation; clients; workforce; services; involvement in sustainable development; organisational structure and arrangements; and protection of community safety From these groups of key issues the Municipality developed the seven strategic outcomes set out in the table in paragraph (v) below. (c) THE MAJOR RISKS FACING THE MUNICIPALITY (HIGH IMPACT AND HIGH LIKELIHOOD) In a follow-up session on risk management, the major risks that could close down a municipality were identified. The inherent risk ratings in terms of impact and likelihood were also determined. The major risks are the following: Major risk Inherent risk rating Impact Likelihood Rating If there is insufficient revenue to meet the demand for services If services are expensive and unaffordable If clients are unsatisfied / uninvolved / uninformed If there is a lack of appropriately skilled and productive staff If the working environment is unsafe and unhealthy If infrastructure is ageing and poorly maintained and can result in a collapse in services If there is a lack of capacity in respect of infrastructure If there is an imbalance between the three pillars of sustainable development i.e. environment, economy and people If there is a lack of good governance If management - and IT systems are inadequate If there is a decrease in law compliance If we are insufficiently prepared for disasters The route causes of these risks are set out in the table in paragraph (v) below. Integrated Development Plan for
116 (d) STRATEGY FORMULATION PROCESS - SEPTEMBER TO NOVEMBER 2011 During the months of September, October and November 2011 the process of putting a strategy together was continued. The following strategy discussions and sessions took place: Strategy discussions with all municipal departments: Strategy discussions with the executive mayoral committee: Strategy workshop involving all councillors, top management of the Municipality and external stakeholders: Strategy workshop involving the executive mayoral committee as well as all directors and division heads of the Municipality: 30 September - 28 October 11 October 1 November 8 November 7.5 The Municipality's five year strategy [revised on 26 May 2016] (a) PILLARS FOR A SUCCESSFUL STRATEGY (FROM THE BACK TO BASICS APPROACH COGTA) Things need to be done differently if we want different solutions. We cannot solve today s problems with the same level of thinking that created the problems in the first place (Albert Einstein). The situation needs a change of paradigm that focuses on serving the people and not political elites and organisations. A successful municipal strategy will be based on the following five pillars: 1 Sound Financial Management: A municipality must ensure sound financial management and accounting, and prudently manage resources so as to sustainably deliver services and bring development to communities. 2 Public participation: Putting people first: A municipality must put people and their concerns first and ensure constant contact with communities through effective public participation platforms. 3 Building capable institutions and administrations: A municipality must build and maintain sound institutional and administrative capabilities administered and managed by dedicated and skilled personnel at all levels. 4 Basic services: Creating conditions for decent living: A municipality must create conditions for decent living by consistently delivering municipal services to the right quality and standard. This includes planning for and delivery of infrastructure and amenities, maintenance and upkeep, including the budgeting to do this. Ensure no failures in services and where there are, restore with urgency. 5 Good Governance: A municipality must be well governed and demonstrate good governance and administration - cut wastage, spend public funds prudently, hire competent staff, ensure transparency and accountability. (b) UNPACKING THE STRATEGY Each of the seven outcomes is included under one of the above-mentioned pillars for a successful strategy. For each of the outcomes, detail information on the following is provided: the major risks, risk ratings and the root causes (both internal and external) for each of the major risks; the outputs necessary to mitigate or minimise the risks and to ensure realisation of the outcomes; the actions and processes related to each output and who is responsible; and the key performance indicators (KPI s), standards and targets that will be used to measure the extent to which outputs are being reached. 108 Integrated Development Plan for
117 1 Sound Financial Management Back to basics approach: Sound financial management is integral to the success of local government. In support of the legislated functions, municipalities will have to ensure the following: A functional financial management system which includes rigorous internal controls Eliminating wasteful expenditure Supply chain management structures and controls with appropriate oversight Cash-backed budgets Effective collection of revenue Effective servicing of debt Ensuring the provision of free basic services and the maintenance of indigent register STRATEGIC OUTCOME 1: A FINANCIALLY SUSTAINABLE MUNICIPALITY WITH WELL MAINTAINED ASSETS Major Risks Risks 1.1 If there is insufficient revenue to meet the demand for services no controls Risk rating with - Root causes existing controls future controls Internal Non-core operational functions Incomplete / inaccurate revenue database Long term strategy not based on a realistic income potential External funding not investigated fully Tariffs that are not cost recoverable Surplus generated from electricity sales under serious threat due to increase in cost causing reduced consumption and conversion to renewable energy External External economic factors IMPACT LIKELIHOOD Integrated Development Plan for
118 Risks 1.2 If services are expensive and unaffordable no controls Risk rating with - Root causes existing controls future controls Internal Non-core operational functions High cost of maintaining and replacing services infrastructure No standard costing Tariffs that are not cost recoverable External High increases in the cost of bulk increases (ESKOM, Water) Collective agreements regarding salaries Unfunded mandates Progress since 2012 All debt collection officials were trained as law enforcement officers during The Engen site in Malmesbury was redeveloped in The first batch of water demand management devices for revenue protection was delivered in Jan 2014 and will be installed in Abbotsdale as a pilot project. Due date is June During 2014 a new McDonald s and a new West Coast College Campus established in Malmesbury and major expansions took place at SASKO. During 2013 financial contributions were received from SASKO (R2.1 million), McDonalds (R ) and the Van Zyl Family Trust (R ). Swartland Municipality received R2m from PPC in its 2013/14 fin year. R1.5m will be received in 2014 and another R1.5m in These contributions are for the waste water treatment works in Riebeek Kasteel. Yzerfontein Harbour was outsourced with effect from 1 September Long term (20 year) lease agreement concluded with effect from 1 January 2016 in respect of land in Yzerfontein to ensure optimum financial and other benefit related to a new Modular Data Centre in the vicinity. Outputs Actions Processes Responsible Key Performance Indicators Targets Output 1.1: Secured and increased sources of revenue (Review tariffs in respect of water, sewerage and refuse) inactive at present Maintain and improve on debt collection Housing education - financial responsibility in respect of payments of accounts Evaluate the result of the use of the water demand management devices by comparing the outstanding debt for 2013/14 with that of 2014/15 Director Fin Services Director Dev Services Director Fin Services Housing consumer education at Phola Park housing project completed Evaluation done and result reported to Management Team Yes (by June 2017) Yes (by June 2017) 110 Integrated Development Plan for
119 Actions Processes Responsible Key Performance Indicators Targets Secure new sources of Investigate new sources of revenue, Strategic Investigate and report to management Yes (annually in revenue external funding sources and government grants Manager meeting October) Investigate equitable share allocations to indigent households with the aim to effectively balance the pay-outs with the National Grant received Investigate possible sliding scale for municipal flats rent tariffs Marketing of Swartland to attract new economic development Facilitate new businesses to establish in the area Output 1.2: Affordable and well managed budget Monitor the financial health of Measure and report on financial the Municipality against performance against ratio s and financial standards standards and identify controls Output 1.3: Curtailing expenditure Streamlining of municipal organisation Director Fin Services Director Fin Services Municipal Manager and Strategic Manager Municipal Manager Director Fin Services Investigate and report to the Mayoral Municipal Committee on the streamlining of Manager municipal services to curtail expenditure Output 1.4: Well managed and maintained assets Maintain and utilise assets Investigate an asset management effectively and efficiently programme Director Fin Services Investigate and report to management meeting Yes (by October 2016) Investigate and report to management Yes (by October meeting 2016) Marketing Plan for Swartland finalised Yes (by June 2017) Report on the success of the Marketing Yes (by June 2018) Plan during 2017/2018 submitted to the Mayoral Committee Report to the Mayoral Committee on the number of engagements with potential investors and stakeholders to bring growth to the area and the number of successes Report to Management Team on Municipality s performance against ratio s and standards Investigation completed and reported to the Mayoral Committee Investigation completed and submitted to Management Team Yes (annually by June) Yes (annually by November) Yes (annually by October) Yes (by June 2017) Integrated Development Plan for
120 2 Public participation: Putting people first Back to basics approach: Municipalities must develop affordable and efficient communication systems to communicate regularly with communities and disseminate urgent information. The basic measures to be monitored include: Implementing community engagement plans targeting hotspots and potential hotspots areas Communicating the municipalities plans to deal with backlogs Functional ward committees and Councillors meeting with and report back to their constituencies quarterly Utilising ward committees and ward councillors to communicate projects earmarked for implementation Acting on complaints, petitions and other feedback The number of council effective public participation programmes conducted The regularity of community satisfaction surveys carried out STRATEGIC OUTCOME 2: SATISFIED, INVOLVED AND WELL INFORMED STAKEHOLDERS Major Risks Risks 2.1 If clients are unsatisfied / uninvolved / uninformed no controls Risk rating with - Root causes existing controls future controls Internal Poor or ineffective communication with our clients Political promises not delivered Ineffective functioning of and inadequately represented ward committees Lack of public knowledge with respect to ward committees and ward committee members Poor or no reaction to complaints regarding service delivery External Spreading of wrong perceptions and incorrect information Unrealistic expectations Corruption in government Resistance against high service costs Politicised environment Poor understanding/ insight (provider and receiver) Lack of organised tax / services / client forums Poor communication from public regarding concerns IMPACT LIKELIHOOD 112 Integrated Development Plan for
121 Progress since 2012 The client services charter was revised in 2013 to improve standards. A draft communication strategy was completed by May 2014 and is awaiting approval by Council An executive summary of the IDP in full colour booklet format was completed and distributed in The client services charter was revised in 2014 to improve standards. A communication strategy was approved in June 2014, linked to the IDP term. Policies on communication and public participation were approved during June Outputs Actions Processes Responsible Key Performance Indicators Targets Output 2.1: Prompt, courteous and responsive service that is sensitive to the needs/concerns of the public and respectful of individual rights All actions deleted Output 2.2: External and internal stakeholders / clients that are well informed on and actively participating in municipal matters Formulate and implement a communication strategy and plan Annual review of communication action plans and relevant IDP indicators and targets for next financial year Director Corp Services Manager Public Relations Annual review completed Output 2.3 (Citizens that are actively participating in municipal decision-making) deleted and combined with Output (Involve external and internal clients in the compilation of municipal strategies, policies and programmes) inactive at present Ensure actively functioning Amend ward committee rules and Manager Amendment of ward committee rules and adequately represented ward committees procedures Secretariat & and procedures finalised Records Yes (annually by June) Yes ( before municipal election) Integrated Development Plan for
122 3 Building capable institutions and administrations Back to basics approach: There has to be a focus will be on building strong municipal administrative systems and processes. It includes ensuring that administrative positions are filled with competent and committed people whose performance is closely monitored. The basic requirements to be monitored include: Enforcing competency standards for managers and appoint persons with the requisite skills, expertise and qualifications Realistic municipal organograms, underpinned by a service delivery model and affordable Implementable human resources development and management programmes Sustained platforms to engage organised labour to minimise disputes and disruptions Implementing and managing effective performance management systems STRATEGIC OUTCOME 3: AN EFFECTIVE, EFFICIENT, MOTIVATED AND APPROPRIATELY SKILLED WORK FORCE Major Risks Risks 3.1 If there is a lack of appropriately skilled and productive staff no controls Risk rating with - Root causes existing controls future controls Internal External Insufficient succession and Better opportunities/better training planning salaries elsewhere ( brain Insufficient capacity drain ) building Scarce and unaffordable Poor knowledge sharing skills Inefficient method of work (low productivity) Uneconomical utilisation of resources Silo approach of departments Primary functions are neglected compared to secondary functions IMPACT LIKELIHOOD 114 Integrated Development Plan for
123 Risks 3.2 If the working environment is unsafe and unhealthy Progress since 2012 no controls Risk rating with - Root causes no controls no controls Internal Non-compliance with prescriptions and regulations Non-usage and availability of safety clothing and equipment Insufficient training and awareness External A preliminary organisation and work study report was completed in Oct A perception / satisfaction survey was done under all staff members of the Municipality in May The Municipal Manager's annual roadshows were held in Nov 2012 and Nov Policy and standards for the recognition of achievement was developed and will be implemented after July Career paths for staff members on levels T12 and higher were finalised in July 2013 and are in the process of being finalised for levels T5 T11. Succession plan added to Recruitment and Selection Policy was finalised with the Labour Forum during April 2014 and will be considered by the Mayoral Committee in May Outputs Actions Processes Responsible Key Performance Indicators Targets Output 3.1: A motivated, productive work force pursuing Swartland Municipality s vision, mission, philosophy and values Undertake and implement an Undertake detailed surveys / studies per Director Corp Survey / study completed Yes (by June 2017) Organisation and Work study / department over a three year period with Services productivity survey the aim of a more effective and efficient organisation Manager HR Improve staff interaction and motivation Monitor the level of motivation of the workforce Manager HR Perception / satisfaction survey completed Yes (by December 2016) Recognition of achievements Implement policy for the recognition of achievement Manager HR Policy implemented Yes (by June 2016) Output 3.2 (A well trained and appropriately skilled work force, striving towards service excellence) inactive at present Output 3.3: Safe and healthy working environment Establish a culture of workplace health and safety Workplace safety awareness campaigns in all departments Manager OHS Awareness campaigns conducted Yes (bi-annually by October and March) Integrated Development Plan for
124 4 Basic services: Creating conditions for decent living Back to basics approach: The planning, implementation and maintenance of basic infrastructure is critical for sustaining basic standards of living and economic activity in our towns and cities. Municipalities must develop service standards for each service, and will establish systems for monitoring adherence to these standards. The basic activities to be performed and the performance indicators to be monitored include: Developing fundable consolidated infrastructure plans Delivering basic services Ensuring proper maintenance and immediate addressing of outages or maintenance issues Improving mechanisms to deliver new infrastructure at a faster pace whilst adhering to the relevant standards. Extend reach of basic services to communities living in informal settlements by providing temporary services STRATEGIC OUTCOME 4: ACCESS TO AFFORDABLE AND RELIABLE MUNICIPAL INFRASTRUCTURE Major Risks Risks 4.1 If infrastructure is ageing and poorly maintained which can result in a collapse in services 4.2 If there is a lack of capacity in respect of infrastructure no controls Risk rating with - Root causes existing controls future controls Internal Insufficient extension and upgrading of infrastructure Non-prioritisation of funding/projects Pressure of expansion Insufficient funds Larger portion of budget used for non-core activities Insufficient provision of funds in the past through depreciation and license conditions Non-prioritization of funding/projects Pressure of expansion Unmanaged in-migration Vandalism External IMPACT LIKELIHOOD 116 Integrated Development Plan for
125 Progress since 2012 In % of new applications for development on existing erven could be accommodated. Energy losses were 5.9% for the quarter January March 2014, down from 13.17% in July Water losses were 13.9% for the quarter January March 2014, down from 17.4% in July Standards for operating costs for water and sewerage and electrical services were developed in By March 2014 the licensing process in respect of the waste disposal facilities in Darling and Yzerfontein has been completed. Only an adaptation license is necessary for Darling. The facility in Moorreesburg - waiting for permit. In respect of the waste disposal facilities in Riebeek West, Riebeek Kasteel and Koringberg an environmental consultant was appointed in Dec 2013 to manage the process. An application for these areas was submitted and is funded by DEAT. Outputs Actions Processes Responsible Key Performance Indicators Targets Output 4.1: Sufficient capacity in respect of infrastructure Ensure that there is always Ensure up to date master planning with Civil Annual review of master plan for water Yes (annually by sufficient water and sewerage respect to water and sewerage services Engineering services completed June) infrastructure capacity to accommodate demand Services Annual review of master plan for sewerage services completed Yes (annually by June) Ensure that there is always sufficient electricity infrastructure capacity to accommodate demand Ensure up to date master planning with respect to electricity services Electrical Engineering Services Annual review of master plan for electricity services completed Yes (annually by June) Output 4.2: Affordable municipal infrastructure Minimise water distribution losses and departmental operating costs Minimise energy distribution losses and departmental operating costs Maintain water losses at an acceptable level Maintain energy losses at an acceptable level Director Civil Engineering Services Output 4.3: Reliable, safe and well operated and maintained municipal infrastructure (Measurements against benchmarks / standards to confirm reliability and safety levels) 4.3.1(a) Water: Ensure that the Water: Secure a realistic amount on the Director Civil Annual Budget makes Annual Budget for maintenance, Engineering adequate provision for renewal, upgrading and refurbishment Services maintenance, renewal, upgrading and refurbishment of existing obsolete networks and equipment % total water losses Maintain the annual average below 17% Director % total energy losses (technical + nontechnical) Electrical Eng Services Water: % of the depreciated asset value provided on the Annual Budget for maintenance, renewal, upgrading and refurbishment Maintain the annual average below 8% Norm = 7.5% Actual /14: 1.38% 2014/15: 1.01% Integrated Development Plan for
126 Actions Processes Responsible Key Performance Indicators Targets Sewerage: Secure a realistic amount on Director Civil Sewerage: % of the depreciated asset Norm = 7.5% the Annual Budget for maintenance, Engineering value provided on the Annual Budget Actual /14: 1.86% renewal, upgrading and refurbishment Services for maintenance, renewal, upgrading 2014/15: 9.78% and refurbishment 4.3.1(b) Sewerage: Ensure that the Annual Budget makes adequate provision for maintenance, renewal, upgrading and refurbishment of existing obsolete networks and equipment 4.3.1(c) Electricity: Ensure that the Annual Budget makes adequate provision for maintenance, renewal, upgrading and refurbishment of existing obsolete networks and equipment Roads and storm water: Speed up routine maintenance to temporarily stop the deterioration of roads and storm water Electricity: Secure a realistic amount on the Annual Budget for maintenance, renewal, upgrading and refurbishment Director Electrical Engineering Services Note: There are not sufficient funds to do preventative maintenance, which means roads and storm water will inevitably deteriorate in the long run (Gravel roads) inactive at present (Waste Management: Address unlicensed waste disposal facilities) inactive at present 4.3.5(a) Parks: Ensure that the Annual Budget makes adequate provision for maintenance, renewal, upgrading and refurbishment of existing obsolete networks and equipment. Roads and stormwater: Secure a realistic amount on the Annual Budget for maintenance, renewal, upgrading and refurbishment Parks: Secure a realistic amount on the Annual Budget for maintenance, renewal, upgrading and refurbishment Director Civil Engineering Services Director Civil Engineering Services Electricity: % compliance with Nersa licence condition with respect to 5% of revenue for maintenance, renewal, upgrading and refurbishment annually Roads and stormwater: % of the depreciated asset value provided on the Annual Budget for maintenance, renewal, upgrading and refurbishment Parks: % of the depreciated asset value provided on the Annual Budget for maintenance, renewal, upgrading and refurbishment 50% Norm = 7.5% Actual /14: 2.31% 2014/15: 2.04% Norm = 7.5% Actual /14: 12.22% 2014/15: 13.96% 118 Integrated Development Plan for
127 Actions Processes Responsible Key Performance Indicators Targets 4.3.5(b) Sport Grounds and Sport Grounds and Swimming Pools: Director Civil Sport Grounds and Swimming Pools: % Norm = 7.5% Swimming Pools: Ensure that Secure a realistic amount on the Engineering of the depreciated asset value Actual /14: 6.57% the Annual Budget makes Annual Budget for maintenance, Services provided on the Annual Budget for 2014/15: 11.22% adequate provision for renewal, upgrading and refurbishment maintenance, renewal, upgrading and maintenance, renewal, refurbishment upgrading and refurbishment of existing obsolete networks and equipment (Adequate play areas for children) inactive at present Municipal Property Maintenance: To be maintained to minimum level to prevent deterioration. Municipal Property Maintenance: Secure a realistic amount on the Annual Budget for maintenance, renewal, upgrading and refurbishment Director Civil Engineering Services Municipal Property Maintenance: % of the depreciated asset value provided on the Annual Budget for maintenance, renewal, upgrading and refurbishment Norm = 7.5% Actual /14: 1.12% 2014/15: 0.90% Integrated Development Plan for
128 STRATEGIC OUTCOME 5: SUSTAINABLE DEVELOPMENT OF THE MUNICIPAL AREA Major Risks Risks no controls 5.1 If there is an imbalance between the three pillars of sustainable development i.e. environment, economy and people Risk rating with - Root causes existing controls future controls Internal Poor decision-making Insufficient relevant new knowledge in Municipality Insensitivity towards sustainable development Lack of pro-active infrastructure planning Imbalanced infrastructure development Ineffective / unfocussed marketing of Swartland Departmental silo thinking Unmanaged in-migration Lack of buy-in, nonimplementation of and deviation from sector plans Lack of income-generating projects Lack of awareness of green development Illegal development Lack of political / administrative alignment and focus Lack of shared information in respect of economic drivers and strengths of towns Lack of information in respect of potential of development Lack of baseline information External Lack of co-operation between spheres of government Rigid application of development requirements by provincial government Urban bias in national and provincial government when deciding on national investment Low skills levels / skills development not relevant and not up to standard Unrealistic expectations Inequality - people/ towns/ rural area/ metropole Unbalanced or insufficient economic growth Poor global economy Outflow of capital from Swartland due to close proximity of Metropole High human needs in towns other than Malmesbury as a result of limited economic and social means and opportunities IMPACT LIKELIHOOD 120 Integrated Development Plan for
129 Progress since 2012 The Social Development Policy and Strategy was approved in May Action plans in terms of the Social Development Policy and Strategy are being finalised in Action Plans in terms of the Spatial Development Framework were prioritised and grouped into implementable projects. They were submitted at the budget week in Dec A prioritisation meeting was held in Feb The Dept of Environmental Affairs and Development Planning appointed a service provider to compile a Climate Change Strategy as part of the Provincial Built Environment Support Program (BESP). Project will be completed by Sep Project for energy efficiency and demand side management approved in March R5 million awarded for 2013/2014. Participatory Appraisal of Competitive Advantage (PACA) process was done from Jan LED Strategy was approved by the Mayoral Committee on 10 February Outputs Actions Processes Responsible Key Performance Indicators Targets Output 5.1: Social development that improves people s quality of life Implementation of the Social Report submitted Development Policy and Strategy Internal Social Development : Committee must identify projects, prioritise, set objectives and submit to relevant department for budget consideration Output 5.2: Sound management of the urban and rural environment (Implementation of the Spatial Development Framework) inactive at present (Protect environmental quality) inactive at present (Land use and building control management) inactive at present Implementation of the integrated human settlement plan Annual review of the integrated human settlement plan Output 5.3: Economic growth that benefits all Formulate LED strategy and Economic development marketing action plan implementation plans, systems, processes and campaigns Manager Community Development Manager Housing Strategic Manager Annual review completed Housing pipeline revised Plans, systems, processes and campaigns approved subject to funds provided by Provincial Government Yes (annually by October for budget purposes) Yes (annually by May) Yes (annually by April) Yes (by July 2017) Integrated Development Plan for
130 STRATEGIC OUTCOME 7: INCREASED COMMUNITY SAFETY THROUGH TRAFFIC / BY-LAW ENFORCEMENT AND DISASTER MANAGEMENT Major Risks Risks 7.1 If there is a decrease in law compliance 7.2 If we are insufficiently prepared for disasters Progress since 2012 no controls Risk rating with - Root causes existing controls future controls Internal Municipal Police Service becoming unaffordable Insufficient enforcement of municipal by-laws and traffic legislation Insufficient resources to serve the demand for licensing and registration Uninformed public Vulnerability for corruption by traffic officials Insufficient resources Lack of comprehensive disaster management plan Lack of disaster management structure Non-compliance with firefighting by-law External Court sentences not sufficient deterrent Easy withdrawal of traffic and by-law offences by public prosecutors SAPS having a limited role to play Increased mentality of lawlessness within public domain Provincial mandate shared with the District Municipality Extreme weather patterns (climate change) A new specialised law enforcement unit that replaces the Municipal Police Service is in place from 1 July A new Disaster Management Plan was approved in June IMPACT LIKELIHOOD 122 Integrated Development Plan for
131 Outputs Actions Processes Responsible Key Performance Indicators Targets Output 7.1: Increase in law compliance (Establish a more efficient and focused structure in terms of registration, licensing and roadworthiness of vehicles) deleted Effective enforcement of municipal by-laws and traffic legislation Implement awareness campaigns with regards to law enforcement services Review current by-laws and fines applicable to traffic and law enforcement service Major law enforcement awareness campaigns Director Protection Services and Director Corp Services Chief Traffic & Law Enforcement Output 7.2: Strengthening of firefighting service Updated firefighting by-law Annual review of firefighting by-law Chief Fire Services Output 7.3: Effective disaster management Disaster management plan Annual review of Disaster Management Plan Director Protection Services By-laws reviewed At least one per annum By-law reviewed Review completed Yes (annually before end of June) Yes (annually before end of June) Yes (annually by June) Yes (annually by June) Integrated Development Plan for
132 5 Good Governance Back to basics approach: Good governance is at the heart of the effective functioning of municipalities. Municipalities should constantly monitor and evaluate their ability to carry out the following basics: Addressing of post audit action plans Decisive action against fraud and corruption The holding of Council meetings as legislated The functionality of oversight structures, section 79 committees, audit committees and District IGR Forums Whether or not there has been progress following interventions over the last 3-5 years Assess the existence and efficiency of anti-corruption measures The extent to which there is compliance with legislation and the enforcement of by laws The rate of service delivery protests and approaches to address them STRATEGIC OUTCOME 6: AN AGILE, INTEGRATED, STABLE AND CORRUPTION FREE ORGANISATION Major Risks Risks 6.1 If there is a lack of good governance no controls Risk rating with - Root causes existing controls future controls Internal Inadequate controls Non-identification of risks affecting the Municipality (risk management not fully implemented) Inefficient organisational structure Poor decision-making (not risk related) Lack of political / administrative alignment and focus External IMPACT LIKELIHOOD 124 Integrated Development Plan for
133 Risks 6.2 If management - and IT systems are inadequate Progress since 2012 no controls Risk rating with - Root causes no controls no controls Internal Outdated technology Lack of training for IT staff on new technology Poor/lack of integration and development of systems Inadequate planning Insufficient funds External A fraud and corruption and whistle blowing awareness session with staff members was held in August All reported fraud and corruption were investigated and appropriate action taken to prevent recurrence. A Risk Based Audit Plan (RBAP) was approved by the Audit Committee in Aug A Risk Management Strategy and Implementation Plan was accepted by the Risk and Audit Committee in Feb An ethics training session was held in Oct The Municipality received five consecutive clean audit reports between 2011 and Outputs Actions Processes Responsible Key Performance Indicators Targets Output 6.1: Improved organisational focus and performance Monitor the implementation of the Municipality s strategic plan (IDP) Ensure up to date strategic plan (IDP) as per legislative requirements Output 6.2: Improved organisational control environment Full implementation of risk Identify risks affecting the organisation management Compile / review RBAP according to updated risk assessments Strategic Manager Annual review of Strategic plan (IDP) completed Shared Updated strategic risk assessment Services and Managemen t team Internal RBAP updated Audit Yes (annually by May) Yes (annually by June) Yes (annually by July) Integrated Development Plan for
134 Actions Processes Responsible Key Performance Indicators Targets Output 6.3: Sound work ethics Maintain a zero tolerance to fraud and corruption Promote awareness of fraud and corruption and whistle blowing procedures and contact numbers under staff and the public Internal Audit Output 6.4: An effective, efficient and well-disciplined institution with sustainable capacity Improve community confidence and trust in the municipality Maintain an effective independent Audit Committee function as per legislation Output 6.5 (Relevant and efficient IT service and infrastructure) inactive at present Mayor, MM and Internal Audit Awareness campaign by external service provider for all departments up to supervisor level Annual evaluation of Audit Committee by Mayor and MM completed Yes (annually by August) Yes (annually by January) 7.6 Special strategic measures for the 2016/2017 financial year [added on 26 May 2016] (a) STABILITY OF PROVISION OF POTABLE WATER FROM THE VOëLVLEI DAM The level of the Voëlvlei Dam reached its lowest levels since the development of the dam in die 1950's. Unprecedented water saving measures had to be implemented in the Swartland. During February City of Cape Town limited its withdrawal from the dam to between 10 and 20% of its normal usage. The release of water from the dam into the Berg River for agricultural use was also stopped at this time. One of the problems experienced is that the bottom 18% of the water in the Voëlvlei Dam is difficult to access because of a ridge between the main volume of water and the Municipality's water treatment works. Phase one of the contingency plan therefore is to make the 18% accessible. This will in the first instance be done by using machinery to dig away a part of the ridge. Secondly so-called diamond pumps will be used to pump the water over the ridge to the side where the Municipality's water treatment works is located. Phase two of the contingency plan should the Voëlvlei Dam run dry is to obtain water from boreholes in areas with strong groundwater reserves with the cooperation of the farmers concerned. This poses its own challenges because the water is not purified. To bring this water into the reticulation system will be costly and the water will have to be purified before being used for human consumption. (b) INTEGRATED CRIME PREVENTION PLAN Swartland Municipality has identified the compilation of an Integrated Crime Prevention Plan as a high priority. It is also one of the Joint Planning Initiatives agreed upon with the Western Cape Government. The compilation will be done in collaboration with all role players. (c) LAND MANAGEMENT Swartland Municipality is investigating the establishment of a Land Management Unit. This will obviously require an amendment of the organisational structure and have budget implications. 126 Integrated Development Plan for
135 7.7 Implementation of the strategy The implementation of the strategy will be monitored continuously over the next five years. First of all the above table of outcomes, outputs, actions, processes, key performance indicators and targets will become a permanent item on the agenda of monthly management meetings so that management can discuss and monitor the success of actions and processes and the reaching of targets and make timely adjustments if necessary. Secondly the key performance indicators and targets in the above table will be integrated with the Municipality s performance management system where it impacts on the targets of directors and division heads. The Municipality s performance measurement is done on an electronic database system and all KPIs and targets will be linked to the strategic outcomes in the table above. Performance measurement is currently done on management level which involves the Municipal Manager and Directors, and on operational level which involves all division heads. No bonuses are involved. Although not a statutory requirement and not linked to the strategic objectives in the IDP, the performance of councillors is being measured from January All councillors participate in this performance management exercise on a voluntary basis with no bonuses involved. It is totally non political and only measures performance as a councillor, not as a political party member. 7.8 General indicators in terms of the Municipal Planning and Performance Management Regulations, 2001 [added on 30 May 2014] Regulation 10 of the Municipal Planning and Performance Management Regulations, 2001 prescribes the following general KPI s that will be included with the top level KPI s of the Municipality in the Service Delivery and Budget Implementation Plan (SDBIP) and also reported on in the Bi-annual Report and the Annual Report: (a) The percentage of households with access to basic level of water, sanitation, electricity and solid waste removal; (b) the percentage of households earning less than R1100 per month with access to free basic services; (c) the percentage of a municipality s capital budget actually spent on capital projects identified for a particular financial year in terms of the municipality s integrated development plan; (d) the number of jobs created through municipality s local economic development initiatives including capital projects; (e) the number of people from employment equity target groups employed in the three highest levels of management in compliance with a municipality s approved employment equity plan; (f) the percentage of a municipality s budget actually spent on implementing its workplace skills plan; and (g) financial viability as expressed by the following ratios: (i) B C A D A = debt coverage B = total operating revenue received C = operating grants D = debt service payments (i.e. interest + redemption) due within the financial year; Integrated Development Plan for
136 (ii) B A C A = outstanding service debtors to revenue B = total outstanding service debtors C = annual revenue actually received for services; (iii) B C A D A = cost coverage B = all available cash at a particular time C = investments D = monthly fixed operating expenditure 128 Integrated Development Plan for
137 CHAPTER 8: EXPENDITURE FRAMEWORKS: ALL SPHERES OF GOVERNMENT [Updated with the latest planning and financial information on 26 May 2016] 8.1 Provincial spending in the Swartland municipal area The information in the tables below was obtained from the publication Western Cape Government's Budget Estimates of Provincial Revenue and Expenditure 2016, Provincial Treasury, 3 March It indicates all Provincial payments and spending with respect to the Swartland municipal area during the 2016/17, 2017/18 and 2018/19 financial years. VOTE 1: PREMIER None VOTE 2: PROVINCIAL PARLIAMENT None VOTE 3: PROVINCIAL TREASURY Transfers to local government by transfer/grant type and category (Provincial Gazette Extraordinary 7576 of 3 March 2016) Grant 2016/ / /19 R'000 R'000 R'000 Purpose Financial Management Capacity Building Grant To develop financial human capacity within municipal areas to enable a sustainable local financial skills pipeline that is responsive to municipalities requirements to enable sound and sustainable financial management and good financial governance. VOTE 4: COMMUNITY SAFETY Provincial payments and estimates Programmes 2016/ / /19 R'000 R'000 R'000 Purpose Programme 2: Civilian Oversight To exercise oversight over the conduct, effectiveness and efficacy of law enforcement agencies in the Province. Programme 3: Provincial Policing Functions To promote good relations between communities and the police through its whole-of-society approach and to ensure that all service delivery complaints about policing in the province are dealt with independently and effectively. TOTAL Integrated Development Plan for
138 VOTE 5: EDUCATION Provincial payments and estimates Programmes 2016/ / /19 R'000 R'000 R'000 Purpose Programme 1: Administration To provide overall management of the education system in accordance with the National Education Policy Act, the Public Finance Management Act and other policies. Programme 2: Public Ordinary School Education To provide public ordinary education from Grades 1 to 12, in accordance with the SA Schools Act and White Paper 6 on Special Needs Education Building an Inclusive Education and Training System. E-learning is also included. Programme 3: Independent School Subsidies To support independent schools in accordance with the SA Schools Act. Programme 4: Public Special School Education To provide compulsory public education in special schools in accordance with the SA Schools Act and White Paper 6 on Inclusive Education. Including e-learning and inclusive education. Programme 5: Early Childhood Development (ECD) To provide ECD at the Grade R and pre-grade R level in accordance with White Paper 5 on Early Childhood Education Meeting the Challenge of ECD in SA. E-learning is also included. Programme 6: Infrastructure Development To provide and maintain infrastructure facilities for schools and other facilities utilised by the department. Programme 7: Examination and Education Related Services To provide education institutions as a whole with examination and education-related support. TOTAL Summary of details of expenditure for infrastructure by category Facility / Asset Name and Project Name Type of infrastructure Date: Start Date: Finish Total Project Cost Exp. from previous years 2016/ / /19 Outer Years R'000 R'000 R'000 R'000 R'000 R'000 NEW AND REPLACEMENT ASSETS (paid from the Education Infrastructure Grant - DORA) Laurie Hugo PS New School Primary 1 Apr Dec Moorreesburg HS New School Secondary 1 Jun Mar Vooruitsig PS Inappropriate structures - 1 Jan May Primary School TOTAL NOTE: In 2014 money was allocated in the budget of the Provincial Department of Education for 2016/17 for the building of a primary school in Chatsworth. This Provincial Department has now unilaterally and without consultation moved the money to The replacement of Chatsworth PS has been a priority for many years for Swartland Municipality and it remains a high priority. 130 Integrated Development Plan for
139 VOTE 6: HEALTH Provincial payments and estimates Programmes 2016/ / /19 R'000 R'000 R'000 Purpose Programme 2: District Health Services To render facility-based district health services (at clinics, community health centres and district hospitals) and communitybased district health services (CBS). Programme 4: Provincial Hospital Services Delivery of hospital services, which are accessible, appropriate, effective and provide general specialist services, including a specialised rehabilitation service, dental service, psychiatric service, as well as providing a platform for training health professionals and conducting research. Programme 6: Health Sciences and Training To create training and development opportunities for actual and potential employees of the Department of Health. Programme 7: Health Care Support Services To render support services required by the Department to realise its aims. Programme 8: Health Facilities Management The provision of new health facilities and the refurbishment, upgrading and maintenance of existing facilities, including health technology. TOTAL Summary of details of expenditure for infrastructure by category Facility / Asset Name and Project Name Type of infrastructure Date: Start Date: Finish Total Project Cost Exp. from previous years 2016/ / /19 Outer Years R'000 R'000 R'000 R'000 R'000 R'000 NEW AND REPLACEMENT ASSETS (paid from the Health Facility Revitalisation Grant) Abbotsdale Satellite Clinic Clinic replacement 5 May Apr Integrated Development Plan for
140 VOTE 7: SOCIAL DEVELOPMENT Provincial payments and estimates Programmes 2016/ / /19 R'000 R'000 R'000 Purpose Programme 1: Administration To capture the strategic management and support services at all levels of the Department i.e. Provincial, Regional, District and Facility/Institutional level. Programme 2: Social Welfare Services To provide integrated developmental social welfare services to the poor and vulnerable in partnership with stakeholders and civil society organisations. TOTAL VOTE 8: HUMAN SETTLEMENTS Transfers to local government by transfer/grant type and category (Provincial Gazette Extraordinary 7576 of 3 March 2016) Grant 2016/ / /19 R'000 R'000 R'000 Purpose Human settlements development grant (beneficiaries) To provide funding for the creation of sustainable human settlements. Provincial payments and estimates Programmes 2016/ / /19 R'000 R'000 R'000 Purpose Programme 3: Housing Development To provide housing opportunities, including access to basic services, to beneficiaries in accordance with the housing code. See Section 8.3 below for the Human Settlements Development Grant for Swartland in terms of Provincial Gazette Extraordinary 7576 of 3 March The housing projects are dealt with in terms of the Swartland Human Settlements Pipeline (see paragraph 8.8 below). 132 Integrated Development Plan for
141 VOTE 9: ENVIRONMENTAL AFFAIRS AND DEVELOPMENT PLANNING Transfers to local government by transfer/grant type and category (Provincial Gazette Extraordinary 7576 of 3 March 2016) Grant Regional Socio-economic Project/Violence Prevention through Urban Upgrading (RSEP/VPUU) - Municipal projects Provincial payments and estimates 2016/ / /19 R'000 R'000 R'000 Purpose To implement and enhance programmes to interact with stakeholders and empower communities to partner with government in implementing socioeconomic and urban upgrading programmes. Programmes 2016/ / /19 R'000 R'000 R'000 Purpose Programme 7: Development Planning (RSEP) To provide a regional planning and management service so as to promote inter-governmental and inter-sectoral coordination so as to ensure improved impact of public and private investment in physical development initiatives and to implement the RSEP-VPUU programme that promotes a whole of society approach to development planning and, in addition, other development planning special projects VOTE 10: TRANSPORT AND PUBLIC WORKS Transfers to local government by transfer/grant type and category (Provincial Gazette Extraordinary 7576 of 3 March 2016) Grant Financial Assistance to Municipalities for Maintenance and Construction of Transport Infrastructure Grant 2016/ / /19 R'000 R'000 R'000 Purpose To financially assist/subsidise municipalities with the maintenance/construction of proclaimed municipal main roads, where the municipality is the Road Authority (Section 50 of Ordinance 19 of 1976). Integrated Development Plan for
142 Provincial payments and estimates Programmes 2016/ / /19 R'000 R'000 R'000 Purpose Programme 3: Transport Infrastructure To deliver and maintain transport infrastructure that is sustainable, integrated, and environmentally sensitive, that supports and facilitates social empowerment and economic growth and promotes accessibility and the safe, affordable movement of people, goods and services. Programme 5: Transport Regulation To regulate the transport environment through the registration and licensing of vehicles, associations, operators and drivers; to promote safety through traffic law enforcement services, facilitate road safety education, communication, awareness and the operation of weighbridges; and to provide training to traffic policing and other law enforcement officials. TOTAL Summary of details of expenditure for infrastructure by category Facility / Asset Name and Project Name Type of infrastructure Date: Start Date: Finish Total Project Cost Exp. from previous years 2016/ / /19 Outer Years R'000 R'000 R'000 R'000 R'000 R'000 NEW AND REPLACEMENT ASSETS (paid from own funds) C967 Malmesbury Bypass Surfaced roads 13 Jan Jan REHABILITATION, RENOVATIONS AND REFURBISHMENTS (paid from own funds) C817 Mamre - Darling Surfaced roads 9 Jul Jul C920 Moorreesburg Surfaced roads 19 Mar Dec TOTAL Items not on the budget yet but in process are The Chatsworth bus route for which R12 million is required. This proposal has been directed to the CRDP and will need to be deliberated on further through this structure before any decisions are made with regards allocation of funds. The municipality must prepare to engage on this project with a full motivation. 134 Integrated Development Plan for
143 VOTE 11: AGRICULTURE Provincial payments and estimates Programmes 2016/ / /19 R'000 R'000 R'000 Purpose Programme 2: Sustainable Resource Management To provide agricultural support services to farmers in order to ensure sustainable development and management of agricultural resources. Programme 3: Farmer Support and Development To provide support to farmers through agricultural development programmes. Programme 4: Veterinary Services To provide veterinary services to clients in order to ensure healthy animals, safe animal products and welfare of people of South Africa. Programme 5: Research and Technology Development Services To render expert and needs based research development and technology transfer services impacting on development objectives. TOTAL VOTE 12: ECONOMIC DEVELOPMENT AND TOURISM None VOTE 13: CULTURAL AFFAIRS AND SPORT Transfers to local government by transfer/grant type and category (Provincial Gazette Extraordinary 7576 of 3 March 2016) Grant 2016/ / /19 R'000 R'000 R'000 Purpose Development of sport and recreation facilities 54 Provision of Sport and Recreation facilities in especially previously disadvantaged communities. Library Service: Replacement funding for most vulnerable B3 Municipalities To support municipal investment in library services and to sustain the future professional delivery and development of such services in the most vulnerable B3 municipalities. Community Library Services Grant To transform urban and rural public library infrastructure, facilities and services (primarily targeting previously disadvantaged communities) through a recapitalised programme at provincial level in support of local government and national initiatives. TOTAL Integrated Development Plan for
144 Provincial payments and estimates Programmes 2016/ / /19 R'000 R'000 R'000 Purpose Programme 3: Library and Archive Services To provide comprehensive library and archive services in the Western Cape. Programme 4: Sport and Recreation 54 To provide sport and recreation activities for the inhabitants of the Western Cape. TOTAL VOTE 14: LOCAL GOVERNMENT Transfers to local government by transfer/grant type and category (Provincial Gazette Extraordinary 7576 of 3 March 2016) Grant 2016/ / /19 R'000 R'000 R'000 Purpose Thusong Service Centres Grant (Sustainability: Operational Support Grant) 100 To provide financial assistance to municipalities, ensuring the financial sustainability of the Thusong Service Centres. Community Development Worker Operational Support Grant To provide financial assistance to municipalities to cover the operational and capital costs pertaining to the line functions of the community development workers including the supervisors and regional coordinators. TOTAL Provincial payments and estimates Programmes 2016/ / /19 R'000 R'000 R'000 Purpose Programme 2: Local Governance To promote viable and sustainable developmental local governance, integrated and sustainable planning and community participation in development processes. Programme 3: Development and Planning To promote and facilitate effective disaster management practices, ensure well maintained municipal infrastructure, and promote integrated planning. TOTAL Integrated Development Plan for
145 8.2 Swartland allocations in terms of the Division of Revenue Bill (DORA) of 18 February 2016 GRANT 2016/ / /19 Equitable share Energy Efficiency and Demand Side Management Grant Local Government Financial Management Grant Expanded Public Works Programme (EPWP) Municipal Infrastructure Grant (MIG) Integrated National Electrification Programme (Municipal) Grant Integrated National Electrification Programme (Eskom) Grant Thusong Service Centres Grant (Sustainability: Operational Support Grant) Community Development Worker Operational Support Grant TOTAL Swartland allocations in terms of Provincial Gazette Extraordinary 7576 of 3 March 2016 GRANT 2016/ / /19 Human settlements development grant Regional Socio-Economic Project (RSEP) Financial assistance for maintenance and construction of transport infrastructure Library service: Replacement funding for most vulnerable B3 municipalities Library service: Conditional grant Development of sport and recreation facilities Community Development Workers(CDW) operational support grant Thusong Service Centres Grant (Sustainability: Operational Support Grant) Financial Management Capacity Building Grant TOTAL Integrated Development Plan for
146 8.4 Swartland Municipality s five year capital budget per department Department and Division / Service 2016/ / / / /21 Office of the Municipal Manager Equipment MM Equipment Council Civil Engineering Services Buildings and maintenance Cemeteries Parks and amenities Roads Sewerage Sports Fields Storm Water Water Cleaning Services Equipment Ward committees Corporate Services General and Equipment Administration: Properties and Contracts Communication and Public Relations Development Services Community Development Housing Planning Caravan Parks Equipment Electrical Engineering Services Equipment Operations, Maintenance and Construction Information Management Financial Services Financial Services General Water demand management systems Protection Services Traffic and law enforcement Fire and emergency services GRAND TOTAL Integrated Development Plan for
147 8.5 Swartland Municipality s five year capital budget per IDP strategic outcome STRATEGIC OUTCOME 2016/2017 % 2017/2018 % 2018/2019 % 2019/2020 % 2020/2021 % Strategic Outcome 1: A financially sustainable municipality with well-maintained assets Strategic Outcome 2: Satisfied, involved and well informed stakeholders Strategic Outcome 3: An effective, efficient, motivated and appropriately skilled work force Strategic Outcome 4: Access to affordable and reliable municipal infrastructure Strategic Outcome 5: Sustainable development of the municipal area Strategic Outcome 6: An agile, integrated, stable and corruption free organisation Strategic Outcome 7: Increased community safety through traffic / by-law enforcement and disaster management TOTAL Ten largest capital projects /17 PROJECT BUDGET SOURCE(S) OF FINANCE pj Resealing/upgrading of roads and sidewalks (Swartland) CRRF pj Sport Projects: (MIG) Municipal Infrastructure Grant pj Electricity networks: New infrastructure CRRF pj Building of streets (Swartland) Municipal Infrastructure Grant pj Upgrading/Replacement water reticulation network Municipal Infrastructure Grant pj b RSEP - Parks and Amenities: Activity recreation nodes (playgrounds, RSEP Grant (DEADP) trees & benches) pj WWTW Moorreesburg CRRF pj New Library: Abbotsdale DCAS pj Vehicles Sewerage: CK14612 Nissan UD CRRF pj Sewerage: Chatsworth sewerage works CRRF The ten largest capital projects represent a total budget of R52.6 million which is 70.2% of the total capital budget. Integrated Development Plan for
148 8.7 Swartland Municipality s five year operating budget per IDP strategic outcome DEPARTMENT DIVISION 2016/2017 % 2017/2018 % 2018/2019 % 2019/2020 % 2020/2021 % Strategic Outcome 1: A financially sustainable municipality with well-maintained assets Financial Services Administration Grants and Subsidies - FMG Supply Chain Management TOTAL % % % Strategic Outcome 2: Satisfied, involved and well informed stakeholders Corporate Services Administration Libraries Marketing and Tourism Town and Community Halls TOTAL % % % Strategic Outcome 3: An effective, efficient, motivated and appropriately skilled work force Corporate Services Human Resources Development Services Occupational Health and Safety TOTAL % % % Strategic Outcome 4: Access to affordable and reliable municipal infrastructure Civil Services Administration Cemeteries Municipal Property Maintenance Parks and Recreational Areas Proclaimed Roads Refuse Removals Sewerage Services Sports grounds Streets and Storm water Swimming Pools Water Distribution Electricity Services Distribution IT Services TOTAL % % % Integrated Development Plan for
149 DEPARTMENT DIVISION 2016/2017 % 2017/2018 % 2018/2019 % 2019/2020 % 2020/2021 % Strategic Outcome 5: Sustainable development of the municipal area Development Administration Services Caravan Parks - Yzerfontein Community Development Planning and Valuations Building Control Housing TOTAL % % % Strategic Outcome 6: An agile, integrated, stable and corruption free organisation Council Council General Expenses Municipal Manager Administration Internal Audit TOTAL % % % Strategic Outcome 7: Increased community safety through traffic / by-law enforcement and disaster management Protection Services Administration Civil Protection Fire Fighting Harbour Yzerfontein Traffic: Licensing and Registration Services Traffic and Law Enforcement Services TOTAL % % % TOTAL BUDGET Integrated Development Plan for
150 8.8 Swartland Municipality s Human Settlements Pipeline - April 2016 PIPELINE PROJECTS 2016/ / / / /2021 Project Name Total sites Total units Sites Units Other Funding Required Sites Units Other Funding Required Sites Units Other Funding Required Sites Units Other Funding Required Sites Units Other Funding Required Abbotsdale Abbotsdale IRDP Abbotsdale FLISP Social & Economic Facilities Abbots CRU Chatsworth Riverlands Chatsworth FLISP Chatsworth UISP Darling Darling FLISP Darling Kalbaskraal ECD Facility Kalbaskraal IRDP Malmesbury Municipal flats Malmesbury UISP Malmesbury UISP Additional 100 erven Phola Park Wesbank Thusong Malmesbury FLISP Malmesbury IRDP Purchasing of land Moorreesburg Moorreesburg IRDP Riebeek Wes Riebeek Wes IRDP TOTAL Integrated Development Plan for
151 ANNEXURE 1: SWARTLAND PROFILE The information in this Annexure was taken from the following documents: Census 2011 compiled by Statistics South Africa; and 2015 Socio-economic Profile for Swartland Municipality compiled by the Western Cape Provincial Treasury. 1.1 Demographics (a) POPULATION GROUPS Annual Growth Black African % Coloured % Indian or Asian % White % Other TOTAL SWARTLAND % West Coast District % Source: Census 2011, Statistics South Africa The population increased from in 1996 to in 2001 and to in The average growth rate between 1996 and 2001 was 2% per annum while the growth between 2001 and 2011 escalated to a 57.8% increase of over the ten year period or an average growth of 4.7% per annum. The population of the West Coast District increased by 38.6% over the same period (or 3.3% per annum). Swartland was the second fastest growing municipality in the Western Cape between 2001 and This demographic growth trend is likely to add pressure to the demand for municipal services. In terms of population size Swartland is now the sixth largest municipality in the Western Cape out of 24 municipalities (Cape Town metro excluded) and the largest in the West Coast District. 64.8% of the population is Coloured, 18.3% Black African, 15.6% White, 0.5% Indian or Asian and 0.7% Other. Integrated Development Plan for
152 (b) SWARTLAND POPULATION PROJECTIONS, [updated on 26 May 2016] Year Population Source: Western Cape Department of Social Development, 2015 Of the five local municipalities within the West Coast District, Swartland has the largest population which is estimated to be in This total is projected to reach by 2020 which equates to an approximate 6.3% growth off the 2015 base estimate. (c) POPULATION PER WARD TOTAL Black African Coloured Indian or Asian White Other TOTAL Source: Census 2011, Statistics South Africa (d) POPULATION PER AREA 2011 [added on 30 May 2014] Area Black African Coloured Indian or Asian White Other TOTAL Koringberg Moorreesburg Ongegund Riebeek West Riebeek Kasteel Esterhof Abbotsdale Kalbaskraal Chatsworth Riverlands Integrated Development Plan for

![73 753 585 17 780 838 113 762 Source: Census 2011, Statistics South Africa (e) AGE AND GENDER DISTRIBUTION 2015 [updated on 26 May 2016] Age distribution 2015 Age cohort 2015 Source: Western Cape](/docs-images/89/99027790/images/153-1.jpg "Department of Social Development, 2015 Source: Western Cape Department of Social Development, 2015 Approximately 68% of the 120 314 inhabitants of the Municipality are currently considered to be")
153 Area Black African Coloured Indian or Asian White Other TOTAL Yzerfontein Grotto Bay Darling Malmesbury Wesbank, Sunnyside, Newclaire, Garden Village Ilinge Lethu, Saamstaan Swartland Non-Urban TOTAL Source: Census 2011, Statistics South Africa (e) AGE AND GENDER DISTRIBUTION 2015 [updated on 26 May 2016] Age distribution 2015 Age cohort 2015 Source: Western Cape Department of Social Development, 2015 Source: Western Cape Department of Social Development, 2015 Approximately 68% of the inhabitants of the Municipality are currently considered to be within the working age. These figures reveal that Swartland has a total dependency ratio of 46.2 which is slightly higher than the 2013 total of As higher dependency ratios imply greater strain on the working age to support their economic dependants (children and aged). Integrated Development Plan for
154 (f) MAJOR FIRST LANGUAGES SPOKEN Afrikaans 88.14% 76.18% IsiXhosa 7.99% 8.16% English 2.54% 4.30% Sesotho 0.95% 1.42% Setswana 0.06% 0.43% Sign language % Source: Census 2011, Statistics South Africa 76.2% of the population speak Afrikaans as first language. This is followed by IsiXhosa (8.2%) and English (4.3%). The proportion of the population speaking Afrikaans decreased by almost 12% between 2001 and 2011 while the proportion speaking English increased from 2.5% to 4.3%. 1.2 Social development and well-being (a) LITERACY [updated on 26 May 2016] A simple definition of literacy is the ability to read and write, which has been translated into the successful completion of a minimum of 7 years of formal education. Since most learners start school at the age of 7 years, the literacy rate is calculated as the proportion of those 14 years and older who have successfully completed a minimum of 7 years of formal education. The literacy rate in Swartland was recorded at 78.0 per cent in 2011 which is similar to that of the District (79.1 per cent) but well below the 87.2 per cent average literacy rate of the Province. (b) EDUCATION [updated on 26 May 2016] Educational levels reflect what skills are available to society and the labour market. The level of education provides an indication of the income potential and standard of living of residents in a particular geographic area. Educational levels 2011 Level 2011 No schooling Grade 12/Std 10/Form Higher Diploma Post Higher Diploma; Masters; Doctoral Diploma 186 Bachelor s Degree Bachelor s Degree and Post Graduate Diploma 356 Honours Degree 414 Higher Degree Masters/Phd 314 Source: Census 2011, Statistics South Africa 146 Integrated Development Plan for
155 Education indicators in Swartland Indicator Learner enrolment (Gr LSEN) Average dropout rate 32.9% Crude dropout rate using 2013 Gr 10 and 2015 Gr % Average Learner-teacher ratio 28.0 % Matric pass rate 85.2% 85.3% 88.3% No. of schools 31 Proportion of no fee schools 64.5% 74.2% No. of schools with libraries/media centres Source: Western Cape Department of Education, Annual Survey of public and independent schools (ASS) 2014 The learner enrolment figures rose marginally (1.3%) from in 2013 to in The average school dropout rate in Swartland was recorded at 32.9% in The dropout rate measured amongst Grade 10 learners of 2013 and Grade 12 learners at the start of 2015 was 20.0%. This implies that one in every five learners dropped out of school after Grade 10 and before they completed their schooling. Although Swartland s dropout rates are the lowest in the District, it remains at unacceptably high levels. The 2014 matric results for Swartland showed a slight improvement in the matric pass rate from 85.3% in 2013 to 88.3% in 2014, stepping up one position in terms of its overall municipal ranking within the West Coast. (c) HEALTHCARE [updated on 26 May 2016] Access to healthcare facilities is directly dependent on the number and spread of healthcare facilities within a geographic space. South Africa s healthcare system is geared in such a way that people have to move from primary, to secondary and tertiary levels of healthcare. The first point of contact would be at the primary healthcare level. Primary healthcare facilities include Community Health Centres (CHCs), Community Day Centres (CDCs) and Clinics, including satellite and mobile clinics. Healthcare facilities 2015 Number of PHC clinics - fixed 5 Number of PHC clinics - non-fixed (mobile/satellite) 9 Community health centres 0 Community day centres 0 Total number of PHC facilities (fixed clinics, CHCs and CDCs, excluding non-fixed) 5 Number of district hospitals 1 Number of regional hospitals 0 Emergency medical services: Number of operational ambulances per population 0.48 Source: Western Cape Department of Health, 2015 Integrated Development Plan for
156 HIV, AIDS and Tuberculosis prevalence and care / / /15 Antiretroviral treatment (ART) patient load Mother-to-child transmission rate 3.2% Number of ART clinics/treatment sites 13 Number of TB patients Number of TB clinics/treatment sites 18 Source: Western Cape Department of Health, 2015 At the end of June 2011, the Province highlighted that anti-retroviral treatment (ART) was provided to over persons in the Province, of whom were in the West Coast District and in the Swartland municipal area. By the end of March 2015 Swartland s patient load had increased to 1 545, administered from 13 treatment sites. In addition to improving the quality of life of the patient, anti-retroviral treatment to mothers both before and at birth, also decreases the chances that infants will contract HIV from their mothers. The most recent information for Swartland indicates a mother-to-child transmission rate of 3.2% which is above the 1.4% District and Provincial rate as well as the medium term annual target for 2015/16 and 2016/17. Child and maternal health 2015 Child health: Full immunisation coverage under 1 year 75% Malnourished children under 5 years (per ) 2.2 Neonatal mortality rate Low birth weight 13% Maternal health: Maternal mortality ratio 0 Percentage deliveries in respect of women under 18 years 8.2% Termination of pregnancy rate 3.9% Source: Western Cape Department of Health, 2015 The number of malnourished children under five years in Swartland in 2015 was 2.2 per which was below the District average. The neonatal mortality rate (1.5) is below the Province s 2019 target of 6.0 per live births. Low birth weight is associated with a range of both short- and long term consequences. In the Swartland 13% of babies had a low birth weight; just below that of the District (14%). 2 The neonatal mortality rate is the number of neonates dying before reaching 28 days of age, per live births in a given year. 148 Integrated Development Plan for
157 (d) POVERTY RATE [updated on 26 May 2016] The poverty rate is the percentage of people living in households with an income less than the poverty income. The poverty income is defined as the minimum monthly income needed to sustain a household and varies according to household size, the larger the household the larger the income required to keep its members out of poverty. The poverty rate for Swartland Municipality declined from 32.8% in 2001 to 27.6% in 2007 and 26.8% in 2010 (Source: Global Insight Regional Explorer, 2011). (e) GINI COEFFICIENT [updated on 26 May 2016] The Gini coefficient is a summary statistic of income inequality, which varies from 0 (in the case of perfect equality where all households earn equal income) to 1 (in the case where one household earns all the income and other households earn nothing). In practice the coefficient is likely to vary from approximately 0.25 to The national figure is 0.7. The Gini Coefficient for Swartland Municipality was 0.59 in 2001, 0.61 in 2007 and 0.59 in 2012 (Source: Quantec Research). (f) HUMAN DEVELOPMENT INDEX [updated on 26 May 2016] The Human Development Index (HDI) is a composite, relative index that attempts to quantify the extent of human development of a community. It is based on measures of life expectancy, literacy and income. It is thus seen as a measure of people s ability to live a long and healthy life, to communicate, to participate in the life of the community and to have sufficient resources to obtain a decent living. The HDI can assume a maximum level of 1, indicating a high level of human development, and a minimum value of 0. The Human Development Index for Swartland Municipality was 0.63 in 2001, 0.64 in 2007 and 0.67 in 2012 (Source: Quantec Research). (g) HOUSEHOLD INCOME [updated on 26 May 2016] In an effort to eliminate poverty and reduce inequality, the National Development Plan has set the objective of having zero households earn less than R418 per month by As per the table below, Swartland Municipality was in 2011 still behind this target with approximately 12.2 per cent of its households that earned less than R400 per month. Lower levels of household income increase indigent dependency on municipal support. Municipal resources are therefore strained in an effort to provide free basic services. Swartland annual household income 2001 and 2011 Income No income 4.6% 10.5% R1 R % 1.7% R4 801 R % 2.6% R9 601 R % 13.4% R R % 21.7% R R % 20.1% R R % 13.0% R R % 9.5% R R % 5.5% Integrated Development Plan for
158 Income R R % 1.5% R R % 0.4% R or more 0.2% 0.2% Source: Census 2011, Statistics South Africa Per capita income 2013 The 2013 per capita income in the Swartland Municipality was R which is slightly higher than that of the West Coast District (R28 173). It is the second highest per capita income compared with other local municipalities within the West Coast District. (h) INDIGENT HOUSEHOLDS [updated on 26 May 2016] Municipalities offer additional support through its indigent policy. The indigent policy provides free or discounted rates on basic services such as water, electricity, sanitation, refuse removal and also on property rates. The number of indigent households in the Swartland municipal area was as follows: Source: Dept. Local Government, September 2013 and own information. The number of indigent households increased by 65% over a three year period. (i) CRIME [updated on 26 May 2016] The discussion on recorded crimes in this section is limited to contact and property related crime such as murder and sexual crimes, as well as crime heavily dependent on police action for detection such as drug-related crimes and driving under the influence of alcohol/drugs; these are detailed in the table and graph below. Crime category 2005/ / / / / / / / / /15 Murder Total Sexual Crimes Burglary at residential premises Drug-related crime Driving under the influence of alcohol or drugs Source: SAPS, Quantec Research, Integrated Development Plan for

159 The categories pertaining to residential burglaries and drug-related crime are dominant in relation to crime within Swartland Municipality. While drugrelated crime, driving under the influence and sexual offences showed some decline in 2014/15, the number of murders and burglaries increased. 1.3 Access to housing [updated on 26 May 2016] (a) TYPE OF MAIN DWELLING - URBAN HOUSEHOLDS 2011 Type Number % House or brick/concrete block structure on a separate stand or yard or on a farm Traditional dwelling/hut/structure made of traditional materials Flat or apartment in a block of flats Cluster house or town house in complex; semi-detached house; or house/flat/room in backyard Informal dwelling (shack; in backyard) Informal dwelling (shack; not in backyard; e.g. in an informal/squatter settlement or on a farm) Room/flatlet on a property or larger dwelling/servants quarters/granny flat Caravan/tent Other TOTAL Source: Census 2011, Statistics South Africa Integrated Development Plan for
160 (b) TENURE STATUS - URBAN HOUSEHOLDS 2011 Status Number % Rented Owned but not yet paid off Occupied rent-free Owned and fully paid off Other TOTAL Source: Census 2011, Statistics South Africa 1.4 Access to municipal services (a) WATER [updated on 26 May 2016] Access to water urban households 2011 Access Number % Piped (tap) water inside dwelling Piped (tap) water inside yard Piped (tap) water on community stand less than 200m from dwelling Piped (tap) water on community stand more than 200m from dwelling No access to piped (tap) water TOTAL Source: Census 2011, Statistics South Africa 83.3% of households have access to piped water within their dwellings and a further 15.6% have access inside their yards. The minimum service level is households that have access to water at least 200 m from their dwelling. 99.5% of households meet this minimum standard. 152 Integrated Development Plan for
161 (b) ELECTRICITY [updated on 26 May 2016] Energy source used for lighting - urban households 2011 Source Number % Electricity Gas Paraffin Candles (not a valid option) Solar None TOTAL Source: Census 2011, Statistics South Africa (c) SANITATION [updated on 26 May 2016] Access to toilet facilities - urban households 2011 Facility Number % Flush toilet (connected to sewerage system) Flush toilet (with septic tank) Chemical toilet Pit toilet with ventilation (VIP) Pit toilet without ventilation Bucket toilet Other None TOTAL Source: Census 2011, Statistics South Africa The Municipality has a high level of access to sanitation with 96.4% having sanitation on a level in excess of RDP standards. Only 3.6% have poor or no sanitation. The Municipality does not operate a bucket system in the urban areas. The 1.4% people who indicated bucket toilets are using it unofficially. Integrated Development Plan for
162 (d) REFUSE REMOVAL [updated on 26 May 2016] Access to refuse removal - urban households 2011 Way of disposal Number % Removed by local authority/private company at least once a week Removed by local authority/private company less often Communal refuse dump Own refuse dump No rubbish disposal Other TOTAL Source: Census 2011, Statistics South Africa The Highlands waste disposal facility has a 30 year lifespan. (e) ROADS West Coast District roads by type of road Category Km Surfaced % surfaced Km Gravel % Gravel Total km National % 0 0.0% 368 Trunk % 0 0.0% 431 Main % % Divisional % % Minor % % Total % % Source: Western Cape Department of Transport, 2010 The statistics for the West Coast District depict a region deemed to be relatively well sourced in relation to surfaced roads which is a prerequisite for sound bulk economic infrastructure to foster economic connectivity within a region. National and Trunk roads are both fully covered while covered main roads account for 65% per cent of total main roads. While this figure is deemed acceptable, this is an area the District can improve on to further enhance the bulk infrastructure within the region. 154 Integrated Development Plan for
163 1.5 Economic performance [updated on 26 May 2016] (a) GROWTH AND GDPR CONTRIBUTION Swartland comprised the second largest share (29%) of the West Coast District s GDPR of R19 billion in The Swartland economy experienced average year-on-year growth of 3.7% from , on par the Province s growth rate of 3.6% over this period. Economic growth in Swartland tapered off to 3% annually during the recessionary period from 4% average growth over the period. Growth however continued to fall (2.6%) during the recovery period. Sectoral growth Trend % Agriculture, forestry and fishing 0.3 Manufacturing 2.1 Construction 5.1 Commercial services 7.7 General government and community, social and personal services -2.8 Other 0.3 Total 3.7 Source: Municipal Economic Review and Outlook (MERO), 2015 Top ten non-metro GDPR contributors in the Western Cape Sector % Stellenbosch 17.1 Mossel Bay 13.0 Drakenstein 8.9 George 8.1 Overstrand 5.7 Saldanha Bay 5.4 Langeberg 5.3 Knysna 4.8 Bitou 4.4 Swartland 3.7 Source: Quantec Research 2014 (MERO 2014) Integrated Development Plan for
164 GDPR contribution per sector Sector % Finance, insurance; real estate and business services 36 Manufacturing 20 Agriculture, forestry and fishing 14 Wholesale and retail trade, catering and accommodation 11 General government 5 Construction 5 Transport, storage and communication 4 Community, social and personal services 3 Electricity, gas and water 2 Mining and quarrying 0 Total 100 Source: Municipal Economic Review and Outlook (MERO), 2015 (b) EMPLOYMENT Employment status Status Employed Unemployed Unemployment rate 8.5% 10.2% 12.7% Source: Census 2011, Statistics South Africa Economically active people (those in the labour force) are those between the ages of 15 and 65 years who chose to participate in the labour market by being willing to supply their labour in exchange for an income. Being economically active does not depend on being employed; as long as there is a desire, willingness and availability to work, even if that desire does not translate into employment, then you are seen as part of the labour force. The differences in participation levels as a result of discouragement, people who want to work but have given up hope in finding employment and therefore are not taking active steps to look for work is what is typically causing the difference between South Africa s official versus the broad/expanded unemployment definition. The 2011 unemployment rate for Swartland is 12.73% according to the 2011 National Census. This is a 2.5% increase from the 2001 rate of 10.22%. The 2011 unemployment rate for the West Coast District is 14.64% and for the Western Cape 29.8%. 156 Integrated Development Plan for
165 Swartland employment by sector Sector % Commercial services 41 Agriculture, forestry and fishing 22 General government and Community, social and personal services 17 Manufacturing 13 Construction 6 Other 1 Total Source: Municipal Economic Review and Outlook (MERO), 2015 The sector that employed the largest proportion of people in the municipal area in 2007 was Agriculture; hunting; forestry and fishing employing 27.1 per cent of the labour force. This was followed by Manufacturing (16.7%) and Financial, insurance, real estate and business services (11.5%). Swartland change in net employment Sector Number Agricultural Manufacturing -773 Construction -611 Commercial services General government and Community, social and personal services Other 16 Total Source: Municipal Economic Review and Outlook (MERO), 2015 Employment per skills sector Sector % Growth p.a Highly skilled 10.4% 0.1% Skilled 28.4% 0.1% Semi- and unskilled 38.7% -5.3% Informal 22.5% 3.5% Total 100.0% -1.8% Source: Municipal Economic Review and Outlook (MERO), 2015 [Section 1.6 (National Development Plan 2030 targets vs Swartland current status) deleted on 26 May 2016] Integrated Development Plan for
166 ANNEXURE 2: EXTERNAL ANALYSIS Client satisfaction survey [Added on 28 May 2015] (a) BACKGROUND In 2009 the Municipality introduced a Client Services Charter in which the services rendered by the Municipality are communicated. Part of the exercise was to do a client satisfaction survey in respect of service delivery. 348 telephonic interviews were conducted in the different areas by means of a preapproved questionnaire. The results were published in January During October and November 2014 Swartland Municipality has done a follow-up survey amongst residents to determine the satisfaction with service delivery. The questions were the same as the previous survey to make the comparison of results possible. Where the previous survey was done by a consultancy firm by means of telephonic interviews, the 2014 survey was done in-house by the Municipality at a nominal cost. The 2014 survey's questionnaire could be completed either in electronic format by means of Survey Monkey over the internet or on paper at various places in the municipal area. Eventually 367 (47%) questionnaires were completed on paper and 416 (53%) in electronic format. The completed paper questionnaires were obviously also captured on Survey Monkey. The number of responses (783) is 125% more than the 348 of the previous survey. The questionnaire was available in Afrikaans, English and isixhosa. The survey was advertised by means of the Municipality's SMS system, s, the Municipality's website, the local newspapers, the Tourism Association's website and Facebook page as well as the Malmesbury Facebook page. The survey was done totally anonymous and there is no way that any person can be linked to the questionnaire completed by him or her. (b) NUMBER OF RESPONSES RECEIVED PER AREA Town Responses 2011 population % of 2011 population Previous survey Abbotsdale % 10 Chatsworth % 5 Darling % 50 Grottobaai / Jakkalsfontein % 5 Kalbaskraal % 5 Koringberg % 5 Malmesbury % 92 Malmesbury - Ilinge Lethu % 25 Malmesbury - Wesbank / Saamstaan % 40 Moorreesburg % 55 Moorreesburg - Rosenhof % - Moorreesburg - Sibanya Integrated Development Plan for

167 Town Responses 2011 population % of 2011 population Previous survey Ongegund % - Riebeek-Kasteel % 15 Riebeek-Kasteel - Esterhof % - Riebeek-Wes % 16 Riverlands % 5 Ruststasie Yzerfontein % 20 Non-urban % - Total % 348 (c) OVERALL EVALUATION Respondents were asked a variety of questions where they had to make a choice between very poor, poor, average, good or excellent. These categories carry the following weights: very poor 1 (=20%), poor 2 (=40%), average 3 (=60%), good 4 (=80%) and excellent 5 (=100%). The score average in the table below is a weighted average score on the grounds of the number of responses in each of the categories in all the different questions while the percentage average merely displays the score (out of 5) as a percentage. If the results of the different questions are summarised per department / service, the picture looks as follows: Department / Service Score % average average Civil Engineering Services % Electrical Engineering Services % Protection Services % Development Services % Financial Services % Corporate Services % Client service: Local offices (excluding Malmesbury) % Client service: Malmesbury offices % Overall score % Integrated Development Plan for
, an overall average score can be calculated for each area separately.")
168 Respondents had to indicate the area in which they live. Survey Monkey makes it possible to filter the results per area. As the overall average score could be calculated in respect of all 783 responses (see table above), an overall average score can be calculated for each area separately. In this case the picture looks as follows: Area Score % average average Abbotsdale % Chatsworth % Darling % Esterhof % Ilinge Lethu % Kalbaskraal % Malmesbury % Moorreesburg % Riebeek-Kasteel % Riebeek-Wes % Riverlands % Rosenhof % Wesbank / Saamstaan % Yzerfontein % The detail survey results are available on the Municipality's website. 2.2 Area Plans The Municipality together with the ward committees commenced with the compilation of area plans covering all 12 wards. Meetings are held annually with all 12 ward committees to determine their issues and top five priorities. Area-based planning is an initiative that complements the IDP process by focusing and zooming in on communities. Communities in this sense are represented by settlements and wards. Because wards are often delineated in a way that divides areas that in reality represent coherent communities or settlements, Swartland decided to take an approach that in the first place focuses on sensible geographical areas. It however also deals with wards so that ward planning is not neglected. To achieve this, a number of wards are combined for each area plan to echo the area-based approach in a pragmatic way. The following five planning areas were identified: 160 Integrated Development Plan for
169 Planning areas Wards Towns and settlements North 1 and 2 Moorreesburg and Koringberg East 3 and 12 Riebeek West and Riebeek Kasteel West 5 and 6 Darling and Yzerfontein South 4 and 7 Abbotsdale, Chatsworth, Riverlands and Kalbaskraal Central 8, 9, 10 and 11 (and small portions of wards 4, 7 and 12) Malmesbury The importance of the role of the wards and ward committees is built into the process as the second Section of each Area Plan presents the ward committee members and the planning they have been involved with. It also contains the community inputs and the results of the public meetings pertaining to those wards. Each area plan includes amongst others 2011 population figures and related demographic data, services capacity and backlogs, the most important priorities of the different wards, proposals from the Spatial Development Framework for that area, and the municipal capital budget for the next five years. A summary of the ward priorities is provided in Chapter Public Perception Survey [Added on 30 May 2014] A public perception survey was done under the guidance of Prof De Wet Schutte from UniSearch Research Consultants during October and November The process started on 9 October 2013 when 15 municipal officials were trained by Prof Schutte to act as facilitators. This was followed by a demonstration focus group session with councillors that was facilitated by Prof Schutte. The purpose of this session was to introduce the methodology to councillors and to serve as a learning experience for the 15 officials. The municipal area was then divided into 10 target areas. Focus group interviews were conducted in these areas with members of the community. This survey was intentionally not aimed at community leaders but at ordinary men and woman in the community people whose opinion are seldom heard. Focus group sessions were held with the following groups in each of the 10 target areas: Men years Women years Men 36 years and older Women 36 years and older In a few cases where circumstances dictated otherwise, gender and age groups were combined. Data collection was completed between 14 October and 7 November Facilitators had face-to-face contact with 173 persons from all levels of the community. If this figure is multiplied according to the group dynamic principle where each person represents on average five other individuals opinions, it can be stated that the survey represents a total of approximately 865 opinions from the different communities in Swartland. Two indexes were used. The Priority or P-Index determines the priority of the issues mentioned in the focus group sessions by participants. It measures two things on a scale of 1 to 11: the importance of the issues and the level of satisfaction with the issues. The priority is determined by subtracting the satisfaction rating from the importance rating. An issue which is regarded as important by the participants but where the level of satisfaction with the issue is also high, will therefore have a lower priority than an issue with the same importance but a lower level of satisfaction. Integrated Development Plan for
170 High importance, low level of satisfaction: Priority high Importance Satisfaction Priority High importance, high level of satisfaction: Priority low Importance Satisfaction Priority The Community or C-Index is a graphic representation of the level of satisfaction of the respondents with the basic building blocks of a healthy community. These are shelter/housing, health care, sanitation, water, food, energy/electricity, income/access to income, education, recreation, environment, religion, welfare, transport, and safety. The items were measured on a scale of 1 to 11 in terms of satisfaction level only and the result was presented as a community profile (yellow line in the figure below). The closer the yellow line is to the centre the better. The Community or C-Index also measured the cohesion or bonding within a community (blue circle in the figure below). Participants were asked to rate three questions on a scale of 1 to 11: To what extent do you consider this community to be your home? How close or distant do you feel to your friends in this community? To what extent can you rely on the rest of your community to come to your aid if you would have a problem? The smaller the blue circle is the better. The information of the C-Index is essential for any sustainable development initiatives. It serves as a point of departure from which the impact of any change in the community s service delivery and/or any intervention programmes in the community can be monitored. 162 Integrated Development Plan for

171 The validity and reliability of insights obtained during the exercise should not be underestimated. The reality is that the survey provided the Municipality with great detail about the real needs of the different communities in Swartland. The road ahead: The next phase of the exercise will be to interpret the results of the survey and to integrate the information into the IDP and Area Plan process. Integrated Development Plan for
Swartland Municipality
 Swartland Municipality INTEGRATED DEVELOPMENT PLAN FOR 2012-2017 COUNCIL S SUSTAINABLE LONG TERM STRATEGY As revised on 30 May 2013 INTEGRATED DEVELOPMENT PLAN FOR 2012-2017 Compiled in terms of the Local
DRAFT PROCESS PLAN. to guide the planning, drafting, adoption and review of the SWARTLAND INTEGRATED DEVELOPMENT PLAN. for. 1 July June 2022
 DRAFT PROCESS PLAN to guide the planning, drafting, adoption and review of the SWARTLAND INTEGRATED DEVELOPMENT PLAN for 1 July 2017-30 June 2022 For public inputs and comments June 2016 Draft IDP Process
TABLE OF CONTENTS SUBJECTS 1. INTRODUCTION 2. INSTITUTIONAL ARRANGEMENTS. Roles and responsibilities
 IDP REVIEW PROCESS PLAN DEPARTMENT OF THE OFFICE OF THE MUNICIPAL MANAGER JULY 2009-JUNE2010 TABLE OF CONTENTS SUBJECTS 1. INTRODUCTION 2. INSTITUTIONAL ARRANGEMENTS Roles and responsibilities 2.1 Council
SWARTLAND SPATIAL DEVELOPMENT FRAMEWORK ADDENDUM F
 SWARTLAND SPATIAL DEVELOPMENT FRAMEWORK ADDENDUM F DEMOGRAPHIC PROFILE 2011 Census APRIL 2014 By CK Rumboll and Partners 1 1. Introduction Swartland Municipality is located on the north western boundary
Swartland Municipality
 Swartland Municipality Special Council Meeting - 29 March 2012 A: 2012-2017 Draft Integrated Development Plan B: 2012-2017 Draft Multi Year Capital and Operating Budgets ----------------------------------------
Moretele Local Municipality. IDP/Budget Process Plan 2018/ ( IDP: Process Plan)
") Moretele Local Municipality IDP/Budget Process Plan /2019 1 Revision Control Final - August 2017 Strategic Services IDP/PMS Unit Enquiries: 012 716 1321 / 1324 (tel) thabo.makwela@moretele.org.za nyakale.lale@moretele.org.za
Moretele Local Municipality IDP/Budget Process Plan /2019 1 Revision Control Final - August 2017 Strategic Services IDP/PMS Unit Enquiries: 012 716 1321 / 1324 (tel) thabo.makwela@moretele.org.za nyakale.lale@moretele.org.za
MATRIX OF STRATEGIC VISION AND ACTIONS TO SUPPORT SUSTAINABLE CITIES
 Urban mission and overall strategy objectives: To promote sustainable cities and towns that fulfill the promise of development for their inhabitants in particular, by improving the lives of the poor and
PLAN AND MANAGE THE BUDGET POLICY & PROCEDURE MANUAL
 PLAN AND MANAGE THE BUDGET POLICY & PROCEDURE MANUAL THABA CHWEU LOCAL MUNICIPALITY Approved 25 June 2012 Resolution no: A50/2012 TABLE OF CONTENTS 1 INTRODUCTION... 1 1.1 Vision and value statement...
Challenges in implementing SDGs, Paris Climate Agreement. Ms. Tuhina Sinha, Asst. Professor, SPA, JNAFAU, Hyderabad
 Challenges in implementing SDGs, Paris Climate Agreement Ms. Tuhina Sinha, Asst. Professor, SPA, JNAFAU, Hyderabad Paris Agreement Background The adoption of a new climate change agreement at the 21st
Environmental, Social, Governance and Impact policy 2016
 Environmental, Social, Governance and Impact policy 2016 1. Belief statement We believe that applying ethical, social and environmental values to each investment decision builds a better world for current
Results of the global questionnaire of the Friends of the Chair on broader measures of progress
 Statistical Commission Forty-sixth session 3 6 March 2015 Item 3(a) (i) of the provisional agenda Items for discussion and decision: Data in support of the post-2015 development agenda: Broader measures
The Role of Securities Industry for the Sustainable Development Goals
 The Role of Securities Industry for the Sustainable Development Goals The establishment of a sustainable and fair society has been put on the global agenda. The United Nations announced the Sustainable
Verslag Ingxelo Report
 Verslag Ingxelo Report Office of the Director: Financial Services 8 May 2012 2/1/4/4/1 5/1/1/1 2012/13 5/1/1/2 2012/13 5/1/4 ITEM 3.1 OF THE AGENDA OF A SPECIAL COUNCIL MEETING TO BE HELD ON 31 MAY 2012
Review of the fourth Strategic Plan of the Ramsar Convention
 RAMSAR CONVENTION ON WETLANDS 54th Meeting of the Standing Committee Gland, Switzerland, 23 27 April 2018 Review of the fourth Strategic Plan of the Ramsar Convention Doc. SC54-8 Actions requested: The
International Cultural Youth Exchange
 BSP/C/16/NGO/65 Reply to the Consultation of Member States and Associate Members, including their National Commissions for UNESCO, as well as of intergovernmental organizations and international non-governmental
World Organization of the Scout Movement
 BSP/C/16/NGO/77 Reply to the Consultation of Member States and Associate Members, including their National Commissions for UNESCO, as well as of intergovernmental organizations and international non-governmental
THE SUSTAINABLE DEVELOPMENT GOALS AND SOCIAL PROTECTION
 THE SUSTAINABLE DEVELOPMENT GOALS AND SOCIAL PROTECTION Ms Nelisiwe Vilakazi Acting Director General- Ministry of Social Development REPUBLIC OF SOUTH AFRICA Global Practitioners Learning Event Oaxaca,
Ensuring The Effective Participation Of Each Sphere Of Government In The Processes And Structures That Determine Intergovernmental Fiscal Arrangements
 Ensuring The Effective Participation Of Each Sphere Of Government In The Processes And Structures That Determine Intergovernmental Fiscal Arrangements Jackie Manche, Chief Executive Officer, Independent
Association of South-East Asian Nations
 BSP/C/16/IGO/01 Reply to the Consultation of Member States and Associate Members, including their National Commissions for UNESCO, as well as of intergovernmental organizations and international non-governmental
THEEWATERSKLOOF MUNICIPALITY
 THEEWATERSKLOOF MUNICIPALITY IDP/BUDGET REVIEW 2018/2019 DRAFT PROCESS PLAN Approved by Council: Reference: C Integrated Development Plan (IDP) Process Plan Compiled in terms of Sections 27, 28 and 29
DRAFT INTGETAED DEVELOPMENT PLAN 2018/2019
 DRAFT INTGETAED DEVELOPMENT PLAN 2018/2019 Department of the Office of the Municipal Manager IDP and PMS Division 27 Voortrekker Street Ficksburg 9730 Tel: 051 933 9368 Fax: 051 933 9363 Email: strategy@setsoto.co.za
PRESENTATION TO THE SELECT COMMITTEE ON PUBLIC SERVICES DPW STRATEGIC PLAN AND BUDGET FOR 2012/13 15 MAY 2012
 PRESENTATION TO THE SELECT COMMITTEE ON PUBLIC SERVICES DPW STRATEGIC PLAN AND BUDGET FOR 2012/13 15 MAY 2012 TABLE OF CONTENTS MINISTER S FOREWORD PART A: STRATEGIC OVERVIEW INTRODUCTION AND STRATEGIC
Sustainable Development Goals. A briefing for the HelpAge Global Network
 Sustainable Development Goals A briefing for the HelpAge Global Network Verity McGivern 22 July 2015 The Sustainable Development Goals The Sustainable Development Goals (SDGs) are a new, universal set
RELATIONSHIP BETWEEN THE BUDGET AND THE IDP 28 FEBRUARY 2017
 RELATIONSHIP BETWEEN THE BUDGET AND THE IDP 28 FEBRUARY 2017 1 Contents Introduction Legislative Requirements Inc. MSCOA Why MSCOA Local Government Accountability Cycle Budget Process and linkage to IDP
UGANDA: Uganda: SOCIAL POLICY OUTLOOK 1
 UGANDA: SOCIAL POLICY OUTLOOK Uganda: SOCIAL POLICY OUTLOOK 1 This Social Policy Outlook summarises findings published in two 2018 UNICEF publications: Uganda: Fiscal Space Analysis and Uganda: Political
Guidance on Doing Well by Doing Good: Mapping SASB s Material Issues to the SDGs
 Guidance on Doing Well by Doing Good: Mapping SASB s Material Issues to the SDGs Costanza Consolandi, University of Siena Robert G. Eccles, Said Business School, University of Oxford FOR PROFESSIONAL CLIENT
Department of Policy and Strategic Planning
 SUMMARY OF MAIN FINDINGS EMERGING FROM NATIONAL MIDTERM REVIEW PROCESS By Motulu Molapo Department of Policy and Strategic Planning Ministry of Development Planning 1. INTRODUCTION: Lesotho is a small
4/7/2015. Group. Governance and Legislation
 Group 3 Governance and Legislation DIPLOMA IN PUBLIC ACCOUNTABILITY MINIMUM MUNICIPAL COMPETENCY PROGRAMME Karel van der Molen Module 2 Intergovernmental Fiscal Relations, Legislation and Policies affecting
UNESCO questionnaire on the Programme and Budget for the period (39 C/5) Member State. Georgia. question. question. question.
 Member State. Georgia. question. question. question.") BSP/C/16/MS/04 Reply to the Consultation of Member States and Associate Members, including their National Commissions for UNESCO, as well as of intergovernmental organizations and international non-governmental
BSP/C/16/MS/04 Reply to the Consultation of Member States and Associate Members, including their National Commissions for UNESCO, as well as of intergovernmental organizations and international non-governmental
5 YEAR INTEGRATED DEVELOPMENT PLAN OF KOUKAMMA LOCAL MUNICIPALITY ( )
") 5 YEAR INTEGRATED DEVELOPMENT PLAN OF KOUKAMMA LOCAL MUNICIPALITY (2017-2022) Private Bag X011 Kareedouw 6400-042 288 7200 TABLE OF - 042 CONTENTS 288 0797 koukamma@koukamma.gov.za 1 TABLE OF CONTENTS
5 YEAR INTEGRATED DEVELOPMENT PLAN OF KOUKAMMA LOCAL MUNICIPALITY (2017-2022) Private Bag X011 Kareedouw 6400-042 288 7200 TABLE OF - 042 CONTENTS 288 0797 koukamma@koukamma.gov.za 1 TABLE OF CONTENTS
UN-OHRLLS COUNTRY-LEVEL PREPARATIONS
 UN-OHRLLS COMPREHENSIVE HIGH-LEVEL MIDTERM REVIEW OF THE IMPLEMENTATION OF THE ISTANBUL PROGRAMME OF ACTION FOR THE LDCS FOR THE DECADE 2011-2020 COUNTRY-LEVEL PREPARATIONS ANNOTATED OUTLINE FOR THE NATIONAL
1. INTRODUCTION 2. OVERVIEW OF POLICY PRIORITIES FOR 2016/17
 REPORT OF THE PORTFOLIO COMMITTEE ON COOPERATIVE GOVERNANCE AND TRADITIONAL AFFAIRS ON THE ANNUAL PERFORMANCE PLAN AND BUDGET VOTE 4 OF THE DEPARTMENT OF COOPERATIVE GOVERNANCE AND TRADITIONAL AFFAIRS
CLIMATE FINANCE OPPORTUNITIES FOR ENHANCED LOCAL ACTION
 CLIMATE FINANCE OPPORTUNITIES FOR ENHANCED LOCAL ACTION V-LED AFRICA WORKSHOP: LOCALISING CLIMATE FINANCE AND ACTION 23-25 APRIL 2018, IRENE, SOUTH AFRICA 1 CC expenditure will absorb ~ 70% of domestic
PIXLEY KA SEME DISTRICT MUNICIPALITY
 PIXLEY KA SEME DISTRICT MUNICIPALITY FINAL SERVICE DELIVERY BUDGET IMPLEMENTATION PLAN ( SDBIP ) 2014/2015 1 Table of Contents Page no. 1. Introduction 3 2. Legislative Framework in terms of MFMA 3 3.
Monitoring Poverty in rural Nicaragua through the Community Based Monitoring System: A SDGs and MPI report.
 Monitoring Poverty in rural Nicaragua through the Community Based Monitoring System: A SDGs and MPI report. Milagros Romero NITLAPAN CENTRAL AMERICAN UNIVERSITY UCA June 12, 2018 2018 PEP Annual Conference,
Status of Sustainable Development Goals
 Ministry of Economy Status of Sustainable Development Goals In Afghanistan November 2017 The SDGs at a glance The Sustainable Development Goals (SDGs) are ambitious set of 17 goals, 169 targets and 232
THE COUNTY GOVERNMENT OF MACHAKOS THE COUNTY TREASURY PROGRAMMME BASED BUDGET FY 2015/2016
 REPUBLIC OF KENYA THE COUNTY GOVERNMENT OF MACHAKOS THE COUNTY TREASURY PROGRAMMME BASED BUDGET FY JUNE 2015 0 Table of contents Table of contents... 1 Revenue Estimates FY 2015/16-2017-18... 2 Summary
YOU Foundation- Education for Children in Need
 BSP/C/16/FON/05 Reply to the Consultation of Member States and Associate Members, including their National Commissions for UNESCO, as well as of intergovernmental organizations and international non-governmental
Suggested elements for the post-2015 framework for disaster risk reduction
 United Nations General Assembly Distr.: General 16 June 2014 A/CONF.224/PC(I)/6 Original: English Third United Nations World Conference on Disaster Risk Reduction Preparatory Committee First session Geneva,
Resources mobilization for the implementation of the Brussels Programme of Action:
 Resources mobilization for the implementation of the Brussels Programme of Action: The Experiences of Timor-Leste Presented by: Aicha Bassarewan, Vice Minister of Planning & Finance, RDTL Haoliang Xu,
The Presidency Department of Performance Monitoring and Evaluation
 The Presidency Department of Performance Monitoring and Evaluation Briefing to the Standing Committee on Appropriations on the Strategic Plan and Annual Performance Plan for the 2012/13 financial year
3. The terms of reference of Portfolio Standing Committees will be to :
 POLICY ON PORTFOLIO COMMITTEES 1. That standing committees be created for each portfolio consisting of Councillors nominated by the various political parties on a proportional basis. Where a party does
People s Republic of China: Study on Natural Resource Asset Appraisal and Management System for the National Key Ecological Function Zones
 Technical Assistance Report Project Number: 50004-001 Policy and Advisory Technical Assistance (PATA) October 2016 People s Republic of China: Study on Natural Resource Asset Appraisal and Management System
2018 report of the Inter-agency Task Force Overview
 2018 report of the Inter-agency Task Force Overview In 2017, most types of development financing flows increased, amid progress across all the action areas of the Addis Ababa Action Agenda (hereafter,
A POSITION PAPER OF THE EQUAL
 A POSITION PAPER OF THE EQUAL OPPORTUNITIES COMMISSION (EOC) ON THE PROPOSED REPEAL OF SECTION 13(15) (g) OF THE PUBLIC FINANCE MANAGEMENT (AMENDMENT) BILL, 2015 (PFMA 2015) The Equal Opportunities Commission
Current ratio Liquidity ratio
 2.3.7.8 Current ratio The current ratio compares the value of a municipality's short-term assets (cash, bank deposits, etc.) with its short-term liabilities (creditors, loans due and so on). A higher current
Green Bond Framework
 Green Bond Framework ENGIE is committed to successfully addressing the energy challenges of coming decades by producing energy that emits low CO 2. The environment, universal access to energy and the quest
Meeting on the Post-2015 Development Agenda for LDCs, LLDCs and SIDS in Asia and the Pacific: Nepal s Perspective
 Meeting on the Post-2015 Development Agenda for LDCs, LLDCs and SIDS in Asia and the Pacific: Nepal s Perspective Yuba Raj Bhusal, Member Secretary National Planning Commission, Nepal Contents 1. Nepal:
STRATEGIC PLAN AND BUDGET 2013 TO 2016 MUNICIPAL DEMARCATION BOARD
 STRATEGIC PLAN AND BUDGET 2013 TO 2016 MUNICIPAL DEMARCATION BOARD BRIEFING TO THE PORTFOLIO COMMITTEE ON COOPERATIVE GOVERNANCE AND TRADITIONAL AFFAIRS 19 MARCH 2013 DELEGATION Mr LJ Mahlangu Chairperson:
Delhi Development Report
 Delhi Development Report PLANNING COMMISSION GOVERNMENT OF INDIA NEW DELHI Published by ACADEMIC FOUNDATION NEW DELHI '&.' " ': Contents o The Core Committee, including Partner Agencies and Project Team
Message from the Treasurer. Proposed Property Tax Increases. Municipal Service Delivery. Economic Profile. Development Outlook
 Executive Summary Table of Contents Message from the Treasurer Proposed Property Tax Increases Exec-3 Exec-4 About Brampton Brampton Facts Municipal Service Delivery Economic Profile Development Outlook
Programme Development and Funding Officer
 Programme Development and Funding Officer Candidate Pack Thank you for showing an interest in working for Age International. Age International is a subsidiary charity of Age UK. As such, it is supported
Unit Standard : Apply the principles of budgeting within a municipality. Karel van der Molen
 Unit Standard 116345: Apply the principles of budgeting within a municipality Karel van der Molen Group The full programme 1. Strategic Management; Budgeting Implementation & Performance Management 2.
OPERATIONAL PROGRAMME under THE FUND FOR EUROPEAN AID TO THE MOST DEPRIVED
 OPERATIONAL PROGRAMME under THE FUND FOR EUROPEAN AID TO THE MOST DEPRIVED 2014-2020 1. IDENTIFICATION (max. 200 characters) The purpose of this section is to identify only the programme concerned. It
UN BHUTAN COUNTRY FUND
 UN BHUTAN COUNTRY FUND Terms of Reference Introduction: 1. The UN system in Bhutan is implementing the One Programme 2014-2018. The One Programme is the result of a highly consultative and participatory
S&D POSITION PAPER SUMMARY ON EUROPE 2020 STRATEGY A REVIEW FOR SUCCESS
 POSITION PAPER - SUMMARY S&D POSITION PAPER SUMMARY ON EUROPE 2020 STRATEGY A REVIEW FOR SUCCESS OUT OF THE CRISIS - A BETTER ECONOMIC MODEL FOR EUROPE Financing a better Europe Date: 16 March 2016 European
New York, 9-13 December 2013
 SIXTH SESSION OF THE OPEN WORKING GROUP OF THE GENERAL ASSEMBLY ON SUSTAINABLE DEVELOPMENT GOALS New York, 9-13 December 2013 Statement of Mr. Paolo Soprano Director for Sustainable Development and NGOs
Executive Summary of the National Report on the Implementation of the 2030 Agenda for Sustainable Development. Czech Republic
 Office of the Government of the Czech Republic Sustainable Development Department Executive Summary of the National Report on the Implementation of the 2030 Agenda for Sustainable Development Czech Republic
1 July Guideline for Municipal Competency Levels: Chief Financial Officers
 1 July 2007 Guideline for Municipal Competency Levels: Chief Financial Officers issued in terms of the Local Government: Municipal Finance Management Act, 2003 Introduction This guideline is one of a series
Evaluation of Budget Support Operations in Morocco. Summary. July Development and Cooperation EuropeAid
 Evaluation of Budget Support Operations in Morocco Summary July 2014 Development and Cooperation EuropeAid A Consortium of ADE and COWI Lead Company: ADE s.a. Contact Person: Edwin Clerckx Edwin.Clerck@ade.eu
Solidar EU Training Academy. Valentina Caimi Policy and Advocacy Adviser. European Semester Social Investment Social innovation
 Solidar EU Training Academy Valentina Caimi Policy and Advocacy Adviser European Semester Social Investment Social innovation Who we are The largest platform of European rights and value-based NGOs working
Integrating climate risk assessment/management/drr into national policies, programmes and sectoral planning. G Midgley, South Africa
 Integrating climate risk assessment/management/drr into national policies, programmes and sectoral planning G Midgley, South Africa The national policy framework South Africa s Disaster Management Act,
2013 Budget and Plan Guidelines
 APPENDICES 142 Appendix A: 2013 Budget and 2014-2018 Plan Guidelines 148 Appendix B: 2013 Operating Budget and 2014-2015 Operating Plan Guidelines 154 Appendix C: 2013 Capital Budget and 2014-2018 Capital
TITLE OPPORTUNITY FOR ALL CANADA S FIRST POVERTY REDUCTION STRATEGY. OECD Policy Workshop on Enhancing Child Well-being: From Ends to Means?
 TITLE OPPORTUNITY FOR ALL CANADA S FIRST POVERTY REDUCTION STRATEGY OECD Policy Workshop on Enhancing Child Well-being: From Ends to Means? January 16, 2019 Why a Poverty Reduction Strategy? Canada is
A loyal three made stronger in one. Loyalist Township Strategic Plan ( )
") A loyal three made stronger in one Loyalist Township Strategic Plan (2012-2015) Adopted by Council on August 13, 2012 Loyalist Township Strategic Plan I. Community Profile As prescribed by the Ministry
A loyal three made stronger in one Loyalist Township Strategic Plan (2012-2015) Adopted by Council on August 13, 2012 Loyalist Township Strategic Plan I. Community Profile As prescribed by the Ministry
MANGAUNG METROPOLITAN MUNICIPALITY BUDGET POLICY
 MANGAUNG METROPOLITAN MUNICIPALITY BUDGET POLICY 2 INDEX 1. Statutory Framework... 3 2. Policy Objectives... 8 3. Votes, Categories of Expenditure and Line Items... 8 4. Capital Budget Mythology... 9 5.
A Checklist on the Fitness for Municipal Pooled Financing
 Discussion Paper A Checklist on the Fitness for Municipal Pooled Financing Dr Juergen Goebel GIZ and SALGA May 2017 Contents Background... 2 Starting Point, Purpose and Use of this Checklist... 4 The Fitness
DOCUMENT OF THE EUROPEAN BANK FOR RECONSTRUCTION AND DEVELOPMENT STRATEGY FOR ALBANIA
 DOCUMENT OF THE EUROPEAN BANK FOR RECONSTRUCTION AND DEVELOPMENT STRATEGY FOR ALBANIA REPORT ON THE INVITATION TO THE PUBLIC TO COMMENT 1. Overview of the public consultation process The objective of this
Objectives for FATF XXV ( ) Paper by the incoming President
 Paper by the incoming President") Objectives for FATF XXV (2013-2014) Paper by the incoming President Main tasks for the FATF in 2013-2014, in line with the Ministerial Mandate of 20 April 2012: I. INTRODUCTION Promoting and facilitating
Objectives for FATF XXV (2013-2014) Paper by the incoming President Main tasks for the FATF in 2013-2014, in line with the Ministerial Mandate of 20 April 2012: I. INTRODUCTION Promoting and facilitating
Development Planning in Uganda Patrick Birungi, PhD
 Development Planning in Uganda Patrick Birungi, PhD Director Development Planning National Planning Authority Delivered to Rotary Club, Kampala 25 th July, 2016 Outline Introduction Functions of the National
EU FUNDING PROGRAMMES IN THE FIELD OF DEVELOPMENT AID
 EU FUNDING PROGRAMMES IN THE FIELD OF DEVELOPMENT AID EU FORDERUNG FUR MIGRANTEN ORGANISATIONEN UND TRAGER DER PARTICIPATIONS UND INTEGRATIONS ARBEIT IN BERLIN MOVE GLOBAL 25 October 2014, Berlin About
A value and rights based EU budget for the future
 A value and rights based EU budget for the future EU Civil Society Contact Group contribution to the EU budget review consultation 3 April 2008 The EU Civil Society Contact Group brings together some of
A Roadmap for SDG Implementation in Mauritius Indicative. UNDP Mission Team 17 November 2016
 A Roadmap for SDG Implementation in Mauritius Indicative UNDP Mission Team 17 November 2016 WHAT IS MAPS? MAINSTREAMING Landing the SDG agenda at the national and local levels: integration into national
GROWTH OF SA S ROAD INFRASTRUCTURE: WHAT TO EXPECT
 GROWTH OF SA S ROAD INFRASTRUCTURE: WHAT TO EXPECT SOUTH AFRICAN FORUM OF CIVIL ENGINEERING CONTRACTORS LR 2/6/3/138 SKHUMBUZO MACOZOMA CHIEF EXECUTIVE OFFICER SANRAL IN ORDER TO DEFINE A FUTURE IT MUST
Council conclusions on the EU role in Global Health. 3011th FOREIGN AFFAIRS Council meeting Brussels, 10 May 2010
 COUNCIL OF THE EUROPEAN UNION Council conclusions on the EU role in Global Health 3011th FOREIGN AFFAIRS Council meeting Brussels, 10 May 2010 The Council adopted the following conclusions: 1. The Council
at 8 th IAEG-SDGs Proportion of men, women and children of all ages living in poverty in all its dimensions according to national definition
 indicators and changes made at 8 th meeting of the IAEG-SDGs Target Indicator / changes made at 8 th IAEG-SDGs 1.2 1.2.2 Proportion of men, women and children of all ages living in poverty in all its dimensions
Simón Gaviria Muñoz Minister of Planning
 HLPF - ECOSOC High Level Inter-institutional 2030 Agenda & SDG Commission Simón Gaviria Muñoz Minister of Planning @simongaviria SimonGaviriaM New York, July 20, 2016 AGENDA 1. THE 2030 AGENDA AND THE
REGIONAL EVALUATION FRAMEWORK 1.0 INTRODUCTION 2.0 PURPOSE 3.0 DEFINITIONS. Edmonton Metropolitan Region Planning Toolkit
 Edmonton Metropolitan Region Planning Toolkit Re-imagine. Plan. Build. Edmonton Metropolitan Region Growth Plan 1.0 INTRODUCTION On October 26, 2017, the Government of Alberta approved the Edmonton Metropolitan
SDMX CONTENT-ORIENTED GUIDELINES LIST OF SUBJECT-MATTER DOMAINS
 SDMX CONTENT-ORIENTED GUIDELINES LIST OF SUBJECT-MATTER DOMAINS 2009 SDMX 2009 http://www.sdmx.org/ Page 2 of 10 SDMX list of statistical subject-matter domains 1 : Overview Domain 1: Demographic and social
Survey Results Note The key contribution of regions and cities to sustainable development
 Survey Results Note The key contribution of regions and cities to sustainable development From 13 December 2018 to 1 March 2019, the European Committee of the Regions (CoR) in cooperation with the Organisation
EAST AFRICAN COMMUNITY EAST AFRICAN LEGISLATIVE ASSEMBLY COMMITTEE ON AGRICULTURE, TOURISM AND NATURAL RESOURCES
 EAST AFRICAN COMMUNITY EAST AFRICAN LEGISLATIVE ASSEMBLY COMMITTEE ON AGRICULTURE, TOURISM AND NATURAL RESOURCES REPORT ON THE REGIONAL PARLIAMENTARIAN'S POLICY WORKSHOP ON CLIMATE CHANGE AND GENDER 27TH-28TH
1. I N T R O D U C T I O N
 INTRODUCTION The Chico 2030 General Plan is a statement of community priorities to guide public decisionmaking. It provides a comprehensive, long-range, and internally consistent policy framework for the
Cross-border Cooperation Action Programme Montenegro - Albania for the years
 ANNEX 1 Cross-border Cooperation Action Programme Montenegro - Albania for the years 2015-2017 1 IDENTIFICATION Beneficiaries CRIS/ABAC Commitment references Union Contribution Budget line Montenegro,
Sharm El Sheikh Declaration on Disaster Risk Reduction. 16 September Adopted at the Second Arab Conference on Disaster Risk Reduction
 Sharm El Sheikh Declaration on Disaster Risk Reduction 16 September 2014 Adopted at the Second Arab Conference on Disaster Risk Reduction City of Sharm El Sheikh, Arab Republic of Egypt, 14 16 September
A/HRC/17/37/Add.2. General Assembly. United Nations
 United Nations General Assembly Distr.: General 18 May 2011 A/HRC/17/37/Add.2 English only Human Rights Council Seventeenth session Agenda item 3 Promotion and protection of all human rights, civil, political,
COMMUNICATION FROM THE COMMISSION TO THE EUROPEAN PARLIAMENT, THE COUNCIL, THE EUROPEAN ECONOMIC AND SOCIAL COMMITTEE AND THE COMMITTEE OF THE REGIONS
 EUROPEAN COMMISSION Brussels, 13.10.2011 COM(2011) 638 final COMMUNICATION FROM THE COMMISSION TO THE EUROPEAN PARLIAMENT, THE COUNCIL, THE EUROPEAN ECONOMIC AND SOCIAL COMMITTEE AND THE COMMITTEE OF THE
Supplement to the Estimates. Fiscal Year Ending March 31, 2019
 Supplement to the Estimates Fiscal Year Ending March 3, 209 Supplement to the Estimates Fiscal Year Ending March 3, 209 British Columbia Cataloguing in Publication Data British Columbia. Estimates, fiscal
Terms of Reference Development of the City of Tshwane Sustainability Financing Mechanism Strategy
 Terms of Reference Development of the City of Tshwane Sustainability Financing Mechanism Strategy 1. ABOUT THE SACN The South African Cities Network (SACN) as established in 2002, is a network of the nine
9644/10 YML/ln 1 DG E II
 COUNCIL OF THE EUROPEAN UNION Brussels, 10 May 2010 9644/10 DEVGEN 154 ACP 142 PTOM 21 FIN 192 RELEX 418 SAN 107 NOTE from: General Secretariat dated: 10 May 2010 No. prev. doc.: 9505/10 Subject: Council
LEKWA-TEEMANE LOCAL MUNICIPALITY TERMS OF REFERENCE OVERSIGHT COMMITTEE
 LEKWA-TEEMANE LOCAL MUNICIPALITY TERMS OF REFERENCE OVERSIGHT COMMITTEE To be read in conjunction with National Treasury MFMA Circular 32 The Oversight Report CONTENTS 1. INTRODUCTION 3 2. BACKGROUND 3
Organisation strategy for Sweden s cooperation with the Green Climate Fund for
 Organisation strategy for Sweden s cooperation with the Green Climate Fund for 2016 2018 Appendix to Government Decision 22 June 2016 (UD2016/11355/GA) Organisation strategy for Sweden s cooperation with
MUNICIPAL BAROMETER. Empowering municipal planning, governance, oversight & benchmarking through easily accessible and reliable Local Level Data
 Welcome MUNICIPAL BAROMETER Empowering municipal planning, governance, oversight & benchmarking through easily accessible and reliable Local Level Data Seana Nkhahle The Urban Indicators Project Workshop
Strategic Development Partnership Framework
 Strategic Development Partnership Framework GOVERNMENT OF KHYBER PAKHTUNKHWA 2 ND OCTOBER 2013 The PTI-led coalition government of Khyber Pakhtunkhwa wishes to deepen and accelerate the partnership for
Briefing: National Action Plan from Social Inclusion (NAP Inclusion)
") Briefing: National Action Plan from Social Inclusion (NAP Inclusion) A. Background Ireland currently has two National Action Plans for Social Inclusion which have different origins and structures. However,
Briefing: National Action Plan from Social Inclusion (NAP Inclusion) A. Background Ireland currently has two National Action Plans for Social Inclusion which have different origins and structures. However,
KEY DATES FOR THE MANGAUNG METROPOLITAN MUNCIPALITY IDP REVIEW/BUDGET 2017/18
 KEY DATES FOR THE MANGAUNG METROPOLITAN MUNCIPALITY IDP REVIEW/BUDGET 2017/18 Mangaung Metropolitan Municipality wishes to inform all its stakeholders and communities of the key opportunity to make inputs
Building a Better Tomorrow
 Building a Better Tomorrow Investing in Ontario s Infrastructure to Deliver Real, Positive Change A Discussion Paper on Infrastructure Financing and Procurement February 2004 2 BUILDING A BETTER TOMORROW
14684/16 YML/sv 1 DGC 1
 Council of the European Union Brussels, 28 November 2016 (OR. en) 14684/16 OUTCOME OF PROCEEDINGS From: To: General Secretariat of the Council Delegations DEVGEN 254 ACP 165 RELEX 970 OCDE 4 No. prev.
FINAL INTEGRATED DEVELOPMENT PLAN (IDP)
") Final Drakenstein Municipality Integrated Development Plan (IDP) 2013-2018 FINAL INTEGRATED DEVELOPMENT PLAN (IDP) 2013-2018 APPROVED: 24 May 2013 Prepared by: Drakenstein Municipality Civic Centre, Bergriver
Final Drakenstein Municipality Integrated Development Plan (IDP) 2013-2018 FINAL INTEGRATED DEVELOPMENT PLAN (IDP) 2013-2018 APPROVED: 24 May 2013 Prepared by: Drakenstein Municipality Civic Centre, Bergriver
Palu, Indonesia. Local progress report on the implementation of the Hyogo Framework for Action ( )
") Palu, Indonesia Local progress report on the implementation of the Hyogo Framework for Action (2013-2014) Name of focal point: Yusniar Nurdin Organization: BNPB Title/Position: Technical Support Consultant
Palu, Indonesia Local progress report on the implementation of the Hyogo Framework for Action (2013-2014) Name of focal point: Yusniar Nurdin Organization: BNPB Title/Position: Technical Support Consultant
SETSOTO LOCALL MUNICIPALITY
 ANNUAL BUDGET OF SETSOTO LOCALL MUNICIPALITY Page 1 TABLE OF CONTENTS 2013/14 TO 2015/16 MEDIUM TERM REVENUE AND EXPENDITURE FORECASTS PART 1: ANNUAL BUDGET 6 1.1 MAYOR S REPORT 6 (REFER TO THE ATTACHMENT)