Economic and Fiscal Impact Analysis of the Vermont Trails and Greenway Council Member Organizations
|
|
|
- Shavonne Parsons
- 5 years ago
- Views:
Transcription

1 Economic and Fiscal Impact Analysis of the Vermont Trails and Greenway Council Member Organizations October 2016 Prepared for: Vermont Trails and Greenways Council

2 About Camoin Associates Camoin Associates has provided economic development consulting services to municipalities, economic development agencies, and private enterprises since We specialize economic and fiscal impact analyses and have conducted numerous studies on trail and tourism based projects throughout the country. Through the services offered, Camoin Associates has had the opportunity to serve EDOs and local and state governments from Maine to Texas; corporations and organizations that include Lowes Home Improvement, FedEx, Volvo (Nova Bus) and the New York Islanders; as well as private developers proposing projects in excess of $600 million. Our reputation for detailed, place specific, and accurate analysis has led to projects in twenty nine states and garnered attention from national media outlets including Marketplace (NPR), Forbes magazine, and The Wall Street Journal. Additionally, our marketing strategies have helped our clients gain both national and local media coverage for their projects in order to build public support and leverage additional funding. The firm currently has offices in Saratoga Springs, NY, Portland, ME, and Brattleboro, VT. To learn more about our experience and projects in all of our service lines, please visit our website at You can also find us on and on Facebook. The Project Team Michael N dolo Vice President, Project Principal Rachel Selsky Senior Economic Development Specialist, Project Manager Dina DeCarlo Economic Development Analyst, Project Staff Project Support Lat + Long Resource Group, LLC provides organizational and operational support to non profits and small businesses across North America. Our consulting services include grant writing, project coordination and facilitation, and strategic planning. We specialize in multi use and motorized recreation policy, planning, and program management. Lat + Long secured federal funding through the USDA Rural Business Opportunity Grant Program to conduct the Economic Impact Study and served as the Project Consultant for the Vermont Trails and Greenways Council. Through the generous financial support of the Council, USDA Rural Development (Vermont) and the four participating organizations; Catamount Trail Association, Green Mountain Club, Kingdom Trails Association, and the Vermont ATV Sportsman s Association, we were able to partner with Camoin Associates to produce a high quality and thorough analysis of the economic impact of recreation on the Vermont Trails System. For more information about our services, please contact Alexis Nelson at alexis@latlongresourcegroup.com This study was funded in part by the United States Department of Agriculture Rural Development.
3 Contents Introduction... 1 History... 1 Methodology... 4 Survey Process... 4 Methodology Employed... 5 Modeling Software... 5 Economic Impact Analysis... 6 Fiscal Impact Sales and Use Tax Other State Tax Revenue Total State Tax Revenue Economic Activity Direct Use Benefit Other Spending Attachment A: What is an Economic Impact Analysis? Attachment B: Survey Questions Attachment C: Survey Answers Camoin Associates Economic and Fiscal Impact of the Vermont Trails and Greenways Council Member Organizations
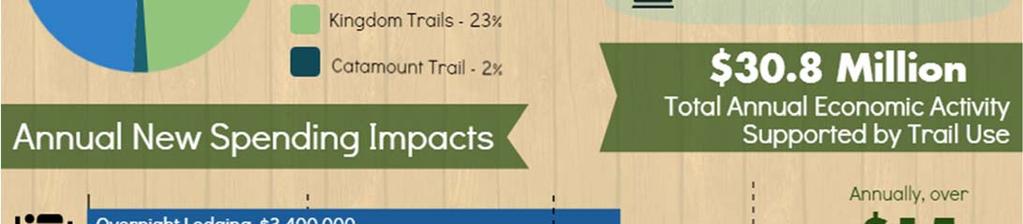
4 Executive Summary Camoin Associates was retained by the Vermont Trails and Greenways Council (the VTGC ) to provide an economic and fiscal impact assessment of how four 1 statewide and regional trail associations (the Trails ) impact the economy of Vermont (the State ). To study this, we examine the question, What would change in the State, if the Trails ceased to exist? We would expect that certain visitors who currently come to Vermont for the Trails, specifically those visitors who are not residents of the Vermont, would no longer spend money in the local economy because the Trails are their primary reason for visiting. This spending is referred to as net new because it is spending that is dependent on the Trails and would not otherwise occur in the state. It is important to note here that this impact analysis only looks at the impact of the four trail systems that participated in the survey, namely the Catamount Trail Association, the Kingdom Trails Association, the Vermont All Terrain Sportsman s Association, and the Green Mountain Club. The actual impact of recreation on the Vermont State economy is much greater and includes many more trails and recreation types. The infographic on the following page outlines the findings of this analysis. 1 This study analyzes the impact of the Catamount Trail Association, the Kingdom Trails Association, the Vermont All Terrain Sportsman s Association, and the Green Mountain Club. Camoin Associates Economic and Fiscal Impact of the Vermont Trails and Greenways Council Member Organizations


5 Camoin Associates Economic and Fiscal Impact of the Vermont Trails and Greenways Council Member Organizations

6 Introduction The Vermont Trails and Greenways Council ( VTGC ) is an organization of volunteers dedicated to trail preservation, promotion, and development in Vermont. The VTGC commissioned Camoin Associates to complete an economic and fiscal impact analysis to study and report on four of its member including the Catamount Trail Association, the Kingdom Trails Association, the Vermont All Terrain Sportsman s Association, and the Green Mountain Club (collectively the Trails ) 2. The purpose of this study is to demonstrate the existing economic and fiscal benefits of the Trails on the State of Vermont s (the State ) economy. The analysis will consider the many users of the Trails and how their spending in Vermont creates jobs, earnings, and sales for the State s businesses and employees as well as additional tax revenue for the State. Additionally, the analysis estimates how the Trails create economic activity associated with spending by state residents and the value of the Trails to the State. It is important to note here that this impact analysis only looks at the impact of the four trail systems that participated in the survey, namely the Catamount Trail Association, the Kingdom Trails Association, the Vermont All Terrain Sportsman s Association, and the Green Mountain Club. The actual impact of recreation on the Vermont State economy is much greater and includes many more trails and recreation types. History The Vermont Trails and Greenways Council was first established in 1995 with the goal of ensuring access to adequate land and water based trails and greenways in Vermont. The Council represents every kind of trail use and works to strengthen the Vermont trail systems to support trail recreation across the state. Within the Vermont Trails and Greenways Council, there are individual trail organizations that focus on their particular region or type of user. The following is a brief summary of these organizations. 2 Note that this analysis only includes the use and impact of these four statewide or regional trail networks and does not include other Vermont Trails and Greenways Council member organizations. Camoin Associates Economic and Fiscal Impact of the Vermont Trails and Greenways Council 1


7 Catamount Trail Association The Catamount Trail Association was incorporated in 1984 as a non profit, member driven organization with the primary goal of building and maintaining a long distance Nordic ski trail from Massachusetts to Canada as a public resource. The goal of connecting the state from end to end with a ski trail was finally realized in The organization s vision is described on their website as follows: The Catamount Trail is a fully conserved, well maintained public access ski trail that spans the length of Vermont. The Catamount Trail and related trail networks are unique resources for winter recreation and important conservation and economic assets for the people and State of Vermont. The Catamount Trail Association hosts numerous events throughout the year including winter triathlons, instructional courses, uphill challenges, and others throughout the state. In total, the organization estimates that approximately 10,000 people use the Catamount Trail each year. 3 Green Mountain Club The Green Mountain Club was created in 1910 in Burlington, Vermont after which work began on the Long Trail the oldest long distance hiking trail in the United States. The Long Trail follows the main ridge of the Green Mountains from the Massachusetts Vermont border to the Canadian border. The Green Mountain Club is charged with maintaining the Long Trail System as well as protecting other hiking trails in Vermont. Approximately 200,000 people use the Long Trail each year. 3 Source: Catamount Trail Association Camoin Associates Economic and Fiscal Impact of the Vermont Trails and Greenways Council 2


8 Kingdom Trails Association Taking the name from the Northeast Kingdom region of Vermont, the Kingdom Trails Association was established in 1994 to encourage recreational use in the region in a way that is ecologically sensitive and promotes the natural beauty. Working with private landowners, the Kingdom Trails Association offers year round recreational opportunities on mapped trails. The vast majority of the users are mountain biking during the spring, summer, and fall seasons but there is also use during the winter by fat bikers, cross country skiers, and snowshoers. The trails are maintained with the funds generated from day passes and membership fees. The trails are home to a number of events, including Winterbike, Nembafest, and Circumburke. Based on the day passes sold, member usage, and other estimates, the Kingdom Trails Association estimates that the trails are used approximately 94,000 times per year, the majority are mountain bikers during the spring, summer, and fall seasons. Vermont All Terrain Sportsman Association Vermont All Terrain Sportsman Association ( VASA ) is the statewide organization dedicated to developing, promoting, and conserving responsible, family friendly ATV recreation in Vermont. The Association has over 800 miles of trails on mostly private property. The 800 miles of trails are maintained by VASA and the local clubs are open only to the 2,500 members who have registered their ATV with the Vermont Department of Motor Vehicles and have paid their membership fee. There are 16 local clubs that provide the volunteers to support the trails. VASA also offers free safety training to all riders under the age of VASA does not maintain trail user counts but, based on the information collected in the survey, we estimate that an average VASA member rides their ATV in Vermont 42 days per year. Based on 2,500 users, that is a total of 105,000 uses per year. 4 Source: VASA Website web.pdf Camoin Associates Economic and Fiscal Impact of the Vermont Trails and Greenways Council 3


9 Methodology Survey Process Throughout 2016, surveys were conducted throughout Vermont to gain insights into the characteristics of the users of the Trails. The survey included questions regarding location of origin, time spent on the trail, time spent in Vermont, types of activities the users typically participate in, and spending habits (See Attachment B for the list of questions). When the surveying process was first outlined, the intention was for each of the four trail organizations to conduct in person surveying at different points throughout the system. For a number of different reasons this surveying method was not feasible for all of the different trail systems, so a variety of techniques were employed to gather data from as many users as possible, while at the same time working to limit over representation of a unique group (i.e. only trail club members as opposed to one time users). Catamount Trail Association: Unfortunately, the winter of will be remembered as never actually arriving. There was very little snowfall throughout Vermont, which did not allow for sections of the cross country trail to be useable by Nordic skiers. In order to gain information from those who typically use the trails, an effort was made to collect information at ski events that attract similar participants and using an online survey that went to the Association s full enews list of friends, members of the organizations, and event participants. In total, 212 surveys were collected including 155 online surveys and 57 in person surveys. Green Mountain Club: The Green Mountain Club conducted their surveying on site during the summer of 2016 at trailheads. The survey was conducted at the visitor center. In total, 87 surveys were collected. Kingdom Trails Association: The surveying for the Kingdom Trails Association was conducted during the mountain biking season using surveys at the registration desk. In addition, the survey was sent out to their mailing list which includes everyone who has used the trails, including both members and non members. In total, 1,036 surveys were collected including 108 in person surveys and 935 online surveys. VASA: The surveying for the VASA trails was conducted using an online survey sent out to members during the Spring and Summer of In order to ride on the VASA trails, you must be a member, so it was reasonable to measure the spending and usage of only the members. In total, 285 online survey forms were completed. Home zip code of survey takers Camoin Associates Economic and Fiscal Impact of the Vermont Trails and Greenways Council 4

10 Methodology Employed Camoin Associates employed the following methodology to determine the economic impact of the Trails: 1. The individual trail organizations provided Camoin Associates with the average annual usage of the individual trail systems and Camoin Associates calculated the usage for the entire system per year. 2. Based on information gathered in the survey, Camoin Associates developed an estimate for the percent of users who come to the Trails from within Vermont ( Local Visitor ) and the percent of visitors who come from outside of the Vermont ( Non Local Visitor ). 3. Using the Non Local Visitor survey data, Camoin Associates looked further into why the user was in Vermont and whether the trail was their primary or secondary reason or whether they traveled to Vermont for another reason and just happened to use the trail. Only those Non Local Visitor who were in Vermont because of the trail (primary or secondary reason) are considered net new for purposes of the economic impact study. 4. Using the usage estimates (Step 1), the percent of Local and Non Local Visitors (Step 2) and the percent of Non Local Visitors who are in Vermont because of the Trails (Step 3), Camoin Associates determined the number of net new Non Local Visitors that use the Trails on an annual basis. These Non Local Visitors who are in Vermont because of the Trails are considered to be net new visitors to the State and their spending is directly related to the Trails. 5. Using the data collected in the survey, Camoin Associates estimated the percent of the net new visitors to the State that are taking a day trip or overnight trip to Vermont as a result of the Trails. 6. Based on spending estimates for the visitors identified in Step 5, Camoin Associates determined average visitation spending of a typical net new Non Local Visitor. 7. Camoin then aggregated the new visitation spending by multiplying the average spending (Step 6) by the new visitor estimates (Step 4). 8. Camoin then calculated direct jobs/economic activity resulting from the new spending (Step 7). 9. The direct economic activity was then entered into the EMSI model (described below) to calculate the associated indirect impacts. 10. Arrived at total economic impacts as the sum of all direct and indirect impacts in an average year. In modeling the economic impact of the Trails, net new visitor spending on food, retail, lodging, and transportation are the Direct Impact. Indirect Impacts occur as visitor oriented business, such as restaurants, hotels, gift shops, and others, make purchases from second tier suppliers, those second tier suppliers make purchases from third tier suppliers, and so on, back through the supply chain. Another component of indirect impacts are induced impacts those impacts that occur as employees, both those working directly for visitororiented businesses as well as for those businesses that supply to them spend their wages in the economy. Together, direct, indirect, and induced impacts comprise the total economic impact of each scenario on Vermont. Modeling Software Economic Modeling Specialists, Inc. (EMSI) designed the input output model used in this analysis. The EMSI model allows the analyst to input the amount of new direct economic activity (spending or jobs) occurring within the study area and uses the direct inputs to estimate the spillover effects that the net new spending or jobs have as these new dollars circulate through the study area s economy. This is captured in the indirect impacts and is commonly referred to as the multiplier effect. See Attachment A for more information on economic impact analysis. Camoin Associates Economic and Fiscal Impact of the Vermont Trails and Greenways Council 5
; 2) Residents spending money in Vermont because of access to the Trails, such money that would otherwise go out of state (see Economic")
11 Economic Impact Analysis Users of the Trails have an impact on Vermont in a number of ways, including: 1) Non residents traveling to Vermont to use the Trails and spending money in Vermont (see Economic Impact section of the report for more information); 2) Residents spending money in Vermont because of access to the Trails, such money that would otherwise go out of state (see Economic Activity section of the report for more information); 3) The value of the Trails to residents of Vermont (see Direct Use benefit section of the report for more information); and, 4) The fiscal impact of the Trails on the tax revenue generated for the State (see Fiscal Impact section of the report for more information). The next section will calculate the total number of annual users, the number of visitors from outside of Vermont, their typical spending patterns, and how these visitors impact the State s economy. Visitation Estimates Total Use Based on the information collected from the different trail organizations and data collected from the survey, Camoin Associates estimates that the Trails have nearly 410,000 user days per year. This includes both local and non local users and use throughout all of the seasons. Non Vermont Users Annual Trail Use Trail System Annual Users Catamount Trail 10,000 Long Trail 200,000 Kingdom Trails 94,000 VASA 105,750 Total 409,750 Source: Trail Associations and Survey For the purpose of evaluating the impact of the Trails on Vermont, Camoin Associates used a question regarding the subject s primary residence to determine the proportion of trail users who live outside the State and came to Vermont because of the Trails. Spending by these users is considered net new to the State because, if not for the Trails, this spending would not have occurred. Conversely, it was assumed that users from within the State and those that were in Vermont for other reasons and just happened to use the trail would still have spent a similar amount in the State even without the Trails. In other words, the recreation dollars spent by these non net new users in the state could reasonably be assumed to be spent in Vermont on other similar types of offerings. Additional information regarding the impact of the Trails on state residents is provided later in this report. Camoin Associates Economic and Fiscal Impact of the Vermont Trails and Greenways Council 6

12 Net New Visitor Days Trail System System Annual Non Resident Number Net % Non-Resident % Net New Users Visitors New Catamount Trail 10,000 42% 4,238 88% 3,708 Long Trail 200,000 71% 141,860 87% 123,256 Kingdom Trails 94,000 75% 70,263 97% 68,338 VASA 105,750 34% 35,513 61% 21,792 Total 409,750 61% 251,874 86% 217,094 Source: Survey, Camoin Associates Of the 409,750 user days, 39% were days spent by Vermont residents, while 61% were spent by visitors from beyond the State. Of those visitors from out of Vermont, 86% indicated in the survey that they were in Vermont because of access to the Trails, these 217,094 user days are considered the net new portion. In the review of the location of origin of the visitors, there are people from all around the country and world including from Canada, Sweden, Germany, Australia, China, and Brazil. Digging further into the habits of the net new trail users, the majority of them stay overnight in Vermont when using the Trails. The table below also shows the average number of days spent in Vermont for the survey takers who indicated that they would be staying in Vermont overnight. The Green Mountain Trail users have the highest average, with many people responding to the survey staying in Vermont for long periods of time and using the trail for that many days as well. The other three trail systems have average overnight stays of around 3 days. Length of Stay in Vermont Day Visit Multiple Day % of Net New Users # of New New Users % of Net New Users # of New New Users Average Number of Days in Vermont Catamount Trail 22% % 2, Long Trail 8% 9,302 92% 113, Kingdom Trails 22% 15,374 78% 52, VASA 19% 4,036 81% 17, Total 14% 29,531 86% 187,563 Source: Survey, Camoin Associates Camoin Associates Economic and Fiscal Impact of the Vermont Trails and Greenways Council 7

13 Visitor Spending Impacts The users of the Trails will have an impact on the state economy as they make purchases including lodging, transportation, and food and beverage purchases. Based on the information collected from the survey, we are able to estimate the average spending of day and overnight users of the different trail systems. 5 Note that the table to the right calculates average spending per party, per trip and does not yet break it down to per person or per day. It is interesting to note that the Catamount Trail users and VASA users spend the most money, with the Long Trail users spending the least. The lower spending amounts for users of the Long Trail/Green Mountain Club system is expected as there are many long distance or thru hikers on the Long Trail and they spend very little money as they do not venture off trail often and tend to bring food with them. On average, day users of all the trail systems spend about 20% 30% of what the overnight visitors spend. Average Spending per Party Catamount Trail Day Visitor Overnight Visitor Per Party Per Party Transportation $ 48 $ 226 Food & Drink (Restaurant) $ 88 $ 236 Food & Drink (Grocery) $ 26 $ 133 Overnight Lodging $ - $ 334 Gifts/Souvenirs $ 36 $ 110 Recreation (admission fees) $ 29 $ 197 Equipment Purchases $ 78 $ 333 Average Spending Per Party $ 305 $ 1,569 Long Trail/Green Mountain Club* Day Visitor Overnight Visitor Per Party Per Party Transportation $ 20 $ 81 Food & Drink (Restaurant) $ 36 $ 179 Food & Drink (Grocery) $ 11 $ 152 Overnight Lodging $ - $ 177 Gifts/Souvenirs $ 15 $ 35 Recreation (admission fees) $ 12 $ 23 Equipment Purchases $ 32 $ 11 Average Spending Per Party $ 125 $ 657 Kingdom Trails Day Visitor Overnight Visitor Per Party Per Party Transportation $ 69 $ 145 Food & Drink (Restaurant) $ 91 $ 230 Food & Drink (Grocery) $ 62 $ 152 Overnight Lodging $ - $ 470 Gifts/Souvenirs $ 27 $ 66 Recreation (admission fees) $ 64 $ 126 Equipment Purchases $ 63 $ 129 Average Spending Per Party $ 376 $ 1,317 VASA Day Visitor Overnight Visitor Transportation $ 152 $ 226 Food & Drink (Restaurant) $ 118 $ 326 Food & Drink (Grocery) $ 89 $ 285 Overnight Lodging $ - $ 119 Gifts/Souvenirs $ 51 $ 119 Recreation (admission fees) $ 33 $ 116 Equipment Purchases $ 44 $ 390 Average Spending Per Party $ 487 $ 1,580 * There were too few respondents that were only staying in Vermont for the day to come up with good estimates for spending on the Long Trail. In this case we based the day user spending off of the Catamount Trail spending and reduced it down proportionally to how the overnight spending baskets relate to each other (Long Trail overnight spending is approximately 41% of the Catamount Trail overnight spending). 5 Note: In order to make a conservative estimate for the spending baskets, the analysts assumed that no money was spent in a category if the survey taker did not fill in that category. This is likely a conservative assumption and undercounts total spending. Camoin Associates Economic and Fiscal Impact of the Vermont Trails and Greenways Council 8

14 The table to the right breaks down the spending into per person and per day estimates. Using the Catamount Trail as an example, we know that a day user party spends $305 and the survey results tell us that they have an average of 2 people per party or $135 per person. There are 819 net new day users of the Catamount Trail per year, and if they each spend an average of $135 that is $110,491 per year. The overnight users spend $1,569 per party per visit, with an average stay of 3.6 days and 3 people per party that is $145 dollars per day. With 2,890 overnight net new users that is $417,845 new spending resulting from overnight users of the Catamount Trail. In total, the Catamount Trail creates nearly $528,336 in direct spending per year in Vermont. The same process was followed for the four trail systems, and in total results in over $15 million in new spending in Vermont. Total Net New Spending in Vermont Catamount Trail Day Visit Multiple Day Spending Per Party $ 305 $ 1,569 Spending Per Day $ 305 $ 437 Average Party Size 2 3 Average Spending per Person $ 135 $ 145 Total Net New Users 819 2,890 Total Net New Spending $ 110,491 $ 417,845 Total Annual Spending $ 528,336 Long Trail/Green Mountain Club Day Visit Multiple Day Spending Per Party $ 125 $ 657 Spending Per Day $ 125 $ 78 Average Party Size 2 3 Average Spending per Person $ 56 $ 31 Total Non-VT Residents 9, ,953 Total Non-VT Resident Spending $ 517,003 $ 3,511,049 Total Annual Spending $ 4,028,052 Kingdom Trails Day Visit Multiple Day Spending Per Party $ 376 $ 1,317 Spending Per Day $ 376 $ 478 Average Party Size 3 4 Average Spending per Person $ 115 $ 117 Total Non-VT Residents 15,374 52,963 Total Non-VT Resident Spending $ 1,767,459 $ 6,178,065 Total Annual Spending $ 7,945,524 VASA Day Visit Multiple Day Spending Per Party $ 487 $ 1,580 Spending Per Day $ 487 $ 518 Average Party Size 3 5 Average Spending per Person $ 148 $ 111 Total Non-VT Residents 4,036 17,757 Total Non-VT Resident Spending $ 595,607 $ 1,975,772 Total Annual Spending $ 2,571,379 Total Direct Net New Spending $ 15,073,291 Source: Survey, Camoin Associates The table below shows the direct, indirect, and total impact of user spending on the Vermont economy. The indirect activity calculates how the user s spending and associated economic activity continues to circulate adding more jobs, earnings, and sales to the regional economy. The approximately $15 million in visitor related sales calculated above was used as an input into the EMSI model to estimate the impact on jobs, earnings, and sales. The total net new impact of new visitor spending is 365 jobs, $8.8 million in earnings, and over $22 million in sales. This represents the annual economic impact the State would lose without the visitors to the Trails. Annual Economic Impact Direct Indirect Total Sales $ 15,073,291 $ 7,340,400 $ 22,413,691 Jobs Earnings $ 5,957,056 $ 2,918,958 $ 8,876,014 Source: EMSI, Camoin Associates Camoin Associates Economic and Fiscal Impact of the Vermont Trails and Greenways Council 9
15 Fiscal Impact In addition to the economic impact on the Vermont economy (outlined above), the net new users of the Trails also have a fiscal impact in terms of annual property tax and sales tax revenue collected by the State. Sales and Use Tax Sales tax will be generated for Vermont in two ways: 1. Spending Sales Tax Resulting from Trail Users Spending: From the spending by the net new Trails users on taxable goods and services, and 2. Earning Sales Tax Resulting from Jobs Created by Trail Users Spending: Due to spending by net new Trail users, businesses hire employees and those employees spend a portion of their wages on taxable goods in Vermont. Sales Based on in State spending by Trail net new users, and the assumption that 75% 6 of the total sales are on taxable goods, Vermont would receive over $1 million in new sales tax revenue. State Sales and Use Tax Generated by Trail User Spending Total Sales in Vermont Generated by Trails $ 22,413,691 Percent Taxable 75% Taxable Spending in Vermont $ 16,810,268 State Sales Tax 6% Annual Sales Tax Revenue from Sales $ 1,008,616 Earnings Source: Camoin Associates The additional earnings described by the total economic impact of Trails net new users would lead to additional sales tax revenue for the State. It is assumed that 90% of the earnings would be spent within Vermont and that 30% 7 of those purchases would be taxable. Using a sales tax rate of 6%, the Trails net new users generate over $143,000 in sales tax revenue for the State annually. State Sales Tax Revenue from Earnings Generated by Trails Total Earnings Generated by Trails $ 8,876,014 Percent Spent in Vermont 90% Total Spent in Vermont $ 7,988,413 Percent Spent on Taxable Goods 30% Total Taxable Sales $ 2,396,524 Tax Rate 6% Annual Sales Tax Revenue from Earnings $ 143,791 Source: Camoin Associates Other State Tax Revenue The economic activity associated with the Trails net new users support economic activity and therefore other tax revenue in the State. Based on current estimates, sales generated by the Trails net new users accounts for % % of the Gross State Product (GSP), and therefore we assume that % of the State s tax revenue is from activity associated with the Trails users. Total state tax revenue (excluding Sales and Use Tax described 6 Camoin Associates assumes 75% of the spending by VTGC users in Vermont is on taxable goods. This is based on a review of the spending categories reported in the survey and the total spending amounts in each category. Each category was identified as taxable or non taxable to establish a basic assumption on the percent of all goods that are taxable. 7 Camoin Associates assumes that 30% of the spending by people who have jobs in Vermont as a result of the VTGC user spending is taxable. This assumption is based on typical spending habits where a good portion of spending goes towards nontaxable items such as food from grocery stores, utilities, housing, health care, etc. Camoin Associates Economic and Fiscal Impact of the Vermont Trails and Greenways Council 10

16 above) is approximately $1.1 billion. 8,9 If Trails net new users account for.0768% of this revenue that is equal to over $851,000 annually in the State. The following table calculates the impact of the Trails net new users on the State s property tax collection. Total State Tax Revenue All State Revenue (except Sales and Use) Total Sales in Vermont Generated by Trails $ 22,413,691 Gross Regional Product for Vermont $ 29,200,000,000 Percent GRP from Trails % Total State Tax Revenue (except Sales and Use) $ 1,109,000,000 Percent Real Property Tax Revenue from Trails % State Tax Revenue from Trails $ 851,260 Source: July 2016 Economic Review and Revenue Forecast Update, Camoin Associates, EMSI Vermont receives over $2 million in tax revenue annually as a result of the net new users of the Trails. This figure does not include the local tax revenue that is generated. Annual State Tax Revenue Sales Tax Revenue from Trail Related Sales $ 1,008,616 Sales Tax Revenue from Jobs Created by Trail Related Sales $ 143,791 Other State Tax Revenue $ 851,260 Total Annual Sales Tax Revenue $ 2,003,667 Source: Camoin Associates Regional Impact This economic impact analysis focuses only on the net new economic activity that occurs in Vermont as a result of the Trails. However, it is also important to note that the various trail systems have a significant economic and fiscal impact on the host communities throughout the State. As evidenced in the survey, the Trails encourage travel within Vermont that otherwise might not occur if the trails didn t exist. Therefore, any interstate travel that occurs as a result of the Trails is a net positive for the host communities. 8 Source: July 2016 Economic Review and Revenue Forecast Update prepared for the State of Vermont Emergency Board and Legislative Joint Fiscal Office by Kavet, Rockler & Associates, LLC. 07%20July%20Forecast.pdf 9 Includes the following revenue sources: Personal Income; Corporate; Meals and Room; Cigarette and Tobacco; Liquor; Insurance; Telephone; Beverage; Electric; Estate; Property; Bank; and Other. Camoin Associates Economic and Fiscal Impact of the Vermont Trails and Greenways Council 11
17 Economic Activity Previous sections of this report focus on the economic and fiscal impacts of the Trails on the State of Vermont whereas the following is the economic activity associated with the trail and considers the spending of all users of the trail, not simply those that are net new. Economic activity is a compilation of the general economic activity around, in this case, trail use. It reports all the people using the trails and what they might be spending. It is a good way to simply summarize what is happening whereas the economic impact analysis focuses only on new spending that, but for the Trails, would not occur within the State of Vermont. Economic impact analyses are considered a more rigorous look not at just what is happening, but what is changing economically in the state. While not as rigorous as the economic impact study, the economic activity is a good measure of the size of the Trails activity relative to the state s economy. Using the average spending per party, average party size, and average number of days in Vermont of the non net new users (both Vermont residents and non Vermont residents who indicated that the Trails were not their primary or secondary reason for being in the state) plus the economic impact of net new trail users estimated in the previous section, it is estimated that the Trails account for over $30.8 million in economic activity annually. Net New Economic Impact Net New Economic Impact $ 15,073,291 Sub-Total Economic Activity $ 15,073,291 Non-Vermont Resident Economic Activity Average Spending per Person (3.78 people per party and 2.55 days in Vermont) Transportation 14 Food & Drink (Restaurant) 21 Food & Drink (Grocery) 14 Gifts/Souvenirs 6 Recreation (admission fees) 12 Sub-Total Economic Activity 68 Total Non-Vermont Non-Net New Spending (34,780 per Year) $ $ 493,090 $ $ 744,883 $ $ 495,458 $ $ 220,177 $ $ 405,482 $ $ 2,359,089 Vermont Resident Economic Activity Average Spending per Person Total Resident Spending (3.65 people per party) (157,876 per Year) Transportation $ 26 $ 4,046,103 Food & Drink (Restaurant) $ 22 $ 3,470,937 Food & Drink (Grocery) $ 20 $ 3,146,641 Gifts/Souvenirs $ 5 $ 772,527 Recreation (admission fees) $ 12 $ 1,934,797 Sub-Total Economic Activity $ 85 $ 13,371,004 TOTAL ECONOMIC ACTIVITY $ 30,803,384 Source: Camoin Associates, Survey Again, of the approximately $30 million in total economic activity, roughly $15 million can be considered net new to the state. Camoin Associates Economic and Fiscal Impact of the Vermont Trails and Greenways Council 12

18 Direct Use Benefit In addition to the visitors to Vermont that are drawn by the Trails, residents of Vermont also benefit immensely from the opportunities for recreation, and the general enjoyment of nature. The use of Trails by residents has measurable economic value referred to as direct use benefit. The direct use benefit is not an actual measure of spending, but rather measures how much residents of Vermont value the Trails. Essentially, direct use is the value that any given resident places on a particular activity that they do within the system, even if that activity is free. Economists have determined that certain recreational activities are worth specific dollar amounts to participants in these activities. The value per visit is the money saved by visitors from not having to pay for the recreational experiences they enjoy on VTGC member organization lands. Put another way, it is how much visitors would be willing to pay to do those activities, if the activities were not free. Since these activities are (generally) free, visitors receive a benefit (value) by not having to pay that amount. Based on the findings of the survey, approximately 157,900 Vermont residents use the Trails on an annual basis. Using the U.S. Army Corps of Engineers estimates that General Use recreation (including trails, picnicking, sitting, etc.) is worth $3.90 per visit for a total of $615,715 per year. Annual Direct Use Value Value per Visit Resident (U.S. Army Corps of Total Value Users Engineers) 157,876 $3.90 $ 615,715 Source: Survey, Camoin Associates, U.S. Corps of Engineers FY 2016 Economics Guidance Memorandum Other Spending In addition to the economic activity and economic impact described above, there is also spending on equipment that is not included in this analysis. The survey focused on spending per trip and while some people did include spending related to major purchases such as new mountain bikes, new ATVs and new skis, it would not be appropriate to attribute those major purchases to each of the trips to Vermont. So it is important to note that the State also receives sales tax and economic activity when people make these major purchases in Vermont because of their regular use of the Trails. Camoin Associates Economic and Fiscal Impact of the Vermont Trails and Greenways Council 13
19 Attachment A: What is an Economic Impact Analysis? The purpose of conducting an economic impact study is to ascertain the total cumulative changes in employment, earnings and output in a given economy due to some initial change in final demand. To understand the meaning of change in final demand, consider the installation of a new widget manufacturer in Anytown, USA. The widget manufacturer sells $1 million worth of its widgets per year exclusively to consumers in Canada. Therefore, the annual change in final demand in the United States is $1 million because dollars are flowing in from outside the United States and are therefore new dollars in the economy. This change in final demand translates into the first round of buying and selling that occurs in an economy. For example, the widget manufacturer must buy its inputs of production (electricity, steel, etc.), must lease or purchase property and pay its workers. This first round is commonly referred to as the Direct Effects of the change in final demand and is the basis of additional rounds of buying and selling described below. To continue this example, the widget manufacturer s vendors (the supplier of electricity and the supplier of steel) will enjoy additional output (i.e. sales) that will sustain their businesses and cause them to make additional purchases in the economy. The steel producer will need more pig iron and the electric company will purchase additional power from generation entities. In this second round, some of those additional purchases will be made in the US economy and some will leak out. What remains will cause a third round (with leakage) and a fourth (and so on) in ever diminishing rounds of spending. These sets of industry to industry purchases are referred to as the Indirect Effects of the change in final demand. Finally, the widget manufacturer has employees who will naturally spend their wages. As with the Indirect Effects, the wages spent will either be for local goods and services or will leak out of the economy. The purchases of local goods and services will then stimulate other local economic activity; such effects are referred to as the Induced Effects of the change in final demand. Therefore, the total economic impact resulting from the new widget manufacturer is the initial $1 million of new money (i.e. Direct Effects) flowing in the US economy, plus the Indirect Effects and the Induced Effects. The ratio between Direct Effects and Total Effects (the sum of Indirect and Induced Effects) is called the multiplier and is often reported as dollar of impact per dollar of change. Therefore, a multiplier of 2.4 means that for every dollar ($1) of change in final demand, an additional $1.40 of indirect and induced economic activity occurs for a total of $2.40. Key information for the reader to retain is that this type of analysis requires rigorous and careful consideration of the geography selected (i.e. how the local economy is defined) and the implications of the geography on the computation of the change in final demand. If this analysis wanted to consider the impact of the widget manufacturer on the entire North American continent, it would have to conclude that the change in final demand is zero and therefore the economic impact is zero. This is because the $1 million of widgets being purchased by Canadians is not causing total North American demand to increase by $1 million. Presumably, those Canadian purchasers will have $1 million less to spend on other items and the effects of additional widget production will be cancelled out by a commensurate reduction in the purchases of other goods and services. Changes in final demand, and therefore Direct Effects, can occur in a number of circumstances. The above example is easiest to understand: the effect of a manufacturer producing locally but selling globally. If, however, 100% of domestic demand for a good is being met by foreign suppliers (say, DVD players being imported into the US from Korea and Japan), locating a manufacturer of DVD players in the US will cause a change in final demand because all of those dollars currently leaving the US economy will instead remain. A situation can be envisioned whereby a producer is serving both local and foreign demand, and an impact analysis would have to be careful in calculating how many new dollars the producer would be causing to occur domestically. Camoin Associates Economic and Fiscal Impact of the Vermont Trails and Greenways Council 14
20 Attachment B: Survey Questions Vermont Trails and Greenways Council - Visitor Survey Please fill out one survey per party and do not fill this survey out more than once. Thank you. 1. What is the zip code of your primary residence? 2. Age a. <18 b c d e f g Gender a. Male b. Female c. Choose Not to Respond 4. How many people are in your party (including yourself)? a. Adults b. Children (18 and under) 5. How long will you be in Vermont (including travel time)? a. Vermont is my primary residence b. < 6 hours c hours d. Overnight: Number of nights 6. How long will you be on the trail? a. <6 hrs b hrs c hrs d. overnight 7. How would you describe your primary reason for coming to the State? a. Use of this trail is the primary reason I am in Vermont b. I am in Vermont for many reasons, one of which is the trail c. I was already in Vermont (or live here) and decided to come to the trail d. I moved to Vermont because of access to the trail(s) 8. What activity are you participating in today? a. Hiking/Trail Running b. Snowshoeing c. Mountain Biking d. Fat Biking e. Backcountry Skiing/Snowboarding f. Cross Country Skiing g. ATV 9. How many days per year, on average, do you participate in the following activities in Vermont (including today): a. Hiking/Trail Running e. Backcountry Skiing/Snowboarding b. Snowshoeing f. Cross Country Skiing c. Mountain Biking g. ATV d. Fat Biking h. Snowmobiling 10. Did this visit to the trail involve an overnight stay in one of the following types of accommodations? Please indicate the number of nights. a. Motel/Hotel e. Second Home b. Bed and Breakfast f. Vacation Rental c. Friend or Relative s Home g. Other d. Campground 11. Please estimate the total amount your party will spend during your entire visit to Vermont (only report on this visit) in each of the following categories: Place a zero if you will not spend money in that particular category. a. Transportation (including parking and gas for personal vehicle) $ b. Food & Drink (restaurants) $ c. Food & Drink (grocery or convenience stores) $ d. Overnight lodging $ e. Gifts/souvenirs and other shopping $ f. Recreation (such as admission fees, rentals, tours, etc.) $ g. Equipment purchases (purchased in VT) $ h. ATV vehicle maintenance and fuel (purchased in VT) $ i. Other please describe: $ 12. Do you pay any user/membership fees to any trail organizations within the state of Vermont? Yes No If yes, please list organization and amount: Camoin Associates Economic and Fiscal Impact of the Vermont Trails and Greenways Council 15
21 Attachment C: Survey Answers The following are some additional findings from the data collected. Age of Survey Taker Age Number Percent <18 8 0% % % % % % % Length of Time on the Trail Overnight 17% <6 hours 47% 6 12 hours 36% What Activity Are You Participating in Today? Activity Number Percent ATV % Backcountry Skiing/Snowboarding % Cross Country Skiing 55 3% Fat Biking 87 6% Hiking/Trail Running % Mountain Biking % Snowmobiling 1 0% Snowshoeing 16 1% *For online survey takers this was asked as "What was the primary activity you were participating in during your last trip to Vermont?" Do you pay any user/membership fees to any trail organizations within the state of Vermont? Top Lodging Age Number Percent Vacation Rental % Campground % Second Home 91 9% Motel/Hotel 82 8% Bed and Breakfast 78 8% Friend or Relatives Home 61 6% Total Responses* % *Some people selected multiple answers. The figures above are based only on those who selected just one lodging option for their stay. Yes, 64% No, 36% Camoin Associates Economic and Fiscal Impact of the Vermont Trails and Greenways Council 16

22 Camoin Associates, Inc. 120 West Avenue, Suite 303 Saratoga Springs, NY
GREEN ACRES MALL AND COMMONS: ECONOMIC AND FISCAL IMPACT ANALYSIS
 GREEN ACRES MALL AND COMMONS: ECONOMIC AND FISCAL IMPACT ANALYSIS November 14, 2016 Prepared for: John Ryan, Esq Ryan, Brennan and Donnally Floral Park, New York 518.899.2608 www.camoinassociates.com About
THE ECONOMIC IMPACT OF TOURISM IN VERMONT: SPRING & SUMMER 2001
 THE ECONOMIC IMPACT OF TOURISM IN VERMONT: SPRING & SUMMER 2001 Prepared for The Vermont Department of Tourism and Marketing By Department of Community Development & Applied Economics The University of
The Economic Impact Of Travel on Massachusetts Counties 2015
 The Economic Impact Of Travel on Massachusetts Counties 2015 A Study Prepared for the Massachusetts Office of Travel and Tourism By the Research Department of the U.S. Travel Association Washington, D.C.
Scottsdale Tourism Study - Visitor Statistics
 Scottsdale Tourism Study - Visitor Statistics January 2018 Tourism and Events Department Scottsdale Visitor Statistics January 2018 Scottsdale City Council W.J. Jim Lane Mayor Linda Milhaven Kathy Littlefield
Scottsdale Tourism Study - Visitor Statistics
 Scottsdale Tourism Study - Visitor Statistics September 2018 Tourism and Events Department Scottsdale Visitor Statistics September 2018 Scottsdale City Council W.J. Jim Lane Mayor Linda Milhaven Kathy
Economic and Fiscal Impact of the Arizona Public University Enterprise
 Economic and Fiscal Impact of the Arizona Public Enterprise Prepared for: January 2019 Prepared by: and Elliott D. Pollack & Company 7505 East 6 th Avenue, Suite 100 Scottsdale, Arizona 85251 1300 E Missouri
VDTM3436 Economic Impact Study Brochure
 10/25/10 1 The Travel and Tourism Industry in Vermont A Benchmark Study of the Economic Impact of Visitor Expenditures on the Vermont Economy 2009 INTRODUCTION Despite the significant impact of the Great
Economic Impacts Associated with Improvements to Storm Lake
 Daniel Otto, Professor and Extension Economist Economics Department Iowa State University Dec. 2004 Economic Impacts Associated with Improvements to Storm Lake This report analyzes the economic impacts
The Economic Impact of the 2012 Alberta Cross Country Ski World Cup
 The Economic Impact of the 2012 Alberta Cross Country Ski World Cup Event Dates: December 13, 15, & 16, 2012 Venue: Canmore Nordic Centre Canmore, Alberta, Canada Host Organization: Alberta World Cup Society
The Economic Impact of Travel on Massachusetts Counties 2009
 The Economic Impact of Travel on Massachusetts Counties 2009 A Study Prepared for the Massachusetts Office of Travel and Tourism by the Research Department of the U.S. Travel Association Washington, D.C.
The Impact of the Tourism Sector on the Vermont Economy: 1999
 The Impact of the Tourism Sector on the Vermont Economy: 1999 Prepared by Department of Community Development and Applied Economics, The University of Vermont, Vermont Tourism Data Center, School of Natural
The Economic Impact of Tourism in New York Calendar Year Long Island Focus
 The Economic Impact of Tourism in New York 2010 Calendar Year Long Island Focus Key themes in 2010 The New York State visitor economy rebounded in 2010, recovering 94% of the losses experienced during
The Economic Impact of Travel on Massachusetts Counties 2016
 The Economic Impact of Travel on Massachusetts Counties 2016 A Study Prepared for the Massachusetts Office of Travel and Tourism By the Research Department of the U.S. Travel Association Washington, D.C.
Welcome To Rockville Intercept Survey Report. April 26 th -27 th, 2014
 Welcome To Rockville Intercept Survey Report April 26 th -27 th, 2014 Prepared for: Laurie Kopstad Visit Jacksonville Prepared by: Michael M. Binder, Ph.D Andrew C. Hopkins, MPA May 14, 2014 METHODOLOGY
The Economic Impact of the 2014 Alberta Winter Games
 The Economic Impact of the 2014 Alberta Winter Games Event Dates: February 6-9, 2014 Location: Banff & Canmore, Alberta Host Organization: Banff-Canmore 2014 Alberta Winter Games Society Survey and Data
Lake Tahoe Visitors Authority. Visitor Profile Study Top Line Results Preliminary Summer + Fall 2015
 Lake Tahoe Visitors Authority Visitor Profile Study Top Line Results Preliminary Summer + Fall 2015 Notes The following is summary top line report of data collected over the summer and fall quarters. The
The Economic Impact of Tourism in New York
 The Economic Impact of Tourism in New York 2010 Calendar Year Greater Niagara Focus Key themes in 2010 The New York State visitor economy rebounded in 2010, recovering 94% of the losses experienced during
ECONOMIC IMPACT STUDY
 ECONOMIC IMPACT STUDY THE EVENT 211 CANADIAN CROSS COUNTRY SKI CHAMPIONSHIPS MARCH 11 19, 211 THE SPORT CROSS COUNTRY SKIING THE LOCATION CANMORE, ALBERTA THE VENUE CANMORE NORDIC CENTRE THE HOST ORGANIZATION
The Economic Impact of Tourism in New York
 The Economic Impact of Tourism in New York 2010 Calendar Year Chautauqua Allegheny Focus Key themes in 2010 The New York State visitor economy rebounded in 2010, recovering 94% of the losses experienced
Greater Des Moines Water Trails & Greenways Economic Impact Study
 Greater Des Moines Water Trails & Greenways Economic Impact Study SUBMITTED TO Capital Crossroads SUBMITTED BY Johnson Consulting November 26, 2018 FINAL TABLE OF CONTENTS SECTION I COVER LETTER SECTION
2015 Ford World Men s Curling Championships Halifax, Nova Scotia
 2015 Ford World Men s Curling Championships Halifax, Nova Scotia Economic Impact Assessment November 2015 The following analysis provides the economic impact of the 2015 Ford World Men s Curling Championship
ECONOMIC IMPACT STUDY
 ECONOMICIMPACTSTUDY EVENT 2011LAKELOUISEWINTERSTARTWORLDCUP NOVEMBER26 27&DECEMBER1 4,2011 THESPORT ALPINESKIING THELOCATION LAKELOUISE,ALBERTA THEVENUE LAKELOUISESKIRESORT Credit:RogerWitney/AlpineCanadaAlpin
Estimated Economic Impacts of Tennessee State Parks
 Estimated Economic Impacts of Tennessee State Parks University of Tennessee Institute for Agriculture Department of Agricultural and Resource Economics Department of Forestry, Wildlife and Fisheries J.
2002 State Economic Impacts of Missouri State Park Visitors. Project Completion Report
 2002 State Economic Impacts of Missouri State Park Visitors Project Completion Report Submitted to Missouri Department of Natural Resources Division of State Parks Prepared by: Shu Tian Cole, Ph.D. C.
ECONOMIC IMPACT OF TRAVEL ON GEORGIA 2004 PROFILE
 ECONOMIC IMPACT OF TRAVEL ON GEORGIA 2004 PROFILE A Study Prepared for the Georgia Department of Economic Development (DEcD) By the Travel Industry Association of America Washington, D.C. June 2005 Preface
Mountain Biking Economic Impact Study - Pemberton
 (Electoral Area C) Mountain Biking Economic Impact Study - Pemberton May 2017 Copyright 2017 Western Canada Mountain Bike Tourism Association Summary: Mountain Biking in Pemberton 2016 Mountain biking
RACCOON RIVER VALLEY TRAIL
 RACCOON RIVER VALLEY TRAIL Economic Impact September, 2016 Raccoon River Valley Trail CYBIZ LAB TEAM Erin Rettenmaier Phase 1 Team Lead Joseph Gunkelman Phase 2 Team Lead Nick Jordan Jared Brown 1 TABLE
The Economic Impact of Tourism in New York Calendar Year Thousand Islands Focus
 The Economic Impact of Tourism in New York 2016 Calendar Year Thousand Islands Focus 2 State Summary Key trends in 2016 New York State s tourism economy expanded in 2016 with 2.7% growth in traveler spending,
Introduction...1. Project Overview.2. Cache la Poudre River NHA Economic Impact 4. Conclusion..10. Appendix A: Glossary of Terms 11
 TABLE OF CONTENTS Introduction...1 Project Overview.2 Cache la Poudre River NHA Economic Impact 4 Conclusion..10 Appendix A: Glossary of Terms 11 Appendix B: Research Methodology 12 Acknowledgements.18
Oswego County Economic Advancement Plan:
 Oswego County Economic Advancement Plan: Comparison Assessment September 2017 Prepared for: Oswego County, NY 120 West Avenue, Suite 303 Saratoga Springs, NY 12866 518.899.2608 www.camoinassociates.com
The Economic Impact of Tourism in New York
 The Economic Impact of Tourism in New York 2015 Calendar Year Finger Lakes Focus 2 State Summary Key trends in 2015 3 New York State s tourism economy expanded in 2015 with 1.0% growth in traveler spending.
The Economic Impact of Short-Term Rentals In the State of Texas 2018 Update
 The Economic Impact of Short-Term Rentals In the State of Texas 2018 Update Prepared by TXP, Inc. 1310 South 1st Street, Suite 105 Austin, Texas 78704 (512) 328-8300 www.txp.com Overview The popularity
CONTRIBUTION OF THE GREENVILLE HOSPITAL SYSTEM TO THE ECONOMIES OF GREENVILLE COUNTY AND THE SOUTH CAROLINA UPSTATE, 2000
 REDRL RESEARCH REPORT 05-2001-01 CONTRIBUTION OF THE GREENVILLE HOSPITAL SYSTEM TO THE ECONOMIES OF GREENVILLE COUNTY AND THE SOUTH CAROLINA UPSTATE, 2000 prepared by Mark S. Henry, Professor David L.
The Economic Impact of Leech Lake Band of Ojibwe Gaming Operations
 ECONOMIC IMPACT ANALYSIS The Economic Impact of Leech Lake Band of Ojibwe Gaming Operations An Extension Community Economics Program Prepared by: Brigid Tuck and Adeel Ahmed with assistance from: David
The Economic Impact of Tourism in New York
 The Economic Impact of Tourism in New York 2017 Calendar Year Greater Niagara Focus 2 State Summary Key trends in 2017 New York State s tourism economy expanded in 2017 with 4.4% growth in traveler spending,
The Economic Impact of Alberta s Winter Olympic Legacy Events
 June 6, 2013 Credit: Roger Witney/Alpine Canada Alpin Credit: Arno Hoogveld The Economic Impact of Alberta s Winter Olympic Legacy Events 1988 Olympic Winter Games gave Alberta many world class winter
Lake Havasu City Travel Impacts, p
 Lake Havasu City Travel Impacts, 2005-2010p photo courtesy of Lake Havasu Convention & Visitors Bureau JUNE 2011 PREPARED FOR Lake Havasu Convention & Visitors Bureau Lake Havasu City, Arizona LAKE HAVASU
The Economic Impact of Tourism in New York
 The Economic Impact of Tourism in New York 2010 Calendar Year Finger Lakes Focus Key themes in 2010 The New York State visitor economy rebounded in 2010, recovering 94% of the losses experienced during
The Economic Impact of Tourism in New York Calendar Year Hudson Valley Focus
 The Economic Impact of Tourism in New York 2017 Calendar Year Hudson Valley Focus 2 State Summary Key trends in 2017 New York State s tourism economy expanded in 2017 with 4.4% growth in traveler spending,
The Impact of the Tourism Sector on the Vermont Economy: The Input-Output Analysis
 The Impact of the Tourism Sector on the Vermont Economy: The Input-Output Analysis By Tun Lin, Graduate Student, The University of Vermont Department of Community Development and Applied Economics Burlington,
The Local Economic Impact of Short Term Rentals in Galveston, Texas
 The Local Economic Impact of Short Term Rentals in Galveston, Texas TXP, Inc. 1310 South 1st Street #105 Austin, Texas 78704 www.txp.com Overview Short term rentals (STR) are an increasingly popular lodging
Truckee Donner Chamber of Commerce Visitor Profile Study. Four Season Visitor Profile Study 2013/14
 Truckee Donner Chamber of Commerce Visitor Profile Study Four Season Visitor Profile Study 2013/14 Thanks You! Thanks to the Town of Truckee for funding this Visitor Profile Study through the marketing
Jacksonville Jazz Festival Intercept Survey Report. May 22 nd -25 th, 2014
 Jacksonville Jazz Festival Intercept Survey Report May 22 nd -25 th, 2014 Prepared for: Laurie Kopstad Visit Jacksonville Prepared by: Michael M. Binder, Ph.D Andrew C. Hopkins, MPA June 4, 2014 METHODOLOGY
Economic Impact of. on Tangipahoa Parish. December Herb Holloway Dr. Abul Jamal William Joubert
 Economic Impact of on Tangipahoa Parish December 2013 Herb Holloway Dr. Abul Jamal William Joubert December 20, 2013 The Southeastern Louisiana University Business Research Center (BRC) is jointly operated
Economic Impact of THE PLAYERS Championship Golf Tournament at Ponte Vedra Beach, Florida, May Tom Stevens, Alan Hodges and David Mulkey
 Economic Impact of THE PLAYERS Championship Golf Tournament at Ponte Vedra Beach, Florida, May 2007 by Tom Stevens, Alan Hodges and David Mulkey University of Florida, Institute of Food and Agricultural
Economic Impact Analysis of Fort Steele National Heritage Town. Final Report. By:
 Economic Impact Analysis of Fort Steele National Heritage Town Final Report By: The Canadian Tourism Research Institute The Conference Board of Canada April 30, 2008 WHAT'S INSIDE This study reports on
TRANSPORTATION-SPECIFIC SALES TAX REVENUE 23% Visitors Generate Roughly 23 Percent of Taxable Retail Sales
 EXECUTIVE SUMMARY Applied Analysis was retained by the Las Vegas Convention and Visitors Authority ( LVCVA ) to review and analyze the economic impacts associated with its various operations and the overall
Rebekka Dudensing, Texas AgriLife Extension Service I January Economic Impact of the Brazos
 Rebekka Dudensing, Texas AgriLife Extension Service I January 2014 Economic Impact of the Brazos Brazos County County Expo Expo Complex Complex: Economic Fiscal Impact Year of Surveyed Events, Fiscal Year
Gateway Center, Collinsville, Illinois Economic and Fiscal Impact Analysis
 Economic and Fiscal Impact Analysis SUBMITTED TO Gateway Center SUBMITTED BY C.H. Johnson Consulting, Inc. February 2017 TABLE OF CONTENTS SECTION I TRANSMITTAL LETTER SECTION II INTRODUCTION AND EXECUTIVE
Arizona Travel Impacts p
 Arizona Travel Impacts 1998-2007p June 2008 Prepared for the Arizona Office of Tourism Phoenix, Arizona ARIZONA TRAVEL IMPACTS 1998-2007P Arizona Office of Tourism Primary Research Conducted By: Dean
Economic Impact of Mountain Biking in the Grand Mesa, Uncompahgre & Gunnison National Forests
 Economic Impact of Mountain Biking in the Grand Mesa, Uncompahgre & Gunnison National Forests JA MES N. M A PLES, PhD MICH A EL J. BR A DLEY, PhD Image Credit: Carl Zoch Report submitted to Outdoor Alliance:
The Economic Capture of the Downtown Phoenix Redevelopment Area. Prepared for:
 The Economic Capture of the Downtown Phoenix Redevelopment Area Prepared for: June 2018 Table of Contents Section 1: Executive Summary... 2 Section 2: Introduction and Purpose... 4 2.1 Analytical Qualifiers...4
Stynes Chang and Propst 1996 National CE Estimates 02/16/98 Page 1. National Economic Impacts of CE Recreation Visitor Spending: An Update for 1996
 Stynes Chang and Propst 1996 National CE Estimates 02/16/98 Page 1 National Economic Impacts of CE Recreation Visitor Spending: An Update for 1996 Daniel J. Stynes, Wen-Huei Chang and Dennis B. Propst
Tulip Time 2015: Economic Impact and Attendee Profile
 July 13, 2015 Tulip Time 2015: Economic Impact and Attendee Profile Prepared by: Anderson Economic Group, LLC Cristina Benton, Consultant Traci Taylor, Senior Analyst Scott Watkins, Senior Consultant Commissioned
Vermont Tourism: By the Numbers. Ken Jones, Economic Research Analyst Vermont Agency of C0mmerce and Community Development April 12, 2018
 Vermont Tourism: By the Numbers Ken Jones, Economic Research Analyst Vermont Agency of C0mmerce and Community Development April 12, 2018 Putting it in Context Marketing and Policy What is the Size of the
New Orleans Ernest N. Morial Convention Center
 New Orleans Ernest N. Morial Convention Center 2016 Economic Impact Analysis Prepared for By July 2017 Acknowledgments This report was prepared by Maria J. Ortiz, Project Manager in the Division of Business
The Economic Impact of Tourism in New York
 The Economic Impact of Tourism in New York 2013 Calendar Year Finger Lakes Focus 2 State Summary Key trends in 2013 New York State s tourism economy expanded in 2013 with 3.5% growth in traveler spending.
The Economic Impact of Off-Highway Vehicles in Iowa
 The Economic Impact of Off-Highway Vehicles in Iowa Prepared for the Iowa Off-Highway Vehicle Association Strategic Economics Group Des Moines, Iowa Daniel Otto and Harvey Siegelman January, 2008 Executive
2018 Major League Baseball Florida Spring Training Economic Impact Study. Joseph St. Germain, Ph.D. Phillip Downs, Ph.D.
 2018 Major League Baseball Florida Spring Training Economic Impact Study Joseph St. Germain, Ph.D. Phillip Downs, Ph.D. Rachael Anglin Introduction 2 Goals Determine overall economic impact, jobs supported,
2015 A Record Year for Indiana Tourism. Methodology, Metrics and Evaluation
 2015 A Record Year for Indiana Tourism Methodology, Metrics and Evaluation Table of Contents 2015 Indiana Tourism Highlights Background & Methodology 2014 2015 Indiana Tourism Performance 2015 Tourism
THE ECONOMIC IMPACT OF NATIONAL HERITAGE AREAS: A CASE STUDY APPROACH
 THE ECONOMIC IMPACT OF NATIONAL HERITAGE AREAS: A CASE STUDY APPROACH WHEELING NATIONAL HERITAGE AREA JUNE 2017 TABLE OF CONTENTS Introduction...2 Project Overview.4 Wheeling NHA Economic Impact...6 Conclusion.14
The Economic Impact of the. and the Georgia Dome
 The Economic Impact of the Georgia World Congress Center and the Georgia Dome On Georgia s Economy in FY 2008 Jeffrey M. Humphreys, Director Selig Center for Economic Growth August 2008 Executive Summary
Economic Significance of Meetings to the US Economy. Events Industry Council
 Economic Significance of Meetings to the US Economy Events Industry Council February 2018 February 2018 This Economic Significance Study (ESS), conducted by Oxford Economics, quantifies a vital industry
AMERICA S BYWAYS RESOURCE CENTER JOURNEY THROUGH HALLOWED GROUND ECONOMIC IMPACT TOOL: SENSITIVITY ANALYSIS
 AMERICA S BYWAYS RESOURCE CENTER JOURNEY THROUGH HALLOWED GROUND ECONOMIC IMPACT TOOL: SENSITIVITY ANALYSIS CASE STUDY AUGUST 16, 2012 mountainview@utah.gov www.udot.utah.gov/mountainview CONTENTS Executive
The Economic Impact of Tourism in New York
 The Economic Impact of Tourism in New York 2016 Calendar Year Finger Lakes Focus 2 State Summary Key trends in 2016 New York State s tourism economy expanded in 2016 with 2.7% growth in traveler spending,
The 2015 Economic Impact Study of the Recreation Vehicle Industry
 The 2015 Economic Impact Study of the Recreation Vehicle Industry Methodology Prepared for Recreation Vehicle Industry Association 1896 Preston White Drive Reston, VA 20191 By John Dunham & Associates,
THE ECONOMIC IMPACT OF NATIONAL HERITAGE AREAS: A CASE STUDY APPROACH
 THE ECONOMIC IMPACT OF NATIONAL HERITAGE AREAS: A CASE STUDY APPROACH CROSSROADS OF THE AMERICAN REVOLUTION MARCH 2017 TABLE OF CONTENTS Introduction...2 Project Overview.3 Crossroads of the American Revolution
Impact Analysis of the Greensboro Coliseum Complex for the 2012 Operating Year
 Regional Dynamics & Economic Modeling Laboratory Impact Analysis of the Greensboro Coliseum Complex for the 2012 Operating Year On Greensboro & Guilford County, North Carolina and the Surrounding Area
THE ECONOMIC IMPACT OF THE ROUND ROCK CHAMBER
 THE ECONOMIC IMPACT OF THE ROUND ROCK CHAMBER 2012 2017 July 12, 2017 Prepared for: Round Rock Chamber 212 East Main St. Round Rock, TX 78664 Prepared by: Impact DataSource Austin, Texas www.impactdatasource.com
The Economic Impact of Spending for Operations and Construction in 2013 by AZA-Accredited Zoos and Aquariums
 The Economic Impact of Spending for Operations and Construction in 2013 by AZA-Accredited Zoos and Aquariums By Stephen S. Fuller, Ph.D. Dwight Schar Faculty Chair and University Professor Director, Center
LGA PROFILE - Glen Innes Severn
 Dec-08 Mar-09 Jun-09 Sep-09 Dec-09 Mar-10 Jun-10 Sep-10 Dec-10 Mar-11 Jun-11 Sep-11 Dec-11 Mar-12 Jun-12 Sep-12 Dec-12 Mar-13 Jun-13 Sep-13 Dec-13 Mar-14 Jun-14 Sep-14 Visitors (000's) OVERVIEW LGA PROFILE
SALES TAX ATTRIBUTABLE TO VISITORS
 EXECUTIVE SUMMARY Applied Analysis was retained by the Las Vegas Convention and Visitors Authority (the LVCVA ) to review and analyze the economic impacts associated with its various operations and southern
Impacts of the Commercial Gaming Industry in Iowa. November 2014
 Impacts of the Commercial Gaming Industry in Iowa November 2014 Overview To quantify the statewide impacts of the commercial gaming industry for the American Gaming Association, Oxford Economics analyzed
Impacts of the Commercial Gaming Industry in Indiana. November 2014
 Impacts of the Commercial Gaming Industry in Indiana November 2014 Overview To quantify the statewide impacts of the commercial gaming industry for the American Gaming Association, Oxford Economics analyzed
THE ECONOMIC IMPACT OF THE ROUND ROCK CHAMBER OF COMMERCE & ECONOMIC DEVELOPMENT PARTNERSHIP
 THE ECONOMIC IMPACT OF THE ROUND ROCK CHAMBER OF COMMERCE & ECONOMIC DEVELOPMENT PARTNERSHIP 2011 2014 November 7, 2014 Prepared for: Round Rock Chamber of Commerce & Economic Development Partnership 212
The Economic Impact of Tourism in Fairfield County, Ohio. June 2016
 The Economic Impact of Tourism in Fairfield County, Ohio June 2016 Fairfield County tourism summary Fairfield County Tourism Sales ($) Top quintile Middle quintile First quintile 2 Overview Tourism is
Economic Impact of the Hotel Roanoke and Conference Center. Prepared by the
 Economic Impact of the Hotel Roanoke and Conference Center Prepared by the April 2015 The economic impact analysis provided in this report was generated using an economic impact model (IMPLAN) calibrated
The Local Economic Impact of Short Term Rentals in Monterey County
 The Local Economic Impact of Short Term Rentals in Monterey County TXP, Inc. 1310 South 1st Street #105 Austin, Texas 78704 www.txp.com Overview Short term rentals (STR) are an increasingly popular lodging
Georgia World Congress Center and Georgia Dome Economic Impact Analysis FY 2016
 Georgia World Congress Center and Georgia Dome Economic Impact Analysis FY 2016 Prepared by: Ken Heaghney State Fiscal Economist Fiscal Research Center Andrew Young School of Policy Studies Georgia State
ECONOMIC IMPACT OF THE HUSKY ATHLETIC PROGRAM ON THE WASHINGTON ECONOMY
 ECONOMIC IMPACT OF THE HUSKY ATHLETIC PROGRAM ON THE WASHINGTON ECONOMY WILLIAM B. BEYERS UNIVERSITY OF WASHINGTON, DEPARTMENT OF GEOGRAPHY SEATTLE, WA 98195-3550 BEYERS@U.WASHINGTON.EDU EXECUTIVE SUMMARY
Economic Impact of THE PLAYERS Championship Golf Tournament at Ponte Vedra Beach, Florida, March Tom Stevens, Alan Hodges and David Mulkey
 Economic Impact of THE PLAYERS Championship Golf Tournament at Ponte Vedra Beach, Florida, March 2005 By Tom Stevens, Alan Hodges and David Mulkey University of Florida, Institute of Food and Agricultural
TABLE OF CONTENTS. Economic & Fiscal Impact Analysis of the Proposed Hamilton Fields Sports Park. Prepared for the City of Novato: April 11, 2016
 TABLE OF CONTENTS Economic & Fiscal Impact Analysis of the Proposed Hamilton Fields Sports Park Prepared for the City of Novato: April 11, 2016 TABLE OF CONTENTS I. Project Background 3 II. Methodology
THE ECONOMIC IMPACTS OF THE 2012 SUNDANCE FILM FESTIVAL HELD IN UTAH FROM JANUARY 19, 2012 TO JANUARY 29, 2012
 THE ECONOMIC IMPACTS OF THE 2012 SUNDANCE FILM FESTIVAL HELD IN UTAH FROM JANUARY 19, 2012 TO JANUARY 29, 2012 PREPARED BY JAN ELISE STAMBRO BUREAU OF ECONOMIC AND BUSINESS RESEARCH UNIVERSITY OF UTAH
The Fiscal Impact of Beaches in California
 The Fiscal Impact of Beaches in California A Report Commissioned by The California Department of Boating and Waterways by Philip King, Ph.D Public Research Institute San Francisco State University September
THE ECONOMIC IMPACT OF THE 2013 GENERAL OBLIGATION BONDS FOR AFFORDABLE HOUSING IN AUSTIN NOVEMBER 2016
 THE ECONOMIC IMPACT OF THE 2013 GENERAL OBLIGATION BONDS FOR AFFORDABLE HOUSING IN AUSTIN NOVEMBER 2016 INTRODUCTION Civic Economics and HousingWorks are pleased to present this analysis of the economic
The Economic Impact of Northern Virginia Transportation Authority Capital Investment
 The Economic Impact of Northern Virginia Transportation Authority Capital Investment Prepared for Northern Virginia Transportation Authority November 26, 2018 1309 E Cary Street, Richmond, VA 23219 1025
ECONOMIC IMPACT ANALYSIS UPDATE, ORO MEDONTE, ONTARIO PREPARED FOR BURL S CREEK EVENT GROUND INC.
 ECONOMIC IMPACT ANALYSIS UPDATE, ORO MEDONTE, ONTARIO PREPARED FOR BURL S CREEK EVENT GROUND INC. November 25, 2015 November 25, 2015 Burl s Creek Event Ground Inc. C/O Mr. Ryan Howes 180 Line 8 S Oro-Medonte,
The Economic Impact of the UK Exhibitions Industry
 The Economic Impact of the UK Exhibitions Industry A report for Vivid Interface Final Report Contents Executive Summary... 2 1 Introduction... 4 1.1 Purpose of the study... 4 1.2 Study approach... 4 1.3
Did not work at home: Less than 5 minutes Estimate Estimate Estimate
 Economics Traditionally, the Economics Element focused on data and analysis related to unemployment, employment by industry, and labor force characteristics of a community. For the 2015 Comprehensive Plan,
EAGLECREST MISSION STATEMENT FY13 ADOPTED BUDGET $2,706,100 CORE SERVICES FUNDING SOURCES
 MISSION STATEMENT Eaglecrest Ski Area is a community owned winter recreation area and year-round destination for outdoor recreation and education, providing a wide range of affordable winter and summer
Mountain Biking Economic Impact Study - Squamish
 Mountain Biking Economic Impact Study - Squamish April 2017 Copyright 2017 Western Canada Mountain Bike Tourism Association Summary: Mountain Biking in Squamish 2016 Mountain biking is a significant outdoor
Economic accounts office
 Economic accounts office 1 Compilation of : National Accounts Regional Accounts Quarterly Accounts Input-output Tables Satellite Account of: Health Accounts Cooperatives and Mutual Societies Accounts ICT
Georgia World Congress Center and Georgia Dome Economic Impact Analysis FY 2017
 Georgia World Congress Center and Georgia Dome Economic Impact Analysis FY 2017 Prepared by: Ken Heaghney State Fiscal Economist Fiscal Research Center Andrew Young School of Policy Studies Georgia State
The ECONOMIC VALUE of the UNIVERSITY OF IDAHO. Main Report. Analysis of the Economic Impact & Return on Investment of Education
 The ECONOMIC VALUE of the UNIVERSITY OF IDAHO Main Report Analysis of the Economic Impact & Return on Investment of Education OCT 2015 1 CONTENTS 4 ACKNOWLEDGMENTS 5 EXECUTIVE SUMMARY 5 Economic Impact
Kluane National Park and Reserve Economic Impact Study
 Kluane National Park and Reserve Economic Impact Study Background Paper No. 2 ECONOMIC IMPACT ANALYSIS Research Northwest Inukshuk Planning & Development February 28, 2005 Kluane National Park and Reserve
THE NEW YORK STATE PARK SYSTEM:
 THE NEW YORK STATE PARK SYSTEM: AN ECONOMIC ASSET TO THE EMPIRE STATE James Heintz, Robert Pollin & Heidi Garrett-Peltier Political Economy Research Institute University of Massachusetts, Amherst March
The Economic Impact of Flagstaff Unified
 The Economic Impact of Flagstaff Unified School District #1 on the Flagstaff Area Economy The A Unit of the Center for Business Outreach Thomas Combrink, Senior Research Specialist Wayne Fox, Director
September The Economic Impact of the Atlantic Coast Pipeline in West Virginia, Virginia, and North Carolina. Prepared for. Dominion Resources
 September 2014 The Economic Impact of the Atlantic Coast Pipeline in West Virginia, Virginia, and North Carolina The one-time construction activity of the Atlantic Coast Pipeline can inject an annual average
Arizona Travel Impacts p
 Arizona Travel Impacts 1998-2010p photo courtesy of Arizona Office of Tourism June 2011 Prepared for the Arizona Office of Tourism Phoenix, Arizona ARIZONA TRAVEL IMPACTS 1998-2010P Arizona Office of
Economic Impact of Tourism in Kelowna and the Greater Kelowna Area, B.C.
 FINAL REPORT Economic Impact of Tourism in Kelowna and the Greater Kelowna Area, B.C. PREPARED FOR Tourism Kelowna PREPARED BY InterVISTAS Consulting Inc. 2 March 2017 Contents Executive Summary... iii