Built Environment Performance Plan (BEPP) 2017/ th May 2017 As approved by Council
|
|
|
- Jocelyn Fowler
- 5 years ago
- Views:
Transcription

")

1 Built Environment Performance Plan (BEPP) 2017/18 30 th May 2017 As approved by Council 1
2 Executive Summary: A. INTRODUCTION BEPP Overview Principles of the Integrated Development Plan (IDP) Supporting Plans and Processes Aligning budget and strategy B. SPATIAL PLANNING AND TARGETING LOGIC Problem Statement Spatial Targeting and Priorities Themes of BEPP Integration Zones Metropolitan South-East Integration Zone (Figure B9): Voortrekker Road Corridor Integration Zone (Figure B10) Blue Downs / Symphony Way Integration Zone Human Settlements Overview Point Human Settlement Turnaround Action Plan 2017/18 and MTREF Introduction Point Turnaround Human Settlement Action Plan Informal Settlements Upgrading Background: City IDP Commitments to Informal Settlements Upgrading: Reblocking and Emergency Housing Initiatives Backyarder Initiatives: Institutional Arrangements: Resource Planning for Informal Settlements: Resource Planning Governance and Institutional Benefits of Upgrading Initiatives Year Formal Housing Programme City IDP Commitments to Formal Housing Institutional Arrangements: Resource Planning for Human Settlements Economic Areas City of Cape Town s Economic Areas Management Programme (ECAMP) Data-driven diagnostic model Prioritisation framework and toolkit Spatial concentration of knowledge economy Marginalised Areas C. INTERGOVERNMENTAL PROJECT PIPELINE Current Operational Spend on Catalytic Project Pipeline Existing Co-ordinating Forums and Arrangements D. CAPITAL FUNDING Overview Spatial Budget Mix
3 3. City s Grant Specific Spatial Focus Investments by Western Cape Government and SOEs E. IMPLEMENTATION Land Availability Tenure Security Social Infrastructure F. URBAN MANAGEMENT Precinct Management Urban Upgrade and Improvement District Project Economic Interventions and Incentives Business Precinct Management Framework Transport Management Key Land Use Management Interventions Urban Development Zone (UDZ) Public Transport Areas (PT 1 / PT2) Proactive Land Use Application Overlay Zones Restructuring Zones Environmental and Heritage Legislation Regulatory Approaches to Tenure and Formalisation Tenure certificates Leasehold to Freehold Title Conversion Issuing of Title Deeds on Project Completion G. INSTITUTIONAL ARRANGEMENTS AND OPERATING BUDGET Institutional Arrangements: City and BEPP Related H. REPORTING AND EVALUATION List of Figures Figure B1: Corridors and a Spatial Quadrant structuring Cape Town Figure B2: Operational Trunk routes of BRT Trunk Figure B3: Planning/ Construction Phase Future Figure B5: Priority Projects Located Within Spatial Frame Figure B4: Blue Downs Link Figure B6: Spatial Targeting and Priorities Diagram B7: Differentiated Scales of TOD within Cape Town Figure B8: Relationship between 11 IDP Transformational Priorities and the 4 BEPP Themes Figure B9: Metro South East Integration Zone Spatial Structure Figure B10: Voortrekker Road Corridor Integration Zone Spatial Structure Figure B11: Spatial Location of Human Settlement Catalytic Projects Figure B12: Possible Integration Zone Boundaries and Extensions to be Investigated/ Considered in 2017/
4 Figure B13: Human Settlement Implementation Initiatives Figure B14: Spatial Location of USDG-Funded Informal Settlements Upgrades (2016/ /20) Figure B15: Spatial Location of USDG-Funded Backyard Upgrades (2016/ /20) Figure B16: Capex Budget Formal Housing Programme (as at 27 March 2017) Figure B17: Capital Requirements 2016/ / Figure B18: Cape Town s economic topography Figure B19: Diagnostic classification of business nodes Figure B20: Area Regeneration Approaches Figure B21: Non-residential development Figure B22: Growth Management Framework (concept and subject to change) Figure D1: Budget Sources and Contributions to Capital Spending Source: CCT: 15 Jan 2016: Adjustments budget Jan 2016/17 included Figure D2: Grant Proportional Contributions to Capital Spending Source: CCT: 15 Jan 2016: Adjustments budget Jan 2016/17 included Figure D3: Budget Grant Sources and Contributions to Capital Spending Figure D4: Approved budget 2016/17 (as of 27 March 2017) Figure D5: Actual Expenditure 2016/17 (as at 27 March 2017) Figure D6: Directorate Funding (2016/ /20) Figure D7: CCT s PTIG/ PTNG Grant locations 2017/ / Figure D8: USDG Grant locations 2017/ / Figure D9: ICDG Grant locations 2017/ / Figure D10: NDPG Grant locations 2016/ Figure D11: WCG Human Settlements Budget Priority 2017/ / Figure D12: HSDG Proposed Budget 2017/ / Figure D13: WCG Health Budget Priority 2017/ / Figure D14: WCG Roads Budget Priority 2017/ / Figure D15: WCG Education Budget Priority 2017/ / Figure D16: ESKOM Budget Priority 2017/ / Figure D17: ESKOM Budget Priority 2017/ / Figure D18: PRASA Budget 2016/ Figure D19: ACSA Budget 2017/ / Figure F1: Special RatingAreas (SRAs) and Mayoral Urban Regneration Prgramme (MURP) Areas Figure F2: Business Precinct Development Continuum Concept Figure F3: PT1 and PT2 Designations Figure G1: Institutional Arrangements for BEPP Figure G2: MSDF and MSDF Alignment Process Figure 2A: Spatial Targeting areas with priority projects in the City of Cape Town Figure 2B: Location of projects on capital budgets of City, Province and SOEs in relation to Integration Zones Figure 2C: Location of projects on capital budgets of City, Province and SOEs in relation to areas of economic opportunity
5 Figure 2D: Location of projects on capital budgets of City, Province and SOEs in relation to marginalised areas List of Tables Table A1: Strategic Screening Alignment Themes Table B1: Metro South East Corridor Overview Table B2: Voortrekker Road Corridor Integration Zone Overview Table B3: Blue Downs Proposed Integration Zone Overview Table B4: Key IHSF Recommendations Table B5: Settlement Categorisations Table B6: Results of Rapid Assessments Table B7: USDG Informal Settlements/ Upgrading and Backyarder MTREF Funding Commitments (Sorted by Estimated Yield) (29 March 2017 SAP PPM extract) Table B8: Future Informal Settlement Project Pipeline (sorted by Estimated Project Cost / Yield) Table B9: Land Utilisation of Current Upgrading Projects Table B10: Land Requirements by region for Informal Settlements Programme Table B11: Human Settlement Typologies associated with 5-Year Formal Housing Programme Table B12: Capex Budget Formal Housing Programme (29 March 2017 SAP PPM extract) Table B13: Capital Requirements 2016/ / Table B14: ECAMP Monitored Nodes and Relative Performance Table C1: Catalytic Projects Preparedness Table C2: Priority Projects Details of projects in Annexure Table D1: ICDG Planned Investment per Integration Zone Table D2: NDPG Planned Investment per Integration Zone Table D3: INEP Planned Investment per Integration Zone Table E1: Summary by Stage of Development Table E2: Summary by Proposed Type Table E3: Assumptions Informing Land Summaries Table E4: Extract of Land Use and Parking Standards by Public Transport Areas Designation Table E5: Integration Zone PT Designations Table E6: Gazetted Restructuring Zones Table H1: Extract from draft corporate scorecard City IDP (2017/18 to 2021/22) Table 2A: Budget per BEPP Spatially Targeted Theme / Area List of Annexures: Annexure 1: Format for Built Environment Outcomes Indicators & Targets Annexure 2: Intergovernmental Project Pipeline Annexure 3: Catalytic Projects Annexure 4: Priority Project Summary Appraisals
6 Abbreviation ACSA BDRC BNG BSC BSM BEPP CTIA CTMSDF CTSDF CTZS CIF CBD CSP CCT CRU COGTA CSIR DEA&DP DHS DoT DT&PW DORA/Bill du/ha EA ECAMP EGS EIA EMF EMP EMT FLISP GIS GDP HSDG IDA IDZ ICDG IDP IEM IHSF INEPG IPTN IRT ITP IUDF IZSIP IZ IGR LGES Abbreviations and Acronyms Full title Airports Company South Africa Blue Downs Rail Corridor Breaking New Ground Budget Steering Committee Budget Strategy Meeting Built Environment Performance Plan Cape Town International Airport Cape Town Municipal Spatial Development Framework Cape Town Spatial Development Framework Cape Town Zoning Scheme Capital Investment Framework Central Business District Cities Support Programme City of Cape Town Community Residential Units Cooperative Governance and Traditional Affairs Council for Scientific and Industrial Research Department of Environment and Development Planning (PG:WC) Department of Human Settlement Department of Transport Department of Transport and Public Works (WCG) Division of Revenue Act / Bill dwelling units per hectare Economic Area Economic Areas Management Programme Economic Growth Strategy Environmental Impact Assessment Environmental Management Framework Environmental Management Plan (in terms of Section 11 of NEMA) Executive Management Team (of the CCT) Finance-Linked Individual Subsidy Programme Geographic Information System Gross Domestic Product Human Settlements Development Grant Incremental Development Area Industrial Development Zone Integrated City Development Grant Integrated Development Plan (in terms of the MSA) Integrated Environmental Management Integrated Human Settlements Framework Integrated National Electrification Programme Grant Integrated Public Transportation Network Integrated Rapid Transit Integrated Transport Plan Integrated Urban Development Framework Integration Zone Strategy and Investment Plan Integration Zones Inter-Governmental Review (session as per Mid-Year Budget Review) Local Government Equitable Share 6
7 Abbreviations and Acronyms Abbreviation Full title LGTA Local Government Transition Act (No 61 of 1995) Mayco Mayoral Committee (of the CCT) MURP Mayoral Urban Renewal Progamme MTIIF Medium Term Infrastructure Investment Framework MTREF Medium Term Revenue and Expenditure Framework MSEIZ Metro South-East Integration Zone MFMA Municipal Finance Management Act, Act No. 56 of 2003 MSA Municipal System Act, Act 32 of 2000 MSDF Municipal Spatial Development Framework NDP National Development Plan NEMA National Environmental Management Act (No 107 of 1998) NLTA National Land Transport Act, Act 5 of 2009 NSDF National Spatial Development Framework NDPG Neighbourhood Development Partnership Grant NGO Non-Governmental Organisation NMT Non-Motorised Transport OECD Organisation for Economic Cooperation and Development ODTP Organisational Development and Transformation Plan PRASA Passenger Rail Agency of South Africa PGWC Provincial Government Western Cape PTIG Public Transport Network Infrastructure Grant PTOG Public Transport Operating Grant SDBIP Service Delivery Business Implementation Plan SANRAL South African National Roads Agency Ltd SPLUMA Spatial Planning and Land Use Management Act, Act 16 of 2014 SOE State Owned Entity TRA Temporary Relocation Area TAP Transit Accessible Precinct TOD Transit Oriented Development TOD-C Transit Oriented Development Comprehensive (land use model) TDA Transport and Urban Development Authority TCT Transport for Cape Town TAZ Transportation Analysis Zone TODSF Transit Oriented Development Strategic Framework UISP Upgrading of Informal Settlements Programme UDZ Urban Development Zone (in terms of Income Tax Act, Act 58 of 1962) UNS Urban Network Strategy USDG Urban Settlements Development Grant VRCIZ Voortrekker Road Corridor Integration Zone WCG Western Cape Government 7
8 Evaluation Framework and BEPP Guidelines The evaluation of the 2015/16 BEPP cycle identified issues of uneven quality and procedural rigour between metropolitan municipalities. An Evaluation Framework has been introduced to monitor the maturity and ongoing development of individual metropolitan municipalities. The Evaluation Framework enables a city to progress in terms of its capacities and capabilities, and encourages clear accountability for the ongoing strengthening of the BEPP process and outputs over time. The Evaluation Framework informs a more nuanced and responsive approach to providing support and incentives for progressive improvement of the BEPPs. National Department of Treasury BEPP guidelines 2017/ /20 (page 10). During the course of this financial year, the City of Cape Town has undergone a substantial organisational transformation via an Organisational Development and Transformation Plan (ODTP) process. Due to this reorientation of the administration, the premise of the BEPP has been refocused further toward service delivery excellence and spatial transformation, that address the needs of Cape Town s citizens. Whilst every effort has been made to confirm the validity and consistency of internally and externally sourced information provided in this document, some information will inevitably have changed and gaps in immediate requirements may be apparent. The Evaluation Framework provides a sound and consistent foundation for future annual refinements and will indicate which of these gaps require more resourcing in future. 8
9 The Minister of Finance has repeatedly emphasised the need to move beyond planning intentions to urgently prepare and implement practical programmes that can address structural and spatial constraints to urban economic growth. While these programmes need careful planning, their intentions will not be realised without the preparation of a tangible portfolio of public investment projects, and accompanying regulatory reforms that can provide the foundation for practical partnerships with the private sector. The requirement for all metropolitan municipalities to develop an annual BEPP is a cornerstone of the support provided by national government to drive the identification, preparation, implementation and management of the programmes and projects necessary to achieve these objectives. National Treasury BEPP Guidelines 2017/ /20 As part of our Organisational Development and Transformation Plan (ODTP), we are committed to dealing with the legacy of apartheid spatial planning. a new directorate, the Transport and Urban Development Authority, whose key role is to drive urban development and align it with transport investment. The TOD strategic framework will redress the injustices of the past by stopping long travelling distances and urban sprawl as we bring people closer to residential and work opportunities. In leveraging City assets, the City will be the catalysis investor in these projects to create a crowding in effect by the private sector. Executive Mayor Patricia de Lille, Full Council Meeting 29 March
10 Executive Summary: The Built Environment Performance Plan (BEPP) has become an integral part of the municipal package of strategic plans. On an annual basis it is required to articulate the City s investment rationale and institutional arrangements to address spatial and sectoral integration reflecting: the founding strategic principles and targets established in the Integrated Development Plan (IDP) and Spatial Development Framework (SDF); the annual City budget, inclusive of capital grants and Medium Term Revenue and Expenditure Framework (MTREF); the investment rationale of other state departments and entities; and strategic themes emphasised in guidelines issued annually by National Treasury. This revision demonstrates the planning rationale and financial strategy supportive of the City s spatial targeting initiatives which are at the heart of the City s spatial restructuring agenda and underpin a revised spatial narrative and logic. The promotion in this review of a third Integration Zone (IZ) - the Blue Downs Integration Zone directly supports the City s objectives of building integrated communities and prioritising dense, transit oriented growth and development (Section A2). The declaration of this third IZ represents a logical and strategic extension of the Voortrekker Road and Metro South East Integration Zones, linking the two on their eastern boundaries. The characteristics of the IZs and the role they each play in unlocking spatial inefficiencies and removing historical barriers is described in Section B1 and B2. The projects and investments associated within the established Integration Zones (IZs) have been extensively listed and Prioritised Local Areas within the corridors highlighted (Section B3.1). Philippi, Khayelitsha and Gugulethu located within the Metro South East IZ account for some of the City s most marginalised communities in the city. Similarly, a number of these areas are amongst the highest household and population densities within the city e.g. Kosovo and Sweet Home Informal Settlement (Philippi) and Zondi in Gugulethu. The primary spatial restructuring objective of the Metro South East IZ is to spatially link Mitchells Plain and Khayelitsha with the Cape Town CBD, utilising: the existing and proposed public transportation linkages and infrastructure; supporting a more diverse land use pattern; and maximising the catalytic benefits of the Athlone Power Station and Philippi priority projects. The Voortrekker Road Corridor IZ hosts key business districts of Bellville, Maitland, Parow, Goodwood, and Salt River and diverse regional health and tertiary educational infrastructure. Like the Metro South East IZ it is anchored by the City s CBD. It does not however reflect the same socio-economic profile of the Metro South East IZ. However, it has been negatively impacted by urban decay and is in need of structured management approaches to support and stimulate investment and re-investment in the corridor. It does provide opportunities to optimise land-used in support of transit investments and intensify development to serve the diverse community residential and commercial needs. The availability and increase in supply of affordable rental stock is recognised as one of the key levers towards integration and renewal of the Corridor. The VRC Social Project Housing (including Conradie) was endorsed by the National Department of Human Settlements as one of the City s candidate Catalytic Human Settlements Projects. Blue Downs IZ is premised on the potential development opportunities and structural efficiencies afforded by the committed investment in the multi-billion-rand rail link extension facilitated by the Passenger Rail Agency of South Africa (PRASA). Other catalysts for integrated planning and development include the partnership with ACSA (in relation to the Swartklip land development) and the supportive feeder systems for station precincts along the rail route (Wimbledon, Blue Downs and Nolungile). The Southern Corridor human settlement project comprising clusters of informal settlements in proximity to the N2 highway traverses both the Blue Downs and Metro-South East IZs. 10
11 Five priority precincts are emphasised within this spatial logic and frame. Athlone Power Station, Bellville, Foreshore Freeway, Paardevlei, Philippi are projects identified and driven by the City on the basis that they provide the greatest potential to catalyse development reflective of the transformation priorities defined in the newly defined IDP (Section C). Together with the Provincially driven, City supported precincts of Conradie and Two River Urban Park (TRUP) these projects are emphasised and described in detail. The current pipeline of informal settlement upgrades and other new-build housing typologies have been integrated into this review (Section B3.2). The BEPP also reflects a ten-point human settlement programme that is intent on redirecting the prioritisation, sequencing and resourcing of these initiatives to ensure optimal alignment and a diversity in typology and affordability: hostel upgrading; social housing; modular; and gap housing are all embraced within this ten-point plan. An emphasis on affordable housing in the inner city cores of the City (very much framed by the three Integration Zones) as a direct means of tackling the segregation and exclusion historically associated with the city form and function. The full complement of National funded grants supporting these initiatives and other infrastructure investments (in for example public transportation and electrification initiatives) have also been spatially referenced and sourced directly from the City s SAP Project Portfolio Management system (PPM) 1 Section D. The City s approaches to Urban Management and other Institutional Arrangements post the City s first phase of Organisational Development and Transformation Plan (ODTP) - are outlined in sections F and G respectively. The Performance aspect of the BEPP is reflected in Section H and reflects the City s commitment to monitoring the impact and outcomes associated with its investment intentions. In summary, the BEPP 2017/18 is reflective of the strategic intention and desired impact of the R6,8bn capital budget and an operating budget of R37,5bn (total budget R44,3bn). In her Draft Budget Speech of March 29 th 2017, the Executive Mayor, Patricia de Lille listed among the budget highlights that directly translate in this BEPP: R497,6 million for the construction of top structures; R583 million to provide affordable alternative road-based public transport; R30,9 million for the Glenhaven Social Housing Project; R462,6 million: Ongoing roll-out of the IRT Project: Phase 2A to the Metro South-East, linking Mitchells Plain and Khayelitsha to the Wynberg and Claremont public transport hubs; R108,7 million for the Public Transport Interchange Programme (including allocations for development and/or upgrading of inner-city and Bellville public transport hubs, Retreat and Somerset West public transport interchanges, Makhaza bus and taxi facilities, and the Dunoon and Masiphumelele taxi facilities. 1 Public Transport Network Grant (PTNG) Schedule 5B (specific purpose allocations to municipalities fund managed by Transport and Development Authority for Cape Town (TDA); Urban Settlements Development Grant (USDG) Schedule 4B (supplements municipal budgets) fund managed by Human Settlement Directorate; Human Settlements Development Grant (HSDG) Schedule 5A (specific purpose allocations to provinces) fund managed by Western Cape Department of Human Settlements; Integrated City Development Grant (ICDG) Schedule 4B (supplements municipal budgets) fund historically managed by Department of Spatial Planning and Urban Design (SPUD), but now amalgamated into TDA; Neighbourhood Development Partnership Grant (NDPG) Schedule 5B & Schedule 6B (allocation-in-kind to municipalities for designated special programmes) - fund historically managed by the Department of Spatial Planning and Urban Design (SPUD), now amalgamated into TDA; and Integrated National Electrification Programme Grant (INEPG) Schedule 5B fund managed by Utilities Directorate. 11
12 A. INTRODUCTION 1. BEPP Overview The Built Environment Performance Plan (BEPP) for the City of Cape Town has evolved over the past three years. Initially a more human settlement orientated product in support of the Human Settlement and Urban Settlement Development grants, it has progressively encompassed a more transversal perspective indicative of all funding sources. For the 2017/18 financial year and beyond, the BEPP has now been repositioned in accordance with a new transformation perspective that has focused the organisation on sustainable, targeted service delivery that is based on business-oriented principles and investment-led spatial transformation for the benefit of the citizens of and visitors to Cape Town. The City has embarked on a transformational, data-driven implementation agenda for addressing the socio-economic and environmental issues and inefficiencies that have manifested themselves in the built environment, due to the apartheid legacy. The City s 2017/18 Built Environment Performance Plan (BEPP) emphasises the required capital interventions of ALL role players in the bounds of the municipality, including City, Province, National and State Owned Enterprises, in order to achieve the required spatial transformation. The overall aim of Opportunity City is one that creates and enabling environment for economic growth and job creation, and provides assistance to those who need it most through the delivery of quality basic services to all residents. The overall premise of the 2017/8 BEPP of the City of Cape Town is therefore: To contribute actively to the development of the city s environment, human and social capital. To offer high quality services to all who live in, do business in or visit Cape Town. To be known for its efficient, effective and caring government. 2. Principles of the Integrated Development Plan (IDP) The guiding principles of the IDP direct BEPP content and vision and the associated budget so as to ensure sustainable and integrated communities. These guiding principles include: Resilience o Adaptability and innovation led thinking in addressing urban challenges o Progressive risk management Sustainability Transformation of the Built Environment through Transit Oriented Development (TOD) o Spatial transformation of the Built Environment o Densification and intensification o Efficiencies in an integrated, intermodal and interoperable Public Transport Network Customer Centricity o More responsive, focused administration to deal with customer needs o Area-based service delivery model o Accountability o Data-driven approach Transversal Approach o Further implementation of the Organisational Development and Transformation Plan (ODTP) o Focus on delivery of the 11 Transformational Priorities o Foster transversal management internally and with other spheres of government 12
13 Governance Reform o Area-based service delivery o Modernisation o Transformational agenda The aim of the Built Environment Performance Plan (BEPP) is to translate the City s IDP strategic vision on annual basis into a tangible portfolio of public investment projects that are implementation ready and facilitates spatial transformation and primarily focuses on: Excellence in Basic Service Delivery Giving effect to TOD: City s key commitments are to direct planning decisions and public investment towards a comprehensive Transit Oriented Development perspective that: o Directs new development in the city to strategic locations in and around public transport infrastructure; o Secures and appropriate mix of land uses and be inclusive in well-located areas; o Establishes a high quality of public space that promotes the use of public trans port and non-motorised transport modes; and o Utilises City and State-owned strategically located land holdings and partner the private sector to lead by example to achieve transit oriented development. Building Integrated Communities Operational Sustainability of the Urban Form These aspects are clearly outlined in the National Development Plan (NDP) and Integrated Urban Development Framework (IUDF). Both prioritise urban spatial restructuring adding to the growing policy attention and market incentives for a new urban form and targeted investment approach. As stated in the BEPP Guidelines the BEPP is prepared by the City as a planning tool that aligns and sharpens the focus of existing planning instruments to reduce poverty and inequality and enable faster more inclusive urban economic growth. It focusses on measurable improvements - via defined BEPP Outcome Indicators - to urban productivity, inclusivity and sustainability by means of clear spatial targeting and restructuring initiatives, public investment programmes and regulatory reforms. This fourth submission is prepared at a time where all municipalities are required to formulate their new Integrated Development Plans for the new five-year term of office (2017/ /22). The City of Cape Town will approve its IDP approved and operational by July It is also undertaking the statutory review of its Spatial Development Framework during The 2017/18 BEPP has been developed in an iterative manner that has taken its lead from and in turn influenced the corporate and governance focus of the City as reflected in the IDP. 3. Supporting Plans and Processes The City has developed a comprehensive suite of sectoral plans and strategies to address economic growth and social development; infrastructure maintenance and expansion; environmental protection; and climate adaption. In particular, approved policy and strategy directing the transportation and human settlement sectors have had significant impacts on framing the terms of revision of the City s spatial vision and the structuring elements associated with the Spatial Development Framework. The adoption of a Transit Oriented Development Strategic Framework (TODSF) established an implementation framework to progressively move towards a compact, well connected, efficient, resilient urban form and movement system that is conducive to economic and social efficiency and equality. Additional objectives are to provide cost effective access and mobility, with the least possible negative impact on the environment. 13
14 National policy via the Integrated Urban Development Framework (IUDF) and the City s TODSF acknowledge the public transport network as one of the key strategic levers to overcome apartheid spatial planning and the fragmented urban form legacies that manifests in transport inefficiencies and the associated costs to the state, households, business and individuals - of these inefficiencies. The TOD rationale seeks to progressively respond to and harness the generative capacity, scale and network effects of urbanisation ( economies of agglomeration ). To this end, the City s key commitments are that all land use planning decisions and public investment will be directed in terms of a comprehensive TOD perspective, namely that: New development in the city will be strategically located around public transport; New development will have an appropriate mix of land uses and be inclusive in welllocated areas; The high quality of public space will serve to promote the use of public transport and nonmotorised transport modes. The City will leverage its strategically located land holdings and partner the private sector to lead by example to achieve transit oriented development. Pragmatic approaches to settlement typology and locations associated with upgrading and rental accommodation programmes are reflected in the Integrated Human Settlements Framework (IHSF). The new term of office IDP, its transformation priorities and these key sectoral frameworks which are fundamental to the BEPP - are being integrated into a reviewed Municipal Spatial Development Framework (MSDF) that is compliant with prevailing legislation inter-alia, Spatial Planning and Land Use Management Act, Act 16 of 2013 (SPLUMA) and the Western Cape Land Use Planning Act 2014, Act No.3 of The CTMSDF review will be subject to a public comment and approval process in mid Aligning budget and strategy The aforementioned components of the city s Corporate Agenda are directly influencing the budgeting process for the coming and future years as an integral component of the IDP / budgeting process and will direct both City and Grant funding allocations. Aligning key infrastructure investments and implementation of long term infrastructure investment plans is currently being supported via a strategic screening tool comprising a questionnaire and supportive GIS viewer - to test and validate the spatial and strategic alignment of proposed capital projects. The questionnaire tested the extent to which proposed project supported the Strategic alignment themes reflected (Table A1). The strategic alignment screening process was established to ensure that key components of alignment principles politically endorsed in 2015 were embedded in the budget prioritising process. The outcomes of the project readiness and strategic analysis aimed at confirming a project's adherence to the spatial targeting criteria set by the Mayor and senior management. The analysis process increased awareness of the spatial targeting focus of the capital programme into the project management level of the organisation and effectively implied that wider awareness was established to preferred locations for investment. The value of the project lies specifically in the pre-analysis of projects and clearer direction for the capital allocations (within the constraints of the grant conditions where these are applicable). Table A1: Strategic Screening Alignment Themes 14
15 Strategic theme Strategy alignment Spatial consolidation Transit-Oriented Development Basic service infrastructure Integrated investment programme Socio-economic need Enabling economic growth Impact Priorities: Alignment of Capital Budgets (as per report approved by Joint Cluster) Support the strategic objectives of the City as articulated in the Integrated Development Plan, the Economic Growth Strategy, and the Social Development Strategy Support the consolidation of the City footprint - in recognition of the fact that the consolidation of the City footprint can (i) enhance the efficiency of the public transport network, (ii) ensure that people are located closer to economic opportunities and social amenities, and (iii) promote efficiencies in basic service provision. Prioritise projects that support the City s objectives with regard to Transit Oriented Development and enhancing the efficiency of the public transport network Maximise opportunities to leverage existing basic service infrastructure (and recognising the need to maintain the City's existing infrastructure) Prioritise projects that are planned as part of a programme of interventions to improve City infrastructure and services in a particular area (and recognising the need for social facilities as part of an integrated approach to human settlements) Prioritise projects in areas where citizens are in greatest need (as determined by socioeconomic indicators derived from the Census) Facilitate economic growth by focusing investment in growth-enabling infrastructure in areas of high economic potential, but lagging levels growth and investment Prioritise catalytic projects with the potential to unlock opportunities for crowding in investment in priority areas - as articulated in the Built Environment Performance Plan (BEPP) 15
16 B. SPATIAL PLANNING AND TARGETING LOGIC 1. Problem Statement The basis of the BEPP narrative is the City s existing and planned road and rail network. The City of Cape Town has resolved to embark on a transit-led service delivery premise to resolve the historical legacies of the city s history and future position growth opportunities. Implementation of this approach is via the City s Integrated Transport Plan (IPTN). Six years ago the only public transport trunk routes in the City were the rail corridors. Service delivery was not integrated and it was not based on truly achieving operational inefficiencies in the built environment. As a result, there were three main constraints and blockages impacting on the structuring western, metro south east corridor, and north-south corridors that in effect, forms a spatial quadrant that in turn, structures the City s space economy and urban form (Figure B1). Each of the corridors has experienced different accessibility problems and impediments impacting on the urban form, efficiency to integration opportunities which, over time, the City has addressed or plans to address, in the manner described below. The Western Corridor (extending from the CBD up the West Coast to Atlantis via the N7 / R27 and incorporating Table View and Dunoon) developed incrementally with no dedicated right of way. The first stage of the IPTN implemented a road-based dedicated right of way from the CBD up the West Coast corridor past Du Noon and Table View to Atlantis. The intervention has addressed the access issues for this segment of the population as well as released land for development at an acceptable intensity, especially in proximity to the BRT stations and extending to Century City. There is, however, now a need to support the intensification and densification of land uses in the corridor to build operational efficiencies into the system. Notwithstanding an existing rail dedicated right-of-way from the Metro South East Corridor to the CBD, capacities of existing public transport infrastructure in the corridor are far exceeded. This corridor extends from the townships of Mitchells Plain and Khayelitsha to Philippi and Athlone and west to the CBD. It represents the corridor with the highest volumes of peak hour commute movements and the highest numbers of informal settlements and associated residents. Compounding the demand and inefficiencies of the infrastructure and perpetuating the marginalised nature of the area in socio-economic terms are a predominant monoresidential land use pattern; the proliferation and positioning of informal settlements; and the spatial location of these areas on the urban periphery, removed from the centres of economy and jobs. A second stage rollout of BRT commenced the N2 Express service from Khayelitsha and Mitchells Plain along the N2 Highway to the CBD (Figure B2). This has, in effect, linked the far north with the far south of the city via the existing trunk routes. In its first two years of operations, this supplementary service has been increasingly pressurised due to the passenger volumes and the gradual collapse of rail services. This transport investment has confirmed the need to release the economic development potential of the Metro South East coupled with the residential potential of the Central/Northern corridor of the Voortrekker Road corridor, hence the identification of the first two integrated zones (discussed in more detail in the following section). The next step in the developmental logic that will consolidate the City and improve efficiencies through transit-led investment will be to invest into the corridor that has the most identified demand: the Phase 2A Corridor that extends west from Khayelitsha and Mitchells Plain through Philippi - a major interchange hub to the Claremont and Wynberg nodes (Figure B3) this transit corridor has always been considered a potential Integration Zone and is reflected as such in the mapping included in this BEPP submission. 16

17 Figure B1: Corridors and a Spatial Quadrant structuring Cape Town 17
18 The City is also committed to infrastructure that will release the T17 corridor that will enable a more sustainable and development-oriented linkage by comparison to the N2 Express - as well as addressing the development and human settlement potential along this corridor. This corridor will be the opportunity to consolidate investment across the central-diagonal arterials of the city. The investment in the first phases of the IPTN effectively addresses three legs of a spatial quadrant. The benefits of investment are realised via both improved and extended connectivity and associated socio-economic benefits. The focus of service delivery investment and growth management generally is therefore premised on an inward growth trajectory within this this quadrant. This will support city compaction initiatives with supportive services being optimised and development, employment and human settlements initiatives benefitting from this consolidated investment. A North/South Corridor (linking the Mitchells Plain / Khayelitsha with Bellville and Kuils River and Brackenfell) presently lacks a direct rail or road dedicated right of way: in volume terms the commute movements associated with this corridor - from the MSE to the northern areas along the Voortrekker Road Corridor - are second only to those of the MSE to the CBD. Movement and commute efficiency is further constrained being forced to divert in a north westerly direction (N2 and rail access) into the inner city before accessing the VRC. This is also pushing the poor further and further away. These developments in the City have begun over the past four years resulting in increased pressure on the City along this corridor. A direct, northwards route is essential to support network and movement efficiencies and requisite urban form of the area (Figure B4). The City has, via previous BEPP submissions, identified two Integration Zones, namely the Metro South East Corridor and the Voortrekker Road Corridor. The City had always identified an additional prospective Integration Zone along the North/South corridor. In this submission and based on the refined spatial logic within the BEPP and corporate planning within the City, the City has formally added a third Integration Zone to support the needs and aspirations of the North/South Corridor incorporating the proposed BRT (Symphony Way) and Rail (Blue Downs) rights of way. The motivation for its inclusion is based on two main considerations. Firstly, recognising the purpose and premise of the BEPP process to support collaborative inter-governmental funding initiatives, the lead investor for this proposed new integration zone is the Passenger Rail Agency of South Africa (PRASA). An initial commitment from PRASA to construct this 10km connection through the Strategic Integrated Project Seven (SIP 7) Process has been made some years ago however, to date the initiative has not been placed on budget and now needs to be expedited: the lack of access in this last line of the development quadrant in the City of Cape Town is causing a detrimental long term impact on the whole of the city. Secondly, investigations have revealed that despite significant growth and planning of human settlement initiatives in this corridor, densities and intensities along Symphony Way road and Blue Downs rail are not contributing optimal densities or land uses diversities due to the lack of adequate access and the constrained movement options. This needs to be addressed as a matter of urgency as this imbalance is contrary to the adopted development rationale of TOD. Within the context of these three Integration zones, the quadrant they frame and the nodes that are connected, there is a need to identify the TOD priority development precincts. Figure B5 reflects identified priority TOD precincts are additional lower order priority precincts. Five City projects are presently prioritised within the City to support TOD initiatives see Section C and Annexure 4 for details. 18


19 Figure B2: Operational Trunk routes of BRT Trunk Figure B3: Planning/ Construction Phase Future These are further reconsidered in the section dealing with Priority Projects. Each of the three integration zones have a different profile and accordingly a different developmental objective and lever for service delivery intervention There has been substantial investment over the past five years by the City to unlock access within the quadrant. In addition, the commencement of PRASA s modernisation programme has also begun to address the Metro-South East and Voortrekker Road corridors. There will be a need to on an on-going basis to review the public value-add of these investments and key projects and programmes that are unpacked in the following section. 19
20 Figure B4: Blue Downs Link 2. Spatial Targeting and Priorities Figure B5: Priority Projects Located Within Spatial Frame The City s spatial priorities in this BEPP review are based on the following illustrated in Figure B6: Three (3) Integration Zones (two existing, one new) Priority Transit Oriented Development Projects (refer to Annexure 4 for detailed project appraisal sheets) Two (2) priority Provincial Game Changer Projects (refer to Annexure 4 for detailed project appraisal sheets) Three (3) Human Settlements Catalytic Projects (approved and endorsed by National, Provincial Departments Human Settlement and the City) Strategic land owned by other state agencies which remain integral to regeneration and restructuring initiatives. The City s aim is to use the 2017/ /20 BEPP to articulate a sequential developmental logic that revises previous submissions and approaches within the context of the TOD Strategic Framework, 2016 (TODSF - approved March 2016), All projects and programmes have been incorporated into this logic to reflect a transversal and integrated approach to service delivery and investment in the built environment, for the benefit of all citizens of Cape Town. The TODSF acknowledges differentiated scales of implementation of TOD principles and opportunities to influence and achieve TOD outcomes at metropolitan, corridor, nodal and precinct scales (Figure B7). It presents an institutional strategy identifying tools and mechanisms to be employed by various role players who collectively impact on development to support a more progressive transition towards a more sustainable, compact and equitable urban form as depicted by the TOD Comprehensive (TOD-C) Land Use Scenario. 20

21 Figure B6: Spatial Targeting and Priorities 21
22 Diagram B7: Differentiated Scales of TOD within Cape Town 22
23 3. Themes of BEPP Beyond the prescribed BEPP guidelines directing content and structure of the document this year s guidelines have structured compliance aspects around four key themes, namely: Integration Zones Human Settlements (emphasis on Informal Settlement Upgrading) Economic Areas Marginalised Areas The spatial location of the majority of capital projects on the budgets of the City, Province and SOEs and how they relate to the above spatial targeting areas, are visible in Annexure 4. Each of these, in turn will be considered in the following sub-section. As an introduction, a diagrammatic representation of the transformation priorities and the transversal relationship between the priorities and these themes is illustrated in Figure B8. 23

24 Figure B8: Relationship between 11 IDP Transformational Priorities and the 4 BEPP Themes Excellence in basic service delivery Mainstreaming of basic services to informal settlements and backyarders 1 2 Integration Zones Safe communities Dense and transit orientated urban growth and development 3 4 Informal Settlement Upgrading An efficient integrated transport system 5 Leveraging technology for progress 6 Economic Areas Positioning Cape Town globally 7 Resource efficiency and security 8 Marginalised Areas Building integrated communities 9 Economic inclusion 10 Operational sustainability 11 24
25 3.1. Integration Zones 2 To give effect to spatially targeting and the performance-related Integrated City Development Grant (ICDG), the City has identified and undertaken detailed planning for two Integration Zones (IZs) namely, the Metro South-east Integration Zone (MSEIZ) and the Voortrekker Road Corridor Integration Zone (VRCIZ). These IZs are premised on i) opportunities afforded by public transport to restructure urban form along Transit Orientated Development principles; ii) capacity to link concentrations of economic opportunity and mono-use settlement patterns; iii) opportunities to diversify and intensify land uses; and iv) infrastructure improvements and related catalytic urban development projects. Although the two IZs share the potential to assist in the restructuring of the City they are quite different in terms of existing spatial form and structure, socio-economic profile and interventions required to support restructuring aims and objectives. One of the key themes highlighted in successive BEPP guidelines is the call for prioritisation of IZs. Local Area Planning has been on-going within Cape Town s IZs since 2014/15. Much of the planning efforts in the past two year has focused on prioritising local areas within each corridor; determining investment strategies; and engaging with the key stakeholders internally and externally. In addition, this BEPP submission states a third Integration Zone to be planned and implemented, namely the Blue Downs Integration Zone. The primary structuring element of this IZ is the Blue Downs Rail link (driven by PRASA) and potentially, the Symphony Way road infrastructure. Each of these IZs has its own defined objectives in terms of the spatial logic of the City. The following section details the more mature aspects of the existing IZs (MSEIZ and VRCIZ) and the intent and ambition of the Blue Downs IZ in turn. Refer to Annexure 2 for maps reflecting the majority of capital projects which are on the City s, Provincial and SOE budgets, and how they spatially related to the Integration Zones. Detailed Investment Strategies for MSEIZ and VRCIZ can made available on request. 2 Each integration zone is a spatially targeted, city or city region-wide TOD network aimed at spatial transformation. Each zone consists of a transit spine and a number of intermediate nodes and linkages. The transit spine consists of two anchors connected via mass public transport (rail/bus), e.g. the CBD and an urban hub (township node with the best investment potential). It can also comprise of the CBD and another primary metropolitan business node. Between the two Integration Zone anchors are a limited number of Integration Zone intermediate nodes that are strategically located at key intersections connecting to marginalised residential areas (informal settlements) and employment nodes (commercial and industrial nodes) via feeder routes (taxis). The Urban Hub connects to secondary townships nodes within the marginalized peripheral township. (Source: National Dept. Treasury BEPP Guidelines 2017/ /20) 25
26 Metropolitan South-East Integration Zone (Figure B9): (MSEIZ) Primary Objectives: linking Mitchells Plain (Urban Hub) / Khayelitsha with the Cape Town CBD. Spatial Restructuring Opportunities: Implementing Phase 2A: T11 / T12 Trunk Routes Metro South East to Claremont and Wynberg. Philippi East Transit Project is one of the TOD Catalytic Projects. Alternative TOD housing development in the inner cities of Khayelitsha, Mitchells Plain, Wynberg, Claremont, Nolungile. This is where alternative building materials are to be explored as well as alternative tenures and a mix of income Facilitating Athlone Power station and Two Rivers Urban Park (TRUP) Priority Projects (nb: TRUP is a Provincially led Project); Identified informal settlement upgrades along the T11, T12 and Rail corridors; Focus on the upgrading of the hostels in accordance with collective, unified standards. This project will be fast tracked so as to facilitate completion within the next five years. This includes the purchasing of the Land Hostel from Transnet and the total redevelopment of the site; and Facilitating other potential development site e.g. Fruit & Veg City Development and Ottery. Marginalised Areas within MSEIZ: Philippi, Khayelitsha and Gugulethu located within the MSEIZ account for some of the City s most marginalised communities as defined by the Socioeconomic Index based on Census Similarly, a number of sub-places within these areas are amongst the highest household and population densities within the City e.g. Kosovo and Sweet Home Informal Settlement (Philippi) and Zondi in Gugulethu. Many areas targeted by the Mayoral Urban Regeneration Programme (MURP) fall within this Integration Zone. Numerous human settlements projects are active and planned in this Integration Zone to address the high prevalence of informal settlements. The City s Southern Corridor human settlement project submitted to the National Department of Human Settlement falls within the MSEIZ. Key human settlements projects and interventions Langa Joe Slovo (N2 Gateway programme), BM Section (In-situ Upgrading programme) and Valhalla Park Infill (New Mixed- Use programme). Growth Nodes: Three Urban Hubs are located within this IZ, namely Athlone, Philippi East and Mitchell s Plain Town Centre. There are numerous smaller nodes within the IZ including Khayelitsha, Nyanga, Manenberg, Gugulethu and Langa. The City s ECAMP platform monitors performance and potential of the following nodes in the IZ: Athlone and Athlone Industrial, Epping Industrial, Khayelitsha, Mitchell s Plain, Ndabeni, Philippi East and North. Strategic intentions and opportunities within MSEIZ: The rail corridor is the backbone of the MSEIZ. Transportation projects and investments include: The N2 Express MyCiti (CCT), the Central Line Modernisation Programme (PRASA and Metrorail), Phase 2a MyCiti (CCT), the redevelopment of the Nolungile Public Transportation Interchange, Khayelitsha CBD, and the Station Deck Precinct Development. Additional engineering infrastructure capital investment in capital infrastructure to support the Integration Zone includes: the Mitchells Plain intake (Erica substation), Cape Flats 3 sewer line installation and rehabilitation of lines 1 & 2. Key projects within the zone recognising that it hosts a number of potentially catalytic urban development property projects including the redevelopment of the Athlone Power Station (APS), the Two Rivers Urban Park (TRUP) and District Six. 26
27 Specific objectives of the MSEIZ SIP are to: Enhance the MSEIZ s contribution to a more compact and integrated city, with associated efficiency, productive, and resource sustainability gains. Use the TOD Strategy as a lever to growth and development through the enhancement of public transport infrastructure (including its institutional arrangements and processes) and the support of appropriate development at appropriate locations. Improved housing opportunity to enable productive livelihoods and communities. Maximise the investment by various spheres of government and related agencies in the provision and maintenance of infrastructure and public facilities; and encourage private sector and individual entrepreneurship and investment through appropriate infrastructure and facility provision, regulations, and urban management instruments. Enhance infrastructure provisions in the MSEIZ. Human Settlement Priority Project: (Linked to MSEIZ Southern Corridor Housing Project) In February 2017, the City received confirmation from the Housing Development Agency endorsing of three national priority catalytic projects (Figure B11), namely, the N2 Phase 2 Southern corridor, North Eastern Corridor and Voortrekker Integration Zone Social Housing (including Conradie) projects. It is understood that these three projects contribute to forty-five country-wide state led projects which enjoy national priority status. The Southern Corridor Human Settlement Catalytic Project endorsed by the Province and City is focused on the implementation in the short-medium term of the N2 Phase 1 and 2 projects and 27 linked informal settlements upgrades in the vicinity benefiting more than 50,000 households. A number of these settlements intersect with the MSEIZ and the Blue Downs / Symphony Way IZ. The most recent and significant land purchase to support human settlement initiatives is the formerly owned AECI Paardevlei land in the south-east of the city. This land purchase will support the extension and anchoring of the Southern Development Corridor Catalytic Project in the medium to long-term. 27

28 Figure B9: Metro South East Integration Zone Spatial Structure 28
29 Table B1: Metro South East Corridor Overview Metro South East Corridor / Integration Zone To be upgraded rail and road-based transit corridor Nature of the 1. Metro South East Integration Zone Investment Strategy in process of development development 2. Phase 2a implementation of the MyCiti linking Khayelitsha/ Mitchells Plain - including Philippi Interchange with Claremont / Wynberg and associated PTI upgrades (T11 and T12) 3. Prasa Rail Modernisation project 4. Conradie & TRUP 5. Athlone Power Station 6. Paardevlei The MSEIZ comprises 12.3% of the City s jurisdictional area within the urban edge and more than 39% of the total metropolitan population. The MSEIZ is the location of 31% of Cape Town s formal dwellings, 51% of its backyard units, and 70% of the city s informal dwellings (not in back yards). The highest unit densities in the city (above 100 units/ha) occur in the MSEIZ, specifically in Langa, Philippi/ Crossroads, Site B, C, and TR Section, and the rest of Khayelitsha. The area is home to the largest concentration of people in the city rated worst off in terms of the Socio-Economic Status Index (specifically the area from Langa south-eastwards towards Khayelitsha), and the largest concentration of people in the city rated worst off in terms of the Household Services Index (specifically Philippi/ Crossroads, Site B, C, and TR Section, and the rest of Khayelitsha). Development lead 1. City in collaboration with all internal and external stakeholders 2. Transport Development Authority 3. Prasa/ Metrorail 4. Province, TDA 5. Transport Development Authority 6. Transport Development Authority The south-east, where most of the city s poor live, is not achieving the same growth as the highincome suburbs to the west. The lack of formal industrial and commercial development in the Cape Flats is very striking considering the sizeable resident population. Rail provides the backbone of transportation services within the MSEIZ. The Southern and Cape Flats Lines partially pass through the MSEIZ. The Langa, Guguletu, Bishop Lavis, Heideveld, Nyanga, Mitchells Plain and Khayelitsha areas (central and eastern MSEIZ) have the highest trip origins in the city. The central rail line is over capacity and the infrastructure is failing. Additionally, there is ever-increasing pressure on the N2 Express BRT infrastructure that serves this corridor / Integration Zone. Social facilities of all types are generally under stress, specifically in the eastern parts of the area. The City and its partners are working on 3 large projects: Consolidating the Investment Strategy whilst acknowledging and facilitating the Prasa Rail Modernisation Project as well as expanding the implementation of the MyCiti to connect this metro-south east area with areas of economic potential to the west at Claremont and Wynberg. 29
30 Metro South East Corridor Integration Zone Priority Projects: IRT: Phase 2 Philippi PT Facility & PTI Athlone Power Station (APS) TRUP Prasa Rail Modernisation Paardevlei Southern Corridor Housing Project Built environment projects directly supporting priority projects: IRT: Phase 2A (R843m) & MSE/ Philippi PT Facility: (R48m) & Stock Road NMT (R3,6m) Athlone Power Station (R2,8m) for planning approvals incl EIA & HIA. PRASA Central Line Modernization: Electrical programme for conductors, substations and lines (R75,7m) WWTW: Althlone Capacity Extension Ph 1 (R126m)@APS, Macassar Ext (R98,9m)@Paardevlei, Collector Sewer: Philippi (R78,4m)@Philippi PTF. * Reservoir: Steenbras (R105,m)@Paardevlei. Electricity: Observatory Main Subst Upgr. (R69,9m)@TRUP, Koeberg Rd Switching St Ph 3 (R29,2m)@APS. Total budget planned 2016/ /19: R1,38bn Projects supporting the overall development in the corridor: State City PRASA Cress/ Tech Station Improvements & Upgrades: Nolungile (R36m), Bonteheuwel (R20m), Mandalay (R18m), Philippi (R20m), Stock Road (R18,9m), Lentegeur (R18m) WCG Human Settl: Southern Corridor Housing Project: Airport Precinct, itemba Farms, Kosovo,Thabo Mbeki, Joe Slovo, Boystown, Sheffield Rd WCG Education: Inkanini Prim (2m). WCG Health: Observatory FLP replacement (R179m), Elsies River CHC replacement (R77m), Wynberg/ Victoria Hospital new Emergency Care Unit (R58,7m), Observatory/ Valkenberg (R45m) ESKOM: Esethu (R67,6m), Vlakte (R23,5m), Eureka (R17,2m) Total budget planned 2016/ /19: R2,38bn Utilities: WWTW Zandvliet (Extension incl. BlacMac Sewer diversion, R461,7m); Cape Flats (Refurbish various, R96m); Mitchells Plain (Ph 2, R62,8m) * Bulk Sewer: Cape Flats 3 (R120m), Philippi Collector Sewer (R78,4m) * Bulk water: Gugs & Mannenberg (R19,5m). * Water & sewer network upgrades: Water (R19,3m) and Sewer (R16,4m). Supply (Baden Powell Dr to Khayelitsha, R52,7m), Belgravia Est (R2,6m). * For informal settlements: Rehabilitation of water & sanitation networks (R40,5m), internal sanitation (R62,8m), internal water (R9m), network replacements Khayelithsa(R2,8m). * Solid Waste: Athlone Transfer Station upgrade: (R9m), Swartklip (R28,4m). Electricity (See box above and ESKOM). Road Rehab: Gugulethu (R20m), Klipfontein Upgade (R2,6m), Manenberg (R13,5m). * PTI: Makhaza (R17,7m), Lentegeur/ Mandalay (R8m), Mitchell s Plain (R5,2m), Nolungile (R0,5m), Nyanga (R0,2m). * NMT: Elsies River/ Halt Road (R13m), Mitchell s Plain (R7,8m). Precinct Upgrade: Kuyasa Library (R1,6m), Langa Sation (R0,05m). * Upgrade Informal Markets & Facilities (R3,5m). * Parks & Recreation: Manenberg Integrated Project (R15m), Manenberg Precinct (R10m), Gugulethu Sportsfield (R7,7m), Sagaloda (Philippi) (R4m), Wallflower Park (R1,4m). Social Facilities: ECD Centres: Heideveld (R14,7m), * Clinics: Zakhele (new) (R12m), Elsies TB/ARV Ext (R8,1m), St Vincent Ext (R0,3m), Gugulethu Ext (R0,5m). * Mun Courts: Lentegeur (R2m). * Cemetry: Langa (R1m), Khayelitha (R1,2m). * Fire Station: Langa (R2m), Khayelitsha (R1,7m), Landsdowne(R1m). Housing: * Hostels upgrade: Langa (R166m). * IDA/UISP: Sweethomes (R82,5m), 8st Laan (R53m), Tambo Sq (Gugs) (R7m), BBT Section (R4,5m). * New housing: Beacon Valley M/Plain (R72,2m), Harare Infill (R31,3m), Valhalla Park (R27,9m), Ilitha Park (R16,7m), Heideveld (R4,8m), Bonteheuwel (R2,6m), Gugs Infill (R2,4m), Highlands M/Plain(R1,4m), Forest village (R35,5m), Blue Berry Hill (R6,5m), * Reblocking: Tambo Sq (R2m) Dark Fiber Broadband: Part of R627,5m for whole city. 30
31 Metro South East Corridor Integration Zone Partnerships: Dutch Government: PRASA, ESKOM & ACSA: Province: The Faculty for Infrastructure Development (ORIO) encourages public-infrastructure development in upcoming markets and developing countries. The Cape Town project PRASA is planning the modernization (new signalling, etc.) of the central rail line the backbone of the MSE transportation infrastructure. includes the upgrading of PTIs and the development and management of these PTIs with a new management system in association with the community and land users to ensure continuation of project objectives during operations. ACSA bought Swartklip, a strategic land parcel of 517 Ha in the MSE corridor located between Khayelitsha and Mitchell s Plain. A development conceptualisation phase is imminent with the appointment of a consultant team who will work with the City s different departments. Major opportunities for mixed use and commercial development are being investigated. Eskom intends to create a new step down station at Philippi to help with the Erica LILO network serving the MSE. The city is supporting the TRUP, Conradie and Southern Corridor Integrated Human Settlement projects that the provincial government initiated. The former two are mixed use development projects and the latter caters for the provision of human settlements in a number of locations in and outside the MSE IZ. 31
32 Voortrekker Road Corridor Integration Zone (Figure B10) (VRC) Primary Objectives linking Bellville CBD with the Metro South-East Corridor boundary and the Cape Town CBD; Spatial Restructuring Opportunities: securing the modernisation of the Rail Corridor; proving alternative housing development in the inner cities of Bellville, Parow, CBD, etc. Facilitating the Foreshore Freeway TOD Catalytic Project 3 ; Facilitating the Bellville TOD and Conradie TOD Catalytic Project (Conradie is a Provincially led project); and; Facilitating land swops with Province to enable affordable housing e.g. Stikland and Woodstock Hospital. Marginalised Areas within VRC: Although the socio-economic profile is not as vulnerable as the broad MSEIZ profile, the VRC has been susceptible to urban decay and in need of structured management approaches to support and stimulate investment and re-investment. A relatively small quantum of informal settlements and households are located within the VRC namely: Koekoe Town (98 households), Maitland cemetery (113), Royal Plakkers Kamp (172), 6th Avenue, Kensington (189), Wingfield Camp (235), Appelboord (359), and Gaza (378). Growth Nodes: In addition to the key business districts of Bellville and the Cape Town CBD other strategic nodal points and precincts include Maitland, Parow, Goodwood, Salt River. Regional facilities located in the VRC include the University of the Western Cape, Cape Peninsula University of Technology and Tygerberg Hospital. Strategic intentions and opportunities within VRC: The VRC provides opportunities to i) optimise land-use in support of transit investments ii) intensify development and iii) balance transit demands (key to an efficient and sustainable public transport network). Most prominent of these opportunities from a public transport perspective is the Bellville Public Transport Interchange which provides the City an opportunity to reconsider its considerable land holdings and to leverage opportunities of integrated, mixed land use within the context of this inter-modal facility. The availability and increase in supply of affordable rental stock is recognised as one of the key levers towards integration and renewal of the VRC and the VRC Social Housing project was submitted by the National Department of Human Settlements as one of the City s candidate Catalytic Human Settlements Projects. A separate integrated strategically-orientated forward planning exercise (referred to as the Bellville Integrated Transport Local Area Plan - BITLAP) consolidates planning efforts by the City s previous departments Transport and Spatial Planning Departments as well as other SOEs (Transnet, PRASA/ Metrorail) and the Provincial Departments. The VRC hosts a number of urban development opportunities linked to strategic state land including Wingfield and old provincial hospital sites. The human settlements emphasis in this Integration Zone is focused on social housing that would provide affordable rental opportunities at densities supportive of the public transport network and TOD principles. Human Settlement Priority Project: Voortrekker Road Social Housing (Figure B11) In February 2017, the City received confirmation from the Housing Development Agency endorsing of three national priority catalytic projects, namely, the N2 Phase 2 Southern corridor, North Eastern Corridor and Voortrekker Integration Zone Social Housing (including Conradie) projects. It is understood that these three projects contribute to forty-five countrywide state led projects which enjoy national priority status. 3 The first phase Request for Proposals closed on 9 February 2017 and adjudication of bids have commenced. There are, however, other Inner City / CBD sites that are also being explored. 30
33 The opportunities afforded in the VRCIZ to support rental accommodation and a more effective human settlement approach to Transport Orientated Development (TOD), are recognised in the Voortrekker Road Social Housing project. A potential yield of 1,600 units relating to five targeted sites was submitted as a third catalytic project submission to National Department of Human Settlements. 31

34 Figure B10: Voortrekker Road Corridor Integration Zone Spatial Structure 28
35 Table B2: Voortrekker Road Corridor Integration Zone Overview Voortrekker Road Corridor / Integration Zone To be upgraded rail and road-based transit corridor Nature of the development 1. Voortrekker Road Integration Zone Investment Strategy in process of finalisation 2. Bellville CBD Project (PTI & Paint City) 3. CBD Sites: * Wingfield and Stikland Identified as a regeneration corridor directly linking the Bellville and Cape Town Central Business Districts which are situated approximately 20km from each other. Key spatial elements include an efficient multimodal public transport network (road, rail, taxi, bus etc.); the highest number of tertiary institutions in relation to the rest of the City; abundant social facilities and opportunities for latent land use rights to be taken up (reducing turnaround times for proposals in many instances). In addition, a significant portion of the City s Urban Development Zone (UDZ) extent is located within the VRCIZ. There is evidence of major urban blight and this regeneration initiative aims to facilitate investment in the corridor by remediating the drivers of disinvestment, including: urban management issues, infrastructure and transport capacity constraints, inefficient and unproductive use of public land, anti-social behaviour, lack of optimal use of public facilities and ineffective land use management. Specifically, there is a need to address the freight constraints on the northern line and the resultant road freight movement along Voortrekker Road. The VRC IZ, with its diverse range of land uses (including: residential, commercial, retail, industrial and public facilities), excellent location and established infrastructure and services has significant potential for renewal and redevelopment. By taking advantage of these locational advantages, spatial restructuring ill result in a more efficient city form and function, can be driven through leveraging the existing and planned public transport networks, transitoriented development as to expand on the close proximity of communities to public transport, employment and social amenities. A core component of the strategy will be the facilitation of social rental housing. There is a need to link the rollout and phasing of the PRASA modernisation on this rail line as well with the upgrading of Bellville and of the related Public Transport Interchange (PTI). This will include investment into affordable housing, social housing and the overall stimulation of the market. Pockets of strategically located land within the corridor owned by other spheres of government such as Wingfield and Stikland can potentially and significantly contribute to the TOD agenda in this corridor. Development lead 1. City in collaboration with all internal and external stakeholders (incl. Prasa/ Metrorail) 2. Transport Development Authority, PRASA/ priv sector 3. Transport Development Authority & private sector 29
36 Voortrekker Road Corridor Integration Zone Priority Projects: Bellville (incl. Paint City and PTI) Elsies Kraal River Management Plan Northern Line Modernisation Study Conradie Hospital Development Built environment projects directly supporting priority projects: WWTW: Bellville Bellville CBD IRT Control Centre & Fare Collection Goodwood (R143,8m) Transport Management Centre Extension (R82,5m) & TM System (R220m). PRASA s Cape Metrorail Control Centre@ Bellville-signalling recapitalisation (R348,2m) Electricity for Bellville CBD: MV Systems North (R80,1m), Oakdale Main Substation upgrade R61m). CBD Public space/ NMT upgrade for Bellville CBD: Kruskal (R16,8m), Elizabeth/JMuller Park (R12m), VTRoad Islands (R2m) Total budget planned 2016/ /19: R1,11bn Projects supporting the overall development in the corridor: City State WWTW: Borchard s Quarry(R209m) * Sewer network: Goodwood PRASA: Salt River Depot Upgrading (R143m). Safety (fencing): Salt River, replacement (R5,5m) * Bulk water for human settlements: (R14,8m), (Head Paardeneiland, Culemborg (R31m) Office) (R273m) * Bulk Sewer (Northern Reg Sludge Fac) (R119,2m) * Solid PRASA Cress/ Tech Station Improvements & Upgrades: Cape Town Waste: Maitland Depot Specialized Equipment (R12,7m). * Solid Waste: (R27,2m), Bellville (R15,6m), Kuilsrivier (R7,6m), Esplanade (R5,7m) Parow Depot Upgrade (R17,9m), Bellville Transfer & Bellville Land Fill ESKOM: Stikland (R91,6m), Modderdam Traction (R22,8m). (R12,2m), Beaconvale new drop-off (R6,2m). Electricity: Koeberg Rd Swt Ph 3 (R29,2m), Tygerberg SS Upgrade (R26,3m), WCG Human Settlement: Conradie, Glenhaven Social housing, Belhar Plattekloof Reinforcement (R25,3m) and around Oakdale) (R2,9m). CBD. Roads (congestion relief): Erica Dr (R45m), R300/ Bottelary IC (R29,2m), Belhar Main Rd (R26m), Jip de Jager (R14,2m). PTI: Bellville (R4m). Social Facilities: Clinics: Ravensmed (R1,7m) * Crematorium Maitland: Upgrade (R8,18m) incl Booking Facility Chapel etc; Stikland Cemetery (R2m) Housing: New housing: Belhar CBD (R49,2m), Bellville Pentech (R13,8m), ElsiesRiver (R3,4m). Informal Settlement/ Backyarder upgrading: Ravensmead (R5m), Bellville South (R4,9m). Dark Fiber Broadband: Part of R627,5m for whole city. Total budget planned 2016/ /19: R1,4bn WCG Education: Parow Ravensmeat CDC Replacement (R55,5m) WCG Health: Green Point New Somerset Hospital Acute psychiatric unit (R40,5m) 30
37 PRASA Establishing a high quality, efficient rail service is critical for the achievement of TOD in the corridor. The Northern Rail Corridor Modernisation Study is a corridorwide intervention jointly undertaken by the City and PRASA using ICDG funding. Voortrekker Road Corridor Integration Zone Partnerships: Greater Tygerberg Partnership (GTP) Universities and Private Sector - and CID Medical Service providers: The GTP is a key partner of the City in the Integration Zone. The GTP acts as a liaison and facilitator between the public and private sectors. The GTP has been integral in the development of the Strategy and Investment Plans. The various CIDs in the area are key partners in urban management. Projects are underway to coordinate efforts and responses of all urban management organisations. There is a concentration of tertiary education institutions and student housing around Bellville and Parow. These campuses and student populations are drivers of urban regeneration. Projects: Private sectors off-campus residential development. Medical value chain in Bellville and Parow resulting from cluster of medical facilities and universities. This value chain is an employment driver in the area. Projects: Mediclinic expansion; TASK (medical research) building purchase in Parow; Tygerberg Hospital redevelopment. Social Housing Institutions: The delivery of social housing is a high priority within the VRC as a mechanism for achieving spatial transformation and preventing gentrification. A pilot project is underway, with NASHO, to test a precinct based approach to affordable housing delivery. 31
38 Figure B11: Spatial Location of Human Settlement Catalytic Projects 32
39 Blue Downs / Symphony Way Integration Zone During the coming financial year, the City will endeavour to package the Blue Downs / Symphony Way Integration Zone in a similar fashion to the other two, more mature IZs. The delineation of the IZ, priority precincts etc. would be basic steps towards that work programme and planning. A concept indicating the linkages and possible amendments to the Metro South East, Voortrekker and Blue Downs IZs are indicated in Figure B12. The basic tenets of the Blue down IZ are listed in Table B3 below. Table B3: Blue Downs Proposed Integration Zone Overview Blue Downs Corridor / Integration Zone Proposed, rail based but supported by MyCiti feeder Nature of the development 1. Prasa Blue Downs Rail link construction and associated stations precincts at Wimbledon, Blue Downs and Mfuleni 2. MyCiti feeder system. A secondary intervention of the TDA will reprioritise the Blue Downs feeder system, the restructuring of the bus network upon assignment of the Contracting Authority function and the development of the BRT corridor along Symphony Way. Development lead 1. PRASA undertook to the lead with the design and development of the rail line and stations in association with the Transport and Development Authority 2. Transport and Development Authority The Blue Downs Rail Link remains critical to the development of the City. This requirement and the analysis of development trends in proximity to the proposed BRT (Symphony Way) and Rail (Blue Downs) have been the primary motivations for the City to adopt this formally as its third Integration Zone. The lead investor for this proposed new integration zone is PRASA via its commitment to the Blue Downs rail link (estimated R5bn). The lack of access in this last line of the development quadrant in the City of Cape Town, is causing a detrimental long term impact on the city. Future development needs to follow the direction of the TOD Strategic Framework and specifically the TOD-Comprehensive Land Use Model which emphasises land use intensity (density of households and diversity of land uses). The 3 new stations on the Blue Downs Rail Line will become major opportunities for the development of multi-functional integrated hubs of both mobility, commercial and living spaces. Consequently, there is a need for the City, along with PRASA to determine land use development and management opportunities for both land use intensification (with appropriate degrees of density and diversity) in and around the proposed new stations. 33
40 NB: There is a degree of overlap in the Blue Downs IZ given the linkages it provides between the VRC and MSE IZs. Priority Projects: Built environment projects directly supporting priority projects: Blue Downs Rail Link The Blue Downs rail link station feasibility project is completed. 3 new station locations namely (Mfuleni, Blue Downs, Wimbledon). The 3 new stations on the Prasa confirmed the construction of the rail link is still on their budget. Blue Downs Rail Line become major opportunities for the development of multifunctional integrated hubs of both mobility, commercial and living spaces. Consequently, there is a need for the City, along with PRASA to determine land use management opportunities for both land use intensifications (with appropriate degrees of density and diversity) in and around the proposed new stations. Southern Corridor Housing Project Total budget planned 2016/ /19: R1,38bn Projects supporting the overall development in the corridor: State City PRASA Cress/ Tech Station Improvements & Upgrades: Lengegeur (R5,8m). New housing: Macassar BNG (R72,9m), Forest village (with Province) (R35,5m), Delft/ The Hague (R13m), Blue Berry Hill (R6,5m), Mahama (R2m), Maroela (R2m), Bardale/ Fairdale (R1,6m). ESKOM: Pinotage (R259,2m), Blackheath Infor Settl/ Backyarder upgrading/ Reblocking: Mfuleni Santini (R2m), Tambo Sq (R2m), California (R196,8m), Eersterivier (R23,6m), Delft (R13,2m). (R1,9m). WCG Education: Blackheath Primary (R58,5m), UISP: Kalkfontein (R72M) Disa Road (R55m), EersteRivier Sec (R31m), Social Facilities: ECD Centres: Delft: (R13,9m). Rusthof (R11,6m), Macassar Prim (R37m) Parks: Mfuleni Urban (R16,4m) WCG Health: Eerste River Hospital - Acute Dark Fiber Broadband: Part of R627,5m for whole city. Psychiatric Unit (R12,5m), Macassar (R37m), Mfuleni (R27m) Cemetery: MSE Regional (Faure) (R14,9m), Welmoed (Eersterivier) (R14m). With WCG Human Settl: Forest Village, itemba Farms, Penhill, Delft 7, Delft Erf 3494, Highbury Park, BlueDowns Erven 1896 & 4238, Nuwe Begin, Our Pride, Eersterivier Erf 393, Brentwood Park, Glenhaven Social, Tsunami Total budget planned 2016/ /19: R1,04b (excluding Blue Downs) Partnerships: PRASA: Province: Prasa confirmed at the Mid Year Budget A large proportion of the identified projects which are part of the Southern Corridor Integrated Review meeting in Feb 2017 that the Human Settlement project (a partnership between the City and the Provincial Human Settlements construction of the rail link is still on their budget. Department), is located in this corridor. 34

41 Figure B12: Possible Integration Zone Boundaries and Extensions to be Investigated/ Considered in 2017/18 35
42 3.2 Human Settlements Overview During 2014/15 the City completed a detailed review of the as-is housing (or shelter) situation in Cape Town and, given specific assumptions, the projected housing situation by In summary, Census 2011 indicated that the City of Cape Town has a population of approximately one million households being accommodated as follows: 46% (489,833) of households live in formal dwellings (owned); 31% (328,135) live in formal dwellings (rented); 13% (143,823) live in informal settlements; 7% (74,957) are live in backyard shacks; and Less than 1% (12,297) live in hostels. Furthermore, the Census 2011 indicated the following socio-economic profile of the City s households: 47% fall into the R0 R3,200pm category; 14% into the R3,201 R6,400pm category; 13% into the R6,401 R13,000pm category; 12% into the R13,001 R26,000pm category; and 14% into the R26,001+ pm category In-migration and population growth will be responsible for approximately 500,000 new households by Estimates suggest that 650,000 families earning less than R13,000 or living in sub-optimal conditions will be reliant on the state for some kind of assistance with respect to their shelter between now and Current and prospective funding, land and human resources at Council s disposal is inadequate to address existing and future human settlement challenges. This recognition formed the basis of an Integrated Human Settlements Framework (IHSF). The IHSF recognised that the default approach to supply and demand interventions would not deliver on existing and projected housing need and would necessitate a strategic and institutional review. This resulted in a series of recommendations on how to significantly redirect the human settlements strategy (Table B4). From Depth of delivery (completed product to few) A completed private dwelling Promoting entitlement Supply led delivery Once-off delivery to beneficiary Re-active servicing/ support for private rental Project based approach Contestation between infill and urban expansion Limited practical support for urban integration Housing as a limited (silo/ directorate specific and state) responsibility Many communication points Table B4: Key IHSF Recommendations To Width of delivery (incremental product to many) An incremental dwelling supported by full public facilities and opportunity Promoting self-reliance Demand led delivery (focused on greatest need and diversity) On-going development support to beneficiary based on an incremental model Pro-active servicing/ support for private rental Programme based approach in terms of budgeting Complementary infill and urban expansion Pro-active support for urban integration in designated placed and Integration Zones (e.g. through the conversion of brown buildings). Housing as a common, shared responsibility (within the municipality and between government and the private sector) One communication point; one message 36
43 Fundamental to the IHSF s messaging was the need to progressively shift supply typologies and approaches, most notably emphasising the width of delivery approaches, over depth. In practical terms this would require the commitment of resources to a greater number of beneficiaries (at a reduced quantum per beneficiary) with a greater emphasis on serviced site delivery in place of completed units. The need to identify and execute delivery of mixed-use, mixed income developments to support integration of communities (and in turn support objectives of transit oriented development and densification) was also a key theme of the IHSF programme. During 2016 the City has developed an Integrated Implementation Programme to support the implementation of the IHSF premised on: An Informal Settlement Upgrading schedule informed by Rapid Assessments appraisals (all settlements identified, mapped and assessed) and determining appropriate, differentiated approaches ranging from: o rapid full and conventional upgrading o the provision of basic services as an intermediate measure and o relocations only undertaken as a last resort A 5-Year formal Housing Programme i.e. internal services with top structure for qualifying beneficiaries; An inventory and database of vacant land owned by the city and reserved for human settlement development (Land availability); and The adoption of Planning and Design Directives 4. 4 Historically, the City employed a standard approach to the provision of housing opportunities of plot sizes of 100m² and single free-standing 40m² dwelling unit. Progressively, these standards were amended to accommodate 2-storey, semi-detached housing units on 60 80m² serviced sites. One of the significant deliverables of the IHSF programme has been the completion and adoption of Directives for The Planning, Design and Implementation of Human Settlement Projects in Cape Town. Under the auspices of the Sustainable Communities Working Group, a multi-departmental team determined these design and planning directives and standards (e.g. road widths and parking requirements) to support a more adaptable and practical delivery mechanism to address effectively the urban form of upgrading and new projects. These approaches to density and design serve many outcomes including: the maximisation of housing interventions within the limits of funding provisions; the minimisation of displacement of families and the retention of densities that are appropriate from an urban management perspective, bulk infrastructure utilisation and public transport threshold. The directives state the following: Where incremental development is proposed a starter structure, including a party wall, wet core, slab and foundations must be provided on each site. Generic house plans should be developed for building plan approval illustrating how the starter unit can be extended and added to over time. Urban house typologies: semi-detached, row houses and courtyard houses are preferred. The design of the residential unit should not be prescriptive or limit how a unit can be extended or added on to. Building types must be adaptable and able to accommodate additions, extensions and second dwellings. These now inform the design process and layout of all future human settlements projects within the City of Cape Town and are also be used by City line departments in assessing and commenting on development applications (from public sector organisations or private developers) submitted for approval through the land use process. 37
44 Point Human Settlement Turnaround Action Plan 2017/18 and MTREF Introduction South African cities, and in this instance, Cape Town, are very inefficient and costly, due to spatial disparities; segregated land uses; singular income and tenure residential environments; and access constraints. Further, like many other cities in the world Cape Town continues to experience rapid urbanisation as more and more people move to the city in search of opportunities and with it comes numerous challenges. Apartheid spatial planning created a fragmented city which not only saw people put far from economic opportunities without opportunities or sustainable communities where the activities of live, work and play could coexist, but lack of investment to bring economic activity into those areas. These challenges need a fresh, innovative approach as we can no longer do the same things and expect different results. Radical, out of the box thinking and proactive, implementable solutions are the way to achieve integrated, sustainable communities. We have an opportunity to use the challenges to our advantage by RE-IMAGINING OUR CITY and responding to growth and the ever increasing housing demand in a responsible and innovative way which ensures that our city works more efficiently and effectively and that human settlement are integrated and sustainable. Building integrated communities goes hand-in-hand with the spatial transformation of our City of Cape Town and resultant improved efficiencies. Integration of land use, integration of income groups with tenure blind strategies, racial integration of employment equity and empowerment are all part of this transformational priority. It is considered critical that the human settlement agenda be redirected so as to be consolidated within the urban core, as bounded by integration zones and ensuring that there is a densification and intensification of development to support the transit led investment. This will also include developments that are tenure-blind and change the design of social, transitional and low income housing alternatives. The human settlement investment along the corridor needs to be within 500m of a rail and BRT station and the TOD-related tool are to be employed. Two of the major integrated human settlement investment potentials (dense and intense developments on greenfield sites) are Paardevlei, which is the proposed node in the eastern segment of the City, and Ottery, which is a recently identified opportunity that is in the southern segment of the City. 10 Point Turnaround Human Settlement Action Plan The new Council post the Local Government Elections, made the decision to combine into one governance structure the functions of integrated transport, urban development and the formal human settlements implementation. As a result, the Transport and Urban Development Authority or TDA Cape Town was established and came into existence on 1 January The Organisational Development and Transformation Plan (ODTP) determined 11 Transformational Priorities to address amongst others, the realisation by the City that its delivery of human settlement opportunities since 2011 has fallen short of expectations and projected service delivery targets. Delivery was inadequate in relation to the ever increasing demand that is resultant from both growth and urbanisation. The aim therefore of this 10 Point Turnaround Human Settlements Programme for human settlements service delivery in the City for the 2017/18 financial year and the MTREF is to revisit and refocus the long term Business Plan that was submitted to the National Department of Human Settlements (NDHS). This refocus has essentially been broken down into 10 main points, which are summarised below. The ten interventions of the Programme will be unpacked into detailed projects and action plans which will then change the delivery targets. 38
45 By including this overview of the Programme in the BEPP 2017/18 it will ensure that the rollout of each of the components are in accordance with the overall development philosophy of the City of Cape Town and specifically in accordance with their manifestation in relation to the three integration zones and the urban core. One of the major problems historically has been that human settlement opportunities have been predominantly provided on the urban periphery. The aim is to reverse this. Defining Different Housing Typologies and Tenure Options The first step in the process, which has already commenced, is to formally define each available housing typology and tenure option available to the City. This research is linking these typologies to financial options and identifying alternative funding sources should the City wish to change the typology option. This will also include researching international best practice and design that will enable spatial transformation but also move towards sustainable, integrated communities. Human Settlement Database On investigation in 2017 it was revealed that the housing database is not functional, has not been updated for some time, does not identify the required information for the City to make informed decisions on the quantum and structure of the demand. The City is now in the process of determining the parameters of a tender that will revisit the housing database, clean the information currently available and then add information that will enable targeted and responsive service delivery. Pipeline of Projects and Land Investigation has revealed that the forward planning functions that are required to have a consistent pipeline of both land for human settlement projects as well as human settlement projects themselves, in accordance with identified needs, does not exist. Through the ODTP a new unit to undertake these functions has been created and is in the process of being filled. Further, a pilot land identification mechanism is being reviewed with the aim of mainstreaming it. Alternative Housing Building Materials The City of Cape Town is in the process of exploring alternative building materials as an option for more affordable, energy efficient solutions as well as to reduce the time of service delivery. This includes modular housing, container options, etc. Financial Management and Procurement Serious problems with the contractual payment processes linked to the HSS were identified in January They are in the process of being streamlined. Further, TDA is registering human settlement service delivery as a programme along with developing a database and term tender for both human settlement professional service providers and contractors. This will ensure that projects can run in parallel and, should there be any delays in a given project, then there can be a transfer under the programme to another that is running ahead of schedule. Inner Cities Human Settlement Plan In terms of the City s TOD Strategic Framework, there is a need to identify housing opportunities close to BRT and rail stations. TDA is in the process of developing an inner cities human settlement strategy. This is not just the Cape Town CBD but for all of the smaller inner city areas such as Bellville, Parow, Khayelitsha, Claremont, Mitchells Plain, Wynberg, Plumstead, etc. Social Housing One of the concerns is that the delivery of social housing opportunities in Cape Town is slow, that the housing database does not identify those that qualify for social housing and that there is a dearth of opportunities in well located areas. TDA is in the process of 39
46 packaging a multiple site initiative in the Woodstock / Salt River area with the aim of putting it out, in consultation with the social housing institutions, for development. Hostels It has been identified that there are still beds in hostels that fall under the auspices of the City and that need to be addressed in terms of either relocation or reconstruction into family homes. The pace of the hostel programme was too slow and disjointed. Through the programme methodology, TDA is embarking on a multi-pronged process to be able to expedite the hostel programme for the benefit of those that both live in the hostels as well as those in informal situations on the hostel sites. Revisited Administration including Title Deeds The City is expediting the process for managing the title deeds and developing a system that will ensure that, as from the 2017/18 financial year all houses completed will be transferred to beneficiaries with immediate effect of completion. The Human Settlement Green Agenda The City of Cape Town is in the process of exploring the possibility of securing a Green Bond. Further in this regard, TDA has started a process to determine whether it can source top up funding for all human settlement opportunities in Cape Town that will ensure that green, sustainable technologies can be introduced Informal Settlements Upgrading Background: Statistics from Census 2011 indicates that the housing backlog was approximately 345,000 households 5 : 143,823 (13.5% of all households) of this backlog was located in informal settlements defined by StatsSA as An unplanned settlement on land which has not been surveyed or proclaimed as residential, consisting mainly of informal dwellings. These settlements vary significantly in size and topographical condition and are located on private or state-owned property. Generally, informal settlements develop into a haphazard arrangement of dwellings and informal structures of varying construction types and materials some less sound than others. The average density in existing informal settlement areas is approximately 180du/ha: some are as high as 480du/ha. An effective approach to managing density is fundamental to a broader human settlement response to urbanisation and land budgeting. Other common characteristics of informal settlements include: inappropriate locations and unsuitable environments floodlines, within servitudes e.g. electrical pylons, landfill etc.; inadequate infrastructure and poor access to basic services illegal connections to electricity and other services common to cater for latent demands beyond design capacity; uncontrolled population and building densities resulting in environmental - health and fire risks; inadequate dwelling material susceptible to flood, fire, storm conditions; poor access to social facilities; and inhabited by households susceptible to poverty and vulnerability 77% 6 of the city s informal settlements are located within the areas classified needy and very needy by the Socio-Economic Index. A consolidated database established in 2006 listed the (then) 223 informal settlements in the city and recorded the levels of service provision ,953 housing applications were registered on the City s housing database (as at December 2015). 6 GIS spatial query
47 To support the IHSF implementation, an additional Rapid Assessment was undertaken in 2016 to ensure that all settlements are identified, mapped and assessed. The Rapid Assessment methodology was applied to all settlements and is distinct from the more detailed prefeasibility, feasibility and project-level planning work which would follow. The objectives of the Rapid Assessments were to: strengthen and update the IHSF in respect of informal settlements; obtain a rapid overview of the locality, scale and nature of informal settlements (i.e. needs & constraints) determine an initial categorisation: indicating the appropriate type of developmental response for each settlement (based on a preliminary assessment of site developability and formalisation potential, noting that this categorisation may need to be subject to review and amendment at a later stage) Table B5; enable strategic prioritisation of informal settlements for different developmental responses (Table B6); enable the allocation of financial and human resources on multi-year expenditure framework (associated with further pre-feasibility and feasibilities studies, design, and implementation / construction e.g. emergency or basic services, land acquisition, full services, housing); and identify priority settlement improvement actions pertaining to: o Basic infrastructure, tenure and housing improvements; and o Broader socio-economic improvements (e.g. primary health care, early childhood development, public transport, basic education, informal economy etc.) 41
48 CAT. DESCRIPTION CRITERIA APPROACHES 1 Settlement to be upgraded in-situ i.e. Settlement is located on land owned by the City In situ Upgrading UISP or Re-blocking method Density of settlement does not require any type of decanting Re-Blocking No immediate risk (flooding, power lines etc.) 2 Settlement can be upgraded but Settlement is located on land owned by the city In situ Upgrading requires decanting to adjoining or Density of settlement requires decanting to provide space for sites, services Re-Blocking nearby land parcel. and access There is no immediate risk (flooding, power lines etc.) 3 Settlement can be upgraded but Settlement is located on land owned by the city In situ Upgrading requires decanting to distant greenfield land parcel already Density of settlement requires decanting to provide space for sites, services and access identified. Settlement partially located in road or rail reserve, servitude or in future public transport route. There is no immediate risk (flooding, power lines etc.) 4 Settlement can be upgraded but Settlement is located on land owned by the city In situ Upgrading requires decanting and destination land parcel uncertain Density of settlement require decanting to provide space for sites, services and access Settlement partially located in road or rail reserve, servitude or in future public transport route. There is no or limited risk 5 Settlement to be relocated in totality Settlement is located on land not owned by the city i.e. private or state Full Relocation but destination land parcel uncertain owned land e.g. SANRAL, PRASA, Transnet etc. Settlement located in servitude, road reserve, rail reserve or future public transport route Immediate risk associated with settlement i.e. flooding, ponding, detention pond, power lines, servitude, Biodiversity Core 1, very high density etc. 6 Settlement to be relocated in totality to distant greenfield land parcel. As above Full Relocation 7 Uncertain - Settlement conditions to be further investigated as to best possible future plan Investigation 7 Table B5: Settlement Categorisations TRA 8 Provincial / N2 9 Cleared 10 7 Settlement conditions to be further investigated as to the best possible future plan. 8 Existing TRA s in the city. 9 To be upgraded by the Western Cape Provincial Government as part of the N2 development. 10 Settlements that have already been cleared and is no longer in existence 42
 Full Relocation 132 30 Provincial / N2 10 2 Cleared 22 5 Investigation 29 7 Total 436 100 Table B6: Results of Rapid Assessments Figure B13: Human Settlement Implementation")
49 Finding Areas of Informality % of Total In-Situ (UISP) (refer to Figure B14 for example) Re-Blocking (refer to Figure B14 for example) 23 5 Temporary Relocation Areas (TRA) (refer to 13 3 Figure B14 for example) Full Relocation Provincial / N Cleared 22 5 Investigation 29 7 Total Table B6: Results of Rapid Assessments Figure B13: Human Settlement Implementation Initiatives 43
50 City IDP Commitments to Informal Settlements Upgrading: Informal settlements and the City s explicit commitments to supporting and upgrading the amenity and conditions associated with informal settlements and new developments is defined in the City s draft Integrated Development Plan s Objective 3.2 that commits to mainstreaming basic service delivery to informal settlements and backyard dwellers, through a Basic Service Delivery and Human Settlements programme: 3.2.a Basic Service Delivery Programme 3.2.a.1 Encouraging and supporting backyard dwellings 3.2.b Human Settlements Programme 3.2.b.1 Informal Settlements Services Project 3.2.b.2 Informal Settlements Water and Sanitation Project 3.2.b.3 Settlement Formalisation Project 3.2.b.5 Informal Settlement Formalisation Project The draft IDP submits a clear delivery rationale for the regularisation and the progressive upgrade of informal settlements and constantly works towards the administrative incorporation of all informal settlements. An investment and upgrading framework for informal settlements is in place to support the provision of services and ultimately security of tenure for the residents of the City s informal settlement. The City will ensure the provision of and access to basic municipal services (water, sanitation, electricity and refuse removal) to households in line with the national guideline levels: one tap per 25 families within 200 metres (the City applies a higher standard at 100m) 11 ; a minimum of one toilet per five families 12 ; weekly refuse removal; and Individual electricity connections (where possible & subject to the applicable legislation) The current standard of service described below is what the programme strives to continually deliver to all informal settlements. i. Sanitation technology solutions: The water supply to informal settlements is provided in the form of standpipes while for sanitation there is a range of sanitation technology solutions implemented, based on the specific conditions of the settlement. ii. Waterless technology solutions: Due to the current drought imperative, other waterless technologies will be explored in the 5-year term. Partnerships with reputable institutions e.g. Tertiary institutions, the Water Research Commission and others will to be included in agreements to ensure that the City remains the beacon in Africa for the provision of Water and Sanitation services. iii. Repairs and maintenance: The overcrowding (structures built over infrastructure), vandalism, foreign objects in sewers, unstable political environment and annual flooding makes regular maintenance difficult and time consuming in informal settlements. As a result, the ongoing maintenance and repairs to the existing infrastructure in Informal Settlements are resource intensive with longer response times. Many localised challenges exist in providing water and sanitation services to informal settlements, e.g. where households are on private property, in settlement areas of high density or high water tables or where grey water problems exist. iv. Installations: The city plan to deliver across the city over the next five years - Water supply via standpipes at an estimated R24m - Sanitation installations at an estimated R118m v. Capacity enhancement: Additional resources will be made available to the Informal Settlement Unit to enhance its capacity, of which the Expanded Public Works Programme (EPWP) is key. It is being embraced throughout the Department of Water and Sanitation to improve service delivery while also creating jobs and hence alleviating poverty. 12 Full flush toilets: 12,900 sanitation options will be installed in the coming five-years with full flush toilets being the first and preferable option where the situation allows. Other options will also be explored. 13 Electrification in the city is guided by the City and Western Cape Government (WCG) s Human Settlements Plans. These plans entail the provision of electricity to qualifying low-cost housing developments, informal settlements and backyard dwellings on City Rental Units within the metro. This function also covers the provision of infrastructure to enable electrification of qualifying sites with funding from both municipal and national resources. Currently, the bulk of the electrical connection backlog in informal areas is in the portion of the metro serviced by Eskom. 44
51 The urban form (i.e. the layout and density) associated with upgrading must cater adequately for the operation and maintenance of the municipal services described above; reduce fire hazards; and permit adequate access by both pedestrians and emergency and service vehicles. Where minimum service levels cannot be achieved due to encumbrances and risks (such as waterlogged or privately owned land, or settlements that are too densely populated to allow service access) the informal settlement must be reconfigured through re-blocking or other de-densification initiatives. Formal township establishment processes (i.e. land use approvals, surveying, approval of a general plan and the proclamation of the township) are followed even though township layout could differ substantially from the norm. This process is also essential for future funding applications to construct top structures and to normalise the property market and intrinsic asset value within a formalised land market. After the upgrading of an informal settlement there are a variety of options are available for the construction of permanent top structures. These include People s Housing Projects, individual ownership options, contractor built houses, rental accommodation and medium density options that may include rental and individual ownership options reflective of individual and community needs, affordability and aspirations. 45
52 Table B7: USDG Informal Settlements/ Upgrading and Backyarder MTREF Funding Commitments (Sorted by Estimated Yield) (29 March 2017 SAP PPM extract) WBS Element Project Name 3 phases in the UISP 14 Estimated Yield Revised Budget 2016/17 Revised Budget 2017/18 Revised Budget 2018/19 Revised Budget 2019/20 Fund Source Description CPX F1 UISP: Kalkfontein Informal Settlement * Phase ,000,200 38,000,000 17,000,000-4 NT USDG CPX F1 UISP: 8ste Laan -Valhalla Park * Phase ,502,900 33,000,000 4,500,000-4 NT USDG CPX F1 Incremental Development Area - False Phase ,400,000 10,600, NT USDG Bay CPX F1 UISP - Tambo Square, Gugulethu * Phase ,000, NT USDG CPX F1 Incremental Dev. Area - Ravensmead Phase ,900,000 1,100, NT USDG Park * CPX F1 IDA/UISP Sweethomes-Philippi * Phase ,500,000 35,000,000 35,000,000-4 NT USDG CPX F1 REB - BBT Section * Phase 3 Not yet available 4,500, NT USDG CPX F1 Reblocking - California, Mfuleni * Phase 3 Not yet available 1,900, NT USDG CPX F1 Reblocking - Santini, Mfuleni * Phase 3 Not yet available 2,070, NT USDG CPX F1 Reblocking - Tambo Square, Mfuleni * Phase 3 Not yet available 2,000, NT USDG CPX F1 BY-Backyarder Programme FY2018 ** Phase 3 Not yet available - 10,000, NT USDG CPX F1 CPX F1 CPX F1 CPX F1 Urbanisation: Backyards/Infrm Settl Upgr ** Urbanisation: Backyards/Infrm Settl Upgr ** Urbanisation: Backyards/Infrm Settl Upgr ** Urbanisation: Backyards/Infrm Settl Upgr ** * refer to Figure B13 for map ** refer to Figure B14 for map Phase 3 Not yet available 20,200, NT USDG Phase 3 Not yet available - 847, NT USDG Phase 3 Not yet available - - 5,000,000-4 NT USDG Phase 3 Not yet available ,000,000 4 NT USDG TOTAL 5,365 98,973, ,547,236 62,000,000 23,000,000 Only USDG 98,973, ,547,236 62,000,000 23,000, ) Community participation & planning; 2) Emergency services; & 3) Basic services installed (and housing construction only in selected cases). 46
53 Figure B14: Spatial Location of USDG-Funded Informal Settlements Upgrades (2016/ /20) 47
54 Table B8: Future Informal Settlement Project Pipeline (sorted by Estimated Project Cost / Yield) Project Name Yield Cost/hh (ZAR) Project Cost (ZAR) Status Target date for impleentation Construction Period/ months Comments Enkanini , ,995,000 Planning Application submitted 07/ De-densification site needed Monwabisi Park , ,005,000 VPUU 01/ De-densification site needed S-section , ,605,000 Pre-Feasibility 07/ De-densification site needed Barney Molokwana Section - Khayelitsha , ,585,000 Planning Application submitted 07/ De-densification site needed Doornbach , ,975,000 Planning Application to be submitted 07/ De-densification site needed The Heights , ,460,000 VPUU 01/ De-densification site needed Greater Strandfontein , ,750,000 Pre-Feasibility 07/ Greenfield Site Monwood - Philippi , ,730,000 Planning Approved - Detail Design to be done 01/ De-densification site needed Nooiensfontein Land , ,500,000 Pre-Feasibility 07/ Greenfield Site Lotus Park ,000 72,405,000 VPUU 01/ De-densification site needed Aloeridge - Mfuleni ,000 61,560,000 Planning Approved - Phase 1 - Detail Design to be done / Awaiting WULA for Phase 2 01/ Greenfield Site Driftsands (Los Angeles, Green Park, & Sopokama) ,000 57,690,000 Tenders called for Land Use Planning 01/ Existing settlement Mfuleni Ext ,000 46,935,000 Planning Approved 07/ Awaiting signing of MoA by Mfuleni community Phola Park Gugulethu ,000 32,445,000 Planning Application submitted 01/ De-densification site needed Backstage 1 & 2 - Khayelitsha ,000 32,220,000 Planning Approved - Detail Design to be done 01/ Greenfield Site Garden City - Mfuleni ,000 15,825,000 Planning Approved - Detail Design to be done 07/ Re-layout of existing layout to get better yield Hangberg (Hida Park) - Hout Bay ,000 24,300,000 Planning Application submitted 01/ Existing settlement Mfuleni Ext ,000 22,500,000 Land use planning to be done 12 Deep Freeze, Erf Macassar ,000 19,800,000 Planning Approved - Detail Design to be done 01/ Existing settlement/greenfield 4 in 1 - Wallacedene ,000 12,105,000 Planning Application submitted 01/ Existing settlement/greenfield Vygieskraal ,000 11,520,000 Land identification underway 01/ Must be relocated to Greenfield site Pook-se-Bos - Athlone ,000 8,550,000 Planning Application submitted 01/ Greenfield Site Wallacedene TRA - (Klein Akker) ,000 7,875,000 Planning Comments 07/ Greenfield Site Freedom Park ,000 6,750,000 Planning Application submitted 01/ Existing settlement Better Life - Mfuleni ,000 5,265,000 Planning Approved - Detail Design to be done 01/ Greenfield Site 6th Avenue - Kensington 88 45,000 3,960,000 Planning Application submitted 01/ Existing settlement/greenfield Eagle Bar - Strand 22 45, ,000 Planning Approved - Detail Design to be done 07/ Existing settlement Total ,358,300,000 48

55 Figure B15: Spatial Location of USDG-Funded Backyard Upgrades (2016/ /20) 49
56 One of the strategic approaches in terms of human settlements is opening up new areas for housing development within and adjacent to existing developed areas of Cape Town. The emphasis is in these new areas is on starter units that support incremental completion over an indefinite period and are at optimal densities. Where individual sites could not be developed in a formal upgrading project the City will prioritise the development of super-blocks which is an incremental development approach for the upgrading of informal settlements in manageable portions. This approach clusters pockets of informality within the greater informal settlement which allows for the provision of higher order and quality of services such as primary roads and installation of service connection to these pockets until the whole settlements could be serviced with one on one services. This is a systematic approach to ultimately upgrade and formalise the informal settlement to a settlement with 1:1 services for each residential site. Presently, in-situ upgrading initiatives are realising net densities in excess of 100du/ha on incremental sites (Table B9). Consideration is being given to 3-storey buildings along main roads (e.g. Monwabisi Park) to facilitate live/work units. These units are constructed on the basis of the resident running a small business/workshop on the ground floor and living on the first floor. A variety of top structure models on serviced sites have been discussed including a serviced site and wetcore (i.e. water and sanitation reticulation) and progressing to a serviced site, slab and firewall. Table B9: Land Utilisation of Current Upgrading Projects Project Circulation Res POS/Com Erf sizes Net density Sweethomes (In situ) 34% 56% 10% 45m² - 55m² ± 112du/ha Aloe Ridge (Incremental) 29% 59% 12% 75m² ± 133du/ha Reblocking and Emergency Housing Initiatives The City has also embraced an innovative re-blocking model to improve service delivery in settlements which cannot be formalised to full township standards and which reside on Cityowned property. The City aims to deliver to 1,000 households per annum via this initiative at an estimated cost of R30,000 per household. The Re-blocking processes are community-driven and reconfigure and reposition shelters that are densely located within an informal settlement. The planning is prepared and agreed to by the community. The implementation of this initiative is in partnership with the City and the relevant community and can be supported by recognised NGOs working within a specific community. Benefits of the re-blocking process have proven to be: A better utilisation of space; improved living environment of households living in informal settlements; courtyards and space for shared services; an appropriate distance between structures to prevent spread of fires; access and exit roads for emergency, service vehicles and community use; access to basic services (1:1 where possible); safer, healthier settlements; basis for formal upgrading (after future de-densification). Re-blocking initiatives are dependent on the self-mobilisation of communities. The community members and supportive NGOs are responsible for improved informal top structures and the City being responsible for the services and access tracks/roads. Projects will be identified within the targeted service delivery areas. Khayelitsha (TT, LB, WB and VT Sections) The City will continue developing Temporary Relocation Areas (TRAs), as well as Incremental Development Areas (IDAs) for families in need of emergency housing. Where possible this incremental approach to housing developments provides for one-on-one services. 50
57 Backyarder Initiatives: An additional focus is to improve service delivery to existing backyard dwellings associated with Community Rental Units (CRU). Desktop research by the City revealed that approximately 41,500 backyard structures are currently attached to CRUs, and 34,000 to privately owned houses. Those residing in these backyard structures have access to varying levels of service, ranging from none at all to full service access. Frequently, the level of service access depends on the relationship between the backyarders and their landlords. The City s commitments to structures associated with the City s rental stock extends to the provision and maintenance of water, sanitation, electricity and refuse removal. These facilities are provided in the form of a precast structure containing a flush toilet, a tap with a washing trough attached to it, electricity connections for up to three structures, as well as a 240 litre refuse bin per backyard. The initiative will be rolled out across the city where such installations are possible. The City is intent on addressing 2,000 households at a cost of R20,000 per household. Progress on this programme will be measured against the number of households benefiting from access to basic services. Institutional Arrangements: Resource Planning for Informal Settlements: Resource Planning To achieve the service delivery objectives above, each informal settlement needs to be allocated an underlying upgrade layout as part of the Upgrading of Informal Settlements Programme (UISP), which will inform and ultimately drive tenure and sustainable formal development, while ensuring access to education, health, business development, sport and recreation, and policing. An internal costing study revealed that the upgrade of all existing informal settlements, which comprise 191,590 households, would cost R19bn based on 1:1 service delivery and would require 1,828 ha of land as well as bulk and internal services. This cost excludes structures, amenities and operating costs finances. Table B10 illustrates the extent of land required for decanting and full relocation associated with the informal settlements programme. Region Ha of Land required for decanting Ha of Land required for full relocation Total % East Tygerberg % Helderberg / Khayelitsha % North / Blaauwberg % South Peninsula % TOTAL , Table B10: Land Requirements by region for Informal Settlements Programme Governance and Institutional Benefits of Upgrading Initiatives A recurring theme in discussions with and queries from National Treasury has been the derived financial and governance benefits to the City (e.g. revenue collection, progressive expansion of the City s rates base) accruing from the upgrading initiatives beyond just the social benefits. Present financial policy exempts revenue collection on houses valued less than R400,000 (this threshold is periodically reviewed). Accordingly, the absorption of households within informal settlements into a formal and structured property rates-base remains a long-term and speculative outcome. Nevertheless, there are some immediate, direct and in-direct savings accruing from the upgrading and servicing initiatives. With respect to informal settlements upgrade, immediate income is generated when free flowing water points are replaced with individual water connections. The installation of water meters also results in the water resource and cost savings accruing from the improved management of wastage from broken or inappropriately utilised communal standpipes. 51
58 Furthermore, water consumption can be pinpointed to individual erven and consumers as opposed to an unidentified group. This is also a benefit derived from the installation of ready boards to facilitate prepaid meter operations for electricity consumption. Indirect financial impacts relate to potential reductions in expenditure on reactive servicing of backyard structures, fires and patient care (as a result of improved living conditions decreasing rates of water-borne infections and diseases and fire risk) and solid waste management. These aspects also have an indirect impact on the environmental amenity and quality of neighbouring wetlands, retention ponds and stormwater systems Year Formal Housing Programme City IDP Commitments to Formal Housing Commitments to new market Human Settlements initiatives beyond upgrading initiatives described earlier in this section are defined in the City s draft Integrated Development Plan s Objective 3.1 that commits to excellence in basic service delivery and a housing programme premised on the following: 3.1.c.1 Densification Project 3.1.c.2 New Housing Development Project 3.1.c.3 Public-Private Housing Demand Project 3.1.c.4 Social Housing Safety Project 3.1.c.5 Housing Financing Options Project 3.2.c.6 Housing Function Assignment Project Strategic densification in targeted areas. Specifically in relation to transport corridors and priority nodes with supportive infrastructure and via incremental densification via second dwelling units. New Housing Development will encourage urban densification. All housing units are required to be designed so that they are adaptable, extendable and able to densify over time. Vacant land inside the urban edge also needs to be utilised more efficiently through infill initiatives, the release of unused land owned by other state departments, and promote mixed-use retail and residential development along key development nodes and transport corridors Engaging the private sector and national government to meet the level of housing demand and identification of new areas for housing development. Development of a safety model for rental stock aimed at reducing crime and disorder at social housing complexes. Considers different perspectives i.e. crime prevention, law enforcement, and social-based prevention by a wide range of stakeholders. Lobbying for subsidy and grant conditions to transform the end user s financing options in order to break dependency cultures process of assignment of human settlement functions to give full effect to the City s capabilities within the built environment. The City is intent on delivering 19,000 top structures in the period 2016/ /22 aligned to the national housing programmes as stipulated by the National Housing Code; the City s IDP and MSDF. Each project has been assessed and an appropriate mix of typologies determined via feasibility and design parameters. The alignment of all formal housing delivery mechanisms is important to ensure a range of housing typologies that provide various location and ownership options to housing beneficiaries. These are not only provided directly by the City as a developer, but also in partnership with the private sector through Section 21 company with the requirement to provide social housing, as well as in partnership with non-governmental organisations to assist with consolidation and PHP roll-out. The typologies are outlined in Table B11. The projects reflected in the capital budget are indicted in Table B12 and Figure B16. The Pelican Park mixed-use housing project is one example of this, and the South African Housing Foundation presented a special merit award to the City of Cape Town and Power Construction in recognition of their work to forge successful partnerships with all stakeholders for the benefit of the community. The Pelican Park project encompassed all housing categories, namely Breaking New Ground (BNG), Finance-Linked Individual Subsidy Programme (FLISP) and the affordable housing market. The project was also named best implementer of FLISP at the 2015 Western Cape Govan Mbeki awards Adapted from the Integrated Human Settlements Five-Year Plan July 2012 June /17 Review 52
59 Table B11: Human Settlement Typologies associated with 5-Year Formal Housing Programme Typology Description Funding Source / Programme Other requirements / pre-requisites Breaking New Ground BNG GAP / Finance Linked Individual Subsidy Programme -FLISP Social Housing Provides a minimum of a 40 m² RDP house (subsidised house built between 1994 and pre-september 2004) or a BNG house (house built according to the BNG policy, post- September 2004) to families on the City s database earning a combined income of between R0 and R3,500 per month, with the subsidy amount provided by the National Human Settlements Department. Administered by Province s Department of Human Settlements and available to households earning between R3,501 and R15,000 per month in order to purchase a serviced site or bonded house. Higher-density, subsidised housing implemented, managed and owned by independent, accredited social housing institutions in designated restructuring zones (for rental purposes). Critical to support City s TOD aspirations and secure rental properties in perpetuity for lower income households. Targets households earning less than R7 500 per month qualify. Utilises institutional and capital subsidies available in terms of the national housing programmes. Delivery occurs through the social housing institutions that have entered into partnership agreements with the City to build and manage the housing developments on the City s behalf. To date, the City has completed social housing projects in Steenberg, Brooklyn, Bothasig and Scottsdene. The Belhar social housing project is currently under construction and should be completed by December USDG / HSDG IRDP Enhanced PHP FLISP Social Housing Programme USDG Capital Restructuring Grant Tenure of serviced site and top structure provided for qualifying beneficiaries earning below R3,500 per month. Beneficiaries must be on the City s database and meet the requirements as prescribed in the National Housing Code. Implemented by private developers and bought by homeowners. Therefore, market demand in the location for a GAP product and appetite of financial institutions to fund FLISP houses critical. Can only be developed in designated Restructuring Zones Social Housing Regulatory Authority (SHRA) custodian of CRG dependent on allocation and support from this body) Social Housing Institution capacity to manage / maintain stock Quantum 2016/ /22 MTREF budget split 53
60 Table B11: Human Settlement Typologies associated with 5-Year Formal Housing Programme Typology Description Funding Source / Programme Other requirements / pre-requisites Communal Rental Units (CRUs) Open Market Sites Enhanced Serviced Sites New rental stock (including hostels) and the upgrade of existing higher-density stock. Caters for families who prefer rental housing and earn less than R3,500 per month. The City remains the owner of the rental units. (The programme includes the former hostels redevelopment programme.) Provides (i) basic services (water, standpipes and toilet facilities), (ii) permanent services to existing informal settlement areas, wherever possible (including in-situ upgrades). CRU USDG USIP Emergency housing programme Units have been provided where there has been a need for rental accommodation for non-qualifying households re: BNG or Social Housing Sites are provided in larger developments where there is a need to integrate the new development with an established community that reflects various income categories Afforded to qualifying beneficiaries below the age of 40 and those earning from R3,501 to R7,000 per month Quantum 2016/ /22 MTREF budget split 54
61 Table B12: Capex Budget Formal Housing Programme (29 March 2017 SAP PPM extract) WBS Element Project Name Phase Estimated Yield Revised Budget 2016/17 Revised Budget 2017/18 Revised Budget 2018/19 Proposed Budget 2019/20 Fund Source Description - 4 NT USDG C F2 Bardale / Fairdale Phase 5A Develop Construction ,000 1,100, Units - CPX F1 Belhar CBD Hsg Development (PGWC) Construction Not available 34,592,093 14,642,453-4 NT USDG - C F2 Belhar/Pentech Housing Proj: 350 Units Construction 350 7,500,000 6,280, NT USDG C F2 Delft - The Hague Housing Project Construction 10,12 6,000,000 5,000,000 2,000,000-4 NT USDG CPX F1 Dido Valley (535 units) Construction ,536,396 3,837,655-4 NT USDG - CPX F1 Fisantekraal Garden Cities Phase 2 Construction 4,320 12,560,000 10,000, NT USDG C F1 Gugulethu Infill Project Erf Construction 7,071 1,000, , ,240-4 NT USDG 8448/MauMau C F2 Hazendal Infill Housing Project Construction , NT USDG C F2 C F2 C F2 C F2 C F2 Heideveld Duinefontein Housing Project Kanonkop (Atlantis Ext12) Housing Project Manenberg Infill The Downs: Housing Project Morkel's Cottage Strand Housing Project Scottsdene New CRU Project Ph 2 of 350 Units Construction 738 1,000,000 3,750, NT USDG Construction 455 2,400, NT USDG Construction ,000 25, NT USDG Construction 562 8,514,000 17,595, NT USDG Construction 196 2,034, Prov House Dev Brd Construction ,500,000 4,372, NT USDG CPX F1 Valhalla Park Integrated Housing Project CPX F1 Pelican Park Phase 2 Housing Project Next1-5 years Not yet available 20,000 2,000,000 2,500,000 4,544,675 4 NT USDG C F2 Rondevlei Housing Project Not available Not available 66, NT USDG C F3 10 Ha Somerset West Hsg Project Planning 151 9,347, USDG CPX F1 Beacon Valley Housing Project - Planning 1, ,000 24,000,000 48,000,000 12,502,458 USDG Mitchell CPX F1 Blue Berry Hill Housing Project Planning Not available 20,000 2,000,000 2,500,000 4,000,000 USDG CPX F1 BNG: Housing Developments Planning Not yet available 3,008, EFF CPX F1 BNG: Housing Developments Planning Not yet available - 3,008, EFF CPX F1 BNG: Housing Developments Planning Not yet available - - 3,008,119 - EFF CPX F1 Bonteheuwel Infill Housing project Planning ,000 1,000,000 1,166,000 - USDG 55
62 WBS Element Project Name Phase Estimated Yield Revised Budget 2016/17 Revised Budget 2017/18 Revised Budget 2018/19 Proposed Budget 2019/20 Fund Source Description CPX F1 Conradie Hsg Development (PGWC) Planning Not yet available - 5,000,000 5,000,000 85,438,000 USDG CPX F1 Darwin Road Housing project Planning 4, ,000 2,000,000 1,500,000 - USDG C F1 Edward Street: Grassy Park Planning 104 2,750,000 1,287, USDG Development CPX F1 Elsies River Infill Housing Project Planning 1, ,000 1,000,000 2,170,688 3,500,000 USDG CPX F1 Forest Village (Blue Downs) Planning 5,268 25,086,880 10,444, USDG CPX F1 Hangberg Phase 2 Housing project Planning , , ,000 - USDG CPX F1 Harare Infill Housing Project Planning Not yet available 1,200,000 15,000,000 15,076,000 1,300,000 USDG CPX F1 Highlands Drive Infill Housing project Planning Not yet available 600,000 1,300, USDG CPX F1 Ilitha Park Infill Internal Services Planning Not yet available 450,000 9,500,000 6,799, ,000 USDG CPX F1 Imizamo Yethu - Hout Bay Housing Planning Not yet available 4,250,000 5,300,000 6,440,000 15,000,000 USDG Project CPX F1 Imizamo Yethu Housing Project (Phase Planning 696 1,615,000 6,600,000 2,015, ,000 USDG 3) CPX F2 Imizamo Yethu Housing Project (Phase 3) Planning 696-3,300,000 33,615,000 25,500,000 Prov House Dev Brd CPX F1 Kanonkop (Atlantis) Phase 2 Ext12 Planning 1,124 1,000,000 20,000,000 22,000,000 - USDG CPX F1 Land Acquisitions (HSDG) Planning Not applicable - 20, Prov House Dev Brd CPX F1 Land Acquisitions (HSDG) Planning Not applicable ,000 - Prov House Dev Brd C F2 Land Acquisition Planning Not applicable 3,480, USDG CPX F1 Land Acquisition Planning Not applicable USDG 153,555,072 CPX F2 Land Acquisition Planning Not applicable USDG 10,987,186 CPX F1 Land Acquisition Planning Not applicable USDG 38,098,910 CPX F1 Land Acquisition Planning Not applicable USDG 116,316,625 CPX F1 Land Acquisition Planning Not applicable USDG 250,000,000 CPX F1 Macassar BNG Housing Project Planning 2,469 2,000,000 28,380,000 42,570,000 33,110,000 USDG CPX F1 Mahama Infill Husing Project Planning Not yet available 400, , ,000 1,400,000 USDG CPX F1 Maroela Housing Project Planning 2,000 2,480,000 2,466,260 1,657,066 2,800,000 USDG 56
63 WBS Element Project Name Phase Estimated Yield Revised Budget 2016/17 Revised Budget 2017/18 Revised Budget 2018/19 Proposed Budget 2019/20 Fund Source Description CPX F1 Masiphumelele Housing Project Phase Planning 327 7,350,000 1,750, ,000 - USDG 4 C F1 Morningstar Durbanville Infill Housing Planning 160 5,000,000 2,802, USDG Project C F2 Ocean View - Mountain View Hsg Planning , USDG Project CPX F1 Sir Lowry's Pass Village Hsg Project Planning ,000 1,500,000 1,500,000 - USDG CPX F1 Vlakteplaas Housing Project Planning Not yet available 50,000 5,000,000 5,000,000 11,316,294 USDG C F2 Witsand Housing Project Phase 2 Atlantis Planning Not yet available 2,000,000 1,000, USDG Total 38, ,174, ,107, ,326, ,273,427 Only USDG 324,166, ,107, ,326, ,273,427 57

64 Figure B16: Capex Budget Formal Housing Programme (as at 27 March 2017) 58
65 Institutional Arrangements: Resource Planning for Human Settlements The financial requirements for the respective housing programmes are expressed in Table B13 and Figure B17. It illustrates the shortfall in funding to fund the project pipeline. Large parts of the implementation of all human settlement projects are funded by USDG and HSDG. Table B7 reflects the USDG-funding allocations specifically towards Informal Settlements/ Upgrading and Backyarder for the MTREF. Table B13: Capital Requirements 2016/ /22 USDG Market 2016/ / / / / /2022 New Rental Units / Hostels "CRU" New 20,848,170 27,573,388 25,098,388 BNG Housing Projects New 156,735,130 84,437,722 51,474,722 Current and New USDG Projects New 18,267,000 76,555,101 86,132,778 New USDG Planning Projects New 15,400,000 14,460,000 17,627,500 40,000,000 60,000,000 20,000,000 UISP & IDA Informal 134,060,012 99,347, ,000,000 TOTAL 345,310, ,373, ,333,388 40,000,000 60,000,000 20,000,000 Project Pipeline - Unfunded 110,407, ,017, ,415, ,369, ,619, ,726,667 Variance 234,902,812 70,644, ,081, ,369, ,619,167 83,726,667 USDG Approved Approved Approved Required Required Required Market 2016/ / / / / /2022 New Market New 211,250, ,026, ,333, ,426, ,126,667 Informal Market Informal 134,060,012 99,347, ,000,000 TOTAL 345,310, ,373, ,333,388 HSDG Approved Approved Approved Required Required Required 2016/ / / / / /2022 New Market New 663,586, ,819, ,247,000 Informal Market Informal 61,532,000 59,780,000 50,000,000 1,211,526,760 1,411,651,760 TOTAL 725,118, ,599, ,247,000 59

66 R Milions Figure B17: Capital Requirements 2016/ /19 160,000, ,000, ,000, ,000,000 80,000,000 60,000,000 40,000,000 20,000,000 0 New Rental Units / Hostels "CRU" BNG Housing Projects Current and New USDG Projects New USDG Planning Projects UISP & IDA 2016/ ,848, ,735,130 18,267,000 15,400, ,060, / ,573,388 84,437,722 76,555,101 14,460,000 99,347, / ,098,388 51,474,722 86,132,778 17,627, ,000,000 60
67 3.3 Economic Areas 16 With a gross geographic product of over R300bn and the second largest urban economy in Southern Africa, Cape Town plays a significant role in the regional economy. As a mid-sized, middle-income city on the international stage, Cape Town is highly interconnected with the rest of the world and strongly affected by developments in the global economy. The City is a service-driven economy, with services constituting 76% of the economy as of Official projections expect economic growth to grow from 1,8% in 2015 to 3,2% by 2020, driven by construction (average of 3,6% between ), business services (3,2%) and transport and communication (3,1%) 17. Economic growth forecasts over the medium-term will be sufficient to gradually absorb skilled and semi-skilled workers affected by the economic slump in certain sectors. However, in the absence of marked improvements to educational outcomes, this growth is unlikely to have any significant impact on the employment prospects for unskilled workers. In order to adapt to a low-growth future, Cape Town must reduce its vulnerability by optimising the potential for growth, productivity and innovation which arise from the spatial concentration of jobs, people and opportunities which enables household to access employment and higher quality public services 18. Cape Town s space economy comprises a network of inter-connected and inter-dependent productive centres or business nodes where the vast majority of the city s firms and formal jobs are clustered (Figure B18). Each of these nodes represent an ecosystem in which businesses are established, and, over time, flourish or fail. The performance of these ecosystems has a direct impact on the livelihoods of each of the 1.46 million-strong work force and their dependents. Indirectly, the attractiveness of these nodes to businesses is capitalised into revenue for the City in the form of rates and tariffs which, in turn, provide part of the necessary resources for the City to roll-out infrastructure and provide services to poor households. 16 Refer to Annexure 2 for maps reflecting the majority of capital projects which are on the City s, Provincial and SOE budgets, and how they spatially related to Areas of Economic of Opportunity. Table B14 reflects the ECAMP Monitored Nodes and Relative Performance. 17 Municipal Economic Review and Outlook Integrated Urban Development Framework add year, source/organisation 61
68 3.3.1 City of Cape Town s Economic Areas Management Programme (ECAMP) ECAMP was introduced by the City as a tool to guide the spatial targeting and prioritisation of area-based interventions across each of business precincts, tailored to local business opportunities and constraints. It is underpinned by two linked instruments, namely: a datadriven diagnostic model and prioritisation framework. Data-driven diagnostic model The diagnostic model (Figure B19) is a representation of the Cape Town space economy that helps us categorise and interpret data, enhance our understanding about spatial trends and create a common, short-hand language necessary to disseminate these insights. It involves the systematic assessment of business precincts current level of functioning in relation to two composite indicators: location potential and development performance. Whereas the location potential indicator measures the extent to which the precinct is aligned to the medium- to long-term location requirements (i.e. agglomeration, land supply, crime and grime, proximity and infrastructure) of the city s business sectors, the development performance indicator reflects the current level of market confidence in the area by measuring short-term price signals (i.e. sales, building work, rentals and rental growth, vacancies, etc.). The synthesis of the two composite indicators described above support the assignment of each business precinct to four quadrants, each representing a typical phase in the life-cycle of a business precinct: Growth zone: where a business precinct exhibits above-average location potential and above-average development performance; Consolidation zone: where a business precinct exhibits below-average location potential and above-average development performance; Transition zone: where a business precinct exhibits below-average location potential and below-average development performance; Opportunity zone: where a business precinct exhibits above-average location potential and below-average development performance. By classifying business locations in terms of their positioning along the cycle, the most appropriate local interventions for each precinct are identified and organized into areabased strategies. Prioritisation framework and toolkit Whereas the diagnostic model and the indicators which feed into it helps to identify the most critical barriers preventing private sector decision-makers from choosing particular urban locations to operate and invest, the prioritisation framework proposes actions that policymakers can take to remove these barriers and thereby attract more firms. The lifecycle approach recognises the role of government in ensuring that these transformations manifest in such a manner as to optimise broader developmental outcomes. The appropriate role of government in leveraging these market drivers is not static but evolves as the area transforms from one stage in the cycle to another: The four area-based strategies (Figure B20) are: Regeneration: stimulating market response to existing location potential by creating market certainty and fostering local initiative; Growth management: mitigating the effects of crowding on location potential by reducing congestion and discouraging inappropriate development; Business retention: mitigating the impact of functional obsolescence on vulnerable firms and workers though business promotion and worker mobility; Repositioning: improving location potential by facilitating functional repositioning through local stakeholder participation and ensuring that basic requirements for future investment are in place. 62
.")
69 Figure B18: Cape Town s economic topography City of Cape Town Diagnostic classification of business nodes based on location potential and market performance indices drawn from ECAMP Diagnostic Model based on criteria described in Rabe et al (2015). BRT trunks routes shown are not comprehensive but a subset based on connectivity between social mobility nodes and areas of medium-term economic potential. Trunk routes indicated are stylised. 63


, ECAMP")

70 Figure B19: Diagnostic classification of business nodes 20 Figure B20: Area Regeneration Approaches City of Cape Town (2016), ECAMP Business Location Platform. 21 Rabe, McGaffin and Crankshaw (2015) 64
71 IZ Designation Type Performance Potential Size CBD* VRC Commercial Growth Tygervalley Commercial Growth Century City Commercial Growth Claremont/Newlands Commercial Growth Bellville * VRC Commercial Opportunity Wynberg/Diep River Commercial Growth Mitchell's Plain ** MSE Commercial Transition N1 City VRC Commercial Transition Somerset West Cbd Commercial Transition Tokai Commercial Consolidation Sea Point Commercial Growth Athlone** MSE Commercial Transition Strand Commercial Transition Brackenfell Commercial Transition Kuilsrivier Commercial Transition Rondebosch Commercial Transition Fish Hoek Commercial Consolidation Khayelitsha MSE Commercial Transition Mowbray Commercial Transition Muizenberg Commercial Transition Kraaifontein Commercial Transition Table View Commercial Transition Durbanville Commercial Growth Montague Gardens Industrial Growth Killarney Gardens Industrial Growth Airport Ind MSE Industrial Consolidation Atlantis Ind Industrial Growth Parow Ind VRC Industrial Growth Sack's Circle Ind VRC Industrial Opportunity Athlone Ind Industrial Transition Ndabeni VRC/MSE Industrial Growth Philippi North MSE Industrial Opportunity Retreat Ind Industrial Transition Elfindale Industrial Consolidation Lansdowne Industrial Transition Kraaifontein Ind Industrial Consolidation Paarden Eiland VRC/MSE Industrial Consolidation Ottery Gardens Industrial Opportunity Capricorn Park Industrial Transition Blackheath/Kuilsrivier Ind Industrial Growth Brackenfell Ind Industrial Growth Epping Ind VRC/MSE Industrial Growth Triangle Farm/Stikland Ind VRC Industrial Growth Elsies River Ind VRC Industrial Opportunity Strand Halt Mixed Use Opportunity Goodwood/Parow VRC Mixed Use Growth Maitland VRC/MSE Mixed Use Growth Waterfront Mixed Use Growth Somerset Mall Mixed Use Growth Milnerton Mixed Use Transition Strand Onverwacht Mixed Use Transition Ottery Mixed Use Transition Kenilworth Mixed Use Consolidation Philippi East** MSE Mixed Use Transition Westlake Mixed Use Transition Hout Bay Mixed Use Transition Retreat Mixed Use Transition Sun Valley Mixed Use Transition Salt River VRC/MSE Mixed Use Opportunity * CBD as per Urban Network Strategy ** Urban Hub as per Urban Network Strategy Table B14: ECAMP Monitored Nodes and Relative Performance 65
72 By closely monitoring and analysing the location potential 22 (i.e. unique assets and constraints) and market performance 23 of these business nodes over time (Figure B20), the City can intervene more intelligently, tailoring responses to differentiated circumstances, and thus realising a great prospect for success, whether to retain existing businesses or attract new investment Spatial concentration of knowledge economy The space economy has entered a phase of spatial consolidation, with the knowledge economy increasingly concentrated in Cape Town Central Business District (CBD), Salt River- Woodstock, Tyger Valley and Century City (Figure B21). Since 2005, approximately two out of three new office-bound jobs were located in these areas, despite a dramatic increase in road congestion and land values. The CBD, to which 200,000 people commute every working day, remains by far the most significant concentration of business and employment in the city and the region. It ranks alongside Sandton, Johannesburg as one of the few business locations in Southern Africa which has the intrinsic locational qualities required to compete successfully at a global level, attracting inward investment, visitors and scarce skills from abroad. It is an economic engine which helps drive employment across the city as a result of the demand for goods and services. The total current value of property in the CBD has grown from R6.1bn in 2005 to R24bn in , generating over R250 million in property rates per month. The residential population within historical business precincts has grown significantly in recent years from almost non-existent 10 years ago to nearly 20,000 today 25. However, the CBD is growing at a much slower rate than the less congested regional nodes of Tyger Valley and Century City, which have enjoyed the bulk of general corporate office and retail development since Investment in connective infrastructure to the CBD and the other commercial growth nodes will deepen and extend the geographic spill over of agglomeration benefits beyond their immediate neighbours and reinforce the greater inner city stretching from Maitland to Bellville. In terms of economic regeneration, local areas must build on their existing assets and strengths, whilst correctly diagnosing and addressing constraints to investment. The use of public funds for place-based economic interventions is inherently inequitable as it disadvantages nonpriority areas; for this reason, such interventions must be targeted at those areas where there are well-defined binding constraints and a credible chance of building a self-sustaining business node within the short-to-medium term: carefully targeted government investment will only carry the local economy to the tipping point, after which market-led regeneration must take root to continue to attract businesses and generate employment at scale well after the grant funding and incentives have shifted to other priorities Location Potential is a composite, weighted indicator which includes the scale, intensity and complexity of economic activity, room for growth, proximity to markets, skills, disposable household income and regional economic gateways, congestion, infrastructure constraints and the incidence of crime affecting businesses. 23 Market Performance is a composite, weighted indicator which includes non-residential rentals and rental growth, vacancy, building development and property sales. 24 Nominal values 25 State of Central City Report (2016) 26 Moretti. The New Geography of Jobs (2012) 66

73 Figure B21: Non-residential development 67
74 3.4 Marginalised Areas 27 The City s SDF which is under review proposes a Growth Management Framework (Figure B22) which considers areas in relation to particular attributes and desired spatial outcomes. Marginalised Areas (referred to as Social Mobility Area) have been determined based on the following informants: Social Development Strategy, Socio-Economic Index, Informal Settlement Upgrading Programme and the Integrated Human Settlements Framework. The key emphasis and desired outcomes of these areas are: Implementation of programmes which enhance social and economic mobility. Diversification of mono-use residential patterns. Service upgrading, local economic development and poverty alleviation. Facilitation of a range of human settlements interventions (delivery methods, partnerships, typologies etc.). Social infrastructure backlogs and operational deficiencies addressed. Elimination of non-essential regulatory constraints on informal economic activity within poorly-located marginal areas. Extension of effective urban management practices and programmes. Unlocking development of large-scale economic opportunities within close proximity to areas of social need. Streamlining of regulatory requirements to support and facilitate formal densification that is taking place in settlement. (e.g. Boarding house developments in DuNoon) In addition, last year s BEPP submission identified the following marginalised areas within the respective Integration Zones Marginalised Areas within MSEIZ: Philippi, Khayelitsha and Gugulethu located within the MSEIZ account for some of the City s most marginalised communities as defined by the Socioeconomic Index based on Census Similarly, a number of sub-places within these areas are amongst the highest household and population densities within the city e.g. Kosovo and Sweet Home Informal Settlement (Philippi) and Zondi in Gugulethu. Many areas targeted by the Mayoral Urban Regeneration Programme 28 fall within this Integration Zone. Marginalised Areas within VRC: Although the socio-economic profile is not as vulnerable as the broad MSEIZ profile, the VRC has been susceptible to urban decay and in need of structured management approaches to support and stimulate investment and re-investment. A number of informal settlements are located within the VRC namely: Koekoe Town (98 households), Maitland cemetery (113), Royal Plakkers Kamp (172), 6th Avenue, Kensington (189), Wingfield Camp (235), Appelboord (359), and Gaza (378). 27 Please refer to Annexure 2 for maps reflecting the majority of capital projects which are on the City s, Provincial and SOE budgets, and how they spatially relate to the Marginalised Areas. 28 See Section F: Precinct Management 68

75 Figure B22: Growth Management Framework (concept and subject to change) 69
76 C. INTERGOVERNMENTAL PROJECT PIPELINE 29 Work completed under the auspices of the City s Growth Management and Transit Oriented Development (TOD) Working Group and an Inter-Governmental Working Group evaluated candidate mixed-use property projects City and Provincial Departments. Five City and two Provincial projects / locations have been prioritised from these candidate projects. Each requires a broad spectrum of development partners in both the public and private sector. The scale and sequencing of the projects will be refined in due course: the alignment of public resources and infrastructure to support the objectives will be essential for the pipeline to materialise and yield tangible results. Each of the projects is described in Table C2. Figure 2A in Annexure 2 spatially indicates the spatial targeting areas in relation to the priority projects. Table C1 indicates the progress on the implementation scale for each of the Catalytic Projects with respect to preparedness. 29 The intergovernmental project pipeline consists of both catalytic and standard projects (not all projects, only that of a strategic/priority nature) within the metropolitan space whether it is a project of the national, provincial or metropolitan government, or that of a public entity. The main purpose of the pipeline is for it to incorporate projects from all spheres and entities to prioritise collective public investment in particular spaces. (Source: National Dept. Treasury BEPP Guidelines 2017/ /20) 70
77 Priority Precinct / Targeting Intervention TOD Gamechanger Catalytic project identification: Catalytic projects Estimated Pre-Project Inception Preparation Implementation Commercial Estimated Res Need Development Strategy Programme Identification Selection Prioritisation Concept Pre- Feasibility Detailed Procurement Construction Handover /Retail GLA Units Identification Approach Definition Feasibility Design / Contract sqm APS / MSEIZ Athlone Power Station 303,895 1,177 BDIZ Delft CBD, Belhar Road redevelopment 18, Bellv ille / VRC Bellv ille Park Campus dev elopment 650,000 Undetermined Bellv ille / VRC Bellv ille 6, Bellv ille / VRC Stikland Hospital 83,856 4,717 Bellv ille / VRC Stikland Triangle 47,107 - CBD Granger Bay: Cape Town Stadium 29,060 - CBD Somerset Precinct Dev elopment 253,000 1,450 CBD Gallows Hills Redev elopment 25, CBD Ebenaezar Depot 5, CBD Three Anchor Bay Precinct 80, CBD Foreshore Precinct / CBD MSEIZ Kapteinsklip 21,800 1,200 MSEIZ Lentegeur social housing 1, MSEIZ Khayelitsha Business District expansion. 10,000 - MSEIZ Khayelitsha Industrial Park (proposed) 59,101 - MSEIZ Phillipi PTI MSEIZ Athlone CBD redev elopment 14,800 - MSEIZ Mowbray golf club 17,545 2,075 Paardev lei Paardev lei (AECI land) 528,460 14,471 Phase 2 IRT Ottery 130, VRC Conradie Hospital 213,000 3,603 VRC Salt Riv er social housing 2, VRC Two Riv ers Urban Park 537,262 6,278 VRC Tygerberg Hospital 165,000 7,500 VRC Wingfield 344,400 11,625 VRC Maitland Abattoir 95,230 - VRC Parow Golf Course 56,700 1,913 Total 3,699,969 60,455 Need Identification Dev elopmen t Approach Strategy Programme Definition Identification Selection Prioritisation Concept Pre-Feasibility Feasibility Detailed Design Procurement Construction Handov er / Contract Pre-Project Inception Preparation Implementation Table C1: Catalytic Projects Preparedness 71
78 Table C2: Priority Projects 30 Details of projects in Annexure 2 Spatial Targeting Theme Project Description Estimated Value Project Lead Estimated GLA Yield Estimated Residential Yield Voortrekker Road Integration Zone Metro South East Integration Zone Blue Downs Integration Zone Economic Node (proximity 500m) Urban Development Zone Transit Accessible Precincts A Athlone Power Station The intention is that this project includes both public and private investment. The public focus will be on infrastructure and the private on the development to the extent feasible. Both will contribute to social/ affordable housing in the project. R5,25 billion 2010 Pre-feasibility Study at 2010 rates City 303,895 1,177 X B Bellville The public sector investment will be in a multi-modal public transport interchange including the upgrading and modernisation of the PRASA station. The estimated initial investment is R35m which is intended to catalyse development of the adjacent City owned land the Paint City site and air rights above the public transport infrastructure. Ideally the development would be private sector-led. R2bn City 6, X X X X C Conradie Hospital This project envisages the development of the 22 hectare former Conradie Hospital site into an integrated, sustainable, and affordable residentially-led, mixed-use neighbourhood. This multi-million rand project will be developed through a partnership between the Western Cape Government, the City of Cape Town, and the private sector. Province 213,000 3,603 X X X D Foreshore / CBD City contributes land and enhanced development rights in Sites exchange for a private sector driven development that addresses accessibility and inter alia contributes towards affordable housing provision in the inner city. Pre-feasibility work is underway on three sites, namely: Gallows Hills, Ebenezer Depot and Three Anchor Bay Precinct. The intention is that all are developed by the TBC City TBC TBC X X X X X 30 A full project summary of each of these projects is included as Annexure 1 in this BEPP 72
79 Spatial Targeting Theme Project Description Estimated Value Project Lead Estimated GLA Yield Estimated Residential Yield Voortrekker Road Integration Zone Metro South East Integration Zone Blue Downs Integration Zone Economic Node (proximity 500m) Urban Development Zone Transit Accessible Precincts private sector. The extent of public sector investment will be determined by what is needed to catalyse the developments (in addition to the extensive public transport investment made into the existing Atlantic Seaboard) and to secure affordable housing provisions. E Paardevlei This site, acquired by the City is intended to be developed in R18 billion City 528,460 14,471 partnership with the private sector. The nature of the development will be determined by market feasibility and the private sector s ability to ensure affordable housing provision within the development project. X F Philippi East The City s investment will be via the MyCiti infrastructure investment in a multi-transfer interchange the equivalent of 5 pods and 6 trunks interchanging at the site. This infrastructure will include development of air rights above the station and is intended to catalyse private investment in the adjacent properties that this major metropolitan station will bridge. R100m City X X G Two Rivers Urban Park (TRUP) TRUP is located along the banks of the Liesbeek and Black R15 billion 31 Province 537,262 6,278 Rivers and comprises +/- 250 ha of land. As a mixed-use integrated development at scale, it will require significant public resources to address existing infrastructure constraints and support an off the grid approach are key challenges. X X
80 1. Current Operational Spend on Catalytic Project Pipeline The following projects are presently being funded to support planning and technical studies to advance the feasibility aspects of the respective projects (Annexure 4 contains further information): 1. Athlone Power Station: For Framework, Engineering Services, Environment and Land Use Planning 2. MSE Integration Zone Strategy and Investment Framework: Provision of Professional Services in Respect of the Development of a Strategy and Investment plan for the Metro South - East Integration Zone 3. TRUP: Professional fees 4. Conradie: Professional fees 2. Existing Co-ordinating Forums and Arrangements At a more general level the City s BEPP Technical Steering Committee includes the National Treasury and the Western Cape Government (The Provincial Treasury and the Department of Environmental Affairs and Development Planning, the latter responsible for coordinating planning within the Western Cape Government). The process of preparing the annual BEPP includes bilateral engagements with the relevant Western Cape Government departments investing in Cape Town, national government departments as well as state owned enterprises). Summaries of these interactions and a reflection of the broader investment plans from the other public sector partners within Cape Town are included in Section D which reflects capital funding commitments across the public sector. The City has a number of forums through which it facilitates strategic alignment in planning, resource allocation and implementation that endeavours to achieve a coordinated intergovernmental project pipeline. These include inter-alia: An Inter-governmental Working Group was established in 2015 to assess and prioritise catalytic projects located on the provincial and city owned land to support the strategic objectives of both parties and in particular Transit Oriented Development. The working group was supported and informed by an analysis undertaken by KPMG to determine the project readiness of the numerous candidate projects. The support from KPMG was made under the auspices of the Cities Support Programme (CSP) as a component of the Capacity Support Implementation Plan. In the Transport Sector, the Transport and Urban Development Authority host the Land & Transport Advisory Board and Inter-Modal Planning Committee (IPC) which includes the Western Cape Government and all public transport providers (i.e. PRASA, Transnet, the mini bus taxi industry and Golden Arrow). These structures are supported by a number of sub-committees focusing on: operational coordination; forward planning coordination; transit oriented development and land value capture; safety coordination around. The City has a Memorandum of Action with PRASA that supports the implementation of the following collaborative projects and programmes: o The Infrastructure Investment Programme includes all the planning, design and implementation of the Blue Downs Rail link, Fisantekraal line, Bloekombos Station. o The Modernisation Programme and the Rolling Stock (new and refurbishment). 74
81 o o The Operations Management Programme facilitates projects such as the Protection of Rail Reserves, Operations Integration and Management Reporting, Railway Crossings and NMT. The Strategic Investment Interventions projects include TOD and Trail Station Typologies, Integrated Ticketing, Strategic Land Management and Investment Packaging, Branding etc. The City has a Memorandum of Understanding with the Transnet Ports Authority which commits the City and the Cape Town Port to joint planning. From this process a Revisioning of the Port Gateway Precinct was completed in ACSA have been facilitating inter-governmental engagement on the viability of an aerotropolis in Cape Town and what the conceptual approach to this would be in the Cape Town context, with strong participation from the City and Western Cape Government. Discussions around the planning and use of strategic ACSA-owned land - the Swartklip site - to the south of the airport are also at an advanced stage via a technical integrated planning meeting. There are established structures that ensure regular coordination between the City level, provincial and national Departments of Human Settlement. The inter-governmental pipeline of human settlements projects in Cape Town has been submitted to the National Department of Human Settlements and is understood to be accepted. The City and the Western Cape Government have identified the need to set up a regular forum specifically for facilities planning aligned to the City s development plans, human settlement development plans in particular and understanding prevailing growth trends. The sequencing of informal settlement upgrading is currently directed via the City s Informal Settlements Matrix, a detailed database reflecting the development suitability and community statistics for all informal settlements. All of these efforts at inter-sectoral and inter-governmental coordination serve to maintain positive working relations and mitigate against the risks of uncoordinated investments. NB: Attendance records of the BEPP Technical Meetings and external engagements are available on the City SharePoint site and available on request to external role-players as evidence of the intra-sectoral municipal co-ordination. 75
82 D. CAPITAL FUNDING 1. Overview The City of Cape Town s Conditional Grant Funds emanate from both National Government, via the various national sector departments/national Treasury, as well as the Provincial Government: Western Cape. All Conditional Grants received by the City of Cape Town are extensively tested for alignment against approved policy and strategy including the Integrated Development Plan, Transport Orientated Development Strategic Framework; Integrated Human Settlements Framework; Spatial Development Framework. Grants within the City are aligned to strategy and synergised against the City s own funds (e.g. Capital Replacement Reserve - CRR and the External Financing Fund - EFF) whereby all available funds are strategized to maximise service delivery in a manner that provides for Grant and City funds to be used in a manner that ensures both the long term financial sustainability of the City and strategic delivery imperatives, with a special focus on previously disadvantaged areas. Key financial issues like the cost of money, via interest charges, form an informant regarding grant funds utilisation within the envelope of, inter alia, the DORA and the package of all funds used across the City. Long term financial sustainability is further emphasised within the City s Grant Funds governance processes as the funds review process requires all grant fund applicants to commit to the long term operating management and maintenance of all infrastructure developed with City/Grant capital funds. The long term contribution by the City ratepayer in terms of operating commitment over the life of a capital asset created cannot be underestimated (e.g. clinic) The City s various governance interfaces also strongly focus on the allocation of grant funds to key strategic and catalytic projects by way of, inter alia, the City s Budget Strategy Meeting (BSM) and Budget Steering Committee (BSC) both of which Committees comprise senior politicians and senior officials which carefully scrutinise budget submission alignment to strategy, linkages to City funds availability and subsequently provide direction regarding the allocation and focussed use of grant funds. All grants received are administered against the foundation of the Division of Revenue Act and Grant Fund Frameworks/Policies and Provincial Gazette s. The City is not an island and, as a consequence regularly engages with the National and Provincial Government with the aim to identify opportunities where mutual delivery can maximise project and services delivery given the strategic nature of the various assets (e.g. land) held by both the City and Province. Project maximisation and integration takes place by way of co-funded (City and Province) projects utilising, inter alia, specialist skills and systems. Grant funds support this integrated development approach noting that, where required, the final asset created by Province must, as per contract, be transferred to the City for ongoing asset management and maintenance as per the provisions of inter alia the MFMA and grant conditions and as aligned to financial treatment advice from the National Treasury. Nowhere is this collaboration more important than within the integrated human settlements environment where provincially owned strategic land parcels which are well located are accessed for human settlement development by the province with the financial support of the City, accessing applicable funds (e.g. HSDG, USDG) and allow for the structured development, within City boundaries, of integrated housing projects. The recent announcement of catalytic human settlements related projects further supports this developmental and funding relationship. 76

83 In addition, Provincial grant funds, for various key City delivery imperatives, also form a significant pillar within the financial mix for certain capital and operating projects whereby the City is expanding on, inter alia, its community facilities through the use of City capital funds, USDG funds and the applicable provincial grant funds for the development of key infrastructure within areas lacking in social facilities (e.g. clinics, libraries, community halls etc.) The City applies a stringent governance process and is currently exploring the expansion of its administrative governance processes targeting all Grant receipts in order to support a consistent and compliance focussed governance process whilst ensuring alignment to Grant Fund Frameworks for all national and provincial grants. The recent introduction of the Capital Project Monitoring Systems (CPMS) provides a strong mechanism against which major capital projects are pre-assessed, monitored during development and subsequently reviewed against deliverable and project imperatives (financial and non-financial). This is a key new governance and control element for all City and supports the assurance that budgetary allocations are expended within the financial (DORA/Gazette) allocation period. Certainty of long term funding remains an area of concern within the current economic environment wherein project pipelines and subsequent commitment cannot be placed at risk through reductions to grant fund allocations to the City by either National or Provincial Government. Further, this funding commitment, given the nature of many large capital projects, must extend beyond the MTREF horizon, ideally at least 5 years. 2. Spatial Budget Mix The City s capital funding is sourced from four primary sources, namely: Grants, the Capital Replacement Reserve (CRR), the External Financing Fund (EFF) and Revenue. Grant funding presently represents 38% (R6,95bn) of the R18,38bn capital spend of the City (over the 2016/ /19 MTREF period). Although it remains a significant percentage of the total capital funding this contribution has declined as a percentage in recent years: grant funding as a percentage of total budget has declined from 45% for the period 2014/ /17 to 38% for the 2016/ /19 period. The EFF and CRR contributions have increased by 3 and 4% respectively in that same period (Figure D1). Figure D1: Budget Sources and Contributions to Capital Spending Source: CCT: 15 Jan 2016: Adjustments budget Jan 2016/17 included The Urban Settlements and Human Settlements Development Grants (USDG/HSDG) and Public Transport Network / Infrastructure Grants (PTIG / PTNG) continue to represent 90% or greater of the grant funding available over the MTREF (Figure D2 and D3). Table D1 contains the details of projects funded under the ICDG grant per Integration Zone. Similar Table D2 for NDPG and Table D3 for INEP. 77
 2015/16-2017/18 (3 years with base as 2015/16) 2016/17-2018/19")

84 Figure D2: Grant Proportional Contributions to Capital Spending Source: CCT: 15 Jan 2016: Adjustments budget Jan 2016/17 included 3-year Total Capital Cycles (Jan 2017) Millions 4,500 4,000 3,500 3,000 2,500 2,000 1,500 1, USDG/ HSDG PTIG Private Sector NDPG INEP Other ICDG 2014/ /17 (3 years with base as 2014/15) 2015/ /18 (3 years with base as 2015/16) 2016/ /19 (3 years with base as 2016/17) Figure D3: Budget Grant Sources and Contributions to Capital Spending 3. City s Grant Specific Spatial Focus Due to programmatic level management of the budget, the majority of bulk votes cannot be spatialised. Work in underway with the SAP-based Project Portfolio Management System (PPM) to enable Project Managers to geo-reference the location and the impact area of the capital investment. This system is in the advanced stages of design and implementation and will inform future BEPP reviews. Figures D4 and D5 indicate the current financial year s approved budget and expenditure to date. Figure D6 reflects the spatial location of the capital projects per directorate. With the intention to spatialise at least the project specific location per grant programme, the Figures D7, D8, D9 and D10 illustrate the location of different grants, namely the Public Transport Network Grant / Public Transport Infrastructure Grant (PTNG/ PTIG); Urban Settlement Development Grant (USDG); Integrated Network Electrification Programme (INEP); Integrated City Development grant (ICDG); and Neighbourhood Development Partnership Grant (NDPG). 78
85 Figure D4: Approved budget 2016/17 (as of 27 March 2017) 79
86 Figure D5: Actual Expenditure 2016/17 (as at 27 March 2017) 80
")
87 Figure D6: Directorate Funding (2016/ /20) 81
88 Figure D7: CCT s PTIG/ PTNG Grant locations 2017/ /20 82
89 Figure D8: USDG Grant locations 2017/ /20 83
90 Figure D9: ICDG Grant locations 2017/ /19 84

91 Figure D10: NDPG Grant locations 2016/17 85
92 WBS Element WBS Element Description Intergration Zone Phase Approved Budget 2016/17 Proposed Budget 2017/18 Proposed Budget 2018/19 Proposed Budget 2019/20 Fund CPX F1 CCTV Installation Goodwood FY17 MSE Implementation 2,084,250 4 NT ICD CPX F1 Shotspotter installation MSE Implementation 8,000,000 8,000, NT ICD CPX F1 Upgrade Manenberg Integrated Project MSE Implementation 5,000,000 10,000,000 2,100, NT ICD CPX F1 Upgrade of the Manenberg Precinct MSE Implementation 5,000,000 8,000, NT ICD CPX F1 Upgrade: Sagaloda Park, Philippi MSE Implementation 2,000,000 2,000, NT ICD CPX F1 Upgrading B/heuwel TC and Pedestria Link MSE Implementation 500, NT ICD CPX F1 Wallflower Park incl Landscaping of AZ B MSE Implementation 1,000, , NT ICD CPX F1 Upgrade Gugulethu Integrated Parks MSE Planning 0 0 7,000, NT ICD CPX F1 CCTV Installation & Upgrade FY17 VRC Implementation 5,000,000 4 NT ICD CPX F1 Maitland Cem Public/ Visitor Info Centre VRC Implementation 2,512, ,000 5,000, NT ICD CPX F1 Smart Trees Programme VRC Implementation 2,000,000 2,534,000 3,000, NT ICD CPX F1 Upgrade: Elizabeth to Jack Muller Park VRC Implementation 2,000,000 13,000,000 3,700, NT ICD CPX F1 Upgrading of Voortrekker Road islands VRC Implementation 1,000,000 1,000, NT ICD CPX F2 Bellville: Public Transport Hub VRC Planning 487,394 1,000, NT ICD CPX F1 Koeberg Road Switching Station Phase 3 VRC Planning ,179, NT ICD CPX F1 Kruskal Avenue Upgrade, Bellville CBD VRC Planning & Implementation 1,500,000 1,100,000 13,760, NT ICD CPX F1 CCTV Installation & Upgrade FY18 VRC & MSE Planning 0 5,000, NT ICD CPX F1 ICDG Capex programmes VRC & MSE Planning ,917,000 4 NT ICD TOTAL 38,084,250 52,318,650 56,740,000 59,917,000 Table D1: ICDG Planned Investment per Integration Zone 86
93 WBS Element WBS Element Description Integration Zone Phase Approved Budget 2016/17 Proposed Budget 2017/18 Proposed Budget 2018/19 Proposed Budget 2019/20 Fund C F1 Kuyasa Library Precinct:Walter Sisulu Rd MSE Implementation CPX F1 Lentegeur & Mandalay Station PTI's:Dsg MSE Implementation C F2 Mitchell's Plain Station TI MSE Implementation 650,000 5,000,000 3,000, NT NDPG NT NDPG NT NDPG CPX F1 Stock Road NMT MSE Implementation CPX F1 CPX F1 CPX F1 NDPG Capt Programme F2018 NDPG Capt Programme F2019 NDPG Capt Programme F2020 Table D2: NDPG Planned Investment per Integration Zone To be determined To be determined To be determined 3,565, NT NDPG Planning 2,109, NT NDPG Planning 0 30,000, NT NDPG Planning ,093,000 4 NT NDPG TOTAL 12,215,000 2,109,000 30,000,000 58,093,000 WBS Element WBS Element Description Intergration Zone Phase Approved Budget 2016/17 Proposed Budget 2017/18 Proposed Budget 2018/19 Proposed Budget 2019/20 Fund C F3 Electrification 0 5,000, DME - INEP CPX F3 Electrification 0 0 5,000, DME - INEP CPX F3 Electrification ,000,000 4 DME - INEP Table D3: INEP Planned Investment per Integration Zone TOTAL 0 5,000,000 5,000,000 19,000,000 87
94 4. Investments by Western Cape Government and SOEs The Western Cape Government (WCG) Department of Treasury is represented on the BEPP Technical Committee and has been jointly responsible for annual bi-laterals and communication of the investment nature and scope of the Provincial budget. In October 2015 and October / November 2016 the City in collaboration with key WCG departments met to discuss investment plans that impact on the City and to understand the alignment of these across the respective spheres. This was in addition to the work and institutional arrangements associated with the Catalytic Project Pipeline considered in Section C completed in 2015/16. Each Department was invited to respond to and present a pro-forma presentation template reflecting the following questions. Task 1: Comments on May 2015/16 and May 2016/ 17 BEPP documents Task 2: This is my budget (consecutive 3 year-cycles 2015/16, 2016/17, 2017/18, 20118/19). This is how it looks in space/geography! This is my long term plan. My priorities are x y z. I am driven to them by who/ what? What/ who/ how can my priorities be changed? What prevents me from operating in an ideal world? (institutional, legal, policy, direction of other sectors, political priorities ) These are my top 3 projects and they are located here. Task 3: How do you determine the priorities for capital investment in your sector? Explain the criteria used for the prioritising of capital budgets. What is the role of the City s department (if co-mandated) in the prioritizing process and what are the co-dependencies between City and Province if not co-mandated? How can the City be more involved in collaborative planning? In November 2016, the City s strategic and spatial logic for restructuring the apartheid City derived from the IDP process and emphasising the spatial targeting messages of the BEPP were presented to the SOEs and Provincial Departments at a workshop session. The location of the budgets of SOEs such as PRASA, ACSA, ESKOM as well as the Provincial Government Department are reflected in the following section. Data reflected in the Figures below were obtained from the Inter-Governmental Sessions between the City s BEPP process and the SOE/C in December Note: the budgetary periods from each submission vary based on information available in January March NB: The City has at hand extensive evidence of consultation and inputs received from the SOEs and Provincial departments. Should additional information be required this is available internally via the BEPP SharePoint site or via a request to the BEPP Coordinator. 88

95 Figure D11: WCG Human Settlements Budget Priority 2017/ /20 89

96 Figure D12: HSDG Proposed Budget 2017/ /20 90

97 Figure D13: WCG Health Budget Priority 2017/ /21 91

98 Figure D14: WCG Roads Budget Priority 2017/ /20 92
99 Figure D15: WCG Education Budget Priority 2017/ /20 93
100 Figure D16: ESKOM Budget Priority 2017/ /20 94

101 Figure D17: ESKOM Budget Priority 2017/ /20 95

102 Figure D18: PRASA Budget 2016/17 96

103 Figure D19: ACSA Budget 2017/ /22 97
104 E. IMPLEMENTATION 1. Land Availability In support of the implementation of the Human Settlement initiatives, qn assessment of land availability was concluded during 2016 updating an existing 2013 database. The assumptions and summary of city-wide land resources are highlighted in Tables E1, E2 and E3. 98
105 Table E1: Summary by Stage of Development Stage of Potential yield: developme total units nt Land available - usable area (ha) (Site and Service; BNG; Social; Gap) * In planning ,198 (3,392; 17,862; 6,033; 14,821) 1-5 years 2, ,952 (26,260; 36,425; 25,448; 19,843) Long term 3, ,327 (33,574; 41,915; 32,223; 33,630) Total 6, ,477 (63,226; 96,202; 63,704; 68,294) Comments Approximately 944.8ha of land is considered to be available in the planning stage, with the majority located in the Northern (est ha), and Khayelitsha / Mitchells Plan Greater Blue Downs Districts (est ha) followed by Blaauwberg (est. 82.9ha). Land that could potentially be considered for the initiation of planning in a 5 year horizon is likely to be derived from an estimated ha of property identified. The majority of this land is located in Khayelitsha Mitchells Plan / Greater Blue Downs (est ha), Blaauwberg (428.6ha) and Cape Flats (est ha) and Helderberg (est ha). This however is dependent both on whether land in the long term category may be prioritized and accelerated into initiation within a 1-5 year horizon (along with site challenges overcome) and on whether further investigations and planning on sites within the 1-5 year horizon result in them potentially falling out of the pipeline. Land that is considered likely only to be suitable for consideration for the initiation of planning in a longer term horizon is estimated at ha. The majority of this land is located in Helderberg (est ha) and Blaauwberg (est ha) followed by the Cape Flats (814.3ha) Khayelitsha Mitchells Plain Greater Blue Downs (est ha) and the Northern Districts (est ha). Approximately 6050ha of land has been identified for potential human settlements purposes. The majority of this land is located in Blaauwberg (est ha), Khayelitsha Mitchells Plain Greater Blue Downs (est ha), Helderberg (est ha) Cape Flats (est ha) and Northern District (est ha). One should be cautious regarding the assumption that the scale of land identified, particularly in districts such as Khayelitsha Mitchells Plain Greater Blue Downs is considered final. There are potentially site level informants that may militate against the development of portions of this land which may only become evident when detailed planning is undertaken. Furthermore, targeting only the largest land holdings may lead to sub-optimal outcomes in terms of meeting the challenges set out by the IHSF. Thus, this work is provided as base information to further IHSF Implementation activities such as the compilation of a spatial selection plan and associated prioritisation. (Activities and 5.2.2). 99
106 Table E2: Summary by Proposed Type Greenfield land identified for: Land stage Est. potential yield* Site and Planning service stage Potential 1-26,260 5 years Long term 33,574 Total 63,226 BNG Planning stage Potential 1-36,425 5 years Long term 41,915 Total 96,202 Social housing Planning in corridors stage Potential 1-25,448 5 years Long term 32,223 Total 63,704 Superblocks for 3rd party development (GAP) and Private sector high density (GAP) Comments 3,392 Whilst relatively few site and service opportunities have been noted in the planning phase, the potential may exist to consider possibilities around the interchangeability of BNG and site and service delivery, dependent on site level dynamics. Land in the planning phase is concentrated in the Northern and Blaauwberg Districts. Opportunities identified with potential to initiate planning within a 5-year horizon includes, most notably, land in Blaauwberg (est. 11,158units), Khayelitsha Mitchells Plain Greater Blue Downs (est. 5,434 units), Cape Flats (est. 5,309 units) and Helderberg (est. 4,191 units) Districts. 17,862 Significant land is in the planning stage aimed at delivery of BNG units. This includes, most notably, land in the Northern District (est. 7,318 units), Blaauwberg (est. 4,956 units) and Khayelitsha Mitchells Plain Greater Blue Downs (est. 4,081). Opportunities identified and potentially available to initiate planning within a 5 year horizon includes, most notably, land in Blaauwberg (est. 9,033 units), Khayelitsha Mitchells Plain Greater Blue Downs (est. 8,756 units), Cape Flats (est. 7,135 units) and Helderberg (est units). 6,033 Land in the planning stage where Social Housing may be accommodated includes a range of sites, most notably in Table Bay, Tygerberg District, Cape Flats and Khayelitsha Mitchells Plain Greater Blue Downs Districts. These are generally on sites focused on Social Housing only (such as Dillon Lane, Glenhaven, Pine Road, Enslin Road) or where Social Housing could be accommodated as part of a mix. (e.g. Conradie Hospital). In the 1-5 year horizon a number of land opportunities exist to potentially initiate planning for possible Social Housing including in Table Bay (e.g. CBD and surrounds), Northern District, (e.g. Scottsville), Tygerberg (e.g. Parow precinct and Elsies River) and Helderberg and Khayelitsha Mitchells Plain Greater Blue Downs. (e.g. as part of the mix at Penhill and at sites in Blue Downs). However, the number of units in (planning and) potential 1-5 years stage/s is potentially somewhat overstated mainly due to assumptions on accommodating Social Housing as part of the mix in larger scale developments. Planning stage Potential 1-14,821 19,843 A significant amount of land is identified and included in the planning phase that holds opportunities for housing in the Gap market. Land is concentrated in the Northern District, (est. 5,588 units, which includes potential for super blocks as part of the Garden Cities and Darwin Road development), and Khayelitsha 5 years Long term 33,630 Mitchells Plain Greater Blue Downs (est. 5,066 units including projects such as Blueberry Hill and part of the mix at the Nooiensfontein housing project). Total 68,294 Further land opportunities exist that may be considered for initiation for planning exist most notably in Khayelitsha Mitchells Plain Greater Blue Downs (est. 11,056 units, which includes land at Penhill and Melton Rose), Cape Flats (est. 3,620 units, including as part of a mix on land in Ottery and at Strandfontein, where superblocks could be made available for 3 rd party development) and Table Bay (est. 1,520 units). *based on type proposal and potentially available land and subject to risks / dependencies (see schedule of assumptions) 100
107 Table E3: Assumptions Informing Land Summaries VARIABLE VARIABLE ASSUMPTIONS / RATIONALE DETAIL Potential Site and Service These are proposals /possibilities, and subject to change. The choice of potential housing typology for sites was not an automated housing BNG process, but was informed by: typology Social Housing Current typology/ies planned for the site, if available (most notably if already in planning stage); Gap Proximity to informal settlement. Site and service opportunities were given special consideration on greenfield sites in relative proximity of existing informal settlement to support upgrade projects and any relocation that may be necessary as a result); Density imperative in relation to the Integrated Public Transport Network. Sites within transit accessible precincts were considered as generally being suited to forms which could result in higher densities; Other site level suitability considerations. Assumed density Site and 50du/ha gross As per IHSF directive factors 50du/ha As per IHSF directive gross Social Housing As per revealed average gross densities based on case examples. Where included on larger sites, yields potentially 120du/ha 30du/ha As per housing land stream as part of HSCP project and revealed average densities. Usable area Area (m 2 ) in GIS database, Based on existing information in 2013 database. New sites usable area estimated, but no detailed site investigation should be assumed. There may be a margin of error which could result in overstating of land available. converted to ha in report Yield Dwelling units Per site, based on either (estimated usable area) multiplied by (% of usable area per housing typology i.e. site and service and/or BNG and/or Social Housing and/or GAP) multiplied by (applicable assumed density factor). Alternatively, actual yields used as part of site level planning, where available. Note: these figures should not be quoted or used in relation to official reporting on housing planning or delivery they are estimates based on assumptions identified. Stage Planning These are properties that are currently in the planning process for human settlements (e.g. subject of land use and/or EIA processes or in the process of tender preparation) and are by default priorities in the next 5 years. This may include projects run by the Western Cape Government or private sector role players acting in cooperation with City (e.g. Garden Cities) for delivery of publicly assisted housing. 1-5 years Preliminary identification of sites that could, given resources, proceed to inception and planning stage within a 5-year horizon. Informing this, consideration was given to: ownership - properties outside of City ownership e.g. National Public Works are less likely to be considered in this category, unless they may already be in the process of acquisition / vesting / transfer. any obvious constraints that may present issues in terms of planning for housing within a 5-year period (e.g. proximity to bulk services). This does not commit to planning these sites within 5 years, but could be an informant to prioritization around inception processes (along with other IHSF implementation plan activities). Long term Land that is generally not likely to be suited to inception / planning process in 5-year horizon. (e.g. due to ownership or location away from services). 101
108 2. Tenure Security At a household scale there are a number of policy and practical initiatives underway to remedy and advance tenure security within the City. The following examples are indicative of commitments made to support new settlement initiatives for both individual households and social housing institution partners. Tenure certificates: In partnership with the Violence Prevention through Urban Upgrading (VPUU) non-profit company, the City has issued Tenure Certificates to 80% of the 6,480 families in Monwabisi Park prior to the implementation of a UISP project. The certificates have been introduced to enhance the sense of security of tenure enjoyed by the resident households on a GIS registered plot. This confirms the size and configuration of plots and builds community ownership of the project as well as preventing further unplanned densification which can compromise the deliverability of the project. The tenure certificate does not constitute a legal document and is not a title deed. Once the land use application is approved, a process of sub-division can begin with the end goal being the handover of title at as early a stage as possible. Title can be transferred from the City to the benefitting individual upon receipt of a serviced site and wet core. This allows top structure development as soon as the owner has the resources to do so. This approach to tenure reform and progressive ownership is being discussed with other NGO partners like Community Organisation Resource Centre (CORC) to plot existing erven electronically and upload onto a GIS application for the purposes of widening the scope and reach of the programme. Leasehold to Freehold title conversion: Under a directive from the State Attorney s Office leasehold titles will be converted to freehold titles in all former African townships directly benefiting existing leasehold tenants. Within the City this directive will impact on 2,400 servicedsite plots that are still to be finalised and 4,500 houses registered in the name of the National Housing Board. Issuing of Title Deeds on project completion: Provincial Government policy guarantees the delivery of Title Deeds upon future project completion. To address historical backlogs in issuing Title Deeds the City is drafting policy to guide the rectification program, and has signed a cooperation and financing agreement with the Free-market Foundation. Rental Accommodation and Partnership with Social Housing Partners: Well-located parcels of municipal land supportive of rental, mixed income and higher density developments have been made available to social housing partners and banks to build homes with bond finance. Twelve such parcels have been released for development by banks, while 90 have been released to emerging developers. Legislative Reform to encourage household densification to increase supply of new housing opportunities by private households via rental units: Amendments to Municipal Planning Bylaw have been advertised to include a Third Dwelling Overlay zones. This provides certain areas with land use rights permitting a second and third dwelling on an erf and will enable private property owners to contribute to the provision of affordable rental housing stock. 3. Social Infrastructure The provision of social amenities is integral to the City s planning processes for upgrading and establishing new settlements. Nevertheless, sequencing and operationalisation of facilities remains a significant challenge; particularly given the inter-governmental dependencies on Provincial Departments when health and education facilities are required. This remains a key work-stream and process associated with and monitored via the BEPP process. This challenge 102
109 was a key strategic theme considered at the Mid-Year Budget Review session in February 2015 and revisited in the workshop with Provincial Departments in October The Council for Scientific and Industrial Research (CSIR) benchmarking study of community infrastructure (2014) calculated the accessibility and capacity of existing facilities as well as forecasted facility demand for the estimated population growth between 2011 and It covered the following sectors: Parks, Sport and Recreation, Community Halls/Civic Centres, Education, Primary Health, Fire, and Libraries. The projections for 2032 signals an important message to both the WCG and the CCT with regard to the current backlog and large growing demand for the provision of social facilities. The Metro South-East area continues to have the greatest demands and is compounded by population growth. Current investment in educational and primary health care facilities prioritises areas of high population growth. Future investment in social facilities should focus on: expanding capacity through new facilities or upgrading existing facilities, enhancing access to these facilities by improving public transport and integrating with new public transport infrastructure, actively engaging with space allocation (erf sizes and building design) of facilities developing new models of co-location and clustering as well as multi-level facilities, and a clear notion that developing new facilities on the outskirts of the city will exacerbate the backlog demand in the built-up part of the city. The provision of Community Services to Informal Settlements will be aligned with targeted strategies and interventions of the Integrated Human Settlement Directorate (e.g. Reblocking and Site and Service programmes). Social Services and Integrated Human Settlements will jointly determine the localised basic needs of specific informal settlement where after services will be provided taking the local challenges of land ownership, zoning, land availability, private sector partners, NGO s in the community, community structures, budget availability, ongoing management and maintenance ext. into consideration. Different standardised social facilities provision models will be developed as a starting point. These models will then be further refined and adapted according to every locations challenges and realities. This approach is also part of the Integrated Human Settlement Framework (IHSF). A workgroup as part of the implementation of this framework have been established to drive the above-mentioned approach. Collaborative transversal planning to develop a new management model for multi-use, multiownership social facilities sharing a (good) location (currently a component of the work being undertaken by the City s Optimisation Programme). There is a need to look at new institutional options for management of these facilities. A rationalisation project is a good starting point for this, but improved, integrated forward planning is essential. Cost containment and revenue generation for social facilities. This requires clear strategies and approaches. Property management functions should be centralised across facilities. Careful location planning is required to reduce risks of vandalism. Citizen engagement with district level planning should be prioritised. Private sector partners should be sought. The development of an operating finance strategy, in conjunction with capital investment programmes. There is a clear linkage with TOD planning that should be explored to ensure optimal facility location. 103
110 F. URBAN MANAGEMENT 1. Precinct Management BEPP guidelines continue to highlight the significance of urban management to protect public and private investments and assets in a formal and institutionalised manner. This section recaps the approaches being employed within and beyond the Integration Zones. Aside from maintaining a standard of routine urban management services, the City of Cape Town uses a number of mechanisms to promote improved precinct management within priority areas: Special Rating Areas (SRAS) incorporating City Improvement Districts (CIDs Figure F1) have been successfully implemented in many metropolitan and sub-metropolitan nodes and industrial areas. SRAs are presently in place in the following locations: Airport*; Athlone*; Blackheath; Brackenfell; Cape Town Central*; Claremont; Epping*; Fish Hoek; Glosderry; Green Point; Groote Schuur*; Kalk Bay St James; Llandudno; Maitland*; Muizenberg; Observatory*; Oranjekloof; Paarden Eiland*; Parow Industria*; Salt River*; Stikland*; Sea Point; Triangle Farm*; Vredekloof; Woodstock*; Wynberg; Zeekoevlei Peninsula; Zwaanswyk Association. (* = located within or adjacent to an Integration Zone). In the City s metropolitan nodes (Cape Town and Bellville CBDs) the SRA initiatives have been complemented by the City entering into partnerships with the private sector to promote investment and investment retention in these nodes, namely the Greater Tygerberg Partnership (GTP) and the Cape Town Partnership (CTP). The Mayoral Urban Regeneration Programme (MURP) has identified a number of declining CBD s, town centres and community nodes where Area Coordinating Task Teams (ACTTs) have been established. MURP areas include: Athlone CBD (Urban Hub as per Urban Network Strategy and MSEIZ); Bellville Transport Interchange and Voortrekker Road Corridor; Bishop Lavis, Valhalla Park, Bonteheuwel; Gatesville CBD (MSEIZ); Harare and Kuyasa Transport Interchanges(MSEIZ); Macassar; Manenberg, Hanover Park (MSEIZ); Mitchells Plan Town Centre (Urban Hub as per Urban Network Strategy and MSEIZ); Nyanga/Guguletu (MSEIZ); Ocean View; Parow (Voorterkker Road Corridor); and Wesfleur Business Node (Atlantis) (Figure F1). Under the leadership of the relevant sub-councils, the ACTTs include all relevant Council line departments as well as other stakeholders and local community representation. They employ short term urban management solutions and oversee the development of a more comprehensive community action planning process that draw from the best practices developed under the Violence Prevention through Urban Upgrading Programme. The above is premised on a strong social crime prevention approach. Work is progressing towards the realisation of a community policing programme and integrated neighbourhood safety programme based on the work piloted by MURP in areas presently suffering from severe gang activity. In addition to resources available via the MURP playing a catalytic or unblocking role around minor urban management issues that struggle to receive attention, ICDG allocations have invested in supportive urban management infrastructure such as CCTV installations and improvement of public spaces. Voortekker Road Corridor Integration Zone in particular has benefited from these investments. 104
")
111 Figure F1: Special RatingAreas (SRAs) and Mayoral Urban Regneration Prgramme (MURP) Areas 105
112 The City s Quality Public Spaces and Smart Park Programmes are efforts to implement, through design, the principles of equity, integration and sustainable development in poor areas. In so doing, the City aims to improve accessibility, quality of life, and dignity for all. The philosophy behind the programme is that urban design can be a catalyst for positive change and effective urban management. The programme delivers a visible and tangible way of reconnecting communities and addressing issues of equality and social justice. The programme has grown to include the provision of a dignified community space as part of each informal settlement upgrade project. This sees a move away from the traditional approach in which the menu of services provided is limited to engineering services. Many projects include the recognition and celebration of places of cultural, historical, and social significance in communities. Since 1999, the programme has delivered more than 100 projects. Presently, line departments remain responsible for their respective daily operational costs relating to urban management like cleansing and periodic repairs and maintenance of own assets. The greater challenge face by the City in relation to the management of precincts and assets is in relation to an integrated financial and operational model associated with multi-departmental facilities that can realise greater efficiencies and enhanced standards of maintenance. The City has established a Transversal Working Group under the Economic Cluster working on the Rationalisation of City Assets. One of its primary tasks is to consider co-management approaches for land and buildings developed by the different departments of the municipality: for example, a library development with a large urban park, adjacent to a BRT and rail station, where retail units funded and constructed by council are leased out to private business. Work is progressing to produce financial and practical urban management models based on an institutional framework which can support this urban management institutional framework. At least 3 cases exist in need of solution and is being piloted in Harare, Khayelitsha (MSEIZ) as a legacy of the Violence Prevention through Upgrading Programme Urban Upgrade and Improvement District Project Investing in the following targeted urban upgrade programmes which will include the identification and focus on crime hotspot areas: Area Initiative Comments on Progress Integration Zone Athlone Community Action Plan Prepared for implementation MESIZ Athlone/Gatesville Proposed Shared Services Feasibility study and project plan MSEIZ Centre to be prepared Atlantis Project Development of an Integrated PTI and trading precinct and sustainable management regime PTI complete, to be completed by June N/A Bonteheuwel Public Investment Framework First phase implementation of road rehabilitation/public space upgrade to commence in 2017/18. Urban Design and Planning for further phases to be undertaken for implementation in 2018/2022 Gatesville Community Action Plan To be completed by June 2017 for implementation MSEIZ MSEIZ 106
113 Area Initiative Comments on Progress Integration Zone Hanover Park Public Investment Framework (PIF) (will include planning for the development of a Youth Lifestyle Centre, a Media Centre and an Aqua centre) Public Investment Framework complete and approved for implementation N/A Hanover Park Urban Upgrade Harare Node Kuyasa Station Precinct Town centre upgrade and implementation of the PIF over the next 5 years. area based management Area based management plan Phase 4 of the VPUU Programme approved, implementation protocol including a scope of work concluded between the City and Province NMT and concrete road upgrade currently underway ShotSpotter currently under implementation Ceasefire currently under implementation 2017/2018 Implementation of plan approved and to be implemented in 2017/18 Implementation of an area based management plan approved and to be implemented in 2017/18 N/A MSEIZ MSEIZ Kuyasa Station Land release strategy MSEIZ Precinct Macassar Community Action Plan Complete for implementation N/A 2017/18 Manenberg Youth Lifestyle Campus design to start in 2017/18 MSEIZ Manenberg NMT and concrete road currently underway MSEIZ upgrade Manenberg ShotSpotter currently under implementation MSEIZ Manenberg Ceasefire phase 2 to be rolled out to Manenberg September MSEIZ Mitchells Plain Town Centre Nyanga / Gugulethu Establishing Management Entity for Mitchell s Plain Town centre NUNU Transport Interchange Precinct Lotus Park in-situ upgrading Develop an area based management regime and Development and implementation of a Safety Plan. Development plan complete for implementation , MSEIZ MSEIZ Ocean View Voortrekker Road Corridor (VRC), Voortrekker Road City Improvement District (VRCID) and Greater Tygerberg Partnership (GTP) implementation of a Safety Plan Safety Plan and Urban Management (Bellville and Parow) To be completed by June 2017 for implementation N/A VRC 107
114 1.2. Economic Interventions and Incentives Since 2013 the City has offered financial and non-financial incentives to qualifying investment that creates jobs within Cape Town. The focus of the policy is on incentive levers that lie within the City s constitutional mandate, specifically relating to reduced approval times; simplified application processes; single point development facilitation; provision of investment information; as well as a limited range of indirect financial incentives including reduced electricity tariffs. In an environment of low economic growth and unemployment, visible commitment from the City, i.e. that it is serious about its economy, is critical to ensuring ongoing investment growth. Initially, the incentive policy was rolled out in Atlantis and initial analyses suggests positive and tangible results. The policy is being reviewed in respect of its application in the rest of the City. It now includes a spatial targeting component that aims to identify underperforming industrial areas adjacent to or within the Integration Zones (e.g. Philippi East, Landsdowne Rad Industrial Area, Athlone Industrial, Elsies River Industrial and Triangle Farm/Stikland) where the incentive can be applied. The new manufacturing investment incentives policy will continue to offer both financial and non-financial incentives in targeted areas across the city for job-creating new investment and expansion of existing investment. The manufacturing investment incentive policy will be implemented as part of a broader investment facilitation service offered by the City. Targeted incentive areas: The investment incentives are spatially targeted, and while the precise areas are still to be determined, they will be implemented in industrial areas experiencing low growth and in need of generation. Furthermore, incentives will be offered in areas in the integration zones where the focus of public sector infrastructure investment is being brought to bear. Area Initiative Comments on Progress Atlantis Special Economic Zone (SEZ) The City will continue working with the Western Cape provincial government, the Department of Trade and Industry and relevant SPVs to enhance the profile and confidence in the Atlantis Industrial Zone as an investment destination, with a focus on manufacturing. Efforts continue to declare Atlantis Industrial Zone as a Special Economic Zone (SEZ). Atlantis Investment Facilitation Office (IFO) The City will continue to run the Atlantis Investment Facilitation Office (AIFO), which will provide high quality facilitation services to prospective investors, including business and location advice, as well as aftercare to existing investors. The City furthermore, supports the Integrated Resource Power Purchase Programme (IRPPP) and believes in its continued success Business Precinct Management Framework The City has also piloted a conceptual framework for business precinct management in Wynberg, Philippi and Mitchells Plain. Informants for the pilot included: National Treasury s The Art of Precinct Management: A Municipal Guide ; The South African Property Owners Association (SAPOA) and the Cities Network Developing a Collective Approach to Mixed-use Development in Transit Orientated Development Precincts ; and MyCiTi technical specialists retail development strategies February
115 A key question that the initiative sought to answer was: In the context of scarce municipal resources, how do municipalities support the operational management of key precincts that require services beyond what the municipality can provide to all of its citizens? All three of the pilot sites in Wynberg, Philippi and Mitchells Plain are located in public transport nodes. They are reflective of precincts hosting formal and informal urban environments accommodating a variety of street or informal trading activities. Accordingly, the initiative sought approaches that supported a holistic approach to property and retail development across the network and at specific precincts. Key success indicators for the establishment of viable precincts were found to include: A dedicated entity or function that has overall Business Precinct Management responsibility is required; An adequate budget allocation for the provision of specified services should be available; The ability to generate private sector participation or partnerships should be in place; Overall there should be meaningful local participation from all levels of the business spectrum; The management and co-ordination of multi stakeholder participation would be a prerequisite; The management responsibilities and functions should be exercised on the basis of a detailed specification of Business Precinct Management responsibilities in respect of basic services delivery and any add-on support services. This may imply distinguishing between infrastructure provision responsibilities and management services; There is a need for clarity on the Business Precinct Management concept within the City environment implying the requirement of consensus between all relevant City role players and Departments, coupled with a strong communication function; Sufficient capacity within the entity or function to support and manage specified precinct activities must be established; Overall a solid understanding of local market and property development considerations must be applied; Ability to work within all statutory requirements, particularly including land use regulation must be in place; and Overall ability of Business Precinct Management model to be financially sustainable within a specified ratepayers base, and complemented by any other additional funding as may be secured in terms of budgeted expenditure requirements. The report highlights a Business Precinct Development Continuum Concept that reflects levels of maturity and needs of the nodes (Figure F2) 109

116 Figure F2: Business Precinct Development Continuum Concept 110
117 2. Transport Management The Inter-modal Planning Committee set up in terms of the Municipal Land and Transport Act also serves as mechanism to deal with urban management issues inter-governmentally around public transport precincts. Work being undertaken by Transport for Cape Town on its industry transition model also presents exciting opportunities for improving the management of public transport interchanges which is often a key issue in the sustainable management of urban precincts. In 2015 the City awarded the Automated Public Transport Management System (APTMS) contract for the development, implementation and operation of a system to manage public transport service in real time to improve public transport service delivery. Initially applicable to the MyCiTi service, it is expandable to a multimodal system as functions are assigned to the Transport Authority in future. In addition, the City in collaboration with Metrorail are using train efficiency data to improve the annual calculation of the Transport Development Index (TDI) which enables the tracking, over time, the effect and benefit of operational improvements made to the systems as well as identifying areas for further improvement to the transport systems from a user perspective. 3. Key Land Use Management Interventions An increasing emphasis is being placed on mechanisms and tools available to the City to support development within the Integration Zones and the city more broadly. There are a number regulatory initiatives that are in place or in and advanced stage of implementation that are directly impacting on the local area planning and ease of doing business within the Integration Zones. These are considered in turn in the following subsections: Urban Development Zones: a SARS / City initiative premised on tax incentives within specific city precincts linked to urban renewal and reinvestment. Public Transport Areas Zones 1 and 2: a City initiative that seeks to reduce parking standards in areas of the City supported by existing or future public transport networks and infrastructure. Proactive Land Use Applications: A City initiative to widen the scope of permitted activities in terms of the Development Management Scheme (DMS). Overlay Zones: A City initiative within the scope of the DMS applying a development rule which may less restrictive than the base zoning within a prescribed area. Precinct Plans / Specialist studies: City initiatives to direct planning and investment policy within local precincts. Restructuring Zones: City and Social Housing regulatory authority (SHRA) governed initiative to support the allocation of the Restructuring Grant for the purposes of Social Housing. Environmental and Heritage Legislation (including the designation of Integration Zones as Urban Areas to assist with scheduled activities as per NEMA EIA Regulations 2014) Urban Development Zone (UDZ) Introduced in 2003, the aim of the UDZ is to stimulate private sector-led residential and commercial development in inner-city areas with developed public transport facilities by means of a tax incentive administered by SARS. The tax incentive is based on an accelerated depreciation allowance on the costs of buildings erected, added to, extended or improved within the UDZ as per the following criteria: erection, extension or improvement of or addition to an entire building; 111
118 erection, extension, improvement or addition of a part of a building representing a floor area of at least 1,000 m²; erection, extension or improvement of or addition to low-cost housing; and / or purchase of such a building or part of a building directly from a developer. When the UDZ incentive was first introduced in 2003, the City of Cape Town demarcated an area of 551ha in the Cape Town CBD, which extended through Woodstock, Salt River, Observatory and Mowbray including the western sections of Voortrekker and Klipfontein Roads, as well as 78ha of the Bellville CBD. In 2013 extensions of the delineation of the City s UDZ further benefited both Integration Zones and extended the provisions of the designation until From Buitengracht Street in the Cape Town CBD, the UDZ extends eastward and includes the following subareas within the MSEIZ: Cape Town CBD (portion); Woodstock; Salt River; Observatory; Mowbray; Greater Athlone; and Gatesville. Within the VRCIZ two areas were incorporated including 83ha extending from Bellville to Parow, and 42ha in Maitland. These complemented the initial Bellville designation. The TOD Strategic framework recognises the need for pro-active planning approaches to accelerate development in strategic precincts. The City has implemented a number of regulatory approaches linked to the Development Management Scheme to support such objectives including: the introduction of Public Transport Zones; Proactive Land Use Applications and Overlay Zones Public Transport Areas (PT 1 / PT2) Recognising the scale and impact of the IPTN and the positive impacts afforded by the existing and future public transport in reducing car-based trips to developments the City s Development Management System (DMS) facilitates reduced minimum parking requirements in demarcated PT1 and PT2 areas. The criteria selected to determine PT1 and PT2 areas were largely related to proximity of public transport, specifically the rail and MyCiti bus network. Key assumptions and drivers of the integration of the PT1 and 2 Areas in to the DMS included: Establishing a routine planning regulatory response to reduce the need for applicants to apply for departures from conventional parking ratios. NB: This does not preclude applications for reductions in excess of those determined via the PT1 / 2 status. Encouraging public transport use as an alternative to private car use and recognising that the need for parking is reduced where trips conventionally made by car are likely to shift to public transport and NMT (non-motorised transport). Acknowledging that parking reductions would be most viable in locations where the public transport system provides for (or will be provided in the short time) and provide an attractive alternative to the car. 112
119 Recognising that the demarcation of PT1 and PT2 effectively bestows additional development rights to designated land parcels and that these rights are dependent on the long-term commitment capital and operational investment in public transport systems by the City and National Government (PRASA and BRT subsidies). PT2 areas are drawn at a 400m radius from the centre of the public transport facility. Chapter 15 of the city s approved Municipal Planning By-Law states: PT1 areas refer to areas where the use of public transport is promoted, but where the City considers the provision of public transport inadequate or where the use of motor vehicles is limited. In PT1 areas this distance is extended to at least 800m. The MPBL states: PT2 areas refers to areas where the use of public transport is promoted and the City considers the provision of public transport good, or where the use of motor vehicles is very limited. Minimum off-street parking requirements for PT1 areas for Main Dwelling House (SR1 Zoning) are reduced from 2 to a single bay and are exempted in PT2 area. Parking is exempt in both PT1 and 2 areas in SR2 Zoned properties. Other land uses examples and implications of PT designation for commercial zoned are illustrated in Table E4. Figure F3 and Table E5 reflect the spatial locations of all PT1 zones with an emphasis placed on those in the IZs. Land Use Standard Areas PT1 Areas PT2 Areas Main Dwelling House (SR1 Zoning) Main Dwelling House SR2 Zoned properties 2 bays per dwelling unit (1 bay per dwelling for erven < 350 m2) 1 bay per dwelling unit Nil 1 bay per dwelling unit Nil Nil (Nil per dwelling for erven < 100 m2) 4 bays per 100 m² GLA 2 bays per 100 m² GLA 1 bay per 100 m² GLA Shops (excluding supermarket) Offices 4 bays per 100 m² GLA 2.5 bays per 100 m² GLA 1 bay per 100 m² GLA Conference centre 6 bays per 10 seats 4 bays per 10 seats 2 bays per 10 seats Table E4: Extract of Land Use and Parking Standards by Public Transport Areas Designation 113
120 Figure F3: PT1 and PT2 Designations 114
121 Metro South East Athlone Bonteheuwel Chris Hani Esplanade Hazendal Voortrekker Road Acacia Park Avondale Bellville Century City & Acacia Park De Grendel Heideveld Elsies River, Vasco & Goodwood / Khayelitsha Kuyasa Langa Lentegeur Mandalay Mitchells Plain Mowbray Netreg/ Netreg 2 Nolungile Nonkqubela Nyanga Goodwood, Vasco & Elsies River Kentemade Maitland & Ndabeni Monte Vista Mutual & Woltemade/ Woltemade & Mutual Oosterzee Parow Stikland Thornton Tygerberg Ysterplaat Observatory Philippi Pinelands Salt River Stock Road Woodstock OTHER: Atlantis; Belhar, Blue Downs, Brackenfell, Cape Town, Century City, Claremont, Crawford, Diep River, Eikenfontein, False Bay, Firgrove, Fisantekraal, Fish Hoek, Glencairn, Harfield Road, Heathfield, Kalk Bay, Kapteinsklip, Kenilworth, Killarney, Du Noon & Usasaza, Kraaifontein, Kuils River, Lakeside, Lansdowne, Lavistown, Melkbosstrand, Mfuleni, Muizenberg, Neptune & Section, Newlands, Ottery, Paarden Eiland, Pentech, Plumstead, Postdam to Du Noon, Retreat, Rondebosch, Rosebank, Royal Ascot & Sunset Beach, Sandown, Porterfield & Table View, Sandrift, Phoenix & Omuramba, Serepta, Simon s Town, South Field, St James, Steenberg, Steurhof, Sunny Cove, Table View, Grey, Janssens & Wood, Turf Club, Montagu & Refinery, Unibell, Waterfront, Wetton, Wimbeldon, Wittebome, Woodbridge & Milnerton, Wynberg, Zoar Vlei & Lagoon Beach Table E5: Integration Zone PT Designations 3.3. Proactive Land Use Application In 2015 the City successfully obtained land use approval to widen the scope of permitted activities in terms of the zoning scheme in Langa, one of the oldest townships in Cape Town and a designated PT Zone. This pilot approach to proactive rezoning of precincts / properties enables businesses such as restaurants and guest houses to operate lawfully in the Langa Quarter precinct, home to a responsible tourism project driven by ikhaya le Langa, a non-profit organisation based in the area. The proactive land use application was initiated by the City, with the support of the owners and ikhaya le Langa, and allows owners to exercise certain consent use rights in Single Residential 2 (SR2) zoned properties. 115
122 Initial investigations of the take up of development rights in the VRC have indicated a significant underutilisation of land use rights within the corridor generally. In a number of areas amendments to existing rights are required for further development to take place. A further investigation of underutilised rights and trends around applications would form the basis of a proactive rights amendment to facilitate development and the urban form considered appropriate for the location within the VRC Overlay Zones Overlay Zones are a mechanism in the City s Municipal Planning Bylaw (MPBL) that can allocate or remove rights to demarcated areas in order to give effect to approved policy. An amendment to the MPBL was made in relation to facilitating entrepreneurship across the City to accommodate a broader range of work from home activities currently permitted in the Single Residential zoning category. This initiative will be further linked to the scheduled road and rail public transport network and will support travel demand management issues. Overlay zones are currently being investigated to support incremental densification of neighbourhoods and facilitate economic opportunities and job creation. The Third Dwelling Overlay Zone makes provision for up to three dwellings to be a primary right in Single Residential zoned erven. The objective of this initiative is to encourage private property owners to contribute to the provision of affordable accommodation via second and third dwellings. The City intends on sending these amendments out to public participation in May 2017 for operationalisation prior to the end of the calendar year Restructuring Zones The City of Cape Town is committed to establishing, promoting and accelerating the delivery of social housing to support its efforts to address the ever-increasing and diverse accommodation needs in the city. Providing affordable housing opportunities that are close to places of employment, or public transport infrastructure and routes to connect to other parts of the city, are some ways that the City is seeking to promote a more integrated, opportunity city for all. Typically, these initiatives would require a differentiated approach to residential densities and typologies and supported by the Restructuring Grant applicable to designated Restructuring Zones. The City has considered it necessary to revisit the gazetted restructuring zones as published in the government gazette Notice 900 of 2011, in accordance with section 5(d) (i) of the Social Housing Act, Accordingly, it has given notice to the Provincial and National Department of Human Settlements of its intent to declare the whole of Cape Town a Restructuring Zone so as to make available and optimise the supply of land for all communities based on the following motivation: The City is committed to actively redressing and revising the spatial legacy of apartheid planning; The City has always considered all centrally located areas the CBD and surrounds as well as zones along the key transport routes to be restructuring zones that are eligible for social housing. The provisional restructuring zones identified in 2011 (Government Notice 848, and as corrected in GN 900) gives effect to this objective. However, the designation of specific areas of the City is an insufficient guarantee for the provision of social housing. The City recognises that there are opportunities for social housing in many areas, and that the development and availability of affordable rental accommodation in central areas of the city must play a key role in the future development 116
123 of the city. No eligible site that meets the criteria for providing affordable housing should be excluded from being realised as an opportunity to promote integration, reverse the legacy of apartheid and provide safe and accessible housing to lower income families on the basis of this Act. Denoting the entire city as a restructuring zone will eliminate any restriction to creating a more integrated city. Accordingly, the Executive Mayor has notified the City s intention to declare the City of Cape Town, in its entirety, as a restructuring zone. This will be initiated and processed through the City s SDF, IDP and BEPP processes. Therefore, according to the motivation detailed above, the City of Cape Town motivates for its entire geographic area to be declared a restructuring zone. This will enable the required enablement of both transit oriented development and tenure blind development. It will also ensure that multiple projects can be implemented to directly support the City s spatial transformation objectives. This declaration will then also enable the City to revisit its pipeline of projects in accordance with its Built Environment Performance Plan as well as in relation to the reviewed Municipal Spatial Development Framework (MSDF). The current Restructuring Zones for social housing, as determined the Social Housing Act, are detailed in Table E6. Table E6: Gazetted Restructuring Zones SPATIAL AREAS (AS PER GAZETTE) 1 CBD and Surrounds (Salt River, Woodstock and Observatory) 2 Cape Flats (Athlone and surrounds, Pinelands- Ottery) 3 Southern (Strandfontein, Mitchells Plain, Mandalay and surrounds) 4 Northern Central (Belville, Bothasig, Goodwood and surrounds) 5 Southern near Claremont, Kenilworth, Rondebosch 6 Southern Central (Westlake-Steenberg) IZ KEY SOCIAL / ECONOMIC NODE RAIL MSE CBD Southern Metro Line to CBD and southwards to Simonstown MSE Ahtlone, Gatesville, Cape Flats Metro line Pinelands MSE Mitchells Plain Town Centre Mitchells Plain Metro Line ROAD / IRT INFRASTRUCTURE Main Road Taxi Road Jan Smuts, Klipfontein, Landsdowne AZ Berman, Spine Road, and Morgenster VRC Belville, Epping Metro Line N1 and Voortrekker Road CBD, Kenilworth Westlake,Blue Route, Capricorn Southern Metro Line to CBD and southwards to Simonstown Southern Metro Line to CBD and southwards to Simonstown 7 Northern near Milnerton CBD Southern Metro Line to CBD and southwards to Simonstown 8 South Eastern (Somerset West, Strand, Gordons Bay) 9 Eastern (Brackenfell, Durbanville, Kraaifontein, Kuils River) 10 Far South (Fish Hoek, Simonstown) 11 Northern (Parklands and surrounds) Somerset West Kraaifontein Somerset West-Belville Metro line Belville-Cape Town Metro Line Main Road Taxi Road M3 and M5 Main Road Taxi Road M3 and M5 Main Road Taxi Road M3 and M5 Somerset West Main Road, T2 and Broadway Old Paarl Road, Van Riebeeck Street, Carl Cronje Drive, Brighton Road Fish Hoek Simonstown Metro Line Main Road Montague Gardens, Killarney Industrial and Century City IRT on R27 R27 Road The challenge remains to identify and secure a critical mass of land and project-ready initiatives with the requisite institutional support quantum of yield, mix of land uses and quality of urban design. 117
124 Well-located parcels of municipal land supportive of rental, mixed income and higher density developments have been made available to social housing partners and banks to build homes with bond finance. A project is underway with the City, National Association of Social Housing Organisations (NASHO) and the Development Action Group (DAG) to use a precinct based approach to affordable housing led urban regeneration in the Salt River / Woodstock area. This area has been selected as it contains a number of proposed affordable housing projects. A number of projects located on State Land support this approach and are located within the IZs, for example: Athlone Power Station, Conradie Hospital, Two Rivers Urban Park and Wingfield. Wingfield is the largest redevelopment opportunity within the VRC. The Wingfield site is owned by National Government and partially utilised by the Defence Force. The City has made representation to the State President requesting redevelopment of the site. The matter has been referred to the Housing Development Agency (HDA) for further investigation. Stikland as another example occupies a very large piece of land within the VRC. While the hospital very much operational, large portions of the site are under-utilised and present a redevelopment opportunity. Provincial Government, as the land owner, needs to develop a position on the future of the site and the potential development of underutilised portions. The potential development yield from these sites is considerable, and because of their extent, there could be opportunity for cross-subsidisation of income groups. The IZs also contain considerable opportunity for the conversion of existing buildings to residential units. The City of Cape Town in the 2017/18 financial year is to embark on two Social Housing composite initiatives that will show its Spatial Transformation and TOD intentions within the Human Settlement environment, namely: The Collective Social, GAP and/or emergency housing developments in the CBD/Salt River/Woodstock area. The City owns six sites in the area and is in the process of securing another from Provincial Government. The aim is to package these projects using the following principles: o The City will facilitate a design that integrates these developments with their surrounding area and innovates both the housing and public space. o A new financial mechanism will be incubated, utilising a combination of City finances and other available sources to push the delivery, design and TOD boundaries. o Working with Social Housing institution to, not only increase sustainable stock, but also to innovate with the operational model. The CBDs housing programme. There are a number of CBDs across Cape Town: the Cape Town CBD itself, Bellville, Parow, Claremont, Wynberg, Khayelitsha, Mitchells Plain, and Plumstead amongst others. The intention is not only to identify land but also buildings within these CBDs that can be developed or converted into rental accommodation and Social Housing units. This will ensure: o Developments that are integrated within the existing urban form as well as are close to established public transport systems o Enable the upgrading and repurposing of buildings that might have been downgraded. o Linkage to a new spatially referenced housing database. In addition, the City is intent on addressing the existing hostels in the City via an area-based programme of interventions and upgrades which will be detailed in due course. 118
125 3.6. Environmental and Heritage Legislation The recent delisting of a number of key activities within the Urban Edge requiring Environmental Impact Assessments (EIAs) has reduced the regulatory red-tape associated with the National Environmental Management Act, Act 107 of 1998 (NEMA). Based on discussions between the City and the Provincial Department of Environmental Affairs and Development Planning (DEADP) one of the intentions of the MSDF review is to consider the Voortrekker Road Corridor and Metro Southeast Corridors as urban areas for the purposes of the 2014 NEMA EIA Regulations which could further mitigate lengthy environmental legislative requirements. Heritage considerations produce uncertainty due to the age of buildings and a lack of clarity regarding their preservation worthiness. To address this constraint and ambiguity it has been recommended that a strategic heritage impact assessment should be undertaken for the VRC to clearly identify which structures and urban forms have heritage value and should be retained and which can be redeveloped. 4. Regulatory Approaches to Tenure and Formalisation There are a number of policy and practical initiatives being employed to advance tenure security within the City. The following examples are indicative of commitments made to support accelerated and efficient transfer of tenure to individual households benefiting from upgrading initiatives Tenure certificates In partnership with the Violence Prevention through Urban Upgrading (VPUU) non-profit company, the City has issued Tenure Certificates to 80% of the 6,480 families in Monwabisi Park (MSEIZ) prior to the implementation of an upgrading project. The certificates have been introduced to enhance the sense of security of tenure enjoyed by the resident households on a GIS registered plot. This confirms the size and configuration of plots and builds community ownership of the project as well as preventing further unplanned densification which can compromise the deliverability of the project. The tenure certificate does not constitute a legal document and is not a title deed. Once the land use application is approved, a process of sub-division can begin with the end goal being the handover of title at as early a stage as possible. Title can be transferred from the City to the benefitting individual upon receipt of a serviced site and wet core. This allows top structure development as soon as the owner has the resources to do so. This approach to tenure reform and progressive ownership is being discussed with other NGO partners like Community Organisation Resource Centre (CORC) to plot existing erven electronically and upload onto a GIS application for the purposes of widening the scope and reach of the programme Leasehold to Freehold Title Conversion Under a directive from the State Attorney s Office leasehold titles will be converted to freehold titles in all former African townships directly benefiting existing leasehold tenants. Within the City this directive will impact on 2,400 serviced-site plots that are still to be finalised and 4,500 houses registered in the name of the National Housing Board Issuing of Title Deeds on Project Completion Provincial Government policy guarantees the delivery of Title Deeds upon future project completion. To address historical backlogs in issuing Title Deeds the City is drafting policy to guide the rectification program, and has signed a co-operation and financing agreement with the Free-market Foundation. G. INSTITUTIONAL ARRANGEMENTS AND OPERATING BUDGET 119
126 1. Institutional Arrangements: City and BEPP Related During the previous IDP term, the City of Cape Town implemented a Transversal Management System (TMS) as a management approach to improve integration and coordination of service delivery and planning. This tool has helped to improve City-wide strategic alignment through inclusive strategic planning processes to improve integration and coordination of service delivery and planning. It operates within the existing hierarchical structure, but complements this structure with additional platforms for cross-directorate communication and decisionmaking. The Transversal Approach aims to ensure that function-oriented departments collaborate around identified themes and groupings (issues falling into the mandate of multiple departments). This approach has been supplemented to now include: Transformational priorities and the role of all departments in achieving them (expressed in Section A); an area based management approach to ensure that services are coordinated and delivered on an area basis; Alignment of existing theme-related transversal working groups and their ongoing projects and programmes to newly defined structures within the ODTP; Development, alignment, implementation and monitoring of strategies and policies at a transversal level so as to ensure ongoing alignment; A supportive system of delegations and business and operational plans During the 2016/17 financial year, the City has embarked on a significant restructuring exercise via its Organisational Development and Transformation Process (ODTP). The Transport and Urban Development Authority (TDA) is now tasked with the co-ordination of the BEPP process and product. Presently, the team responsible for the coordination process is located within the Catalytic Investment Department. Transversal Committees (TC) have replaced the Portfolio Committees. The Transport and Urban Development Authority TC (TDATC) now provides an oversight role for BEPP and related projects and programmes. To inform and support the incoming members of the committee, a workshop was held with the TDATC on 6 th February The session outlined the BEPP focus, importance of the process envisaged leading to an approval by Council in May Figure G1 reflects the institutional arrangements. An Inter-governmental BEPP briefing session was hosted by the City on 2 nd December Invites were extended to Provincial Government Departments, State Owned Entities and National Departments with a view to further improving the quality and consistency o information pertaining to planned public sector projects and investment. SOEs in attendance: ESKOM, Airports Company South Africa (ACSA), the Housing Development Agency (HDA) and South Africa Social Security Agency (SASSA) Western Cape Government Departments in attendance: Environmental Affairs and Development Planning (DEADP), Education, Health, Transport and Public Works (regeneration and special projects), Human Settlements, Treasury and Transport and Public Works. The Provincial Department of Treasury (Infrastructure division) has continued to provide on-going support and service to the BEPP Technical Committee and remain vital to the coordination and communication with sister departments. The National Department of Treasury has directly supported the process during the course of the financial year by addressing both the Inter-governmental session in December and the inaugural meeting of the BEPP Technical committee for the 2017/18 review process. 120
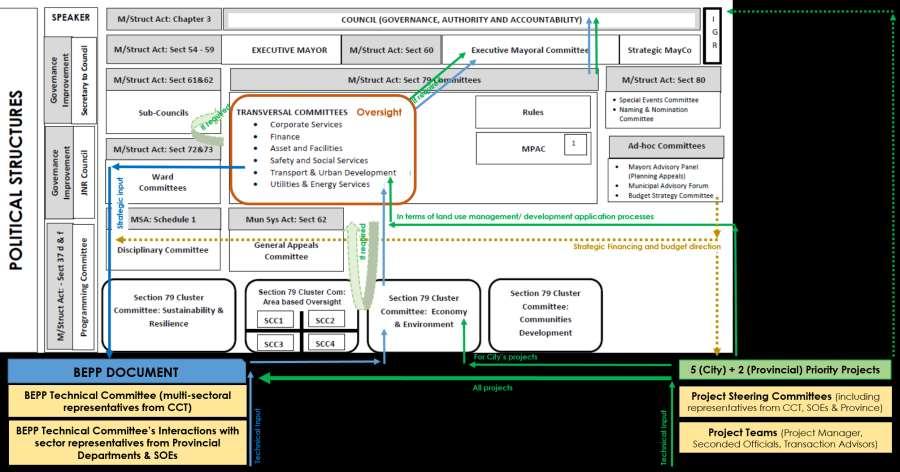
127 Figure G1: Institutional Arrangements for BEPP 121
128 Figure G2 provides a diagram indicating how the MSDF and the IDP & budget process was planned. Subsequently the MSDF has been slightly delayed and the review will not take place only once the IDP and Budget has been confirmed by Council. The total process plan for the IDP, Budget, BEPP and MSDF as accepted by Council on 24 th August 2016 is on the web via the following link: %20and%20frameworks/IDP%20Budget%20Time%20schedule%20A3% pdf Timeframes for the MSDF have subsequently been adjusted to allow the IDP process to conclude. The review process will take place formally during the mid-late The draft IDP (March 2017) is located here and was available for public comment until 21 st April 2017: nexure%2011%20- %20IDP%20New%20Term%20of%20Office%20July%202017%20to%20June% pdf 122


129 Figure G2: MSDF and MSDF Alignment Process 123
130 H. REPORTING AND EVALUATION The City has made progress with the establishment of baselines for the 8 indicators within the BEPP context and the finding appear in Annexure 1. The City is working on further details to verify the currently proposed/ working targets for the 8 indicators. The proposed approach and timelines for the population of the baselines for other indicators as well as the reporting arrangements are pending and will appear in the final BEPP document. The basic agreement at the moment is that the BEPP indicators will be reported on annually by several selected sector representatives who will be generating information from existing sources within a nonauditable environment. The BEPP has had the highest level of influence on the IDP and the Corporate Scorecard with records to spatial targeting. To date the City has managed to include in its corporate scorecard several new (13 of 40) indicators which will be monitoring the implementation of the 5+2 priority projects as described in the BEPP as well as the important strategic focus on Informal Settlement improvement. These elements are high on the City s IDP priorities and the relevant auditable indicators were included in the corporate scorecard visible below (Mar 2017 version) (refer Table H1 for an extract from draft corporate scorecard City IDP (2017/18 to 2021/22)). The City included 2 sets of baselines and targets in Annexure 1. Set 1 (8 indicators with City provided baselines and targets) and Set 2 (10 indicators with NT provided baselines and City provided targets). The City is awaiting the CSP s response on how the Metros continued support will contribute to the overall reduction in reporting obligations of Metropolitan Governments. 124
131 4.1. Dense and Transit Oriented Growth and Development 4.A Number of passenger journeys per kilometre operated (MyCiti) 4.B Percentage identified priority projects moved out of pre-projects to inception phase 4.C Percentage identified priority projects moved out of inception to implementation phase 3.2. Mainstreaming Basic Service Delivery to Informal Settlements and Backyard Dwellers 3.J Number of service points (toilet and tap with hand basin) provided to backyarders 3.K Number of electricity subsidided connections installed (NKPI) 3.L Percentage progress made in establishing a verifiable database that determines housing needs 3.M Percentage of allocated housing opportunity budget spent 3.N Number of deeds of sale agreements signed with identified beneficiaries per annum 3.O Number of sites serviced in the informal settlements (incremental housing & reblocking) 3.P Number of community services facilities within informal settlements 3.2. Mainstreaming Basic Service Delivery to Informal Settlements and Backyard Dwellers 3.G Number of water service points (taps) provided to informal settlements (NKPI) 3.H Number of sanitation service points (toilets) provided to informal settlements (NKPI) 3.I Percentage of informal settlements receiving a door-to-door refuse collection service (NKPI) Table H1: Extract from draft corporate scorecard City IDP (2017/18 to 2021/22) 125
132 Annexure 1: Format for Built Environment Outcomes Indicators & Targets 126
133 IndicatIndicator Name Baseline Year Baseline value Details from NT 16/17 data Details for 16/17 1 IC1 New subsidised units developed in Brownfields developments as a percentage of all new subsidised units city-wide 2016 June 37% (Number of new subsidised housing units in brownfields development) / (Total number of newly provided subsidised housing units city-wide) x100 i.e. (1251/ 3378)*100 2 IC2 Gross residential unit density per hectare within 2011 October 8.14du/has (Number of households in integration zones VRC integration zones) : (area of 28.09du/Ha integration zones (hectares)) 3 IC3 Ratio of housing types in integration zones 2016 June 1206:152:1350 (Number of subsidised units in 4 IC6 % households accessing subsidy units in integration zones that come from informal settlements 5 IC7 Number of all dwelling units within Integration Zones that are within 800 metres of access points to the integrated public transport system data & Nov as a percentage of all dwelling units within Integration Zones 6 WG13 Percentage change in the value of properties in Integration Zones (all units MSE including fully Social Housing, CRU, BNG, and and partially subsidised) integration zones) : (including FLISP/Gap units) : private market units, located in integration zones. The above does not m ake sense. City changed to # of subsidised (any erf and any top structure incl BNG): # partially subsidised (social & FLLISP): # private 2016 June 100% (Number of households from 2011 October population 2016 IPTN station data informal settlements accessing subsidy units in integration zones) / (Number of subsidy units provided in integration zones) VRC: Ha : units MSE: Ha: units VRC & MSE: Fully subsuidized units 1206: Partially subsidised/ GAP units 152 : Private market units, i.e (whicn include fully and partially subsidised i.e. roughly 8 : 1 : 1 17/18 target Details for 17/18 18/19 target 19/20 target (30 June 2017) (30 June 2018) 38% (1200/ 3140)*100 38% (1200/ 3153)*100 tbd tbd 922 : 578 : tbd at 30 June 17. 1,6 : 1 : 1?? Will remain the same until base population information upgrades are available 1,6 : 1 : 1?? 747 : 316 : tbd at 30 June 18 Will remain the same until base population information upgrades are available 2,4 : 1 : 1?? (1206/1206)*100 (922/922)* % (747/747)* % tbd 60.73% (Number of all dwelling units within Number of dwellings within 500m to existing BRT (trunk and Integration Zones that are within 800 metres of access points to the integrated public transport system) 871 & MSE: (( ) / ( )) * / (Number of dwelling units within Integration Zones) x and 2015 v 25.46% (((Value of privately owned buildings in integration zones on year 3) - (1)) / (Value of privately owned buildings in integration zones on year 1)) x100 high order) and Rail stations: VRC: & MSE: Number of dwelling units within Integration Zones: VRC: = 23% Number of dwellings within 800m to existing BRT (trunk and high order) and Rail stations in VRC & MSE: (R R ) / R )* % 61.00% tbd 25.46% Will increase based on Valuation Role increase estimated at CPI likely around 6% Will remain the same until base population information upgrades are available Similar to 18/19. Valuations role only updated every 3 years, next new VR 1 Jul WG7 Value of catalytic projects as listed in the BEPP at financial closure as a % of total MTREF capex budget value Jun-16 0% (Value of catalytic projects at financial closure) / (total capital budget in MTREF) x100 City 30 June 2016 (mainly opex): R2,7m/R17,9b (capex) for = 0.016% City estimate 30 June 2017 (mainly opex): R7,6m/R17,9b for (capex) = 0.043% City estimates 30 June 2017 (opex and capex): (R7,6m+R24,9M)/R17,9b = 0.18% City estimates 30 June 2018 (opex and capex): (R23m+R71,6M)/R20, 4b = 0.464% 0.713% tbd 8 WG8 The budgeted amount of municipal capital expenditure for catalytic projects contained in BEPP, as a percentage of the municipal capital budget. 0.12% (Budgeted expenditure on catalytic projects) / (Total municipal capital budget) x100 Mar 2017 (Capex): Estimated expenditure 30 June 2017 (R24,9m))/Originally approved budget 2017/18 as in May 2016 (R6,6b): 0.38% 0.84% 2.01% tbda7f6a9:l11c6:l1 127
134 IndicatIndicator Name City Contact person Contact No Notes 1 IC1 New subsidised units developed in Brownfields developments as a percentage of all new subsidised units city-wide 2 IC2 Gross residential unit density per hectare within integration zones Cassandra Gabriel cassandra.gabriel@capetown.gov.za Human Settlements' definition of Brownfields development is land identified for development where there are already inhabitants on. The projects that therefore relates to this description is in-situ upgrading of informal settlements as well as PHP projects as in both instances there are already inhabitants on the piece of land that will be developed. Base year: Number of new subsidised housing units in Brownfields developments as at 30 June 2016 = 1251/ Total number of newly provided subsidised housing units (Top-structures) city-wide as at 30 June 2016 = Jaco Petzer Jaco.Petzer@capetown.gov.za The city has used the definitions of dwelling units as per the Census 2011 and calcuated the overlap from small areas amalgamating to the boundaries of the Integration Zones. There is no 'artificia/ synthetic' population counts available from the 2016 General Household Survey data from STATS SA for years between census years on spatial areas smaller than metropolitan level. The City is in process to calculate the Dec 2016 figures based using its own Urban Growth Monitoring System but the updated data will only be available later in IC3 Ratio of housing types in integration zones Cassandra Gabriel & Jaco.Petzer@capetown.gov.za; The first part of the indicator is a response from the Human Settlments Department and is exactly the same as IC6. It Jaco Petzer cassandra.gabriel@capetown.gov.za includes what the city considers as 'fully subsidised' which is both erven and top structures (like BNG and other). The second part comes from HS and has a zero value because the data element is confusing in its description. City was not sure why BNG again included here. City proposes to keep this second group ONLY those 'partially subsidised' like FLISP and Social Housing. The City's information does not include FLISP by the Province or any project located outside the Intergration Zone although there are such projects. The third part is from the Urban Growth Monitoring System which is only available annually in June for the formal residential unit growth of the preceding year. this implies the number of unit occupied and where a rates bill is being transmitted to the new property owner. The City only has data for all the residential units completed and then have to deduct the'partially and fully subsidised unit's (FLISP/ Soc Housing and other subsidised units) because the UGMS does not relect the type of units separately. 4 IC6 % households accessing subsidy units in integration zones that come from informal settlements Cassandra Gabriel cassandra.gabriel@capetown.gov.za The position of Human Settlements is that all persons benefiting of our housing projects comes from a form of informality i.e. informal structure within an informal settlement, informal structure in the backyard or overcrowded conditions and therefore our answer to indicator IC6 will be that all beneficiary households within the integration zones come from informal settlements. Base year: Number of households from informal settlements accessing subsidy units in integration zones as at 30 June 2016 = 1206/ Number of subsidy units provided in integration zones as at 30 June 2016 = IC7 Number of all dwelling units within Integration Zones that are within 800 metres of access points to the integrated public transport system Jaco Petzer Jaco.Petzer@capetown.gov.za Integrated Public Transport System is considered as the existing BRT trunk and high order bus stations and rail stations. The access points/ bus stops to other bus services and taxis are not fixed, although considered operational but not an integrated sytem. The target is linked to many assumptions but includes the adding ofonly 4 new stations located within as a percentage of all dwelling units within Integration Zones 6 WG13 Percentage change in the value of properties in Integration Zones 7 WG7 Value of catalytic projects as listed in the BEPP at financial closure as a % of total MTREF capex budget value tyhe IZ. The base population remains for 2011 but contains elements of the projected 2017 population assuming a equal proportionate growth between 2011 and 2017 as was the contribution by the 2011 Small Areas to the totals of The target will remain untill the population estimates have been confirmed, the IZ boundaries amended or the stops increased. Llewellyn Louw Llewellyn.Louw@capetown.gov.za Includes valuations extracted the GV2012 and the GV2015 values, as well as ownership, for all properties within the integration zone. The growth in total roll values for all properties, is 25,46%. There is no unique identifier for privately vs nonprivately owned properties, so Government and Council owend properties will still need to be manually removed from the list if required. Also note that the there is a high likelihood that the proportionate increase in valuations (growth in R value) to the next period (from 1 July 2019) is going to be equal for the city compared to the Integration Zone. That pose the question to the relevance of this indicator as the proportional growth of the IZ is likely to stay stable unless compared to another IZ calculated separately or another control point e.g. like the CBD. It is impossible to get the growth for privately owned land unless we remove the government owned land manually. Annelise de Bruin Annelise.DeBruin@capetown.gov.za At 30 June 2016 no capital funding was spent on any Priority / Catalytic Project (NT definition in BEPP). However R19m of consultancy fees were committed to moving the projects into implementation phases. The majority of the funds on TRUP and Conradie. In 2016/17 the fees for planning documentation and rezoning applications (including specialist studies and EIAs) increased significantly to an estimated R35m (for both province and city) of the R20.4b MTEF capex of the City. Targets are draft and based on unconfirmed allocations for professional fees equal to the totals for 2016/17. 8 WG8 The budgeted amount of municipal capital expenditure for catalytic projects contained in BEPP, as a percentage of the municipal capital budget. Annelise de Bruin Annelise.DeBruin@capetown.gov.za Estimated expenditure by the City on capex for direct facilitation of priority projects as proportion of originally approved caped in May each year. 2017/18's estimated annual capex is as proposed in Mar Assumptions for 2018/19 is based on continuation of opex provisions for planning processes equal to the current year, and capital increases equal to the difference between period 2016// and 2017/ (which is 14% over the MTEF and 5% on the capital). 128
135 Indicator Indicator Name code 1 WG11 Non-grant capital as a percentage of total Baseline year: 2011 Baseline year: 2012 Baseline year: 2013 Baseline year: 2014 Baseline year: Baseline year: Baseline value (30 June (30 June (30 June (30 June 2014/15 ( /16 ( ) 2012) 2013) 2014) June 2015) Jun 2016) not not not not 52.8% 61.0% Estimated non-grant capex: 4 16/17 data (30 June 2017 target) 17/18 target 18/19 target 19/20 target 20/21 target (30 June (30 June (30 June (30 June 2018 target) 2019 target) 2020 target) 2021 target) 66% 67% 67% not capital expenditure city-wide available available available available available 2 IC9 Capital expenditure on integrated public not not not not 23% vs City 25.6% vs Estimated June 2017 PT Spent: 12.29% 10.44% 7.64% 8.12% not transport networks as a percentage of the available available available, available info 18.14% City info vs Tot Capex Spent: available municipal capital expenditure but City but City 16.36% information information 35.41% 18.64% 3 IC11a % learners travelling for longer than 30 minutes to not not not not not 15.5% an education institution available available available available available 4 IC11b % of workers travelling for longer than 30 minutes not not not not not 43.9% to their place of work available available available available available 5 PC1 Productive GVA of the single metro as a 9.7% vs City 9.8% vs City 9.9% vs City 9.9% vs City 9.9% vs City 10% vs City 10.03% 10.09% 10.16% 10.23% 10.29% percentage of national productive GVA info 9.55% info 9.65% info 9.76% info 9.81% info 9.86% info 9.96% 6 PC2 Productive GVA for a single metro per not not not not 109% vs City 106% vs City No of employed people ('000): % % % % % economically active person as a % of the national available available available available info % info % 2015: 1425, 2016:1468. GVA per productive GVA per economically active person. vs City Info vs City info vs City info vs City info person 2015: , 2016: 96.11% 97.30% 99.84% % City Info: No of employed people 2016: vs GVA: SC4 Green drop score for municipality 86.8% No audit 89.70% No audit No audit No audit Latest score released See comment conducted conducted conducted conducted and thus no and thus no and thus no and thus no score score score score released released released released 8 SC5 Blue drop score for the municipality 97.6% 98.1% No audit conducted and thus no score 9 SC6 Percentage of non-revenue water produced not available, vs City info 10 SC7 Non-revenue electricity as a percentage of not electricity purchased available not available, vs City info not available not available, vs City info not available 95.9% No audit conducted and thus no score not available, vs City info not available 21,4% vs City info 22.3% 11.3% vs City info 11.25% No audit Latest score released 95% 95% 95% 95% conducted and thus no score 21,3% vs (March 2017: 21.23%) 25% 25% 25% 25% City info 22.2% 10% vs City This is the target value for the 9.30% 9.30% 9.30% 9.30% 9.30% info 11.42% year. 129
136 Indicator code Indicator Name City Contact person Contact number Notes 1 WG11 Non-grant capital as a percentage of total capital expenditure city-wide Karen Fourie Karen.Fourie@cape 2012/21falls outside of the MTREF period as well as National and Provincial Treasury allocations published. town.gov.za 2 IC9 Capital expenditure on integrated public Karen Fourie & Annelise.debruin@c Any work that the City do on our road network could benefit public transport. However, for the purposes of this transport networks as a percentage of the municipal capital expenditure Paul Vink apetown.gov.za exercise, we have certain dedicated public transport programmes or major projects which have been (up until the current financial year where the non-approval of the roll over left us with a budget shortfall) funded exclusively by the Public Transport Grant allocations. In the current financial year, due to the non-approval of the PTNG rollover, the grant funding was supplemented by EFF and PTI&SG funding. In the 18/19 and 19/20 financial years there was talk of supplementing the shrinking PTNG budget with EFF funding, but futher clarification is required. At the moment the amounts were inserted as PTNG grant allocations. 3 IC11a % learners travelling for longer than 30 minutes to Annelise de Bruin Annelise.debruin@c The City's work on this does was done on a completely alternative methodolody and cannot compare to the 30 an education institution apetown.gov.za minutes travel time element. Further understanding of this indicator is requried considering that all the City's 4 IC11b % of workers travelling for longer than 30 minutes to their place of work Annelise de Bruin Annelise.debruin@c information was already provided earlier apetown.gov.za 5 PC1 Productive GVA of the single metro as a Paul Court Paul Court Indicators PC1 and PC2 have been evaluated. The relevance of either indicator as a measure of the economic percentage of national productive GVA <Paul.Court@capet performance or growth of the city, is still questioned. It would make more sense to use growth rates than own.gov.za> proportions of national output figures. For example if the national economy (GDP/GVA) is shrinking but Cape Town's economy is remaining stagnant then our share of the national GVA or GVA per capita will rise. But this won t in any 6 PC2 Productive GVA for a single metro per Paul Court Paul Court way suggest that we are performing well or even growing. We would also question the use of Gross Value Added economically active person as a % of the national <Paul.Court@capet (GVA) instead of Gross Domestic Product (GDP)/ Gross Geographic Product (GGP). Are we able to suggest a productive GVA per economically active person. own.gov.za> change in this? Nevertheless we made some projections for either indicator based on Cape Town and South Africa growing at the same rate that they have in the past five years. Assumption has simply been that Cape Town and South Africa s GVA and economically active population has continued growing at the average rate of the past 7 years. This is a highly simplified assumption and one which we would ideally not like to be the case. It is, however, the most conservative and defendable estimate. Data source is IHS Markit. 7 SC4 Green drop score for municipality Willem van der Merwe willem.vandermer we@capetown.go v.za Comment: This indicator is not very useful and should be parked. CCT W&S Dept is still in discussion with DWS to review and finalise the latest water treatment licence conditions. The implementation of the new more stringent lisence conditions will most probably affect compliance and the CCT baseline might significantly decrease. Therefore reporting on future Green Drop scores should be put on hold until discussions have been concluded. CCT is therefore currently not in a position to set any future targets. 8 SC5 Blue drop score for the municipality Willem van der Merwe willem.vandermer we@capetown.go v.za Based on previous rounds, the City has already included Blue Drop in our SDBIPs, along NRW% which has been part of our SDBIP for a number of year. No corrections on definitions reaised again, as previous corrections were not taken into account in any case. E.g.: Blue Drop definition not correct and Blue drop is measured per calendar year and not financial year. For Blue and Green Drops, City has entered the scores of the year audited, not the year in which a 9 SC6 Percentage of non-revenue water produced Willem van der Merwe willem.vandermer we@capetown.go v.za score was released, as this may happen only years later. Note also how audits are not conducted every two years as per the definitions. 10 SC7 Non-revenue electricity as a percentage of Gary Michael GaryMichael.Ross@ Not sure where the 2014/15 and 15/16 losses figures came from, as they were not completely accurate (15/16 was electricity purchased Ross Head: Pricing and Regulation capetown.gov.za quite a way off). These have been corrected on ths sheet. Also included targets as per the City's SDBIP in the 2017 IDP for the future years, with the assumption that the current target will not change over the period (not necessarily true). The formula used by NT is the same as the one the City uses. Please note however that in terms of the NERSA benchmarks, acceptable losses are below 12%, and not between 7% and 10% as suggested by NT. 130
137 Annexure 2: Intergovernmental Project Pipeline 131
138 Location of project budgets per spatially targeted zone (See Figure 2A) - as on 1 April 2017 Summary of project budgets in relation to spatially targeting zones (Note the location of some of the projects is under verification because some projects were earmarked as City wide / outside whilst their location could actually be allocated to a specific targeted zone) Table 2A: Budget per BEPP Spatially Targeted Theme / Area Total capital budget: City and other sources (if available) incl ESKOM, PRASA, WCG Education, WCG Health, WCG: Roads Number of projects 2016/17 MTEF Budget FY16/17 MTEF Budget FY17/18 MTEF Budget FY18/19 MTEF Budget FY19/20 TOTAL 17/18-19/20 Total Inside any IZ 692 1,970,905,305 1,155,566,035 1,175,472, ,954,507 3,118,993,225 Total inside the Marginalised Areas (MA) 464 1,292,386,723 1,002,241, ,411, ,610,507 2,149,263,949 Total inside the Areas of Economic Potential (AOEP) 418 1,782,156, ,824, ,022, ,682,500 2,259,529,578 All other projects located outside any of the above ,735,301,417 3,767,550,617 3,763,358,412 2,827,409,486 10,358,318,515 TOTAL PROJECTS ,780,749,618 6,689,182,898 6,689,265,369 4,507,657,000 17,886,105,267 Total budget for capital projects in % Number of projects 2016/17 MTEF Budget FY16/17 MTEF Budget FY17/18 MTEF Budget FY18/19 MTEF Budget FY19/20 TOTAL 17/18-19/20 Total Inside any IZ 19% 25% 17% 18% 17% 17% Total inside the Marginalised areas 13% 17% 15% 13% 6% 12% Total inside the Areas of Economic Potential (AOEP) 12% 23% 11% 13% 13% 13% All other projects located outside any of the above 56% 35% 56% 56% 63% 58% TOTAL PROJECTS 100% 100% 100% 100% 100% 100% 132

139 Figure 2A: Spatial Targeting areas with priority projects in the City of Cape Town 133
140 Integration Zones (See Figure 2B) - as on 1 April 2017 Summary of project budgets in relation to spatially targeting zones (Note the location of some of the projects is under verification because some projects were earmarked as City wide / outside whilst their location could actually be allocated to a specific targeted zone) Total budget for capital projects Number of projects 2016/17 MTEF Budget FY16/17 MTEF Budget FY17/18 MTEF Budget FY18/19 MTEF Budget FY19/20 TOTAL 17/18- Total Inside any IZ 692 1,970,905,305 1,155,566,035 1,175,472, ,954,507 3,118,993,225 Total Outside any IZ 2,899 5,809,844,313 5,533,616,863 5,513,792,686 3,719,702,493 14,767,112,042 Total capital budget: City and other sources (if available) incl ESKOM, PRASA, WCG Education, WCG Health, WCG: Roads 19/ ,780,749,618 6,689,182,898 6,689,265,369 4,507,657,000 17,886,105,267 % of projects in any IZ 25.33% 17.28% 17.57% 17.48% 17.44% % of projects located ourside any IZ 74.67% 82.72% 82.43% 82.52% 82.56% Total budget for capital projects in % Number of projects 2016/17 MTEF Budget FY16/17 MTEF Budget FY17/18 MTEF Budget FY18/19 MTEF Budget FY19/20 TOTAL 17/18- Only VTR ,068, ,652,226 40,000,000 17,000, ,554,665 Only MSE ,845,177 41,061,406 11,430,000 70,511, ,971,879 Onlly BD 92 31,105,315 82,107, ,767,475 72,360, ,159,037 Only Ph2A ,885, ,275, ,055, ,416,000 - Total in all Izs 692 1,970,905,305 1,159,097, ,253, ,288,014 2,382,685,581 % of projects in VTR 46% 69% 6% 3% 20% % of projects in MSE 45% 4% 2% 12% 40% % of projects in BD 2% 7% 24% 13% 40% % of projects in Ph 2A 7% 21% 68% 72% 0% 19/20 134
141 Selection of highest valued projects WBS Element Project name Project leader (metro or province NT classification Catalytic Catalytic/ MTEF Budget MTEF Budget MTEF Budget MTEF Budget TOTAL 17/18- IZ: VRC IZ: MSE IZ: Blue and directorate) group classification/ group Priority Project FY16/17 FY17/18 FY18/19 FY19/20 19/20 Downs C F4 IRT Phase 2A CCT:Transport & Urban Catalytic: Liv e Contribute to Top Philippi East - 187,807, ,417, ,224,000 Yes Dev elopment Authority Work Play 5/5 + 2 C F2 Athlone WWTW-Capacity CCT:Informal Settlements, Water & Catalytic: Liv e Contribute to Top Athlone Power 6,000,000 36,000,000 84,000,000 75,000, ,000,000 Yes Extension-phase 1 Waste Serv Work Play 5/5 + 2 Station Not prov ided CI860012: Observ atory - WCG: HEALTH 9,390,000 20,181,000 73,139,000 60,000, ,320,000 Yes Observ atory FPL - Replacement CPX F1 Ndabeni: Facilities CCT:Energy Engineering/Infrastr ,000,000 70,000, ,000,000 Yes Rearrangement ucture CPX F1 Bellv ille WWTW Extension CCT:Informal Settlements, Water & Catalytic: Liv e Contribute to Top Bellv ille 43,150,000 50,065,000 50,700, ,765,000 Yes Waste Serv Work Play 5/5 + 2 CPX F2 Langa Hostels CRU Prj: Special CCT:Assets & Facilities Management Human Settlement 1,623,188 31,083,588 60,829,076-91,912,664 Yes Quarters CPX F1 IDA/UISP Sweethomes-Philippi CCT:Informal Settlements, Water & Human Settlement 12,500,000 35,000,000 35,000,000-70,000,000 Yes Waste Serv Not prov ided Belhar CBD Phase 2 WCG: HUM. SETT. - 5,000,000 24,000,000 35,000,000 64,000,000 Yes IZ: Phase 2 A (conceptual CPX F1 Road Rehabilitation:Bishop Lav is CCT:Transport & Urban Dev elopment Authority Engineering/Infrastr ucture 37,866,902 53,000,000 8,500,000-61,500,000 Yes CPX F1 IRT PH2A-Stock Road CCT:Transport & Urban Dev elopment Authority Catalytic: Liv e Work Play Contribute to Top 5/5 + 2 Philippi East 58,000,000 50,000,000 10,000,000-60,000,000 Yes Not prov ided Conradie WCG: HUM. SETT. Contribute to Top 5/5 + 2 Conradie Hospital - 5,000,000 5,000,000 85,438,000 95,438,000 Yes Not prov ided CH850050: Parow - Tygerberg Hospital - HT - Refurbishment WCG: HEALTH 8,000,000 25,745,000 20,710,000 11,000,000 57,455,000 Yes Not prov ided Glenhav en Social (416) WCG: HUM. SETT. NDHS: Catalytic HS projects - 4,000,000 25,000,000 23,000,000 52,000,000 Yes Not prov ided Joe Slov o WCG: HUM. SETT. - 5,000,000 20,000,000 25,000,000 50,000,000 Yes Not prov ided Kosov o WCG: HUM. SETT. NDHS: Catalytic HS projects 1,055,000 4,500,000 22,000,000 20,849,000 47,349,000 Yes Not prov ided Mupine WCG: HUM. SETT. 1,000,000 3,500,000 15,000,000 27,000,000 45,500,000 Yes Not prov ided CH850050: Parow - Tygerberg Hospital - HT - Refurbishment WCG: HEALTH ,915,000 28,126,000 45,041,000 Yes Not prov ided Nuwe Begin WCG: HUM. SETT. 1,643,000 5,000,000 15,000,000 25,000,000 45,000,000 Yes CPX F1 Road Rehabilitation:Hanov er Park:Ph2&Ph3 CCT:Transport & Urban Dev elopment Authority Engineering/Infrastr ucture 7,000,000 35,000,000 8,000,000-43,000,000 Yes Not prov ided Sheffield Road WCG: HUM. SETT. 1,500,000 5,000,000 15,000,000 22,000,000 42,000,000 Yes CPX F2 Metro South East Public CCT:Transport & Urban Catalytic: Liv e Contribute to Top Philippi East 7,500,000 20,000,000 20,000,000-40,000,000 Yes Transport Facili Dev elopment Authority Work Play 5/5 + 2 CPX F1 UISP: 8ste Laan -Valhalla Park CCT:Informal Settlements, Water & Waste Serv Human Settlement NDHS: Catalytic HS projects 15,502,900 33,000,000 4,500,000-37,500,000 Yes CPX F2 Langa Hostels CRU Project: New CCT:Assets & Facilities Management Human Settlement 809,294 17,173,590 19,286,032-36,459,622 Yes Flats Not prov ided CH850057: Observ atory - Groote WCG: HEALTH ,277,000 22,084,000 33,361,000 Yes Schuur Hospital - HT - CPX F1 Harare Infill Housing Project CCT:Transport & Urban Human Settlement 1,200,000 15,000,000 15,076,000 1,300,000 31,376,000 Yes Dev elopment Authority Not prov ided Woodstock WCG: HUM. SETT. 27,969,000 25,000,000 5,997,000-30,997,000 Yes 135
142 WBS Element Project name Project leader (metro or province NT classification Catalytic Catalytic/ MTEF Budget MTEF Budget MTEF Budget MTEF Budget TOTAL 17/18- IZ: VRC IZ: MSE IZ: Blue and directorate) group classification/ group Priority Project FY16/17 FY17/18 FY18/19 FY19/20 19/20 Downs CPX F1 Koeberg Road Switching Station CCT:Energy Engineering/Infrastr Contribute to Top Athlone Power ,199,100-29,199,100 Yes Phase 3 ucture 5/5 + 2 Station C F1 Rietv lei P/Station, R/Main CCT:Informal Settlements, Water & Engineering/Infrastr - 10,700,000 16,000,000-26,700,000 Yes Bottelary Waste Serv ucture CPX F1 Road Constr:Belhar Main CCT:Transport & Urban Engineering/Infrastr - 18,000,000 8,000,000-26,000,000 Yes Rd:Stllndl-Hghby Dev elopment Authority ucture Not prov ided CI850049: Parow - Tygerberg WCG: HEALTH - 5,000,000 10,000,000 10,000,000 25,000,000 Yes Hospital - Sewerage Upgrade Not prov ided CI850055: Observ atory - Groote WCG: HEALTH ,000,000 10,000,000 25,000,000 Yes Schuur Hospital - Ventilation and CPX F1 Langa Hostels CRU Prj: Special CCT:Assets & Facilities Management Human Settlement - 10,000,000 10,000,000 4,000,000 24,000,000 Yes Quarters CPX F1 IRT Phase 2A:Consultants: East CCT:Transport & Urban Catalytic: Liv e Contribute to Top Philippi East 5,500,000 12,000,000 12,000,000-24,000,000 Yes Dev elopment Authority Work Play 5/5 + 2 Not prov ided CI840022: Observ atory - WCG: HEALTH 37,273,000 23,000, ,000-23,640,000 Yes Valkenberg Hospital - Not prov ided CI810021: Elsies Riv er - Elsies Riv er WCG: HEALTH - 2,000,000 5,000,000 15,000,000 22,000,000 Yes CHC - Replacement CPX F2 Zakhele Clinic - Replacement CCT:Social Serv ices Other - 2,000,000 10,000,000 9,400,000 21,400,000 Yes IZ: Phase 2 A (conceptual Not prov ided CH850057: Observ atory - Groote WCG: HEALTH - 10,497,000 7,140,000 3,344,000 20,981,000 Yes Schuur Hospital - HT - Not prov ided CI810017: Cape Town - District Six CDC - New WCG: HEALTH 39,384,000 19,710,000 1,095,000-20,805,000 Yes CPX F1 Roads: Rehabilitation CCT:Transport & Urban Dev elopment Authority Engineering/Infrastr ucture - 20,150, ,150,000 Yes Not prov ided CI850042: Observ atory - Groote WCG: HEALTH - 5,000,000 15,000,000-20,000,000 Yes Schuur Hospital - Neuroscience CPX F1 ARTS:Material Recov ery Facility / CCT:Informal Settlements, Water & Engineering/Infrastr 500,000 4,500,000 15,000,000-19,500,000 Yes MBT Waste Serv ucture Not prov ided C1025 Wingfield i/c AFR WCG: PUBLIC WORKS 31,369,000 19,156, ,156,000 Yes Not prov ided CI830119: Bellv ille - Karl Bremer WCG: HEALTH - 1,000 4,000,000 15,000,000 19,001,000 Yes Hospital - Hospital and Nurses CPX F2 Langa Hostels CRU Project: CCT:Assets & Facilities Management Human Settlement 356,290 1,425,159 1,425,159 15,494,237 18,344,555 Yes Siyahlala Not prov ided CO830072: Mitchell's Plain - Mitchell's Plain Hospital - OD - WCG: HEALTH 4,197,000 5,358,000 6,079,000 6,614,000 18,051,000 Yes Not prov ided CI840067: Maitland - Alexandra WCG: HEALTH - 1,000 1,500,000 16,000,000 17,501,000 Yes Hospital - Repairs and Not prov ided CI850047: Parow - Tygerberg Hospital - 11kV Generator Panel WCG: HEALTH 500,000 7,000, ,000 10,000,000 17,500,000 Yes CPX F1 Ilitha Park Infill Internal Serv ices CCT:Transport & Urban Dev elopment Authority Human Settlement 450,000 9,500,000 6,799, ,000 17,099,000 Yes Not prov ided CI850005: Observ atory - Groote WCG: HEALTH 2,679,000 1,000,000 8,000,000 8,000,000 17,000,000 Yes Schuur Hospital - EC upgrade CPX F1 IRT PH2A-Consultants-Depots CCT:Transport & Urban Catalytic: Liv e Contribute to Top Philippi East 5,000,000 8,000,000 9,000,000-17,000,000 Yes Dev elopment Authority Work Play 5/5 + 2 C F1 Upgrade of Athlone Stadium CCT:Assets & Facilities Management Other 12,800,000 6,000,000 6,000,000 5,000,000 17,000,000 Yes Not prov ided CI810038: Hanov er Park - Hanov er Park CHC - WCG: HEALTH - 500,000 3,380,000 12,000,000 15,880,000 Yes Not prov ided CI850054: Observ atory - Groote WCG: HEALTH - 4,000,000 5,000,000 6,000,000 15,000,000 Yes Schuur Hospital - BMS Upgrade 136
143 Figure 2B: Location of projects on capital budgets of City, Province and SOEs in relation to Integration Zones 137
144 Areas of Economic Potential (See Figure 2C) - as on 1 April 2017 Summary of project budgets in relation to spatially targeting zones (Note the location of some of the projects is under verification because some projects were earmarked as City wide / outside whilst their location could actually be allocated to a specific targeted zone) Total budget for capital projects Total inside the Areas of Economic Potential (AOEP) Total outside the Areas of Economic Potential (AOEP) Total capital budget: City and other sources (if av ailable) incl ESKOM, PRASA, WCG Education, WCG Health, WCG: Roads Number of MTEF Budget projects for FY16/17 MTEF Budget FY17/18 MTEF Budget MTEF Budget TOTAL 17/18- FY18/19 FY19/20 19/ ,782,156, ,824, ,022, ,682,500 2,259,529,578 3,173 5,998,593,445 5,920,598,625 5,801,242,564 3,899,974,500 15,621,815,689 3,591 7,780,749,618 6,684,422,898 6,689,265,369 4,507,657,000 17,881,345,267 % of project v alue located in AOEP 23% 11% 13% 13% 13% % of project v alue located outside AOEP 77% 89% 87% 87% 87% Total budget for capital projects in % Only inside AOEP Total in AOEP Number of projects for MTEF Budget FY16/17 MTEF Budget FY17/18 MTEF Budget MTEF Budget TOTAL 17/18- FY18/19 FY19/20 19/ ,642,928 29,100,000-19,900, ,502, ,642,928 29,100,000-19,900, ,502,
145 Selection of highest valued projects WBS Element Project name Project leader (metro or PROGRAMME province and directorate) NT classification group Catalytic classification/ group Catalytic/ Priority MTEF Project Budget supported by the FY16/17 project MTEF Budget FY17/18 MTEF Budget FY18/19 MTEF Budget FY19/20 TOTAL 17/18- AEP 19/20 Not prov ided Airport Precinct WCG: HUM. SETT. 20,226,000 65,000,000 55,000,000 65,000, ,000,000 Yes Not prov ided CPX F 1 C F1 Observ atory FPL - New infrastructure Replacement Ndabeni: Facilities WCG: HEALTH assets 9,390,000 20,181,000 73,139,000 60,000, ,320,000 Yes Engineering/Infras Rearrangement CCT:Energy Capex Borchards Quarry WWTW CCT:Informal Settlements, Water & Waste Serv Capex tructure ,000,000 70,000, ,000,000 Yes Engineering/Infras tructure 99,900,000 59,500,000 50,000, ,500,000 Yes Not provided Blue Downs Erf 1896 WCG: HUM. SETT. 6,085,000 25,000,000 20,000,000 15,496,000 60,496,000 Yes CPX F Inner City:Public Transport CCT:Transport & Urban Catalytic: Liv e Contribute to Top 5/5 1 Hub Dev elopment Authority Capex Work Play + 2 CBD Sites 2,000,000 10,000,000 50,000,000-60,000,000 Yes Not prov ided Boystown WCG: HUM. SETT. 4,500,000 25,000,000 28,997,000 5,000,000 58,997,000 Yes Contribute to Top 5/5 Conradie Not prov ided Conradie WCG: HUM. SETT. + 2 Hospital 500,000 16,300,000 25,000,000 17,200,000 58,500,000 Yes C F2 City Depot CBD - New CCT:Energy Capex Engineering/Infras tructure 74,994,900 57,191, ,191,110 Yes Not prov ided Glenhav en Social (416) WCG: HUM. SETT. NDHS: Catalytic HS projects - 4,000,000 25,000,000 23,000,000 52,000,000 Yes Not prov ided CI830052: Wynberg - Victoria Hospital - New EC WCG: HEALTH Upgrades and additions 853,000 8,217,000 29,000,000 14,050,000 51,267,000 Yes C F1 Potsdam WWTW - Extension CCT:Informal Settlements, Water & Waste Serv Capex Engineering/Infras tructure 2,120,000 14,000,000 35,000,000-49,000,000 Yes Not prov ided Mupine WCG: HUM. SETT. 1,000,000 3,500,000 15,000,000 27,000,000 45,500,000 Yes CPX F 1 Kanonkop (Atlantis) Phase 2 Ext12 CCT:Transport & Urban Dev elopment Authority Capex Human Settlement 1,000,000 20,000,000 22,000,000-42,000,000 Yes CO860038: Infra Unit - Infra Not prov ided Planning - OD - Capacitation WCG: HEALTH Non Infrastructure 12,710,000 11,752,000 12,915,000 14,065,000 38,732,000 Yes CPX F CCT:Transport & Urban 1 Edgemead / Bothasig NMT Dev elopment Authority Capex Public Transport - 16,200,000 21,600,000-37,800,000 Yes Not prov ided Groote Schuur Hospital - HT - Refurbishment WCG: HEALTH Non Infrastructure ,277,000 22,084,000 33,361,000 Yes Not prov ided Woodstock WCG: HUM. SETT. 27,969,000 25,000,000 5,997,000-30,997,000 Yes CPX F 1 City corporate access fibre connections CCT:Corporate Serv ices Capex Other - 21,892,934 7,378, ,500 30,044,089 Yes 139
146 WBS Element Project name Project leader (metro or province and directorate) PROGRAMME NT classification group Catalytic classification/ group Catalytic/ Priority MTEF Project Budget supported by the FY16/17 project MTEF Budget FY17/18 MTEF Budget FY18/19 MTEF Budget FY19/20 TOTAL 17/18- AEP 19/20 CPX F 1 Not prov ided C F1 C F1 CPX F 1 Not prov ided Not prov ided Not prov ided CPX F 1 CPX F 1 CPX F 1 Not prov ided Not prov ided Not prov ided Not prov ided Not prov ided C F1 CPX F 1 CPX F 1 Koeberg Road Switching Station Phase 3 CCT:Energy Capex Prog Deliv ery - OD - Engineering/Infras Contribute to Top 5/5 Athlone Power tructure + 2 Station ,199,100-29,199,100 Yes Capacitation WCG: HEALTH Non Infrastructure 5,427,000 8,851,000 9,638,000 10,497,000 28,986,000 Yes Upgrading of City Hall Rietv lei P/Station, R/Main Bottelary Road Constr:Belhar Main Rd:Stllndl-Hghby Eng Workshop - OD - CCT:Assets & Facilities Management Capex Other 23,000,000 11,300,000 10,500,000 5,000,000 26,800,000 Yes CCT:Informal Settlements, Engineering/Infras Water & Waste Serv Capex tructure - 10,700,000 16,000,000-26,700,000 Yes CCT:Transport & Urban Engineering/Infras Dev elopment Authority Capex tructure - 18,000,000 8,000,000-26,000,000 Yes Capacitation WCG: HEALTH Non Infrastructure 4,893,000 7,694,000 8,691,000 9,465,000 25,850,000 Yes Groote Schuur Hospital - Ventilation and AC Somerset Hospital - Acute Psychiatric Unit Road Constr:Saxdowns Rd:Lngv rwch-vanrbck R44 Extra N-bound Lane - Foundry Precinc Commercial client access WCG: HEALTH Refurbishment and rehabilitation ,000,000 10,000,000 25,000,000 Yes Upgrades and WCG: HEALTH additions 749, ,000 9,000,000 15,000,000 24,750,000 Yes CCT:Transport & Urban Engineering/Infras Dev elopment Authority Capex tructure 1,300,000 11,200,000 13,000,000-24,200,000 Yes CCT:Transport & Urban Catalytic: Liv e Contribute to Top 5/5 Dev elopment Authority Capex Work Play + 2 Paardev lei 2,000,000 18,000,000 6,000,000-24,000,000 Yes fibre routes CCT:Corporate Serv ices Capex Other - 15,118,769 4,211,174 3,125,000 22,454,943 Yes CI810021: Elsies Riv er - Elsies Riv er CHC - Replacement Groote Schuur Hospital - HT - New infrastructure WCG: HEALTH assets - 2,000,000 5,000,000 15,000,000 22,000,000 Yes Refurbishment WCG: HEALTH Non Infrastructure - 10,497,000 7,140,000 3,344,000 20,981,000 Yes CI810017: Cape Town - District Six CDC - New WCG: HEALTH New infrastructure assets 39,384,000 19,710,000 1,095,000-20,805,000 Yes Rav ensmead CDC - New infrastructure Replacement WCG: HEALTH assets 500, ,000 5,000,000 15,000,000 20,500,000 Yes Groote Schuur Hospital - Infrastructure Neuroscience Rehabilitation WCG: HEALTH transfers - Capital - 5,000,000 15,000,000-20,000,000 Yes Flood Allev iation - Lourens CCT:Transport & Urban Engineering/Infras Riv er Dev elopment Authority Capex tructure 12,483,906 10,000,000 10,000,000-20,000,000 Yes Branch systems, facilities and test equi CCT:Corporate Serv ices Capex Other 1,691,203 12,770,697 5,544,013-18,314,710 Yes Repl & Upgr Sew Pump Station CCT:Informal Settlements, Engineering/Infras Water & Waste Serv Capex tructure ,000,000-18,000,000 Yes 140

147 Figure 2C: Location of projects on capital budgets of City, Province and SOEs in relation to areas of economic opportunity 141
148 Marginalised Areas (See Figure 2D) - as on 1 April 2017 Summary of project budgets in relation to spatially targeting zones (Note the location of some of the projects is under verification because some projects were earmarked as City wide / outside whilst their location could actually be allocated to a specific targeted zone) Total budget for capital projects Total inside the Marginalised areas Total outside the Marginalised areas Total capital budget: City and other sources (if av ailable) incl ESKOM, PRASA, WCG Education, WCG Health, WCG: Roads Number of projects for 2016/17 MTEF Budget FY16/17 MTEF Budget FY17/18 MTEF Budget FY18/19 MTEF Budget FY19/20 TOTAL 17/18-19/ ,292,386,723 1,002,241, ,411, ,610,507 2,149,263,949 3,127 6,488,362,895 5,686,940,925 5,826,853,900 4,223,046,493 15,736,841,318 3,591 7,780,749,618 6,689,182,898 6,689,265,369 4,507,657,000 17,886,105,267 % of project v alue located in MA 17% 13% 11% 4% 28% % of project v alue located outside MA 83% 73% 75% 54% 202% Total budget for capital projects in % Only Majoral Urban Renewal Areas (MURP) Only Social Mobility Areas (SMA) Total in all Marginalised Areas % of project budgets in Number of projects for 2016/17 MTEF Budget FY16/17 MTEF Budget FY17/18 MTEF Budget FY18/19 MTEF Budget FY19/20 TOTAL 17/18-19/ ,897, ,522,080-12,000, ,212, ,882, ,844, ,321,780, ,366,247-12,000, ,212,112 MURP 47% 79% 0% 100% 100% % of project budgets in SMA 53% 21% 0% 0% 0% 142
149 Selection of highest valued projects WBS Element Project name Project leader (metro or province and directorate) PROGRAM NT ME classification group Catalytic classification/ group Catalytic/ Priority Project supported by the project MTEF Budget FY16/17 MTEF Budget FY17/18 MTEF Budget FY18/19 MTEF Budget FY19/20 TOTAL 17/18-19/20 MURP SMA CCT:Transport & Urban Liv e Work Contribute to Top 5/5 C F4 IRT Phase 2A Dev elopment Authority Capex Play + 2 Philippi East - 187,807, ,417, ,224,000 Yes Not prov ided Airport Precinct WCG: HUM. SETT. 20,226,000 65,000,000 55,000,000 65,000, ,000,000 Yes C F1 Sir Lowry's Pass Riv er Upgrade CCT:Transport & Urban Dev elopment Authority Capex Engineering/I nfrastructure 13,000,000 40,000,000 60,000, ,000,000 Yes CPX F2 Langa Hostels CRU Prj: Special Quarters CCT:Assets & Facilities Management Capex Human Settlement 1,623,188 31,083,588 60,829,076-91,912,664 Yes Yes CPX F1 IDA/UISP Sweethomes-Philippi CCT:Informal Settlements, Water & Waste Serv Capex Human Settlement 12,500,000 35,000,000 35,000,000-70,000,000 Yes Yes CCT:Transport & Urban Human CPX F2 Imizamo Yethu Housing Project (Phase 3) Dev elopment Authority Capex Settlement - 3,300,000 33,615,000 25,500,000 62,415,000 Yes CCT:Transport & Urban Engineering/I CPX F1 Road Rehabilitation:Bishop Lav is Dev elopment Authority Capex nfrastructure 37,866,902 53,000,000 8,500,000-61,500,000 Yes CPX F1 IRT PH2A-Stock Road CCT:Transport & Urban Dev elopment Authority Capex Liv e Work Play Contribute to Top 5/5 + 2 Philippi East 58,000,000 50,000,000 10,000,000-60,000,000 Yes Not prov ided Boystown WCG: HUM. SETT. 4,500,000 25,000,000 28,997,000 5,000,000 58,997,000 Yes Not prov ided Delft 7 WCG: HUM. SETT. 1,500,000 15,000,000 27,500,000 13,000,000 55,500,000 Yes CPX F1 UISP: Kalkfontein Informal Settlement CCT:Informal Settlements, Water & Waste Serv Capex Human Settlement 17,000,200 38,000,000 17,000,000-55,000,000 Yes CCT:Informal Settlements, CPX F1 Vissershok North:Design and develop Airs Water & Waste Serv Capex Other 1,500,000 21,500,000 32,000,000-53,500,000 Yes Not prov ided Joe Slov o WCG: HUM. SETT. - 5,000,000 20,000,000 25,000,000 50,000,000 Yes Not prov ided Kosov o WCG: HUM. SETT. NDHS: Catalytic HS projects 1,055,000 4,500,000 22,000,000 20,849,000 47,349,000 Yes CPX F1 Road Rehabilitation:Hanov er Park:Ph2&Ph3 CCT:Transport & Urban Dev elopment Authority Capex Engineering/I nfrastructure 7,000,000 35,000,000 8,000,000-43,000,000 Yes CCT:Transport & Urban Engineering/I C F3 Sir Lowry's Pass Riv er Upgrade Dev elopment Authority Capex nfrastructure 7,000,000 7,000,000 31,000,000 3,500,000 41,500,000 Yes CPX F2 Metro South East Public Transport Facili CCT:Transport & Urban Dev elopment Authority Capex Liv e Work Play Contribute to Top 5/5 + 2 Philippi East 7,500,000 20,000,000 20,000,000-40,000,000 Yes CPX F1 UISP: 8ste Laan -Valhalla Park CCT:Informal Settlements, Water & Waste Serv Capex Human Settlement NDHS: Catalytic HS projects 15,502,900 33,000,000 4,500,000-37,500,000 Yes Not prov ided Thabo Mbeki WCG: HUM. SETT. - 2,000,000 5,000,000 30,000,000 37,000,000 Yes Not prov ided Tsunami WCG: HUM. SETT. 1,500,000 10,000,000 25,000,000 2,000,000 37,000,000 Yes CPX F2 Langa Hostels CRU Project: New Flats CCT:Assets & Facilities Management Capex Human Settlement 809,294 17,173,590 19,286,032-36,459,622 Yes CPX F1 IRT PH2A-Strandfontein Rd Upgrade CCT:Transport & Urban Dev elopment Authority Capex Liv e Work Play Contribute to Top 5/5 + 2 Philippi East 92,809,000 35,000, ,000,000 Yes 143
150 WBS Element Project name Project leader (metro or province and directorate) PROGRAM NT ME classification group Catalytic classification/ group Catalytic/ Priority Project supported by the project MTEF Budget FY16/17 MTEF Budget FY17/18 MTEF Budget FY18/19 MTEF Budget FY19/20 TOTAL 17/18-19/20 MURP SMA CPX F1 Harare Infill Housing Project CCT:Transport & Urban Dev elopment Authority Capex Human Settlement 1,200,000 15,000,000 15,076,000 1,300,000 31,376,000 Yes Imizamo Yethu - Hout Bay Housing CCT:Transport & Urban Human CPX F1 Project Dev elopment Authority Capex Settlement 4,250,000 5,300,000 6,440,000 15,000,000 26,740,000 Yes CPX F1 Vissershok South:LFG Infrastructure to F CCT:Informal Settlements, Water & Waste Serv Capex Other - 25,000, ,000-25,200,000 Yes CPX F1 Langa Hostels CRU Prj: Special Quarters CCT:Assets & Facilities Management Capex Human Settlement - 10,000,000 10,000,000 4,000,000 24,000,000 Yes Yes Not prov ided Hospital and Nurses Home Repairs and Renov ation WCG: HEALTH ent and rehabilitati - 1,000 4,000,000 15,000,000 19,001,000 Yes CPX F1 Imizamo Yethu Ph 3, Site 2: Bulk EarthW CCT:Transport & Urban Dev elopment Authority Capex Engineering/I nfrastructure - 19,000, ,000,000 Yes CPX F2 Langa Hostels CRU Project: Siyahlala CCT:Assets & Facilities Management Capex Human Settlement 356,290 1,425,159 1,425,159 15,494,237 18,344,555 Yes Yes CPX F1 Imizamo Yethu Ph 3, Site 2: Rds & SW CCT:Transport & Urban Dev elopment Authority Capex Engineering/I nfrastructure - 18,000, ,000,000 Yes CPX F1 D5,7&8-REP-GUGULETHU-VARIOUS RDS- 150 MM CCT:Informal Settlements, Water & Waste Serv Capex Engineering/I nfrastructure - 12,000,000 5,700,000-17,700,000 Yes Not prov ided CI810038: Hanov er Park - Hanov er Park CHC - Replacement WCG: HEALTH infrastructu re assets - 500,000 3,380,000 12,000,000 15,880,000 Yes CPX F1 IRT Phase 2A:Consultants: Stations CCT:Transport & Urban Dev elopment Authority Capex Liv e Work Play Contribute to Top 5/5 + 2 Philippi East 2,000,000 6,000,000 8,000,000-14,000,000 Yes HCI860001: Parow - Cape Medical infrastructu Not prov ided Depot - Replacement WCG: HEALTH re assets - 1,500,000 5,000,000 7,500,000 14,000,000 Yes C F3 Masiphumelele (Site 5) Taxi Rank CCT:Transport & Urban Dev elopment Authority Capex Public Transport 400,000 12,000,000 1,000,000-13,000,000 Yes CI830021: Khayelitsha - Khayelitsha and Not prov ided Hospital - Acute Psychiatric Unit WCG: HEALTH additions - 750,000 4,000,000 8,000,000 12,750,000 Yes new I/C on N2, Phillippi acc, extend 3rd Not prov ided lanes on N2 phase 2 WCG: PUBLIC WORKS 38,068,000 11,636, ,636,000 Yes Road Rehabilitation: Hanov er Park:Area CCT:Transport & Urban Engineering/I CPX F1 5 Dev elopment Authority Capex nfrastructure 4,000,000 10,500, ,500,000 Yes CCT:Assets & Facilities Human CPX F1 Langa Hostels CRU Project: New Flats Management Capex Settlement - 5,098,388 5,098,388-10,196,776 Yes C F3 Public Transport Fclt:Makhaza:M Bus Taxi CCT:Transport & Urban Dev elopment Authority Capex Public Transport 200,000 5,000,000 5,000,000-10,000,000 Yes CPX F1 Vissershok North:LFG Infrastructure to F CCT:Informal Settlements, Water & Waste Serv Capex Other - 5,000,000 5,000,000-10,000,000 Yes CPX F1 Upgrade: Elizabeth to Jack Muller Park CCT:Social Serv ices Capex Other Contribute to Top 5/5 + 2 Bellville 2,000,000 10,000, ,000,000 Yes CPX F1 Upgrade - Manenberg Integrated Project CCT:Social Serv ices Capex Other 3,000,000 10,000, ,000,000 Yes CCT:Transport & Urban Human CPX F1 Imizamo Yethu Housing Project (Phase 3) Dev elopment Authority Capex Settlement 1,615,000 6,600,000 2,015, ,000 9,115,000 Yes 144
151 Figure 2D: Location of projects on capital budgets of City, Province and SOEs in relation to marginalised areas 145
152 Annexure 3: Catalytic/ Priority Projects 146
153 Project Funding Source (Total Project Value) Project Stauts (% of Project Completed) Metro No. of projects reflected on pipeline Example of Catalytic Projects Total Value (R'm) (2015/16 to 2019/20) Direct investment on site (2015/ /20) Capex Supporting projects contributing to Munic development ipal readiness (2015/ /20) Capex Loan Provin Grant ce SOE PPP % of Total Value Private Sector Leverage (R'm) Identification Preparation Construction Completed Total CT 14 Paardevlei R10bn to be spent in stages over perhaps 10 years. 344,068, ,980,000 tbc tbc tbc tbc tbc tbc 6.98% tbc 100% 15% conceptualization and feasibility in process CT 2 Athlone Power R5,25 billion 0 184,199,100 tbc tbc tbc tbc tbc tbc 7.30% tbc 100% 50% rezoning Station 2010 Prefeasibility documentation, EIA, TIA, HIA in process Study at 2010 rates CT 11 Bellville no feasibility completed 101,365, ,567,895 tbc tbc tbc tbc tbc tbc tbc 100% 25% conceptualisation being finalised CT 10 Philippi & Public Transport Facility At least R68m 400,000 14,370,623 tbc tbc tbc tbc tbc tbc 21.72% tbc 100% 35% conceptualisation being finalised CT 0 CBD: Foreshore Not yet available 0 0 tbc tbc tbc tbc tbc tbc tbc 100% 15% conceptualization and feasibility in process CT 0 CBD: 3 Anchor Not yet 0 0 tbc tbc tbc tbc tbc tbc tbc 100% 15% conceptualization and Bay available feasibility in process CT 0 CBD: Gallows Hil/ Ebeneezer Not yet available 320,000,000 0 tbc tbc tbc tbc tbc tbc tbc 100% 15% conceptualization and feasibility in process CT 2 Conradie 241,229,000 0 tbc tbc tbc tbc tbc tbc 5.36% tbc 100% 50% rezoning Yes planned R4.5 billion (ref: documentation, EIA, TIA, HIA for coming 2016 Financial in process year Feasibility Study) CT 2 TRUP R15bl 0 109,951,500 tbc tbc tbc tbc tbc tbc 0.73% tbc 100% 45% conceptualisation being finalised 147
154 Annexure 4: Priority Project Summary Appraisals 148


155 R1,2m spent in 2015/16 BUDGET ATHLONE POWER STATION Current 2017/ / /20 TOTAL Opex 1,685,158 2,069, ,038,232 Capex TOTAL 1,685,158 2,069, ,038,
156 Project Name Project Status Athlone Power Station Planning Project Description The project site is a strategic site located between the existing VRC and MSE Integration Zones. It is located midway between Cape Town CBD and Cape Town International Airport, adjacent to N2 freeway. A project pre-feasibility study has highlighted the site s potential as a mixed-use development and has been the starting point for the identification of development alternatives. These alternatives will be refined into a preferred development alternative through the detailed planning process and with the information from the development strategy. The intention is that this project includes both public and private investment. The public focus will be on infrastructure and the private on the development to the extent feasible. Both will contribute to social/ affordable housing in the project. Objectives: reconnect three racially segregated neighbourhoods (Athlone, Pinelands and Langa); develop an intense mixed use urban district that will assist with City spatial restructuring; and Create long-term City asset. It is a complex project requiring the retention of key City utility infrastructure, including: electrical infrastructure, the Athlone Regional (waste) Transfer Station and a sewer pumping station and associated reticulation. The City has been working collaboratively to overcome funding hurdles, establish an approach to development of the site and undertake the tender processes for the appointment of necessary consultants all of which have been time consuming and complex processes. To this end, a Development Strategy commenced in July The work is funded by National Treasury and led by the City s Spatial Planning and Urban Design Department. The technical planning, which includes the public participation processes related to the environmental authorisation and land use application commenced in January The work is being funded by the City using the Urban Settlement Development Grant (USDG) and is managed by the Urban Catalytic Investment Department. In addition to fulfilling statutory requirements, the public participation process provides an opportunity for members of the public to engage with the project, to influence and comment on the development options. Project Ownership (Directorate) Project Manager Transport and Urban Development Authority Years Active as Project Estimated Investment Value 3 years R5,25 billion 2010 Pre-feasibility Study at 2010 rates Included in current IDP? Referenced in current BEPP? No not directly Yes in 5+2 If no: Reason for Inclusion in 2017/18 Planning Costs Estimated 2015/16 Current Year 2 MTREF Year 3 MTREF R ,069,723 Land Ownership Land Extent Land Description City 36 ha Province State Private Estimated Project Yield (as at dd/mm/yyyy) Infrastructure Requirements Non-Residential GLA Residential Units Office Market My Citi / Rail Retail Gap Hospitality Subsidised Road Public Transport Interchange Social Rental (SHI) Electricity Other 1,177 WWTW Other 303,895 Sewer Description Estimated Cost Funding Source 150
157 Development Partners Province State Private Public Private Partnership X X Transformation Priorities Supported Basic service delivery Delivery to informal settlements and backyard dwellers Safe communities Transit oriented urban growth Efficient, integrated transport system Leveraging technology Water Other Globally competitive business city Resource efficiency and security Building integrated communities Economic inclusion Operational sustainability X X X PPM Project Designation and WBS Project Location (GPS co-ordinates) X Y Funding Mix Funding Source Previous Current Year Year 2 MTREF Year 3 MTREF USDG TOTAL: R 5,038,232 (ecl VAT) R R R HSDG PTIG PTOG ICDG NDGP INEPG EFF CRR Other Regulatory Processes NEMA / EIA MPB-L / Zoning etc. Heritage Supply Chain Management Growth Priority Area (GPA) Integration Zone (IZ) Economic Node Informal Settlement Programme Yes Yes Yes Prioritised Local Area (PLA) Medium Term Infrastructure Investment Framework Analysis Infrastructure assessment Operating Cost Surface Model Capital costs Surface Model Fiscal Impact Tool Assessment 151

158 The public participation process started in 2016 with 3 public meetings of which the focus was on the general identification of issues from the surrounding communities in order to ensure that the rest of the planning process progresses smoothly. At present the consultant team working on the project is completing documents which will result in an approved local area plan and a rezoning application process with associated land use bulks. 152
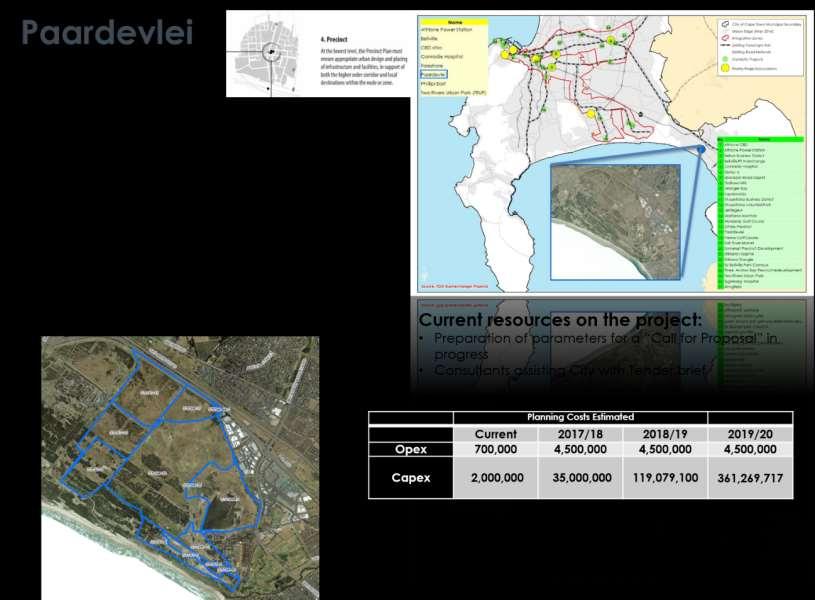
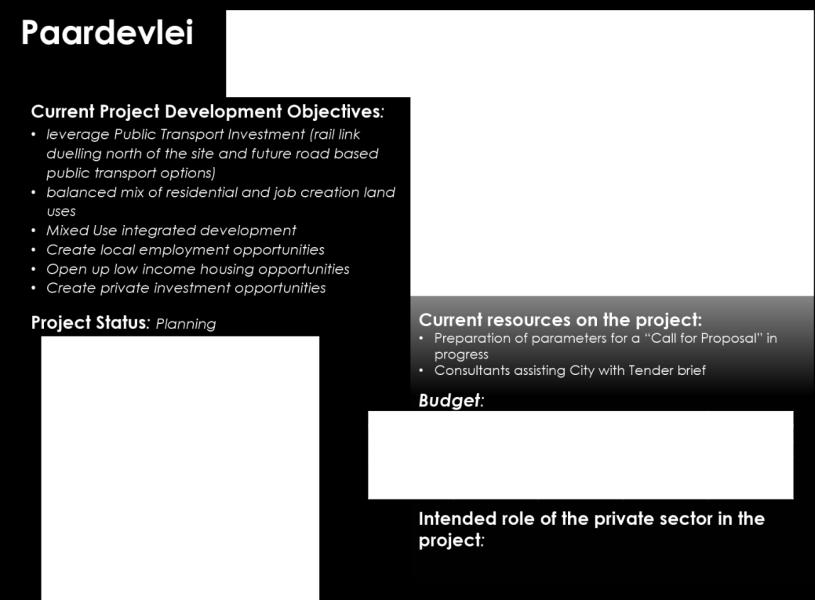
159 153

160 Project Name Project Status Paardevlei Planning Phase Project Description 700ha were purchased in light of the need for land for low income housing in Cape Town. Strategic choices need to taken on how to develop the land. In preparation for that a set of Tender Specification are being drafted with the assistance of a professional team. The primary use of the land will be to deal with urbanisation. Immediate priorities are to establish (i) master plan, (ii) a financial plan and (iii) an institutional arrangement will thus be set up. Certain bulk services shall also be installed as part of the tender. Project Ownership (Directorate) Project Manager Transport and Urban Development Authority Jens Kuhn Years Active as Project Estimated Investment Value Zero, Scope and Preliminary have been under preparation for 12 months Variable depending on strategic decisions yet to be made. R10bn to be spent in stages over perhaps 10 years. Included in current IDP? Referenced in current BEPP? It is mentioned but not articulated Yes in 5+2 If no: Reason for Inclusion in 2017/18 Planning Costs Estimated Previous Year Current Year 2 MTREF Year 3 MTREF R2m Part of R5m consultan cy Est R50-80m Est R m Land Ownership Land Extent Land Description City 620ha 1. T58926/ Ptn 37 of the Farm 794; 2. T58928/ Rem Ptn 44 of the Farm 794; 3. T58929/ Ptn 10 of the Farm No. 787; 4. T58930/ Rem Ptn 40 of the Farm 794; 5. T58931/ Ptn 11 of the Farm 787; 6. T58932/ Rem Ptn 4 of the Farm 791; 7. T58933/ Ptn 5 of the Farm 791; 8. T58935/ Ptn 6 of the Farm 791; and 9. T58936/ Rem Ptn 38 of the Farm 794. Province n/a State n/a Private n/a Estimated Project Yield (as at dd/mm/yyyy) Infrastructure Requirements Non-Residential GLA Residential Units Est. Office Market Retail Gap Hospitality Subsidised Social Rental (SHI) Other Other m2 NOTE: Alongside are provisional cost estimates which serve tender preparation. They are not for budgeting or verified. That shall occur as part of the detailed planning phase. Development Partners Province State Private Public Private Partnership X X Transformation Priorities Supported Basic service delivery Delivery to informal settlements and backyard dwellers Safe communities Transit oriented urban growth Efficient, integrated transport system Leveraging technology Globally competitive business city Resource efficiency and security Building integrated communities X X X X PPM Project Designation and WBS Project Location (GPS co-ordinates) Economic inclusion Operational sustainability 154
161 Supply Chain Ref: DP2897 PPM Ref : CPX Note : WBS is a budget ref number and there are many more as lines shall provision for their own components as and when required. X: Y: Funding Mix Funding Source Previous Current Year Year 2 MTREF Year 3 MTREF Total R10bn R5m R180m R240m HSDG TBD TBD TBD TBD PTIG TBD TBD TBD TBD PTOG TBD TBD TBD TBD ICDG TBD TBD TBD TBD NDGP TBD TBD TBD TBD INEPG TBD TBD TBD TBD EFF TBD TBD TBD TBD CRR TBD TBD TBD TBD Other Regulatory Processes NEMA / EIA MPB-L / Zoning etc. Heritage Supply Chain Management Growth Priority Area (GPA) Integration Zone (IZ) Economic Node Informal Settlement Programme Prioritised Local Area (PLA) Medium Term Infrastructure Investment Framework Analysis Infrastructure assessment Operating Cost Surface Model Capital costs Surface Model Fiscal Impact Tool Assessment 155
162 BUDGET FORSHORE FREEWAYS Current 2017/ / /20 TOTAL Opex 1,000, ,000,000 Capex TOTAL 1,000, ,000,000 Opex: R5m consultancy budget for various projects divided below between Paardevlei, City Projects and Bellville. 156


163 This project has moved rapidly over the past year. It started off with the call for proposals in July 2016 according to the published prospectus. Submissions of proposals were received in November 2016 and the exhibition of 6 of the proposals was opened March 2017 by the Mayor. The project obtained significant and high profile media coverage. 157
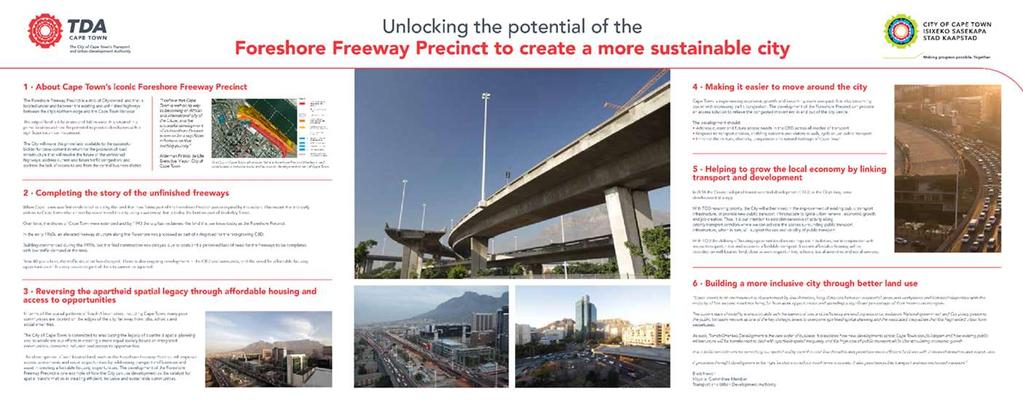
164 158


165 Timeslive: IOL: Citizen Cape Talk Engineering news Wheels Twitterhttps://twitter.com/HeartFMNews/status/ http:// Facebook 159
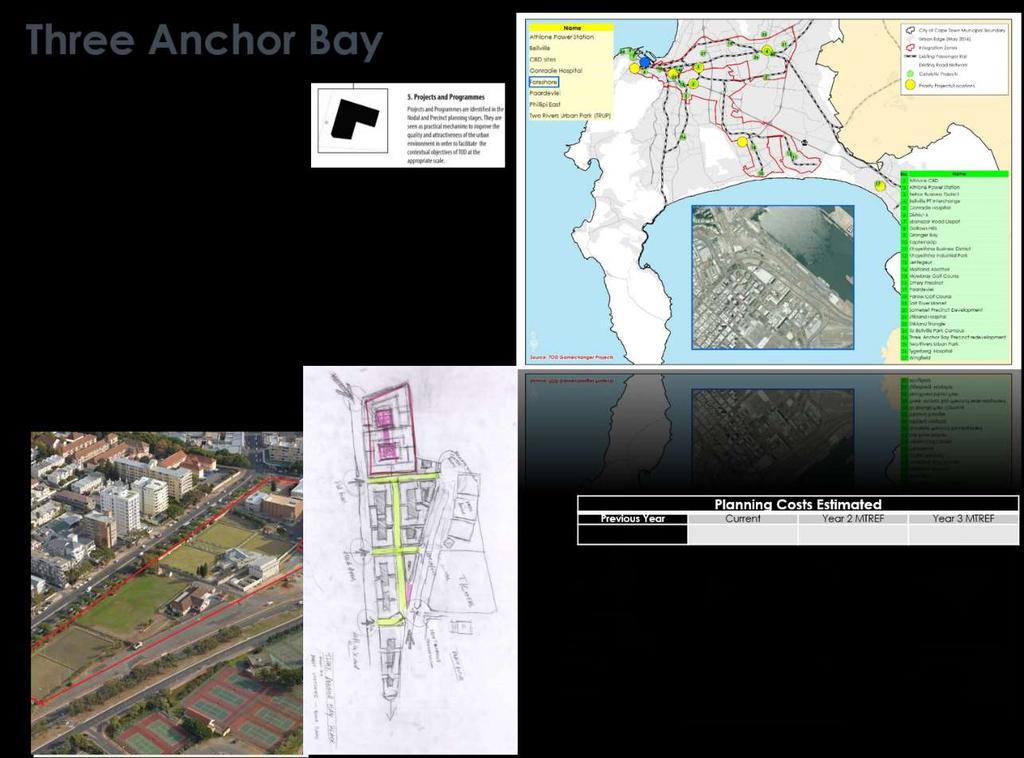
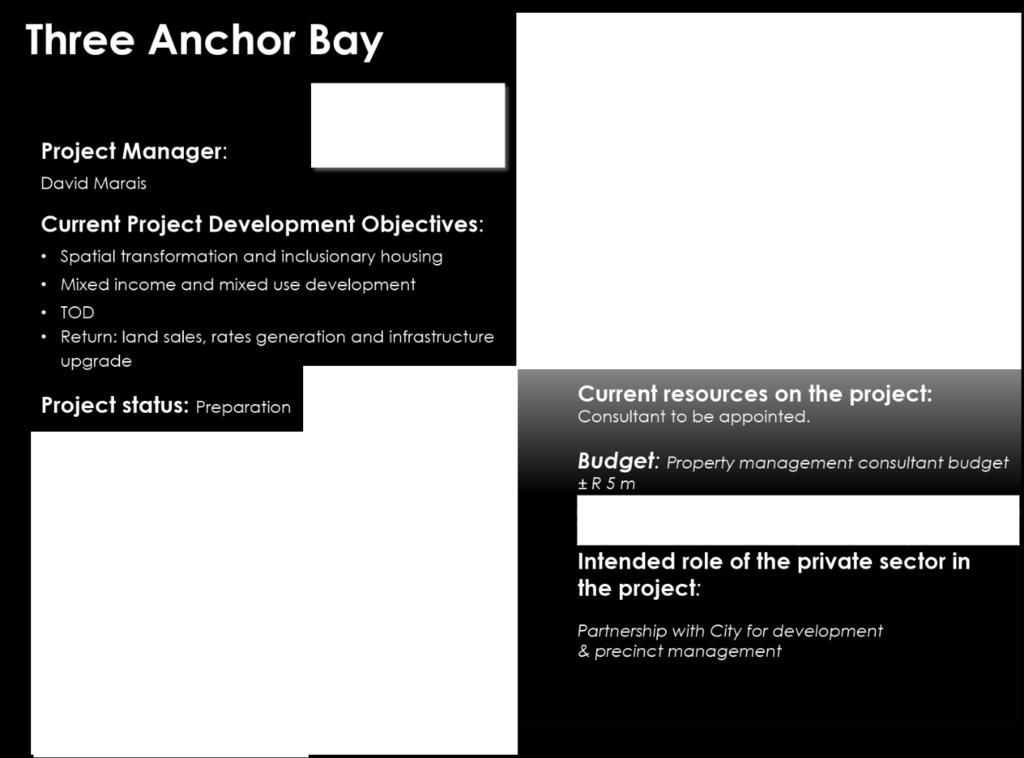
166 160
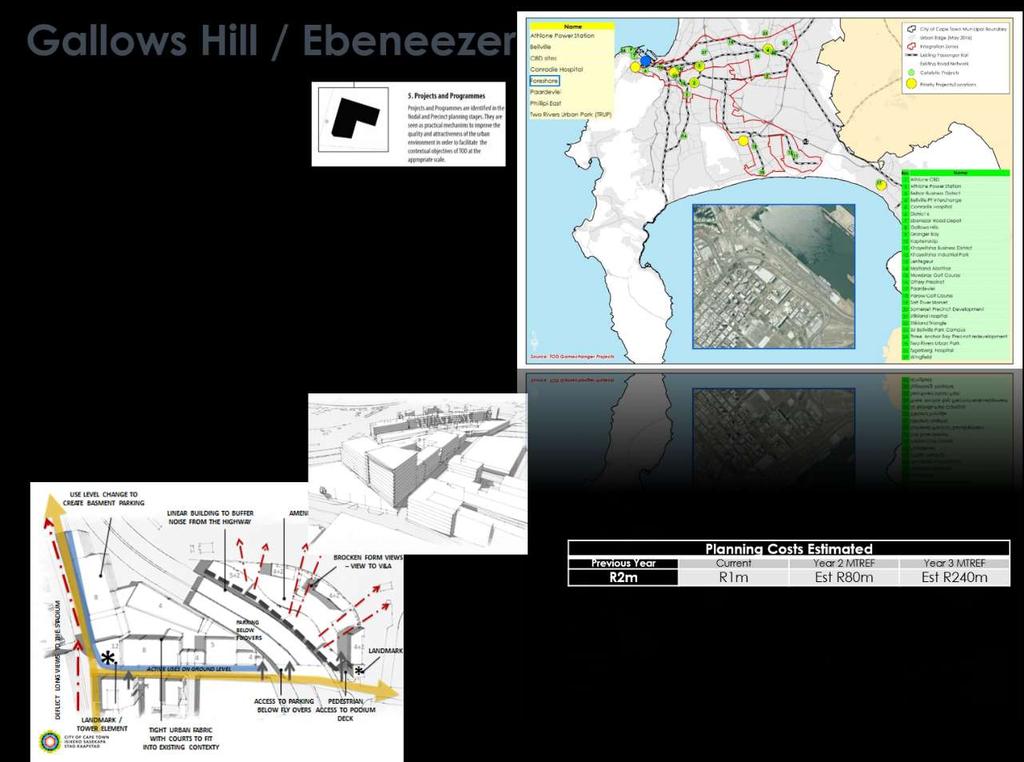
167 161
168 Project Name Project Status Inner City Precinct inclusive of Planning Phase * Foreshore Freeway * Three Anchor Bay * Ebenezer * Gallows Hill Project Description This is a long term investment project to be undertaken by the private sector through investment. A request for proposals (RFP) has been issued. If a proposal is successful it will contain a project plan defining scope and estimated costs and funding strategies. Financial implications, budgetary requirements and project timeframes will be determined once a successful proposal is accepted. This project is a large scale land development and infrastructure project which will span multiple financial years. 32 Project Ownership (Directorate) Transport and Urban Development Authority Years Active as Project Project Manager Estimated Investment Value Included in current IDP? Referenced in current BEPP? If no: Reason for Inclusion in 2017/18 Planning Costs Estimated Previous Year Current Year 2 MTREF Year 3 MTREF Part of R5m Land Ownership Land Extent Land Description City Province State Private Estimated Project Yield (as at dd/mm/yyyy) Infrastructure Requirements Non-Residential GLA Residential Units Office Market My Citi / Rail Retail Gap Hospitality Subsidised Road Public Transport Interchange Social Rental (SHI) Electricity Other Other WWTW Sewer Water Other Description Estimated Cost Funding Source Development Partners Province State Private Public Private Partnership Transformation Priorities Supported Delivery to Transit informal Basic service Safe oriented settlements delivery communities urban and backyard growth dwellers Efficient, integrated transport system Leveraging technology Globally competitive business city Resource efficiency and security Building integrated communities Economic inclusion Operational sustainability PPM Project Designation and WBS Project Location (GPS co-ordinates) Funding Mix Funding Source Previous Current Year Year 2 MTREF Year 3 MTREF USDG HSDG PTIG PTOG ICDG NDGP INEPG 32 Source: Integrated Development Plan (Draft February 2017) 162
169 EFF CRR Other Regulatory Processes NEMA / EIA MPB-L / Zoning etc. Heritage Supply Chain Management Growth Priority Area (GPA) Integration Zone (IZ) Economic Node Informal Settlement Programme Prioritised Local Area (PLA) Medium Term Infrastructure Investment Framework Analysis Infrastructure assessment Operating Cost Surface Model Capital costs Surface Model Fiscal Impact Tool Assessment 163
170 164
171 Project Name Project Status Philippi Planning & Implementation Project Description In accordance with the IPTN 2032, six of the 10 trunk routes will interchange in Philippi. There is therefore a major opportunity to develop the transfer interchange on the principles of TOD and then also facilitate and catalyse surrounding development. 33 Project Ownership (Directorate) Project Manager Transport and Urban Development Authority Years Active as Project Estimated Investment Value Included in current IDP? Referenced in current BEPP? If no: Reason for Inclusion in 2017/18 Planning Costs Estimated Previous Year Current Year 2 MTREF Year 3 MTREF Refer to summary above Land Ownership Land Extent Land Description City Province State Private Estimated Project Yield (as at dd/mm/yyyy) Infrastructure Requirements Non-Residential GLA Residential Units Office Market My Citi / Rail Retail Gap Hospitality Subsidised Road Public Transport Interchange Social Rental (SHI) Electricity Other Other WWTW Sewer Water Other Description Estimated Cost Funding Source Development Partners Province State Private Public Private Partnership Transformation Priorities Supported Delivery to Transit informal Basic service Safe oriented settlements delivery communities urban and backyard growth dwellers Efficient, integrated transport system Leveraging technology Globally competitive business city Resource efficiency and security Building integrated communities Economic inclusion Operational sustainability PPM Project Designation and WBS Project Location (GPS co-ordinates) Funding Mix Funding Source Previous Current Year Year 2 MTREF Year 3 MTREF USDG HSDG PTIG PTOG ICDG NDGP INEPG EFF CRR Other Regulatory Processes NEMA / EIA MPB-L / Zoning etc. Heritage Supply Chain Management 33 Source: Integrated Development Plan (Draft February 2017) 165
172 Growth Priority Area (GPA) Integration Zone (IZ) Economic Node Yes Informal Settlement Programme Yes Prioritised Local Area (PLA) Medium Term Infrastructure Investment Framework Analysis Infrastructure assessment Operating Cost Surface Model Capital costs Surface Model Fiscal Impact Tool Assessment 166
173 167
174 Project Name Project Status Bellville Planning Project Description The outcome of this project is to catalyse development in the Bellville CBD node and leverage additional private sector and PRASA investment for land and public transport development. This is a long term development project and will span multiple financial years. Projects are in initial scoping phase and an Outline Business Case (OBC) to justify and support the case for investment by the City and its various stakeholders in Bellville CBD will be prepared. 34 Project Ownership (Directorate) Project Manager Transport and Urban Development Authority Frank Cumming Years Active as Project Estimated Investment Value Included in current IDP? Referenced in current BEPP? If no: Reason for Inclusion in 2017/18 Planning Costs Estimated Previous Year Current Year 2 MTREF Year 3 MTREF Refer to summary above Land Ownership Land Extent Land Description City Province State Private Estimated Project Yield (as at dd/mm/yyyy) Infrastructure Requirements Non-Residential GLA Residential Units Office Market My Citi / Rail Retail Gap Hospitality Subsidised Road Public Transport Interchange Social Rental (SHI) Electricity Other Other WWTW Sewer Water Other Description Estimated Cost Funding Source Development Partners Province State Private Public Private Partnership Transformation Priorities Supported Delivery to Transit informal Basic service Safe oriented settlements delivery communities urban and backyard growth dwellers Efficient, integrated transport system Leveraging technology Globally competitive business city Resource efficiency and security Building integrated communities Economic inclusion Operational sustainability PPM Project Designation and WBS Project Location (GPS co-ordinates) Funding Mix Funding Source Previous Current Year Year 2 MTREF Year 3 MTREF USDG HSDG PTIG PTOG ICDG NDGP INEPG EFF CRR Other Regulatory Processes NEMA / EIA MPB-L / Zoning etc. Heritage Supply Chain Management 34 Source: Integrated Development Plan (Draft February 2017) 168
175 Growth Priority Area (GPA) Integration Zone (IZ) Economic Node Informal Settlement Programme Yes Yes Yes Yes Prioritised Local Area (PLA) Medium Term Infrastructure Investment Framework Analysis Infrastructure assessment Operating Cost Surface Model Capital costs Surface Model Fiscal Impact Tool Assessment 169
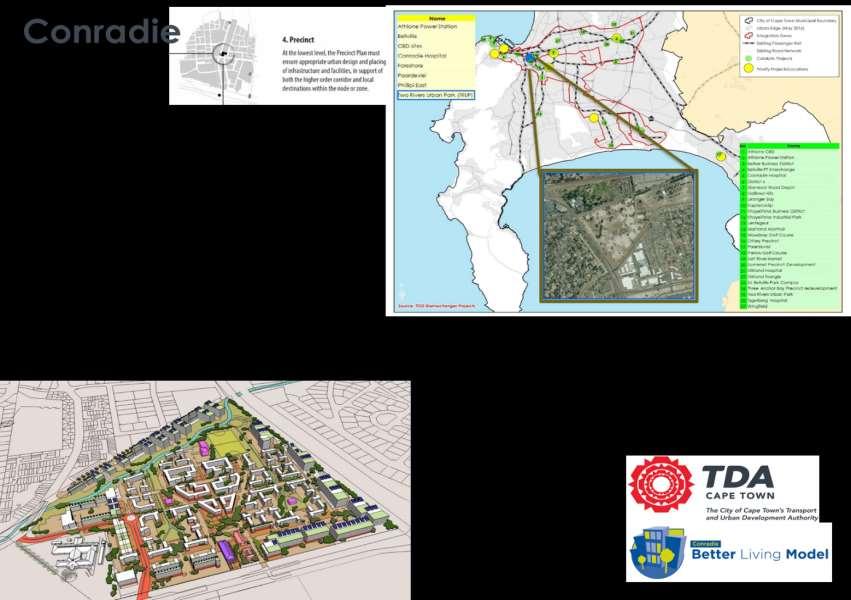
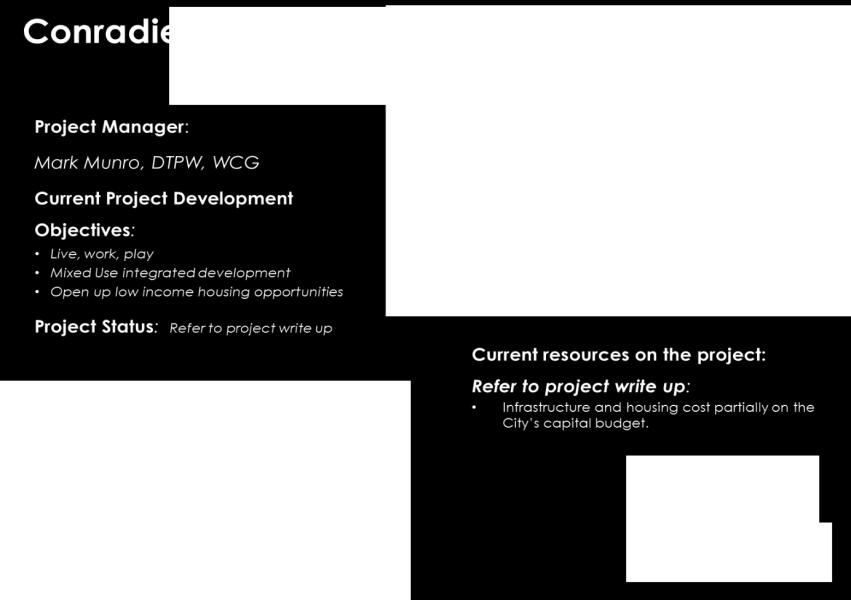
176 170
177 Project Name Project Status Conradie Concept Design & Implementation Project Description The Conradie Better Living Model Exemplar Project (Conradie BLMEP) seeks to deliver a model to efficiently plan, design and fund and develop the former Conradie Hospital site in Pinelands with residentially led, integrated and affordable mixed-use mixed-income and mixed-tenure development. The intention of the development is to address the apartheid spatial planning legacies and establish key, replicable levers to unlock state property. The project aims to develop the site into an integrated and inviting place where people can live, work and play. The Inter-Government Committee (City of Cape Town and Western Cape Government) have selected the former Conradie Hospital site located between the established suburbs of Pinelands and Thornton and in close proximity to Mutual and Thornton rail stations and future MyCiti feeder route, as the location for the pilot or exemplar project for the Better Living Model. The chosen location has placed the project within the prioritized Voortrekker Road Development Corridor (VDC) and City Transit Oriented Development (TOD) Programme. The BLMEP proposes a mixed use, mixed income and mixed tenure development typology, staged over a phased period of not less than five years that incorporates 3605 residential units of which no less than 35% will include social housing (rental stock), 10% FLISP units (owned) and 5% rent-to- own units integrated with retail, service industry, commercial, sports, education, health and other public uses and facilities. The project s goal statement is: In partnership with the City and the Private Sector, develop and implement a Better Living Model on the former Conradie Hospital site that will support positive social, economic and spatial integration. This statement can be structured into the following targets: Deliver an affordable, integrated and sustainable mixed-use, residentially-led outcome Cater for a range of household income and cultural groups Offer various tenure options and provide a safe, accessible and desirable live-work-play sense of place A model supported by sustainable and energy-efficient planning, design, construction and management practices. The project mandate: The Western Cape Government Department of Transport and Public Works (The Department) received a mandate from the Provincial Cabinet and Inter-governmental Committee (IGC) to lead the project. The Department was set 2018 for sod-turning and aims to deliver on its mandate with maximum integration and support of other government departments and the City of Cape Town. The development of the site will be procured through a Land Availability Agreement and conditional sale. Part of the onerous bulk infrastructure required to support the proposed development includes the realignment of the Elsieskraal River Canal along the south-east border of the site designed to alleviate flooding across the entire Conradie site, development of a class 4 road through the development linking Forest Drive Extension with the extension of Odin Drive and the extension of Odin Drive as a class 3 road from Viking Way in the south to Voortrekker Road in the north designed to alleviate traffic congestion on the surrounding road network. Local intersections around the development site will also undergo upgrade and include some signalization. Non-motorized Transport (NMT) routes will be implemented within and beyond the site connecting to the Mutual and Thornton rail stations and future MyCiti bus feeder route on Forest Drive Extension. Reduced parking ratios are also motivated in line with the TOD principles and in order to promote the use of public transport over that of private vehicles. Quality community facilities will be incorporated into the land uses and some of the remaining heritage structures on-site will be adapted for reuse. A landscape framework supports substantial planting and hard landscaping throughout. The model proposes that the development be managed by a Property Owners Association (PoA) and that a Memorandum of Agreement (MoA) be entered into with the City of Cape Town to manage the canal servitude area and on-street parking. The parking bays will not be allocated to residential units and the commercial/office bays will be shared and rented monthly. 171
178 The proposal is compatible with policy and planning frameworks and surrounding land uses and will not have adverse impacts on the surrounding community, environment, traffic, engineering services and will incorporate sustainable measures to reduce the use of water and energy. Project Ownership (Directorate) Project Manager Western Cape Government (Public Works) Mark Munro Years Active as Project Estimated Investment Value 7 years R4.5 billion (ref: 2016 Financial Feasibility Study) Included in current IDP? Referenced in current BEPP? No Yes in 5+2 If no: Reason for Inclusion in 2017/18 Planning Costs Estimated Catalytic, priority project as proclaimed by Previous Year Current Year 2 MTREF Year 3 MTREF Refer to HDA and WCG Cabinet summary above and below Land Ownership Land Extent Land Description City Province 21 ha State Private Estimated Project Yield (as at February 2017) Infrastructure Requirements Non-Residential GLA Residential Units Office Market 1800 My Citi / Rail Retail Gap 461 Public Transport Interchange Hospitality Subsidised Road Social Rental (SHI) 1264 Electricity Other Basic service delivery Other WWTW Sewer Water Storm Water Bulk Earthworks, landscaping Description Aerodrome Road Phase 1 Bulk Supply & Street Lighting Pump Station & rising mains Elsieskraal River Canal realignment Estimated Cost R R R R Funding Source 40.1 % from USDG 40.1% from USDG 40.1 % from USDG Development Partners Province State Private Public Private Partnership X X Transformation Priorities Supported Delivery to informal settlements and backyard dwellers Safe communities Transit oriented urban growth Efficient, integrated transport system Leveraging technology Globally competitive business city Resource efficiency and security Building integrated communities X X X X X X X X PPM Project Designation and WBS Project Location (GPS co-ordinates) X ; Y Funding Mix Economic inclusion Operational sustainability Funding Source Previous Current Year Year 2 MTREF (2017/18) (2018/19) Year 3 MTREF (2019/20) USDG (Bulk Infra & Int. Services) 40.1% of cost n/a R R R HSDG (Bulk infra top-up) - R R DOHS Own Reserve (Bulk infra top-up) - R R USDG (Electrical) 40.1% of cost R R R IRDP R R R HSDG (top structures) - R R RCG - R R Remainder of funding from Private Sector Regulatory Processes NEMA / EIA MPB-L / Zoning etc. Heritage Supply Chain Management X X X Growth Priority Area (GPA) Integration Zone (IZ) Economic Node Informal Settlement Programme Prioritised Local Area (PLA) Yes Yes Medium Term Infrastructure Investment Framework Analysis Infrastructure assessment Operating Cost Surface Model Capital costs Surface Model Fiscal Impact Tool Assessment 172
 for the")


 would be required to design the Game Changers, monitor performance during")
179 Department Transport and Public Works Directorate: Property Partnership Unit (PPU) CONRADIE BETTER LIVING MODEL Exemplar project PROJECT HISTORY Institutional Alignment On the 29 th and 30 th of July 2014 the Cabinet Bosberaad agreed that there would be a Provincial Strategic Plan (PSP) for the period 2015 to 2019 incorporating five Provincial Strategic Goals (PSG s). PSG 4 was determined as: Enable a resilient, sustainable, quality and inclusive living environment. In addition, the Cabinet Bosberaad proposed that a number of Game Changer initiatives or projects must be identified in order to deliver against the PSG s and the PSG leads were charged with identifying the same in conjunction with Specialist Advisors and presenting proposals at the subsequent Cabinet Bosberaad. It was also agreed that a special delivery facility (the delivery Unit) would be required to design the Game Changers, monitor performance during implementation, identify challenges and solutions and reporting directly to the Premier. On the 18 th of November 2014 the Cabinet Bosberaad selected the Game Changer initiatives from a list of proposals and the Better Living (Live- Work-Play) Model was selected on the former Conradie Hospital site against PSG
 for the establishment of the Delivery Support Unit (DSU) to take")
 as custodians of the")
 in association with the Department of")
180 On the 23 rd of February 2015 the Cabinet adopted a resolution (Minute 076/2015) for the establishment of the Delivery Support Unit (DSU) to take forward the Game Changer initiatives. The Department of Transport and Public Works (DTPW) as custodians of the former Conradie Hospital site were charged with leading the Better Living Model Exemplar or Pilot Project (BLMEP) in association with the Department of Human Settlements (DHS). Mutual/ Pinelands Station 174

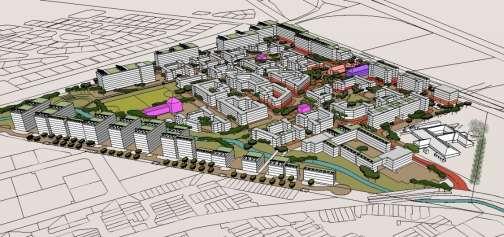
181 Website: 175

182 DTPW secured the necessary Project Scoping, Enablement and Implementation budget through the MTREF in March 2015 as follows: Description 2015/ / /18 Total Project Management Unit & Transaction Advisors R 9,481 R 12,899 R 1,712 R 24,092 Site Security & Security Infra R 6,778 R 2,836 R 2,271 R 11,885 Totals R 16,259 R 15,735 R 3,983 R 35,977 Following a limited bid procurement process, DTPW appointed the Project Manager and established the Project Management Unit in July During the Project Manager Procurement process, the DSU facilitated the inclusion of the BLMEP in the City of Cape Town (CCT) Transit Oriented Development (TOD) Programme and as an intergovernment Game Changer project at the Inter-governmental Committee (IGC), as part of the Voortrekker Corridor Development Prioritization Zone. The Project Steering Committee (PSC) was formally established in August 2015 against incorporated terms of reference accepted by all PSC members including the CCT. PSC Meetings are convened on a monthly basis, minuted and attended by amongst others the CCT. The BLMEP was presented at the Cabinet Bosberaad in August 2015 attended by the CCT and the project objectives were endorsed by all with emphasis on strategic alignment within the CCT TOD Programme. Legal, Financial and Technical Transaction advisors were procured through DTPW and appointed on the 1 st of September 2015 initiating the Scoping (first) phase of the Project. A detailed project Programme for each of the phases was developed by the PMU and summarizes in the following diagram as follows: 176

183 Scoping Phase (1 Sep 10 Dec 2015) The Scoping phase included the various analyses and the development of detailed objectives and a proposed concept for the BLMEP. The CCT Land Use, Roads, Storm water, Water and Electricity departments were extensively consulted in so far as the concept development was concerned pursuant to contextual and site opportunities and constraints (Records of such meetings are available). Throughout the Scoping Phase monthly PSC meetings were convened that included representatives from the CCT and the DSU attend scheduled meetings with the CCT TOD office. In addition, stocktake meetings were convened with the Premier on a six weekly basis and the CCT were in attendance (refer DSU meeting minutes and attendance records). The BLMEP objectives, proposed concept, preferred disposal and development options were presented to the Cabinet on the 10 th of December 2015 and the Cabinet resolved to support that the project progress into the Enablement (second) Phase. Enablement Phase A (15 Jan 1 Jun 2016) Subsequent to initial planning, the enablement phase was divided into a part A and B. Part A was aimed at refining the development concept for the BLMEP through detailed studies and impact assessments, identifying total development costs, determining applicable grant, subsidy and other public sector contributions and ultimately determining the Financial Feasibility of the project. Similar engagements incorporating the CCT in the scoping phase were convened during the enablement phase with considerably more frequency where development impact assessments and refinement of the BLMEP concept were concerned (Minutes and attendance registers are available and have been provided to the CCT). The PSC and stocktake meetings incorporating the CCT were convened as in the scoping phase on a monthly and six-weekly basis respectively. DTPW and the DHS concluded a Memorandum of Understanding during this period regulating the contractual obligations between the parties for the BLMEP. 177
 attended by the Social Housing Regulatory Authority and the CCT Human Settlements department.")
184 Formal USDG applications for Bulk Infrastructure and electricity were submitted to the CCT in April 2016 and the project was formally included in the Social Housing project pipeline through the Provincial Social Housing Steering Committee in February 2016 (Minute of meeting available) attended by the Social Housing Regulatory Authority and the CCT Human Settlements department. The refined development concept together with the BLMEP Financial Feasibility Report findings were presented to the Cabinet on the 1 st of June 2016 and the Cabinet resolved that the BLMEP displayed sufficiently financial feasibility to progress into the second part of the enablement phase as well as the Implementation (third) phase. Enablement Phase B and Implementation Phase (2 June Dec 2017) This phase has realised the finalization of the development concept (Development Framework) and formulation of the rezoning application that was formally submitted to the CCT in September Initial statutory public participation was concluded on the 15 th of November As a result of public objection pursuant to proposed road bulk infrastructure, alternative road infrastructure is currently under consideration through extensive engagement with TDA and will result in both an addenda to the original TIA and rezoning application scheduled for submission to the CCT in March 2017 where after, a second round of statutory public participation will be initiated by the CCT in April Earliest decision by the CCT Municipal Planning tribunal pursuant to the rezoning application is expected in August Road infrastructure alternatives remain subject to a Heritage Impact Assessment process that has been scheduled for review and decision by Heritage Western Cape in July The Developer procurement process was initiated through public advert in July 2016 with a Request for Qualification. Following evaluation of submissions and approval by the Bid Adjudication Committee (BAC), two bidders were formally notified that they had prequalified to proposal stage. The request for Proposal (RFP) is scheduled for release on or before 1 May 2017 with unconditional appointment of a preferred developer anticipated in December During this period various iterations of the USDG applications have been updated based on refined and alternate information resulting in the inclusion of an allocation by the CCT in the budget strategy going forward as follows (confirmation of Minute from CCT pending, but the project is visible on the CCT budget): Description Total cost of bulk infrastructure & internal serv ices Oct-16 CCT proposed 40.1% of total cost allocation (approv al pending) Cash Flow (ex VAT) 17/18 18/19 19/20 20/21 21/22 22/23 Total 18,000,000 85,000, ,000,000 95,000,000 65,000,000 47,954, ,954,891 7,218,000 34,085,000 54,135,000 38,095,000 26,065,000 19,229, ,827,911 In is anticipated that the CCT will apply a similar rationale to the USDG allocation for electrical as follows: Extensive engagements with the CCT including Councillor Herron have been convened around both alternative road infrastructure and USDG funding. 178


185 Financial feasibility for a developer and Social Housing Institution has determined that a minimum of 67% of the total bulk infrastructure and internal services costs must be funded through the public sector. Given that the CCT has only deemed the BLMEP eligible for 40.1% USDG contribution towards total cost (excluding VAT), the DHS has committed budget to the project for bulk infrastructure to make up the shortfall as follows: The BLMEP was awarded catalytic status by the National Housing Development Agency on the 24 th of November Public Engagement Process The process and documentation is located on 179
.")
186 Outlook Going Forward The following summary programme highlights planning going forward as follows: The unconditional appointment of a Developer is expected by December 2017 subject to outer year public sector funding having been sufficiently secured from both the CCT and WCG through due regulatory process (MFMA S33 and PFMA S66). The unconditional appointment has been scheduled to coincide with a final decision from the CCT Municipal Planning Tribunal pursuant to rezoning and will activate the first phase Site Development Plan (SDP) and subdivision application that if approved, may result in development sod-turning in July Expenditure against secured budget remains on track having spent approximately 70% of the original DTPW budget to date and a marginal over spend forecast of 2.5% having already been secured through MTREF roll-over funding. Completion of the Implementation Phase and unconditional appointment of a developer will activate management of the Land Availability and Development Agreement (LADA) between DTPW, DHS and the Developer for which a total amount of approximately R35 million will be required over a period of seven years from July 2018 onwards. DTPW have undertaken to secure this budget requirement going-forward. 180

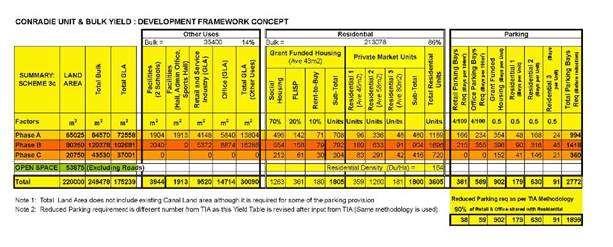
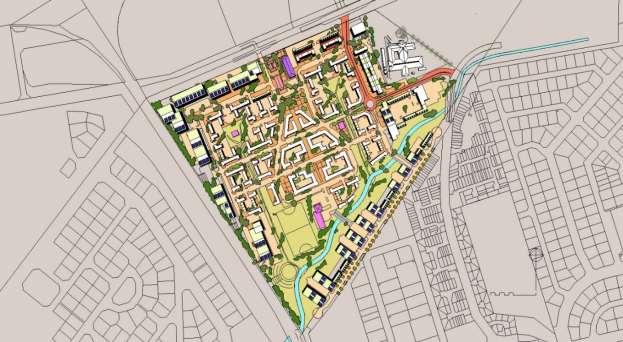
187 Pinelands Station 181
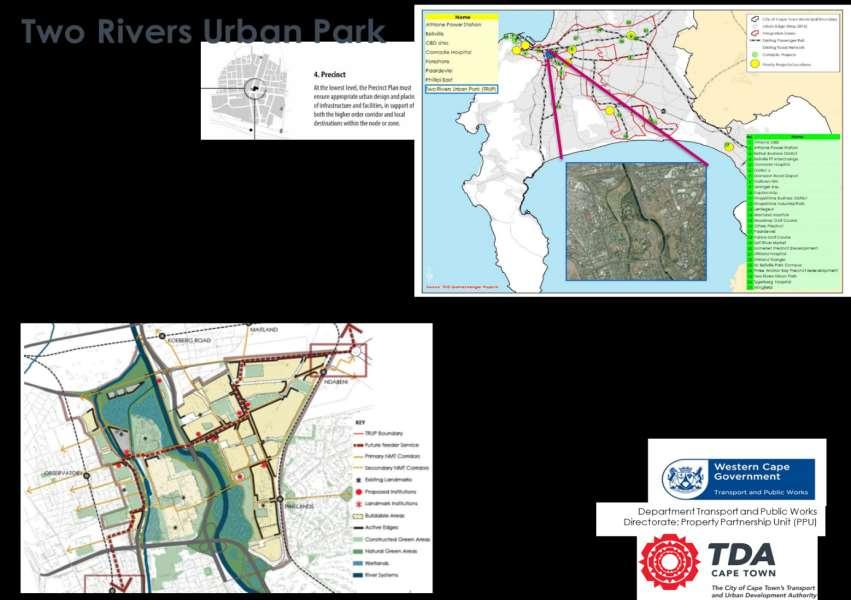
188 182
189 Project Name Project Status Two Rivers Urban Park Feasibility - Planning Project Description The Two Rivers Urban Park (TRUP) is a strategically site located within proximity to the VRC, MSEIZ and numerous public transport routes and also includes two rivers and a number of City, Western Cape Government (WCG) and private properties. Development is governed by a Contextual Framework (2003) and Environmental Management Plan. A Phase 1 Pre-feasibility Study was undertaken by the WCG in 2012 to determine the feasibility of developing its properties located within the TRUP. Possible feasibility was favourably determined provided that City and WCG co-develop their properties. Phase 2 Feasibility work commenced in 2015 and is currently underway towards a Local Area Spatial Development Framework (LSDF). The LSDF will include a Development Framework, Heads of Agreement and an Investment Plan, but detail around investment is not known at this time. It is anticipated that there will be a Phase 3 Implementation that will follow once the disposal method is determined. Objectives Create a mixed used, live-work-play sustainable neighbourhood Develop in a manner whereby additional infrastructure is not required Optimise existing public transport Leverage public land to re-integrate the apartheid city by providing a range of housing opportunities, Rehabilitate the Black and Liesbeek Rivers The City has been working in collaboration with the WCG since 2013 with a view towards developing a common vision. The TRUP Programme is complex and includes a number of projects and roleplayers, including planning work that commenced in 2015 according to a City/WCG terms of reference. The planning work is funded by WCG (R ) and the City (R1.5 million) whose funding was motivated on the basis that the river flood modelling work is a City mandate. The City s funding was transferred in 2014 to the WCG and they have disbursed accordingly. Other partners include the Kingdom of the Netherlands who have provided funding for workshops to contribute specialist inputs around water and flood management, amongst others. The City contributed R towards a workshop held in April The past 18 months has seen the undertaking of an extensive stakeholder participation (including workshops) process that recently ended in anticipation of work commencing on the legislated processes relating to the LSDF. The LSDF process will be managed by the City and will include a stakeholder participation process as will the legislated environmental processes. A mandate for the LSDF was provided by the Mayor in November The development framework will inform the institutional arrangements and funding mechanisms, which have not been determined at this time. Projects that are planned to commence within the TRUP are the Square Kilometre Array, the Cape Health Technology Park and the River Club. Project Ownership (Directorate) Project Manager Enterprise and Investment Kendall Kaveney for the City Years Active as Project Estimated Investment Value 4 R15 billion Included in current IDP? Referenced in current BEPP? Yes Yes in 5+2 If no: Reason for Inclusion in 2017/18 Planning Costs Estimated Previous Year Current Year 2 MTREF Year 3 MTREF Refer to write up 183 City budget Land Ownership Land Extent Land Description City 54% Abbattoir Site, River Corridors, Ndabeni pockets, Hartleyvale and Malta Park Province 17% Valkenberg, Alexandra Hospital, Oude Moulen State 7% Other Parastatal 8% Other Private 14% River Club and other Estimated Project Yield (as at dd/mm/yyyy) Infrastructure Requirements Non-Residential GLA Residential Units Description Estimated Cost Funding Source
190 Office Market My Citi / Rail Retail Gap Hospitality Subsidised Road Public Transport Interchange Social Rental (SHI) Electricity Other Other WWTW Sewer Water Other 184

191 TRUP %E2%80%93-towards-sustainable-integrated-urban-development Status Quo as at 8 March 2017 Project Background The Two Rivers Urban Park is an area located in the City of Cape Town (City), Table Bay District. It includes two rivers and a number of City, Western Cape Government (WCG) and private properties. Some City and WCG properties are currently used for municipal/government functions, others have been identified as underutilised. A planning policy document was prepared by the City in 2003, referred to as the TRUP Contextual Framework and Environmental Management Plan. This policy was generated via an extensive public participation process and relates to the river corridors and the various land-holdings. To date, there has been limited success in implementing the policy. In 2010 the WCG prepared the Cape Town Inner City Regeneration Strategic Framework which included a strategic review of the development potential of their properties. This strategy determined that there was value in developing the WCG-owned properties and established the mandate for the WCG Regeneration Programme. Following on from this work, was the preparation of a high level planning document, the Two Rivers Urban Park Local Area Sustainable Neighbourhood, High Level Development and Urban Design Concept (2012), which concluded with a recommended bulk of 1.3million bulk m² to be developed without increasing the services bulk capacity, whilst rather optimising the existing infrastructure, including six railway stations located on the periphery of the park. This recommendation was based on a proposal that included not only the WCG-owned property, but also City, WCG and privately owned property (for example, the River Club). It was determined that the increased scale of the development supplied sufficient bulk to motivate for infrastructure interventions. The work included in this scope represents Phase 1 Pre-Feasibility. The WCG Cabinet adopted the proposal (12 December 2012) and the institutional arrangements which included the proposal to create a landholding company to proceed with the feasibility work and implementation. Based on the Cabinet approval, the City was engaged as a development partner with a view to committing all their respective landholdings into the landholding company. City and WCG legal counsel advised that a landholding company could not be created in the absence of sufficient detail around what land rights would be committed. In the absence of this detail, it was not possible to determine which sphere of government would be the major share-holder and which legislation would consequently be triggered. The City was therefore reluctant to proceed with a partnership agreement in the absence of this information. The two parties agreed in 2013 to enter into an agreement to pursue further planning work, referred to as Phase 2 - Feasibility. The scope of this work would be to determine the land rights to enable the preparation of the Heads of Agreement and the implementation mechanism, be it a governmentowned landholding company, or the disposal of the land to a developer etc. A Memorandum of Understanding that committed the City and WCG to plan their properties together was signed in
192 with a view to preserving their long term commitment in order to prevent the sterilisation of the future development opportunity through the ad-hoc utilisation of properties. The City appointed a project manager, Mr Kendall Kaveney in May 2013 to work with the WCG Regeneration team to provide support to the TRUP programme, which refers to the larger programme and is not limited to the planning work that is currently underway and is one of a number of projects. A Council resolution in February 2014 approved a project definition report for TRUP which included the provision for a Project Management Team (PMT) to assist with the co-ordination of workstreams related to the planning work and a Steering Committee. In the interim whilst the consultants appointment was underway, a working relationship was established in the form of a Task Team which delivered a terms of reference for The Provision of Professional Services to undertake Urban Planning, Landscape Architecture, Engineering, Environmental and Heritage Studies for the Two Rivers Urban Park (TRUP) Project, Cape Town, Tender number S174/14 (the planning contract), created a Bid Evaluation Committee and managed the work upon the appointment of the team of consultants in July Numerous meetings relating to the planning contract were generally held weekly to discuss project issues, if not three times a week during the bid adjudication process. Detailed technical input to the consultants was accommodated via the workstreams which were comprised of City and WCG officials. These were discontinued at the request of the consultants who believed that the workstream work was not included in their required work. The DTPW committed a budget of approximately R10 million for this planning contract and the City contributed R1.5 million towards the work around the flood mitigation work, which would be part of the City s normal mandate. The total budget is R (incl VAT). A joint steering committee was also established in 2013 with representation from other government departments including the Department of Environmental Affairs and Development Planning, the Department of Economic Development and Tourism, Heritage Western Cape and the Department of Arts and Culture. SteerCom meetings were chaired on an alternate basis between political heads, namely the MayCo member for Special Projects and the MEC of the DTPW. Meetings have typically been held on a monthly basis since the SteerCom s inception. In the preparation of the MOU, it was agreed that in the absence of a landholding company, that the administrative heads mandated as the land custodians would be represented. In this way, it was intended that any decisions requiring decisions around land availability or planning, could be managed by the delegated authority. Political representation at the meetings is on an ad-hoc basis as needed. Due to the elections held in 2014 and 2015 and uncertainty regarding their outcome, SteerCom meetings were suspended. Meetings resumed in 2016 under the chairmanship of the DTPW and DEADP Heads of Department. A partnership was entered into with between the Kingdom of the Netherlands (KON) and the City and is defined in a Memorandum of Arrangement in This agreement was to cover the financial commitments relating to TRUP workshops. The KON funded a workshop in September 2015 that included the appointment of Dutch water specialists to participate in the workshop and act in an advisory role. The second workshop held in April 2016 was co-funded with the City contributing R towards the payment of the Dutch Specialist team who produced two deliverables, including an Evaluation Framework and a Post Workshop report. A third workshop was held in February 2017 and was funded by the KON. A tripartite agreement, a Memorandum of Co-operation, was signed in 2015 between the WCG, City and KON wherein it was agreed to co-operate around the planning for the TRUP programme. Further support was provided by the KON in the form of a study trip in 2015 to the Netherlands attended by DTPW MEC, City Official and the MayCo member for Special Projects. The KOL are represented on the SteerCom and PMT. A shift in programme focus within the DTPW in June 2016 resulted in the project management of the TRUP planning work moving to the DEADP. The City limited its support to the PMT at this time as there was sufficient project support from DEADP to manage the WCG planning contract, which had been lacking from DTPW up until this time, hence the previous close collaboration via the Task Team, which became unnecessary in the interim. At this time, a concept has not been finalised, but it has been determined that a Local Areas Spatial Development Framework (LSDF) will be prepared, in lieu of the previously anticipated Package of Plans approach. It is understood that a draft will be prepared by the consultants by the end of March The District Planner received a mandate in 7 November 2016 from the Mayor to proceed with the necessary work associated with the LSDF. Phase 2, apart from detail planning is expected to see the landing: of two or more anchor developments like the River Club development, the Square Kilometre Array Headquarters and the Cape Health Technology Park (CHTP). Subsequently both SKA and CHTP were put on hold/removed from the scope 186
 Total Budget Current spent to March 2017 : R5 578 384.")

193 as the SKA elected to use a site owned by the NRF and the CHTP work was pending the finalization of the business case. The River Club is however progressing well as a private sector initiative. Phase 2 Planning Work Budget Progress for 2016/17: Total Budget for Project: R (incl VAT) Total Budget Current spent to March 2017 : R (incl VAT) Key future milestones include the finalisation of the infrastructure modelling, phasing, high level financial feasibility and market study which will inform the Heads of Agreement and disposal method. The future institutional arrangements would be determined at this time. Summary of meetings Due to the extensive period required for reporting, it is not possible to be exact with the number of meetings and the below represents an estimation of meetings commencing in 2013 to current: Task Team (or smaller meetings) = approximately 50 PMT = 10 meetings Workstream = undetermined as conducted by Workstream Leaders SteerCom = 12 Public Engagements = 12 The most recent sessions were in Feb 2017 guided by a useful Design Workshop Resource Book CHTP SteerCom meetings = 4 SKA meetings = 4 Public participation processes and products %E2%80%93-towardssustainable-integrated-urbandevelopment Most recent and last of 10 public stakeholder meeting 18 February 2017 with around 77 participants. All presentation material, workshop summaries et al on the project web page. 187
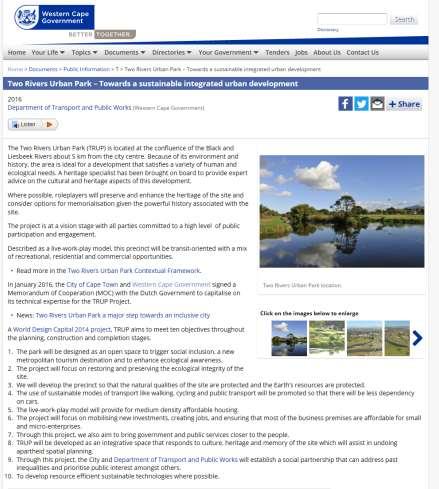
194 188
Guidance Note: Framework for the formulation of Built Environment Performance Plans (BEPP)
") Guidance Note: Framework for the formulation of Built Environment Performance Plans (BEPP) Title: Purpose: Target Audience: Guidance Note: Framework for the formulation of Built Environment Performance
Guidance Note: Framework for the formulation of Built Environment Performance Plans (BEPP) Title: Purpose: Target Audience: Guidance Note: Framework for the formulation of Built Environment Performance
REVISED ACCREDITATION AND ASSIGNMENT FRAMEWORKS FOR MUNICIPALITIES TO ADMINISTER NATIONAL HUMAN SETTLEMENTS PROGRAMMES
 for Municipalities REVISED ACCREDITATION AND ASSIGNMENT FRAMEWORKS FOR MUNICIPALITIES TO ADMINISTER NATIONAL HUMAN SETTLEMENTS PROGRAMMES March 2017 1 for Municipalities Contents SECTION ONE: REVISED ACCREDITATION
CONSTITUTION OF THE TRANSPORT AND URBAN DEVELOPMENT AUTHORITY FOR CAPE TOWN BY-LAW, 2016 CITY OF CAPE TOWN
 CONSTITUTION OF THE TRANSPORT AND URBAN DEVELOPMENT AUTHORITY FOR CAPE TOWN BY-LAW, 2016 CITY OF CAPE TOWN Contents English By-law Afrikaans By-law Xhosa By-law 1 2 CITY OF CAPE TOWN ENGLISH Constitution
DRAFT ETHEKWINI BUILT ENVIRONMENT PERFORMANCE PLAN MARCH 2018
 DRAFT ETHEKWINI BUILT ENVIRONMENT PERFORMANCE PLAN 2018-19 30 MARCH 2018 i 3 PART 3 - DEVELOPMENT PROGRAMME & INTER-GOVERNMENTAL PROJECT PIPELINE... 86 TABLE OF CONTENTS 1 PART 1 INTRODUCTION... 1 1.1
RELATIONSHIP BETWEEN THE BUDGET AND THE IDP 28 FEBRUARY 2017
 RELATIONSHIP BETWEEN THE BUDGET AND THE IDP 28 FEBRUARY 2017 1 Contents Introduction Legislative Requirements Inc. MSCOA Why MSCOA Local Government Accountability Cycle Budget Process and linkage to IDP
REGIONAL EVALUATION FRAMEWORK 1.0 INTRODUCTION 2.0 PURPOSE 3.0 DEFINITIONS. Edmonton Metropolitan Region Planning Toolkit
 Edmonton Metropolitan Region Planning Toolkit Re-imagine. Plan. Build. Edmonton Metropolitan Region Growth Plan 1.0 INTRODUCTION On October 26, 2017, the Government of Alberta approved the Edmonton Metropolitan
Eastern Cape Department of Human Settlements Strategic Plan Evaluation 2015/2016
 Eastern Cape Department of Human Settlements Strategic Plan Evaluation 2015/2016 November 2015 by Thoko Sipungu Monitoring and Advocacy Program, Public Service Accountability Monitor For more information
CLIMATE FINANCE OPPORTUNITIES FOR ENHANCED LOCAL ACTION
 CLIMATE FINANCE OPPORTUNITIES FOR ENHANCED LOCAL ACTION V-LED AFRICA WORKSHOP: LOCALISING CLIMATE FINANCE AND ACTION 23-25 APRIL 2018, IRENE, SOUTH AFRICA 1 CC expenditure will absorb ~ 70% of domestic
Buffalo City Metropolitan Municipality Presentation to the Select Committee on Finance
 Buffalo City Metropolitan Municipality Presentation to the Select Committee on Finance 11 September 2018 Metros financial position at year-ending June 2017 30 June 2015/16 30 June 2016/17 Municipality
Investment for development: Investing in the Sustainable Development Goals: An Action Plan
 TRADE AND DEVELOPMENT BOARD 61 st Session Agenda Item 9 Investment for development: Investing in the Sustainable Development Goals: An Action Plan Geneva, 17 September 2014 Statement by James Zhan Director
PROGRESS WITH THE NATIONAL INFRASTRUCTURE MAINTENANCE STRATEGY
 PROGRESS WITH THE NATIONAL INFRASTRUCTURE MAINTENANCE STRATEGY Kevin Wall CSIR, P.O. Box 395, Pretoria, 0001; Cell: 082-4593618, Email: kwall@csir.co.za ABSTRACT The National Infrastructure Maintenance
KEY DATES FOR THE MANGAUNG METROPOLITAN MUNCIPALITY IDP REVIEW AND BUDGET PROCESS PLAN 2018/19
 KEY DATES FOR THE MANGAUNG METROPOLITAN MUNCIPALITY IDP REVIEW BUDGET PROCESS PLAN /19 Mangaung Metropolitan Municipality wishes to inform all its stakeholders and communities of the key opportunity to
Investing in the future
 Investing in the future Using value creation and value capture to fund the infrastructure our cities need Submission responding to the Discussion Paper issued by Department of Infrastructure and Regional
Appendix 5. Capital Strategy. 1. Strategic Context
 Capital Strategy 1. Strategic Context Barnet Council is ambitious about the impact that capital investment plans will have on the borough over the next 10 to 20 years. This capital strategy sets out how
IMESA. Johan van den Berg (Strategic and Integrated Planning) Dr Danie Wium (Industry Leader, Government) Aurecon
 Dr Danie Wium (Industry Leader, Government) Aurecon") Johan van den Berg (Strategic and Integrated Planning) Dr Danie Wium (Industry Leader, Government) Aurecon ABSTRACT The Consolidated Infrastructure Plan (CIP) is an initiative of the City growth needs.
Johan van den Berg (Strategic and Integrated Planning) Dr Danie Wium (Industry Leader, Government) Aurecon ABSTRACT The Consolidated Infrastructure Plan (CIP) is an initiative of the City growth needs.
Strategic Transport Forum 26 th January Agenda Item 6c: Connectivity Study. It is recommended that the Forum:
 Strategic Transport Forum 26 th January 2018 englandseconomicheartland@buckscc.gov.uk Agenda Item 6c: Connectivity Study Recommendation: It is recommended that the Forum: a) Welcome the government s commitment
RANDFONTEIN LOCAL MUNICIPALITY Municipal Profile
 introduction The Housing Development Agency ("HDA") is a national public development agency that promotes sustainable communities by making well located and appropriately planned land and buildings available
The following report replaces the report of the Portfolio Committee on Human Settlements which was published page 27 in ATC No 56 dated 10 May 2017.
 The following report replaces the report of the Portfolio Committee on Human Settlements which was published page 27 in ATC No 56 dated 10 May 2017. Report of the Portfolio Committee on Human Settlements
Terms of Reference Development of the City of Tshwane Sustainability Financing Mechanism Strategy
 Terms of Reference Development of the City of Tshwane Sustainability Financing Mechanism Strategy 1. ABOUT THE SACN The South African Cities Network (SACN) as established in 2002, is a network of the nine
Housing Development Agency. Business Case Activating the Development Agency Role. Board Approved 11 March 2016
 Housing Development Agency Business Case Activating the Development Agency Role Board Approved Final Version 5.0 Table of Contents Executive Summary 4 1 Introduction 9 2 Background 10 2.1 Establishment
Urban Settlements Development Grant
 Urban Settlements Development Grant Presentation to Select Committee on Appropriations Presenter: Marissa Moore Chief Director: Urban Development and Infrastructure, National Treasury 12 September 2012
SECTION 5: A PROGRAMMATIC APPROACH TO MUNICIPAL INFORMAL SETTLEMENT UPGRADING
 SECTION 5: A PROGRAMMATIC APPROACH TO MUNICIPAL INFORMAL SETTLEMENT UPGRADING Summary A programmatic approach to informal settlement upgrading It is now well recognised that there needs to be a radically
T H E NA I RO B I C A L L TO A C T I O N F O R C L O S I N G T H E I M P L E M E N TA T I O N G A P I N H E A LT H P RO M O T I O N
 T H E NA I RO B I C A L L TO A C T I O N F O R C L O S I N G T H E I M P L E M E N TA T I O N G A P I N H E A LT H P RO M O T I O N 1. INTRODUCTION PURPOSE The Nairobi Call to Action identifies key strategies
CITY OF JOHANNESBURG METROPOLITAN MUNICIPALITY GROUP RISK AND ASSURANCE SERVICES GROUP RISK MANAGEMENT POLICY
 CITY OF JOHANNESBURG METROPOLITAN MUNICIPALITY Effective Date 1 July 2015 TABLE OF CONTENTS 1. POLICY STATEMENT... 3 2. POLICY CONTEXT... 4 3. PURPOSE... 5 4. POLICY SCOPE AND APPLICATION... 6 5. RISK
about mogale city the municipality;
 introduction The Housing Development Agency ("HDA") is a national public development agency that promotes sustainable communities by making well located and appropriately planned land and buildings available
REPORT OF THE SELECT COMMITTEE ON FINANCE ON THE PROVINCIAL TREASURIES EXPENDITURE REVIEW FOR THE 2014/15 FINANCIAL YEAR, DATED 14 OCTOBER 2015
 REPORT OF THE SELECT COMMITTEE ON FINANCE ON THE PROVINCIAL TREASURIES EXPENDITURE REVIEW FOR THE 2014/15 FINANCIAL YEAR, DATED 14 OCTOBER 2015 1. Introduction and Background The Select Committee on Finance
BRT s. A Solution to an Urban Transport Crisis or a Financial Burden
 BRT s A Solution to an Urban Transport Crisis or a Financial Burden A de Jong 28 February 2013 Overview 1. Major challenges facing Urban Public Transport 2. Solution to the Crisis in Public Transport 3.
KEY DATES FOR THE MANGAUNG METROPOLITAN MUNCIPALITY IDP REVIEW/BUDGET 2017/18
 KEY DATES FOR THE MANGAUNG METROPOLITAN MUNCIPALITY IDP REVIEW/BUDGET 2017/18 Mangaung Metropolitan Municipality wishes to inform all its stakeholders and communities of the key opportunity to make inputs
THE ROAD TO ECONOMIC GROWTH
 THE ROAD TO ECONOMIC GROWTH Introduction 1. As in many countries, the road sector accounts for the major share of domestic freight and inter-urban passenger land travel in Indonesia, playing a crucial
NATIONAL LAND TRANSPORT PROGRAMME / INformation sheet / october 2012
 NATIONAL LAND TRANSPORT PROGRAMME 2012 15 / INformation sheet / october 2012 Creating transport solutions for a thriving New Zealand The NZ Transport Agency Board has adopted the 2012 15 National Land
Flood Risk Management Planning in Scotland: Arrangements for February 2012
 Flood Risk Management Planning in Scotland: Arrangements for 2012 2016 February 2012 Flood Risk Management (Scotland) Act 2009 1 Contents Forewords 1. Introduction to this document... 5 2. Sustainable
1 Malta. 1.1 Introduction
 1 Malta 1.1 Introduction This Country Summary for Malta has been produced as part of the Task 5 of the Ex Post Evaluation of Cohesion Policy Interventions 2000-2006 by the Cohesion Fund (including former
An Overview of the City of Newcastle and the Challenges facing the Achievement of Intermediary City Status. Zimbali, Fairmont Hotel - KwaDukuza
 An Overview of the City of Newcastle and the Challenges facing the Achievement of Intermediary City Status United Cities and Local Governments(UCLG) Intermediary Cities Learning Exchange Programme Zimbali,
P L A N N I N G F O R T H E H O M E S W E N E E D
 P L A N N I N G F O R T H E H O M E S W E N E E D C o r i n n e S w a i n A r u p F e l l o w H o u s i n g S u m m i t 2 0 1 6 The Crisis How can we address this? H A S T H E I S S U E E V E R T R U L
DUBLIN CITY COUNCIL. SUPPLEMENTARY DEVELOPMENT CONTRIBUTION SCHEME (under Section 49, Planning & Development Act, 2000 as amended)
") DUBLIN CITY COUNCIL SUPPLEMENTARY DEVELOPMENT CONTRIBUTION SCHEME (under Section 49, Planning & Development Act, 2000 as amended) LUAS CROSS CITY (ST. STEPHEN S GREEN TO BROOMBRIDGE LINE) 1. Definition
DUBLIN CITY COUNCIL SUPPLEMENTARY DEVELOPMENT CONTRIBUTION SCHEME (under Section 49, Planning & Development Act, 2000 as amended) LUAS CROSS CITY (ST. STEPHEN S GREEN TO BROOMBRIDGE LINE) 1. Definition
The Presidency Department of Performance Monitoring and Evaluation
 The Presidency Department of Performance Monitoring and Evaluation Briefing to the Standing Committee on Appropriations on the Strategic Plan and Annual Performance Plan for the 2012/13 financial year
Report to: Development Services Committee Date: June 26, 2017
 SUBJECT: New Provincial Plans Release of the 2017 Growth Plan, Greenbelt Plan and Oak Ridges Moraine Conservation Plan PREPARED BY: Policy and Research, Planning and Urban Design REVIEWED BY: Marg Wouters,
The DAC s main findings and recommendations. Extract from: OECD Development Co-operation Peer Reviews
 The DAC s main findings and recommendations Extract from: OECD Development Co-operation Peer Reviews Luxembourg 2017 Luxembourg has strengthened its development co-operation programme The committee concluded
Auditor-General tables three performance audit reports dealing with the pharmaceuticals, water infrastructure and urban renewal projects
 1 P a g e 30 November 2016 Auditor-General tables three performance audit reports dealing with the pharmaceuticals, water infrastructure and urban renewal projects PRETORIA Government leadership needs
CITY OF JOHANNESBURG CITY OF JOHANNESBURG Department of Economic Development
 CITY OF JOHANNESBURG CITY OF JOHANNESBURG Department of Economic Development City of Joburg Property Company 2013/14 Business Plan Contents 1 TABLE OF THE CONTENTS 1. Introduction 2. Goals of the Economic
Suggested elements for the post-2015 framework for disaster risk reduction
 United Nations General Assembly Distr.: General 16 June 2014 A/CONF.224/PC(I)/6 Original: English Third United Nations World Conference on Disaster Risk Reduction Preparatory Committee First session Geneva,
PRESENTATION TO SABOA CONFERENCE
 PRESENTATION TO SABOA CONFERENCE THE DEVELOPMENT OF PERFORMANCE BASED GROSS NEGOTIATED MODEL CONTRACT DOCUMENT FOR THE ROLL-OUT OF IPTNs 23 FEBRUARY 2012 1 CONTENTS PURPOSE OF THE PRESENTATION CURRENT
NDP/NSS- Regional Perspective
 NDP/NSS- Regional Perspective Presentation By: Deirdre Scully, Regional Planning Guidelines Implementation Officer for Dublin and Mid-East Regional Authorities. Presentation Format RPGs- Current status
Government Gazette REPUBLIC OF SOUTH AFRICA. AIDS HELPLINE: Prevention is the cure
 Please note that most Acts are published in English and another South African official language. Currently we only have capacity to publish the English versions. This means that this document will only
Table of Contents. CHAPTER 1: OVERVIEW Background IDP Legislation MEC Comments on 2004/05 IDP 2005/06 IDP Process 2005/06 IDP Context
 Table of Contents CHAPTER 1: OVERVIEW Background IDP Legislation MEC Comments on 2004/05 IDP 2005/06 IDP Process 2005/06 IDP Context CHAPTER 2: DEVELOPMENTAL REVIEW Profile of the City Development Challenges
FINANCIAL AND FISCAL COMMISSION
 FINANCIAL AND FISCAL COMMISSION For an Equitable Sharing of National Revenue FINANCIAL AND FISCAL COMMISSION SUBMISSION TO THE SELECT COMMITTEE ON FINANCE ON THE SIYENZA MANJE PROGRAMME 30 JUNE 2011 1
PRESENTATION TO THE SELECT COMMITTEE ON PUBLIC SERVICES DPW STRATEGIC PLAN AND BUDGET FOR 2012/13 15 MAY 2012
 PRESENTATION TO THE SELECT COMMITTEE ON PUBLIC SERVICES DPW STRATEGIC PLAN AND BUDGET FOR 2012/13 15 MAY 2012 TABLE OF CONTENTS MINISTER S FOREWORD PART A: STRATEGIC OVERVIEW INTRODUCTION AND STRATEGIC
Government Policy Statement on land transport 2018 release for public engagement
 In Confidence Office of the Minister of Transport Chair, Cabinet Economic Development Committee Government Policy Statement on land transport 2018 release for public engagement Proposal 1. This paper seeks
ICE Autumn Statement Submission. Introduction
 ICE Autumn Statement Submission Introduction High quality, high performing infrastructure is vital for economic growth and improved quality of life. Infrastructure also acts as a catalyst for social and
PUBLIC TRANSPORT TRIP GENERATION PARAMETERS FOR SOUTH AFRICA
 PUBLIC TRANSPORT TRIP GENERATION PARAMETERS FOR SOUTH AFRICA P Onderwater SMEC South Africa, 2 The Cresent, Westway office park, Westville 3629, Durban Tel: 031 277 6600; Email: pieter.onderwater@smec.com
SOL PLAATJE LOCAL MUNICIPALITY
 SOL PLAATJE LOCAL MUNICIPALITY Integrated Development Plan (IDP) IDP REVIEW 2017/18 PLANNING 2018/19 Table of Contents MAYOR S FOREWORD... 3 PREFACE... 5 VISION AND MISSION OF SOL PLAATJE MUNICIPALITY...
THE REGIONAL MUNICIPALITY OF PEEL BY-LAW NUMBER
 THE REGIONAL MUNICIPALITY OF PEEL BY-LAW NUMBER 12-2017 A by-law to adopt Amendment Number 27 to the Region of Peel Official Plan in order to revise and add policies in respect of health and the built
PLAN AND MANAGE THE BUDGET POLICY & PROCEDURE MANUAL
 PLAN AND MANAGE THE BUDGET POLICY & PROCEDURE MANUAL THABA CHWEU LOCAL MUNICIPALITY Approved 25 June 2012 Resolution no: A50/2012 TABLE OF CONTENTS 1 INTRODUCTION... 1 1.1 Vision and value statement...
1. INTRODUCTION 2. OVERVIEW OF POLICY PRIORITIES FOR 2016/17
 REPORT OF THE PORTFOLIO COMMITTEE ON COOPERATIVE GOVERNANCE AND TRADITIONAL AFFAIRS ON THE ANNUAL PERFORMANCE PLAN AND BUDGET VOTE 4 OF THE DEPARTMENT OF COOPERATIVE GOVERNANCE AND TRADITIONAL AFFAIRS
STRATEGIC PLAN AND BUDGET 2013 TO 2016 MUNICIPAL DEMARCATION BOARD
 STRATEGIC PLAN AND BUDGET 2013 TO 2016 MUNICIPAL DEMARCATION BOARD BRIEFING TO THE PORTFOLIO COMMITTEE ON COOPERATIVE GOVERNANCE AND TRADITIONAL AFFAIRS 19 MARCH 2013 DELEGATION Mr LJ Mahlangu Chairperson:
Road and Transport Management Project Phase II SAU/10/51658
 UNITED NATIONS DEVELOPMENT PROGRAMME United Nations Department of Social and Economic Affaires (UNDESA) Project of the Government of the Kingdom of Saudi Arabia Ministry of Transport (MOT) Road and Transport
BUILDING SUSTAINABLE FUNDING PARTNERSHIPS towards an all inclusive housing funding model for South Africa
 BUILDING SUSTAINABLE FUNDING PARTNERSHIPS towards an all inclusive housing funding model for South Africa Presented by Kutoane Kutoane CEO Gauteng Partnership Fund Date: 17 th September 2012 BACKGROUND
Government Gazette REPUBLIC OF SOUTH AFRICA
 Government Gazette REPUBLIC OF SOUTH AFRICA Vol. 526 Cape Town 3 April 2009 No. 32106 THE PRESIDENCY No. 408 3 April 2009 It is hereby notified that the President has assented to the following Act, which
Housing backlog: Protests and the demand for Housing in South Africa BY ESTERI MSINDO PSAM
 Housing backlog: Protests and the demand for Housing in South Africa BY ESTERI MSINDO PSAM Housing delivery law and regulation Section 26 of the constitution stipulates that everyone has the right to adequate
Mayoral Intent for the 10-year Budget (Long-term Plan)
") Mayoral Intent for the 10-year Budget (Long-term Plan) 2018 2028 Author: Mayor Phil Goff 22 August 2017 1 Purpose This report sets out my priorities as Mayor and the advice and work plans that I am asking
Mayoral Intent for the 10-year Budget (Long-term Plan) 2018 2028 Author: Mayor Phil Goff 22 August 2017 1 Purpose This report sets out my priorities as Mayor and the advice and work plans that I am asking
Analysis of the Alameda County Transportation Expenditure Plan Prepared by Alameda County Transportation Commission
 Analysis of the Alameda County Transportation Expenditure Plan Prepared by Alameda County Transportation Commission Discussion: In 1986, voters approved Measure B, a 1/2 cent sales tax, to fund transportation
QUEENSLAND GOVERNMENT RELEASES STATE INFRASTRUCTURE PLAN
 QUEENSLAND GOVERNMENT RELEASES STATE INFRASTRUCTURE PLAN After a three-year hiatus, the 2016 State Infrastructure Plan (SIP) is welcomed by the Infrastructure Association of Queensland (IAQ) as an enabler
2016 Division of Revenue Amendment Bill Select and Standing Committees on Apportions
 2016 Division of Revenue Amendment Bill Select and Standing Committees on Apportions National Treasury 10 November 2016 Overview The 2016 Division of Revenue Act (DoRA) was considered and approved by Legislatures
Screening report Turkey
 20 June 2007 Screening report Turkey Chapter 21 Trans-European networks Date of the screening meetings: Explanatory meeting: 30 June 2006 Bilateral meeting: 29 September 2006 Turkey: chapter 21 Trans-European
Albemarle County FY17 19 Strategic Plan
 Albemarle County FY17 19 Strategic Plan Strategic planning is used to set priorities and focus energy and resources to move an organization towards its vision. Albemarle County has used strategic planning
CITY OF VAUGHAN EXTRACT FROM COUNCIL MEETING MINUTES OF SEPTEMBER 26, 2017
 Item 6, Report No. 8, of the Finance, Administration and Audit Committee, which was adopted without amendment by the Council of the City of Vaughan on September 26, 2017. 6 DEVELOPMENT SERVICES FEE STRUCTURE
TSHWANE BRT: Development of a Traffic Model for the BRT Corridor Phase 1A Lines 1 and 2
 TSHWANE BRT: Development of a Traffic Model for the BRT Corridor Phase 1A Lines 1 and 2 L RETIEF, B LORIO, C CAO* and H VAN DER MERWE** TECHSO, P O Box 35, Innovation Hub, 0087 *Mouchel Group, 307-317,
COUNCIL POLICY. Policy Framework. Approved by City Strategy Committee on: 28 September Next Review Date: 28 September 2012
 COUNCIL POLICY Policy Framework Approved by City Strategy Committee on: 28 September 2009 Next Review Date: 28 September 2012 Responsible Officer: Adrian Stokes Position: Manager Sustainability Phone:
REPORT TO THE CAPITAL REGIONAL DISTRICT BOARD MEETING OF WEDNESDAY, SEPTEMBER 8, 2010
 REPORT TO THE CAPITAL REGIONAL DISTRICT BOARD MEETING OF WEDNESDAY, SEPTEMBER 8, 2010 SUBJECT City of Victoria Request for General Strategic Priorities Funding Application Support Johnson Street Bridge
REPORT EMANATING FROM THE STRATEGIC FLISP WORKSHOP HELD ON 15 AUGUST 2013 AT FOUNTAINS HOTEL, ST GEORGES MALL, CAPE TOWN
 Kahmiela August Director-Affordable Housing Email: Kahmiela.August@westerncape.gov.za Tel: +27 021 483 8412 Fax: +27 021 483 6617 Reference: 13/1/1 Strategic FLISP Workshop REPORT EMANATING FROM THE STRATEGIC
CHAPTER 2 BACKGROUND. Update of Previous Planning Work. Plan Development Process. Public Involvement and Review Process
 CHAPTER 2 BACKGROUND What Is the 2030 TSP? Update of Previous Planning Work Plan Development Process Public Involvement and Review Process Hennepin County Transportation Systems Plan (HC-TSP) Chapter 2
CIoS System Strategic Estates Group Briefing
 CIoS System Strategic Estates Group Briefing Transformation Board 17/01/2019 Jackie Pendleton, Chief Executive Lead Karl Simkins, CIoS Chief Finance Officer & Estates SRO Final Strategic Estates Group
SECTOR ASSESSMENT (SUMMARY): TRANSPORT 1
: TRANSPORT 1") Country Partnership Strategy: Viet Nam, 2012 2015 SECTOR ASSESSMENT (SUMMARY): TRANSPORT 1 Sector Road Map 1. Sector Performance, Problems, and Opportunities 1. Investment in the transport sector in Viet
Country Partnership Strategy: Viet Nam, 2012 2015 SECTOR ASSESSMENT (SUMMARY): TRANSPORT 1 Sector Road Map 1. Sector Performance, Problems, and Opportunities 1. Investment in the transport sector in Viet
Swords/ Airport to City Centre BRT Consultation Submission For Coach Tourism and Transport Council of Ireland (CTTC)
") - Swords/ Airport to City Centre BRT Consultation Submission For Coach Tourism and Transport Council of Ireland (CTTC) Final Submission November 2014 Email:- info@transportinsights.com Telephone:- + 353
- Swords/ Airport to City Centre BRT Consultation Submission For Coach Tourism and Transport Council of Ireland (CTTC) Final Submission November 2014 Email:- info@transportinsights.com Telephone:- + 353
Changing Approaches to Financing and Financial Management in the South African Local Government Sector
 868 Changing Approaches to Financing and Financial Management in the South African Local Government Sector D Sing School of Public Administration & Development Management, University of Natal ABSTRACT
Moretele Local Municipality. IDP/Budget Process Plan 2018/ ( IDP: Process Plan)
") Moretele Local Municipality IDP/Budget Process Plan /2019 1 Revision Control Final - August 2017 Strategic Services IDP/PMS Unit Enquiries: 012 716 1321 / 1324 (tel) thabo.makwela@moretele.org.za nyakale.lale@moretele.org.za
Moretele Local Municipality IDP/Budget Process Plan /2019 1 Revision Control Final - August 2017 Strategic Services IDP/PMS Unit Enquiries: 012 716 1321 / 1324 (tel) thabo.makwela@moretele.org.za nyakale.lale@moretele.org.za
Fingal/ North Dublin Transport Study Consultation Submission For Coach Tourism and Transport Council of Ireland (CTTC)
") Fingal/ North Dublin Transport Study Consultation Submission For Coach Tourism and Transport Council of Ireland (CTTC) Final Submission January 2015 Document Control Contract Name Contract Number C066
Fingal/ North Dublin Transport Study Consultation Submission For Coach Tourism and Transport Council of Ireland (CTTC) Final Submission January 2015 Document Control Contract Name Contract Number C066
Transaction Capital extends its track-record of robust organic growth: 26% earnings growth for FY17
 MEDIA RELEASE 21 November 2017 Transaction Capital extends its track-record of robust organic growth: 26% earnings growth for FY17 SA Taxi has invested more than R18.6 billion in the minibus taxi industry,
Strengthening Vermont s Economy by Integrating Transportation and Smart Growth Policy
 Strengthening Vermont s Economy by Integrating Transportation and Smart Growth Policy Technical Memorandum #4: Short List of Recommended Alternatives May 21, 2013 Tech Memo #4: Short List of Recommended
Edward R. Sajecki Commissioner of Planning and Building
 Corporate Report Clerk s Files Originator s Files CD.03.MIS DATE: TO: FROM: SUBJECT: Chair and Members of Planning and Development Committee Meeting Date: January 12, 2009 Edward R. Sajecki Commissioner
Special Economic Zones as a Trade Facilitation Measure. Asia Pacific Trade Facilitation Forum 2011
 Special Economic Zones as a Trade Facilitation Measure Asia Pacific Trade Facilitation Forum 2011 SEZs presentation content: 1. What are SEZs and what role do they play? 2. Experience with SEZs and emerging
Unit Standard : Apply the principles of budgeting within a municipality. Karel van der Molen
 Unit Standard 116345: Apply the principles of budgeting within a municipality Karel van der Molen Group The full programme 1. Strategic Management; Budgeting Implementation & Performance Management 2.
Greater Bristol Bus Network Major Scheme Business Case. Chapter 1. Developing the Full Approval Major Scheme Business Case
 Greater Bristol Bus Network Major Scheme Business Case Chapter 1 Developing the Full Approval Major Scheme Business Case i ii 1. The Case for Full Approval INTRODUCTION 1.1.1 Bath and North East Somerset,
SECTOR ASSESSMENT (SUMMARY): PUBLIC SECTOR MANAGEMENT (PUBLIC EXPENDITURE AND FISCAL MANAGEMENT) Sector Performance, Problems, and Opportunities
: PUBLIC SECTOR MANAGEMENT (PUBLIC EXPENDITURE AND FISCAL MANAGEMENT) Sector Performance, Problems, and Opportunities") Improving Public Expenditure Quality Program, SP1 (RRP VIE 50051-001) SECTOR ASSESSMENT (SUMMARY): PUBLIC SECTOR MANAGEMENT (PUBLIC EXPENDITURE AND FISCAL MANAGEMENT) 1 Sector Road Map 1. Sector Performance,
Improving Public Expenditure Quality Program, SP1 (RRP VIE 50051-001) SECTOR ASSESSMENT (SUMMARY): PUBLIC SECTOR MANAGEMENT (PUBLIC EXPENDITURE AND FISCAL MANAGEMENT) 1 Sector Road Map 1. Sector Performance,
DRAFT PROCESS PLAN. to guide the planning, drafting, adoption and review of the SWARTLAND INTEGRATED DEVELOPMENT PLAN. for. 1 July June 2022
 DRAFT PROCESS PLAN to guide the planning, drafting, adoption and review of the SWARTLAND INTEGRATED DEVELOPMENT PLAN for 1 July 2017-30 June 2022 For public inputs and comments June 2016 Draft IDP Process
Branch: Urban Planning and Environment
 Branch: Urban Planning and Environment Introduction The Urban Planning and Environment Branch participates in the continuum of land use and environmental planning that starts with pursuing long range city
HISTORIC ENVIRONMENT FUND
 HISTORIC ENVIRONMENT FUND Comments by Northern Ireland Environment Link 6 th June 2016 Northern Ireland Environment Link (NIEL) is the networking and forum body for non-statutory organisations concerned
TABLE OF CONTENTS SUBJECTS 1. INTRODUCTION 2. INSTITUTIONAL ARRANGEMENTS. Roles and responsibilities
 IDP REVIEW PROCESS PLAN DEPARTMENT OF THE OFFICE OF THE MUNICIPAL MANAGER JULY 2009-JUNE2010 TABLE OF CONTENTS SUBJECTS 1. INTRODUCTION 2. INSTITUTIONAL ARRANGEMENTS Roles and responsibilities 2.1 Council
NATIONAL TREASURY STRATEGIC PLAN 2013/17 PRESENTATION TO PARLIAMENTARY FINANCE COMMITTEES
 NATIONAL TREASURY STRATEGIC PLAN 2013/17 PRESENTATION TO PARLIAMENTARY FINANCE COMMITTEES 14 May 2013 TREASURY AIMS AND OBJECTIVES Chapter 13 of the Constitution of the Republic of South Africa. According
Medium-Term Budget 2018/ /21 CITY OF JOHANNESBURG MEDIUM-TERM BUDGET 2018/19 TO 2020/21
 CITY OF JOHANNESBURG MEDIUM-TERM BUDGET 2018/19 TO 2020/21 1 Table of Contents Page No PART1- ANNUAL BUDGET 1.1. EXECUTIVE SUMMARY 9 1.2. OPERATING BUDGET FRAMEWORK 9 1.3. CAPITAL EXPENDITURE 16 1.4. ANNUAL
Marsh Barton Rail Station Draft Benefits Realisation Plan and Monitoring and Evaluation Plan
 Draft Benefits Realisation Plan and Monitoring and Evaluation Plan May 2014 Devon County Council County Hall Topsham Road Exeter Devon EX2 4QD Contents 1 Scheme Background and Context... 3 1.1 Description
PDS-1. Planning & Development
 PDS1 Planning & Development Table of Contents Departmental Overview Divisions Building Development Services Policy Planning Transportation Planning Urban Design Operating Budget Overview Capital Budget
Agenda Item 8: National Infrastructure Commission and Budget Update
 Strategic Transport Forum 15 th December 2017 englandseconomicheartland@b uckscc.gov.uk Agenda Item 8: National Infrastructure Commission and Budget Update Recommendation: It is recommended that the Forum:
Chapter 16: National Economy Introduction
 16 National Economy 16.1 Introduction This chapter considers the Simandou Project s impacts on the national economy. The chapter considers the Project as a whole and does not distinguish between mine,
Executive Summary The Chal enge - Lives Are at Stake The JPIAMR The key to turn the tide of AMR
 0 Executive Summary The Challenge - Lives Are at Stake Antibiotics have saved millions of lives throughout the many decades it has been in use as a common drug. However, antibiotic resistance is now a
Report Card May 2015 T H I S P L A N I S A V A I L A B L E I N A L T E R N A T E F O R M A T B Y R E Q U E S T
 Report Card May 2015 T H I S P L A N I S A V A I L A B L E I N A L T E R N A T E F O R M A T B Y R E Q U E S T Aurora Overview Vision: Goal: : : Objective 3: Objective 4: : Goal: : : Goal: : : An innovative
Presentation to the Egyptian Ministry of Planning, Monitoring, and Administrative Reform (MPMAR) Study Tour: South Africa.
 Study Tour: South Africa.") Presentation to the Egyptian Ministry of Planning, Monitoring, and Administrative Reform (MPMAR) Study Tour: South Africa April 13 2016 STRUCTURE OF THE PRESENTATION 1. Background to South Africa s Intergovernmental
Presentation to the Egyptian Ministry of Planning, Monitoring, and Administrative Reform (MPMAR) Study Tour: South Africa April 13 2016 STRUCTURE OF THE PRESENTATION 1. Background to South Africa s Intergovernmental
COMMISSION STAFF WORKING DOCUMENT Accompanying the document
 EUROPEAN COMMISSION Brussels, 9.10.2017 SWD(2017) 330 final PART 9/13 COMMISSION STAFF WORKING DOCUMENT Accompanying the document REPORT FROM THE COMMISSION TO THE EUROPEAN PARLIAMENT, THE COUNCIL, THE
Building a Better Tomorrow
 Building a Better Tomorrow Investing in Ontario s Infrastructure to Deliver Real, Positive Change A Discussion Paper on Infrastructure Financing and Procurement February 2004 2 BUILDING A BETTER TOMORROW
Mersey Gateway Submission to the Spending Review
 Mersey Gateway Submission to the Spending Review Introduction Mersey Gateway is an integrated transport project that will provide the vital infrastructure that is required to deliver sustainable economic