Lecture 12: Economic Fluctuations. Rob Godby University of Wyoming
|
|
|
- Kelly Hill
- 5 years ago
- Views:
Transcription
1 Lecture 12: Economic Fluctuations Rob Godby University of Wyoming
2 Short-Run Economic Fluctuations Economic activity fluctuates from year to year. In some years, the production of goods and services rises. In other years normal growth does not occur, sometimes leading to recession. This is called the Business Cycle.
3 Long Run GDP If we were to plot real GDP over time, we would see a cyclical line representing actual GDP. Through this line we can define the long run trend of GDP, which represents the economy s growth rate over the long term. Deviations from this trend represent the phases of the business cycle.
4 GDP Long Run vs. Short Run Long Run (trend) Short Run (fluctuations from trend) Time
5 Long Run GDP Level The trend represents the long run (LR) in the economy. LR real GDP grows on average at 2-3%, which is represented by the slope of the trend line. As we have seen previously, this growth rate is determined by long run growth in productivity.
6 Long Run GDP Level As we have also seen previously, the potential output of the economy at a point in time is determined by: technology Factors of production available: Labour Supply (L) Capital (K) Resources (R) Human capital workers have Education Health
7 Potential GDP Using the production function, in the long run we define Potential GDP as Y=A(L, K,R) Potential GDP (Long Run or Trend Y GDP) is the point of reference used to compare the economy s performance to. It describes long run real GDP possible given technology and factors of production available at a point in time. It also describes the real output the economy will tend toward.
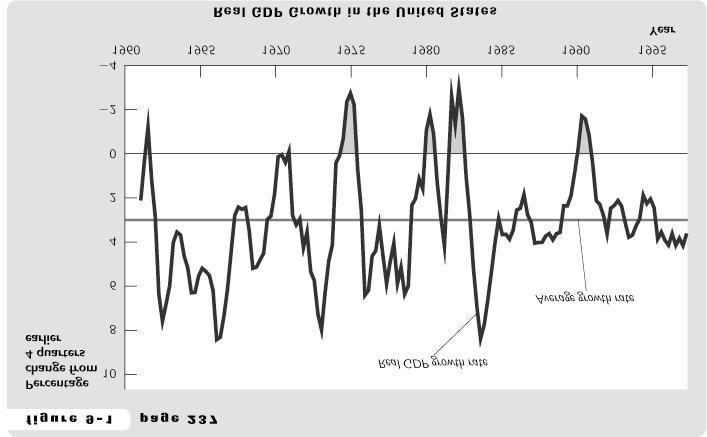
8 Short-Run Economic Fluctuations Real GDP in the Short Run does not always equal Potential GDP. If actual Real GDP is above potential GDP, then we call such a period of time a boom. If Real GDP is below potential GDP, or if growth in real GDP slows, then we call such a period of time a slowdown. If Real GDP is falls for two consecutive quarters (6 mos.), then we call such a period of negative growth a recession (shaded areas on next diagram).
9
10 Long Run vs. Short Run The long run refers to a period of time long enough that ALL prices can adjust to some economic shock. Output will Y tend to equal potential GDP assuming no other shock occurs. The short run refers to a period of time short enough such that ALL prices do NOT adjust to some economic shock. Output usually differs from Potential GDP in the short run.
11 Three Key Facts About Economic Fluctuations ➀Economic Fluctuations are Irregular and Unpredictable in occurrence and duration. ➁Most Macroeconomic Variables Fluctuate Together ➂As Output Falls, Unemployment Rises Changes in real GDP and the unemployment rate are inversely related.
12 The Basic Model of Economic Fluctuations Two variables are used in developing a model to analyze the short-run fluctuations: 1. The economy s output of goods and services, measured by real GDP 2. The overall price level, measured by the CPI or GDP deflator. The Model: Aggregate Demand and Aggregate Supply
13 The Aggregate Demand and Price Level Aggregate Supply Model Aggregate Supply (AS) P E Aggregate Demand (AD) Q E Quantity of Output
14 Aggregate Demand and Aggregate Supply The Aggregate Demand Curve shows the quantity of real GDP all households, firms and government are willing to buy at different price levels in the economy. The Aggregate Supply Curve shows the amount of real GDP created by all firms at different price levels in the economy. Together they determine GDP and the price level.
15 The Aggregate Demand Curve The aggregate demand (total expenditure) for goods and services may be referred to as: AD = C + I + G + NX Why is the aggregate demand curve downward sloping? 1. Pigou s Wealth Effect 2. Keynes Interest Rate Effect 3. Mundell-Fleming s Exchange Rate Effect 4. The Quantity Theory
16 Four Reasons for the Downward Slope of the Aggregate Demand Pigou s Wealth Effect: A decrease in the price level makes consumers feel wealthier, which stimulates the demand for consumption goods. The increase in consumer spending means a larger quantity of goods and services (total real GDP) demanded. High rates of growth in the past few years have been attributed to this effect as prices have not risen quickly relative to historic inflation rates.
17 Four Reasons for the Downward Slope of the Aggregate Demand Keynes Interest-Rate Effect: The lower the price level, the less money households need to hold to buy the goods and services they want. A lower price level (or lower inflation) reduces the interest rate, encourages greater spending on investment goods, and thereby increases the quantity of goods and services demanded.
18 Four Reasons for the Downward Slope of the Aggregate Demand Mundell-Fleming s Exchange-Rate Effect: When our price level rises, the U.S. dollar appreciates and the foreign currency price of U.S. goods goes up. Foreigners buy fewer of our goods, while Americans purchase more of their goods. Overall: net exports (NX) falls. Example: The Asian crisis reduced fears of overheating (inflation due to higher than potential output occurring) in the US economy in 1997 for this reason.
19 Four Reasons for the Downward Slope of the Aggregate Demand Quantity Theory: As P increases, assuming M and V are fixed, Y must decrease to maintain MV=PY The result is a downward sloping curve in the short-run.
20 Factors that might shift the Aggregate Demand Curve Shifts in the aggregate demand curve may arise because of: 1. Expectations changes causing changes in spending plans by consumers or firms. 2. Changes in fiscal or monetary policy. Anything that causes buyers to want to purchase more or less than before will cause the aggregate demand schedule to shift.
21 Factors that might shift the Aggregate Demand Curve AD = C + I + G + NX Fiscal Policy changes: if Government expenditure (G) increases, AD goes up at all price levels (outward shift). If taxes are lowered disposable income increases and consumption (C) causes AD to rise at all price levels (outward shift).
22 Factors that might shift the Aggregate Demand Curve AD = C + I + G + NX Monetary Policy changes: Recall the Quantity Theory: MV=PY an increase in money supply (M) increases the nominal GDP level (PY) since V is fixed. This results in an outward shift of the AD curve (for any given P-level, Y is higher).
23 Price Level Shifts in the Aggregate Demand Curve Outward shifts caused by higher expectations, government spending, lower taxes or increased money supply. AD AD Aggregate Demand Quantity of Output
24 The Long-Run Aggregate Supply Curve In the long-run, GDP level depends on the production function and factors of production available (L, K, R). Y= F(K, L, R) The price level does not affect these variables in the long-run. The Long-Run Aggregate Supply Curve is vertical at full-employment GDP (real GDP level where natural rate of unemployment occurs) with respect to the price level.
25 The Long-Run Aggregate Supply Curve Price Level Long-run Aggregate Supply (LRAS) Output at Full Employment or when economy is at the Natural Unemployment level. ( Potential GDP given L, K, R and technology available) Quantity of Output
26 Shifts in the Long-Run Aggregate Supply Curve Over time, any change in the factors that determine the long-run aggregate supply will cause the curve to shift (changes in L,K, R or technology). An event that reduces potential output shifts the schedule to the left. Any change that increases the economy s potential output will shift the curve to the right.
27 The Very Short-Run Aggregate Supply Curve In the very short run, prices are sticky, that is, they do not have time adjust to changes in output. Wages and prices may be sticky in the short run. If all prices do not adjust the price level would remain constant at all levels of output This creates a horizontal very short run supply curve which is relevant in the very short run.
28 The Short-Run Aggregate Supply (SRAS) Curve If some prices change and others don t, we get an intermediate case, or an AS curve with an upward slope. If a firm s price for it s good increases, they produce more output. An increase in some prices increases the overall level of prices in the economy tends to raise the quantity of goods and services supplied (real GDP).
29 3 Reasons for the SRAS Curve sloping upward Sticky wages: wages are set- if prices rise, but wages are fixed due to contracts, etc., firm revenue rises (from the price increase of their good) but labour costs haven t. This increases profits so firms produce more. Output rises as prices rise (SRAS is upward-sloped).
30 3 Reasons for the SRAS Curve sloping upward Sticky Prices: due to things like menu costs- when prices fall not all firms lower prices right away. When some do and some don t, firms with sticky (and now relatively higher) prices experience declining sales. This decreases profits for these firms so they produce less Output falls as prices fall (SRAS is upward-sloped)
31 3 Reasons for the SRAS Curve sloping upward Misperceptions (confusion): Producers may mistake an overall decrease in prices for a decrease in their good s relative price. They mistakenly believe this will decrease profits for them (it won t- if all prices fall, so do their costs) and they produce less. Output falls as prices fall (SRAS is upward-sloped).
32 Price Level Short-Run vs. Long-Run Aggregate Supply Curves LRAS SR Aggregate Supply (SRAS) (some prices change) P 1 Very Short Run AS (prices fixed) As time goes on, more and more prices can change and the aggregate supply curve gets steeper until it is vertical in the long run. Potential GDP Quantity of Output
33 Causes of Aggregate Supply Curve Shifts (Short and Long Run): Since Y= A(L,K,R)- Factor changes may lead to a shift in the short-run aggregate supply curve. Changes in Labour Supply (L) As L falls, SRAS shifts inward. Changes in Capital Supply (K) As K rises, SRAS shifts outward. Changes in Resource Supply (R) As R rises, SRAS shifts outward. Changes in Technology (A) Such improvements shift SRAS outward.
34 Short Run Aggregate Supply Curve Shifts: Expectations Expectations may also cause the SRAS to shift. People may expect inflation or deflation. If they expect the price level to rise, they demand higher wages- raising firm costs, and forcing price increases. This results in an upward shift of the SRASthe same production level occurs at a higher price level. Opposite occurs for expected deflation- the SRAS shifts down because prices and wages fall at every output level.
35 Shifts in the Aggregate Price Level Supply Curve AS Aggregate Supply AS Shifts outward caused by changes in factors of production (L,K, R), technology, or expectations Quantity of Output
36 Equilibrium in the Long- Run Equilibrium output, employment and price level are determined by the intersection of the aggregate demand curve and the long-run aggregate supply curve. Output is at its natural rate and the short-run aggregate supply curve passes through the point of intersection.
37 Price Level P E Equilibrium in the Long-Run LR Aggregate Supply In the long run, the economy tends toward the natural rate of employment at potential output level of GDP Aggregate Demand Q E Quantity of Output
38 Recession in the Short Run Two sources from which a recession in the economy may occur: A decrease (leftward shift) in aggregate demand A decrease (leftward shift) in aggregate supply Shifts in the aggregate demand or the aggregate supply curves result in fluctuations in the economy s output of goods and services.
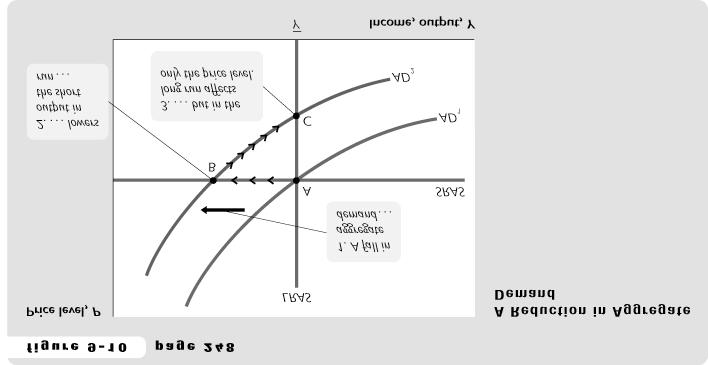
39 Source of Recession: A Decrease in Aggregate Demand For a given price level, a decrease in one or more components of the total spending function (C, I, G or NX) will cause the aggregate demand schedule to shift leftward. Output falls below the full employment output ( cyclical unemployment ) Unemployment rises price levels fall or inflation is reduced
40 A Decrease in Aggregate Price Level Demand Aggregate Supply P E Aggregate Demand Q E Quantity of Output
41 A Decrease in Aggregate Price Level Demand Aggregate Supply P E Aggregate Demand Q E Quantity of Output
42 A Decrease in Aggregate Price Level Demand Aggregate Supply P E Reduced GDP causes cyclical or short run unemployment Aggregate Demand Q E Quantity of Output
43
44
45 Source of Recession: A Decrease in Aggregate Supply A decrease in short-run aggregate supply (possibly caused by higher input prices) will result in a new equilibrium along the aggregate demand curve at a level of GDP below full employment. A fall in total output below full output An increase in unemployment an increase in prices or inflation
46 A Decrease in Aggregate Price Level Supply Aggregate Supply P E Aggregate Demand Q E Quantity of Output
47 A Decrease in Aggregate Price Level Supply Aggregate Supply P E Aggregate Demand Q E Quantity of Output
48 A Decrease in Aggregate Price Level Supply Aggregate Supply P E Reduced GDP causes cyclical unemployment Aggregate Demand Q R Q E Quantity of Output
49 A Decrease in Aggregate Supply When the aggregate supply curve shifts left, the price level rises and output decreases. This is called Stagflation. Stagflation refers to a simultaneous decrease in real GDP and an increase in prices or inflation.
50 Actions by Policymakers During Periods of Recession Policymakers, when faced by decreasing aggregate demand or supply could: Do nothing, waiting for all prices to adjust in the long run. Take action to increase aggregate demand using expansionary fiscal policy (e.g. increase government spending or decrease taxes). Implement expansionary monetary policy.
51 Doing Nothing in a Recession In a recession, prices are low. This should eventually increase consumption, resulting in higher output and more labour being hired. In order for more labour to be hired, or consumption to increase, expectations must improve. Improved expectations could take time to form, causing recessions to be long-lasting.
52 Doing Nothing in a Recession Price Level P E P R Aggregate Supply Improved expectations and low prices, including wages may increase AD, ending the recession. This could take time. Aggregate Demand Q R Q E Quantity of Output
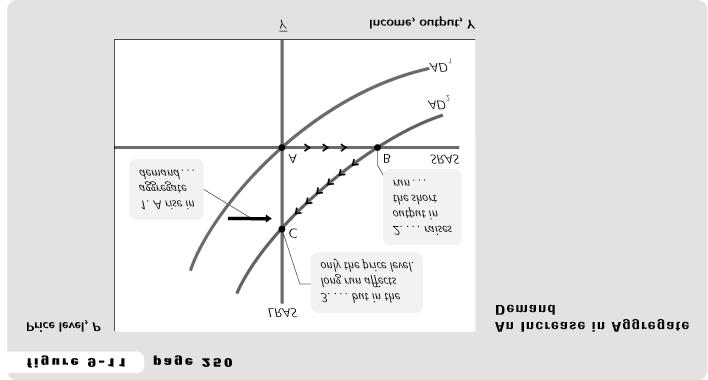
53 Expansionary monetary or fiscal policy Notice by increasing the money supply or government spending, or reducing taxes, the AD curve shifts outward. Such expansionary policies could decrease unemployment but also cause inflation. This is called the unemploymentinflation tradeoff.
54 Using Aggregate Demand Price Level to end a Recession Aggregate Supply P E Expansionary fiscal or monetary policy shifts the AD curve to the right, increasing employment and output. Aggregate Demand Q R Q E Quantity of Output
55 Expansionary Policy Since expansionary policy can shift AD to the left and increase prices causing inflation, it is used sparingly. A warning: Continuous deficits caused by higher and higher spending are therefore inflationary as well as bad for growth if government spending does not increase the economy s capital.
56 Summary: Economic fluctuations can be analyzed using aggregate demand and aggregate supply. Slope of the AS function depends on the time-frame. In the long run, output and unemployment tend to their potential levels, making the AS vertical. In the short run, AS is flatter. AS is shifted by changes in input prices, productivity, or business taxes. AD is shifted by expectations or government action (expansionary fiscal or monetary policy). Rightward shifts in AD or AS can cause a recession (reduced output and cyclical unemployment). In the case of a recession, the government could do nothing, in which case recessions may be long-lasting, or use expansionary fiscal or monetary policy to shift AD outward. Expansionary fiscal and monetary policies face the unemployment-inflation tradeoff.
Lecture 22. Aggregate demand and aggregate supply
 Lecture 22 Aggregate demand and aggregate supply By the end of this lecture, you should understand: three key facts about short-run economic fluctuations how the economy in the short run differs from the
Aggregate Demand and Aggregate Supply
 Aggregate Demand and Aggregate Supply Chapter 19 Copyright 2001 by Harcourt, Inc. All rights reserved. Requests for permission to make copies of any part of the work should be mailed to: Permissions Department,
PART XII: SHORT-RUN ECONOMIC FLUCTUATIONS AGGREGATE DEMAND AND AGGREGATE SUPPLY. Chapter 33
 1 PART XII: SHORT-RUN ECONOMIC FLUCTUATIONS AGGREGATE DEMAND AND AGGREGATE SUPPLY Chapter 33 What did we learn so far? Macroeconomics studies the economy as a whole It aims to explain economic events that
Aggregate Demand and Aggregate Supply
 C H A P T E R 33 Aggregate Demand and Aggregate Supply Economics P R I N C I P L E S O F N. Gregory Mankiw Premium PowerPoint Slides by Ron Cronovich 2009 South-Western, a part of Cengage Learning, all
Introduction. Over the long run, real GDP grows about 3% per year on average.
 Introduction Over the long run, real GDP grows about 3% per year on average. In the short run, GDP fluctuates around its trend. Recessions: periods of falling real incomes and rising unemployment Depressions:
Aggregate Supply and Aggregate Demand
 Aggregate Supply and Aggregate Demand ECO 301: Money and Banking 1 1.1 Goals Goals Specific Goals Be able to explain GDP fluctuations when the price level is also flexible. Explain how real GDP and the
Lesson 11 Aggregate demand and Aggregate Supply
 Lesson 11 Aggregate demand and Aggregate Supply Henan University of Technology Sino-British College Transfer Abroad Undergraduate Programme 0 In this lesson, look for the answers to these questions: What
Aggregate Demand and Aggregate Supply
 Aggregate Demand and Aggregate Supply Aggregate Demand and Aggregate Supply The Learning Objectives in this presentation are covered in Chapter 20: Aggregate Demand and Aggregate Supply LEARNING OBJECTIVES
10. Oferta y demanda agregada
 10. Oferta y demanda agregada In this chapter, look for the answers to these questions: What are economic fluctuations? What are their characteristics? How does the model of aggregate demand and aggregate
Introduction to Economic Fluctuations
 Chapter 9 Introduction to Economic Fluctuations slide 0 In this chapter, you will learn facts about the business cycle how the short run differs from the long run an introduction to aggregate demand an
Lecture 4. Short run economic fluctuations.
 MACROECONOMICS 2 Lecture 4. Short run economic fluctuations. The AD/AS model a short reminder. Joanna Siwińska - Gorzelak Time horizons in macroeconomics Time horizons in macroeconomics Long run: Prices
6. The Aggregate Demand and Supply Model
 6. The Aggregate Demand and Supply Model 1 Aggregate Demand and Supply Curves The Aggregate Demand Curve It shows the relationship between the inflation rate and the level of aggregate output when the
Chapter 9 Introduction to Economic Fluctuations
 Chapter 9 Introduction to Economic Fluctuations facts about the business cycle how the short run differs from the long run an introduction to aggregate demand an introduction to aggregate supply in the
Chapter 13. Aggregate Demand and Aggregate Supply
 Chapter 13 Aggregate Demand and Aggregate Supply 1 Output and Price Level Figure 1 Two-Way Relationship Between Output and Price Level Aggregate Demand Curve Price Level Real GDP Aggregate Supply Curve
Lecture 4. Short run economic fluctuations.
 MACROECONOMICS 2 Lecture 4. Short run economic fluctuations. The AD/AS model a short reminder. Joanna Siwińska - Gorzelak Time horizons in macroeconomics Time horizons in macroeconomics Long run: Prices
Macroeonomics. 20 this chapter, Aggregate Demand and Aggregate Supply. look for the answers to these questions: Introduction. N.
 C H A T E R In 20 this chapter, look for the answers to these questions: Aggregate Demand and Aggregate Supply R I N C I L E S O F Macroeonomics N. Gregory Mankiw remium oweroint Slides by Ron Cronovich
Introduction to Economic Fluctuations. Instructor: Dmytro Hryshko
 Introduction to Economic Fluctuations Instructor: Dmytro Hryshko 1 / 32 Outline facts about the business cycle how the short run differs from the long run an introduction to aggregate demand an introduction
Economic Fluctuations
 Sherif Khalifa Sherif Khalifa () Economic Fluctuations 1 / 43 Definition The business cycle is the fluctuations in the production output of goods and services in an economy. Definition The business cycle
Aggregate Demand & Aggregate Supply
 Aggregate Demand & Aggregate Supply 1 Aggregate Demand AD = C + I + G + NX The sum of planned consumption, investment, government, and net exports expenditures on final goods and services 2 Aggregate Demand
Objectives AGGREGATE DEMAND AND AGGREGATE SUPPLY
 AGGREGATE DEMAND 7 AND CHAPTER AGGREGATE SUPPLY Objectives After studying this chapter, you will able to Explain what determines aggregate supply Explain what determines aggregate demand Explain macroeconomic
Mankiw Chapter 10. Introduction to Economic Fluctuations. Introduction to Economic Fluctuations CHAPTER 10
 Mankiw Chapter 10 0 IN THIS CHAPTER, WE WILL COVER: facts about the business cycle how the short run differs from the long run an introduction to aggregate demand an introduction to aggregate supply in
CHAPTER 23 OUTPUT AND PRICES IN THE SHORT RUN
 CHAPTER 23 OUTPUT AND PRICES IN THE SHORT RUN Expand model to make price level endogenous variable. LEARNING OBJECTIVES - Why exogenous change in price level shifts AE curve and changes equilibrium level
Questions and Answers
 Questions and Answers Ch 1 (continued) Q1: MCQ Aggregate Demand 1) The aggregate demand curve shows A) total expenditures at different levels of national income. B) the quantity of real GDP demanded at
Macroeconomics. Aggregate Demand and Aggregate Supply. Introduction. In this chapter, look for the answers to these questions: N.
 C H A T E R 15 Aggregate Demand and Aggregate Supply B R I E F R I N C I L E S O F Macroeconomics N. Gregory Mankiw remium oweroint Slides by Ron Cronovich 2010 South-Western, a part of Cengage Learning,
Long Run vs. Short Run
 Long Run vs. Short Run Long Run: A period long enough for nominal wages and other input prices to change in response to a change in the nation s price level. The Basic Model of Economic Fluctuations Two
Chapter 23. Aggregate Supply and Aggregate Demand in the Short Run. In this chapter you will learn to. The Demand Side of the Economy
 Chapter 23 Aggregate Supply and Aggregate Demand in the Short Run In this chapter you will learn to 1. Explain why an exogenous change in the price level shifts the AE curve and changes the equilibrium
Archimedean Upper Conservatory Economics, October 2016
 Multiple Choice Identify the choice that best completes the statement or answers the question. 1. The marginal propensity to consume is equal to: A. the proportion of consumer spending as a function of
AQA Economics AS-level
 AQA Economics AS-level Macroeconomics Topic 2: How the Macroeconomy Works 2.2 Aggregate demand and aggregate supply analysis Notes Aggregate demand is the total demand in the economy. It measures spending
ECON 212: ELEMENTS OF ECONOMICS II Univ. Of Ghana, Legon Lecture 8: Aggregate Demand Aggregate Supply Dr. Priscilla T. Baffour
 ECON 212: ELEMENTS OF ECONOMICS II Univ. Of Ghana, Legon Lecture 8: Aggregate Demand Aggregate Supply Dr. Priscilla T. Baffour Sections 1. Relaxing a Temporal Assumption Price Level is no longer fixed.
MULTIPLE CHOICE. Choose the one alternative that best completes the statement or answers the question.
 Econ 105 Study Questions #2: The AD-AS model and Money and Banking From the Kennedy Text: Chapter 5 pp 95-96 Media Ex. #3, #5, #7 Chapter 6 pp 118 N1, N2, N3 Chapter 8 pp140-41 Media Ex. #2, #3, #7, #11,
AGGREGATE DEMAND AGGREGATE SUPPLY
 AGGREGATE DEMAND 8 AND CHAPTER AGGREGATE SUPPLY A Way to View the Economy We can think of an economy as consisting of two major activities: buying and producing. When economists speak about aggregate demand,
Macroeconomics. Introduction to Economic Fluctuations. Zoltán Bartha, PhD Associate Professor. Andrea S. Gubik, PhD Associate Professor
 Institute of Economic Theories - University of Miskolc Macroeconomics Introduction to Economic Fluctuations Zoltán Bartha, PhD Associate Professor Andrea S. Gubik, PhD Associate Professor Business cycle:
ECON 3010 Intermediate Macroeconomics Final Exam
 ECON 3010 Intermediate Macroeconomics Final Exam Multiple Choice Questions. (60 points; 3 pts each) 1. The returns to scale in the production function YY = KK 0.5 LL 0.5 are: A) decreasing. B) constant.
Macroeconomics 1 Lecture 11: ASAD model
 Macroeconomics 1 Lecture 11: ASAD model Dr Gabriela Grotkowska Lecture objectives difference between short run & long run aggregate demand aggregate supply in the short run & long run see how model of
III. 9. IS LM: the basic framework to understand macro policy continued Text, ch 11
 Objectives: To apply IS-LM analysis to understand the causes of short-run fluctuations in real GDP and the short-run impact of monetary and fiscal policies on the economy. To use the IS-LM model to analyse
Econ 102 Discussion Section 8 (Chapter 12, 13) March 20, 2015
 March 20, 2015") Econ 102 Discussion Section 8 (Chapter 12, 13) March 20, 2015 The Multiplier and Shifting the Aggregate Expenditures Function The multiplier effect describes how changes in autonomous expenditures lead
Econ 102 Discussion Section 8 (Chapter 12, 13) March 20, 2015 The Multiplier and Shifting the Aggregate Expenditures Function The multiplier effect describes how changes in autonomous expenditures lead
Archimedean Upper Conservatory Economics, November 2016 Quiz, Unit VI, Stabilization Policies
 Multiple Choice Identify the choice that best completes the statement or answers the question. 1. The federal budget tends to move toward _ as the economy. A. deficit; contracts B. deficit; expands C.
Lecture 10 Aggregate Demand and Supply. Principles of Macroeconomics KOF, ETH Zurich, Prof. Dr. Jan-Egbert Sturm Fall Term 2008
 Lecture 10 Aggregate Demand and Supply Principles of Macroeconomics KOF, ETH Zurich, Prof. Dr. Jan-Egbert Sturm Fall Term 2008 General Information 23.9. Introduction Ch. 1,2 30.9. National Accounting Ch.
download instant at
 Exam Name MULTIPLE CHOICE. Choose the one alternative that best completes the statement or answers the question. 1) The aggregate supply curve 1) A) shows what each producer is willing and able to produce
Questions and Answers
 Questions and Answers Chapter 1 Q1: MCQ Aggregate demand 1. The aggregate demand curve: A) is up-sloping because a higher price level is necessary to make production profitable as production costs rise.
Introduction. Aggregate Demand and Aggregate Supply. In this chapter, look for the answers to these questions:
 33 Aggregate Demand and Aggregate Supply R I N C I L E S O F ECONOMICS FOURTH EDITION N. GREGOR MANKIW remium oweroint Slides by Ron Cronovich 2008 update 2008 South-Western, a part of Cengage Learning,
AP Macroeconomics. Scoring Guidelines
 2018 AP Macroeconomics Scoring Guidelines College Board, Advanced Placement Program, AP, AP Central, and the acorn logo are registered trademarks of the College Board. AP Central is the official online
Chapter 9 Chapter 10
 Assignment 4 Last Name First Name Chapter 9 Chapter 10 1 a b c d 1 a b c d 2 a b c d 2 a b c d 3 a b c d 3 a b c d 4 a b c d 4 a b c d 5 a b c d 5 a b c d 6 a b c d 6 a b c d 7 a b c d 7 a b c d 8 a b
VII. Short-Run Economic Fluctuations
 Macroeconomic Theory Lecture Notes VII. Short-Run Economic Fluctuations University of Miami December 1, 2017 1 Outline Business Cycle Facts IS-LM Model AD-AS Model 2 Outline Business Cycle Facts IS-LM
ophillips Curve Multiple Choice Identify the choice that best completes the statement or answers the question.
 ophillips Curve Multiple Choice Identify the choice that best completes the statement or answers the question. 1. If the natural rate of unemployment is 5%, and the actual rate of unemployment is 4%: A.
Chapter 13. Aggregate Demand and Aggregate Supply. Output and Price Level. Deriving the Aggregate Demand Curve. The Aggregate Demand Curve
 Output and Figure 1 Two-Way Relationship Between Output and Aggregate Demand Curve Chapter 13 Aggregate Demand and Aggregate Supply Price Level Aggregate Supply Curve Real GDP 1 2 The Aggregate Demand
Problem Set #5 Due in hard copy at beginning of lecture on Monday, April 8, 2013
 Name: Solutions Department of Economics Professor Dowell California State University, Sacramento Spring 2013 Problem Set #5 Due in hard copy at beginning of lecture on Monday, April 8, 2013 Important:
The aggregate supply curve shows the relationship between the aggregate price level and the quantity of aggregate output in the economy.
 Chapter 32 The aggregate supply curve shows the relationship between the aggregate price level and the quantity of aggregate output in the economy. GDP Deflator can be used as a measure of the price level
Aggregate Demand and Aggregate Supply. Chapter Objectives. AD AS Model
 10 Demand and Supply 10-1 Chapter Objectives Demand and the Factors That Cause it to Change. Supply and the Factors That Cause it to Change. How AD and AS Determine an Economy s and the Level of Real GDP.
Introduction to Economic Fluctuations
 CHAPTER 10 Introduction to Economic Fluctuations Modified for ECON 2204 by Bob Murphy 2016 Worth Publishers, all rights reserved IN THIS CHAPTER, OU WILL LEARN: facts about the business cycle how the short
ECON 3010 Intermediate Macroeconomics Chapter 10
 ECON 3010 Intermediate Macroeconomics Chapter 10 Introduction to Economic Fluctuations Facts about the business cycle GDP growth averages 3 3.5 percent per year C (consumption) and I (Investment) fluctuate
Economics 1012A: Introduction to Macroeconomics FALL 2007 Dr. R. E. Mueller Third Midterm Examination November 15, 2007
 Economics 1012A: Introduction to Macroeconomics FALL 2007 Dr. R. E. Mueller Third Midterm Examination November 15, 2007 Answer all of the following questions by selecting the most appropriate answer on
Question 5 : Franco Modigliani's answer to Simon Kuznets's puzzle regarding long-term constancy of the average propensity to consume is that : the ave
 DIVISION OF MANAGEMENT UNIVERSITY OF TORONTO AT SCARBOROUGH ECMCO6H3 L01 Topics in Macroeconomic Theory Winter 2002 April 30, 2002 FINAL EXAMINATION PART A: Answer the followinq 20 multiple choice questions.
Questions and Answers. Intermediate Macroeconomics. Second Year
 Questions and Answers Intermediate Macroeconomics Second Year Chapter2 Q1: MCQ 1) If the quantity of money increases, the A) price level rises and the AD curve does not shift. B) AD curve shifts leftward
ECON Drexel University Summer 2008 Assignment 2. Due date: July 29, 2008
 ECON 202-001 Drexel University Summer 2008 Assignment 2 Due date: July 29, 2008 Instructor: Yuan Yuan Name This homework has up to 10 points bonus. Question 1 (40 points, 2 points each): MULTIPLE CHOICE.
Aggregate Supply and Demand Model
 THE AGGREGATE MODEL Aggregate Supply and Demand Model The AS-AD model helps us understand aggregate output (RGDP), employment, prices and the business cycle. Aggregate Demand shows the quantity of goods
Economic Fluctuations
 Sherif Khalifa Sherif Khalifa () Economic Fluctuations 1 / 30 Short-run economic fluctuations are often called business cycles. During periods of economic expansion, firms find that customers are plentiful
Suggested Answers Problem Set # 5 Economics 501 Daniel
 1. Use graphs of IS-LM-FE and AS-AD models to explain why RBC models with productivity shocks and money-supply shocks fail to explain the pro-cyclicality of money growth and inflation. Inflation falls
Expectations Theory and the Economy CHAPTER
 Expectations and the Economy 16 CHAPTER Phillips Curve Analysis The Phillips curve is used to analyze the relationship between inflation and unemployment. We begin the discussion of the Phillips curve
Tradeoff Between Inflation and Unemployment
 CHAPTER 13 Aggregate Supply and the Short-Run Tradeoff Between Inflation and Unemployment Questions for Review 1. In this chapter we looked at two models of the short-run aggregate supply curve. Both models
The Influence of Monetary and Fiscal Policy on Aggregate Demand. Lecture
 The Influence of Monetary and Fiscal Policy on Aggregate Demand Lecture 10 28.4.2015 Previous Lecture Short Run Economic Fluctuations Short Run vs. Long Run The classical dichotomy and monetary neutrality
Real GDP Growth in the United States Introduction to Economic Fluctuations slide 2.
 Real GD Growth in the United States 10 ercent change from 4 quarters 8 earlier Average growth rate = 3.5% 6 4 2 0-2 -4 1960 1965 1970 1975 1980 1985 1990 1995 2000 Introduction to Economic Fluctuations
Chapter 9. Introduction to Economic Fluctuations
 Chapter 9 Introduction to Economic Fluctuations 0 1 Learning Objectives difference between short run & long run introduction to aggregate demand aggregate supply in the short run & long run see how model
Lecturer: Dr. Priscilla Twumasi Baffour, Department of Economics Contact Information:
 MACROECONOMIC EQUILIBRIUM AND MONETARY POLICY Lecturer: Dr. Priscilla Twumasi Baffour, Department of Economics Contact Information: ptbaffour@ug.edu.gh College of Education School of Continuing and Distance
chapter: Aggregate Demand and Aggregate Supply Aggregate Demand The Aggregate Demand Curve The Aggregate Demand Curve
 >> chapter: 1 Demand and Supply Krugman/Wells WHAT YOU WILL LEARN IN THIS CHAPTER " How the demand curve illustrates the relationship between the and the quantity of output demanded in the economy " How
MULTIPLE CHOICE. Choose the one alternative that best completes the statement or answers the question.
 Econ 330 Spring 2017: FINAL EXAM Name ID Section Number MULTIPLE CHOICE. Choose the one alternative that best completes the statement or answers the question. 1) Tobin's q theory suggests that monetary
AP Econ Practice Test Unit 5
 DO NOT WRITE ON THIS TEST! AP Econ Practice Test Unit 5 Multiple Choice Identify the choice that best completes the statement or answers the question. 1. The marginal propensity to consume is equal to:
CIE Economics AS-level
 CIE Economics AS-level Topic 4: The Macroeconomy a) Aggregate Demand (AD) and Aggregate Supply (AS) analysis Notes Determinants of AD: Aggregate demand is the total demand in the economy. It measures spending
Macroeconomics CHAPTER 10. Aggregate Supply and Aggregate Demand
 Macroeconomics CHAPTER 10 Aggregate Supply and Aggregate Demand What you will learn in this chapter: How the aggregate supply curve illustrates the relationship between the aggregate price level and the
Prices and Output in an Open Economy: Aggregate Demand and Aggregate Supply
 Prices and Output in an Open conomy: Aggregate Demand and Aggregate Supply chapter LARNING GOALS: After reading this chapter, you should be able to: Understand how short- and long-run equilibrium is reached
A decrease in the price level makes consumers feel more wealthy, which in turn encourages them to spend more.
 The aggregate-demand curve: Why the aggregate-demand curve is downward slopping: The price level and consumption: The wealth effect The price level and investment: The interest-rate effect The price level
Aggregate Demand and Aggregate Supply
 Aggregate Demand and Aggregate Supply SLIDES PREPARED BY JUDITH SKUCE, GEORGIAN COLLEGE 1 In this chapter you will learn 8.1 What determines the shape of the aggregate demand curve and what factors shift
Aggregate Supply and Demand
 Aggregate demand is the relationship between GDP and the price level. When only the price level changes, GDP changes and we move along the Aggregate Demand curve. The total amount of goods and services,
Examination Period 3: 2016/17
 Examination Period 3: 2016/17 ECN201217N Module Title Level Time Allowed Intermediate Macroeconomics Five Two hours Instructions to students: Enter your student number not your name on all answer books.
Helpful Hint Fiscal Policy and the AS-AD Model
 Helpful Hint Fiscal Policy and the AS-AD Model In this Helpful Hint, we analyze the effects of a change in fiscal policy using the AS-AD model. In doing so, it is useful to consider a specific example.
Economic Fluctuations
 Sherif Khalifa Sherif Khalifa () Economic Fluctuations 1 / 29 Definition The business cycle describes the fluctuations in the production output of goods and services in an economy. The business cycle is
FINAL EXAM STUDY GUIDE
 AP MACROECONOMICS-2017 Name: FINAL EXAM STUDY GUIDE Instructions: DUE: Day of FINAL EXAM => Friday 12/22 nd (1 st & 2 nd Periods) Thursday 12/21 st (4 th period) Section 1: PRODUCTION POSSIBLITIES FRONTIER
7 AGGREGATE SUPPLY AND AGGREGATE DEMAND* Chapter. Key Concepts
 Chapter 7 AGGREGATE SUPPLY AND AGGREGATE DEMAND* Key Concepts Aggregate Supply The aggregate production function shows that the quantity of real GDP (Y ) supplied depends on the quantity of labor (L ),
Economic Fluctuations
 Sherif Khalifa Sherif Khalifa () Economic Fluctuations 1 / 39 Economy s output experiences short run fluctuations around the long run upward trend. Fluctuations in the economy s output are closely associated
Disposable income (in billions)
") Section 4 version 2 Multiple Choice Identify the choice that best completes the statement or answers the question. 1. An increase in the MPC: A. increases the multiplier. B. shifts the autonomous investment
Section 4 version 2 Multiple Choice Identify the choice that best completes the statement or answers the question. 1. An increase in the MPC: A. increases the multiplier. B. shifts the autonomous investment
ECON 209 FINAL EXAM COURSE PACK FALL 2017
 ECON 209 FINAL EXAM COURSE PACK FALL 2017 www.sleepingpolarbear.ca HANDCRAFTED WITH IN THE NORTH POLE ~ TABLE OF CONTENTS ~ ECON 209: FINAL EXAM COURSE PACK SECTION 1 (CH 19-20): INTRO TO MACRO & GDP ACCOUNTING...
Aggregate to add up, aggregation usually implies that the things being added up are similar, but not exactly identical
 Macro Short-Run AS/AD Model Essentials Up to this point, our discussions of unemployment, inflation, output, and income have revolved around how we measure these indicators of economic performance. Now
1 Figure 1 (A) shows what the IS LM model looks like for the case in which the Fed holds the
 shows what the IS LM model looks like for the case in which the Fed holds the") 1 Figure 1 (A) shows what the IS LM model looks like for the case in which the Fed holds the money supply constant. Figure 1 (B) shows what the model looks like if the Fed adjusts the money supply to hold
1 Figure 1 (A) shows what the IS LM model looks like for the case in which the Fed holds the money supply constant. Figure 1 (B) shows what the model looks like if the Fed adjusts the money supply to hold
Karl Marx and Market Failure
 Unit 3 Karl Marx and Market Failure Krugman Module 74 pp. 723-726; Module 76 pp. 743-750; Module 77 pp.754-756; Module 78 pp. 761-770; Module 79 pp. 782-785 Modules 17-19 pp. 172 198 1 Greed is Good. -The
Macroeconomic Analysis Econ 6022
 1 / 36 Macroeconomic Analysis Econ 6022 Lecture 10 Fall, 2011 2 / 36 Overview The essence of the Keynesian Theory - Real-Wage Rigidity - Price Stickiness Justification of these two key assumptions Monetary
Review: Markets of Goods and Money
 TOPIC 6 Putting the Economy Together Demand (IS-LM) 2 Review: Markets of Goods and Money 1) MARKET I : GOODS MARKET goods demand = C + I + G (+NX) = Y = goods supply (set by maximizing firms) as the interest
Keynes Law and Say s Law in the AD/AS Model
 Keynes Law and Say s Law in the AD/AS Model By: OpenStaxCollege The AD/AS model can be used to illustrate both Say s law that supply creates its own demand and Keynes law that demand creates its own supply.
MACROECONOMICS. Section I Time 70 minutes 60 Questions
 MACROECONOMICS Section I Time 70 minutes 60 Questions Directions: Each of the questions or incomplete statements below is followed by five suggested answers or completions. Select the one that is best
Aggregate Supply and Demand Model
 THE AGGREGATE MODEL Aggregate Supply and Demand Model The AS-AD model helps us understand aggregate output (RGDP), employment, prices and the business cycle. Aggregate Demand shows the quantity of goods
Business Fluctuations: Aggregate Demand and Supply
 Chapter 13 MODERN PRINCIPLES OF ECONOMICS Third Edition Business Fluctuations: Aggregate Demand and Supply Outline The Aggregate Demand Curve The Long-Run Aggregate Supply Curve Real Shocks Aggregate Demand
Chapter 10/9. Introduction to Economic Fluctuations 10/8/2017. The chapter covers: Facts about the business cycle
 Chapter 1/9 Introduction to Economic Fluctuations The chapter covers: facts about the business cycle and Okun s Law an introduction to aggregate demand an introduction to aggregate supply in the short
Unit 3.3 Macroeconomic Models Unit Overview
 Unit 3.3 Unit Overview 3.3 Macroeconomic models Aggregate demand - components Aggregate supply >>short-run >>long-run (Keynesian versus neo-classical approach) Full employment level of national income
FINAL EXAM STUDY GUIDE
 AP MACROECONOMICS-2018 Name: FINAL EXAM STUDY GUIDE Instructions: DUE: Day of FINAL EXAM => Friday 12/21 st (1 st & 2 nd Periods) Thursday 12/20 th (4 th period) Section 1: PRODUCTION POSSIBLITIES FRONTIER
Chapter 12 Aggregate Demand II: Applying the IS -LM Model
 Chapter 12 Aggregate Demand II: Applying the IS -LM Model Modified by un Wang Eco 3203 Intermediate Macroeconomics Florida International University Summer 2017 2016 Worth Publishers, all rights reserved
ECON 3010 Intermediate Macroeconomics Final Exam
 ECON 3010 Intermediate Macroeconomics Final Exam Multiple Choice Questions. (60 points; 2 pts each) #1. Which of the following is a stock variable? a) wealth b) consumption c) investment d) income #2.
Answers to Questions: Chapter 8
 Answers to Questions in Textbook 1 Answers to Questions: Chapter 8 1. In microeconomics, the demand curve shows the various quantities of a specific product that a consumer wants at various prices for
Intermediate Macroeconomic Theory II, Fall 2006 Solutions to Problem Set 4 (35 points)
") Intermediate Macroeconomic Theory II, Fall 2006 Solutions to Problem Set 4 (35 points) 1. (16 points) For all of the questions below, draw the relevant curves. (a) (2 points) Suppose that the government
Intermediate Macroeconomic Theory II, Fall 2006 Solutions to Problem Set 4 (35 points) 1. (16 points) For all of the questions below, draw the relevant curves. (a) (2 points) Suppose that the government
FETP/MPP8/Macroeconomics/Riedel. General Equilibrium in the Short Run II The IS-LM model
 FETP/MPP8/Macroeconomics/iedel General Equilibrium in the Short un II The -LM model The -LM Model Like the AA-DD model, the -LM model is a general equilibrium model, which derives the conditions for simultaneous
1. You are right. When a fall in the value of the dollar against other currencies makes U.S. final
 AP Krugman Section 4 Problem Solutions 1. You are right. When a fall in the value of the dollar against other currencies makes U.S. final goods and services cheaper to foreigners, this represents a shift
The Aggregate Demand/Aggregate Supply Model
 CHAPTER 27 The Aggregate Demand/Aggregate Supply Model The Theory of Economics... is a method rather than a doctrine, an apparatus of the mind, a technique of thinking which helps its possessor to draw