AGGREGATE DEMAND AGGREGATE SUPPLY
|
|
|
- Dominic Chandler
- 6 years ago
- Views:
Transcription
1 AGGREGATE DEMAND 8 AND CHAPTER AGGREGATE SUPPLY
2 A Way to View the Economy We can think of an economy as consisting of two major activities: buying and producing. When economists speak about aggregate demand, they are speaking about the buying side of the economy. When economists speak about aggregate supply, they are speaking about the producing side of the economy.

3 A Way to View the Economy
4 A Way to View the Economy The framework of analysis we use is called aggregate demand aggregate supply (AD AS). That framework of analysis has three parts: 1. Aggregate demand (AD) 2. Short-run aggregate supply (SRAS) 3. Long-run aggregate supply (LRAS)

5 Aggregate Demand Recall from the last chapter that households, firms, governments and the rest of the world buy domestic goods and services. Aggregate demand is the quantity demanded of these goods and services, or the quantity demanded of Real GDP, at various price levels, ceteris paribus. For example, the following whole set of data represents aggregate demand:
6 Aggregate Demand An aggregate demand (AD) curve is the graphical representation of aggregate demand. AD is downward sloping As the price level falls, the quantity demanded of Real GDP rises. As the price level rises, the quantity demanded of Real GDP falls
7 Aggregate Demand Why Does the Aggregate Demand Curve Slope Downward? This inverse relationship and the resulting downward slope of the AD curve are explained by: (1) The real balance effect (2) The interest rate effect (3) The international trade effect
8 Aggregate Demand Real Balance Effect When price level goes up, the real value of monetary wealth or the value of a person s monetary assets goes down. This means that purchasing power of monetary assets go down, that is, the quantity of goods and services that can be purchased with a unit of money decreases. As a result, ceteris paribus, people demand less. In summary, a rise in the price level causes purchasing power to fall, which decreases a person s monetary wealth. As people become less wealthy, the quantity demanded of Real GDP falls.
9 Aggregate Demand Interest Rate Effect The inverse relationship between the price level and the quantity demanded of Real GDP is established through changes in the part of household and business spending that is sensitive to changes in interest rates. As the price level rises, the purchasing power of the person s money decreases. With less purchasing power (per unit of money), she cannot purchase her fixed bundle of goods with the same amount of money.
10 Aggregate Demand Interest Rate Effect If she wants to continue to buy the goods, she needs to acquire more money. To do that, she goes to a bank and requests a loan. In terms of simple supply-and demand analysis, the demand for credit increases. Consequently, the interest rate rises. As the interest rate rises, households borrow less to finance, say, automobile purchases, and firms borrow less to finance new capital goods spending. Thus, the quantity demanded of Real GDP falls.
11 Aggregate Demand International Trade Effect The international trade effect takes place through changes in foreign sector spending due to changes in price level. As the price level in Bangladesh rises, Bangladeshi goods become relatively more expensive than foreign goods. As a result, both Bangladeshis and foreigners buy fewer Bangladeshi goods and more foreign goods, i.e. exports fall and imports rise implying a fall in net exports. The quantity demanded of Real GDP falls.
12 Aggregate Demand An Important Word on the Three Effects Keep in mind that what caused these three effects is a change in the price level. When discussing, say, the interest rate effect, we are talking about the interest rate effect of a change in the price level. Why is this point important? The interest rate can change due to things other than the price level changing. Other things that change the interest rate lead to a shift in the AD curve instead of a movement along the AD curve.
13 Aggregate Demand A Change in Quantity Demanded of Real GDP vs. a Change in Aggregate Demand A change in the price level brings about a change in the quantity demanded of Real GDP. As the price level falls, the quantity demanded of Real GDP rises, ceteris paribus. When the aggregate demand curve shifts, the quantity demanded of Real GDP changes even though the price level remains constant.

14 Aggregate Demand
15 Aggregate Demand Changes in Aggregate Demand: Shifts in the AD Curve What can change aggregate demand? What can cause aggregate demand to rise, and what can cause it to fall? The simple answer is, if: Spending increases at a given price level AD rises Spending decreases at a given price level AD falls


16 Aggregate Demand How Spending Components Affect Aggregate Demand At a given price level if:
17 Aggregate Demand Why Is There More Total Spending? True or false? The price level falls and total spending rises. As a result of total spending rising, aggregate demand in the economy rises, and the AD curve shifts rightward.
18 Aggregate Demand Why Is There More Total Spending? The answers is: FALSE Aggregate demand curve shifts to the right only if total spending rises at a given price level. Total spending can rise for one of two reasons. The first deals with a decline in prices and leads to a movement along a given AD curve. The second deals with a change in some factor other than prices and leads to a shift in the AD curve.
19 Aggregate Demand Factors That Can Change C, I, G, and NX and Therefore Can Shift the AD Curve Consumption: C Four factors can affect consumption: 1.Wealth 2.Expectations about future prices and income 3.Interest rate 4.Income taxes
20 Aggregate Demand Factors That Can Change C and Therefore Can Shift the AD Curve 1. Wealth Individuals consume not only on the basis of their present income but also on the basis of their wealth. Greater wealth makes individuals feel financially more secure and thus more willing to spend. Wealth C AD Wealth C AD
21 Aggregate Demand Factors That Can Change C and Therefore Can Shift the AD Curve 2. Expectations About Future Prices and Income Individuals expectations of future prices can increase or decrease aggregate demand: Expect higher future prices C AD Expect lower future prices C AD Similarly, expectations regarding income can affect aggregate demand: Expect higher future income C AD Expect lower future income C AD
22 Aggregate Demand Factors That Can Change C and Therefore Can Shift the AD Curve 3. Interest Rate Current empirical work shows that spending on consumer durables is sensitive to the interest rate. Buyers often pay for these items by borrowing; so an increase in the interest rate increases the monthly payment amounts linked to the purchase of durables and thereby reduces their consumption. The reduction in consumption leads to a decline in aggregate demand. Interest rate C AD Interest rate C AD
23 Aggregate Demand Factors That Can Change C and Therefore Can Shift the AD Curve 4. Income Taxes As income taxes rise, disposable income decreases. When people have less take-home pay to spend, consumption falls. Consequently, aggregate demand decreases. A decrease in income taxes has the opposite effect; it raises disposable income. When people have more take-home pay to spend, consumption rises and aggregate demand increases. Income taxes C AD Income taxes C AD
24 Aggregate Demand Factors That Can Change I and Therefore Can Shift the AD Curve Investments: I Three factors can change investment: 1. The interest rate 2. Expectations about future sales 3. Business taxes
25 Aggregate Demand Factors That Can Change I and Therefore Can Shift the AD Curve 1. Interest Rate As the interest rate rises, the cost of an investment project rises and businesses invest less. As investment decreases, aggregate demand decreases. As the interest rate falls, the cost of an investment project falls and businesses invest more. Consequently, aggregate demand increases. Interest rate I AD Interest rate I AD
26 Aggregate Demand Factors That Can Change I and Therefore Can Shift the AD Curve 2. Expectations About Future Sales If businesses become optimistic about future sales, investment spending grows and aggregate demand increases. If businesses become pessimistic about future sales, investment spending contracts and aggregate demand decreases. Businesses become optimistic about future sales I AD Businesses become pessimistic about future sales I AD
27 Aggregate Demand Factors That Can Change I and Therefore Can Shift the AD Curve 3. Business taxes An increase in business taxes lowers expected profitability. With less profit expected, businesses invest less. As investment spending declines, so does aggregate demand. A decrease in business taxes, on the other hand, raises expected profitability and investment spending. This increases aggregate demand. Business taxes I AD Business taxes I AD
28 Aggregate Demand Factors That Can Change G and Therefore Can Shift the AD Curve Government Expenditure: G Government expenditure usually rises due to expansionary Fiscal policy designed to reduce unemployment. Government expenditure usually falls due to contractionary Fiscal policy designed to reduce inflation. Expansionary Fiscal Policy G AD Contractionary Fiscal Policy G AD
29 Aggregate Demand Factors That Can Change NX and Therefore Can Shift the AD Curve Net Exports: NX Two factors can change net exports: 1. Foreign real national income 2. The exchange rate
30 Aggregate Demand Factors That Can Change NX and Therefore Can Shift the AD Curve 1. Foreign real national income As foreign real national income rises, foreigners buy more Bangladeshi goods and services. Thus, exports rise. As exports rise, net exports rise, ceteris paribus. As net exports rise, aggregate demand increases. This process works in reverse. As foreign real national income falls, foreigners buy fewer Bangladeshi goods and exports fall. This lowers net exports, reducing aggregate demand. Foreign real national income BD exports BD net exports AD Foreign real national income BD exports BD net exports AD
31 Aggregate Demand Factors That Can Change NX and Therefore Can Shift the AD Curve 2. Exchange Rate As the Taka depreciates, Bangladeshi goods become cheaper and foreign goods become more expensive. Bangladeshis cut back on imported goods, and foreigners increase their purchases of Bangladeshi exported goods. If exports rise and imports fall, net exports increase and aggregate demand increases. As Taka appreciates, Bangladeshi goods become more expensive and foreign goods become cheaper, Bangladeshis increase their purchases of imported goods, and foreigners cut back on their purchases of Bangladeshi exported goods. If exports fall and imports rise, net exports decrease, thus lowering aggregate demand. Taka depreciates BD exports and BD imports BD net exports AD Taka appreciates BD exports and BD imports BD net exports AD
32 Aggregate Demand Can a Change in the Money Supply Change Aggregate Demand? Most economists would say that it does, but they differ on how. One way to explain the effect is as follows: 1. A change in the money supply affects interest rates. 2.A change in interest rates changes consumption and investment. 3.A change in consumption and investment affects aggregate demand.
33 Aggregate Demand If One Component of Aggregate Spending Rises, Does Some Other Spending Component Have to Decline? Let s say that the money supply in the economy is Tk. 1 and that Tk. 1 is currently in the hands of Shakib. Shakib takes the Tk. 1 and buys good X from Tamim. Later, Tamim takes the Tk. 1 and buys good Y from Mushfique. Still later, Mushfique takes the Tk.1 and buys good Z from Mashrafe. We started with a money supply of just Tk. 1, and that 1 Taka changed hands three times. The average number of times a Taka changes hands (or is spent) to buy final goods and services is what economists call velocity. In our simple example, velocity is 3. The product of our money supply (Tk. 1) and velocity (3) is Tk. 3, which represents the total amount of spending in the economy.
34 Aggregate Demand From our example, two things are obvious: First, total spending in the economy can be a greater dollar amount than the money supply. Proof: In our example, the money supply was Tk. 1, but total spending equaled Tk. 3. Second, total spending depends on the money supply and velocity. Proof: Total spending in our example was the product of the money supply times velocity. Now, say out of this Tk. 3, Tk. 1 is spent on C, Tk. 1 is spent on I and Tk. 1 is spent on G. If, say, government expenditure rises to Tk. 2, must some other spending component decline? The answer is yes if neither the money supply nor velocity changes. But the answer is no if either the money supply or velocity rises.
35 Aggregate Demand So, to summarize: If both the money supply and velocity are constant, a rise in one spending component (such as government expenditure) necessitates a decline in one or more other spending components. If either the money supply or velocity rises, one spending component can rise without requiring other spending components to decline.
36 Short-Run Aggregate Supply Aggregate demand is one side of the economy; aggregate supply is the other. Aggregate supply is the quantity supplied of all goods Aggregate supply is the quantity supplied of all goods and services (Real GDP) at various price levels, ceteris paribus. Aggregate supply includes both short-run aggregate supply (SRAS) and long-run aggregate supply (LRAS).
37 Short-Run Aggregate Supply Short-Run Aggregate Supply Curve: What It Is A short-run aggregate supply (SRAS) curve shows the quantity supplied of all goods and services (Real GDP or output) at different price levels, ceteris paribus. the SRAS curve is upward sloping: As the price level rises, firms increase the quantity supplied of goods and services; as the price level drops, firms decrease the quantity supplied of goods and services.
38 Short-Run Aggregate Supply Short-Run Aggregate Supply Curve: Why It Is Upward Sloping Why is the SRAS curve upward sloping? Two Explanations: 1. Sticky wages 2. Worker misperceptions
39 Short-Run Aggregate Supply Short-Run Aggregate Supply Curve: Why It Is Upward Sloping 1. Sticky wages Some economists believe that wages are sticky, or inflexible. This may be because wages are locked in for a few years due to labor contracts that workers and management enter into. Both labor and management may see this as in their best interest. Management has some idea of what its labor costs will be during the time of the contract. Workers may have a sense of security knowing that their wages can t be lowered.
40 Short-Run Aggregate Supply
41 Short-Run Aggregate Supply Short-Run Aggregate Supply Curve: Why It Is Upward Sloping The quantity demanded of labor is inversely related to the real wage: As the real wage rises, the quantity demanded of labor falls As the real wage falls, the quantity demanded of labor rises. Firms will employ more workers because it is cheaper to hire them. Now, suppose that the price index falls. As a result, real wage rises. What will firms do? At higher real wages, firms will cut back on its labor. With fewer workers working, less output is produced.
42 Short-Run Aggregate Supply Short-Run Aggregate Supply Curve: Why It Is Upward Sloping So, if nominal wages are sticky, a decrease in the price level (which pushes real wages up) will result in a decrease in output. This is what an upward-sloping SRAS curve represents: As the price level falls, the quantity supplied of goods and services declines.
43 Short-Run Aggregate Supply Short-Run Aggregate Supply Curve: Why It Is Upward Sloping 2. Worker misperceptions Another explanation for the upward-sloping SRAS curve holds that workers may misperceive real wage changes. Suppose that the nominal wage is $30 an hour and price level is $1.50. So, real wage = $30 / $1.50 = $20 Now suppose the nominal wage falls to $25 and the price level falls to $1.25. The real wage is still $20 ($25 / $1.25 = $20) but workers may not know this. They know their nominal wage has fallen (i.e., they are earning $25 an hour instead of $30).They also may know that the price level is lower, but they may not know initially how much lower the price level is.
44 Short-Run Aggregate Supply Short-Run Aggregate Supply Curve: Why It Is Upward Sloping For example, suppose they mistakenly believe the price level has fallen from 1.50 to They will then think that their real wage has actually fallen from $20 ($30 / $1.50) to $17.98 ($25 / $1.39). In response to the misperceived falling real wage, workers reduce the quantity of labor they are willing to supply. With fewer workers (resources), firms produce less. So, if workers misperceive real wage changes, then a fall in the price level will bring about a decline in output, which is illustrative of an upward-sloping SRAS curve.
45 Short-Run Aggregate Supply Issues with these two labor market based explanations Take the first explanation. We have discussed the upward sloping SRAS curve when price falls. What about when price rises? Then, given sticky wages, real wage falls. So, the argument would be that because real wage falls, employers will hire more workers which will in turn lead to more production. However, what about the workers? Will they be willing to supply more labor at lower real wages? When real wage rises, it s reasonable to argue that employers will hire less workers. Because even if the workers want to supply more, it s really the employers prerogative to decide how many workers they are willing to hire. But when real wage falls, and workers do not want to supply more labor, it s hard to justify a scenario whereby employers are forcing workers to work.
46 Short-Run Aggregate Supply Issues with these two labor market based explanations Take the second explanation. We have discussed the upward sloping SRAS curve when workers underestimate the decline in price. But what if they overestimate the price decline? Then, they will think that real wage has actually gone up. Then they will be willing to supply more labor. More labor implies more production. In that case a fall in price would actually result in higher supply! Of course, assuming that employers agree to hire more workers. If they don t, then there will be no change in production. Either way, the direct/positive relationship between price and quantity supplied breaks down. Also, why only assume that the workers misperceive real wage changes? What happens if employers also have misperceptions?
47 Short-Run Aggregate Supply To avoid these problems, we can think about the upward sloping SRAS curve in the following way. Think about an individual firm: firm A. It s fair to assume that in the short run the money wage rate and the prices of nonlabor inputs remain unchanged. Now, if price of the good that firm A produces rises with no change in these costs, then firm A can increase profit by increasing production. Since any firm usually is in business to maximize its profit, firm A will increase production. Similarly, if price of the good produced by firm A falls while the money wage rate and the prices of nonlabor inputs remain unchanged, then firm A can reduce its losses (or profit reductions) by decreasing production.
48 Short-Run Aggregate Supply What s true for firm A is true for the producers of all goods and services. When all prices rise, the price level rises. If the price level rises and the money wage rate and other factor prices remain constant, all firms increase production and the quantity of real GDP supplied increases. A fall in the price level has the opposite effect and decreases the quantity of real GDP supplied.
49 Short-Run Aggregate Supply What Puts the Short Run in the SRAS Curve? According to most macroeconomists, the SRAS curve slopes upward because of the reasons explained in the previous slides (including sticky wages and worker misperceptions). No matter what the explanation, things are likely to change over time. Wages will not be sticky forever (labor contracts will expire), and workers will figure out that they misperceived real wage changes. Factor costs will also not remain constant. Only for a period of time identified as the short run are these issues likely to be relevant.
50 Short-Run Aggregate Supply Changes in Short-Run Aggregate Supply: Shifts in the SRAS Curve The factors that can shift the SRAS curve are: 1. Wage rates 2. Prices of nonlabor inputs 3. Productivity 4. Supply shocks 5. Expected price level
51 Short-Run Aggregate Supply Changes in Short-Run Aggregate Supply: Shifts in the SRAS Curve 1. Wage rates Changes in wage rates have a major impact on the position of the SRAS curve because wage costs are usually a firm s major cost item. The impact of a rise or fall in equilibrium wage rates can be understood in terms of the following equation: Profit per unit = Price per unit - Cost per unit
 that firms will want to produce.")
52 Short-Run Aggregate Supply Changes in Short-Run Aggregate Supply: Shifts in the SRAS Curve Higher wage rates mean higher costs and, at constant prices, translate into lower profits and a reduction in the number of units (of a given good) that firms will want to produce. Lower wage rates mean lower costs and, at constant prices, translate into higher profits and an increase in the number of units (of a given good) firms will decide to produce.
53 Short-Run Aggregate Supply Changes in Short-Run Aggregate Supply: Shifts in the SRAS Curve 2. Prices of nonlabor inputs There are other inputs to the production process besides labor. Changes in the prices of nonlabor inputs affect the SRAS curve in the same way as changes in wage rates do. An increase in the price of a nonlabor input (e.g., oil) shifts the SRAS curve leftward; a decrease in their price shifts the SRAS curve rightward.
54 Short-Run Aggregate Supply Changes in Short-Run Aggregate Supply: Shifts in the SRAS Curve 3. Productivity Productivity is the output produced per unit of input employed over some period of time. Let s consider the labor input. An increase in labor productivity means businesses will produce more output with the same amount of labor, causing the SRAS curve to shift rightward. A decrease in labor productivity means businesses will produce less output with the same amount of labor, causing the SRAS curve to shift leftward.
55 Short-Run Aggregate Supply Changes in Short-Run Aggregate Supply: Shifts in the SRAS Curve Many factors lead to increased labor productivity. Some examples: A more educated labor force A larger stock of capital goods Technological advancements
56 Short-Run Aggregate Supply Changes in Short-Run Aggregate Supply: Shifts in the SRAS Curve 4. Supply shocks Major natural or institutional changes that affect aggregate supply are referred to as supply shocks. Supply shocks are of two varieties. Adverse supply shocks shift the SRAS curve leftward. A long drought can have severe impact on the production of paddy in Bangladesh. A major cutback in the supply of oil coming to the United States from the Middle East.
57 Short-Run Aggregate Supply Changes in Short-Run Aggregate Supply: Shifts in the SRAS Curve Beneficial supply shocks shift the SRAS curve rightward. A major oil discovery or unusually good weather leading to increased production of a food staple These supply shocks can be reflected in resource or input prices.
58 Short-Run Aggregate Supply Changes in Short-Run Aggregate Supply: Shifts in the SRAS Curve 5. Expected price level A change in expected price level can lead to a shift in the SRAS curve. Suppose individuals expect the price level to decline. Thus they expect their real wages to rise and will work more. Working more produces more output; so the SRAS curve shifts rightward. Suppose individuals expect the price level to rise. Thus they expect their real wage to decline and will work less. Working less produces less output; so the SRAS curve shifts leftward.
59 Short-Run Aggregate Supply Changes in Short-Run Aggregate Supply: Shifts in the SRAS Curve
60 Putting AD and SRAS Together: Short- Run Equilibrium
61 Putting AD and SRAS Together: Short- Run Equilibrium Changes in Short-Run Equilibrium in the Economy
62 Putting AD and SRAS Together: Short- Run Equilibrium In Dollars and in Oil In November 2007 the barrel price of oil was rising. On November 1, 2007, it had risen to $96 a barrel. In the same month the value of the dollar was falling in foreign exchange markets. In fact, the value of the dollar had been falling for some time. Although the value of $1 was 0.83 in January 2006, it had fallen to 0.69 by November 1, How would Real GDP and Price change?
63 Putting AD and SRAS Together: Short- Run Equilibrium In Dollars and in Oil We know that the falling value of the dollar would lead to greater U.S. exports, and this is exactly what was happening at the time. As a result, U.S. net exports were rising, pushing the AD curve in the economy to the right. But because oil prices were rising, the SRAS curve in the economy was shifting to the left. How would these two changes affect Real GDP?
64 Putting AD and SRAS Together: Short- Run Equilibrium In Dollars and in Oil The answer depends on the relative shifts of the AD and SRAS curves. There are the three possibilities: 1. If the AD curve shifted rightward more than the SRAS curve shifted leftward, then Real GDP will rise. 2. If the AD curve shifted rightward by less than the SRAS curve shifted leftward, then Real GDP would fall. 3. If the AD curve shifted rightward by the same amount as the SRAS curve shifted leftward, then Real GDP would remain unchanged. In all three cases, though, the price level would increase. Rising aggregate demand, combined with falling short-run aggregate supply, always results in a rising price level.

65 An Important Exhibit Expected Price Level 1. Expansionary Fiscal Policy 2. Contractionary Fiscal Policy
66 Long-Run Aggregate Supply
67 Long-Run Aggregate Supply

68 Long-Run Aggregate Supply

69 Long-Run Aggregate Supply
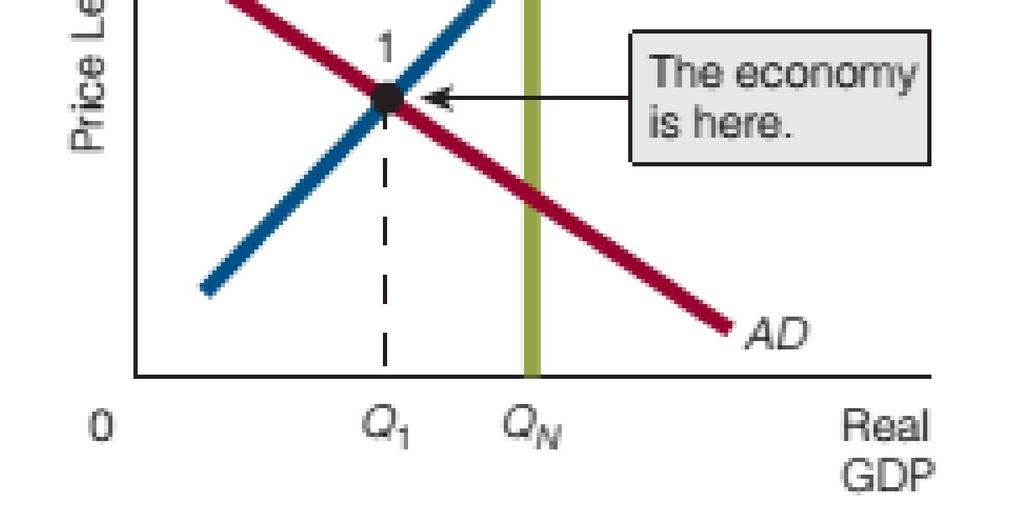
70 Long-Run Aggregate Supply Short-Run Equilibrium, Long-Run Equilibrium, and Disequilibrium In both short-run and long-run equilibrium, the quantity supplied of Real GDP equals the quantity demanded. So what is the difference between short-run equilibrium and long-run equilibrium? In long-run equilibrium, the quantities supplied and demanded of Real GDP equal Natural Real GDP. But in short-run equilibrium, the quantities supplied and demanded of Real GDP are either more or less than Natural Real GDP.
71 Long-Run Aggregate Supply
72 Long-Run Aggregate Supply Short-Run Equilibrium, Long-Run Equilibrium, and Disequilibrium When the economy is in neither short-run nor long-run equilibrium, it is said to be in disequilibrium. Essentially, disequilibrium is the state of the economy as it moves from one short-run equilibrium to another or from short-run equilibrium to long-run equilibrium. In disequilibrium, the quantity supplied and the quantity demanded of Real GDP are not equal.
73 Practice Question Do in Class: Question: Suppose wealth rises and at the same time, the price of nonlabor inputs rises. What is the effect of these changes on the price level and Real GDP? Answer: See page 219 of the textbook under the title Reality Can Be Messy, and Correct Predictions Can Be Difficult to Make
Aggregate Supply and Aggregate Demand
 Aggregate Supply and Aggregate Demand ECO 301: Money and Banking 1 1.1 Goals Goals Specific Goals Be able to explain GDP fluctuations when the price level is also flexible. Explain how real GDP and the
Lecture 12: Economic Fluctuations. Rob Godby University of Wyoming
 Lecture 12: Economic Fluctuations Rob Godby University of Wyoming Short-Run Economic Fluctuations Economic activity fluctuates from year to year. In some years, the production of goods and services rises.
Long Run vs. Short Run
 Long Run vs. Short Run Long Run: A period long enough for nominal wages and other input prices to change in response to a change in the nation s price level. The Basic Model of Economic Fluctuations Two
6. The Aggregate Demand and Supply Model
 6. The Aggregate Demand and Supply Model 1 Aggregate Demand and Supply Curves The Aggregate Demand Curve It shows the relationship between the inflation rate and the level of aggregate output when the
Aggregate Demand and Aggregate Supply
 Aggregate Demand and Aggregate Supply Aggregate Demand and Aggregate Supply The Learning Objectives in this presentation are covered in Chapter 20: Aggregate Demand and Aggregate Supply LEARNING OBJECTIVES
Money and the Economy CHAPTER
 Money and the Economy 14 CHAPTER Money and the Price Level Classical economists believed that changes in the money supply affect the price level in the economy. Their position was based on the equation
Sticky Wages and Prices: Aggregate Expenditure and the Multiplier. 5Topic
 Sticky Wages and Prices: Aggregate Expenditure and the Multiplier 5Topic Questioning the Classical Position and the Self-Regulating Economy John Maynard Keynes, an English economist, changed how many economists
Chapter 13. Aggregate Demand and Aggregate Supply
 Chapter 13 Aggregate Demand and Aggregate Supply 1 Output and Price Level Figure 1 Two-Way Relationship Between Output and Price Level Aggregate Demand Curve Price Level Real GDP Aggregate Supply Curve
Economics 102 Discussion Handout Week 14 Spring Aggregate Supply and Demand: Summary
 Economics 102 Discussion Handout Week 14 Spring 2018 Aggregate Supply and Demand: Summary The Aggregate Demand Curve The aggregate demand curve (AD) shows the relationship between the aggregate price level
Econ 102 Discussion Section 8 (Chapter 12, 13) March 20, 2015
 March 20, 2015") Econ 102 Discussion Section 8 (Chapter 12, 13) March 20, 2015 The Multiplier and Shifting the Aggregate Expenditures Function The multiplier effect describes how changes in autonomous expenditures lead
Econ 102 Discussion Section 8 (Chapter 12, 13) March 20, 2015 The Multiplier and Shifting the Aggregate Expenditures Function The multiplier effect describes how changes in autonomous expenditures lead
download instant at
 Exam Name MULTIPLE CHOICE. Choose the one alternative that best completes the statement or answers the question. 1) The aggregate supply curve 1) A) shows what each producer is willing and able to produce
Economics 102 Discussion Handout Week 14 Spring Aggregate Supply and Demand: Summary
 Economics 102 Discussion Handout Week 14 Spring 2018 Aggregate Supply and Demand: Summary The Aggregate Demand Curve The aggregate demand curve (AD) shows the relationship between the aggregate price level
Archimedean Upper Conservatory Economics, October 2016
 Multiple Choice Identify the choice that best completes the statement or answers the question. 1. The marginal propensity to consume is equal to: A. the proportion of consumer spending as a function of
Problem Set #5 Due in hard copy at beginning of lecture on Monday, April 8, 2013
 Name: Solutions Department of Economics Professor Dowell California State University, Sacramento Spring 2013 Problem Set #5 Due in hard copy at beginning of lecture on Monday, April 8, 2013 Important:
Introduction to Economic Fluctuations
 Chapter 9 Introduction to Economic Fluctuations slide 0 In this chapter, you will learn facts about the business cycle how the short run differs from the long run an introduction to aggregate demand an
Disposable income (in billions)
") Section 4 version 2 Multiple Choice Identify the choice that best completes the statement or answers the question. 1. An increase in the MPC: A. increases the multiplier. B. shifts the autonomous investment
Section 4 version 2 Multiple Choice Identify the choice that best completes the statement or answers the question. 1. An increase in the MPC: A. increases the multiplier. B. shifts the autonomous investment
AP Macroeconomics. Scoring Guidelines
 2018 AP Macroeconomics Scoring Guidelines College Board, Advanced Placement Program, AP, AP Central, and the acorn logo are registered trademarks of the College Board. AP Central is the official online
7. Refer to the above graph. It depicts an economy in the: A. Immediate short run B. Short run C. Immediate long run D. Long run
 CHAPTER 29 1. When the price level decreases: A. The demand for money falls and the interest rate falls B. Holders of financial assets with fixed money values decrease their spending C. Holders of financial
AP Econ Practice Test Unit 5
 DO NOT WRITE ON THIS TEST! AP Econ Practice Test Unit 5 Multiple Choice Identify the choice that best completes the statement or answers the question. 1. The marginal propensity to consume is equal to:
Aggregate Supply and Demand
 Aggregate demand is the relationship between GDP and the price level. When only the price level changes, GDP changes and we move along the Aggregate Demand curve. The total amount of goods and services,
Aggregate Demand & Aggregate Supply
 Aggregate Demand & Aggregate Supply 1 Aggregate Demand AD = C + I + G + NX The sum of planned consumption, investment, government, and net exports expenditures on final goods and services 2 Aggregate Demand
Expectations Theory and the Economy CHAPTER
 Expectations and the Economy 16 CHAPTER Phillips Curve Analysis The Phillips curve is used to analyze the relationship between inflation and unemployment. We begin the discussion of the Phillips curve
Chapter 9 Introduction to Economic Fluctuations
 Chapter 9 Introduction to Economic Fluctuations facts about the business cycle how the short run differs from the long run an introduction to aggregate demand an introduction to aggregate supply in the
ECO 2013: Macroeconomics Valencia Community College
 ECO 2013: Macroeconomics Valencia Community College Exam 3 Fall 2008 1. The most important determinant of consumer spending is: A. the level of household debt. B. consumer expectations. C. the stock of
Questions and Answers
 Questions and Answers Chapter 1 Q1: MCQ Aggregate demand 1. The aggregate demand curve: A) is up-sloping because a higher price level is necessary to make production profitable as production costs rise.
PART XII: SHORT-RUN ECONOMIC FLUCTUATIONS AGGREGATE DEMAND AND AGGREGATE SUPPLY. Chapter 33
 1 PART XII: SHORT-RUN ECONOMIC FLUCTUATIONS AGGREGATE DEMAND AND AGGREGATE SUPPLY Chapter 33 What did we learn so far? Macroeconomics studies the economy as a whole It aims to explain economic events that
Professor Christina Romer SUGGESTED ANSWERS TO PROBLEM SET 5
 Economics 2 Spring 2016 Professor Christina Romer Professor David Romer SUGGESTED ANSWERS TO PROBLEM SET 5 1. The left-hand diagram below shows the situation when there is a negotiated real wage,, that
Aggregate Supply and Demand Model
 THE AGGREGATE MODEL Aggregate Supply and Demand Model The AS-AD model helps us understand aggregate output (RGDP), employment, prices and the business cycle. Aggregate Demand shows the quantity of goods
Chapter 13. Aggregate Demand and Aggregate Supply. Output and Price Level. Deriving the Aggregate Demand Curve. The Aggregate Demand Curve
 Output and Figure 1 Two-Way Relationship Between Output and Aggregate Demand Curve Chapter 13 Aggregate Demand and Aggregate Supply Price Level Aggregate Supply Curve Real GDP 1 2 The Aggregate Demand
ECON 209 FINAL EXAM COURSE PACK FALL 2017
 ECON 209 FINAL EXAM COURSE PACK FALL 2017 www.sleepingpolarbear.ca HANDCRAFTED WITH IN THE NORTH POLE ~ TABLE OF CONTENTS ~ ECON 209: FINAL EXAM COURSE PACK SECTION 1 (CH 19-20): INTRO TO MACRO & GDP ACCOUNTING...
Principles of Macroeconomics Prof. Yamin Ahmad ECON 202 Spring 2007
 Principles of Macroeconomics Prof. Yamin Ahmad ECON 202 Spring 2007 Midterm Exam II Name Id # Instructions: There are two parts to this midterm. Part A consists of multiple choice questions. Please mark
MULTIPLE CHOICE. Choose the one alternative that best completes the statement or answers the question.
 Econ 330 Spring 2017: FINAL EXAM Name ID Section Number MULTIPLE CHOICE. Choose the one alternative that best completes the statement or answers the question. 1) Tobin's q theory suggests that monetary
Objectives AGGREGATE DEMAND AND AGGREGATE SUPPLY
 AGGREGATE DEMAND 7 AND CHAPTER AGGREGATE SUPPLY Objectives After studying this chapter, you will able to Explain what determines aggregate supply Explain what determines aggregate demand Explain macroeconomic
Principle of Macroeconomics, Summer B Practice Exam
 Principle of Macroeconomics, Summer B 2017 Practice Exam 1) If real GDP in a small country in 2015 is $8 billion and real GDP in the same country in 2016 is $8.3 billion, the growth rate of real GDP between
II. Determinants of Asset Demand. Figure 1
 University of California, Merced EC 121-Money and Banking Chapter 5 Lecture otes Professor Jason Lee I. Introduction Figure 1 shows the interest rates for 3 month treasury bills. As evidenced by the figure,
Dokuz Eylül University Faculty of Business Department of Economics
 Dokuz Eylül University Faculty of Business Department of Economics ECN 1002 PROBLEM SET III Q1) A link between the money market and the goods and services market exists through the impact of A) tax revenue
Short-run and Long-run equilibria in the AD-AS model: Flexible Wages and Prices. 4Topic
 Short-run and Long-run equilibria in the AD-AS model: Flexible Wages and Prices 4Topic The Classical View The term classical economics is often used to refer to an era in the history of economic thought
An Introduction to Basic Macroeconomic Markets
 An Introduction to Basic Macroeconomic Markets Full Length Text Part: Macro Only Text Part: 3 Chapter: 9 3 Chapter: 9 To Accompany Economics: Private and Public Choice 13th ed. James Gwartney, Richard
Aggregate Demand and Aggregate Supply
 C H A P T E R 33 Aggregate Demand and Aggregate Supply Economics P R I N C I P L E S O F N. Gregory Mankiw Premium PowerPoint Slides by Ron Cronovich 2009 South-Western, a part of Cengage Learning, all
Chapter 12 Appendix B
 The Effects of Macroeconomic Shocks on Asset Prices Chapter Appendix B By explicitly including the MP and IS curves in the aggregate demand and supply analysis, we can analyze the response of asset prices,
Helpful Hint Fiscal Policy and the AS-AD Model
 Helpful Hint Fiscal Policy and the AS-AD Model In this Helpful Hint, we analyze the effects of a change in fiscal policy using the AS-AD model. In doing so, it is useful to consider a specific example.
Questions and Answers
 Questions and Answers Ch 1 (continued) Q1: MCQ Aggregate Demand 1) The aggregate demand curve shows A) total expenditures at different levels of national income. B) the quantity of real GDP demanded at
Aggregate Supply and Demand Model
 THE AGGREGATE MODEL Aggregate Supply and Demand Model The AS-AD model helps us understand aggregate output (RGDP), employment, prices and the business cycle. Aggregate Demand shows the quantity of goods
Lesson 11 Aggregate demand and Aggregate Supply
 Lesson 11 Aggregate demand and Aggregate Supply Henan University of Technology Sino-British College Transfer Abroad Undergraduate Programme 0 In this lesson, look for the answers to these questions: What
MACROECONOMICS. Section I Time 70 minutes 60 Questions
 MACROECONOMICS Section I Time 70 minutes 60 Questions Directions: Each of the questions or incomplete statements below is followed by five suggested answers or completions. Select the one that is best
10. Oferta y demanda agregada
 10. Oferta y demanda agregada In this chapter, look for the answers to these questions: What are economic fluctuations? What are their characteristics? How does the model of aggregate demand and aggregate
Aggregate Demand and Aggregate Supply
 Aggregate Demand and Aggregate Supply SLIDES PREPARED BY JUDITH SKUCE, GEORGIAN COLLEGE 1 In this chapter you will learn 8.1 What determines the shape of the aggregate demand curve and what factors shift
Aggregate Demand and Aggregate Supply
 Aggregate Demand and Aggregate Supply Chapter 19 Copyright 2001 by Harcourt, Inc. All rights reserved. Requests for permission to make copies of any part of the work should be mailed to: Permissions Department,
Suggested Answers Problem Set # 5 Economics 501 Daniel
 1. Use graphs of IS-LM-FE and AS-AD models to explain why RBC models with productivity shocks and money-supply shocks fail to explain the pro-cyclicality of money growth and inflation. Inflation falls
Lecture 22. Aggregate demand and aggregate supply
 Lecture 22 Aggregate demand and aggregate supply By the end of this lecture, you should understand: three key facts about short-run economic fluctuations how the economy in the short run differs from the
Introduction. Over the long run, real GDP grows about 3% per year on average.
 Introduction Over the long run, real GDP grows about 3% per year on average. In the short run, GDP fluctuates around its trend. Recessions: periods of falling real incomes and rising unemployment Depressions:
Chapter 10 3/19/2018. AGGREGATE SUPPLY AND AGGREGATE DEMAND (Part 1) Objectives. Aggregate Supply
 Objectives. Aggregate Supply") Chapter 10 AGGREGATE SUPPLY AND AGGREGATE DEMAND (Part 1) Objectives Explain what determines aggregate supply in the long run and in the short run Explain what determines aggregate demand Explain how real
Chapter 10 AGGREGATE SUPPLY AND AGGREGATE DEMAND (Part 1) Objectives Explain what determines aggregate supply in the long run and in the short run Explain what determines aggregate demand Explain how real
MULTIPLE CHOICE. Choose the one alternative that best completes the statement or answers the question.
 Econ 330 Spring 2015: FINAL EXAM Name ID Section Number MULTIPLE CHOICE. Choose the one alternative that best completes the statement or answers the question. 1) Suppose a report was released today that
Mankiw Chapter 10. Introduction to Economic Fluctuations. Introduction to Economic Fluctuations CHAPTER 10
 Mankiw Chapter 10 0 IN THIS CHAPTER, WE WILL COVER: facts about the business cycle how the short run differs from the long run an introduction to aggregate demand an introduction to aggregate supply in
5. An increase in government spending is represented as a:
 Romer Section 1 1. The IS curve represents combinations of Y and r that: a. are consistent with equilibrium in the money market. b. are consistent with equilibrium in the goods market. c. are positively
Practice Test 1: Multiple Choice
 Practice Test 1: Multiple Choice 1. If aggregate planned expenditure exceeds real GDP A. actual inventories decrease below their target. B. firms are not maximizing their profits. C. planned consumption
Government Budget and Fiscal Policy CHAPTER
 Government Budget and Fiscal Policy 11 CHAPTER The National Budget The national budget is the annual statement of the government s expenditures and tax revenues. Fiscal policy is the use of the national
ECON 212: ELEMENTS OF ECONOMICS II Univ. Of Ghana, Legon Lecture 8: Aggregate Demand Aggregate Supply Dr. Priscilla T. Baffour
 ECON 212: ELEMENTS OF ECONOMICS II Univ. Of Ghana, Legon Lecture 8: Aggregate Demand Aggregate Supply Dr. Priscilla T. Baffour Sections 1. Relaxing a Temporal Assumption Price Level is no longer fixed.
Real GDP Growth in the United States Introduction to Economic Fluctuations slide 2.
 Real GD Growth in the United States 10 ercent change from 4 quarters 8 earlier Average growth rate = 3.5% 6 4 2 0-2 -4 1960 1965 1970 1975 1980 1985 1990 1995 2000 Introduction to Economic Fluctuations
AQA Economics AS-level
 AQA Economics AS-level Macroeconomics Topic 2: How the Macroeconomy Works 2.2 Aggregate demand and aggregate supply analysis Notes Aggregate demand is the total demand in the economy. It measures spending
Review. Question 1. Answer 1. Question 2. Answer 2. Question 3. Exam Review (Questions Beyond Test 1) True or False? True or False?
 True or False? True or False?") Question 1 Review Exam Review (Questions Beyond Test 1) An increase in income causes the IS curve to shift to the right. Answer 1 When income changes we move along the IS curve. Income itself is not an
Question 1 Review Exam Review (Questions Beyond Test 1) An increase in income causes the IS curve to shift to the right. Answer 1 When income changes we move along the IS curve. Income itself is not an
Test Yourself: Monetary Policy
 Test Yourself: Monetary Policy The improvement of understanding is for two ends: first, our own increase of knowledge; second, to enable us to deliver that knowledge to others. John Locke What is the transaction
Fiscal and Monetary Policy in the Growth Model. Introduction
 Introduction Fiscal and Monetary Policy in the Growth Model A. Our focus will be on fiscal and monetary policies over a longtime horizon. (ex. 10 years) B. Ex. The federal budget deficit was much higher
Unit 3 Exam Review. Formulas to Know: Output gap = YA YP/YP (x 100) MPC = Consumption/ Yd. MPS = Savings/ Yd
 MPC = Consumption/ Yd. MPS = Savings/ Yd") Unit 3 Exam Review Income and Expenditure 1. Explain relationship between MPC and the multiplier. Direct relationship, the higher the MPC, the greater the multiplier. 2. Understand the concept of autonomous
Unit 3 Exam Review Income and Expenditure 1. Explain relationship between MPC and the multiplier. Direct relationship, the higher the MPC, the greater the multiplier. 2. Understand the concept of autonomous
7 AGGREGATE SUPPLY AND AGGREGATE DEMAND* Chapter. Key Concepts
 Chapter 7 AGGREGATE SUPPLY AND AGGREGATE DEMAND* Key Concepts Aggregate Supply The aggregate production function shows that the quantity of real GDP (Y ) supplied depends on the quantity of labor (L ),
Lecturer: Dr. Priscilla Twumasi Baffour, Department of Economics Contact Information:
 MACROECONOMIC EQUILIBRIUM AND MONETARY POLICY Lecturer: Dr. Priscilla Twumasi Baffour, Department of Economics Contact Information: ptbaffour@ug.edu.gh College of Education School of Continuing and Distance
Introduction. Learning Objectives. Chapter 11. Classical and Keynesian Macro Analyses
 Chapter 11 Classical and Keynesian Macro Analyses Introduction The same basic pattern has repeated four times in recent U.S. history: 1973-1974, 1979-1980, 1990, and 2001. First, world oil prices jump.
Aggregate Demand and Aggregate Supply
 chapter: Krugman/Wells 28 Aggregate Demand and Aggregate Supply The following materials are taken from Chap. 28, Economics, 2 nd ed., Krugman and Wells(2009), Worth Palgrave MaCmillan. 1 of 58 WHAT YOU
Econ 102 Exam 2 Name ID Section Number
 Econ 102 Exam 2 Name ID Section Number 1. In a closed economy government spending was $30 billion, consumption was $70 billion, taxes were $20 billion, and GDP was $110 billion this year. Investment spending
AGGREGATE DEMAND, AGGREGATE SUPPLY, AND INFLATION. Chapter 25
 1 AGGREGATE DEMAND, AGGREGATE SUPPLY, AND INFLATION Chapter 25 2 One of the most important issues in macroeconomics is the determination of the overall price level Up to now, we took the price level as
Aggregate to add up, aggregation usually implies that the things being added up are similar, but not exactly identical
 Macro Short-Run AS/AD Model Essentials Up to this point, our discussions of unemployment, inflation, output, and income have revolved around how we measure these indicators of economic performance. Now
Introduction to Economic Fluctuations. Instructor: Dmytro Hryshko
 Introduction to Economic Fluctuations Instructor: Dmytro Hryshko 1 / 32 Outline facts about the business cycle how the short run differs from the long run an introduction to aggregate demand an introduction
Suggested Solutions to Assignment 3
 ECON 1010C Principles of Macroeconomics Instructor: Sharif F. Khan Department of Economics Atkinson College York University Summer 2005 Suggested Solutions to Assignment 3 Part A Multiple-Choice Questions
Chapter 9. Introduction to Economic Fluctuations
 Chapter 9 Introduction to Economic Fluctuations 0 1 Learning Objectives difference between short run & long run introduction to aggregate demand aggregate supply in the short run & long run see how model
Expansions (periods of. positive economic growth)
") Practice Problems IV EC 102.03 Questions 1. Comparing GDP growth with its trend, what do the deviations from the trend reflect? How is recession informally defined? Periods of positive growth in GDP (above
Practice Problems IV EC 102.03 Questions 1. Comparing GDP growth with its trend, what do the deviations from the trend reflect? How is recession informally defined? Periods of positive growth in GDP (above
1. You are right. When a fall in the value of the dollar against other currencies makes U.S. final
 AP Krugman Section 4 Problem Solutions 1. You are right. When a fall in the value of the dollar against other currencies makes U.S. final goods and services cheaper to foreigners, this represents a shift
Professor Christina Romer SUGGESTED ANSWERS TO PROBLEM SET 5
 Economics 2 Spring 2017 Professor Christina Romer Professor David Romer SUGGESTED ANSWERS TO PROBLEM SET 5 1. The tool we use to analyze the determination of the normal real interest rate and normal investment
Macroeonomics. 20 this chapter, Aggregate Demand and Aggregate Supply. look for the answers to these questions: Introduction. N.
 C H A T E R In 20 this chapter, look for the answers to these questions: Aggregate Demand and Aggregate Supply R I N C I L E S O F Macroeonomics N. Gregory Mankiw remium oweroint Slides by Ron Cronovich
A BOND MARKET IS-LM SYNTHESIS OF INTEREST RATE DETERMINATION
 A BOND MARKET IS-LM SYNTHESIS OF INTEREST RATE DETERMINATION By Greg Eubanks e-mail: dismalscience32@hotmail.com ABSTRACT: This article fills the gaps left by leading introductory macroeconomic textbooks
Practice Problems 30-32
 Practice Problems 30-32 1. The budget balance is calculated as: A. T G TR B. T + G TR C. T G + TR D. T + G + TR E. TR T G 2. The government budget balance equals: A. Taxes + Government purchases + Government
The Short-Run Tradeoff Between Inflation and Unemployment
 Chapter 33 The Short-Run Tradeoff Between Inflation and Unemployment Test B 1. The short-run effects of an increase in government expenditures are shown in the graph as a. a movement from A to B and 1
Notes 6: Examples in Action - The 1990 Recession, the 1974 Recession and the Expansion of the Late 1990s
 Notes 6: Examples in Action - The 1990 Recession, the 1974 Recession and the Expansion of the Late 1990s Example 1: The 1990 Recession As we saw in class consumer confidence is a good predictor of household
Introduction to Economic Fluctuations
 CHAPTER 10 Introduction to Economic Fluctuations Modified for ECON 2204 by Bob Murphy 2016 Worth Publishers, all rights reserved IN THIS CHAPTER, OU WILL LEARN: facts about the business cycle how the short
14.02 Quiz #2 SOLUTION. Spring Time Allowed: 90 minutes
 *Note that we decide to not grade #10 multiple choice, so your total score will be out of 97. We thought about the option of giving everyone a correct mark for that solution, but all that would have done
Problem Set #2. Intermediate Macroeconomics 101 Due 20/8/12
 Problem Set #2 Intermediate Macroeconomics 101 Due 20/8/12 Question 1. (Ch3. Q9) The paradox of saving revisited You should be able to complete this question without doing any algebra, although you may
Review: Markets of Goods and Money
 TOPIC 6 Putting the Economy Together Demand (IS-LM) 2 Review: Markets of Goods and Money 1) MARKET I : GOODS MARKET goods demand = C + I + G (+NX) = Y = goods supply (set by maximizing firms) as the interest
chapter: Aggregate Demand and Aggregate Supply Aggregate Demand The Aggregate Demand Curve The Aggregate Demand Curve
 >> chapter: 1 Demand and Supply Krugman/Wells WHAT YOU WILL LEARN IN THIS CHAPTER " How the demand curve illustrates the relationship between the and the quantity of output demanded in the economy " How
Macroeconomics 1 Lecture 11: ASAD model
 Macroeconomics 1 Lecture 11: ASAD model Dr Gabriela Grotkowska Lecture objectives difference between short run & long run aggregate demand aggregate supply in the short run & long run see how model of
Chapter 9 Chapter 10
 Assignment 4 Last Name First Name Chapter 9 Chapter 10 1 a b c d 1 a b c d 2 a b c d 2 a b c d 3 a b c d 3 a b c d 4 a b c d 4 a b c d 5 a b c d 5 a b c d 6 a b c d 6 a b c d 7 a b c d 7 a b c d 8 a b
Archimedean Upper Conservatory Economics, October 2016
 Multiple Choice Identify the choice that best completes the statement or answers the question. Figure 6-2: DVD Market 1. Use the DVD Market Figure 6-2. The figure shows the weekend rental market for DVDs
Title: Principle of Economics Saving and investment
 Title: Principle of Economics Saving and investment Instructor: Vladimir Hlasny Institution: 이화여자대학교 Dictated: 김나정, 김민겸, 김성도, 문혜린, 박현서 [0:00] Let s recall from chapter 23 that the country s gross domestic
11 EXPENDITURE MULTIPLIERS* Chapt er. Key Concepts. Fixed Prices and Expenditure Plans1
 Chapt er EXPENDITURE MULTIPLIERS* Key Concepts Fixed Prices and Expenditure Plans In the very short run, firms do not change their prices and they sell the amount that is demanded. As a result: The price
This paper is not to be removed from the Examination Halls UNIVERSITY OF LONDON
 ~~EC2065 ZB d0 This paper is not to be removed from the Examination Halls UNIVERSITY OF LONDON EC2065 ZB BSc degrees and Diplomas for Graduates in Economics, Management, Finance and the Social Sciences,
ECON 10020/20020 Principles of Macroeconomics Problem Set 5
 ECON 10020/20020 Principles of Macroeconomics Problem Set 5 Dennis C. Plott University of Notre Dame Department of Economics March 25, 2015 Email: dennis.plott@gmail.com 1 Name: 1. Due: Thursday 2 nd April
Karl Marx and Market Failure
 Unit 3 Karl Marx and Market Failure Krugman Module 74 pp. 723-726; Module 76 pp. 743-750; Module 77 pp.754-756; Module 78 pp. 761-770; Module 79 pp. 782-785 Modules 17-19 pp. 172 198 1 Greed is Good. -The
Boğaziçi University, Department of Economics Spring 2016 EC 102 PRINCIPLES of MACROECONOMICS FINAL , Saturday 10:00 TYPE A
 NAME: NO: SECTION: Boğaziçi University, Department of Economics Spring 2016 EC 102 PRINCIPLES of MACROECONOMICS FINAL 21.05.2016, Saturday 10:00 TYPE A Turn off your cell phone and put it away. During
MULTIPLE CHOICE. Choose the one alternative that best completes the statement or answers the question.
 Final Exam Practice Name MULTIPLE CHOICE. Choose the one alternative that best completes the statement or answers the question. 1) In an economy with no government or foreign sector, it is always true
1 Figure 1 (A) shows what the IS LM model looks like for the case in which the Fed holds the
 shows what the IS LM model looks like for the case in which the Fed holds the") 1 Figure 1 (A) shows what the IS LM model looks like for the case in which the Fed holds the money supply constant. Figure 1 (B) shows what the model looks like if the Fed adjusts the money supply to hold
1 Figure 1 (A) shows what the IS LM model looks like for the case in which the Fed holds the money supply constant. Figure 1 (B) shows what the model looks like if the Fed adjusts the money supply to hold
Chapter 23. Aggregate Supply and Aggregate Demand in the Short Run. In this chapter you will learn to. The Demand Side of the Economy
 Chapter 23 Aggregate Supply and Aggregate Demand in the Short Run In this chapter you will learn to 1. Explain why an exogenous change in the price level shifts the AE curve and changes the equilibrium
Econ 102/Lecture 100 Final Exam Form 1 April 27, Answers
 Econ 102/Lecture 100 Final Exam Form 1 April 27, 2005 Answers 1. The Wall Street Journal reports that 2004 saw an increase in the real interest rate and a simultaneous depreciation of the real exchange