Table of Contents. Vision, Mission, Core Values and Strategic Directions... 1 Equal Opportunity Statement... 3 General Information.
|
|
|
- Luke McKenzie
- 5 years ago
- Views:
Transcription
1
2 The Government Finance Officers Association of the United States and Canada (GFOA) presented a Distinguished Budget Presentation Award to, Oregon for its annual budget for the fiscal year beginning July 1, In order to receive this award, a governmental unit must publish a budget document that meets program criteria as a policy document, as an operations guide, as a financial plan, and as a communications device. The award is valid for a period of one year only. We believe our current budget continues to conform to program requirements, and we are submitting it to the GFOA to determine its eligibility for another award.
3 Table of Contents Vision, Mission, Core Values and Strategic Directions... 1 Equal Opportunity Statement... 3 General Information About... 4 Committee... 6 Board of Education... 7 Organization Chart... 8 Organizational Units... 9 Budget Structure and Functions Basis of Budgeting Funds Revenue Sources Expense Functions Expenditure Categories Budget Planning Budget Development Process Budget Message Budget Schedules Summary - All Funds Consolidated Resources & Requirements All Funds Interfund Transfers Fund 1: General Fund Resources Expenditures and Other Requirements Requirements by Expenditures Category Fund IX: Special Revenue Administratively Restricted Fund Resources Expenditures and Other Requirements Fund II: Internal Service Fund Fund III: Debt Service Fund Fund IV: Capital Projects Fund Fund V: Financial Aid Fund Fund VI: Enterprise Fund Fund VIII: Special Revenue Fund Personal Services FTE by Expense Function Salaries Paid from More than One Source Appendices Appendix A: Financial Policies... A1 Appendix B: Performance Measures... B1 Appendix C: Financial Planning... C1 Appendix D: Local & Regional Information... D1 Appendix E: Economic Forecast... E1 Appendix F: Legal Notifications... F1 Appendix G: Glossary of Terms... G1
4 Vision, Mission, Core Values and Strategic Directions Vision Transforming lives through learning Mission Lane is a learning-centered community college that provides affordable, quality, lifelong educational opportunities that include: Career technical and lower division college transfer programs Employee skill upgrading, business development and career enhancement Foundational academic, language and life skills development Lifelong personal development and enrichment, and Cultural and community services Core Values Learning Working together to create a learning-centered environment Recognizing and respecting the unique needs and potential of each learner Fostering a culture of achievement in a caring community Diversity Welcoming, valuing and promoting diversity among staff, students and our community Cultivating a respectful, inclusive and accessible working and learning environment Working effectively in different cultural contexts to serve the educational and linguistic needs of a diverse community Developing capacity to understand issues of difference, power and privilege Innovation Supporting creativity, experimentation, and institutional transformation Responding to environmental, technological and demographic changes Anticipating and responding to internal and external challenges in a timely manner Acting courageously, deliberately and systematically in relation to change Collaboration and Partnership Promoting meaningful participation in governance Encouraging and expanding partnerships with organizations and groups in our community Integrity Fostering an environment of respect, fairness, honesty, and openness Promoting responsible stewardship of resources and public trust -1- Vision, Mission, Core Values and Strategic Directions
5 Accessibility Strategically grow learning opportunities Minimize financial, geographical, environmental, social, linguistic and cultural barriers to learning Sustainability Integrate practices that support and improve the health of systems that sustain life and learning Strategic Directions Provide a learning environment that fosters ecological awareness, diversity, interdisciplinary breadth, and the competence to act on such knowledge Equip and encourage all students and staff to participate fully as citizens of an environmentally, socially, and economically sustainable society, while cultivating connections to local, regional, and global communities. A Liberal Education Approach for Student Learning Equip students to become global citizens with the broad knowledge and transferable skills characterizing a liberal education approach Expand application of the liberal education approach throughout the college s programs and services Optimal Student Preparation, Progression and Completion Promote students progression to goal completion by knowing our students and creating needed systems, processes and learning environments Support academically underprepared students progression to college-level coursework by providing them with foundational skills classes and support Online Learning and Educational Resources Build capacity in faculty and staff to create high-quality, sustainable and innovative online learning and educational resources Provide the required tools, infrastructure and professional development to use emerging technologies for expanding online learning and educational resources Explore the effectiveness of online learning and educational resources A Sustainable Learning and Working Environment Build understanding of sustainable ecological, social and economic systems and practices among the college communities Apply principles of sustainable economics, resource use, and social institutions to Lane s learning and working environments A Diverse and Inclusive Learning and Working Environment Create a diverse and inclusive learning college Develop institutional capacity to respond effectively and respectfully to students, staff, and community members of all cultures, languages, classes, races, genders, ethnic backgrounds, religious beliefs, sexual orientations, and abilities A Safe Learning and Working Environment Maintain safe learning and working environment Improve practices and resources that secure property Promote activities, practices and processes that encourage civil discourse and protect college communities from discrimination, harassment, threats, and harm -2- Vision, Mission, Core Values and Strategic Directions
6 Equal Opportunity Statement It is the policy of to provide equal employment opportunity to all qualified persons and to prohibit discrimination in employment on the basis of race, color, national origin, sex, marital status, family relationship, sexual orientation, age, pregnancy, mental or physical disability, religion, or veteran status, expunged juvenile record, parental or family medical leave, application for Workers Compensation, whistle blowing, association with a member of a protected class, and all other federal, state and local protected classes. -3- Equal Opportunity Statement
7 GENERAL INFORMATION
8 General Information About is a comprehensive public community college, established in 1964 by a vote of district residents. The college offers a wide variety of instructional programs including transfer credit programs, professional technical degree and certificate programs, continuing education noncredit courses, programs in English as a Second Language and International ESL, GED programs, and customized training for local businesses. Classes are offered at many locations, and online classes and telecourses are also available. During the academic year, 20,643 students enrolled in credit classes and 16,256 students enrolled in noncredit classes. Lane has the third largest enrollment of the 17 community colleges in Oregon. The College District encompasses a 5,000 square mile area which includes most of Lane County from the Pacific Ocean to the Cascade Mountains, Monroe Elementary School District in Benton County, Harrisburg Elementary School District in Linn County, Harrisburg Union High School District in Linn County, and a small area south of Cottage Grove and Florence in Douglas County. The College District includes more than 351,109 residents. Lane's 301-acre Main Campus is located in the beautiful south hills of Eugene, Oregon at 4000 East 30th Avenue. The college has a number of other locations including the Downtown Center in Eugene, Campus Centers in Cottage Grove and Florence, a Flight Technology Center at the Eugene Airport, and other outreach sites. Lane is accredited by the Northwest Commission on Colleges and Universities. The Commission is an institutional accrediting body recognized by the Council for Higher Education Accreditation and/or the U.S. Department of Education. Related regional accreditation documents are on reserve in the college library. Individual Lane programs are evaluated for quality by numerous vocational and professional accrediting associations, including: Automotive Technology, certified by the National Automotive Technicians Education Foundation, a non-profit foundation within the National Institute for Automotive Service Excellence Aviation Maintenance, approved and certified under Part 147 of the Federal Aviation Regulations of the Federal Aviation Administration Culinary Arts, accredited by the American Culinary Federation Education Foundation Accrediting Commission, a specialized accrediting commission recognized by the Council for Higher Education Accreditation Dental Assisting, accredited by American Dental Association s Commission on Dental Accreditation, a specialized accrediting board recognized by the U.S. Department of Education Dental Hygiene, accredited by American Dental Association s Commission on Dental Accreditation, a specialized accrediting board recognized by the U.S. Department of Education. The Commission may be contacted at (312) or 211East Chicago Avenue, Chicago, Illinois Diesel Technology, evaluated and accredited by the Association of Equipment Distributors Foundation Dietary Manager, conditionally approved by Dietary Managers Association Emergency Medical Technology-Paramedic, approved by the Department of Human Services and Trauma Systems, Oregon, meeting requirements of OAR (2) -4- General Information
9 Energy Management, awarded Institute for Sustainable Power Quality accreditation credential from the Interstate Renewable Energy Council, International Standard #01021 for accreditation and certification of renewable energy training programs and instructors Exercise and Movement Science endorsed by the American College of Sports Medicine Flight Technology certification courses, approved by the Federal Aviation Administration Hospitality Management, accredited by the Commission on Accreditation of Hospitality Management Programs Medical Office Assistant, accredited by the Commission on Accreditation of Allied Health Education Programs, a specialized accrediting board recognized by the Council for Higher Education Accreditation, on recommendation of the Curriculum Review Board of the American Association of Medical Assistants Endowment. Commission on Accreditation of Allied Health Education Programs, 1361 Park Street, Clearwater, FL 33756, (727) Nursing, evaluated and approved through 2012 by the Oregon State Board of Nursing Physical Therapist Assistant, granted Candidate for Accreditation status by the Commission on Accreditation in Physical Therapy Education of the American Physical Therapy Association (CAPTE, 1111 N. Fairfax Street, Alexandria, VA) on April 29, Candidate for Accreditation is a preaccreditation status of affiliation with the Commission on Accreditation in Physical Therapy Education that indicates the program is progressing toward accreditation; candidacy for accreditation does not assure the program will be granted accreditation status. CAPTE will continue to review program content, standards, and successful objective achievement from fall term 2009 to spring term Respiratory Care, accredited by the Commission on Accreditation of Allied Health Education Programs, a specialized accrediting board recognized by the Council for Higher Education Accreditation, in collaboration with the committee on Accreditation for Respiratory Care coarc.com The college has earned national recognition for many of its instructional programs, services and administrative practices. Lane also is a member of the League for Innovation in the Community College and a Vanguard College. Through the League, Lane exchanges innovative ideas and practices with some of the best community colleges in the United States. -5- General Information
10 Committee Robert Ackerman Pat Albright Ron Green Roger Hall Susie Johnston Gary LeClair Rayna Luvert Chris Matson Tony McCown Marston Morgan, Vice Chair Jennifer Ocker Dennis Shine, Chair Sharon Stiles Carmen Urbina -6- Budget Committee


11 Board of Education Seven elected, unpaid Board members have primary authority to establish policies governing the operation of the college and to adopt its budget. Their charge is to encourage the development of programs and services that will best serve the needs of College District constituents. Sharon Stiles, Retired EEO Officer, Florence Elected May 2009, term expires June 30, 2013 Zone 1-Western Tony McCown, Urban Planner, Eugene Elected May 2007, term expires June 30, 2011 Zone 2-Northern Gary LeClair, Physician, Eugene Elected May 2009, term expires June 30, 2013 Zone 3-Marcola and Springfield Susie Johnston, Conference Planner, Pleasant Hill Elected May 2005, re-elected May 2009, term expires June 30, 2013 Zone 4-Eastern Pat Albright, retired Teacher, Eugene Appointed April 2007, elected May 2007, term expires June 30, 2011 Zone 5-Central Eugene Roger C. Hall, Radiologist, Eugene Elected March 1991, re-elected March 1995, re-elected March 1999, reelected May 2003, re-elected May 2007, term expires June 30, 2011 At-Large, Position 6 Robert Ackerman, retired Attorney, Eugene Elected May 2007, term expires June 30, 2011 At-Large, Position 7-7- Board of Education
12 Organizational Chart President Executive Assistant to the President Marketing & Public Relations Chief Diversity Officer Professional & Organizational Development, Affirmative Action Vice President College Services Chief Finance Officer Chief Human Resources Officer Labor Relations & Operations Manager Grants Development Chief Information Officer Executive Dean Academic Affairs Career Technical Vice President Academic & Student Affairs Chief Academic Officer Executive Dean Academic Affairs Transfer Director Institutional Research, Assessment & Planning Executive Dean Student Affairs Student Services and Student Development International Programs Governmental & Community Relations Oregon Small Business Development Center Network Sustainability Office Budget Office College Finance Printing/Graphics Mail Services Health Clinic KLCC-FM Specialized Support Services & Laundry Titan Store Organizational Chart August 4, 2010 Facilities Management & Planning Public Safety Housekeeping Academic Technology Library Infrastructure Services Infrastructure Technology ABSE & Workforce Development Co-op Education High School Connections Advanced Technology Aviation Academy Child & Family Education Culinary & Conference Services Food & Beverage Catering Health Professions Academic Learning Skills, ESL, Tutoring Arts Business/CIT Florence Health, Physical Education & Athletics Language, Literature & Communication Math Science Social Science Business Development Center Employee Training Continuing Education & Cottage Grove Enrollment & Student Financial Services Financial Aid Counseling & Advising Disability Resources TRiO Title III The Torch Student Life & Leadership Development, Multicultural Center, Women s Program -8- Organizational Chart
13 Organizational Units is structured into the following organizational units: Instruction The Instructional unit s primary responsibility is to plan, schedule, and implement academic, continuing education and other instructional programs and services in accordance with the vision, mission, core values and strategic directions of the college. The college s Instructional Plan is the driving force behind all other organizational units planning and operations. Instructional areas include: lower division transfer, professional technical, developmental education, non-credit courses and workforce development training. Instructional Support The Instructional Support unit is charged with providing specialized services that support and enhance instruction. Instructional Support areas include: distance learning, instructional technology, library, and faculty professional development. Student Services Student Services purpose is to assist students in all phases of their educational experience. Student Services areas include counseling, disability services, enrollment, financial aid, and student life. College Support Services The College Support Services unit consists of the administrative activities of the college. College Support Services areas include the Board of Education, governance system and administration, human resources, marketing and public relations, college operations, finance, computer services, and public safety. Plant Operations and Maintenance Plant Operations and Maintenance ensures that the college provides a safe and comfortable environment in which to learn and work. Plant Operations and Maintenance areas include infrastructure, utilities, motor pool, sustainability, and facilities management and planning. -9- Organizational Units
14 Budget Structure and Functions Basis of Budgeting For the budget document, Oregon Budget Law requires that a modified accrual basis of accounting is used, which determines when and how transactions or events are recognized. As discussed in the Budget Message, this means revenues are reported when earned, expenditures are reported when the liability is incurred and taxes are accounted for on a cash basis, i.e. when received. The result is that carryovers of financial obligations from year-to-year are precluded and projections of anticipated revenue are not inflated. The college budgets all college funds required to be budgeted, the General Fund and all Auxiliary Funds, in accordance with Oregon Local Budget Law on a Non-GAAP budgetary basis, whereas Generally Accepted Accounting Principles (GAAP) provides the structure for the basis of accounting used for financial statement reporting. The differences between GAAP and the budgetary basis of accounting generally concern timing of recognition of revenues and expenditures. Thus, there are no differences between fund structure in the financial statements and the budget document. The basic financial statements present the college and its component unit, Foundation, for which the college is considered to be financially accountable. The Foundation, a legally separate tax-exempt entity, is a discretely presented component unit and is reported in a separate column in the basic financial statements. The budget document presents college information exclusive of Foundation data. Under GAAP, basic financial statements are reported using the economic resources measurement focus and accrual basis of accounting. Revenues are recorded when earned and expenses are recorded at the time liabilities are incurred, regardless of when the related cash flows take place. Property taxes are recognized as revenues in the years in which they are levied. Grants and other similar types of revenue are recognized as soon as all eligibility requirements imposed by the grantor have been met. Material timing differences in expenditures between GAAP and the budgetary basis of accounting include capital expenditures, which under GAAP are allocated to depreciation expense over a specified period of time. In the budget document, capital expenditures are assigned in full to operations expense. With respect to debt service, payments to principal reduce the liability on the financial statements while interest payments are expensed. Under the budgetary basis of accounting, both principal and interest are expensed to operations within the fiscal year Basis of Budgeting
15 Funds s budget is segregated into the following funds, appropriated by the Board of Education. Each fund is independently budgeted, operated and accounted for. The college s primary budgeting and operational funds are the General Fund (I) and the Special Revenue Administratively Restricted Fund (IX). Fund I: General Fund Includes activities directly associated with operations related to the college s basic educational objectives. Fund II: Internal Service Fund Includes functions that exist primarily to provide goods or services to other instructional or administrative units of the college. Fund III: Debt Service Fund Accounts for the accumulation of resources for, and the payment of, general long-term debt, principal and interest. Fund IV: Capital Projects Fund Used for the acquisition of land, new construction, major remodeling projects, and major equipment purchases. Fund VI: Enterprise Fund Includes activities that furnish goods or services to students, staff, or the public, for which charges or fees are assessed that are directly related to the cost of the good or service provided. Fund VIII: Special Revenue Fund Accounts for revenue sources that are legally restricted to expenditures for specific purposes. Fund IX: Special Revenue Administratively Restricted Fund Used to account for specific programs where monies are administratively restricted. Activities recorded in this fund generate revenue primarily through specifically assessed tuition and fees, or through other revenue-generating activities. Fund V: Financial Aid Fund Used for the provision of grants, stipends, and other aid to enrolled students Funds
16 Revenue Sources Intergovernmental Also known as total public resources, intergovernmental resources include Lane s allocation of community college funding from the State of Oregon, resources from various unrestricted federal, state and local contracts, and local property tax revenue. State community college funding resources are determined by the state legislature s funding distribution formula and are calculated on a biennial basis. Federal, state, and local unrestricted resources are budgeted using statistical trend analysis. Property tax revenue is determined by annual property tax levy and is budgeted using estimates provided by the state and through statistical trend analysis. Tuition Credit tuition is generated by assessing students per-credit-hour rates, which are annually adjusted for inflation using the Higher Education Price Index (HEPI) per Board of Education policy D.110. Non-credit tuition is generated by charging varying rates per course, based on course costs and market forces. Tuition resources are budgeted based on enrollment projections developed by the college s Institutional Research and Planning department. Instructional Fees Instructional fees are generated by assessing students for course-related expenses such as art supplies. All instructional fees are administratively restricted resources that are tied specifically to instructional expenditures and are not available for general allocation. Departmental instructional fees are established based on estimated materials and services costs and are approved by the Board of Education. Instructional fees are budgeted based on enrollment projections that are developed by the college s Institutional Research and Planning department and historical trend analysis. Interest Income Interest income is derived from investment of operating capital in excess of daily requirements. Fees (Non-Instructional) Non-instructional fees are generated by assessing students for noninstructional expenses such as student body fees, transportation fees, and technology fees. Individual fee amounts are approved by the Board of Education and budgeted based on enrollment projections and historical trend analysis. Sale of Goods and Services Sales of Goods and Services are generated through the college s Enterprise and Special Revenue activities, including such units as the Titan Store, Food Services, Center for Meeting and Learning, Health Clinic, and Printing & Graphics. Sale of Goods and Services revenue is budgeted based on historical trends and factors in known variables. Administrative Recovery Administrative Recovery includes amounts received from college enterprise funds such as the Titan Store, Foodservices and Center for Meeting and Learning (CML), as well as from various federal, state and local grants and contracts as a contribution to the General Fund for administrative and overhead costs. Other Resources Include resources from various activities such as finance charges, insurance proceeds, sale of equipment, enforcement fees and other nominal, one-time miscellaneous amounts. Budgeting is based on historical trend analysis Revenue Sources
17 Expense Functions Instruction Expenditures for all activities that are part of the college s instructional programs, including expenditures for departmental administrators and their support. Instructional Support Expenditures for activities carried out primarily to provide support services that are an integral part of the college s instructional programs. This category includes the media and technology employed by these programs as well as the administrative support operations that function within the various instructional units, and the retention, preservation, and display of materials. It also includes expenditures for chief instructional officers and their support where their primary assignment is administration. Student Services Expenditures for admissions, registration, record keeping, and other activities which primary purpose is to contribute to students wellbeing and to students development outside the context of the formal instructional program. Community Services Expenditures for activities established primarily to provide noninstructional services to groups external to the college. One such activity involves making available to the public various resources and unique capabilities that exist within the college. College Support Services Expenditures for activities whose primary purpose is to provide operational support for the ongoing operation of the college, excluding physical plant operations. Expenses include, for example, executive management, fiscal operations, administrative and logistical services, and community relations. Plant Operations and Maintenance Expenditures for the operation and maintenance of the physical plant. It includes services related to campus grounds and facilities, utilities, and property insurance. Plant Additions Expenditures for land, land improvement, buildings, and major remodeling and renovation that is not a part of normal plant operation and maintenance. Financial Aid Expenditures for loans, grants and trainee stipends to enrolled students. Student fee remissions are also included in this expense function. Contingency A budget account (not for expenditures) to provide for contingencies and unanticipated items, or to hold funds for future distribution. This function may also be used to provide expenditure authority for obligations created but not expended in previous years Expense Functions
18 Expenditure Categories Personal Services Personal Services expenditures include all full-time and part-time payroll plus other payroll expenses (OPE). Payroll is budgeted using actual position lists, factoring in performance and cost of living adjustments, and any anticipated contract changes to union wage schedules. OPE rates are budgeted using benefits cost projections, including amounts for various employment-related taxes, health and life insurance premiums, retirement fund contributions, employee wellness programs, and other direct employee benefits. Materials & Services Materials & Services expenditures include items such as office support supplies for instructional and operations departments, noncapitalized equipment, travel and maintenance. Materials & Services is budgeted using historical trend analysis. Capital Outlay Capital Outlay expenditures include all equipment purchases with a single item cost in excess of $10,000 and with a useful life exceeding two years. Capital Outlay is budgeted and allocated according to the Capital Assets Replacement Forecast. Transfers Out Interfund transfers out include resource funding of specific amounts to another fund for an identified purpose. The majority of transfers out occur in the General Fund and include items such as transfers to the Financial Aid Fund to cover institutional scholarships and institutional match obligations, and transfers to the Capital Projects Fund for capital repairs and improvements, special projects, capital reserves and deferred maintenance. Debt Service Debt Service includes amounts transferred out to the Debt Service Fund to cover current payment of long-term debt obligations entered into by the college. Contingency Contingency is a budget account used to provide for unanticipated items, or to hold funds for future distribution. This category may also be used to provide expenditure authority for obligations created but not expended in previous years Expenditure Categories

19 Budget Planning As indicated in the budget planning diagram at right, budget planning at is an iterative and participative process that involves all campus constituencies. College Council As the college s main planning and policy body, the College Council takes a lead role in establishing the annual budget development framework. Board of Education The Board of Education is responsible for reviewing and approving the proposed budget development framework, advising the administration on proposed addition and reduction recommendations, and approving the final list of additions and reductions. Administration and Executive Team The administration and Executive Team are responsible for providing guidance to the work of the College Council, communicating budget information to campus constituencies, and reviewing and prioritizing addition and reduction recommendations. Departments College departments are responsible for providing detailed unit plans and budget data elements to the College Council and administration, providing proposals and assessing the feasibility of recommendations for additions and reductions. Governance Councils Governance Councils provide plans and policies that serve as a framework for budget proposal development Budget Planning
20 Budget Development Process In the budget development process outlined below, follows Oregon Local Budget Law *. In addition to providing a financial plan for fiscal year revenues and expenses, Lane s Budget Document outlines programs and initiatives and implements controls on spending authority. The budget development process is designed to encourage citizen input and public opinion about college programs and fiscal policies. I. Establish a Budget Committee II. The Budget Committee consists of the seven members of the Board of Education plus seven citizens at large. Each Board member appoints one citizen to the committee for a term of three years. Terms are staggered so that about one-third of the appointed terms end each year. Appoint a Budget Officer Lane s Budget Officer, the Chief Financial Officer, is appointed by the Board of Education. Calendar Prepare Budget November 2009-April 2010 Public Notice April-May 2010 Budget Committee Meetings April-May 2010 III. IV. Prepare a Proposed Budget The Budget Officer supervises the preparation of a Proposed Budget, which includes the following actions: A. Discuss Budget Assumptions with Budget Committee B. Develop resource (revenue) estimates and base expenditures budget C. Estimate preliminary surplus/deficit D. Determine tuition rate E. Develop changes to base and final budgets in accordance with internal planning processes and Board of Education approval (see page 15). F. Prepare Budget Message for the Budget Committee, public, employees and other stakeholders Public Notice Lane s Budget Officer publishes a public Notice of Budget Committee Meeting(s). Budget Committee Approval May 2010 Publication June 2010 Budget Hearing June 2010 Adoption by Board June 2010 V. Budget Committee Meeting(s) At least one Budget Committee meeting is held to 1) review the budget message and document, 2) hear the public and 3) revise and complete the budget as needed. At the time the proposed budget is distributed to the Budget Committee, it becomes public record and is made available to the public. Filing & Certification June 2010 * Oregon Revised Statutes (ORS) section 294: Budget Development Process
21 VI. Budget Approval When the Budget Committee is satisfied with the proposed budget, including any additions to or deletions from the budget prepared by the Budget Officer, the budget is approved. Note: If the budget requires an ad valorem tax to be in balance, the budget committee must approve an amount or rate of total ad valorem property taxes to be certified to the assessor. VII. Publication After the budget is approved, a budget hearing is held by the Board of Education. The Budget Officer publishes a summary of the approved budget and a Notice of Budget Hearing. VIII. Budget Hearing The Budget Hearing is held to receive citizen testimony on the approved budget. IX. Adoption The Board of Education enacts a resolution to 1) formally adopt the budget, 2) make appropriations, and, if needed, 3) levy and categorize taxes. The resolution must be adopted no later than June 30 for the fiscal year starting July 1. X. Budget Filed and Levy Certified A copy of the complete budget is sent to the Lane County Clerk. When levying a property tax, Lane s Budget Officer submits notice of levy, categorization certification and resolutions to the County Assessor s office by July 15. Budget Amendment Process Budget estimates as shown in the Budget Document may be amended by the Board of Education 1) prior to formal adoption, or 2) after formal adoption if amendments are adopted prior to the commencement of the budget fiscal year and the amount of estimated expenditures for each fund is not increased by more than $5,000 or 10% of the original adopted expenditures, whichever is greater. If special circumstances, unforeseen at the time of original adoption, require an increase of more than 10% of original adopted expenditures, an amended budget document must be republished and another public budget hearing must be held. Total ad valorem property tax amounts or rates may not be increased following formal adoption of the Budget Document unless 1) an amended Budget Document is republished and another public budget hearing is held, and 2) the college obtains written approval and files a supplemental notice of property tax Budget Development Process
22 BUDGET MESSAGE FISCAL YEAR Presented April 28, 2010
23 Budget Message Strategic Directions for Fiscal Year The proposed budget for fiscal year was developed to further the approved Strategic Directions of the college. New Strategic Directions were recently approved by the Board of Education and are listed on page 2-3 of your budget document. Economic Outlook Fiscal year is the second year of the biennium and there is little uncertainty regarding the amount of public funding that will be provided. The economic climate continues to have a grim outlook with high unemployment and steadily declining state revenue forecasts. However, we do not anticipate a further reduction in state support this biennium. Unfortunately, available public resources fall significantly short of what is necessary to serve students and the community, keep education affordable and accessible, maintain compensation levels for employees and meet essential operating requirements of at Fiscal Year Budget Strategies: 1) Continue enrollment growth. 2) Reduce cost rather than capacity. 3) Constrain M&S and capital investment costs. 4) Use differential fees to partially offset higher cost programs. 5) Maintain capacity to serve students by retaining employees. normal levels of support. In addition, the dramatic reductions in state revenue appear likely to continue into the next biennium. At the same time revenue from public support is decreasing, we have not seen a loss in demand for our programs and services. Conversely, the demand for our services has significantly increased as unemployed workers return to school to better prepare themselves for the next economy. This creates a double economic burden of a need to meet increased demand with significantly fewer public resources. This presents the strategic choices of increasing revenue, maintaining service levels at lower cost, downsizing the college and student opportunities to match the reduced public support, or some combination of all. None of these choices is attractive. Raising revenue through higher tuition and fees shifts the burden of lost public support to the students. Higher prices economically challenge students and violate our value of an affordable public education as a public good. Reducing cost is an objective with which we have had some success but with 80 percent of our costs in staff compensation this shifts the burden of decreased public support to the employees. Downsizing the college through layoffs is the worst option as it diminishes our ability to meet student demand when we are most needed, and places employees into a bad economy with little chance of finding work. Consequently, our goal throughout this process is to keep as many employees working as possible and serve as many students as possible. Result of FY10 Budget Strategies Unknowns for FY ) Increase in health care costs/ope rate. 2) Resolution of FY11 economic reopener: negotiations with both employee associations. For the current budget year the college employed a combination of strategies to balance the budget. Employees took a reduction to the negotiated salary schedule in the form of furlough days or delay in longevity steps, capital investment and maintenance expenses were slashed, and students absorbed an increase in tuition including a two year surcharge. Differential fees were also raised. The college focused on meeting the demand of additional students and was able to accommodate another large increase in enrollment. Extraordinary extra effort by employees including faculty flexibility to allow both full time and part time faculty to teach more classes was critical to this success. The combination of additional revenue and cost reductions enabled the college to both balance the budget and meet student demand Budget Message

24 Budget Assumptions The public support revenue assumption is based upon the state model projections for Lane Community College at an appropriation level of $450.5 million. This model assumes that the college s share of total enrollment relative to other colleges will remain stable and preliminary indications are consistent with that assumption. It also assumes that the higher level of enrollment experienced this year will continue and includes a two dollar a credit hour tuition increase. Ending Fund Balance The ending fund balance is essential to maintain the college s credit rating as well as to ensure fiscal stability. Prior to issuing bonds last June we had a credit rating review by Standard and Poor s. The raters expressed considerable concern about the low level of our ending fund balance but we were able to maintain our A+ rating. This is still lower than the AA rating for other community colleges in the state, and reflects our relatively lower level of reserves. Maintaining an adequate fund balance is critical to retain our rating and ability to issue the remainder of bonds as the current projects are completed in three to four years. To keep the interest costs to county taxpayers as low as possible we must maintain fiscal discipline and an adequate fund balance. Funding the last quarter after the fact is likely a continuing characteristic of our state funding for the long term and it would be more prudent to have the reserves to meet that regular requirement. The ending fund balance is not idle cash. It is comprised of working capital already allocated and in use throughout the college. One change we are able to make this year is to budget a higher beginning fund balance than the required unappropriated ending fund balance. The difference will cover contingency balances that are required but are not expected to be expended except in emergencies. That places the fund balance at risk but frees up revenue that would otherwise be required to offset required contingency expense budget authority. Budget Assumptions 1) CCSF funding at $450 million 2) $2 Increase in tuition 3) Restore FY10 reductions in salary schedule 4) $3 tuition surcharge continued -19- Budget Message

25 Enrollment Growth Plans for fiscal year included efforts to increase both enrollment and productivity. We have observed both significant enrollment increases and productivity gains in the current year. We expect to see a 12% or greater increase in total enrollment for the current year. This has yielded both additional revenue and productivity as classes have fewer empty seats. Generally tuition and fees only account for about a third of our revenue and the greatest benefit of increased enrollment comes from additional state support for the increase in FTE. However, in the current environment all colleges have seen similar significant gains so it is not realistic to expect that we will be able to do more than maintain our relative share of a significantly reduced community college support fund. The budget projects the net benefit of the additional enrollment from this year to continue into next year and assumes an additional increase of 2% next year. Purchasing power of public funds allocated had been declining already in recent years, but the dramatic effect of the recession on state revenues resulted in a 10% reduction in state support for the current biennium. In addition, when combined with the enrollment growth the reduction per student is beginning to approach 30-40%. The long-term disinvestment in Oregon public education threatens college values of affordability and accessibility. We will not abandon our commitment to provide an affordable education for the community but we clearly cannot afford to operate at a loss either. Compensation and Benefits We have economic re-openers with both LCCEF and LCCEA regarding compensation for next year. To our knowledge, is the only school district in Oregon that has not set a limit on employer contributions to health care. Preliminary information indicates that costs for medical coverage will continue to increase significantly in FY and that additional costs will need to be assumed by the college, employees, or both. General Fund Budget for Fiscal Year Value of State Support per FTE Previously the college was able to insulate employees from the decline in funding levels and maintained steps and cost of living increases according to contractual agreements even if doing so required tapping reserves. Unfortunately, as mentioned earlier there are no excess reserves and funding has further declined. We remain committed to providing competitive salary and benefits but revenue has not kept pace with increasing costs. We are still competitive as this situation is not unique to Lane. Nationwide, the average faculty and administrator salary increase last year was 0% and a third of the institutions reported decreases in compensation. Fortunately, we have been able to maintain very modest increases for employees to this point. In FY 2008 manager salaries were frozen (no COLA salary schedule adjustments and no step equivalent awards), classified employees received days in lieu of a cost-of-living along with a full step for all classified staff, and contracted faculty agreed to a.86% increase with full steps while part-time faculty received the bargained COLA salary schedule adjustment and steps. In FY 2009 all employees received 1/2 step increase and flat 1.0 % salary adjustments along with various one-time payments. In -20- Budget Message

26 FY10 each employee received the equivalent of a half step but gave up planned salary schedule increases in exchange for furlough days or similar give-back agreement. The FY11 budget provides for restoration of the negotiated decreases from FY , but there is little flexibility to support compensation or benefit increases beyond that level. This budget reflects the reality of a forced transition from public funding to a combination of public and private funding sources. Our expenses in the future must be firmly linked to and limited by revenue to provide a financially sustainable model for the reliable and comprehensive access to education our community needs. The guidance of the Board of Education and the Budget Committee will be essential as we work toward this mutual goal. We are recommending a budget package that balances the budget by limiting increases for employee expenses along with a modest increase in tuition that will limit the increase in student costs. As in past years, the FY11 budget will also continue significant budget reductions in maintenance, materials and services, and equipment replacement. Spending in each of these areas is below levels seen five years ago. None of these reductions are sustainable. This budget is guaranteed to make all stakeholders of unhappy. Resources The proposed General Fund budget revenue for fiscal year is $90 million, a 5% increase from the adopted budget. This increase is mostly from additional enrollment. Revenues from total public resources for fiscal year include an estimated $28,096,321 from the state Community College Support Fund and an estimated $15,000,000 in property taxes for a total of $43,096,321. This represents a small increase of $1 million from the current fiscal year budget due primarily to an increase in the property tax estimate. This state support estimate anticipates that our share of total state enrollment will be stable during the next year. Because the funding distribution formula includes 100% of Lane s property taxes, state and property tax revenues must be considered together in budget development. Property taxes and state revenues are combined in the Intergovernmental Resources line. The includes a $2.00 per credit inflationary adjustment in tuition as previously approved by the Board of Education according to Board Policy D.110 (See Appendix A3) Budget Message

27 Special Revenue- Administratively Restricted Fund (Fund IX) The proposed budget for Special Revenue Administratively Restricted Fund IX increased by $1.5 million due to increased enrollment related revenue and expense. Fund IX is composed of administratively restricted activities of the general fund. Budget projections used for budget development combine the General Fund and Fund IX. Additional Important Information Because budget laws require total resources and expenditures to balance, the budget document includes budget expenditure authority for all reasonably anticipated resources in fiscal year There are several changes for next year to increase budget authority for several other funds. The Financial Aid fund budget authority is increased for additional federal financial aid expected because of increased enrollment, increased entitlements, and Expenditures The General Fund personal services budget has increased by $7 million or 10% from fiscal year The increase is due to additional part time and full time faculty hired to accommodate increased enrollment, and restoration of FY10 salary reductions. The materials and services budget has increased due to a change in budget practice to budget for income credit program fees and prior year fee carryovers in department budgets. Therefore you will find increases in department budget amounts. The increases are due to additional enrollment generating more student fees to cover direct instructional expense. Budgeted capital outlay is unchanged. Transfers out to other funds decreased due to actual expense results in some funds and reductions in general fund support to others. Other personal expense (OPE) rates are likely to change to cover increases in medical costs yet to be determined, and increases in other benefit categories such as pension bonds. In addition, adjustments both increases and decreases have been made for expenditures that are primarily beyond the control of the college. These mandatory adjustments include such items as facilities leases, utilities, property/liability insurance premiums, and maintenance contracts. TOTAL BUDGET: ALL FUNDS General Fund (I) $90,464,800 Internal Services Fund (II) 1,893,771 Debt Service Fund (III) 9,429,112 Capital Projects Fund (IV) 27,010,426 Financial Aid Fund (V) 98,018,105 Enterprise Fund (VI) 15,373,557 Special Revenue Fund (VIII) 18,400,000 Special Revenue: Admin Restricted (IX) 12,538,544 Total All Funds $ 273,128, Budget Message
28 increased need. The Capital Projects budget authority allows for spending related to bond projects, and completion of the new health and wellness building. The Special Revenue fund has increased budget authority to allow for additional grant activity. None of this additional activity creates any new requirements or revenue for the general fund. This Budget Document is consistent with the budget laws of the State of Oregon and other applicable policies. The budget is prepared on a modified accrual basis of accounting (revenues reported when earned; expenditures reported when the liability is incurred; taxes accounted for on a cash basis). The result is that carryovers of financial obligations from year-to-year are precluded and projections of anticipated revenue are not inflated. The format and summarization are consistent with the Oregon Accounting Guidelines for Community Colleges. This budget expresses the basic and essential fiscal requirements of as set forth by the Board of Education. The Document is submitted herewith for your consideration and action. The staff and I are ready to assist you in the important task of reviewing this document. Respectfully, Gregory L. Morgan Budget Officer/ Chief Financial Officer -23- Budget Message
29 BUDGET SCHEDULES
30 SUMMARY - ALL FUNDS Fiscal Year Fiscal Year Fiscal Year Fiscal Year Fiscal Year Fiscal Year ADOPTED APPROVED PROPOSED CURRENT ACTUAL ACTUAL Budget Budget Budget Budget Amounts Amounts General Fund I $ 90,464,800 $ 90,464,800 $ 90,464,800 $ 85,454,924 $ 74,352,192 $ 68,162,806 Internal Service Fund II 1,893,771 1,893,771 1,893,771 1,672,205 1,521,804 1,413,073 Debt Service Fund III 9,429,112 9,429,112 9,429,112 9,151,102 9,236,020 8,843,760 Capital Projects Fund IV 27,010,426 27,010,426 27,010,426 39,623,000 8,536,203 1,697,163 Financial Aid Fund V 98,018,105 98,018,105 98,018,105 94,404,455 61,428,134 41,626,567 Enterprise Fund VI 15,373,557 15,373,557 15,373,557 12,554,600 10,068,920 8,685,191 Special Revenue Fund VIII 18,400,000 18,400,000 18,400,000 13,091,000 9,736,321 7,727,719 Special Revenue-Admin. Restricted Fund IX 12,538,544 12,538,544 12,538,544 12,102,884 8,847,190 9,210,237 Total $ 273,128,315 $ 273,128,315 $ 273,128,315 $ 268,054,169 $ 183,726,785 $ 147,366, Summary All Funds


31 CONSOLIDATED RESOURCES Fiscal Year All Funds Sale of Goods & Services 6% Instructional Fees 5% Interest & Misc Other 7% Fund Transf ers 1% Tuition 13% CONSOLIDATED REQUIREMENTS Fiscal Year All Funds Intergovernmental 69% Financial Aid 36% Debt Service 4% Fund Transf ers 1% Contingency 3% Instruction 23% Instructional Support 2% Student Services 10% Community Services 3% Plant Operation, Maintenance & Additions 12% College Support Services 6%
32 CONSOLIDATED RESOURCES & REQUIREMENTS - ALL FUNDS Fiscal Year Fiscal Year Fiscal Year Fiscal Year Fiscal Year Fiscal Year ADOPTED APPROVED PROPOSED CURRENT ACTUAL ACTUAL SUMMARY OF ALL FUNDS Budget Budget Budget Budget Amounts Amounts Current Operating Resources Intergovernmental $ 178,073,933 $ 178,073,933 $ 178,073,933 $ 171,035,231 $ 115,166,289 $ 94,689,991 Tuition & Fees: Tuition 34,852,066 34,852,066 34,852,066 33,341,562 26,812,717 22,636,687 Instructional & Student Fees 12,622,818 12,622,818 12,622,818 11,209,443 9,564,343 7,491,028 Other Sources: Sale of Goods & Services 15,414,809 15,414,809 15,414,809 13,981,054 12,624,028 11,206,370 Interest Income 294, , , , ,683 1,171,296 Rents, Contracts, Gifts, Donations, Bad Debt Recovery 18,336,730 18,336,730 18,336,730 20,111,180 12,371,241 10,710,760 Proceeds from Sale of Bonds ,903,768 - Fund Transfers 3,678,703 3,678,703 3,678,703 4,213,950 7,332,156 4,975,244 Total Current Operating Resources $ 263,273,309 $ 263,273,309 $ 263,273,309 $ 254,485,170 $ 230,295,225 $ 152,881,377 Current Requirements By Function: Instruction $ 63,452,589 $ 63,452,589 $ 63,452,589 $ 55,768,754 $ 46,958,975 $ 44,476,645 Instructional Support 4,716,776 4,716,776 4,716,776 4,538,594 3,554,903 3,358,363 Student Services 27,848,393 27,848,393 27,848,393 23,902,862 20,799,769 18,396,406 Community Services 8,706,564 8,706,564 8,706,564 7,017,364 6,162,760 5,876,182 College Support Services 16,197,643 16,197,643 16,197,643 15,253,085 14,654,922 13,275,494 Plant Operation & Maintenance 6,800,375 6,800,375 6,800,375 14,661,953 10,410,970 6,494,215 Plant Additions 25,701,776 25,701,776 25,701,776 30,693,000 3,680, ,613 Financial Aid 98,018,105 98,018,105 98,018,105 94,104,455 60,936,077 41,310,595 Debt Service 9,429,112 9,429,112 9,429,112 9,151,102 9,236,020 8,843,760 Fund Transfers 3,678,703 3,678,703 3,678,703 3,913,950 7,332,156 4,975,244 Contingency 8,678,279 8,678,279 8,678,279 9,049, Total Current Operating Requirements $ 273,228,315 $ 273,228,315 $ 273,228,315 $ 268,054,168 $ 183,726,786 $ 147,366,516 Excess (deficit) Current Resources Current Requirements $ (9,955,006) $ (9,955,006) $ (9,955,006) $ (13,569,000) $ 46,568,439 $ 5,514,861 Beginning Fund Balance 9,955,006 9,955,006 9,955,006 13,569,000 13,105,092 7,590,230 Ending Fund Balance $ - $ - $ - $ - $ 59,673,531 $ 13,105, Consolidated Resources & Requirements
33 SCHEDULE OF INTERFUND TRANSFERS Revenues Expenditures Remarks GENERAL FUND I Transfer to Internal Service Fund II $ $ 372,657 Employee Wellness 140,144; Telecommunications 232,613 Transfer to Capital Projects Fund IV 1,000,000 Major maintenance 745,000; Capital repair & improvement 255,000 Transfer to Enterprise Fund VI 167,457 Laundry Transfer to Special Revenue-Admin. Rest. IX 1,568,259 Athletics 217,837; Child & Family Education 470,478; KLCC 197,564; Specialized Support Services 61,715; Staff Health Clinic 244,563; Student Health 293,663; Torch 82,439 Transfer from Internal Service Fund II 3,500 Transfer authority contingency Transfer from Debt Service Fund III 100, GO Bond closure Transfer from Enterprise Fund VI 148,849 Center for Meeting & Learning 77,416; Foodservices 71,433 Transfer from Special Revenue-G/C Fund VIII 4,000 Transfer authority contingency Transfer from Special Revenue-Admin Fund IX 3,600 ASLCC cultural programs TOTAL $ 259,949 $ 3,108,373 INTERNAL SERVICE FUND II Transfer to General Fund I $ $ 3,500 Transfer authority contingency Transfer to Special Revenue-Admin. Rest. IX 1,000 Transfer authority contingency Transfer from General Fund I 372,657 Employee Wellness 140,144; Telecommunications 232,613 TOTAL $ 372,657 $ 4,500 DEBT SERVICE FUND III Transfer to General Fund I $ $ 100, GO Bond closure TOTAL $ - $ 100,000 CAPITAL PROJECTS FUND IV Transfer from General Fund I $ 1,000,000 $ Major maintenance 745,000; Capital repair & improvement 255,000 Transfer from Special Revenue-Admin. Rest. IX 247,776 Transportation/parking 150,000; Longhouse 97,776 TOTAL $ 1,247,776 $ - - Continued Interfund Transfers
34 SCHEDULE OF INTERFUND TRANSFERS Revenues Expenditures Remarks FINANCIAL AID FUND V Transfer from Special Revenue-Admin. Rest. Fund IX 60,605 Student grants TOTAL $ 60,605 $ - ENTERPRISE FUND VI Transfer to General Fund I $ $ 148,849 Center for Meeting & Learning 77,416; Foodservices 71,433 Transfer to Special Revenue-Admin. Rest. IX 1,000 Foodservices Transfer from General Fund I 167,457 Laundry TOTAL $ 167,457 $ 149,849 SPECIAL REVENUE-G/C FUND VIII Transfer to General Fund I $ $ 4,000 Transfer authority contingency TOTAL $ - $ 4,000 SPECIAL REVENUE-ADMIN. REST. FUND IX Transfer to General Fund I $ $ 3,600 ASLCC cultural programs Transfer to Capital Projects Fund IV 247,776 Transportation/parking 150,000; Longhouse 97,776 Transfer to Financial Aid Fund V 60,605 Student grants Transfer from General Fund I 1,568,259 Athletics 217,837; Child & Family Education 470,478; KLCC 197,564; Specialized Support Services 61,715; Staff Health Clinic 244,563; Student Health 293,663; Torch 82,439 Transfer from Internal Service Fund II 1,000 Transfer authority contingency Transfer from Enterprise Fund VI 1,000 Foodservices TOTAL $ 1,570,259 $ 311,981 TOTAL TRANSFERS - ALL FUNDS $ 3,678,703 $ 3,678, Interfund Transfers
35 GENERAL FUND I SPECIAL REVENUE FUND IX ADMIN RESTRICTED


36 Intergovernmental Tuition Instructional Fees Other Total Resources Millions Sale of Goods & Services 1% Instructional Fees 5% GENERAL FUND RESOURCES Fiscal Year Fees 1% Administrative Recovery 1% Rents, Contracts, Gifts 1% Intergovernmental 51% Tuition 40% GENERAL FUND RESOURCES BY SOURCE Fiscal Years 2008 through 2011 $90 $80 $70 $60 $50 $40 $30 $20 $10 $0 FY11 Adopted FY10 Budget FY09 Actual FY08 Actual
37 GENERAL FUND I Fiscal Year Fiscal Year Fiscal Year Fiscal Year Fiscal Year Fiscal Year ADOPTED APPROVED PROPOSED CURRENT ACTUAL ACTUAL Budget Budget Budget Budget Amounts Amounts RESOURCES Intergovernmental* $ 43,096,321 $ 43,096,321 $ 43,096,321 $ 42,092,179 $ 37,837,951 $ 43,676,475 Tuition & Fees: Tuition 34,162,066 34,162,066 34,162,066 32,385,562 26,278,000 22,155,167 Instructional Fees 3,794,700 3,794,700 3,794,700 3,202,665 3,910,201 2,763,645 Other Sources: Sale of Goods & Services 445, , ,050 1,110, , ,181 Interest Income 200, , , , , ,351 Fees 944, , ,778 1,024,978 1,027,900 1,016,525 Administrative Recovery 1,000,000 1,000,000 1,000, , , ,290 Rents, Contracts, Gifts, Bad Debt Recovery, Chargebacks 1,234,580 1,234,580 1,234, ,030 1,018,023 2,998,873 Transfer In from Internal Service Fund II 3,500 3,500 3,500 3, Transfer In from Debt Service Fund III 100, , , Transfer In from Capital Projects Fund IV ,000 Transfer In from Financial Aid Fund V ,945 Transfer In from Enterprise Fund VI 148, , , , ,525 - Transfer In from Special Revenue Fund VIII 4,000 4,000 4,000 4, Transfer In from Special Revenue-Admin Fund IX 3,600 3,600 3,600 3,600 3,600 6,800 Total Operating Revenues $ 85,137,444 $ 85,137,444 $ 85,137,444 $ 82,254,924 $ 71,382,316 $ 74,276,252 Beginning Fund Balance 5,327,356 5,327,356 5,327,356 3,200,000 3,297,148 (2,816,297) TOTAL RESOURCES $ 90,464,800 $ 90,464,800 $ 90,464,800 $ 85,454,924 $ 74,679,464 $ 71,459,955 * Intergovernmental $ 28,096,321 $ 28,096,321 $ 28,096,321 $ 28,092,179 $ 23,078,963 $ 29,741,565 * Property Taxes 15,000,000 15,000,000 15,000,000 14,000,000 14,758,988 13,934,910 ` -28- Fund I: General Fund/Resources


38 Instruction Instructional Support Student Services College Support Services Plant Operation & Maintenance Financial Aid, Debt Service, Transfers Out Total Expenditures Millions Transfers Out 3% Plant Operation & Maintenance 7% GENERAL FUND REQUIREMENTS BY FUNCTION Fiscal Year Contingency 7% Instruction 55% College Support Services 14% GENERAL FUND REQUIREMENTS BY FUNCTION Fiscal Years 2008 through 2011 Student Services 9% $90 $80 Instructional Support 5% $70 $60 $50 $40 $30 $20 $10 $0 FY08 Actual FY09 Actual FY10 Budget FY11 Adopted
39 GENERAL FUND I EXPENDITURES AND OTHER REQUIREMENTS Fiscal Year Fiscal Year Fiscal Year Fiscal Year Fiscal Year Fiscal Year ADOPTED APPROVED PROPOSED CURRENT ACTUAL ACTUAL Budget Budget Budget Budget Amounts Amounts Instruction Academic Learning Skills $ 1,633,137 $ 1,633,137 $ 1,633,137 $ 1,547,782 $ 1,508,906 $ 1,395,874 Adult Basic and Secondary Education 1,586,648 1,586,648 1,586,648 1,515,774 1,564,524 1,508,360 Advanced Technologies 2,707,847 2,707,847 2,707,847 2,550,359 2,485,143 2,446,903 Art & Applied Design 2,278,048 2,278,048 2,278,048 2,126,786 2,123,921 2,019,028 Business Development Center 643, , , , , ,282 Business & Computer Information Technologies 2,702,895 2,702,895 2,702,895 2,433,403 2,473,542 2,451,629 Continuing Education 1,803,868 1,803,868 1,803,868 1,700,312 1,672,564 1,680,764 Cooperative Education 1,777,898 1,777,898 1,777,898 1,796,542 1,583,424 1,587,674 Culinary Arts & Hospitality 666, , , , , ,104 English as a Second Language 1,162,542 1,162,542 1,162,542 1,129,940 1,127,380 1,170,025 Health & Physical Education 2,343,163 2,343,163 2,343,163 2,023,671 1,901,264 1,922,252 Health Professions 5,451,903 5,451,903 5,451,903 4,715,771 4,455,874 4,293,932 at Cottage Grove 446, , , , , ,336 at Florence 636, , , , , ,725 Language, Literature and Communication 5,111,432 5,111,432 5,111,432 4,806,478 4,738,082 4,489,431 Mathematics 3,030,850 3,030,850 3,030,850 2,794,872 2,671,938 2,474,275 Music/Dance/Theatre Arts 1,556,681 1,556,681 1,556,681 1,382,387 1,406,422 1,365,171 Science 3,326,244 3,326,244 3,326,244 3,169,081 3,260,728 3,100,133 Social Science 3,068,195 3,068,195 3,068,195 3,010,420 2,990,160 2,839,956 Special Instructional Projects 6,112,654 6,112,654 6,112,654 4,345, , ,303 Total Instruction $ 48,045,702 $ 48,045,702 $ 48,045,702 $ 43,327,701 $ 38,832,476 $ 37,023,157 - Continued Fund I: General Fund/Expenditures
40 GENERAL FUND I Fiscal Year Fiscal Year Fiscal Year Fiscal Year Fiscal Year Fiscal Year ADOPTED APPROVED PROPOSED CURRENT ACTUAL ACTUAL Budget Budget Budget Budget Amounts Amounts Instructional Support Academic & Student Affairs Office $ 1,011,716 $ 1,011,716 $ 1,011,716 $ 1,080,994 $ 1,045,101 $ 821,620 Academic Technology 1,299,581 1,299,581 1,299,581 1,142, , ,519 Grant Coordination 245, , , , ,803 92,516 High School Connections 109, , , , , ,398 Library 1,161,920 1,161,920 1,161,920 1,119,171 1,024,428 1,125,975 Professional Development - Faculty 399, , , , , ,646 Special Instructional Projects 349, , , , , ,668 Total Instructional Support $ 4,576,776 $ 4,576,776 $ 4,576,776 $ 4,285,594 $ 3,487,921 $ 3,269,343 Student Services Conference & Culinary Services $ 324,076 $ 324,076 $ 324,076 $ 232,506 $ 218,178 $ 310,506 Counseling 3,034,420 3,034,420 3,034,420 2,772,141 2,507,240 2,560,282 Disability Services 685, , , , , ,756 Enrollment & Student Financial Services 2,131,598 2,131,598 2,131,598 2,091,916 2,060,702 1,873,303 Financial Aid 991, , , , , ,510 International Student Program * ,240 Student Life & Leadership Development 568, , , , , ,274 Women's Program 437, , , , , ,296 Total Student Services $ 8,173,593 $ 8,173,593 $ 8,173,593 $ 7,668,546 $ 7,399,617 $ 7,166,928 * Moved from Fund IX, FY Moved to Fund VI, FY Continued Fund I: General Fund/Expenditures
41 GENERAL FUND I Fiscal Year Fiscal Year Fiscal Year Fiscal Year Fiscal Year Fiscal Year ADOPTED APPROVED PROPOSED CURRENT ACTUAL ACTUAL Budget Budget Budget Budget Amounts Amounts College Support Services Archives & Records Management $ 37,824 $ 37,824 $ 37,824 $ 32,328 $ 35,270 $ 36,550 Board of Education 20,000 20,000 20,000 20,000 33,366 23,398 College Finance 1,104,817 1,104,817 1,104,817 1,082, , ,647 College Operations Office 296, , , , , ,391 Curriculum & Scheduling 233, , , , , ,569 Governance & Administration 529, , , , , ,350 Human Resources 1,217,494 1,217,494 1,217,494 1,209, ,269 1,023,913 Infrastructure Technology 3,537,027 3,537,027 3,537,027 3,619,200 4,053,154 3,361,086 Institutional Research, Assessment & Planning 451, , , , , ,951 Foundation 531, , , , , ,650 Legal, Accounting & Administrative 1,208,500 1,208,500 1,208,500 1,161,500 1,297, ,649 Mail Services 173, , , , , ,978 Marketing & Public Relations 693, , , , , ,645 President's Office 879, , , , , ,207 Public Safety 700, , , , , ,840 Sustainability 367, , , , , ,890 Total College Support Services $ 11,983,202 $ 11,983,202 $ 11,983,202 $ 11,982,472 $ 12,257,988 $ 10,859,713 Plant Operation & Maintenance Facilities Management & Planning $ 5,898,875 $ 5,898,875 $ 5,898,875 $ 5,881,954 $ 5,591,473 $ 5,201,166 Total Plant Operation & Maintenance $ 5,898,875 $ 5,898,875 $ 5,898,875 $ 5,881,954 $ 5,591,473 $ 5,201,166 Financial Aid Financial Aid Transfer $ - $ - $ - $ 385,275 $ 1,490,685 $ 277,563 Total Financial Aid $ - $ - $ - $ 385,275 $ 1,490,685 $ 277,563 - Continued Fund I: General Fund/Expenditures
42 GENERAL FUND I Fiscal Year Fiscal Year Fiscal Year Fiscal Year Fiscal Year Fiscal Year ADOPTED APPROVED PROPOSED CURRENT ACTUAL ACTUAL Budget Budget Budget Budget Amounts Amounts Debt Service Debt Service Transfer $ - $ - $ - $ 290,550 $ 302,770 $ 314,990 Total Debt Service $ - $ - $ - $ 290,550 $ 302,770 $ 314,990 Transfer Out: To Internal Service Fund II $ 372,657 $ 372,657 $ 372,657 $ 27,140 $ 384,705 $ 407,767 To Capital Projects Fund IV 1,000,000 1,000,000 1,000,000 1,000,000 1,702,463 1,714,785 To Enterprise Fund VI 167, , , , , ,327 To Special Revenue Fund VIII ,500 To Special Revenue-Admin Restricted Fund IX 1,568,259 1,568,259 1,568,259 1,395,549 2,461,704 1,586,567 Total Transfer Out $ 3,108,373 $ 3,108,373 $ 3,108,373 $ 2,583,784 $ 4,989,262 $ 4,049,946 Contingency Projects/Provisions $ 5,778,279 $ 5,778,279 $ 5,778,279 $ 6,749,047 $ - $ - Total Contingency $ 5,778,279 $ 5,778,279 $ 5,778,279 $ 6,749,047 $ - $ - Total Operating Expenditures $ 87,564,800 $ 87,564,800 $ 87,564,800 $ 83,154,924 $ 74,352,192 $ 68,162,806 Unappropriated Ending Fund Balance (UEFB) 2,900,000 2,900,000 2,900,000 2,300, TOTAL EXPENDITURES AND OTHER REQUIREMENTS-GENERAL FUND I $ 90,464,800 $ 90,464,800 $ 90,464,800 $ 85,454,924 $ 74,352,192 $ 68,162,806 SUMMARY OF GENERAL FUND RESOURCES AND REQUIREMENTS Total Operating Revenues $ 85,137,444 $ 85,137,444 $ 85,137,444 $ 82,254,924 $ 71,382,316 $ 74,276,252 Less: Total Operating Expenditures 90,464,800 90,464,800 90,464,800 85,454,924 74,352,192 68,162,806 Excess of revenues over (under) expenditures $ (5,327,356) $ (5,327,356) $ (5,327,356) $ (3,200,000) $ (2,969,876) $ 6,113,446 Beginning Fund Balance 5,327,356 5,327,356 5,327,356 3,200,000 3,297,148 (2,816,297) Ending Fund Balance $ - $ - $ - $ - $ 327,270 $ 3,297, Fund I: General Fund/Expenditures

43 Capital Outlay 1% Materials & Services 14% BUDGETED REQUIREMENTS BY EXPENDITURES CATEGORY Fiscal Year General Fund Transfers Out 3% Contingency 6% Personal Services 76%
44 REQUIREMENTS BY EXPENDITURES CATEGORY - GENERAL FUND Fiscal Year ADOPTED Personal Materials Capital Transfers Debt Budget Services & Services Outlay Out Service Contingency Instruction Academic Learning Skills $ 1,633,137 $ 1,594,162 $ 38,975 $ - $ - $ - $ - Adult Basic and Secondary Education 1,586,648 1,521,233 65, Advanced Technologies 2,707,847 2,401, , Art & Applied Design 2,278,048 2,069, , Business Development Center 643, ,635 12, Business & Computer Information Technologies 2,702,895 2,535, , Continuing Education 1,803,868 1,160, , Cooperative Education 1,777,898 1,681,248 96, Culinary Arts & Hospitality 666, , , English as a Second Language 1,162,542 1,133,592 28, Health & Physical Education 2,343,163 1,788, , Health Professions 5,451,903 4,545, , at Cottage Grove 446, , , at Florence 636, ,876 97, Language, Literature & Communication 5,111,432 5,001, , Mathematics 3,030,850 2,956,975 73, Music/Dance/Theatre Arts 1,556,681 1,440, , Science 3,326,244 3,145, , Social Science 3,068,195 3,020,595 47, Special Instructional Projects 6,112,654 6,112, Total Instruction $ 48,045,702 $ 44,086,684 $ 3,959,018 $ - $ - $ - $ - Instructional Support Academic & Student Affairs Office $ 1,011,716 $ 937,001 $ 74,715 $ - $ - $ - $ - Academic Technology 1,299,581 1,008, , Grant Coordination 245, ,306 4, High School Connections 109, ,783 5, Library 1,161, , , , Professional Development - Faculty 399,624 17, , Special Instructional Projects 349, ,466 35, Total Instructional Support $ 4,576,776 $ 3,520,347 $ 937,429 $ 119,000 $ - $ - $ - - Continued Fund I: General Fund/Expenditures by Category
45 REQUIREMENTS BY EXPENDITURES CATEGORY - GENERAL FUND Fiscal Year ADOPTED Personal Materials Capital Transfers Debt Budget Services & Services Outlay Out Service Contingency Student Services Conference & Culinary Services $ 324,076 $ 324,076 $ - $ - $ - $ - $ - Counseling 3,034,420 2,706, , Disability Resources 685, ,125 14, Enrollment Services & Student Financial Services 2,131,598 1,793, , Financial Aid 991, ,774 54, Student Life & Leadership Development 568, , , Women's Program 437, ,747 16, Total Student Services $ 8,173,593 $ 7,313,020 $ 860,573 $ - $ - $ - $ - College Support Services Archives & Records Management $ 37,824 $ 33,024 $ 4,800 $ - $ - $ - $ - Board of Education 20,000-20, College Finance 1,104,817 1,030,628 74, College Operations Office 296, ,638 33, Curriculum & Scheduling 233, ,908 7, Governance and Administration 529, , Human Resources 1,217, , , Infrastructure Technology 3,537,027 2,518, ,967 73, Institutional Research, Assessment & Planning 451, ,192 10, Foundation 531, , Legal, Accounting & Administrative 1,208,500-1,208, Mail Services 173, ,128 27, Marketing & Public Relations 693, , , President's Office 879, ,525 46, Public Safety 700, ,769 87, Sustainability 367, , , Total College Support Services $ 11,983,202 $ 7,990,244 $ 3,919,458 $ 73,500 $ - $ - $ - - Continued Fund I: General Fund/Expenditures by Category
46 REQUIREMENTS BY EXPENDITURES CATEGORY - GENERAL FUND Fiscal Year ADOPTED Personal Materials Capital Transfers Debt Budget Services & Services Outlay Out Service Contingency Plant Operation & Maintenance Facilities Management & Planning $ 5,898,875 $ 3,125,771 $ 2,773,104 $ - $ - $ - $ - Total Plant Operation & Maintenance $ 5,898,875 $ 3,125,771 $ 2,773,104 $ - $ - $ - $ - Transfer Out: To Internal Services Fund II $ 372,657 $ - $ - $ - 372,657 $ - $ - To Capital Projects Fund IV 1,000, ,000, To Enterprise Fund VI 167, , To Special Revenue Fund VIII To Special Revenue-Admin. Rest. Fund IX 1,568, ,568, Total Transfer Out $ 3,108,373 $ - $ - $ - $ 3,108,373 $ - $ - Contingency Projects/Provisions $ 5,778,279 $ 2,257,929 $ - $ 700,000 $ - $ - $ 2,820,350 Unappropriated Ending Fund Balance (UEFB) 2,900, ,900,000 Total Contingency $ 8,678,279 2,257,929 $ - $ 700,000 $ - $ - $ 5,720,350 Total - General Fund Functions $ 90,464,800 $ 68,293,995 $ 12,449,582 $ 892,500 $ 3,108,373 $ - $ 5,720,350 SUMMARY OF GENERAL FUND RESOURCES AND REQUIREMENTS Total Operating Revenues $ 85,137,444 Less: Total Operating Expenditures 90,464,800 Excess of revenues over (under) expenditures $ (5,327,356) Beginning Fund Balance 5,327,356 Ending Fund Balance $ Fund I: General Fund/Expenditures by Category


47 Instructional Fees 16% BUDGETED RESOURCES Fiscal Year Fund IX Contracts, Gifts, Donations 11% Tuition 6% Fees - Technology 18% Transfers In 13% Sale of Goods & Services 9% Other Fees & Charges 5% Non Mandatory Fees 9% Fees - Transportation 9% Fees- Student Health Clinic, 5% Student Services 27% College Support Services 10% BUDGETED REQUIREMENTS Fiscal Year Fund IX Transfers Out 3% Instruction 43% Community Services 17%
48 SPECIAL REVENUE FUND IX - ADMINISTRATIVELY RESTRICTED Fiscal Year Fiscal Year Fiscal Year Fiscal Year Fiscal Year Fiscal Year ADOPTED APPROVED PROPOSED CURRENT ACTUAL ACTUAL BUDGET Budget Budget Budget Amounts Amounts RESOURCES Intergovernmental $ 25,000 $ 25,000 $ 25,000 $ 25,000 $ 31,267 $ 26,004 Tuition & Fees: Tuition 670, , , , , ,340 Instructional Fees 1,865,800 1,865,800 1,865,800 1,822,200 1,730,114 1,493,395 Non-Mandatory Fees 1,034,300 1,034,300 1,034, , , ,851 Other Fees & Charges 612, , , , , ,544 Sale of Goods and Services 1,006,645 1,006,645 1,006,645 1,043,700 1,147,547 1,198,745 Interest Income 17,500 17,500 17,500 17,500 10,131 27,808 Contracts, Gifts, Donations 1,360,300 1,360,300 1,360,300 1,365, ,571 1,326,451 Fees - Student Health Clinic 438, , , , Fees-Technology 2,185,780 2,185,780 2,185,780 1,935,780 1,063, ,738 Fees-Transportation 1,098,000 1,098,000 1,098, , , ,012 Transfer In from General Fund I 1,568,259 1,568,259 1,568,259 1,395,549 2,461,424 1,586,567 Transfer In from Internal Service Fund II 1,000 1,000 1,000 1, Transfer In from Enterprise Fund VI 1,000 1,000 1,000 1, Transfer In from Endowment Fund IX Total Operating Revenues $ 11,884,544 $ 11,884,544 $ 11,884,544 $ 11,423,884 $ 9,932,728 $ 8,802,454 Beginning Fund Balance 654, , , ,000 3,809,074 4,216,857 TOTAL RESOURCES $ 12,538,544 $ 12,538,544 $ 12,538,544 $ 12,102,884 $ 13,741,802 $ 13,019,311 - Continued Fund IX: Special Revenue Fund Administratively Restricted Fund
49 SPECIAL REVENUE FUND IX - ADMINISTRATIVELY RESTRICTED EXPENDITURES AND OTHER REQUIREMENTS Fiscal Year Fiscal Year Fiscal Year Fiscal Year Fiscal Year Fiscal Year ADOPTED APPROVED PROPOSED CURRENT ACTUAL ACTUAL BUDGET Budget Budget Budget Amounts Amounts Instruction Advanced Technologies $ 25,500 $ 25,500 $ 25,500 $ 115,500 $ 60,156 $ 46,982 Child & Family Education 256, , , , , ,295 Contract Training 260, , , , , ,258 Energy Management Program 730, , , , , ,809 Flight Technology 1,268,200 1,268,200 1,268,200 1,268,200 1,188,800 1,205,132 Non-Reimbursed Instruction 290, , , , , ,799 Specialized Support Services 201, , , , , ,227 Student Restaurant 39,000 39,000 39,000 39,000 19,544 38,273 Technology Fee 2,235,780 2,235,780 2,235,780 1,985, , ,448 Total Instruction $ 5,306,886 $ 5,306,886 $ 5,306,886 $ 5,326,053 $ 3,822,531 $ 3,602,225 Instructional Support OSBDCN $ 5,000 $ 5,000 $ 5,000 $ 20,000 $ 13,830 $ 8,168 Regional Technical Education Coordination 85,000 85,000 85, ,000 53,152 80,851 Total Instructional Support $ 90,000 $ 90,000 $ 90,000 $ 150,000 $ 66,982 $ 89,020 Community Services KLCC FM Operations 1,661,564 1,661,564 1,661,564 1,711,564 1,472,880 2,255,862 KLCC FM Quasi-Endowment 495, , , , Total Community Services $ 2,156,564 $ 2,156,564 $ 2,156,564 $ 2,156,564 $ 1,472,880 $ 2,255,862 Student Services ASLCC 519, , , , , ,382 Athletics 639, , , , , ,353 Child & Family Education 1,008,563 1,008,563 1,008, , , ,888 International Students Program * ,012 Student Health Services 967, , , , , ,747 Student Productions Association 31,800 31,800 31,800 31,800 23,632 22,324 The Torch 188, , , , , ,170 Women's Program 67,700 67,700 67,700 37,700 11,798 14,974 Total Student Services $ 3,422,550 $ 3,422,550 $ 3,422,550 $ 3,051,222 $ 2,522,110 $ 2,429,851 *Moved to GF in FY Continued Fund IX: Special Revenue Fund Administratively Restricted Fund
50 SPECIAL REVENUE FUND IX - ADMINISTRATIVELY RESTRICTED Fiscal Year Fiscal Year Fiscal Year Fiscal Year Fiscal Year Fiscal Year ADOPTED APPROVED PROPOSED CURRENT ACTUAL ACTUAL BUDGET Budget Budget Budget Amounts Amounts College Support Services Staff Health Clinic $ 302,563 $ 302,563 $ 302,563 $ 291,670 $ 194,173 $ 265,398 Transportation 948, , , , , ,081 Total College Support Services $ 1,250,563 $ 1,250,563 $ 1,250,563 $ 1,133,265 $ 550,773 $ 676,479 Transfers Out: To General Fund I 3,600 3,600 3,600 3,600 3,600 6,800 To Capital Projects Fund IV 247, , , , , ,000 To Financial Aid Fund V 60,605 60,605 60,605 42,180 65,508 - To Enterprise Fund VI ,806 - Total Transfers Out $ 311,981 $ 311,981 $ 311,981 $ 285,780 $ 411,914 $ 156,800 TOTAL EXPENDITURES AND OTHER REQUIREMENTS $ 12,538,544 $ 12,538,544 $ 12,538,544 $ 12,102,884 $ 8,847,190 $ 9,210,237 SUMMARY OF SPECIAL REVENUE-ADMIN. REST. FUND RESOURCES AND REQUIREMENTS Total Operating Revenues $ 11,884,544 $ 11,884,544 $ 11,884,544 $ 11,423,884 $ 9,932,728 $ 8,802,454 Less: Total Operating Expenditures 12,538,544 12,538,544 12,538,544 12,102,884 8,847,190 9,210,237 Excess of Revenues, over (under) Expenditures $ (654,000) $ (654,000) $ (654,000) $ (679,000) $ 1,085,538 $ (407,783) Beginning Fund Balance 654, , , ,000 3,809,074 4,216,857 Ending Fund Balance $ - $ - $ - $ - $ 4,894,612 $ 3,809, Fund IX: Special Revenue Fund Administratively Restricted Fund
51 INTERNAL SERVICE FUND II DEBT SERVICE FUND III CAPITAL PROJECTS FUND IV FINANCIAL AID FUND V ENTERPRISE FUND VI SPECIAL REVENUE FUND VIII

52 Transf ers In 23% BUDGETED RESOURCES Fiscal Year Fund II Sale of Goods & Services 77% BUDGETED REQUIREMENTS Fiscal Year Fund II College Support Services 100%
53 INTERNAL SERVICE FUND II Fiscal Year Fiscal Year Fiscal Year Fiscal Year Fiscal Year Fiscal Year ADOPTED APPROVED PROPOSED CURRENT ACTUAL ACTUAL Budget Budget Budget Budget Amounts Amounts RESOURCES Other Sources: Sale of Goods & Services $ 1,238,114 $ 1,238,114 $ 1,238,114 $ 1,222,614 $ 1,209,768 $ 1,145,771 Transfer In from General Fund I 372, , , , , ,767 Total Operating Revenues $ 1,610,771 $ 1,610,771 $ 1,610,771 $ 1,469,205 $ 1,594,473 $ 1,553,538 Beginning Fund Balance 283, , , , , ,985 TOTAL RESOURCES $ 1,893,771 $ 1,893,771 $ 1,893,771 $ 1,672,205 $ 1,898,923 $ 1,717,523 EXPENDITURES AND OTHER REQUIREMENTS REQUIREMENTS College Support Services Employee Wellness $ 155,044 $ 155,044 $ 155,044 $ 127,140 $ 132,824 $ 132,619 Motor Pool 121, , ,000 46,000 77,073 35,565 Printing & Graphics 836, , , , , ,580 Telephone Services 677, , , , , ,867 Warehouse Services 100, , ,000 80,000 71,044 54,443 Transfer Out: To General Fund I 3,500 3,500 3,500 3, To Special Revenue-Admin Rest. Fund IX 1,000 1,000 1,000 1, TOTAL EXPENDITURES AND OTHER REQUIREMENTS $ 1,893,771 $ 1,893,771 $ 1,893,771 $ 1,672,205 $ 1,521,804 $ 1,413,073 SUMMARY OF INTERNAL SERVICE FUND RESOURCES AND REQUIREMENTS Total Operating Revenues $ 1,610,771 $ 1,610,771 $ 1,610,771 $ 1,469,205 $ 1,594,473 $ 1,553,538 Less: Total Operating Expenditures 1,893,771 1,893,771 1,893,771 1,672,205 1,521,804 1,413,073 Excess of Revenues, over (under) Expenditures $ (283,000) $ (283,000) $ (283,000) $ (203,000) $ 72,669 $ 140,465 Beginning Fund Balance 283, , , , , ,985 Ending Fund Balance $ - $ - $ - $ - $ 377,119 $ 304, Fund II: Internal Service Fund
54 Payroll Charge (Pension Obligation Bonds) 37% BUDGETED RESOURCES FOR RELATED DEBT OBLIGATIONS Fiscal Year Fund III Property Taxes (General Obligation Bonds) 63% BUDGETED REQUIREMENTS Fiscal Year Fund III Interest Expense 33% Principal Payments 67%
55 DEBT SERVICE FUND III Fiscal Year Fiscal Year Fiscal Year Fiscal Year Fiscal Year Fiscal Year ADOPTED APPROVED PROPOSED CURRENT ACTUAL ACTUAL BUDGET Budget Budget Budget Amounts Amounts GENERAL OBLIGATION BONDS, 2009 * Resources Intergovernmental (Property Taxes) $ 5,874,612 $ 5,874,612 $ 5,874,612 $ 5,581,302 $ - $ - Total Operating Revenues $ 5,874,612 5,874,612 5,874,612 5,581, Beginning Fund Balance Total Resources $ 5,874,612 $ 5,874,612 $ 5,874,612 $ 5,581,302 $ - $ - Expenditures and Other Requirements Principal Payments $ 4,360,000 $ 4,360,000 $ 4,360,000 $ 3,985,000 $ - $ - Interest Expense 1,514,612 1,514,612 1,514,612 1,596, Total Expenditures and Other Requirements $ 5,874,612 $ 5,874,612 $ 5,874,612 $ 5,581,302 $ - $ - Summary of General Obligation Bonds Total Operating Revenues $ 5,874,612 $ 5,874,612 $ 5,874,612 $ 5,581,302 $ - $ - Less: Total Operating Expenditures 5,874,612 5,874,612 5,874,612 5,581, Excess of Revenues, over (under) Expenditures $ - $ - $ - $ - $ - $ - Beginning Fund Balance Ending Balance $ - $ - $ - $ - $ - $ - * The college issued $45MM of the total $83MM voter approved GO Bonds in June, Continued Fund III: Debt Service Fund
56 DEBT SERVICE FUND III Fiscal Year Fiscal Year Fiscal Year Fiscal Year Fiscal Year Fiscal Year ADOPTED APPROVED PROPOSED CURRENT ACTUAL ACTUAL BUDGET Budget Budget Budget Amounts Amounts PENSION OBLIGATION BONDS Resources Interest Income $ 250 $ 250 $ 250 $ 250 $ 16,485 $ 72,805 Revenue Allocation - Employee Fringe 3,454,250 3,454,250 3,454,250 3,279,000 3,109,250 2,949,250 Total Operating Revenues $ 3,454,500 $ 3,454,500 $ 3,454,500 $ 3,279,250 $ 3,125,735 $ 3,022,055 Beginning Fund Balance , ,745 Total Resources $ 3,454,500 $ 3,454,500 $ 3,454,500 $ 3,279,250 $ 3,554,183 $ 3,379,800 Expenditures and Other Requirements Principal Payments $ 1,925,000 $ 1,925,000 $ 1,925,000 $ 1,750,000 $ 1,225,464 $ 1,420,000 Interest Expense 1,529,500 1,529,500 1,529,500 1,529,250 1,885,386 1,531,352 Total Expenditures and Other Requirements $ 3,454,500 $ 3,454,500 $ 3,454,500 $ 3,279,250 $ 3,110,850 $ 2,951,352 Summary of Pension Obligation Bonds Total Operating Revenues $ 3,454,500 $ 3,454,500 $ 3,454,500 $ 3,279,250 $ 3,125,735 $ 3,022,055 Less: Total Operating Expenditures 3,454,500 3,454,500 3,454,500 3,279,250 3,110,850 2,951,352 Excess of Revenues, over (under) Expenditures $ - $ - $ - $ - $ 14,885 $ 70,703 Beginning Fund Balance , ,745 Ending Balance $ - $ - $ - $ - $ 443,333 $ 428,448 - Continued Fund III: Debt Service Fund
57 DEBT SERVICE FUND III Fiscal Year Fiscal Year Fiscal Year Fiscal Year Fiscal Year Fiscal Year ADOPTED APPROVED PROPOSED CURRENT ACTUAL ACTUAL BUDGET Budget Budget Budget Amounts Amounts FULL FAITH & CREDIT OBLIGATIONS, SERIES 1992 Resources Transfer In from General Fund I $ - $ - $ - $ 290,550 $ 302,770 $ 314,990 Total Operating Revenues $ - $ - $ - $ 290,550 $ 302,770 $ 314,990 Beginning Fund Balance Total Resources $ - $ - $ - $ 290,550 $ 302,770 $ 314,990 Expenditures and Other Requirements Principal Payments $ - $ - $ - $ 260,000 $ 260,000 $ 260,000 Interest Expense ,550 42,770 54,990 Total Expenditures and Other Requirements $ - $ - $ - $ 290,550 $ 302,770 $ 314,990 Summary of Full Faith & Credit Debt Obligations Total Operating Revenues $ - $ - $ - $ 290,550 $ 302,770 $ 314,990 Less: Total Operating Expenditures , , ,990 Excess of Revenues, over (under) Expenditures $ - $ - $ - $ - $ - $ - Beginning Fund Balance Ending Balance $ - $ - $ - $ - $ - $ - - Continued Fund III: Debt Service Fund
58 DEBT SERVICE FUND III Fiscal Year Fiscal Year Fiscal Year Fiscal Year Fiscal Year Fiscal Year ADOPTED APPROVED PROPOSED CURRENT ACTUAL ACTUAL BUDGET Budget Budget Budget Amounts Amounts GENERAL OBLIGATION BONDS, 1995 * Resources Intergovernmental (Property Taxes) $ - $ - $ - $ - $ 5,988,580 $ 4,809,837 Total Operating Revenues $ ,988,580 4,809,837 Beginning Fund Balance 100, , , ,655 1,062,236 Total Resources $ 100,000 $ 100,000 $ 100,000 $ - $ 6,283,235 $ 5,872,073 Expenditures and Other Requirements Principal Payments $ - $ - $ - $ - $ 5,545,000 $ 5,055,000 Interest Expense , ,418 Transfer Out to General Fund I 100, , , Total Expenditures and Other Requirements $ 100,000 $ 100,000 $ 100,000 $ - $ 5,822,400 $ 5,577,418 Summary of General Obligation Bonds Total Operating Revenues $ - $ - $ - $ - $ 5,988,580 $ 4,809,837 Less: Total Operating Expenditures 100, , ,000-5,822,400 5,577,418 Excess of Revenues, over (under) Expenditures $ (100,000) $ (100,000) $ (100,000) $ - $ 166,180 $ (767,581) Beginning Fund Balance 100, , , ,655 1,062,236 Ending Balance $ - $ - $ - $ - $ 460,835 $ 294,655 * Fully retired in FY SUMMARY OF DEBT SERVICE FUND RESOURCES AND REQUIREMENTS Total Operating Revenues $ 9,329,112 $ 9,329,112 $ 9,329,112 $ 9,151,102 $ 9,417,085 $ 8,146,882 Less: Total Operating Expenditures 9,429,112 9,429,112 9,429,112 9,151,102 9,236,020 8,843,760 Excess of Revenues, over (under) Expenditures $ (100,000) $ (100,000) $ (100,000) $ - $ 181,065 $ (696,878) Beginning Fund Balance 100, , , ,103 1,419,981 Ending Fund Balance $ - $ - $ - $ - $ 904,168 $ 723, Fund III: Debt Service Fund


59 Interest, Donations and Ref unds 19% BUDGETED RESOURCES Fiscal Year Fund IV Transf ers In 5% Intergovernmental 63% Plant Additions 95% BUDGETED REQUIREMENTS Fiscal Year Fund IV College Support Services 2% Plant Operations & Maintenance 3%
60 CAPITAL PROJECTS FUND IV Fiscal Year Fiscal Year Fiscal Year Fiscal Year Fiscal Year Fiscal Year ADOPTED APPROVED PROPOSED CURRENT ACTUAL ACTUAL BUDGET Budget Budget Budget Amounts Amounts RESOURCES Intergovernmental $ 20,000,000 $ 20,000,000 $ 20,000,000 $ 19,650,000 $ 3,455,495 $ - Other Sources: Interest Income 1,500 1,500 1,500 50,000 34,977 49,641 Donations, Special Allocations, Vendor Refunds 5,000,000 5,000,000 5,000,000 10,460,000 3,268, ,964 Proceeds from Sale of Bonds ,903,768 - Transfer In from General Fund I 1,000,000 1,000,000 1,000,000 1,000,000 1,702,463 1,714,785 Fund IX 247, , , , , ,000 Total Operating Revenues $ 26,249,276 $ 26,249,276 $ 26,249,276 $ 31,400,000 $ 54,693,510 $ 2,113,390 Beginning Fund Balance 761, , ,150 8,223,000 1,432,141 1,015,914 TOTAL RESOURCES $ 27,010,426 $ 27,010,426 $ 27,010,426 $ 39,623,000 $ 56,125,651 $ 3,129,304 EXPENDITURES AND OTHER REQUIREMENTS College Support Services Information Technology (LASR Project) $ 407,150 $ 407,150 $ 407,150 $ 150,000 $ 36,472 $ 44,502 Plant Operation & Maintenance Facilities Management & Planning 901, , ,500 1,280,000 1,336,638 1,293,049 GoOregon - State Deferred Maintenance ,500,000 3,482,858 - Plant Additions Bond Project 20,000,000 20,000,000 20,000,000 14,500,000 1,223,760 53,493 Facilities Management & Planning 701, , ,776 1,193,000 1,254, ,455 Health & Wellness Bldg 5,000,000 5,000,000 5,000,000 15,000,000 1,201,762 9,664 Transfer Out: To General Fund I TOTAL EXPENDITURES AND OTHER REQUIREMENTS $ 27,010,426 $ 27,010,426 $ 27,010,426 $ 39,623,000 $ 8,536,203 $ 1,697,163 - continued Fund IV: Capital Projects Fund
61 CAPITAL PROJECTS FUND IV Fiscal Year Fiscal Year Fiscal Year Fiscal Year Fiscal Year Fiscal Year ADOPTED APPROVED PROPOSED CURRENT ACTUAL ACTUAL BUDGET Budget Budget Budget Amounts Amounts SUMMARY OF CAPITAL PROJECTS FUND RESOURCES AND REQUIREMENTS Total Operating Revenues $ 26,249,276 $ 26,249,276 $ 26,249,276 $ 31,400,000 $ 54,693,510 $ 2,113,390 Less: Total Operating Expenditures 27,010,426 27,010,426 27,010,426 39,623,000 8,536,203 1,697,163 Excess of Revenues, over (under) Expenditures $ (761,150) $ (761,150) $ (761,150) $ (8,223,000) $ 46,157,307 $ 416,227 Beginning Fund Balance 761, , ,150 8,223,000 1,432,141 1,015,914 Ending Fund Balance $ - $ - $ - $ - $ 47,589,448 $ 1,432, Fund IV: Capital Projects Fund


62 Other Sources 3% BUDGETED RESOURCES Fiscal Year Fund V Intergovernmental 97% BUDGETED REQUIREMENTS Fiscal Year Fund V College Workstudy 1% Financial Aid 99%
63 FINANCIAL AID FUND V Fiscal Year Fiscal Year Fiscal Year Fiscal Year Fiscal Year Fiscal Year ADOPTED APPROVED PROPOSED CURRENT ACTUAL ACTUAL BUDGET Budget Budget Budget Amounts Amounts RESOURCES Intergovernmental $ 94,078,000 $ 94,078,000 $ 94,078,000 $ 92,143,000 $ 58,585,132 $ 38,963,755 Other Sources: Interest Income 75,000 75,000 75,000 75,000 53, ,692 Scholarships, Local Grants 2,575,000 2,575,000 2,575,000 1,370,000 2,224,768 1,777,321 Transfer In from General Fund I ,275 1,490, ,563 Transfer In from Special Revenue-Admin. Rest. Fund IX 60,605 60,605 60,605 42,180 65,508 - Total Operating Revenues $ 96,788,605 $ 96,788,605 $ 96,788,605 $ 94,315,455 $ 62,419,311 $ 41,271,330 Beginning Fund Balance 1,229,500 1,229,500 1,229,500 89, , ,267 TOTAL RESOURCES $ 98,018,105 $ 98,018,105 $ 98,018,105 $ 94,404,455 $ 62,742,341 $ 41,949,597 EXPENDITURES AND OTHER REQUIREMENTS Student Services * Career & Employment Services $ - $ - $ - $ 300,000 $ 492,057 $ 265,972 Financial Aid College Workstudy 822, , , , , ,834 Financial Aid 97,195,757 97,195,757 97,195,757 93,282,107 60,497,647 40,823,762 Transfer Out: Transfer Out to General Fund ,000 TOTAL EXPENDITURES AND OTHER REQUIREMENTS $ 98,018,105 $ 98,018,105 $ 98,018,105 $ 94,404,455 $ 61,428,134 $ 41,626,567 * This expense function for college-funded student workers moved to General Fund / Student Services / Counseling, effective continued Fund V: Financial Aid Fund
64 Fiscal Year Fiscal Year Fiscal Year Fiscal Year Fiscal Year Fiscal Year ADOPTED APPROVED PROPOSED CURRENT ACTUAL ACTUAL BUDGET Budget Budget Budget Amounts Amounts SUMMARY OF FINANCIAL AID FUND RESOURCES AND REQUIREMENTS Total Operating Revenues $ 96,788,605 $ 96,788,605 $ 96,788,605 $ 94,315,455 $ 62,419,311 $ 41,271,330 Less: Total Operating Expenditures 98,018,105 98,018,105 98,018,105 94,404,455 61,428,134 41,626,567 Excess of Revenues, over (under) Expenditures $ (1,229,500) $ (1,229,500) $ (1,229,500) $ (89,000) $ 991,176 $ (355,237) Beginning Fund Balance 1,229,500 1,229,500 1,229,500 89, , ,267 Ending Fund Balance $ - $ - $ - $ - $ 1,314,206 $ 323, Fund V: Financial Aid Fund
65 BUDGETED RESOURCES Fiscal Year Fund VI Transf ers In 1% International Student Tuition and Fees 8% Sale of Goods & Services 91% BUDGETED REQUIREMENTS Fiscal Year Fund VI Transf ers Out 1% College Support Services 4% Student Services 95%
66 ENTERPRISE FUND VI Fiscal Year Fiscal Year Fiscal Year Fiscal Year Fiscal Year Fiscal Year ADOPTED APPROVED PROPOSED CURRENT ACTUAL ACTUAL Budget Budget Budget Budget Amounts Amounts RESOURCES Sale of Goods & Services $ 12,725,000 $ 12,725,000 $ 12,725,000 $ 10,603,940 $ 9,966,755 $ 8,620,673 Other Fees: International Program * 1,181,100 1,181,100 1,181, , ,249 - Transfer In from General Fund I 167, , , , , ,327 Transfer In from Special Revenue-Admin. Rest. Fund IX ,806 - Total Operating Revenues $ 14,073,557 $ 14,073,557 $ 14,073,557 $ 11,579,600 $ 10,767,200 $ 8,951,000 Beginning Fund Balance 1,300,000 1,300,000 1,300, ,000 3,037,223 2,771,414 TOTAL RESOURCES $ 15,373,557 $ 15,373,557 $ 15,373,557 $ 12,554,600 $ 13,804,423 $ 11,722,414 EXPENDITURES AND OTHER REQUIREMENTS Instruction Performance Season $ - $ - $ - $ 22,000 $ 1,667 $ 8,405 Student Services ASLCC (Prior Years) ,384 Bookstore 10,075,000 10,075,000 10,075,000 7,496,939 7,063,099 5,911,327 Foodservices 2,427,567 2,427,567 2,427,567 2,632,226 1,678,193 1,467,674 Hospitality & Conference Services 922, , ,584 1,052, , ,729 International Student Program * 1,181,100 1,181,100 1,181, , College Support Services Laundry 617, , , , , ,726 Expenditures and Other Requirements Subtotal $ 15,223,708 $ 15,223,708 $ 15,223,708 $ 12,413,990 $ 9,931,395 $ 8,559,246 Transfer Out: To General Fund I $ 148,849 $ 148,849 $ 148,849 $ 139,610 $ 137,525 $ 125,945 To Special Revenue-Admin Rest. Fund IX 1,000 1,000 1,000 1, TOTAL EXPENDITURES AND OTHER REQUIREMENTS $ 15,373,557 $ 15,373,557 $ 15,373,557 $ 12,554,600 $ 10,068,920 $ 8,685,191 * International Student Program moved from Fund I, FY Continued Fund VI: Enterprise Fund
67 ENTERPRISE FUND VI Fiscal Year Fiscal Year Fiscal Year Fiscal Year Fiscal Year Fiscal Year ADOPTED APPROVED PROPOSED CURRENT ACTUAL ACTUAL Budget Budget Budget Budget Amounts Amounts SUMMARY OF ENTERPRISE FUND RESOURCES AND REQUIREMENTS Total Operating Revenues $ 14,073,557 $ 14,073,557 $ 14,073,557 $ 11,579,600 $ 10,767,200 $ 8,951,000 Less: Total Operating Expenditures 15,373,557 15,373,557 15,373,557 12,554,600 10,068,920 8,685,191 Excess of Revenues, over (under) Expenditures $ (1,300,000) $ (1,300,000) $ (1,300,000) $ (975,000) $ 698,279 $ 265,810 Beginning Fund Balance 1,300,000 1,300,000 1,300, ,000 3,037,223 2,771,414 Ending Fund Balance $ - $ - $ - $ - $ 3,735,502 $ 3,037, Fund VI: Enterprise Fund


68 Grants & Contracts 17% BUDGETED RESOURCES Fiscal Year Fund VIII Tuition & Fees 1% Intergovernmental 90% BUDGETED REQUIREMENTS Fiscal Year Fund VIII Community Services 36% Instruction 55% Student Services 9%
69 SPECIAL REVENUE FUND VIII RESOURCES Fiscal Year Fiscal Year Fiscal Year Fiscal Year Fiscal Year Fiscal Year ADOPTED APPROVED PROPOSED CURRENT ACTUAL ACTUAL Budget Budget Budget Budget Amounts Amounts Intergovernmental $ 15,000,000 $ 15,000,000 $ 15,000,000 $ 11,543,750 $ 9,267,863 $ 7,213,920 Tuition & Fees: Tuition 20,000 20,000 20,000 6,000 28,944 23,180 Instructional Fees 80,000 80,000 80,000 50,000 90, ,863 Other Sources: Grants & Contracts 3,100,000 3,100,000 3,100,000 1,291, , ,068 Transfer In from General Fund I ,500 Total Operating Revenues $ 18,200,000 $ 18,200,000 $ 18,200,000 $ 12,891,000 $ 10,088,602 $ 7,766,531 Beginning Fund Balance 200, , , , , ,109 TOTAL RESOURCES $ 18,400,000 $ 18,400,000 $ 18,400,000 $ 13,091,000 $ 10,267,524 $ 7,906,640 EXPENDITURES AND OTHER REQUIREMENTS Instruction Funded Projects $ 10,100,000 $ 10,100,000 $ 10,100,000 $ 7,093,000 $ 4,302,299 $ 3,842,858 Instructional Support Funded Projects 50,000 50,000 50, , Student Services Funded Projects 1,646,000 1,646,000 1,646, , , ,541 Community Services Funded Projects 6,550,000 6,550,000 6,550,000 4,860,800 4,689,880 3,620,320 College Support Services Funded Projects 50,000 50,000 50, ,000 8,747 - Expenditures and Other Requirements Subtotal $ 18,396,000 $ 18,396,000 $ 18,396,000 $ 13,087,000 $ 9,736,321 $ 7,727,719 Transfer Out: To General Fund I $ 4,000 $ 4,000 $ 4,000 $ 4,000 $ - $ - TOTAL EXPENDITURES AND OTHER REQUIREMENTS $ 18,400,000 $ 18,400,000 $ 18,400,000 $ 13,091,000 $ 9,736,321 $ 7,727,719 - Continued Fund VIII: Special Revenue Fund
70 SPECIAL REVENUE FUND VIII SUMMARY OF SPECIAL REVENUE FUND RESOURCES AND REQUIREMENTS Fiscal Year Fiscal Year Fiscal Year Fiscal Year Fiscal Year Fiscal Year ADOPTED APPROVED PROPOSED CURRENT ACTUAL ACTUAL Budget Budget Budget Budget Amounts Amounts Total Operating Revenues $ 18,200,000 $ 18,200,000 $ 18,200,000 $ 12,891,000 $ 10,088,602 $ 7,766,531 Less: Total Operating Expenditures 18,400,000 18,400,000 18,400,000 13,091,000 9,736,321 7,727,719 Excess of Revenues, over (under) Expenditures $ (200,000) $ (200,000) $ (200,000) $ (200,000) $ 352,282 $ 38,813 Beginning Fund Balance 200, , , , , ,109 Ending Fund Balance $ - $ - $ - $ - $ 531,204 $ 178, Fund VIII: Special Revenue Fund
71 PERSONAL SERVICES

72 Instruction Instructional Support Student Services Community Services College Support Services Plant Operations & Maintenance Plant Additions STAFF FTE LEVELS BY EXPENSE FUNCTION Fiscal Years 2008 through 2010 All Funds FY08 FY09 FY10 FY
73 FTE BY EXPENSE FUNCTION FY11 FY10 FY09 INSTRUCTION Academic Learning Skills Adult Basic and Secondary Education Advanced Technologies Art & Applied Design Business Development Center Business & Computer Information Technologies Child & Family Education Continuing Education Cooperative Education Culinary Arts & Hospitality Energy Management Program English as a Second Language Flight Technology Health & Physical Education Health Professions at Cottage Grove at Florence Learning Centers Language, Literature & Communication Mathematics Music/Dance/Theatre Arts Science Social Science Specialized Support Services Continued Personal Services/FTE by Expense Function
74 FTE BY EXPENSE FUNCTION FY11 FY10 FY09 INSTRUCTIONAL SUPPORT Academic & Student Affairs Office Academic Technology College Now Grant Coordination Library Professional Development - Faculty Special Instructional Projects STUDENT SERVICES Academic & Student Affairs Office - - ASLCC Legal Services Athletics Bookstore Child & Family Education Conference & Culinary Services Counseling Disability Services English as a Second Language Enrollment Services Foodservices International Student Program Student Financial Services Student Health Student Life & Leadership The Torch Womens Program Continued Personal Services/FTE by Expense Function
75 FTE BY EXPENSE FUNCTION FY11 FY10 FY09 COMMUNITY SERVICES KLCC Administration COLLEGE SUPPORT SERVICES College Finance College Operations Office Curriculum & Scheduling Employee Wellness Human Resources Infrastructure Technology Institutional Research, Assessment & Planning Foundation Laundry Library Mail Services Marketing & Public Relations President's Office Printing & Graphics Public Safety Staff Health Clinic Sustainability PLANT OPERATIONS & MAINTENANCE Facilities Administration PLANT ADDITIONS Project Management & Planning Small Capital Projects TOTALS Personal Services/FTE by Expense Function
76 SALARIES PAID FROM MORE THAN ONE SOURCE Position Title Fund Division/Department Expense Function FY11 Adopted Budget Salary Split Total 1. Faculty Instructor 1 Institutional Research, Assessment & Planning College Support Services 37,030 Faculty Instructor 1 Curriculum & Scheduling College Support Services 37, Faculty Instructor 1 Health Professions Instruction 56,053 Faculty Instructor 1 Cooperative Education Instruction 14, Faculty Instructor 1 Cooperative Education Instruction 35,033 Faculty Instructor 1 Social Science Instruction 35, Faculty Instructor 1 Social Science Instruction 44,436 Faculty Instructor 1 Cooperative Education Instruction 29, Director - Spec Support Svcs 9 Specialized Support Services Instruction 34,733 Director - Spec Support Svcs 6 Laundry College Support Services 19, Faculty Instructor 1 Cooperative Education Instruction 19,586 Faculty Instructor 1 Art & Applied Design Instruction 33, Faculty Instructor 1 Academic Technology Instructional Support 27,076 Faculty Instructor 1 Art & Applied Design Instruction 27, Faculty Nurse 9 Staff Health Clinic Student Services 31,371 Faculty Nurse 9 Student Health Services Student Services 31, Director -ESL & Int Programs 1 English as a Second Language Instruction 42,202 Director -ESL & Int Programs 1 Academic Learning Skills Instruction 42, Administrative Specialist 9 Student Life & Leadership Development Student Services 10,618 Administrative Specialist 9 ASLCC Student Services 10,618 Administrative Specialist 1 Student Life & Leadership Development Student Services 21, Faculty Instructor 1 Culinary Arts & Hospitality Instruction 54,030 Faculty Instructor 1 Cooperative Education Instruction 13,507 $ 74,060 $ 70,066 $ 70,066 $ 74,059 $ 53,950 $ 52,679 $ 54,152 $ 62,742 $ 84,404 $ 42,473 $ 67, Personal Services/FTE by Expense Function
77 SALARIES PAID FROM MORE THAN ONE SOURCE FY11 Adopted Budget Salary Position Title Fund Division/Department Expense Function Split Total 12. Faculty Instructor 1 Health & Physical Education Instruction 67,537 Faculty Instructor 9 Athletics Student Services 6,754 $ 74, Faculty Instructor 1 Social Science Instruction 29,623 Faculty Instructor 1 Cooperative Education Instruction 44,436 $ 74, Maintenance Helper 4 Facilities Management & Planning Plant Additions 6,042 Maintenance Helper 4 Bond Projects Plant Additions 559 $ 6, Faculty Instructor 1 Cooperative Education Instruction 13,507 Faculty Instructor 1 Health Professions Instruction 54,030 $ 67, Network Administration Spc-I 1 Science Instruction 54,317 Network Administration Spc-I 1 Information Technology Instructional Support 4,723 $ 59, Faculty Instructor 1 Health & Physical Education Instruction 14,183 Faculty Instructor 9 Athletics Student Services 53,354 $ 67, Faculty Instructor 1 Art & Applied Design Instruction 62,742 Faculty Instructor 1 Cooperative Education Instruction 15,686 $ 78, Exec Asst to the President 1 Marketing & Public Relations College Support Services 38,729 Exec Asst to the President 1 President's Office College Support Services 38,729 $ 77, Faculty Instructor 1 Cooperative Education Instruction 13,507 Faculty Instructor 1 Health Professions Instruction 54,744 $ 68, Administrative Specialist 1 Art & Applied Design Instruction 21,237 Archives & Records Mgmt Spec 1 Library College Support Services 21,237 $ 42, Administrative Support Special 1 Academic Learning Skills Instruction 28,131 Administrative Support Special 1 Counseling Student Services 9,377 $ 37, Administrative Coordinator 1 Human Resources College Support Services 11,025 Administrative Coordinator 1 Special Instructional Projects Instructional Support 22,050 Administrative Coordinator 1 Professional Development - Faculty Instructional Support 11,025 $ 44, Personal Services/FTE by Expense Function

78 APPENDICES A: FINANCIAL POLICIES B: PERFORMANCE MEASURES C: FINANCIAL PLANNING D: LOCAL & REGIONAL INFORMATION E: ECONOMIC FORECAST F: LEGAL NOTIFICATIONS G: GLOSSARY OF TERMS
79 Financial Policies Board of Education Policy A.040: Financial Planning and Budgeting Adopted ; Last Reviewed/Revised Financial planning for any fiscal year or the remaining part of any fiscal year shall reflect the Board's end priorities, avoid fiscal jeopardy, and shall be derived from a multi-year plan. Accordingly, the president shall assure budgeting that: 1. Complies with Oregon Local Budget Law. 2. Contains sufficient information to enable credible projections of resources and expenditures as presented in the Budget Document in accordance with Oregon Local Budget Law. 3. Discloses planning assumptions. 4. Limits expenditures in any fiscal year to conservatively projected resources for that period. 5. Maintains current assets at any time to at least twice current liabilities. 6. Complies with budget and financial policies contained in Section E. Policy A.050: Financial Conditions and Activities Adopted ; Last Reviewed/Revised With respect to the actual, on-going financial condition and activities, the president shall avoid fiscal jeopardy and assure that actual expenditures reflect Board priorities as established in ends policies. Accordingly, the president shall: 1. Not expend more funds than have been received in the fiscal year to date, except as approved by the Board. 2. Not use any long-term reserves that are not budgeted and appropriated for expenditure. 3. Settle payroll and debts in a timely manner. 4. Assure that tax payments or other government-ordered payments or filings be on time and accurately filed. 5. Make no single purchase or commitment of greater than $100,000 for goods and services contracts, or $150,000 for public improvements contracts, without Board approval, except in extreme emergencies. 6. Acquire, encumber, or dispose of real property only with Board approval, except in extreme emergencies. 7. Pursue receivables aggressively after a reasonable grace period. 8. Comply with budget and financial policies contained in Section E. 9. Not contract with the college s independent auditors for non-audit services without prior approval of the Board. Provide the following annual certifications, by the president and by the vice president for college operations, to the Board upon receipt of the audited financial statements: A. He/she has reviewed the annual audit report; -A1- Appendix A: Financial Policies
80 B. Based on his/her knowledge, the report does not contain any untrue statement of a material fact or omission of a material fact that makes the financial statements misleading; C. Based on his/her knowledge, the financial statements present in all material respects the financial condition and results of operations. 10. Establish and maintain an adequate internal control structure and procedures for financial operations and reporting. Policy A.070: Asset Protection Adopted ; Last Reviewed/Revised The president shall assure that assets are protected, adequately maintained, and not placed at risk. Accordingly, the president shall: 1. Insure against theft and casualty losses and against liability losses to Board members, staff, and the organization itself in an amount similar to the average for comparable organizations. 2. Prevent uninsured personnel from access to material amounts of funds. 3. Assure that plant and equipment are not subjected to improper wear and tear or insufficient maintenance. 4. Assure that the organization, its Board, or staff, are not unnecessarily exposed to claims of liability. 5. Assure that every purchase: a) includes normally prudent protection against conflict of interest; and b) of over $100,000 for goods and services contracts, or $150,000 for public improvements contracts includes a stringent method of assuring the balance of long-term quality and cost. 6. Protect intellectual property, information, and files from loss or significant damage. 7. Receive, process, or disburse funds under sufficient controls to meet the Board-appointed auditor's standards. 8. Invest or hold operating capital in excess of daily requirements in accordance with ORS Not endanger the organization's public image or credibility, particularly in ways that would hinder the accomplishment of its mission. 10. Not name a building, substantial parts of buildings, or significant landscape features of without prior approval of the Board; and, when a building has substantial support from a donor, without prior involvement of the Foundation. Policy B.060: Board Duties and Responsibilities: Budget Making Adopted ; Last Reviewed/Revised The Board of Education has the responsibility to: 1. Adopt the annual budget before July 1 of the budget year. 2. Act as the levying Board in the budget process. 3. Assist in presenting the needs of the college to the public and assist in the adoption, through the formulated budget process, of a budget that will address these needs. 4. Appoint the seven members with whom they shall serve jointly as the budget committee. 5. Review student tuition rates annually. -A2- Appendix A: Financial Policies
81 Policy B.080: Budget Officer Adopted ; Last Reviewed/Revised The president or designee shall serve as budget officer. The budget officer shall be responsible for preparation and maintenance of the budget document in compliance with Local Budget Law [ORS 294]. Policy B.090: Budget Preparation and Adoption Adopted ; Last Reviewed/Revised At the direction of the Board of Education, the president shall study budget needs and prepare recommendations on programs and services for budget committee consideration. The recommendation of advisory committees and interested citizens and organizations within the College District shall be considered by the president in developing the budget document. The college budget shall be prepared and adopted in compliance with Oregon Local Budget Law (ORS 294). Policy C.040: Borrowing Adopted ; Last Reviewed/Revised The Board may authorize borrowing for the college, in compliance with state laws, by resolution stating the upper limit to be obligated at any one time. The president or designee may initiate emergency borrowing prior to Board approval should a quorum of the Board not be available to authorize borrowing. Policy D.110: Tuition Adopted ; Last Reviewed/Revised In order to maintain a constant tuition rate relative to inflation each December, the Board will adjust the per credit tuition rate to reflect changes in an appropriate index for two-year public colleges since the last tuition adjustment. The rate will be rounded to the nearest half-dollar and become effective the following academic year (Summer Term). Periodically and as needed, the Board will review Lane s tuition rates to ensure: a) that tuition revenues are appropriate for the needs of the district and, b) that Lane s tuition is comparable with other Oregon community colleges that are similar to Lane in terms of student FTE and instructional programs. Prior to approval of the tuition increase, the Board will review the index options, affordability and access for students, and the revenue requirements of the college. Policy E.010: Definition of a Balanced Budget Adopted ; Last Reviewed/Revised The Board directs the president to develop annual budget recommendations that are in accordance with the college s strategic plan and conform to the requirements of Local Budget Law (ORS ). The budget shall provide for: Annual operating expenditures not to exceed projected revenues (Expenditures shall be budgeted according to the college s strategic priorities). Debt service, both current (due in less than 12 months) and long-term. Reserves for maintenance and repairs to its existing facilities. Reserves for acquisition, maintenance and replacement of capital equipment. Reserves for strategic capital projects. Funding levels to fulfill future terms and conditions of employment, including early retirement benefits. Allocations for special projects related to the strategic directions of the college. -A3- Appendix A: Financial Policies
82 Allocations for contingencies (unforeseen events requiring expenditures of current resources). Ending Fund Balances (according to policies set specifically for that purpose). Lane has a further responsibility to: Plan how it will spend any one-time unanticipated revenue, allocating it strategically and prudently between: o The restoration of any shortfall to targeted ending fund balances, o Currently unfunded projects in the strategic plan, and/or o Holding some or all of it in reserve during financially volatile periods. Permanently stabilize its finances in their entirety (operating budget, reserves, contingencies and ending fund balances) when it perceives a long term change (increase or decrease) to its available future recurring resources. Policy E.020: Unappropriated Ending Fund Balance Adopted ; Last Reviewed/Revised The president shall assure budgeting that maintains the estimate of unappropriated ending fund balance at no less than three percent of the general fund operational expenditure budget. Policy E.030: Ending Fund Balance Adopted ; Last Reviewed/Revised shall maintain an unrestricted General Fund Ending Fund Balance equal to approximately 5% of total budgeted expenditures. This amount shall be considered a target and the target range may fluctuate up to 1% above or below the target from year to year depending on financial conditions and the needs of the college. The Ending Fund Balance target shall include the Unappropriated Ending Fund Balance (UEFB) as set by Board Policy E.020. When the Ending Fund Balance falls to 4% or less, the college shall adopt a plan to replenish the Ending Fund Balance to 5% within two years. When the Ending Fund Balance exceeds 6%, the excess shall be set aside for investment in one-time expenditures. If the total Ending Fund Balance (including restricted) falls to levels that require short-term borrowing, the levels set by this policy shall be automatically reviewed and adjusted as necessary. Policy E.040: Stabilization Reserve Fund Adopted ; Last Reviewed/Revised The Board may require the president to establish a separate reserve fund (as described in ORS and ORS ) for the purpose of providing short-term stabilization in anticipation of possible shortfalls in revenue. A Stabilization Reserve Fund may be established under one or more of the following circumstances: State budget appropriations for community colleges are not approved by the time the college budget is approved and adopted. A situation exists where significant changes in enrollment are possible but not reasonably predictable. When any major revenue source has a reasonable possibility of decreasing after the college budget is approved and adopted. -A4- Appendix A: Financial Policies
83 When any operating expenditure that is beyond the control of the college could reasonably be expected to increase after the college budget is approved and adopted. Any other situation in which the Board determines that there is a reasonable expectation that major shifts in revenue or expenditures could occur during the budget year. Stabilization reserve levels: Minimum reserve levels shall be at the discretion of the Board under advice from the Budget Committee and the president. Maximum reserve levels shall be no more than the maximum reasonably estimated shortfall at the time of the adoption of the budget. Stabilization reserves will be reviewed annually as part of the budget development process. The Stabilization Reserve Fund shall be closed out when the Board determines that the precipitating threat to revenues and/or expenditures no longer exists. As long as the conditions exist that caused the fund to be established, the funds shall be kept in reserve for the purpose intended. If and when the fund is closed out, any remaining balance shall be released for use as a resource in the General Fund. Policy E.050: Capital Reserve Funds Adopted ; Last Reviewed/Revised The college shall establish and maintain separate reserve funds (as described in ORS and ORS ) in Capital Projects Fund IV for the following purposes: 1. To replace capital equipment that is broken or beyond its useful life as determined by the Capital Assets Replacement Forecast; 2. To maintain and repair college facilities according to the Major Maintenance Schedule; 3. To maintain and upgrade the college s information/telecommunications system according to planning schedules maintained by Information Technology; 4. To build new instructional facilities and/or to purchase property that facilitates planned long-term growth of the college. Appropriate levels of funding for reserves will be determined using existing college decision-making structures. The president will make recommendations to the Board of Education for approval to establish and fund these reserves. Optimal funding levels will be determined using benchmarks, professional standards and best practices from other colleges and adapting these to Lane s specific situation. It is expected that full funding of these reserves will take place over a number of years and that annual transfers to these reserves will be budgeted from the General Fund and other sources as appropriate As required in ORS , the Board shall periodically review the reserve fund and determine whether the fund will be continued or abolished. While ORS 294 allows review to take place every 10 years, reserve funds established under these policies shall be reviewed (a) annually by the president; and (b) at least every three years or more frequently as determined by the Board. As allowed in ORS , the Board may determine at any time that a reserve fund is no longer necessary or that some or all of the reserves may be transferred to the General Fund. -A5- Appendix A: Financial Policies
84 Policy E.060: Budgeting of Non-Recurring Resources Adopted ; Last Reviewed/Revised Non-recurring resources are resources that are not part of an annual revenue stream. Non-recurring resources include but are not limited to such categories as: Fund balances (i.e., carryover ) Reserves One-time grants or awards of money Funds withheld from annual budget allocations (e.g., funds held back from annual General Fund transfer to Capital Repair & Improvement) Special allocations from the State (e.g., allocations from the Emergency Board) Other special allocations (e.g., seed money for a project) Non-recurring resources shall not be budgeted for ongoing recurring expenditures. Non-recurring resources may be allocated for one-time expenditures including but not limited to the following: Capital equipment Capital construction Investment in a new program or service that will move to recurring funding sources after a specified trial period Projects related to the strategic directions of the college. However, the college shall not rely on non-recurring resources for funding ongoing needs such as major maintenance and equipment replacement. Policy E.070: General Fund Contingency Adopted ; Last Reviewed/Revised Board Contingency: The annual budget shall set aside approximately one-half percent (0.5%) of the budgeted revenues each year for Board Contingency. Use of Board Contingency shall be at the discretion of the Board of Education and shall be allocated by formal approval of the Board according to its policies. Administrative Contingency: Administrative Contingency shall be approximately one percent (1%) of the budgeted revenues each year. Administrative Contingency shall be allocated by approval of the president Policy E.080: Interfund Transfers Adopted ; Last Reviewed/Revised All transfers between funds shall be in conformance with ORS The Budget Document shall clearly show for each fund the amount, origin and destination of each transfer. Accompanying documentation shall list the specific purposes for each transfer. -A6- Appendix A: Financial Policies
85 Transfers from the General Fund to other funds (except Fund IX-Special Revenue Admin Restricted) shall be for the following purposes: Debt service on an obligation incurred as a part of normal operations of the college; Goods and services provided to General Fund units by units in other funds; Construction, maintenance and acquisition of facilities and/or real property used by the college in support of its mission; Acquisition of capital equipment for use by the college in support of its mission; Matching funds for grants and contracts; Operation of certain financial aid functions and matching funds required for financial aid grants; Contractual and legal obligations to employees and retirees for compensation and benefits; Other needs as deemed appropriate and necessary by the Board for fulfilling the obligations of the college. Since Fund IX contains units that could be considered general operations of the college, the boundary between the General Fund and Fund IX is more permeable. While units in Fund IX primarily rely on designated revenues, transfers from the General Fund may be used to augment the resources for any or all of these units. The level of funding through General Fund transfers to Fund IX is at the discretion of the Board under advice from the Budget Committee and the president. Policy E.090: Interfund Loans Adopted ; Last Reviewed/Revised Loans from one fund to another shall conform to the requirements of ORS and be authorized by the Board of Education. Interfund loans may not be from: a Debt Service fund, a Financial Aid fund, employee/retiree benefit funds, or funds legally restricted to specific uses. Repayment of the loan must be budgeted according to an approved schedule and at a stated rate of interest. The full repayment of interfund loans shall occur no later than: Five years from the date of the loan, if the funds are to be used to acquire or improve real or personal property, or June 30 of the fiscal year following the year in which the loan was authorized, if the funds are to be used for operating purposes. Policy E.100: Debt Issuance and Management Adopted ; Last Reviewed/Revised The president shall ensure that sufficient funds are available to meet current and future debt service requirements on all indebtedness, while adequately providing for recurring operating requirements. The issuance of debt limits the college s flexibility to respond to future learning priorities; consequently, the college shall issue and manage debt in a manner which maintains a sound fiscal position, protects its creditworthiness and complies with ORS and ORS To meet the objectives of this policy the president shall ensure that the college incurs and services all debts in a manner that will: Maintain a balanced relationship between debt service requirements and current operating needs. Maintain and enhance the college s ability to obtain access to credit markets, at favorable interest rates, in amounts needed for capital improvements and to provide essential learning services. Prudently incur and manage debt to minimize costs to the taxpayers and ensure that current decisions do not adversely affect future generations. -A7- Appendix A: Financial Policies
86 Preserve the college s flexibility in capital financing by maintaining an adequate margin of statutory debt capacity. The Board shall approve borrowing as described in Board Policy C.040. Long-term debt (due more than a year in the future) shall not be issued to fund normal operating needs. See also Debt Policy. Policy E.110: Financial Reporting Adopted ; Last Reviewed/Revised Lane's annual audited financial statements shall conform to generally accepted accounting principles. Applicable professional accounting standards and guidance shall be incorporated into Lane's financial statements. -A8- Appendix A: Financial Policies
87 Debt Policy The current debt obligations were entered into following policies and procedures as prescribed by Oregon Revised Statutes, and the Lane Community College Board of Education Policy E.100. ORS establishes the authority to incur bonded indebtedness for certain uses such as to acquire, construct, reconstruct, improve, repair, equip or furnish a college building or buildings or additions thereto, and sets the legal debt limit. The legal debt limit is computed in compliance with ORS , according to which the taxing or bonding power of any governmental unit is limited to a percentage of the real market value of the taxable property. ORS sets the percentage at 1.5% of real property value in the community college service district. Additionally, section requires that the proceeds from the issuance of any short-term promissory notes are specifically used for the purpose of meeting current expenses, retiring outstanding bonds or warrants, or paying the interest thereon. The Board of Education Policy E.100: Debt Issuance and Management is presented in its entirety in Appendix A: Financial Policies, on the previous page. Legal Debt Limit: The Lane County Assessor s Office most recent certified assessment roll has recorded a Total Real Market Value of Taxable Property in the service district in the amount of $42,267,721, % of that figure is the maximum legal bonded indebtedness available to Lane Community College, or $634,015,828. Lane s total bonded debt subject to the limitation is $41,015,000 which is approximately 6.4% of the legal limit. The Debt Service Fund (Fund III) accounts for the funds collected to pay the debt service requirements on bonds, debt obligations and pension bonds payable. Following is a summary of current year debt obligations. Obligation Purpose Issued Date General Obligation Bonds Payable Pension Bonds Payable Facilities Construction and Improvements PERS Contribution: Cost Sharing Interest Rate 1.25% % 2.73% % Maturity Date Balance July 1, 2010 Principle Due Within Current Year Interest Due Within Current Year 2024 $41,015,000 $4,360,000 $1,514, $52,262,195 $1,925,000 $1,529,250 -A9- Appendix A: Financial Policies

88 Performance Measures Academic and Student Affairs units at closely monitor their operating effectiveness and efficiency throughout the academic year, and across years. A variety of performance indicators help managers see opportunities for improvement as well as areas that are examples of efficiency and effectiveness. Additionally, Lane administrators work with performance indicators across institutions to understand how effectively Lane is operating overall. Following are a few examples of indicators the college works with. Capacity: Percent of Course Selections Enrolled at Maximum Capacity (Fall, Winter and Spring Terms) Dept Academic Learning Skills 80% 91% 99% Ad Basic & Secondary Ed 65% 69% 81% Advanced Technology 73% 78% 86% Art & Applied Design 86% 91% 95% Business 77% 89% 96% Business Development Center 74% 76% 67% Child & Family Education 78% 68% 86% Computer Info Technology 81% 85% 88% Continuing Education 62% 64% 69% Cooperative Education 72% 73% 68% Cottage Grove 74% 69% 69% Counseling 73% 82% 88% Culinary Arts & Hospitality 74% 76% 82% ESL/IESL 91% 95% 93% Flight Technology 54% 53% 57% Florence 69% 69% 70% Health & Physical Ed 79% 85% 90% Health Professions 82% 91% 93% Lang, Lit & Communication 82% 90% 95% Mathematics 79% 86% 90% Music, Dance & Theatre Arts 80% 83% 91% Science 81% 90% 93% Social Science 86% 96% 100% Women's Programs 95% 97% 95% Average 76% 82% 90% -B1- Appendix B: Performance Measures
89 Cost per FTE by Department: Normalized, with FY as Base Year Dept Academic Learning Skills 100% 96% 81% Ad Basic & Secondary Ed 100% 104% 68% Advanced Technology 100% 87% 66% Art & Applied Design 100% 110% 94% Business 100% 106% 89% Business Development Center 100% 113% 72% Child & Family Education 100% 66% Computer Info Technology 100% 78% 61% Continuing Education 100% 150% 186% Cooperative Education 100% 92% 81% Cottage Grove 100% 66% 57% Counseling 100% 92% 46% Culinary Arts & Hospitality 100% 90% 121% ESL/IESL 100% 99% 89% Flight Technology 100% 106% 82% Florence 100% 109% 94% Health & Physical Ed 100% 112% 94% Health Professions 100% 106% 107% Lang, Lit & Communication 100% 88% 81% Mathematics 100% 93% 81% Music, Dance & Theatre Arts 100% 114% 96% Science 100% 99% 91% Social Science 100% 101% 88% Women's Programs 100% 80% 90% -B2- Appendix B: Performance Measures

90 Annual Comparisons: Student FTE by Department Fiscal Years through ,400 1,200 1, B3- Appendix B: Performance Measures

91 Oregon Community Colleges Source: Most Current Comparison Available from Source -B4- Appendix B: Performance Measures

92 Oregon Community Colleges Most Current Comparison Available from Source -B5- Appendix B: Performance Measures
93 Long-Range Financial Plan Section I: History and Long-Term Economic Environment continues to confront new challenges and opportunities to maintain financial sustainability. The economic environment is much more volatile than in 1990 when local property taxes provided 41% (versus 16% for FY11) of our revenue. The passage of Ballot Measures 5 and 50 has reduced the level of local resources so that tuition has become our largest resource followed by state appropriations. State appropriations dropped 10% from the previous biennium as the State of Oregon s largest revenue source, the income tax, was severely impacted by national and global economic conditions. When the American economy went into recession after the financial markets decline in 2001, Lane was immediately adversely affected by the state s inability to sustain funding levels. To mitigate immediately necessary educational program reductions, Lane has found it necessary to more than double tuition since Enrollment dropped significantly in the wake of large increases in tuition following the recession, but enrollment has grown during the latest economic downturn as the workforce has returned to upgrade skills to better compete for declining employment opportunities. Lane s increasing reliance on state funding and the world economy has had other consequences. The college s share of state aid is determined by an agreedupon community college funding formula which must balance the competing needs of large and small community colleges and rapidly growing districts and those with no growth. As the economic characteristics and competing interests of individual community college districts change, Lane has to expect that its share of state funding will change, perhaps unexpectedly and substantially. For example, Lane was confronted with an unanticipated PERS liability in excess of $69 million when the financial markets rapidly declined in Meeting those obligations has added significantly to the cost of employees. Similar declines in PERS investments in will be further adding to the cost of funding PERS liabilities. In long-range financial planning we need to consider strategies to address future contingencies, like the PERS liability, about which we have no present knowledge. Section II: Budget Assumptions and Projections Revenues State Sources The projections for FY11 of $26.7M are based on the Community College Support Fund (CCSF) funding distribution formula. Local Property Taxes Property tax revenues are projected using statistical trend analysis based on historical data. The annual increase historically averages 3.5%. The recent loss of a major employer and declining property values are likely to slow increases in the near future. Property tax increases are capped by the ballot measures mentioned above. Tuition Tuition revenue estimates are based on enrollment projections developed by Lane s Institutional Research, Assessment & Planning Department. -C1- Appendix C: Financial Planning/Long Range Financial Plan
94 Tuition revenues include tuition generated by Fund IX instructional units. For FY06 and beyond, inflation adjustments use the average annual percentage increase in the Higher Education Price Index (HEPI) of the previous year. The 2009 HEPI Index is 2.3%. A temporary surcharge of $3 a credit hour was added for FY10-11 to offset the decline in the state CCSF. Instructional Fees Projections for instructional fees use predicted expenditures based on historical trend analysis. All instructional fees are administratively restricted revenue, i.e., fees are tied to specific direct instructional expenditures and are not available for general allocation. Other Sources Most miscellaneous sources of revenue are restricted for specific uses and not available for general allocation. Expenditures Personal Services Expenditures for FY11 are based on actual position lists. Budgeted figures are used for part-time compensation projections in FY11. OPE rate is recalculated every year using projected costs of benefits. The primary variable is increases in health premium costs. Materials & Services Projections use historical trend analysis to predict M&S expenditures. Contingency By Board Policy, the Unappropriated Ending Fund Balance (UEFB) is set at 3% of budgeted General Fund expenditures. According to Local Budget Law, the UEFB budgeted for the current year may not be expended except under extraordinary circumstances and therefore will be part of the total Ending Fund Balance, and a resource for the ensuing year (Net Working Capital Unrestricted and part of the Beginning Fund Balance). Other Financing Sources Transfers In and Out are projected using historical trend analysis. Fund IX Administratively Restricted Fund IX was created in the FY03 budget to separate from the General Fund those units that rely entirely or primarily on resources other than state revenues, local property taxes and other general use revenues. For the purposes of maintaining historical trends and in order to properly monitor these units, Fund IX revenues and expenditures are included in budget projections. -C2- Appendix C: Financial Planning/Long Range Financial Plan
95 Section III: Issues Tax Revenues Lane has become increasingly dependent upon the state CCSF since passage of property tax limitations. In 1990 the state provided Lane with $8.8 million, which was 24% of Lane s total revenue and property taxes consisted of 41% of revenue. Today both local property taxes and the CCSF are allocated based on FTE through the state distribution formula. For FY10, the State is providing $26.7 million, which is 29% of Lane s general fund revenue and local property taxes will add about $15 million or 16%. State aid has remained relatively flat since 1997 in real terms and is on a declining trend in terms of purchasing power. Additionally, Lane has no assurance that state aid will increase as much as inflation in the foreseeable future. The state revenue for years after FY11 is uncertain and if the trend of past years continues, it will not rise as quickly as expenses. Therefore, Lane should not rely on substantial increases in state revenue to meet the needs of future budgets. Tuition Rates High Student Demand and Increasing Reliance on Tuition and Fees The college s highest priority is to enable our students to have successful learning experiences. The failure of state aid since 2000 to increase sufficiently to cover Lane s increasing operating costs has negatively impacted Lane s students with rising tuition costs. In 2002 tuition was $38 per credit, but for FY11 this has more than doubled to $83 per credit. In past years Lane s Board has heard from students that maintaining current service levels is their highest priority, and has acted accordingly by raising tuition. However, increases in tuition directly impact accessibility of education which is also a core value of the institution. On the other hand, long class waiting lists, the state de-funding of self-improvement classes, and the inherently high costs of professional/technical programs, all indicate that higher tuition rates may be warranted in the future. Lane s Board has expressed an intention to hold tuition increases to the rise in inflation and has limited the increases in recent years to the Higher Education Price Index (HEPI) provided by the Common Fund Foundation until this year when a temporary surcharge became necessary to offset declines in the CCSF. Tuition now exceeds state support as the college s largest revenue source. Ending Fund Balances Long term institutional viability requires that expenditures not exceed revenues and maintenance of an appropriate level of fund balance to accommodate unknown challenges. To accomplish this end, Board Policy E.030 requires that the college maintain an unrestricted General Fund Ending Fund Balance of approximately 5% of budgeted expenditures and Board Policy E.020 specifies that 3% of general fund expenditures be budgeted as an unappropriated ending fund balance. While the college is currently meeting these requirements, this level is lower than recommended by professional associations and very low by comparison to peer institutions. Increasing uncertainty in the economic environment and the volatility of Oregon tax sources create a compelling need for a larger ending fund balance. Future financial planning should work toward that goal. Labor-Intensive Services The delivery of high quality learning services is, by its very nature, labor-intensive. For FY11, Lane projects spending $68 million, out of a total general fund budget of $90 million, on personal services and related fringe benefits. Because three fourths of the college s financial resources are devoted to employee compensation, compensation levels must be considered the primary driver of rising costs. Future changes to compensation will have the largest impact on college expenditures and must be evaluated carefully to insure that they do not outpace revenue increases. -C3- Appendix C: Financial Planning/Long Range Financial Plan
96 Costs of Health Care Insurance for Employees The Consumer Price Index indicates that medical costs have increased dramatically in recent years, nearly double the rate of increase for all goods and services. The college has taken steps to reduce its future rate increases: requiring employees to share in the payment of the insurance premiums, establishing a Section 125 plan, instituting the LIFE employee wellness program; and implementing an on-site employee medical clinic. The college is providing an increase of 6.9% for managers and classified employees and is negotiating with the faculty unit regarding FY11 insurance contributions. PERS Unfunded Liability Due to high investment losses and the unique benefit structure, the Oregon Public Employees Retirement system (PERS) accrued a substantial Unfunded Actuarial Liability (UAL). In December 2003 Lane was informed by PERS that our share of the UAL exceeded $69 million - - more than the college s entire General Fund annual operating budget. This amount was required to be paid (in addition to current employer contributions) to PERS at an 8% interest rate over 26 years. To minimize this annual obligation, Lane issued taxable pension bonds during April 2003 at an average interest rate of 5.8%. To the extent that PERS investment earnings average more than 8% through 2028, the college will have preserved financial resources for use in the General Fund. The payments on these pension bonds are funded annually by an increase in the college s fringe benefit (OPE) rates. Positive arbitrage on the bonds issued reduced the remaining (UAL) for a time but market declines in the past year have erased those gains and added to future liability. Significant increases in our PERS costs are expected to meet those obligations beginning in FY12. This assessment is delayed due to a lag between actuarial analysis and implementation. Deferred Maintenance Requirements The physical condition of many of our facilities is badly in need of major renovation or repair. The Board recognized the need to properly maintain our facilities by adopting Policy E.050, Capital Reserve Funds, which requires that Lane reserve funds to adequately maintain and repair college facilities. Recent budgets have not been able to fully fund this policy and requirements continued to be deferred until now. The situation dramatically improved, with the approval of $83 million in bonding authority for renovations in the November 2008 election and the appropriation early in the 2009 legislative session of an additional $8 million for deferred maintenance projects. A further appropriation of $8 million for matching state bonds toward replacement of the aging downtown center is also helping meet the huge backlog of facility needs. Not every need will be met but there will be huge improvement despite the declines in general fund revenues. Underfunding of Equipment Replacement Another result of the stagnation in public resources has been that instructional and support services equipment has not been replaced at the end of its economic life. We have been making do with outdated equipment in our efforts to commit the maximum financial resources to direct instruction. The result is that equipment needs continue to grow as replacement needs outstrip available funding. This shortfall as been mitigated in part by Federal Carl Perkins grants. Section IV: Long-Range Strategic Directions Strategic Directions for the next three to five years fall into three major categories (below). Two of the three categories have long-range goals and outcomes defined largely by direction of the Board of Education. Specific long-range goals and outcomes in all categories are being developed through the college s unit and strategic planning processes. -C4- Appendix C: Financial Planning/Long Range Financial Plan
97 Transforming Students Lives Goal: Improve student employment opportunities by integrating student positions into college operations Outcome: Improve financial aid and student retention Transforming the Learning Environment Goal: Fully fund facilities renovation, remodeling and major maintenance Outcome: Improve quality of instructional environment Goal: Fully fund equipment replacement Outcome: Increase Capital Outlay allocations to $1.3 million annually by FY13 Transforming the College Organization Goal: Fundamental redesign of instruction to assist in meeting long term budget challenges Section V: Achieve and Maintain Financial Stability Balance General Fund Budget Outcome: Ongoing (recurring) expenditures & other sources will not exceed revenues The college has reversed earlier shortfalls with a balanced budget and contribution to the ending fund balance for the last three years. However, several areas remain under-funded including: instructional innovation, major facilities maintenance, capital and computer equipment replacement, and workforce/continuing education. Complete stabilization will not occur until these problems have been addressed within available resources. Stabilize Tuition Rates Outcome: Tuition rates not to exceed inflationary adjustments Lane has the highest per credit tuition rate of community colleges in Oregon. Steep increases in tuition rates have jeopardized the affordability of a Lane education for many students. (Board Policy D.110 provides for annual tuition adjustments for inflation.) Build Capital and Equipment Reserves Outcome: Build facilities capital reserve fund to $1.2 million by FY13 Outcome: Build equipment replacement reserve fund to $400,000 by FY13 -C5- Appendix C: Financial Planning/Long Range Financial Plan
98 Over the last decade, Lane has depleted its capital reserves (except for construction bond funds committed to specific projects.) The college needs to build capital reserves in order to (a) provide a mechanism for funding facilities projects in years when project costs are higher than average and (b) provide funds for emergency maintenance and repairs. Likewise, the college has no equipment reserves. For the same reasons, the college should build equipment reserves. Board Policy E.050 enables the Board to establish reserve funds for capital projects. Board Policy E.010 specifies that a balanced budget must provide adequate funds for capital needs in any given year. Reserves ensure that funds are available for emergencies and for needs in years where capital expenditures are expected to be higher than average. Section VI: Strategies in Budgets for Achieving Long-Range Goals All projects recommended for funding in the FY11 budget are described in detail in accompanying documents. Following are the strategies followed for the one-year period covered by the budget: Limit new recurring expenditures: Fund new recurring activities through reallocation of current resources. Fund new recurring activities with recurring savings or recurring new revenues created by those activities. Build new revenue streams: Continue differential tuition program and assess ability to expand or maintain the program into FY11. Build capacity in Lane s Foundation to increase fundraising. Develop Long-Range Plan for the college for FY11 and beyond. Board Policy E.010 specifies that new ongoing expenditures must be supported by recurring revenues. In order to keep Lane s current service level and/or provide additional programs and services, new revenue sources must be identified. Use one-time (non-recurring) funds Grants are being sought to augment initiatives such as Student retention High-demand classes K-12 connections Sustainability Marketing -C6- Appendix C: Financial Planning/Long Range Financial Plan
99 Capital Outlay Plan After many years of inadequate funding due to constrained budgets, has been able to make great progress in providing for capital investment requirements. During the November 2008 Election, district taxpayers approved $83 million dollars in bond authority, continuing the same level of tax support assessed in a bond issue that was paid off in In early 2009 the college was granted $8 million for renovation projects which were completed during $45 million in bonds were issued in June 2009, to begin the first phase of construction and design. Additionally in 2009, the college was awarded $8 million dollars for matching funds toward a new downtown center. In 2010 the first phase of bond renovation construction is well underway on main campus and the new Health and Wellness building and Longhouse will be opened for Fall Term classes. In May of 2010 the City of Eugene agreed to provide the land for the new downtown center as well as $8 million toward the cost of the building from anticipated urban renewal increment financing. Design of the downtown center is underway and construction is slated to begin in early Projects underway or in design with bond funding include: Bond Projects Upgrade science labs for academic and career training classes, including nursing and emergency medical technicians Improve building access to persons with disabilities Replace 40-year-old leaking roofs, plumbing and electrical systems, air conditioning and heating Bring buildings up to current fire and improved earthquake safety codes to provide a safer environment for student learning Renovate, upgrade, and repair classrooms to increase access and meet modern educational technology standards Bring computer, Internet and digital classroom technology up to 21st century standards Improve classrooms for growing enrollment in high-demand programs that prepare today s workforce with career-specific technology and equipment Remodel and enhance existing classrooms to create a Career and Technical Education Center with larger classrooms, expanding access to vocational training for adult students, and for high school students who don t have access to such facilities in their high schools Improve the library to create a one-stop student learning center that includes tutoring and computer technology services Improve labs and classrooms for students in health career training programs such as therapeutic exercise and rehabilitation, to train students and serve the local community Improve existing career training and educational facilities, including the Downtown Center, which would feature, along with existing adult education programs, an energy efficient design which would house the energy management and renewable energy degree programs, as well as provide business resources Florence Center science lab and exterior renovation Improve energy efficiency throughout the college, including a recycling center Campus security - Install first phase of a keyless entry system to buildings and selected rooms to improve security of personnel and equipment. Emergency communication - Install campus wide communication system to notify campus about emergency incidents Replace downtown center with building designed to also serve as an energy programs laboratory. -C7- Appendix C: Financial Planning/Capital Outlay Plan
100 Privately Funded Projects Native American Longhouse: The Foundation together with various community groups and the Student Association has been raising funds to complete a Native American Longhouse intended for multiple uses. The exterior is complete and interior finish work is expected to be complete in FY11. Health and Wellness Building: Construction began on a new Health and Wellness building to provide adequate capacity to support a twofold student learning experience for the health professions. First, the facility will make space available for students to learn how to work with medical equipment in a safe, oncampus environment. It will also allow to increase the use of simulation technology for the purpose of creating a learning environment for students clinical experience. Construction began in June 2009 and is scheduled to be complete by August Funding is provided by private contributions through the foundation and a matching $6.75 million grant from the state. Utilization of the outgoing Downtown Center (DTC) building is unknown at present, but it is presumed that a self-supporting application will be found, in terms of a redevelopment for housing or business incubation space. Impact on General Fund With the exception of the Longhouse and Health and Wellness building which are new structures, all projects are major renovations of existing spaces. The renovations will improve energy efficiency and ease of maintenance and consequently will have a generally positive impact on operating costs although the full extent of benefits is undetermined. Costs estimated by Facilities Management and Planning to support the new infrastructure are as follows: Requirements Personal Services Initial Outlay Annual Increments FY10 FY11 FY12 Custodian 1.0 FTE 25, Groundskeeper.25 FTE 6, General Services.25 FTE 6, Maintenance Worker.5 FTE 17, Other Payroll Expense 27, ,582 2,064 2,116 -C8- Appendix C: Financial Planning/Capital Outlay Plan
101 Initial Outlay Annual Increments Materials & Services FY10 FY11 FY12 Utilities 81,334 4,067 8,133 Fire Alarm System Testing 35,000 1,750 1,838 Alarm Monitoring Svc 5, Keyless Access Monitoring 5, Maintenance & Repairs 14,167 2,833 2,862 Grease Trap Maintenance 5, Misc Service Contracts 4, Elevator Maintenance 3, Testing & Inspections 2, Janitorial Supplies 1, ,002 9,925 14,171 Total Requirements 238,584 11,989 16,288 Resources Utilities due to Def Maintenance 12, Total Resources 12, Estimated Net Requirement 226,584 11,389 15,658 -C9- Appendix C: Financial Planning/Capital Outlay Plan

102 Local and Regional Information Lane County, Oregon Lane County was established in Covering 4,620 square miles from the Pacific Ocean to the Cascade Mountains, the county has three unique climate zones: the Willamette Valley, the Coast, and the Cascade Mountains. Although 90 percent of Lane County is forest land, Eugene and Springfield comprise the second largest urban area in the state (second to Portland). Lane County is renowned for its beautiful topography and climate and outdoor recreational opportunities. Lane County Fast Facts: County Seat: Eugene, Oregon Average Temperatures: January: 40, July: 70 Annual Precipitation: 46 Population: 351,109 Median Age: 36.3 years Assessed Value: $23,673,681,435 Real Market Value: $42,267,721,854 Principle Industries: Agriculture, Higher Education, High Technology, Health Services, Forest Products and Recreation. Economic Indicators: Indicator Lane County Oregon Labor Force 177,477 1,934,054 Median Home Value $141,000 $152,000 Median Household Income $44,180 $49,863 Per Capita Personal Income $33,522 $35,667 Population 351,109 3,825,657 Unemployment Rate 10.9% 11.5% Lane County Oregon Counties Sources: D1- Appendix D: Local and Regional Information


103 Population Population American Indian & Alaska Native 2.8% Racial Demographics Hispanic 6.2% Other 2.7% Asian 3.7% White 83.0% 140, , , Age Profile Black 1.6% 80, , , , Under Household Income 30,000 25,000 20,000 15,000 10,000 5,000 0 Sources: ( American Community Survey)
104 Economic Forecast State of Oregon Office of Economic Analysis June 2010 Executive Summary Oregon Economic Forecast The first quarter of 2010 marks the first positive quarterly job growth since the first quarter of We are hesitant to conclude that this is the turning point we have all been waiting for. Given this is an initial estimate of jobs and a seasonally adjusted measurement, we believe this latest quarter is further evidence of bottoming out of the recession as it relates to the job market. Hopefully as we move ahead thru 2010, the quarters will continue to show positive job growth. The year-over-year (Y/Y) employment decline for the first quarter is 3.0 percent. The Y/Y decline has not been below 5.0 percent since the fourth quarter of The unemployment rate for Oregon sits at 10.6 percent for April, essentially unchanged for the past six months. The unemployment rate tends to be one of the last measurements to improve as the economy enters recovery. Almost all service sectors reported seasonally adjusted job growth in the first quarter of Financial services still posted a slight decline, possibly remnants from the housing and financial declines during the recession. Construction continued with double-digit declines that stretch back to the first quarter of Manufacturing still struggled with only metals and machinery and other durable goods showing job increases. Government added jobs boosted by Census workers at the federal level. One year ago in this section, we wrote about signs that the recession may be coming to an end. With GDP moving to positive territory, the general consensus is that the recession is over. Analysts are now scouring the data looking for signs of the strengths and weaknesses of this recovery. Will the recovery be robust or lackluster? The Wall Street Journal article headline on April 15 reads: Evidence Mounts of Strong Recovery. BusinessWeek on April 19 argues that the economy is coming back strong in its article Why the Obama Plan is Working. Newsweek on April 19 states: America is coming back stronger, better, and faster than nearly anyone expected and faster than most of its international rivals. The Conference Board index of leading indicators rose in March by 1.4 percent and is up 12 percent from a year ago, the fastest rate since the 1980s. On the job market and the March labor report, an article in the Wall Street Journal April 2 edition states: All in all, a very good report that suggests the much-feared jobless recovery was short lived. The consensus is still holding to a soft-patch as the inventory replenishment and stimulus spending start to fade in Although business is feeling much better about the economy, The University of Michigan consumer sentiment survey declined in April and is at its lowest point since November Although retail sales have seen a strong increase in March, analysts worry about the consumer s state of mind and their willingness and ability to increase spending. With no one sector to jump start a robust recovery, the outlook is for the recovery to continue but at a slow pace. -E1- Appendix E: Economic Forecast
105 Oregon mirrors the U.S. economy in questions about the strength of recovery. Although data is not as detailed as for the U.S., it is just as easy to find signs of either a robust or lackluster recovery. The Oregon Index of Leading Indicators is showing very strong signals in the last few months, though we caution that the index should be used to identify turning points rather than gauge the strength or weakness of the Oregon economy. The University of Oregon, Index of Economic Indicators is showing a similar strong rise over the last 5 months. The Philadelphia Federal Reserve Bank State Coincidence Indicator for Oregon has also turned up and among the 50 states, Oregon ranks 6th in terms of indicator growth year-over-year for March. The unemployment rate in Oregon for April is still above 10 percent and has been there for the last fifteen months. This is not unusual as unemployment tends to be a lagging indicator of economic activity. Average weekly hours in manufacturing have risen but are still well below levels associated with an expanding economy. Housing permits are considerably higher than a year ago but the level is still reminiscent of recession periods. Housing prices continue to fall albeit at much lower rates. And although the job numbers were positive in this first quarter of 2010, there is still considerable weakness in several labor sectors. The good news is consensus that the recession, in the U.S. and Oregon, is over. The cloudy news is the strength of this recovery and the prospects for the job market. OEA (Office of Economic Analysis Oregon) forecasts an increase of 1.5 percent in total employment for the second quarter of The year average for 2010 is an employment decline of 0.7 percent. Although positive job growth is forecasted thru the rest of 2010, the growth is too weak to overcome the yearly average decline. Job growth is positive at 1.9 percent in 2011 with quarterly job gains reaching 2.7 percent by the end of the year. The Oregon economy does not see above 2 percent yearly job growth until The wood products industry is slowly seeing signs of recovery, though the sector still remains depressed. Wood products are still projected to lose 5.4 percent jobs in 2010 before adding 5.7 percent in 2011 and 8.7 percent in Although these growth rates in 2011 and 2012 seem very strong, the number of workers in wood products in 2012 will still be 15 percent below the level of workers in Prospect for the computer and electronic equipment sector are looking brighter. This sector is projected to add jobs at the rate of 0.1 percent in The 2010 yearly average increase hides the stronger quarterly job increases in the second half of the year. Job growth continues with 3.7 percent in 2011 and 4.5 percent in The transportation equipment sector has experienced some of the largest job losses through the recession. Jobs in this sector are forecasted to decrease by 10.3 percent in 2010 before rebounding with increases of 4.5 percent in 2011 and 8.9 percent in The metals and machinery sector was one of the last manufacturing sectors to loose jobs as the recession unfolded. Yearly job gains return in 2011 with 2.8 percent growth followed by 4.5 percent growth in Other durable good manufacturers, which includes furniture makers, has suffered through this recession with other sectors that have strong ties to the housing market. This sector will increase jobs by 1.2 percent in 2010, 6.2 percent in 2011, and 5.1 percent in Employment in food processing is forecast to increase 6.8 percent in 2010, the largest projected growth of any sector this year. Employment is expected to grow at a slower rate of 0.8 percent in 2011 and 1.7 percent in This sector is subject to wide employment swings due to seasonal factors. -E2- Appendix E: Economic Forecast
106 Other nondurables, which includes paper and allied products, is projected to have job declines of 3.3 percent in 2010, then increases of 2.0 percent in 2011 and 1.9 percent in Construction employment is still reeling from the effects of the housing downturn and the recession, with commercial real estate joining the slump. Construction is projected to decrease annually by 15.0 percent in 2010 and 1.3 percent in 2012, before adding jobs at a rate of 5.1 percent in The information sector, which includes traditional publishers such as newspapers and publishers of software, is still being impacted from the slowing retail sector as advertising has decreased. This sector is expected to be flat in 2010 then job growth of 2.8 percent in Job growth will continue in 2012 with growth of 2.2 percent. The financial sector, which includes banks and real estate activities, will see a slow recovery in the next year. Financial activities are projected to lose jobs at 1.4 percent rate in 2009 followed by growth of 2.2 percent in Growth continues in 2012 with job gains of 2.5 percent. Professional and business services are projected to mildly increase 0.1 percent in 2010, a more robust increase of 5.9 percent in 2011, and 4.0 percent in Education and health services have continued to add jobs through the recession. This sector is projected to add jobs at a rate of 1.9 percent in 2010, 2.1 percent in 2011, and 1.9 percent in Leisure and Hospitality had a rough time in This sector is projected to mildly increase 0.8 percent in 2010 and 0.7 percent in Job growth will continue in 2012 with growth of 1.5 percent. The government sector will decline by 0.5 percent in 2010 and 0.3 percent in 2011, before adding jobs at 1.0 percent in The federal job count is pushed up by the U.S. Census in State government is forecasted to be essentially flat with growth of 0.1 percent in 2010 but then decline by 0.4 percent in 2011, turning positive again in 2012 with growth of 1.0 percent. Local government is expected to lose jobs at the rate of 1.2 percent in 2010, add jobs at 0.7 percent in 2011 and 1.3 percent in Population growth will be slower than the mid 2000s with growth of 0.9 percent in 2010, 1.1 perfect in 2011 and 1.2 percent in Forecast Risks A year ago, no one thought that many analysts today would be suggesting the US economy could come roaring back. The fears of a double dip recession are fading. IHS Global Insight has changed their probability of risk scenarios: optimistic at 25 percent and pessimistic at 15 percent. The April U.S. jobs report of a 290,000 gain was the best job market showing since late The recovery appears well entrenched with all sectors seeing some degree of revival. The degree of downside risk facing the U.S. may be fading but it still remains a possible outcome. Although the housing sector is seeing some new life, the sector is still quite fragile and starts and sales are not very strong. Commercial real estate also remains weak and the health of regional banks is in question. The problems in Greece and the Euro Zone remind us that all is still not resolved in financial markets. -E3- Appendix E: Economic Forecast
107 Oregon also looks very hopeful that the recovery is finally spreading to most sectors and employment has turned the corner. Oregon s April job report, though not as robust as the U.S., was encouraging to see the nonmanufacturing sector adding jobs. Although the bulk of jobs gains in April was due to federal government Census hiring, the report was still positive for the rest of Oregon s employment sectors. Oregon also faces downside risks similar to the U.S. Housing is still quite weak and commercial real estate is having a tough time. Some regional banks appear to be turning the corner while others still face tough times ahead. With Oregon exports growing in the Pacific Rim, questions about the health of the Chinese economy could slow this positive influence on our economy. The baseline view has the recovery in place but a rather slow speed of economic growth for Oregon compared to historical recovery periods. We will have to be vigilant with forthcoming economic data to see if the economy takes a different path. We will continue to monitor and recognize the potential impacts of risk factors on the Oregon economy. We have identified the major risks now facing the Oregon economy in the list below: Contagion of the credit crunch and financial market instability. Credit markets are easing, but consumers and businesses still have difficulty getting loans. To the extent that credit markets take longer to come back to some sort of state of normalcy, the current recovery could be slower than projected or thrown off track. Housing and commercial real estate may take longer for credit conditions to improve. Oregon will suffer the consequences along with the rest of the nation. H1N1 flu. The flu pandemic has not been as disruptive up to this point in time, but the danger is not over. The disruption to the economy of Mexico has been severe, but other economies so far have not been greatly impacted. Indications to date are for mild disruption and nothing approaching the devastation of the Spanish Flu of Still, rather than a smaller 5 percent of the workforce impacted, it could go as high as 30 to 40 percent. Prolonged housing market instability. Signs are starting to emerge that the housing market has hit bottom, at least in terms of housing starts, but prices may have further to fall. Though Oregon has been hit hard through this downturn, Oregon s housing market is relatively better off compared to California, Nevada, Florida, and Arizona. Coupled with the recessionary state of the economy, overbuilding and heightened credit standards will keep demand for housing relatively low. Rather than the correction of the housing bubble further hurting the Oregon housing market, it has been the deepening recession that caused further home price declines and rising foreclosures. Unlike many parts of the economy, there is an upside risk here as well. If the recovery is stronger than forecasted, Oregon s housing market should revive better than the states that experienced the greater housing market bubbles. The fading of the inventory cycle and federal stimulus. The level of government response to the current recession has never been greater. Furthermore, the coordination of central bank actions throughout the world was similarly unprecedented. Manufacturing has also been lifted as businesses replenish depleted inventories. Both these positive impacts are fading as we enter the second half of The risk is to the extent that the current recovery is slowed or possibly slips back into recession. The return of federal timber payments to Oregon counties. Included in the federal bailout was a provision to reinstate federal timber payments for four years. Oregon counties will receive $254 million, down from the previous $282 million level and will be phased out over the four year window, through While this temporary reinstatement helps cover short term budgets for Oregon counties, finding or replacing this dwindling revenue source will be imperative as any loss of public services could have adverse impacts on economic activity. -E4- Appendix E: Economic Forecast
108 The extent of the global downturn. The U.S. economy has been an important engine of growth for the global economy. The economic woes of the U.S. have been felt throughout the global supply chain and production process. Asian economies, exposed via trade to the U.S., have begun a strong rebound. It is expected that Asian economies will lead the world out of recession, which is good news for Oregon s exports. China is a top export market for Oregon s products and a strong Chinese expansion, along with other Pacific Rim countries will aid the Oregon recovery. Financial stability is still a global question with the fiscal worries of Greece and implications for the Euro Zone. National and regional energy prices. Energy prices are generally lower coming into 2010 compared to Changes in regional electric and natural gas prices are expected to be small over the year. This comes at a welcomed time when businesses are looking for cost savings. The benefit from lower energy prices is most likely short-lived as the underlying demand drivers will return once the world economies rebound from this recession. Geopolitical risks. Uncertainty still abounds in Iraq. Tensions with Iran and heightened security risks weigh on businesses and consumers. Disruptions in travel, oil supplies, and consumer confidence could be severe. The drop in business activity could deepen if this uncertainty persists or if the transition out of the Iraq war goes badly for the U.S. The eventual winding down of military expenses will not greatly impact Oregon. There is also an upside risk that the transition will go more smoothly than anticipated, and stability in the Mideast will provide a stronger than forecasted stimulus to the economy. Initiatives, referendums, and referrals. Generally, the ballot box brings a number of unknowns that could have sweeping impacts on the Oregon economy. Another uncertainty facing the Oregon economy is the impacts from the two tax measures which were passed on January 26. Studies on both sides of the issue from respectable sources derived very different conclusions. Given the uncertain nature of the impact of these two tax measures, we will not incorporate possible impacts into the Oregon economic forecast. We will be monitoring closely to see if any changes are warranted in future forecasts. Demographic Forecast Oregon s estimated population on July 1, 2009 reached 3,823,460. That was an increase of 0.85 percent over the 2008 population. The growth has slowed down since the highs of 2005 through 2007 when it exceeded 1.5 percent on average. This is the first time in two decades that Oregon s population growth was lower than the U.S. average. Overall, population change since 2000 was much slower than the rate of growth of well over 2.0 percent during the early 1990s. As a result of recent economic downturn, Oregon s population is expected to continue a slow pace of growth for at least a couple of years. Based on the current forecast, Oregon s population will reach 4.2 million in the year 2017 with an annual rate of growth of 1.17 percent between 2009 and Oregon s economic condition heavily influences the state s population growth. Its economy determines the ability to retain local work force as well as attract job seekers from other states and beyond. As Oregon s total fertility rate remains below the replacement level and deaths continue to rise due to ageing population, long-term growth comes from net immigration. Working-age adults come to Oregon as long as we have good economic and employment situations. During the 1980s, that included a major recession and a net loss of population, net migration contributed to 22 percent of the population change. On the other extreme, net migration accounted for 73 percent of the population change during the booming economy of 1990s. This share of migration to population change declined to 57 percent in 2002 and it is down to 48 percent in As a sign of slow to modest economic gain, the net migration will account for 50 to 65 percent of the population change in the near future. Although economy and employment situation in Oregon look bleak, migration situation is not expected to replicate the early 1980s pattern. Potential Oregon emigrants have no better place to go since other states are also in the same boat in terms of economy and employment. -E5- Appendix E: Economic Forecast
109 Age structure and its change affect employment, state revenue, and expenditure. Growth in many age groups will show the effects of the baby-boom and their echo generations during the period of It will also reflect demographics impacted by the depression era birth cohort combined with diminished migration of the working age population and elderly retirees. After a period of slow growth in the past, the elderly population (65+) has picked up a faster pace of growth and will surge as the baby-boom generation starts to enter this age group. The average annual growth of the elderly population will be nearly 4.0 percent during the forecast horizon as the boomers continue to enter retirement age. The youngest elderly (aged 65-74) will grow at an extremely fast pace even exceeding 6 percent annual rate of growth due to the direct impact of the baby-boom generation entering retirement age. Reversing several years of shrinking population, the elderly aged will start a positive growth as the effect of depression era birth-cohort will dissipate. The oldest elderly (aged 85+) will continue to grow at a moderately but steady rate due to the combination of cohort change, continued positive net migration, and improving longevity. However, the annual growth rate will continue to taper off as the depression era small birth cohort transitions from the younger age group. As the baby-boom generation matures, the once fast-paced growth of population aged will gradually taper off to near 0 percent rate by The young adult population (aged 18-24) will remain virtually unchanged between 2009 and 2017, slowing from an averaging of 1.0 percent growth experienced between 2000 and Although the slow growth of college-age population (age 18-24) tend to ease the pressure on public spending on college education, college enrollment typically goes up during the time of high unemployment and scarcity of well paying jobs when even the older population flock back to college to better position themselves in a tough job market. The growth rate for children under the age of five will remain below the overall population growth rate. Since the change in the number of children before and after the 2009 baseline population will remain low, the demand for child care services and pre-kindergarten program will be additionally determined by the labor force participation of the parents. The growth in K-12 population (aged 5-17) will remain low which will translate into slow growth in school enrollments. This school-age population has actually declined in size. The age group population has reversed the several year trend of decline and slow growth. The decline was mainly due to the exiting baby-boom cohort. This age group has seen positive growth starting in the year 2003 and will approach 1.2 percent annual growth by the year Revenue Forecast The forecast for General Fund revenues for is $12,683.9 million. This represents a decrease of $511 million from the March 2010 forecast. The forecast for the biennium is now $876.5 million below the Close of Session forecast. On net, nearly all of the decrease for the June forecast is associated with lower-than-expected personal income tax collections during the current tax season and a small decrease for the 2011 fiscal year. After incorporating legislative changes enacted during the 2010 special session, the expected ending balance for is negative $562.6 million. Total available resources amount to $12,747.8 million. Projected lottery earnings will total $1,077.3 million, an increase of $5.6 million from the prior forecast. Lottery revenues appear to have stabilized with yearover-year growth returning over the past several months after nearly 18 months of steady decreases. Including the beginning balance and other earnings, total available resources equal $1,079.5 million. Under current law, $200 million is expected to be transferred to the State School Fund during from these two reserve funds. Based on the June 2010 forecast, it is expected that $115.7 million will be transferred to the State School Fund from the Oregon Rainy Day Fund (ORDF) and $84.3 million will be transferred from the Education Stability Fund (ESF). At the close of fiscal year 2009, the balance in the ORDF equaled $112.5 million. The ORDF is projected to reach a balance of $10 million by the end of The ESF balance was completely withdrawn at the end of in order to fill the budget shortfall for By the end of , available ESF funds will total $99.9 million. Source: -E6- Appendix E: Economic Forecast
110 Legal Notifications -F1- Appendix F: Legal Notifications

111 -F2- Appendix F: Legal Notifications


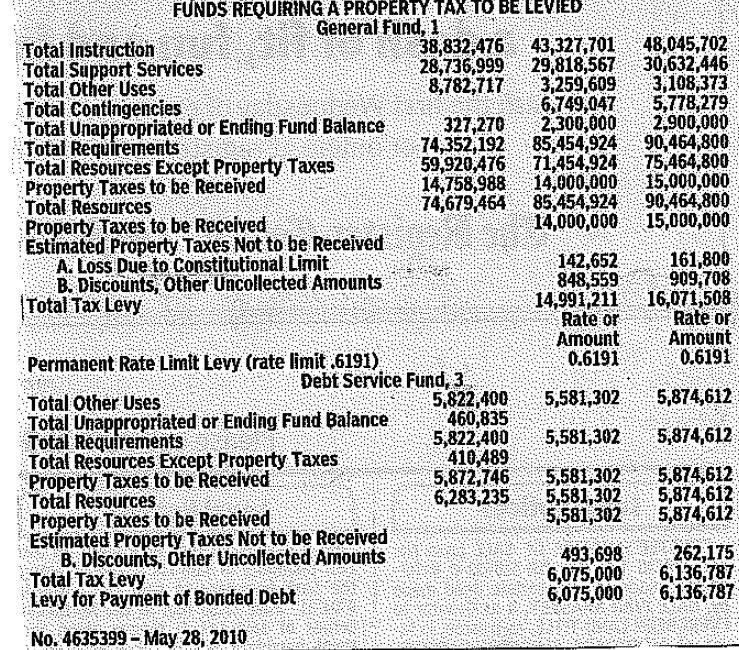
112 -F3- Appendix F: Legal Notifications
113 -F4- Appendix F: Legal Notifications
114 RESOLUTION 552: BUDGET ADOPTION AND APPROPRIATION -F5- Appendix F: Legal Notifications
115 -F6- Appendix F: Legal Notifications

116 -F7- Appendix F: Legal Notifications
BUDGET MESSAGE FISCAL YEAR Presented May 13, 2015
 BUDGET MESSAGE FISCAL YEAR 2015-16 Presented May 13, 2015 The fiscal year 2015-16 budget reflects a year-long process of analysis, review, and application of our budget development principles, criteria
Budget Committee
 Committee Zone 1 Zone 4 Zone 7 (at large) Hop Jackson Sally Dunn Janet Morse Betty Tamm Sharon Rice Vanessa Becker Zone 2 Zone 5 Sandy Henry Elin Miller Zone 3 Zone 6 Chris Davidson Wendy Weikum Rex Stevens
Budget Document Fiscal Year
 Budget Document Fiscal Year 2017-2018 The Government Finance Officers Association of the United States and Canada (GFOA) presented a Distinguished Budget Presentation Award to Lane Community College, Oregon
Budget Committee
 Committee Zone 1 Hop Jackson Betty Tamm Zone 2 Sandy Henry Elin Miller Zone 3 Chris Davidson Wendy Weikum Zone 4 Sally Dunn Sharon Rice Zone 5 Rex Stevens Bob Bell Zone 6 Diane Phillips Joe Yetter Zone
A DOP T ED. Budget Document Fiscal Year
 A DOP T ED Budget Document Fiscal Year 2018-2019 Table of Contents Budget Message 1 Schedule of Interfund Transfers 45 Schedule of Changes Between Proposed and Adopted Budget 5 Change in Fund Balance 46
Approved Budget Document. Budget Document. Fiscal year fiscal year
 Approved Budget Document Budget Document Fiscal year 2018-2019 fiscal year 2018-2019 Committee Zone 1 Hop Jackson Betty Tamm Zone 2 Sandy Henry Doris Lathrop Zone 3 Chris Davidson Wendy Weikum Zone 4 Sally
FY2016 FY2018 Projection Estimate
 FY2016 FY2018 Projection Estimate November 16, 2016 11.16.16 11.16.16 Estimate Projection FY2016 Actual Fund I & IX FY2017 FY2018 10.8% CR decrease 4% CR decrease 0% CR decrease REVENUE $350K increase
MIDDLE GEORGIA STATE UNIVERSITY Budget Stakeholder Report Fiscal Year 2016
 MIDDLE GEORGIA STATE UNIVERSITY Budget Stakeholder Report Fiscal Year 2016 Dear MGA Stakeholder: Thank you for your interest in the MGA budget process. Whether you are an employee, student or just an interested
UNIVERSITY OF WYOMING BUDGETS
 Budget Descriptions and Definitions - 1 UNIVERSITY OF WYOMING BUDGETS BUDGET SECTION I SECTION II SPECIAL APPROPRIATIONS CAPITAL CONSTRUCTION This section contains the general operating budget of the University
FY 2019 Budget Development Subcommittee Consensus Budget Balancing Items
 FY 2019 Budget Development Subcommittee Consensus Budget Balancing Items Planning Projection, March 8, 2018 ($ 5,904,500) UPDATES, ADDITIONS & CORRECTIONS Tuition HEPI Update/Correction $ 430,000 The 2017
Connecticut State University System (The System Office, Central Connecticut State University, Eastern Connecticut State University, Southern
 Connecticut State University System (The System Office, Central Connecticut State University, Eastern Connecticut State University, Southern Connecticut State University, Western Connecticut State University,
UNIVERSITY OF WYOMING BUDGETS
 Budget Descriptions and Definitions - 1 UNIVERSITY OF WYOMING BUDGETS BUDGET SECTION I SECTION II SPECIAL APPROPRIATIONS CAPITAL CONSTRUCTION MAJOR MAINTENANCE This section contains the general operating
RANCHO SANTIAGO COMMUNITY COLLEGE DISTRICT ORANGE COUNTY
 ORANGE COUNTY REPORT ON AUDIT OF FINANCIAL STATEMENTS AND SUPPLEMENTARY INFORMATION INCLUDING REPORTS ON COMPLIANCE June 30, 2017 TABLE OF CONTENTS June 30, 2017 INDEPENDENT AUDITOR S REPORT MANAGEMENT'S
Proposed Budget Document FY
 Proposed Budget Document FY 2018-19 THE UNIVERSITY of TENNESSEE Chattanooga Knoxville Space Institute Martin Health Science Center Institute of Agriculture Agricultural Experiment Station Tennessee Extension
HOLYOKE COMMUNITY COLLEGE (an agency of the Commonwealth of Massachusetts)
") HOLYOKE COMMUNITY COLLEGE INDEPENDENT AUDITORS' REPORTS AS REQUIRED BY THE UNIFORM GUIDANCE AND GOVERNMENT AUDITING STANDARDS AND RELATED INFORMATION JUNE 30, 2016 Independent Auditors' Reports as Required
HOLYOKE COMMUNITY COLLEGE INDEPENDENT AUDITORS' REPORTS AS REQUIRED BY THE UNIFORM GUIDANCE AND GOVERNMENT AUDITING STANDARDS AND RELATED INFORMATION JUNE 30, 2016 Independent Auditors' Reports as Required
Budget Presentation. Chemeketa Community College April 13, 2016
 2016-2017 Budget Presentation Chemeketa Community College April 13, 2016 Budget Publications 2 Budget Committee Reference Handbook A handbook for Budget Committee members of reference materials that includes:
CENTRAL OREGON COMMUNITY COLLEGE DISTRICT BEND, OREGON
 FINANCIAL STATEMENTS YEAR ENDED JUNE 30, 2009 DISTRICT OFFICIALS JUNE 30, 2009 CHAIRPERSON Ronald E. Foerster Zone 4 BOARD MEMBERS Donald V. Reeder Connie Lee Zone 1 Zone 5 Anthony J. Dorsch Charley Miller
AMITY SCHOOL DISTRICT NO. 4J
 AMITY, OREGON JUNE 30, 2016 AUDIT REPORT STEVE TUCHSCHERER Certified Public Accountant A Professional Corporation 807 Trade Street Amity, Oregon 97101-0138 (503) 835-2171 DISTRICT OFFICIALS BARBARA ROWE.............
CAPE COD COMMUNITY COLLEGE (an agency of the Commonwealth of Massachusetts) FINANCIAL STATEMENTS AND MANAGEMENT S DISCUSSION AND ANALYSIS
 FINANCIAL STATEMENTS AND MANAGEMENT S DISCUSSION AND ANALYSIS") FINANCIAL STATEMENTS AND MANAGEMENT S DISCUSSION AND ANALYSIS JUNE 30, 2017 Financial Statements and Management s Discussion and Analysis CONTENTS Independent Auditors Report 1-2 Management s Discussion
FINANCIAL STATEMENTS AND MANAGEMENT S DISCUSSION AND ANALYSIS JUNE 30, 2017 Financial Statements and Management s Discussion and Analysis CONTENTS Independent Auditors Report 1-2 Management s Discussion
EASTERN WASHINGTON UNIVERSITY BUDGET PRIMER
 EASTERN WASHINGTON UNIVERSITY BUDGET PRIMER STATE BIENNIAL BUDGET CYCLE OFM issues budget instructions EVEN YEARS JUN EWU BIENNIAL BUDGET CYCLE ONGOING Agency Strategic Planning Agencies submit budget
WICHITA STATE UNIVERSITY
 WICHITA STATE UNIVERSITY Expenditure Actual FY 2015 Operating Expenditures: State General Fund $ 70,934,109 $ 75,278,380 $ 74,275,237 $ 74,879,391 $ 74,879,391 Other Funds 218,063,313 226,509,672 227,512,815
Our Mission. To inspire every student to think, to learn, to achieve, to care
 At a Glance Our Mission To inspire every student to think, to learn, to achieve, to care MESSAGE FROM OUR SUPERINTENDENT High Performance in Cherry Creek Schools Harry Bull, Jr., Ed.D. The Cherry Creek
Gov. Rec. FY Agency Req. FY 2018
 UNIVERSITY OF KANSAS Actual FY 2016 Agency Est. FY 2017 FY 2017 Agency Req. Agency Req. FY 2019 FY 2019 Operating Expenditures: State General Fund $ 129,474,124 $ 130,488,578 $ 130,439,226 $ 127,920,517
CAPE COD COMMUNITY COLLEGE (an agency of the Commonwealth of Massachusetts) FINANCIAL STATEMENTS AND MANAGEMENT S DISCUSSION AND ANALYSIS
 FINANCIAL STATEMENTS AND MANAGEMENT S DISCUSSION AND ANALYSIS") FINANCIAL STATEMENTS AND MANAGEMENT S DISCUSSION AND ANALYSIS JUNE 30, 2016 Financial Statements and Management s Discussion and Analysis CONTENTS Independent Auditors Report 1-2 Management s Discussion
FINANCIAL STATEMENTS AND MANAGEMENT S DISCUSSION AND ANALYSIS JUNE 30, 2016 Financial Statements and Management s Discussion and Analysis CONTENTS Independent Auditors Report 1-2 Management s Discussion
COLLEGE OF DUPAGE FY2015 Budget Summary
 COLLEGE OF DUPAGE FY2015 Budget Summary May 22, 2014 Prepared by: Thomas J. Glaser, Senior Vice President Administration & Treasurer Lynn M. Sapyta, AVP Financial Affairs/Controller David P. Virgilio,
SOUTH TEXAS COLLEGE BUDGET For The Fiscal Year Ending August 31, 2008
 SOUTH TEXAS COLLEGE BUDGET For The Fiscal Year Ending August 31, 2008 Budget For The Fiscal Year Ending August 31, 2008 TABLE OF CONTENTS INTRODUCTORY SECTION Board of Trustees... 1 Mission and Vision...
HOLYOKE COMMUNITY COLLEGE (an agency of the Commonwealth of Massachusetts) FINANCIAL STATEMENTS AND MANAGEMENT S DISCUSSION AND ANALYSIS
 FINANCIAL STATEMENTS AND MANAGEMENT S DISCUSSION AND ANALYSIS") FINANCIAL STATEMENTS AND MANAGEMENT S DISCUSSION AND ANALYSIS June 30, 2014 Financial Statements and Management s Discussion and Analysis C O N T E N T S Independent Auditors' Report 1-2 Management s Discussion
FINANCIAL STATEMENTS AND MANAGEMENT S DISCUSSION AND ANALYSIS June 30, 2014 Financial Statements and Management s Discussion and Analysis C O N T E N T S Independent Auditors' Report 1-2 Management s Discussion
Please review your ExpressLane reports and close or cancel purchase orders as appropriate to clean up the data.
 College Finance May 20, 2016 To: Budget Administrators From: Greg Holmes, Chief Financial Officer RE: 2015-2016 FISCAL YEAR-END CLOSING In order for us to close the College's books on a timely basis for
COLE COUNTY MISSOURI
 COLE COUNTY MISSOURI Budget Officer Recommended Budget For Fiscal Year 2019 Prepared by: Auditor s Office Kristen Berhorst County Auditor Cole County, Missouri 2019 Budget Table of Contents Budget Message
Laramie County Community College
 Laramie County Community College TM District s Annual Budget For Fiscal Year Beginning July 1, 2016, and Ending June 30, 2017 Presented May 25, 2016 (Second Draft) To be adopted by the Board of Trustees
Chapter GENERAL CLASSIFICATION OF EXPENDITURES BY ACTIVITY INSTRUCTIONAL ACTIVITIES
 Accounting for Expenditures and Outgo Chapter 4 Table of Contents Chapter 4... 4-1 GENERAL... 4-2 CLASSIFICATION OF EXPENDITURES BY ACTIVITY... 4-3 INSTRUCTIONAL ACTIVITIES... 4-4 ADMINISTRATIVE AND SUPPORT
CENTRAL OREGON COMMUNITY COLLEGE FINANCIAL STATEMENTS YEAR ENDED JUNE 30, 2016
 FINANCIAL STATEMENTS YEAR ENDED JUNE 30, 2016 OFFICIALS JUNE 30, 2016 CHAIRPERSON David Ford Zone 4 BOARD MEMBERS Joe Krenowicz John Mundy Zone 1 Zone 5 Laura Cooper Bruce Abernethy Zone 2 Zone 6 Anthony
BUDGET SUMMARY FISCAL YEAR Working Together, Achieving Excellence
 BUDGET SUMMARY FISCAL YEAR 2009-2010 Working Together, Achieving Excellence This page left blank intentionally MISSION The mission of the Sultan School District is to work together to achieve excellence
Financial Statements. C.S. Mott Community College Flint, Michigan. June 30, 2012 and 2011
 Financial Statements C.S. Mott Community College Flint, Michigan June 30, 2012 and 2011 Table of Contents Page Independent Auditor s Report 1-2 Management s Discussion and Analysis 3-20 Financial Statements:
Functions at West Virginia University
 Functions at West Virginia University Function is used to classify the University's expenditures in multiple ways. The classifications are necessary to report the activity to the Federal government, sponsors
FY2018 Operating Budget
 FY2018 Operating Budget SUMMARY OF PROPOSAL The Board of Trustees is charged with reviewing and approving the university s annual operating budget. The budget supports the educational, research, and outreach
BALDWIN COMMUNITY SCHOOLS FINANCIAL STATEMENTS
 BALDWIN COMMUNITY SCHOOLS FINANCIAL STATEMENTS June 30, 2016 BALDWIN COMMUNITY SCHOOLS FINANCIAL STATEMENTS June 30, 2016 CONTENTS Page MANAGEMENT DISCUSSION AND ANALYSIS...I-XI INDEPENDENT AUDITOR S REPORT...
Pierpont Community and Technical College
 Pierpont Community and Technical College Financial Statements Years Ended June 30, 2013 and 2012 And Independent Auditor s Reports 2 PIERPONT COMMUNITY & TECHNICAL COLLEGE TABLE OF CONTENTS INDEPENDENT
Missouri Western State University A Component Unit of the State of Missouri
 Accountants Report and Financial Statements (Including Reports Required Under OMB-133) June 30, 2005 and 2004 June 30, 2005 and 2004 Contents Management s Introduction... 1 Independent Accountants Report
Iowa Community Colleges Fiscal Year 2010 Certified Budgets
 Iowa Community Colleges Fiscal Year 2010 Certified Budgets April 2009 Iowa Department of Education Division of Community Colleges and Workforce Preparation Bureau of Community Colleges State of Iowa DEPARTMENT
Table of Contents. Transmittal... i Introduction Executive Overview...1 Organization Chart...7. Community Profile...8. GFOA Budget Award...
 Table of Contents Transmittal... i Introduction Executive Overview...1 Organization Chart...7 Community Profile...8 GFOA Budget Award...18 Budget Calendar...19 How to use this document...20 General Fund
WICHITA STATE UNIVERSITY
 WICHITA STATE UNIVERSITY Actual FY 2014 Agency Est. Agency Req. Agency Req. FY 2017 FY 2017 Operating Expenditures: State General Fund $ 63,335,814 $ 72,622,953 $ 72,481,613 $ 74,428,373 $ 73,897,534 $
ITEM NO: 5.1 DATE: June 4, /15 TENTATIVE BUDGETS. SYNOPSIS: Board of Trustees consideration of the adoption of the 2014/15 Tentative Budgets.
 ITEM NO: 5.1 DATE: June 4, 2014 SUBJECT: TENTATIVE S SYNOPSIS: Board of Trustees consideration of the adoption of the Tentative Budgets. A public hearing on the proposed Adopted Budgets will be held at
UNIVERSITY OF KANSAS MEDICAL CENTER
 UNIVERSITY OF KANSAS MEDICAL CENTER Expenditure Actual FY 2015 Est. Est. Operating Expenditures: State General Fund $ 107,261,725 $ 107,973,763 $ 106,488,966 $ 111,555,200 $ 111,555,200 Other Funds 218,372,066
California State University, Long Beach
 California State University, Long Beach 2008-2009 Annual Management Report A Supplement to the Annual Audited Financial Report Foreword September 18, 2009 Dr F King Alexander President The Annual Management
MT HOOD. be yourdream PROPOSED BUDGET COMMUNITY COLLEGE OFFICE OF ADMINISTRATIVE SERVICES SE STARK STREET GRESHAM
 MT HOOD COMMUNITY COLLEGE 2017-2018 PROPOSED BUDGET OFFICE OF ADMINISTRATIVE SERVICES 26000 SE STARK STREET GRESHAM OR be yourdream COMMUNITY COLLEGE MT. HOOD COMMUNITY COLLEGE DISTRICT BUDGET COMMITTEE
ENGADINE CONSOLIDATED SCHOOLS Mackinac County, Michigan
 ENGADINE CONSOLIDATED SCHOOLS Mackinac County, Michigan Annual Financial Report For the year ended Table of Contents For the year ended Financial Section Independent Auditor s Report... 1 Management s
MIDDLE GEORGIA STATE UNIVERSITY Budget Stakeholder Report Fiscal Year 2017
 MIDDLE GEORGIA STATE UNIVERSITY Budget Stakeholder Report Fiscal Year 2017 Dear MGA Stakeholder: Thank you for your interest in the Middle Georgia State University (MGA) budget process. Whether you are
Annual Financial Report
 Annual Financial Report Prepared By The Waco Independent School District Business and Financial Services Department 501 Franklin Avenue, Waco, Texas 76701 (This page intentionally left blank) Table of
ENGADINE CONSOLIDATED SCHOOLS Mackinac County, Michigan
 ENGADINE CONSOLIDATED SCHOOLS Mackinac County, Michigan Annual Financial Report For the year ended Table of Contents For the year ended Financial Section Independent Auditor s Report... 1 Management s
 CEDAR FALLS COMMUNITY SCHOOL DISTRICT CEDAR FALLS, IOWA Management s Discussion and Analysis For the Fiscal Year Ending June 30, 2015 This section of the Cedar Falls Community School District s annual
MADISON DISTRICT PUBLIC SCHOOLS MADISON HEIGHTS, MICHIGAN AUDIT REPORT FOR THE YEAR ENDED JUNE 30, 2010
 MADISON HEIGHTS, MICHIGAN AUDIT REPORT FOR THE YEAR ENDED JUNE 30, 2010 TABLE OF CONTENTS Report of Independent Accountants Management s Discussion and Analysis PAGE I II - IX Basic Financial Statements:
DAYS CREEK SCHOOL DISTRICT NO. 15
 DAYS CREEK SCHOOL DISTRICT NO. 15 DAYS CREEK, OREGON AUDIT REPORT JUNE 30, 2013 STEVE TUCHSCHERER Certified Public Accountant A Professional Corporation DAYS CREEK SCHOOL DISTRICT NO. 15 PO BOX 10 Days
FY 2011 BUDGET (MAY 5, 2010)
") Approved by Chancellor Spakes May 11, 2010 FY 2011 BUDGET (MAY 5, 2010) INTRODUCTION Taking into account a constrained resource environment, the FY 2011 budget recommendation supports the mission of the
Approved by Chancellor Spakes May 11, 2010 FY 2011 BUDGET (MAY 5, 2010) INTRODUCTION Taking into account a constrained resource environment, the FY 2011 budget recommendation supports the mission of the
WORCESTER STATE UNIVERSITY (AN AGENCY OF THE COMMONWEALTH OF MASSACHUSETTS) FINANCIAL STATEMENTS AND MANAGEMENT S DISCUSSION AND ANALYSIS WITH
 FINANCIAL STATEMENTS AND MANAGEMENT S DISCUSSION AND ANALYSIS WITH") (AN AGENCY OF THE COMMONWEALTH OF MASSACHUSETTS) FINANCIAL STATEMENTS AND MANAGEMENT S DISCUSSION AND ANALYSIS WITH SUPPLEMENTARY INFORMATION AND OTHER REPORTS YEARS ENDED JUNE 30, 2017 AND 2016 AND INDEPENDENT
(AN AGENCY OF THE COMMONWEALTH OF MASSACHUSETTS) FINANCIAL STATEMENTS AND MANAGEMENT S DISCUSSION AND ANALYSIS WITH SUPPLEMENTARY INFORMATION AND OTHER REPORTS YEARS ENDED JUNE 30, 2017 AND 2016 AND INDEPENDENT
WICHITA STATE UNIVERSITY
 WICHITA STATE UNIVERSITY Actual FY 2016 Agency Est. Agency Req. Agency Req. FY 2019 FY 2019 Operating Expenditures: State General Fund $ 71,149,663 $ 71,617,393 $ 71,580,924 $ 70,738,088 $ 70,566,341 $
Chancellor s Message - Achievements
 Chancellor s Message - Achievements We have achieved significant educational and operational advances. To name a few: $41 million in savings from operations through the elimination of redundancies and
School Finance Basics and District Support Operations. Budgeting. When Do You Begin?
 School Finance Basics and District Support Operations The Legislature implemented the school funding formula that exists in Arizona today starting in the 1980-1981 school year. The formula was developed
STATE CENTER COMMUNITY COLLEGE DISTRICT
 STATE CENTER COMMUNITY COLLEGE DISTRICT Districtwide Resource Allocation Model General Fund Unrestricted Budget Fresno Reedley Madera Oakhurst Willow International Table of Contents Background... 3 Elements
Superintendent s Preliminary Budget
 City School District of New Rochelle Embracing Diversity...Driving Success Superintendent s Preliminary 2018-2019 Budget April 10, 2018 CSDNR s Mission The City School District of New Rochelle, through
Table of Contents. Executive Summary... Overview...
 Table of Contents Executive Summary... Overview... iii 1 Delegation of Authority to the Administration... Summary Revenue and Expense by Program... Summary Revenue and Expense by Account... Operating Resources
The Fiscal Environment
 Section 7: Fiscal Responsibilities Chapter 29 The Fiscal Environment Understanding the fiscal role and responsibilities of the governing board means understanding the fiscal environment in which the community
Missouri Southern State University (A Component Unit of the State of Missouri) Independent Auditor s Reports and Financial Statements
 Independent Auditor s Reports and Financial Statements") (A Component Unit of the State of Missouri) Independent Auditor s Reports and Financial Statements Contents Independent Auditor s Report... 1 Management s Discussion and Analysis... 3 Financial Statements
(A Component Unit of the State of Missouri) Independent Auditor s Reports and Financial Statements Contents Independent Auditor s Report... 1 Management s Discussion and Analysis... 3 Financial Statements
Message from the Chief Financial Officer
 Financial Report For the Year Ended June 30, 2003 Message from the Chief Financial Officer Founded in 1881, the University of Connecticut serves as the state s flagship for higher education, meeting the
Financial Report 2000
 Financial Report 2000 A message to Chancellor Larry Vanderhoef This report sets forth the financial position and results of operations of the University of California, Davis, for the fiscal year ended
WEST VALLEY-MISSION COMMUNITY COLLEGE DISTRICT ANNUAL FINANCIAL REPORT JUNE 30, 2010 AND 2009
 WEST VALLEY-MISSION COMMUNITY COLLEGE DISTRICT ANNUAL FINANCIAL REPORT JUNE 30, 2010 AND 2009 TABLE OF CONTENTS JUNE 30, 2010 FINANCIAL SECTION Independent Auditors' Report 2 Management's Discussions and
North Orange County Community College District Integrated. Planning Manual March 2014 Update
 2013 Integrated Planning Manual March 2014 Update 2013 Integrated Planning Manual NOCCCD Mission Statement The mission of the is to serve and enrich our diverse communities by providing a comprehensive
B o a r d o f E d u c a t i o n A P P R O V E D A n n u a l O p e r a t i n g B u d g e t FY 2017 CHIEF EXECUTIVE OFFICER
 B o a r d o f E d u c a t i o n A P P R O V E D A n n u a l O p e r a t i n g B u d g e t CHIEF EXECUTIVE OFFICER Monitoring, Accountability & Compliance Diversity Officer Interpreting & Translations Services
UNIVERSITY OF KANSAS MEDICAL CENTER
 UNIVERSITY OF KANSAS MEDICAL CENTER Actual FY 2016 Agency Est. Agency Req. Agency Req. FY 2019 FY 2019 Operating Expenditures: State General Fund $ 103,090,804 $ 107,348,826 $ 107,338,520 $ 104,223,345
CALVERT COUNTY PUBLIC SCHOOLS Prince Frederick, Maryland. FINANCIAL STATEMENTS June 30, 2016
 Prince Frederick, Maryland FINANCIAL STATEMENTS TABLE OF CONTENTS INDEPENDENT AUDITORS REPORT... 1 MANAGEMENT S DISCUSSION AND ANALYSIS... 3 FINANCIAL STATEMENTS... 19 Government wide Financial Statements:
CHAFFEY COMMUNITY COLLEGE DISTRICT TENTATIVE BUDGET
 2017 2018 TENTATIVE BUDGET Developed and Prepared by: Lisa Bailey, Associate Superintendent Business Services and Economic Development Anita D. Undercoffer, Executive Director, Budgeting and Fiscal Services
Millbrae Elementary School District First Interim for Fiscal Year Board of Trustees
 Millbrae Elementary School District First Interim for Fiscal Year 2016-2017 Board of Trustees Frank Barbaro Denis Fama Lynne Ferrario Maggie Musa D. Don Revelo Administration Vahn Phayprasert, Superintendent
Vernonia School District 47J Adopted Budget
 Vernonia School District 47J 2017-2018 Adopted Budget 1000 Missouri Avenue, Vernonia OR 97064 www.vernonia.k12.or.us 503 429 5891 VERNONIA SCHOOL DISTRICT 47J VERNONIA, OREGON ADOPTED BUDGET 2017 2018
Office of Superintendent of Schools April 1, 2019 Board Meeting of April 17, 2019 MONTHLY FINANCIAL REPORT FOR THE PERIOD ENDING FEBRUARY 2019
 Office of Superintendent of Schools April 1, 2019 Board Meeting of April 17, 2019 Financial Services Mr. Ron Y. Steiger, Chief Financial Officer SUBJECT: COMMITTEE: LINK TO STRATEGIC BLUEPRINT: MONTHLY
COMPREHENSIVE ANNUAL FINANCIAL REPORT FISCAL YEAR ENDED JUNE 3D, 2011
 FOUNDATION ACADEMY CHARTER SCHOOL COMPREHENSIVE ANNUAL FINANCIAL REPORT FISCAL YEAR ENDED JUNE 3D, 2011 FOUNDATION ACADEMY CHARTER SCHOOL Foundation Academy Charter School Board of Trustees Trenton, New
Montclair State University (A Component Unit of The State of New Jersey) Basic Financial Statements and Management s Discussion and Analysis and
 Basic Financial Statements and Management s Discussion and Analysis and") Basic Financial Statements and Management s Discussion and Analysis and Schedules of Expenditures of Federal and State of New Jersey Awards (With Independent Auditors Reports Thereon) Financial Statements
Basic Financial Statements and Management s Discussion and Analysis and Schedules of Expenditures of Federal and State of New Jersey Awards (With Independent Auditors Reports Thereon) Financial Statements
Budget Committee Meeting
 Budget Committee Meeting Proposed FY2020 Budget Document Umpqua Community College Presented by Natalya Brown, CFO April 11, 2019 Budget Committee Duties to comply with local budget law https://www.oregon.gov/dor/programs/property/pages/local-budget.aspx
MIRACOSTA COMMUNITY COLLEGE DISTRICT ANNUAL FINANCIAL REPORT JUNE 30, 2018
 MIRACOSTA COMMUNITY COLLEGE DISTRICT ANNUAL FINANCIAL REPORT TABLE OF CONTENTS FINANCIAL SECTION Independent Auditor's Report 2 Management's Discussion and Analysis 5 Basic Financial Statements - Primary
South Texas College Budget Fiscal Year
 Budget Fiscal Year 2012-2013 Hidalgo County and Starr County, Texas Budget For The Fiscal Year Ending August 31, 2013 TABLE OF CONTENTS INTRODUCTORY SECTION Board of Trustees... 1-3 Executive Staff...
The Criterion Two Team found that Estrella Mountain has demonstrated effective organization of its financial resources through the following
 99 SECTION C - FINANCIAL RESOURCES OVERVIEW The Criterion Two Team found that Estrella Mountain has demonstrated effective organization of its financial resources through the following findings. The existence
MIDDLESEX COMMUNITY COLLEGE. Financial Statements. June 30, 2015 and (With Independent Auditors Report Thereon)
") Financial Statements (With Independent Auditors Report Thereon) Financial Statements Table of Contents Page(s) Management s Discussion and Analysis (Unaudited) 1 9 Independent Auditors Report 10 11 Statements
Financial Statements (With Independent Auditors Report Thereon) Financial Statements Table of Contents Page(s) Management s Discussion and Analysis (Unaudited) 1 9 Independent Auditors Report 10 11 Statements
Montclair State University (A Component Unit of the State of New Jersey) Basic Financial Statements and Management s Discussion and Analysis
 Basic Financial Statements and Management s Discussion and Analysis") (A Component Unit of the State of New Jersey) Basic Financial Statements and Management s Discussion and Analysis Financial Statements TABLE OF CONTENTS Page Independent Auditors Report 1-2 Management
(A Component Unit of the State of New Jersey) Basic Financial Statements and Management s Discussion and Analysis Financial Statements TABLE OF CONTENTS Page Independent Auditors Report 1-2 Management
ANNUAL FINANCIAL REPORT For the Fiscal Year Ended June 30, 2015
 Hutchinson and Willmar, MN ANNUAL FINANCIAL REPORT For the Fiscal Creating Opportunities, Changing Lives. ANNUAL FINANCIAL REPORT For the year ended June 30, 2015 TABLE OF CONTENTS Page College Administration
Stoughton Area School District Budget Report
 2017-18 Stoughton Area School District Budget Report Serving the following communities: Albion, Christiana, Stoughton, Cottage Grove, Deerfield, Dunkirk, Dunn, Pleasant Springs and Rutland in Dane County
GALION CITY SCHOOL DISTRICT CRAWFORD COUNTY SINGLE AUDIT
 GALION CITY SCHOOL DISTRICT CRAWFORD COUNTY SINGLE AUDIT FOR THE YEAR ENDED JUNE 30, 2016 TITLE GALION CITY SCHOOL DISTRICT CRAWFORD COUNTY TABLE OF CONTENTS PAGE Independent Auditor s Report... 1 Management
Budget Presentation. Chemeketa Community College April 12, 2017
 2017-2018 Budget Presentation Chemeketa Community College April 12, 2017 Budget Publications 2 Budget Committee Reference Handbook A handbook for Budget Committee members of reference materials that includes:
LETTER FROM THE EXECUTIVE VICE CHANCELLOR, CHIEF FINANCIAL OFFICER
 LETTER FROM THE EXECUTIVE VICE CHANCELLOR, CHIEF FINANCIAL OFFICER The California State University is a remarkable institution that is comprised of 23 campuses offering an outstanding education to 438,157
Office of Budget and Financial Planning. Glossary of Terms
 Glossary of Terms Academic Support "Includes all funds expended for activities carried out primarily to provide support services that are an integral part of the operations of one of the institution's
The Stanford University Budget Plan
 i The Stanford University Budget Plan 2000/01 Submitted for Action to the Board of Trustees June 8-9, 2000 This publication can also be found on the World Wide Web at: http://www.stanford.edu/dept/pres-provost/budget/plans/plan01.html
Maurice Mo Green, Superintendent 712 North Eugene Street, Greensboro, NC
 EDUCATION Guilford County Schools Maurice Mo Green, Superintendent 712 North Eugene Street, Greensboro, NC 27401 336-870-8100 Links to County Goals and Strategic Priorities: COUNTY GOAL: Further Community
Fiscal Year 2019 Annual Operating Budget Executive Summary
 EXECUTIVE SUMMARY Fiscal Year 2019 Annual Operating Budget Executive Summary The University of Illinois System s consolidated Fiscal Year 2019 (FY19) budget recommendation is the culmination of a two year
Centennial School District Budget Message April 19, CENTENNIAL SCHOOL DISTRICT 2017/2018 BUDGET MESSAGE April 19, 2017
 CENTENNIAL SCHOOL DISTRICT 2017/2018 BUDGET MESSAGE April 19, 2017 Dr. Paul Coakley Superintendent Rick Larson Budget Officer EXECUTIVE SUMMARY It was the best of times, it was the worst of times so begins
COMPREHENSIVE ANNUAL FINANCIAL REPORT. The York County School Division Component Unit of the County of York, Virginia
 COMPREHENSIVE ANNUAL FINANCIAL REPORT The York County School Division Component Unit of the County of York, Virginia For the Fiscal Year Ended June 30, 2010 Prepared by the Department of Finance Dennis
BALTIMORE CITY COMMUNITY COLLEGE. Financial Statements Together with Report of Independent Public Accountants
 Financial Statements Together with Report of Independent Public Accountants For the JUNE 30, 2013 AND 2012 CONTENTS REPORT OF INDEPENDENT PUBLIC ACCOUNTANTS 1 MANAGEMENT S DISCUSSION AND ANALYSIS 3 FINANCIAL
Table of Contents. Executive Summary... Overview...
 Table of Contents Executive Summary... Overview... iii 1 Delegation of Authority to the Administration... Summary Revenue and Expense by Program... Summary Revenue and Expense by Account... Operating Resources
DALLAS COUNTY COMMUNITY COLLEGE DISTRICT APPROVED BUDGET
 DALLAS COUNTY COMMUNITY COLLEGE DISTRICT 2014-2015 APPROVED BUDGET DALLAS COUNTY COMMUNITY COLLEGE DISTRICT 2014-2015 APPROVED BUDGET TABLE OF CONTENTS PAGE Board of Trustees and District Administration...
GLOSSARY. A separate organizational unit of County government established to deliver services to citizens.
 Accrual Basis of Accounting A basis of accounting that recognizes transactions at the time they are incurred, rather than when cash is received or spent. In Albemarle, the basis of budgeting and accounting
Table of Contents. Executive Summary... Overview...
 Table of Contents Executive Summary... Overview... iii 1 Delegation of Authority to the Administration... Summary Revenue and Expense by Program... Summary Revenue and Expense by Account... Operating Resources
CALIFORNIA STATE UNIVERSITY, LONG BEACH
 CALIFORNIA STATE UNIVERSITY, LONG BEACH DATE: March 14, 2008 TO: FROM: Vice Presidents Gould, Stephens, Robinson and Taylor, Director Cegles 2008-09 Resource Planning Process Task Force RPP SUBJECT: Campus
Budget Document FY
 Budget Document FY 2017 2018 THE UNIVERSITY of TENNESSEE Chattanooga Knoxville Space Institute Martin Health Science Center Institute of Agriculture Agricultural Experiment Station Extension College of