THE INCORPORATION OF BUDGET CONSTRAINTS WITHIN STATED CHOICE EXPERIMENTS TO ACCOUNT FOR THE ROLE OF OUTSIDE GOODS AND PREFERENCE SEPARABILITY
|
|
|
- Eleanore Copeland
- 5 years ago
- Views:
Transcription

1 THE INCORPORATION OF BUDGET CONSTRAINTS WITHIN STATED CHOICE EXPERIMENTS TO ACCOUNT FOR THE ROLE OF OUTSIDE GOODS AND PREFERENCE SEPARABILITY John Rose 2/26/18 BIDA Working Paper 1801
2 THE INCORPORATION OF BUDGET CONSTRAINTS WITHIN STATED CHOICE EXPERIMENTS TO ACCOUNT FOR THE ROLE OF OUTSIDE GOODS AND PREFERENCE SEPARABILITY John Rose University of Tehnology Sydney Business Intelligene and Data Analytis University of Tehnology Sydney Business Shool ABSTRACT Stated hoie (SC) experiments are a popular means of olleting preferene data for disrete alternatives. Many SC experiments inlude a no hoie alternative, either as an opt out or as a status quo alternative. Even in the presene of a no hoie alternative, it is not lear that respondents understand fully the trade-offs being made between the hoie alternatives, and other outside goods. As suh, it is possible that many SC experiments are in violation of one of the entral tenets underlying the miro-eonomi theory of demand. In this paper, we report two studies, in whih respondents are required to indiate how they would readjust their household budget in light of hoies made in a SC experiment. In both ase studies, we find signifiant differenes in the results obtained between traditional SC tasks and tasks involving the realloation of household budgets. We argue that tasks involving the reorganisation of the household budget, are at least in part, more inentive ompatible given that respondents are faed with the finanial onsequene of their hoies, as well as bound by their true budget onstraint. The results of the paper reaffirms lassial miroeonomi demand theory with respet to SC experiments. JEL lassifiations: C35, C83, C99, D01, D12, D14. Keywords: Stated hoie experiment, multiple disrete ontinuous extreme value model, household budget, preferene separability, inentive ompatibility
3 1.0 INTRODUCTION Originating in the field of psyhology in the 1930s (Thurstone 1931), stated hoie (SC) methods have beome widely used as a means of olleting data to model onsumer preferenes. Early proponents of SC methods made use of rude experimental designs to onstrut surveys in whih respondents were asked to make pairwise omparisons between ompeting hypothetial alternatives. These early researhers were able to derive indifferene urves representing the preferenes of the sampled respondents and later test the axioms underlying indifferene urves and hene onsumer demand theory itself (MaCrimmon and Toda 1969, May 1954, Mosteller and Nogee 1951, Rousseas and Hart 1951, Thurstone 1931). Numerous advanes have ourred sine. Paralleling improvements in omputing, advanes in eonometri modelling have also ourred, allowing researhers to deal with multinomial hoies (MFadden 1974), model omplex forms of heterogeneity (e.g., the mixed multinomial logit model - Train et al or the latent lass model - e.g., Kamakura and Rusell 1989) as well as other effets assoiated with SC data, suh as the possibility that multiple hoie observations (repeated measures) an be obtained for eah respondent (see e.g., Revelt and Train 1998). Additionally, experimental design theory speifially for SC type data also has advaned onsiderably over the past three deades (see Rose and Bliemer 2014a for a review of the literature on SC experimental design theory). Nevertheless, from its very ineption, many eonomists have ritiized the use of SC experiments, laiming that the hypothetial nature of suh experiments will result in respondents systematising their answers in suh a way as to produe plausible but spurious results (Wallis and Friedman 1942). The same arguments against the use of SC surveys remain today (e.g., Camerer and Hogarth 1999; Diamond and Hausman 1994; Fifer et al. 2014, List 2001, Kruien et al. 2015). Indeed, enapsulated by the onept of inentive ompatibility, there exists growing evidene supporting the early ritiisms of Wallis and Friedman (1942) that respondents ating in a utility maximising manner may behave strategially rather than reveal their true preferenes when answering SC surveys (e.g., Carson and Groves 2007). Given the ontinued need to provide foreasts and inputs into benefit ost ratio (BCR) alulations for new or emerging tehnology and large sale infrastruture projets, as well as to derive estimates as to the value of non-market goods for purposes of poliy analysis, a number of researhers, rather than abandon SC experiments, have explored alternative strategies to either stimulate respondents to at identially to how they would behave if faed with similar hoies in real markets, or minimise any biases that might arise if they were to not make hoies that reflet their true preferenes. Reent attempts to make SC hoie tasks more realisti and less prone to hypothetial bias have taken many forms. Making SC hoie tasks more inentive-ompatible by inreasing the onsequentiality of the hoies made by ensuring that respondents fae some real outome or onsequene from the hoies they make, referred to as inentive alignment (e.g., Ding 2007, Harrison 2007, Vossler and Evans 2009, Herriges et al. 2010), or via the individual ustomisation of SC hoie tasks to deision maker speifi experienes (e.g., Rose et al. 2008; Train and Wilson 2008), represent just two approahes researhers employ. The inentive ompatibility requirement that respondents experiene one of their hoies may not always be feasible, partiularly when the experiment involves some new hypothetial alternative or tehnology (e.g., a new metro mode that is yet to be built), some non-market good that may not be readily aessible to them (e.g., a study designed to value the protetion of a river system in Afria), a senario in whih the alternatives are partiularly ostly (e.g., new ar hoie), or requires extensive linial trials before release to the market (e.g., a new aner fighting mediation). As a onsequene, most studies tend to ignore the issue ompletely or rely on the soft approah of reminding respondents about the impat their hoies will have on their urrent expenditure patterns, as with the heap talk tehnique (e.g., Arrow et al. 1993). Even with suh reminders, however, it is possible for respondents undertaking SC tasks to ignore or underestimate their true budget onstraints, whih will signifiantly impat on the study outomes. Wardman (2001) and Brownstone and Small (2005) both argue that respondents tend to ignore budget onstraints and selet higher-ost alternatives more frequently in hypothetial surveys as opposed to in real life. A further potential issue with SC surveys lies in the ability of respondents to omplete lengthy questionnaires. Whilst there exists no restrition as to how muh information respondents an provide analysts in theory, empirially respondents are only able to provide a finite amount of information
4 before beoming bored or ognitively impaired. As suh, SC experiments are typially onstrained to examine only a single hoie ontext (e.g., work trip mode hoie, hoie of headahe mediation, preferene for alternative environmental poliies related to a speifi river system). Suh a restrition limits the onsumption set available to individual deision makers to a set of finite alternatives defined by the ontext being examined. For example, in applied transportation studies involving mode hoie, the hoie set faed by individual deision makers will be defined by the alternative modes of transport available to them given a speifi trip ontext. Thus, SC experiments are always devised under the assumption of preferene separability, and hene assume that substitution and trade-off effets our only within a subset of onsumption over an exogenously determined portion of the budget (e.g., Deaton and Muellbauer 1980). Preferene separability only holds, however, if the pries (and non-prie attributes) of all goods outside of the onsumption set under diret onsideration are the same for all deision makers (e.g., Deaton 1974). This assumption is unlikely to hold in pratie, in whih ase SC experiments are no longer onsistent with basi miro-eonomi theory. Demand analysis, as derived from miro-eonomi theory, is a powerful tool for the measurement of the behavioural and distributional effets of ounterfatual prie, inome and quality hanges. Typial demand analysis researh involves the estimation of the unknown parameters of a parametri demand system, whih are then applied to alulate a post-reform hange in demand as well as alulate any orresponding hanges to welfare that might our (e.g., Banks et al. 1997). Early eonomi theorists working on demand analysis developed the oneptual framework of utility trees to desribe the budget alloation of individual agents (e.g., Furubotn 1963, Gorman 1959, Stotz 1957, 1959), noting that under onsumer theory, ommodities that are lose substitutes are more likely to satisfy the same need, and hene belong to the same branh or hierarhy within the utility tree than ommodities that are not substitutes (Drakopoulos 1994). This led to the now frequently imposed assumption in both theoretial and applied demand studies known as weak separability of utility, where a group of goods is deemed to be weakly separable if the marginal rate of substitution (MRS) between any two goods in the group is independent from the quantities onsumed of any outside good, or strongly separable if the value of a ommodity is independent of the MRS between any two goods loated in a separate utility branh (e.g., Leontief 1947; Sono 1961, Stotz 1959). The assumption of separable preferenes is ubiquitous in studies of aggregate level demand, with numerous studies providing examples of miro-eonomially rigorous simultaneous-equation models of onsumer demand for goods and servies whih are onsistent with the idea of weak utility separability (e.g., Deaton 1987, Deaton and Muellbauer 1980, Lau 1986, Pollak and Wales 1978 and Stone 1954). To date, these empirial studies have mostly made use of revealed preferene data and tended to rely on two main approahes to test for preferene separability; (i) the use of eonometri methods to verify ertain parameter restritions on a given demand model, and (ii) tests related to the generalised axiom of revealed preferene (GARP) (see Afriat 1967, Varian 1982, Diewert and Parkan 1985) that assess whether the revealed preferene onditions that haraterise the olletion of data sets that are rationalisable by a (weakly or strong) separable utility funtion hold. Speifially, Varian (1983) developed a test for the joint hypothesis of separability and onavity of utility that involves solving a system of polynomial inequalities. This test was later operationalised by Cherhye et al. (2015). Subsequently, Browning and Meghir (1991) developed a parametri eonometri test for preferene separability based on revealed preferene data. More reently, Quah (2012) developed an alternative proess to test for separability alone, without the assumption of onavity of utility, however the test developed makes severe restritions on the number of goods that an be onsidered. Independent of the above researh, Blundell et al. (2003, 2007, 2008) developed a nonparametri test for separability restritions. Whilst there exist some studies involving disaggregate level demand data that are onerned with the topi of preferene separability, suh onerns appear yet to be disussed within the framework of SC data. Nevertheless, many SC experiments inlude an opt-out alternative, whih impliitly aknowledges the presene of outside goods in the data generation proess. As noted by Rose and Hess (2009) however, there exist multiple representations of how opt out alternatives have been inluded within SC surveys. Traditionally, the opt out alternative was presented to respondents either as a none alternative devoid of any attribute levels, or alternatively as an option labelled as your urrent alternative with attribute levels given simply as at the urrent level (see e.g., Dhar 1997). More reently, for studies dealing with environmental goods, it is not unommon to provide respondents with a status quo alternative desribed by levels whih are invariant aross respondents.
5 Somewhat different is the transportation literature where it is now ommon to use as an opt out alternative, a referene alternative onstruted using levels related to some reent experiene as reported by the respondent undertaking the questionnaire. Unfortunately, different types of opt out alternatives may indue different types of responses arising from interpretational disrepanies, and even when interpretation is onsistent between respondents, differenes may arise due to pereptual or preferene differenes. In the urrent paper, we seek to examine the role outside goods have on SC experiments. In doing so, we propose a method that also potentially has impliations for the inentive ompatibility of suh experiments. Reported herein are two empirial studies in whih respondents ompleting SC experiments were also tasked with having to realloate their existing household budget in order to aommodate the assoiated osts of their hoies. Whilst the ontext of both studies is vehile hoie, in the first study, we provide a within subjet omparison between a traditionally framed hoie task and one requiring the additional household budget realloation assignment, whilst the seond study involves a between subjet omparison involving similar question treatments. For the first study, we find signifiant hanges in the hoies made by respondents when they are required to also omplete the household budget realloation task. Surprisingly, whilst the seond task is likely to indue substantial more ognitive burden to omplete, we found over 20 perent of the sample opting into the market after originally seleting the no hoie alternative in the more traditional task. In the seond study, we also find substantial differenes between the results obtained from the two tasks. In both ases, we provide a more realisti hoie senario, whereby respondents are also able to adjust the impat of their hoies in the SC task by making additional hoies, suh as using savings or money earned from selling existing vehiles to offset the ost of purhasing a vehile in the SC questions asked. It is our argument that allowing for a more realisti set of interrelated hoie outomes, is likely to improve the inentive ompatibility of SC tasks. Further, we argue that by foring respondents to realloate their existing household budget based on related hoies observed in a SC experiment, respondents are diretly onfronted with the budgetary impat of their hoies, further adding to the inentive ompatibility of the survey task performed. The remainder of the paper is strutured as follows. In Setion 2, we disuss the within subjet ase study, where respondents are first exposed to a traditional hoie task, after whih they are onfronted with the same task, but the additional requirement to indiate how they would realloate their household budget based on their observed hoie. Next, Setion 3 details a seond study, involving a between subjets omparison similar to that undertaken by respondents involved in the first study. Here we demonstrate how suh data an be modelled in a single framework, involving the estimation of disrete hoie models alongside a multiple disrete ontinuous model. Finally, Setion 4 provides a general disussion and onlusion to the paper. 2.0 STUDY I 2.1 Survey Respondents were asked to omplete an internet questionnaire related to vehile hoie with several setions (shown in Figure 1). After providing onsent to partiipate in the survey, respondents were asked to indiate how muh their household spends in a typial month on a number of ommon expenditure ategories (see Figure 2). Next, respondents were asked a series of questions related to their urrent vehile fleet, after whih they were asked were to omplete a stated hoie (SC) experiment onsisting of four fored hoie SC questions. So as to order to apture market size variability impats, eah of the four SC tasks onsisting of a variable number of alternatives (between two and eight) represented as different vehile body types and olour shemes, whih were further desribed by a set of 12 attributes. These inluded the year of manufature of the vehile, the number of kilometres the vehile had on its odometer (onstrained to zero if the vehile was manufatured in 2015), how many seats the vehile had, the type of fuel the vehile used (onsisting of engines whih are pure eletri, hybrid, diesel or petrol), the number of ylinders (onstrained to zero for pure eletri vehiles), and the range of the vehile if the vehile had a pure eletri engine.
.")
6 Figure 1: Study 1 survey struture Other attributes inluded a rating system desribing the vehile ride performane and level of omfort of the interior. The rating system adopted to desribe these attributes was based on real ar sale websites (in partiular The remaining attributes desribe the air pollution rating of the vehile based on a 0 to 10 point sale, the vehile fuel onsumption level, and a variable that desribes the amount of noise when at rest of the vehile (also on a 0 to 10 point sale). The noise and air pollution rating attributes were based on the green vehile guide website established by the Australian Federal government ( final attribute was the prie of vehile. A Bayesian effiient experimental design was implemented based on priors obtained from a previous study that made use of similar stated hoie survey questions (see Rose and Bliemer 2014b). The design allowed for variable hoie set sizes, as desribed in Rose et al. (2013).

7 Figure 2: Household monthly expenditure After ompleting the four fored hoie tasks, respondents were next presented with a sreen showing simultaneously the four SC sreens, and asked whih of the four hoie tasks they would most prefer to visit when looking to purhase a vehile, assuming eah individual market represented a different ar yard or market. After making a hoie of hoie task, respondents were presented with a fifth vehile hoie task, whih onsisted four alternatives, these being the alternatives seleted in the first four SC questions. An example hoie task, based on this question is shown in Figure 3. Figure 3: Study I example hoie sreen Next, respondents where shown a repeat of the previous hoie task (onsisting of the four preferred vehiles based on the initial four hoie tasks ompleted), however this time, in addition to being shown the overall vehile prie, respondents were also shown the monthly repayments for their seleted vehile, as well as being given an offer prie for selling any of their existing vehile fleet, and an adjustment to the minimum monthly repayments should they sell any of their existing vehiles. At the bottom of the sreen, their monthly household budget given earlier in the survey was shown bak to them. With this additional information, respondents where then asked an additional hoie question, onsisting of whether they would not buy any of the vehiles shown, purhase their preferred vehile and if the vehile was to be purhased, whether they would keep all their existing vehiles or sell one or more of them. Respondents were able to hange their preferred vehile from that seleted in the previous task, and in doing so the repayments required that were shown were also adjusted, but not the offer pries of vehiles in their existing fleet. For respondents who eleted to

8 purhase any of the vehiles shown, they were next tasked with having to adjust their monthly household budget to aount for how they would meet the vehile repayments. An example of this task is shown in Figure 4. Figure 4: Study I example hoie sreen with budget adjustment question The final setion of the survey involved respondents answering questions about themselves as well as providing general information about their household. Information olleted inluded data on the respondent s age and gender, highest eduation attained, employment status, annual inome before tax, as well as the number of adults and hildren living in their household at the time of the survey Sample A total of 1,000 respondents ompleted an internet based survey, sampled using the internet panel PureProfile ( The survey was onduted the week ommening the 13 th April Eligible respondents, drawn from the Australian population, had to be over 18 years of age and either have purhased a vehile in the past 12 months or be urrently in the market to buy a vehile in the next 12 months. Respondents were asked at the ommenement of the survey to provide information related to their average monthly spending for a range of typial household expenditure items, inluding savings (see Figure 1). Data from 88 respondents were removed during data leaning as a result of providing what was onsidered to be nonsensial answers to the household expenditure
9 question (e.g., spending zero dollars for food, or reporting a total expenditure that was less than their own net inome levels), thus resulting in data from 912 respondents being available for use in the final analysis. Of the final sample, perent of respondents had reported purhasing a vehile in the previous 12 months with the remainder being in the market for a new vehile. Further, 1.21 perent of respondents reported belonging to a household that does not urrently own a vehile and hene were in the market for an automobile for the first time. The remaining respondents reported belonging to households with an average vehile ownership of 1.61 vehiles, with perent of households having one vehile, perent two vehiles and the remaining 9.32 perent having three or more vehiles. The average prie paid for a vehile at the time of purhase was $23, with a median year of manufature being 2007 and year of purhase The average age of the respondents was 48.83, with perent being female. Average personal net inome reported for the sample was $36, per annum, and for the sample, the average household size was 2.75, onsisting of 2.05 adults and 0.70 hildren Results Given the nature of the data, we do not report models but rather explore desriptively how respondents hange their hoies between the two omparable tasks, with and without the budget realloation task. The deision not to estimate models was based on two fators. Firstly, the pre and post budget questions were aptured for only a single hoie task, whih provided very poor model results when aounting for the large number of attributes and alternatives over suh a small number of observations. Seondly, as will be disussed below, hanges in hoies between the two tasks where observed to be mainly onfined to respondents either hanging their initial vehile hoie to the no hoie alternative, or seleting a vehile after initially hoosing none of the available vehile alternatives. Very few hanges where observed to have ourred between vehiles shown within the hoie tasks. Suh hoie behaviour, alongside the omplexity of the task itself, provides little understanding of the marginal utilities of the individual attributes, but rather provides interesting insights into what role the outside goods, as portrayed via the household budget items, plays on the hoie proess. Table 1 presents a ross tabulation of the hoie data aptured in the first study. Within the table, the row totals reflet the number of times a partiular vehile type was seleted in the first task (without budget realloation), whilst the olumn totals reflet the number of times a vehile type was hosen in the seond task when respondents were asked to indiate how they would hange their monthly household budget given the vehile repayments required given the vehile hosen. For example, from the table it an be seen that 40 respondents seleted a station wagon as their preferred vehile in the first task, whilst 54 respondents hose a station wagon as their preferred vehile in the seond task. The leading diagonal of the table reflets the number of times respondents seleted the same alternatives in both tasks. For example, 21 respondents seleted a station wagon in both tasks (i.e., did not hange their initial hoie), whilst 52 hoose the same SUV in both tasks. Three hundred and fifteen respondents hoose none of the vehiles in both tasks. Within the table, elements shown above the leading diagonal in light grey relate the number of respondents who hanged their hoie upon being asked to indiate how they would have to hange their monthly household budget based on their vehile hoie. Thus for example, of the 40 respondents who hose a station wagon as their most preferred vehile in the first task, two of those hoose an alternative vehile (i.e., one to a oupe and one to a ute/4 wheel drive) whilst 17 swithed their hoie to the no hoie alternative. Four respondents seleted a different vehile of the same body type, as shown in the olumn titled Same body type. One hundred and fifty five respondents hanged their hoie from one vehile to no vehile when asked to omplete the household budget omponent in the seond task. Elements below the leading diagonal in the table show whih vehile types respondents swithed from. For example, 32 respondents who hose the no hoie alternative in the first task, hose a station wagon in the seond task, whilst one who had seleted an SUV swithed to a station wagon. In total, 202 respondents who hose no vehile in the first task, seleted a vehile when asked to omplete the household budget omponent in the seond task.
10 Table 1: Study 1 results Convertible Station wagon Ute/4WD Sedan Coupe Hath -bak Family van SUV Same body type None Total (no budget) Convertible (1.64%) Station wagon (4.39%) Ute/4WD (4.71%) Sedan (7.57%) Coupe (4.61%) Hath bak (7.24%) Family van (2.52%) SUV (9.65%) Same body type (0.44%) None (57.24%) Total (budget) 28 (3.07%) 54 (5.92%) 51 (5.59%) 82 (8.99%) 39 (4.28%) 61 (6.69%) 36 (3.95%) 87 (9.54%) 4 (0.44%) 470 (51.54%) In total, 376 or perent of respondents altered their initial hoie when asked to detail how they would have to hange their monthly household budget to pay for their preferred vehile. Of the 155 who originally seleted a vehile but later eleted no vehile in the seond task, the median vehile prie for the vehiles shown in the two tasks was $27,115 (mean $34,529.40), representing an average monthly repayment of $637.82, translating to approximately perent of the monthly household budget for these respondents. In omparison, for the 202 respondents who seleted none of the vehiles in the initial task but eleted to purhase a vehile in the seond task, the median vehile prie was $27,510 (mean $30,160.14), representing an average monthly repayment $560.68, or perent of household monthly budget of these respondents. Of the 536 respondents who retained their initial vehile hoie in the seond task, 315 hose none of the vehiles in both tasks. The median vehile prie for these respondents was $29, (mean $39,757.73), with an average monthly repayment of $ per month, or perent of the household monthly budget for these respondents. Of the remaining 221 respondents who seleted the same vehile in both tasks, the median vehile ost for all vehiles shown in the two tasks was $25,225 (mean $30,196.25) with an average monthly repayment of $576.64, representing perent of the monthly budget for these respondents. Based on the above results, there appears to exist some threshold in terms of the amount of monthly repayments required when purhasing a vehile as a proportion of the total monthly household budget. In the aggregate, when repayments exeed 20 perent of the household budget, respondents elet not to purhase any of the vehiles, whereas repayments less than 20 perent of the total household budget tend to result in the deision to purhase a vehile. 3 STUDY II 3.1 Survey As with those who ompleted the survey in the first study, respondents reruited to the seond study were tasked with ompleting an online questionnaire that involved several different survey setions. As before, after obtaining onsent from the respondent, the survey started by asking respondents to provide information as to their monthly household budget, in addition to any savings they had, whih had not been asked in study I. Next, answers to questions relating to the existing vehile fleet of the household were aptured, after whih respondents were introdued to a SC experiment. Unlike the first study however, respondents were randomly assigned to one of two treatment groups. Respondents assigned to the first treatment group (referred to as G1 hereafter) ompleted four SC tasks, involving vehile hoie using the same experimental design setup developed for the first study. As suh, respondents were exposed to several alternative vehiles and asked to selet their most preferred vehile from the set shown, with the number of vehiles shown in eah task varying from two to eight aording to the same availability design employed in Study I. The attributes and attribute levels were also those used for the first study. The main differene between the hoie tasks used for Study I and those for those assigned to treatment group G1 in Study II lies with the response mehanism employed. Whilst both experiments asked respondents to first selet their most preferred vehile from those shown, respondents in G1 where subsequently shown the repayments required for the seleted vehile and asked given the repayment value if they would not purhase their preferred vehile, buy the preferred vehile and keep all vehiles in their existing fleet, or buy the preferred 912 (100%)

11 vehile and sell one or more of the urrent household vehiles. A further differene between the two studies meant that those involved in Study II where also able to alloate any savings they urrently have towards the purhase of the new vehile, therefore minimising the monthly repayments required. Figure 5 shows an example hoie task for those assigned to G1. In the example, the respondent previously indiated that household had zero savings available to them (an example of the household savings alloation task is given in Figure 6). Figure 5: Study II example hoie sreen shown to treatment group 1 For respondents assigned to treatment group G2, the hoie tasks looked similar to those shown to G1, however respondents were additionally required to indiate how they would realloate their monthly household budget to aount for any vehile repayments required if they eleted to purhase their preferred vehile. Unlike the task in Study I, respondents were required to omplete the budget realloation for all four hoie tasks. As with the task given to those assigned to group G1, respondents were also able to offset the vehile purhase prie by alloating any savings they had, therefore reduing the monthly repayments required to be made for their hosen vehile. Figure 6 provides a sreen apture of the task required for those assigned to treatment group G2. In the example shown, the household has indiated that they do not urrently own a vehile, hene they are not offered the opportunity to sell a vehile to redue their monthly repayments. For households with an existing vehile, respondents were given the opportunity to sell the vehile and hene redue the required monthly repayments. The final setion of the survey involved olleting information on the soio-demographi harateristis of the respondent as well as about the size of the household. For onsisteny reasons, the same questions aptured in the first survey were used in the seond study Sample A total of 998 respondents ompleted the seond internet based survey. Respondents for the seond study were drawn from an internet panel provided by PureProfile ( The survey was onduted the week ommening the 9 th Deember Eligible respondents, drawn from the population of Australia, had to be over 18 years of age and either have purhased a vehile in the past 12 months or be urrently in the market to buy a vehile in the next 12 months, and not have taken part in the Study I survey onduted earlier that year. Respondents were asked at the ommenement of the survey to provide information related to their average monthly spending for a range of typial household expenditure items, inluding savings (see Figure 1). Data from 27 respondents were removed during data leaning as a result of providing what was onsidered to be nonsensial answers to the household expenditure question (e.g., spending zero dollars for food, or reporting a total
.")
12 expenditure that was less than their own net inome levels), thus resulting in data from 971 respondents being available for use in the final analysis. Figure 6: Study II example hoie sreen with budget adjustment question Upon reruitment, respondents were randomly assigned to one of two treatment groups (referred to as G1 and G2 throughout). Both treatment groups undertook the same SC experiment related to vehile hoie, however the seond group where asked to omplete questions about how they would realloate their household budget based on their hoies made. In this way, the first group ated as a ontrol group, undertaking a survey similar to urrent pratie involving SC experiments. A total of 498 respondents were assigned to treatment group G1, with the remaining 473 respondents alloated to treatment group G2. Table 2 provides a summary of the desriptive statistis of the soiodemographi breakdowns of the two samples. With the exeption of gender, no statistial differenes
13 between the two treatment groups was found to exist. Whilst overall, females made up 43 perent of the data, a larger proportion of females relative to males were alloated to the seond group, whilst a majority of males where sampled into the first group. Table 2: Study 2 soio-demographi harateristis Overall sample G1: No budget realloation task G2: Budget realloation task Respondent harateristis Age Female (%) Weekly inome $1, $1, $1, Respondent highest eduation level High shool Diploma Bahelor s degree Post graduate degree Other Employment lass Full time student Part time student Employed full time Employed part time Employed asual Not working for pay Full time homemaker Regular volunteer worker Retired/Pensioner Unemployed & seeking Other Household harateristis Num. of driver lienes in HH Num. of hildren in HH Num. of adults in HH Eonometri model All respondents, irrespetive of whether they were assigned to treatment group G1 or G2, were asked to omplete a series of disrete hoie tasks involving the seletion of their preferred hoie of vehile type out of the set shown. Respondents were first asked to indiate whih vehile they prefer the most, after whih they ould indiate whether they would likely purhase the vehile or not, thus allowing for the possibility of not seleting any of the vehiles shown. For the urrent study, we onentrate on the unfored hoie. In the urrent study, we estimate mixed multinomial logit (MMNL) models to explain the vehile hoie (inluding no hoie). In making their vehile seletion, respondents were further able to elet to sell any vehile they urrently hold within their vehile fleet mix, as well as use any savings they might have, so as to redue the monthly payments required. The ability for respondents to affet the possible vehile monthly repayments via the sale of one or more urrently owned household vehiles or the use of any savings represents a possible soure of endogeneity. To aount for this possibility, we estimate Probit models to explain whether or not respondents hoose to sell any of the existing household vehiles, and a Tobit model to model the amount of household savings alloated to redue the prie paid for their preferred vehile. Endogeneity in the system of resulting equations is addressed via the inlusion of an additional orrelated random term assoiated with eah of the Probit, Tobit and MMNL models. For those assigned to treatment group G2, respondents were further asked how they would realloate their monthly household budget given the hosen vehile in the SC experiment, noting no budget realloation was neessary if none of the vehiles was seleted. For this seond treatment group, we estimate simultaneous with the MMNL, Probit, and Tobit models used to expliate vehile hoie, vehile fleet hange and use of any savings, a multiple disrete ontinuous extreme value (MDCEV) model to explain the observed budget realloation task. In doing so, we allow for simultaneous feedbak between the SC task and budget realloation task, and the budget realloation task and SC task. We explain eah of the individual models, and the ombined simultaneous estimation of all models, in the setions that follow.
14 3.2.1 Probit model: Aounting for vehile fleet sales Before undertaking the SC questions, respondents were asked to provide information for up to three vehiles that urrently make up their household vehile fleet, inluding data on vehile age, the age at whih the vehile entered the household, the prie of the vehile at time of purhase, the vehile make and model, engine size, et. Based on the vehile age and purhase prie, respondents were provided with offers to sell one or more of their existing household vehiles in order to redue the monthly ost assoiated with their hoie of vehile in eah of the four SC senarios. The offers for eah vehile were varied slightly in eah task. We model the hoie as to whether or not a respondent elets to sell the l th household vehile, assuming the household urrently owns one, using a series of binary Probit models. Let the utility for respondent n in hoie task t assoiated with selling vehile l, be u ntl θvnl ση v n1 tntl, = + + (1) where θ is a vetor of parameters related to harateristis desribing vehile l=1,2,3, held by the household to whih respondent n belongs, η n1 is a random term following a standard normal distribution whih is orrelated with similar random terms assoiated with the Tobit and MMNL models, σ v represents a standard deviation parameter assoiated with the orrelated random term, η 1 n, t ~ iid... N 0,1. and ntl t is a random disturbane term, distributed ( ) Assigning a utility of zero to not selling vehile l, the probability that respondent n will hoose to sell the vehile is given as ( u > ) = ( θv + ση 1 + t > ) = ( + + > ) ( ) ( ) Pr 0 Pr 0, ntl ntl nl v n ntl I 1 l θvnl ση v n1 tntl ϕ ηn 1 φ tntl dηn 1dtntl where I (.) values of n1 l η t ntl 0, is an indiator of whether the statement in parenthesis holds, and the integral is over all η and t. ntl Separate binary Probit models are estimated for eah vehile owned by a household, suh that for any given respondent, there may exist between zero and three suh models. Within respondent, eah estimated binary hoie model is orrelated via the ommon random term, η, n1 with the parameter vetor assoiated with the vehile harateristis, θ, also held onstant aross eah of the three possible models. The final model models the probability of observing the sequene of hoies over hoie tasks and vehiles. This hoie probability shown in Equation (3), is T = 4 Ln * Y ntl Prn = E Pr ntl, (3) t l where the expetation is over the random η n1 values, whih make the probabilities Pr ntl random, and Yntl is a binary variable equal to one if respondent n in hoie task t hooses to sell vehile l, or zero otherwise. Whilst binary hoie models are estimated only where a urrent household vehile is present, for * estimation purposes, the probability Pr n is fixed to a value of one in ases where a household has zero vehiles present. In this way, the final system of modelled equations does not impat on the estimation of the parameters, θ or σ v, but still allows for the speifiation of a fully integrated loglikelihood funtion over all modelled omponents. We disuss the reasoning for this further when we present the log-likelihood funtion for the final ombined model Tobit model: Using existing savings Respondents ompleting the SC task were able to redue monthly repayments by offsetting the vehile prie paid with any savings they had aumulated in the past. To model the amount of savings alloated to the vehile hoie, we use a Tobit model. Alloation of savings in the model is treated as a latent variable whih is explained via a linear funtion suh that (2)
15 S * nt κqn ηn2 πnt, = + + (4) * where S nt is the latent variable representing how muh respondent n in hoie task t uses in savings, inluding zero savings,κ is a vetor of parameters assoiated with household soio-eonomi harateristis, q n, ηn2 is a random term following a standard normal distribution, whih is orrelated with random terms from the Probit and MMNL models, and π nt is a random disturbane term, 2 distributed πnt iid N( σ S ) ~... 0,. Empirially, we observe the atual amount of savings alloated to the vehile purhase rather than the latent variable, S suh that S nt *, nt * * Snt if Snt >0 = * 0 if Snt 0, where zero represents a natural ensoring of savings used Base eonometri model: Vehile hoie In order to model the vehile hoie omponent of the survey, we make use of disrete hoie models. Denote the utility of vehile j, j = 1, K, J, pereived by respondent n in hoie task t as U ntj. Utility is assumed to be omprised of a systemati omponent, V nsj, and a random omponent, ε nsj, Untj = Vntj + ε ntj. The systemati omponent of utility, V ntj, for vehile j onsists of a funtion f j () of different attributes with levels X = [ x ntjk ] that haraterise the alternative (and an somehow be observed or measured), and a set of weights or taste parameters, β, V = f ( x, β ), ntj j ntj where xntj K R is a vetor of attribute levels for vehile j that define the alternative for respondent n in hoie task t, and β is a vetor of (unknown) parameters. The utility funtions an essentially have any form, however, in most appliations it is assumed that the utility is a linear ombination of the attributes, suh that we an write (5) (6) (7) V = υp + β x ntj ntj k ntjk k = 1 K, (8) where we have separated out the prie attribute, pntj, from the non-prie attributes, suh that υ is the parameter assoiated with prie. Rather than use the vehile prie, p ntj represents the minimum monthly repayments assoiated with vehile j, after adjusting for the sale of any existing vehile within the household fleet, as well as the use of any aumulated household savings. The systemati omponent of utility may also inlude alternative-speifi onstants (ASCs), whih may appear in the utility funtions of a maximum J 1 alternatives. The modelling framework outlined above allows for presene of a no hoie option, as is the ase with the urrent study. The utility of the no hoie alternative is void of attribute levels (e.g., there is no ost assoiated with not purhasing a vehile), and hene, the no hoie alternative an be assigned a utility of zero, or alternatively, have an ASC if the ASC of one of the other alternatives is normalised to zero. Assuming independently and identially distributed (IID) EV1 random omponents, the probability of deision maker n hoosing vehile j in hoie task t is, P ntj exp( Vntj ) =. exp( V ) (9) J i= 1 nti
16 For the present study, we estimate mixed multinomial logit (MMNL) models, whih allow for preferenes to be treated as if they are heterogeneous over the population suh that one or more parameters follow a ertain probability distribution. As suh, rather than assume fixed parameters β, we assume that β follows a given probability distribution with multivariate density φβ ( Ω ), where Ω is the vetor of parameters of the distribution. For the models estimated herein, we assume that the random parameters are independently distributed, suh that K φβ ( Ω ) = φ( β Ω ), k = 1 k k k where φk( βk Ω k) is the univariate density funtion for parameter β k. If a parameter β k is assumed to be fixed instead of random, then φ ( β ) = 1. k k We further allow for the possibility of an error omponent within the utility framework adopted herein. The speifiation of an error omponent involves the nesting of alternatives into subgroups, whih is ahieved by the speifiation of a dummy variable, suh that the dummy takes the value one if an alternative belongs to the subgroup, or zero otherwise. A normally distributed random parameter, with a mean of zero, is then assoiated with the dummy variable. Whilst eonometrially an error omponent is no different to a traditional random parameter in terms of how it is estimated, the interpretation given to both types of parameters is somewhat different. Whilst a traditional random parameter is interpreted as the marginal utility assoiated with a partiular level of the related attribute, x ntjk, the fat that an error omponent is a random parameter that is ommon to subsets of alternatives, but not speifi to any one attribute of the alternatives within that subset, means that it represent some unobserved orrelated shift in the utilities of all alternatives to whih it is assigned. Typially, the orrelation of utilities within the subset of alternatives is interpreted as representing some form of substitution pattern between the set of nested alternatives. In the urrent study, we assign an error omponent to the utilities of the vehiles, suh that they reflet a greater orrelation of substituting hoies between vehiles than with substituting a vehile with the no-hoie alternative. The utility funtion for eah vehile therefore beomes, K V = υp + b x + ση, ntj ntj k ntjk b n3 k = 1 where is a random term distributed N ( ) omponent. (10) (11) η ~ 0,1, n3 and σ b represents the standard deviation of the error As with the series of binary Probit models used to model the hoie as to whether a respondent hooses to sell a vehile or not, we model the probability of observing the sequene of hoies eah respondent makes over the t hoie tasks in the SC omponent of the experiment. Let yntj be a binary variable equal to one if respondent n selets alternative j in hoie task t, or zero otherwise. The probability, P is observed to make a ertain sequene of hoies, is given by n*, 4 J T = t * y nsj Pn = E Pnsj, (12) t j where the expetation is over the random term η n3, whih make the probabilities P nsj random as well Handling endogeneity: orrelated error terms Given that respondents hoosing to use existing household savings as well as sell existing household vehiles an potentially influene the minimum monthly payments required to be meet for eah of the alternatives ontained within the SC experiment, it is neessary to aount for the possible existene of endogeneity bias when estimating the ombined system of model equations (see Train 2009). To this end, we allow for orrelated error terms to be estimated for eah of the models assoiated with use of savings, the sale of existing vehiles, and the hoie of vehile in the SC tasks. The resulting multivariate Normal distribution is onstruted from the univariate Normal distributions η, n1 ηn2 and η, n3 suh that
17 ηn1 0 1 r1 r2 η : N 0, r 1 r, 1 rr 1, r = 1, 2,3. n2 1 3 η n3 0 r2 r3 1 The resulting Cholesky deomposition matrix for the variane-ovariane term of Equation (13) is 1 r1 r r1 r2 ρ 1 ρ = ρ a 0 0 a a ρ2 ρ3 1 ρ2 a2 a3 0 0 a 3 2 where a1 = 1 ρ1, a = 2 ( ρ ρρ 1 1 2) a, and a3 = 1 a1 a2, and where draws from this multivariate distribution are generated from independent N(0,1) draws, r 1, r 2 and r 3 as follows. r = r, n1 1 r = rr + ra, and n r = rr + ra + ra. n Whilst ρ 1 and ρ2 are parameters to be diretly estimated, ρ3 is omputed from the resulting Cholesky matrix. Given that ρ3 is not diretly estimated, we derive the standard error for this parameter using the Krinksy and Robb (1990) proedure MDCEV model: Household expenditure realloation task Respondents assigned to treatment group G2 were tasked with having to realloate their monthly household budget subjet to the repayment requirements given their hoie in the related SC task. The budget realloation task represents a form of multiple disreteness in whih deision makers are required to simultaneously alloate ontinuous amounts of some type, in this ase expenditure, towards two or more disrete outomes, representing as budget expenditure items in the urrent study. To model these outomes, we implement a version of Bhat s (2008) Multiple Disrete-Continuous Extreme Value (MDCEV) model, whih is based on the Kuhn Tuker (1951) first-order onditions for onstrained random utility maximization. The model assumes a generalised variant of onstant elastiity of substitution (CES) diret utility funtion α C γ e nt U ( x nt ) = ψ = 1 α γ where U(x nt ) is a quasi-onave, inreasing, and ontinuously differentiable funtion with respet to the expenditure quantity (Cx1)-vetor e (e nt 0 for all ) assoiated with hoie task s, and ψ, γ and α are parameters assoiated with budget item. ψ in Equation (16) represents the baseline utility, that being the marginal utility assoiated with zero expenditure, assoiated with expenditure item, and in order for Equation (16)to be valid in an eonomi sense, must be greater than or equal to zero. Likewise, γ must also greater than zero for all. The γ in Equation (16)assume several roles within the model framework. Firstly, γ shifts the point at whih the indifferene urves are asymptoti to the axes representing different amounts of expenditure between budget items. Seondly, γ allows for the possibility of orner solutions in terms of alloation amongst the C expenditure items. Finally, the value of γ impats on the steepness of the indifferene urve in the positive orthant, and as suh γ further ats as a satiation parameter, suh that the higher the value of γ, the less the satiation effet on the expenditure on item. Unlike γ, α has but a single role to play in terms of its impat on the interpretation of Equation (16). Taking a value less than or equal to 1, α ats as a satiation parameter, similar to the third role of γ. A value of α = 1 implies no satiation effet, whilst as α, the model implies immediate satiation (13) (14) (15) (16)
18 related to expenditure item (see Bhat 2008) for a more detailed explanation of the role eah of these parameters play in terms of the MDCEV model and its interpretation. The MDCEV model allows for the baseline utility for eah expenditure item ψ, to be parameterised suh that ψ = exp( x z ), n where Z n is a vetor of attributes haraterizing expenditure alternative, and may inlude a onstant for C-1 ψ funtions, or represent potentially harateristis of the deision maker n, and ξ is a vetor of parameters to be estimated. The exponential in Equation (17) ensures that ψ 0. In operationalising the model, so as to ensure α 0, α is parameterized as [1 exp( δ )], where δ is the parameter to be estimated. Further, to allow the satiation parameters (i.e., the α values) to vary aross individuals, Bhat (2005) speifies δn = ω' hn, where h n is a vetor of individual harateristis impating satiation for the th alternative, and θ is a orresponding vetor of parameters. Given γ > 0, γ is re-parametrising as exp( ϖ ). Additionally, the translation parameters an be allowed to vary aross individuals by speifying vn = ϕ v n, where v n is a vetor of individual harateristis for the th alternative, and ϕ is a orresponding vetor of parameters. As noted by Bhat (2008), γ and α both at as satiation parameters and as suh it is rarely possible to empirially identify both parameters simultaneously. Bhat (2008) therefore reommends to estimate either γ or α but not both. In the ase where γ is estimated, resulting in a model known as γ profile, the analyst normalises α = 0,. The α profile version of the model, involves estimation of α and the normalisation of γ = 1,. In the urrent study, we estimate the γ profile version of the MDECV model. Solving the optimal expenditure alloations by forming the Lagrangian and applying the Kuhn-Tuker onditions, Bhat (2008) shows that the utility assoiated with expenditure item in hoie task s, is given as * * ' * e nt Wnt = lξ zn + ( α 1)ln + 1 ln p, ( = 1, 2,..., C) γ pnt * ' e nt = lξ zn + σ ( α 1)ln + 1 ln p, ( = 1, 2,..., C), γ pnt where γ, α, ξ and zn are as per previously defined, e * nt is the optimal expenditure alloation assoiated with item, and p is the prie per unit assoiated with expenditure item, as made by nt respondent n in hoie task t. λ in Equation (18) is a sale parameter whih in the urrent study we normalise to 1.0. Given the prie per unit is equal to one for all expenditure items, and adopting a γ profile, Equation (18) ollapses to * * ' e nt Wnt = ξ zn ln + 1, ( = 1, 2,..., C). γ For hoie task s, the probability of a given onsumption vetor * * * * ( ) e, e, e,..., e, 0, 0,..., 0, where M of the C expenditure items has expenditure greater nt nt nt M nt than zero, is given as (17) (18) (19)
19 * * * * ( e1 e2 e3 e ) Prob,,,...,, 0, 0,..., 0 nt nt nt nt M nt M nt Wnt M nt M e nt 1 1 g = nt C M nt = 1 = 1 gnt W nt = ( Mnt 1)!, e = 1 (20) 1 α 1 where gnt = * whih ollapses to gt = * under the γ profile of the model, ent + g pnt ent + g assuming unit pries. A further point of larifiation about the MCDEV model speifiation used here is neessary. At the outset of the survey, we apture the household monthly expenditure for all items, save for the ar repayments item, whih by design are speifi to eah of the four SC task questions. Within the modelling proess, we inlude this base revealed preferene (RP) expenditure pattern alongside the observed expenditure patterns assoiated with the four SC tasks suh that T =5 rather than four for the MCDEV model. For the RP expenditure observation, no SC ar repayments are observed, and hene * e = 0 for this observation. n Combining the vehile hoie model with the MDCEV model: Allowing for feedbak relationships Respondents assigned to treatment group, G2, were asked to first make a hoie between a finite number of vehiles shown in a SC experiment, inluding a no hoie option, after whih depending on their response, they were asked to indiate how they would realloate their monthly household budget to aount for any repayments neessary given their aforementioned hoie. These monthly repayments ould potentially be redued if the respondent indiated that they would alloate existing savings to offset the purhase of the vehile, or similarly use money obtained from the sale of existing household vehiles. The overall task allowed respondents to hange their vehile hoie so as to explore the impliations on the household budget as well as make hanges to their existing vehile fleet. To aommodate the omplex hoie proess of the survey task, we hypothesis a model framework in whih the utility derived from the vehile hoie impats upon the sub omponent of utility assoiated with the vehile repayment expenditure ategory within the household budget realloation task, suh that a greater level of utility derived from a hosen vehile will result in a higher expenditure on repayments for the vehile within the household budget. We further hypothesis that as the utility assoiated with non-ar repayment expenditure ategories inrease, respondents are more likely to hoose none of the vehiles in the SC experiment given that these expenditure items represent ompeting outside goods in terms of possible household budget alloation. To aommodate the influene of the vehile hoie on the alloation of household expenditure towards possible vehile repayments, we ompute the expeted maximum utility (EMU), given as the familiar log-sum formula, for all alternatives j in the SC task save for the no hoie alternative. We ignore the no-hoie alternative in the EMU alulation, given our assumption that the relationship between the no hoie alternative and the budget alloation task exists for all non-ar repayment expenditure ategories, rather than the repayment alloation ategory itself. The EMU for hoie respondent n in task is given in Equation (21). J Vntj EMU nt = ln e, j, j none. (21) j= 1 The EMU from Equation (21) enters into the utility for the ar repayment expenditure item suh that Equation (19) for this item beomes * e repay, nt Wrepay, nt = ξ' zrepay, nt + temunt ln + 1, γ repay (22)
20 where τ is a parameter to be estimated, refleting the influene of the vehile hoie EMU on the utility assoiated with the ar repayment expenditure item. It is worth noting that the inlusion of the EMU into the ar repayment sub-utility funtion assoiated with observations related to the SC questions, means that the MCDEV model ontains indiretly random parameter terms. As with the treatment of the other modelled probabilities, we model the sequene of hoie probabilities over the t observations. Given the ommon set of draws, we estimate the sequene of hoie probabilities over the SC model and MCDEV model simultaneously. As suh, the hoie probability for the joint model beomes 4 J T= t T= 5 * y nsj Probn = E Pnsj Prob nt, t j t (23) where the expetation is over the random terms introdued via Equation (22). The feedbak loop between the budget realloation task and the SC questions is ompleted via the inlusion of the MCDEV sub-utilities for the non-ar repayment expenditure ategories into the utility funtion of the no hoie alternative of the SC model, as shown in Equation (24) Vnt, no = ϑ +ΨWnt, ar repayments, (24) where ϑ is an ASC assoiated with the no hoie alternative, and Ψ is a vetor of parameters assoiated with W nt Estimating the model: Log-likelihood funtion The presene of random parameters requires that the hoie probabilities of the model be integrated over the random parameter distribution assumed. Unfortunately, this represents an intratable problem from an analytial perspetive, whih in pratie is most ommonly solved by use of simulation methods. This involves taking multiple draws from the random parameter distribution and alulating the expetation of the hoie probability over the draws. A simulated maximum likelihood estimator is therefore used to maximise the log-likelihood funtion of the model based on the expeted hoie probabilities. Likewise, the presene of a random term within the Tobit model regression funtion means that it is neessary to use a simulated maximum likelihood estimator for the Tobit model. In order to estimate the parameters κ and σ S, simulated maximum likelihood funtion for the Tobit model is given as L κq + η 1 S κq η = E Φ + φ (25) 1 n n2 nt n n2 ln n ln 1 ln, Snt = 0 s Snt > 0 s s where Φ(.) is the inverse the umulative distribution funtion of a standard normal distribution, and φ (.) is the orresponding density funtion, and the expetation is over the random term η. 2 The overall simulated likelihood funtion for the entire model system, assuming hoie probabilities given in Equations (3), (12) and (23), ombined with the simulated log-likelihood funtion for the Tobit model, is given as LnL ( ) N * * 1 M = ln Prn Probn + ln L n. n= 1 * As noted previously, for households without an existing vehile, it is neessary to set Prn = 1, else the * * * term Prn P nprobn will equal zero, and the simulated log-likelihood funtion of the model will no longer be defined. We further note that for respondents assigned to treatment group G1 were not * required to omplete the budget realloation task, and hene for these respondents, Prob n does not appear in the log-likelihood funtion for this group. Further, only 11 respondents in treatment group G1 indiated in 16 hoie tasks that they would use existing savings to derease the vehile repayments. Unfortunately, this small number of observations does not allow for estimation of the (26) n
21 Tobit model omponent for this group, and as suh, the simulated log-likelihood funtion for this group ollapses to LnL N * * ( P ) = ln Pr. M n n n= 1 All models are estimated using Python Biogeme 2.4 (Bierlaire 2016). Ten thousand Modified Latin Hyperube Sampling (MLHS) pseudo random draws (see Hensher et al. 2015) were used in estimating the simulated log-likelihood funtion of the models. 3.3 Results Table 3 presents the results of two models, one for eah treatment group, G1 and G2. As noted in the previous setion, there exists insuffiient observations to model the use of savings to derease the vehile repayments for treatment group G1. For treatment group G2, 154 respondents in 290 hoie tasks suggested they would use existing savings to redue vehile repayments, whih provides suffiient data to model this outome. The large negative onstant for the Tobit model assoiated with treatment group G2 supports the observation that the vast majority of respondents hoose not to use existing savings when onsidering purhasing a new vehile. After extensive testing, the weekly inome of the respondent and number of hildren in a household were found to be statistially signifiant in determining how muh savings would be employed to redue overall vehile repayments. The positive parameter assoiated with weekly inome suggests that higher earning respondents are more likely to use a greater amount of savings to offset the purhase prie of a vehile in the SC tasks, likely the result of suh individuals having a larger sum of savings available to do so. The positive parameter assoiated with the number of hildren resident within a household suggests that families with more hildren are more likely to use larger amounts of existing savings to redue vehile repayments for newly purhased vehiles. We hypothesis that by reduing vehile repayments by using savings to redue the priniple owing on a newly purhased vehile, households with more hildren have aess to greater disretionary inome whih provides greater flexibility in monthly expenditure patterns. The seond setion of Table 3 reports the results from the series of Probit models used to model the probability that respondents will sell vehiles from their existing household fleet in order to subsidise the purhase of a new vehile in the SC tasks. For both treatment groups, there exists a statistially signifiant negative onstant, suggesting that, all else being equal, respondents are unlikely to sell an existing vehile as a replaement for a new vehile within the SC tasks. This effet appears to be muh more pronouned for those assigned to treatment group G2, than for those belonging to the first treatment group. For treatment group G1, the number of vehiles that urrently belong to a household as well as the square root of the age eah of the vehiles were found to explain whether or the vehile would be sold or not. For treatment group G2, only the square root of the age eah of the household vehiles was found to be statistially signifiant. Other variables tested, inluding soio-demographi harateristis of the respondent, the harateristis of the household, and additional attributes of the existing vehile were not found to influene this hoie. Surprisingly, for treatment G1, the number of vehiles urrently owned by a household was found to be negatively related to respondents indiating they would sell the vehile. This suggests that by and large, the sample would prefer to inrease the size of their urrent vehile fleet holdings rather than use the purhase of an additional vehile as a replaement vehile. As is to be expeted, for both samples, older vehiles are more likely to be replaed than newer vehiles, all else being equal. The next two setions of Table 3 present the results for the vehile hoie experiment. First to be presented are the parameters assoiated with the vehile attributes, after whih the parameters related to the no-hoie alternative are reported, inluding feedbak parameters from the MCDEV model for treatment group G2. Models for both samples involve estimation of a series of random and fixed parameters. With the exeption of the prie parameter, all random parameters are assumed to be normally distributed. For the prie parameter, the parameter is assumed to follow a negative lognormal distribution. Different preferene strutures are observed for the two samples with regards to vehile olour. For sample G1, there exists signifiant preferene heterogeneity for blue oloured vehiles, however on average there appears to be no preferene either for or against blue ars. No other vehile olour effets were found for this sample. For sample G2 however, there is found to exist signifiant preferene heterogeneity assoiated with green, red, and silver oloured vehiles, with a statistially signifiant negative average preferene being observed against red and silver (27)
22 vehiles, but with no average effet against green oloured vehiles. Blue oloured vehiles were not found to have an influene, either positive or negative on the hoie of vehile. Table 3: Study II results G1: No budget G2: Budget with MDCEV Mean par. Std Dev. par. Mean par. Std Dev. par. Name Par. (t-test) Par. (t-test) Par. (t-test) Par. (t-test) Savings: Tobit Model Constant , (-13.23) - - Number of hildren in HH , (3.49) - - Weekly inome (3.18) - - Sigma (σ s ) , (20.53) - - Sale of existing vehile fleet: Probit Model Constant (-7.86) (-16.69) - - Age of vehile (9.74) (6.38) - - Number of vehiles in HH fleet (-5.51) Sigma (σ v ) (-7.86) Stated hoie experiment: vehile hoie parameters Vehile olour: Blue (-0.99) (3.11) Vehile olour: Green (-1.46) (3.38) Vehile olour: Red (-2.04) (3.23) Vehile olour: Silver (-1.91) (3.52) Vehile type: Coupe (0.44) (1.74) (-1.49) (5.15) Vehile type: Hathbak (-2.16) - - Vehile type: Sedan (4.27) Vehile type: Station wagon (-3.11) (4.25) Vehile type: SUV (4.23) Vehile type: Ute (-2.77) (4.09) (0.43) (4.27) Comfort rating (2.54) (-0.25) (5.00) Diesel fuel (-1.77) (-1.08) (4.41) Num. of Cylinders (-1.12) (2.52) (1.05) (2.38) Number of seats (2.42) (2.42) - - Odometer (-3.60) (3.27) (-5.25) (6.05) Performane rating (3.85) (1.16) (3.01) Pollution rating (1.65) (3.19) Prie (-33.57) (12.69) (-30.32) (7.57) Error omponent (σ b ) (3.65) (5.98) Stated hoie experiment: No hoie parameters Constant (no hoie) (-2.62) (3.96) - - W(Entertainment) (-0.67) 0.06 (1.75) W(Misellaneous) (-1.47) 0.06 (2.55) W(Rent/mortgage) (-2.31) 0.13 (2.43) Endogeneity orrelation parameters ρ(probit,tobit) (6.12) - - ρ(probit,sc) (-2.93) (1.99) - - ρ(tobit,sc) * (4.64) - - MDCEV model Sub utility funtions ѱ ASC Entertainment (-13.11) - - Num. hildren in HH - entertainment (-7.60) - - ASC General household bills (-6.68) - - ASC Misellaneous (-13.46) - - Num. hildren in HH - Misellaneous (-2.59) - - ASC Rent/mortgage (-17.03) - - Num. adults in HH rent/mortgage (-4.43) - - Num. hildren in HH - rent/mortgage (4.62) - - ASC Savings (-17.42) - - Num. hildren in HH - savings (-3.14) - - ASC general shopping (-13.08) - - Num. hildren in HH - general shopping (-6.96) - - ASC Transport (-8.76) - - ASC Other expenditure (-20.18) - - Num. adults in HH -other (-1.99) - - Num. hildren in HH - other (-1.77) - - ASC Vehile repayments (-17.43) - - τ(emu) (8.32) - -
23 Table 3 Study II results (ont d) MDCEV model Gamma funtions (ϒ ) ASC Entertainment (35.84) - - Age - entertainment (-5.24) - - ASC General household bills (17.28) - - Age - general bills (6.18) - - Female - general bills (3.43) - - ASC Groeries (6.16) - - ASC Misellaneous (63.20) - - Female - misellaneous (-2.34) - - ASC Rent/mortgage (87.06) - - Female - rent/mortgage (2.40) - - ASC Savings (38.80) - - Age - savings (-2.85) - - Female - savings (-7.02) - - ASC General shopping (61.80) - - Female - general shopping (-2.25) - - ASC Transport (35.68) - - ASC Other expenditure (65.43) - - Female - other expenditure (-2.52) - - ASC Vehile repayments (15.57) - - Age - vehile repayment (-2.10) - - Model fit LL(0) , LL(β) , ρ adj. ρ Num. par Sample size * Standard error omputed using Krinsky and Robb (1990) proedure For treatment group G1, on average, respondents display a statistially signifiant preferene against purhasing a ute relative to other vehile body types, and a statistially signifiant preferene for buying either a sedan or SUV. There exists for this group however, signifiant preferene heterogeneity towards the purhase of both utes and oupes. In ontrast, on average there exists no impat on utility for respondents belonging to treatment group G2 for utes, SUVs or sedans, and a negative overall preferene towards oupes relative to other vehile body types, although there does also exist statistially signifiant preferene heterogeneity for both utes and oupes within this sample. Further, respondents assigned to treatment group G2 are observed to have a negative overall preferene towards hathbaks and station wagons, when no suh effets are observed within treatment group G1. Treatment group G1 has statistially signifiant fixed positive parameter estimates for vehiles with higher omfort and performane ratings, whilst for treatment group G2, whilst no statistially signifiant mean effet was found for these two attribute, signifiant preferene heterogeneity was deteted. For diesel fuelled vehiles, a fixed negative parameter was found to be marginally statistially signifiant for treatment group G1, whilst for treatment group G2, only the standard deviation parameter for this attribute is statistially signifiant, indiating signifiant preferene heterogeneity for this variable. For both treatment groups, a fixed positive parameter was found to be statistially signifiant for the number of seats attribute, whilst for both groups, signifiant heterogeneity was found to exist for the number of ylinders attribute. Combined, this suggests that respondents tend to prefer larger vehiles but are heterogeneous in terms of their preferenes for either vehiles with smaller or larger engines, all else being equal. Overall, the two models also suggest that both groups also were found to have a negative mean parameter for the odometer reading attribute, as well as statistially signifiant standard deviation parameters. The signifiant heterogeneity parameters for the odometer reading attribute an be interpreted as refleting different preferenes for newer or older vehiles, given this attribute was orrelated with the vehile age in the experiment. Interestingly, the pollution rating was found to not influene vehile hoie for treatment group G1, and whilst the mean parameter assoiated with the pollution rating of vehiles on offer was not statistially signifiant for group G2, the standard deviation parameter was. This suggests that on average, respondents belonging to the seond treatment group displays, on average, neither a taste nor 23
24 distaste for less polluting vehiles, however signifiant preferene heterogeneity is evident for this attribute for group G2. Also reported in the table are the population moments of the underlying normal distribution assoiated with the lognormally distributed prie parameters. Converting the parameters for the underlying distribution to that of the lognormal, the mean, median and standard deviation of preferenes assoiated with the prie attribute for group G1 are , and respetively, and , and for treatment group G2. Whilst a diret omparison between the two results should be avoided due to potential differenes in sale between the two data sets, this finding suggests that respondents ompleting both the SC task and budget realloation task have a muh lower sensitivity to prie than those who were asked only to omplete the SC task. With regards to sale, it is worth noting that for the non-prie mean parameter estimates that are statistially signifiant aross both treatment groups, parameters for the model that are estimated on the data olleted from the seond group are a median 2.77 times larger than those estimated for the first group. For the heterogeneity parameters, the parameters from the seond group are a median 2.42 times larger than those from the first. Whilst not offered as formal proof of the existene of sale differenes between the two data sets, this finding does suggest that sale differenes do exist between the two data sets, with sale being larger in the seond data set. Assuming this to be the ase, it is partiularly noteworthy that the prie parameter is muh lower for treatment group G2 than for treatment group G1. To rule out experimental design influenes being the soure of the observed differene in the magnitude of the prie parameters, Table 4 details the average and median monthly repayments for treatment groups G1 and G2 over the experiment. Shown in the table are the original average and median monthly repayments shown to respondents from both groups, as well as the average and median monthly repayments respondents saw after adjusting for the use of any savings and the sale of existing household vehiles. Repayments are further broken down into values for all vehiles shown to respondents, versus monthly repayments for the hosen vehile only. Visual examination of the table shows that there exists an $8.84 differene in the vehile pries originally displayed to respondents aross the two data sets ($ versus $709.94), whih dereases to a $0.50 differene after aounting for prie adjustments resulting from the use of savings and from the sale of existing ($ versus $641.20). Table 4: Vehile repayment values Original vehile monthly repayment Vehile monthly repayment after adjustment G1 All vehiles Average $ $ Median $ $ Chosen vehile Average $ $ Median $ $ G2 All vehiles Average $ $ Median $ $ Chosen vehile Average $ $ Median $ $ Considering just the hosen vehile, even after adjusting for respondents offsetting the vehile prie with the use of savings and money earned from selling vehiles from their existing fleet, average differenes in the monthly repayments between the two groups is not large ($ ompared to $482.16), however a muh larger disrepany is observed in terms of the median prie differene between the two groups ($ versus $430.00). The large differene between the average and median pries for the hosen vehile after adjusting for selling existing household vehiles, suggests a somewhat skewed prie distribution for group G1. Overall however, it is apparent that the observed differenes in the magnitudes of the prie parameters between the two groups is not the result of systemati differenes in the appliation of the experiment design as applied to the two groups. Our findings therefore suggest, that even aounting for possible sale differenes, the observed differene in the marginal utility for prie is the result of differenes in preferene between the two groups, and not due to some experimental artefat resident within the data. 24
25 A further point of departure between the models obtained from the two groups lies in the relative magnitudes of the error omponent parameter estimates. Whilst the median standard deviation parameter for G2 is 2.42 times that observed for G1 given non-prie attributes, the error omponent parameter for G2 is 2.86 times larger in magnitude than that obtained from treatment group G1. This suggests, all else being equal, that when hosen, there exists substantially more substitution ourring between vehiles for treatment group G2 than for G1. A further point of differene between the two models exists with the no-hoie ASC parameter, with a statistially signifiant negative parameter being estimated for treatment group G1, whilst treatment group G2 is observed to have a statistially signifiant positive ASC for the same no-hoie option. This later finding indiates that respondents not having to perform the budget realloation task were more likely to selet a vehile than not, all else being equal, whilst respondents who had to omplete the budget realloation task, tended more often to hoose the no-hoie alternative, eteris paribus. Also inluded in the utility funtion of the no hoie alternative of treatment group G2 are the subutilities for three household expenditure items derived from the budget realloation task MCDEV model. After extensive testing, it was found that the sub-utilities for entertainment, misellaneous spending, and rent/mortgage at to explain the hoie of the no-purhase option in the SC experiment. Random parameters following univariate normal distributions were estimated for eah of the three sub-utilities, resulting in statistially signifiant negative mean parameter estimate for the rent/mortgage MCDEV sub-utility. We interpret this finding as suggesting that as the utility of a respondent inreases for putting money towards rent/mortgage, they are more likely to also purhase one of the vehiles present within the SC task, all else being equal. This finding suggests that within the onfines of the experiment onduted, on average, rent/mortgage payments at as an eonomi ompliment to the purhase of a new vehile, eteris paribus. Nevertheless, there does exist signifiant preferene heterogeneity for this as well as the entertainment and misellaneous spending sub-utility funtions, in relation to their impat on the no-hoie alternative. Suh heterogeneity suggests that for some of the sample, respondents who experiene inreasing utility for expenditure within these ategories view the purhase of a vehile as a ompliment, whilst others within the sample view suh a purhase as a diret eonomi alternative. The fourth setion of Table 3 presents the results of the orrelated error terms tying the Probit, Tobit and MNNL models together. Given it was not possible to estimate a Tobit model for treatment group G1, only the orrelation for the Probit and MMNL model error terms are presented within the table for this group. For treatment groups G1, a statistially signifiant and negative orrelation parameter is estimated to exist between the series of Probit models used to explain the sale of existing vehiles from a households fleet, and the MMNL model used to explain the hoie of vehile in the SC experiment. Following Train (2009), we interpret this finding as suggesting that the unobserved effets explaining whether or not a respondent sells an existing vehile is negatively related to the respondent s preferene for purhasing a new vehile in the SC experiment, eteris paribus. The opposite effet however is observed for treatment Group G2. This suggests that for this sample, the unobserved effets explaining whether or not a respondent sells an existing vehile is negatively related to the respondent s preferene for purhasing a new vehile in the SC experiment, all else being equal. For the seond treatment group, we found a statistially signifiant and positive orrelation parameter for the error terms of the Probit and Tobit models. This suggest, eteris paribus, that the unobserved effets explaining whether a respondent sells an existing vehile are positively orrelated with the unobserved effets that explain how muh savings they are prepared to use to offset the vehile prie in the SC experiment. As suh, (un)desirable unobserved effets explaining the sale of existing vehiles are likely to play a similar role with regards to the (un)desirable unobserved effets that help explain how muh household savings respondents put towards the SC vehile of hoie. Likewise, a positive and statistially signifiant orrelation is observed to exist between the error terms of the Tobit model and MMNL model. The next two setions of Table 3 report the parameter estimates assoiated with the MCDEV budget expenditure model. First to be reported are the parameters assoiated with the sub-utilities for nine of the 12 expenditure ategories. The ategory of hildare was exluded from the analysis due to an insuffiient number of respondents reporting positive expenditure for this budget item. Borrowing from family and friends was exluded for similar reasons. Utility for expenditure on groery items was normalised to zero for identifiation reasons, suh that the utility funtions for the remaining budget ategory items an be interpreted relative to this ategory. The ASCs for the remaining nine 25
26 budget ategories are statistially signifiant and negative, suggesting that all else being equal, relative to groery shopping, expenditure on these items is less preferred. The model suggests that inreasing the number of hildren in a household tends to result in lower expenditure on entertainment, savings, general shopping, and misellaneous and other expenses, eteris paribus, but inreases expenditure on rent/mortgage payments. Inreasing the number of adults in a household however tends to result in lower expenditure on rent/mortgage payments, but also redues expenditure on other expenses, all else being equal. As is to be expeted, the model predits that as the EMU derived from the SC experiment inreases, expenditure on vehile repayments also inreases, supporting the hypothesis that individuals are willing to pay more for a vehile that they will derive a greater degree of utility for owning. Within the model framework, the γ parameters have been estimated as a funtion of soiodemographi variables. These parameters are shown in the sixth setion of Table 3. Negative parameters were found for female respondents for the γ parameters assoiated with the expenditure ategories of savings, general shopping, and misellaneous and other expenses, and positive parameters for general household bills and rent/mortgage payments. Age was found to be negatively assoiated with the γ parameters of entertainment, savings, and vehile repayments, and positively related with general household bills. Rather than offer an interpretation of these results here, we demonstrate how these parameters affet the results within the ontext of the entire model system in the next setion. 3.4 Example appliation of model In this setion, we demonstrate via a hypothetial ase study, firstly, how the predited model outomes differ depending on whether one applies the model estimated using just the SC experiment based on treatment group G1 versus whether one where to operationalise the full model framework assoiated with treatment group G2, and seondly, to show how the seond model an be used to demonstrate the link between the SC experiment and the other outside goods represented by the budget realloation task. To do so, onsider three distint deision makers belonging to family units desribed by different household harateristis, with different spending patterns. Further, onsider that eah deision maker is onfronted with the hoie of purhasing a vehile from different and unique markets. Table 5 summarises the relevant harateristis of eah deision maker, the attributes of the households to whih they belong, and the vehiles that are present within the market to whih eah person is onfronted with. For simpliity, assume that the monthly repayments for the various vehiles shown are the repayments required after adjusting for the use of any previous aquired savings, as well as the sale of any existing household own vehile. Table 5: Person, household and vehile harateristis Person and household harateristis Person #1 Person #2 Person #3 Gender Female Female Male Age Weekly Inome $1,000 $1,200 $900 Number of Adults in HH Number of Children in HH Number of Vehiles in HH Age of Vehile # Age of Vehile # HH budget for entertainment $200 / month $350 / month $250 / month HH budget for rent/mortgage $2000 / month $2500 / month $1500 / month Vehile attributes Car(1) Car(2) Car(3) Car(1) Car(2) Car(1) Car(2) Car(3) Car(4) Monthly ar repayments $ $ $ $ $ $ $ $ $ Colour Red Blue Blak Silver Green Red Blak Silver Green Body Type Sedan Coupe SUV Ute SUV 4WD Coupe Sedan Coupe Comfort Rating (1-5) Performane rating (1-5) Pollution rating (0-10) Number of ylinders Fuel type Petrol Hybrid Petrol Petrol Petrol Petrol Diesel Hybrid Petrol Number of seats Odometer reading 40,000 35,000 50,000 20,000 22,000 80,000 85,000 60,000 70,000 26
27 Table 6 presents the predited hoie shares for eah deision maker desribed in Table 5 assuming the two models reported in Table 3. To obtain these results, 10,000 randomised Sobol draws (see Hensher et al. 2015) where used to simulate the random parameters, and orrelated error terms of the models (inluding Probit and Tobit models). Reported within the table are the hoie probabilities obtained for the three deision makers with regards to selling an existing household vehile, as well as purhasing a new vehile. Comparing the results obtained from applying the two models to deision maker 1, the first model predits that urrent household vehiles one and two will be sold with probabilities of and respetively, whih hange to and respetively when the seond model is applied instead. As suh, the first model predits slightly lower probabilities that both vehiles will be sold relative to the seond model. Large differenes begin to emerge however when the results of the ar purhase model are examined. In partiular, whilst both models predit the no hoie alternative as being the most likely outome, the probability that none of the vehiles will be hosen inreases signifiantly when the seond model is used ompared to when the parameters from the first model are applied. Table 6: Choie probabilities for models G1 and G2 G1 G2 G1 G2 G1 G2 Person #1 Person #2 Person #3 Sell existing vehile fleet P sell (vehile #1) P sell (vehile #2) Purhase new P purhase (Car1) P purhase (Car2) P purhase (Car3) P purhase (Car4) P purhase (none) Further, whilst both models predit that the third of the three vehiles has the highest probability of being seleted, the first model assigns the next highest probability to vehile one being hosen, whilst the seond model assigns a higher probability to vehile two being hosen over vehile one. Looking at the seond deision marketer, the probability that the single existing household vehile will be sold drops from to when moving from models G1 to G2. For the same deision maker, as with the first, the probability that no vehile will be hosen is greater for the seond model, than for the first, however for model based on treatment group G2, there appears to be a greater degree of possible trading between the two vehiles that make up the market, with the probabilities for the two alternatives being relative lose to eah other. In ontrast, appliation of the first model assigns a signifiantly higher probability that the seond vehile will be hosen relative to the first. For the third example deision maker, there exists a large disrepany between the models in terms of the predited probability that the first vehile will be hosen out of those available. Appliation of the first model predits that this vehile has the seond highest probability of being hosen, ignoring the no hoie alternative, whilst use of the parameters from the seond model assigns the lowest probability to this vehile being seleted. Whilst the other differenes in the hoie probabilities for the remaining three vehiles are observed to our, these disrepanies are relatively minor ompared to that of the first vehile. Similar to the other two deision makers, there exists a substantial inrease in the probability of the third deision maker not hoosing any of the available vehiles. To demonstrate the relationship between the vehile ar repayment budget item and the other outside goods, we plot indifferene several urves for the three deision makers desribed in Table 5, based on the model obtained for treatment group G2. Plotted in Figure 7, are the indifferene urves for expenditure on ar repayments against expenditure for savings, rent/mortgage and entertainment. We do this for three different amounts of total utility, U ( x nt ), these being total utility equal to 1, 2.5 and 5. The slopes of the indifferene urves represent the marginal rates of substitution between the budget items shown on the axis of eah subplot. The onstant slops for eah urve suggests that over the range of expenditure patterns explored, eah plotted budget item represents a perfet substitute for expenditure on ar repayments. To understand why suh an outome arises, we note that the model predits very low values for eah ψ alongside relatively large estimates for the γ parameters. Further, as an be seen here, the slopes of the urves differ by deision maker as a result of the utility 27
 = 2.")
 = 1")

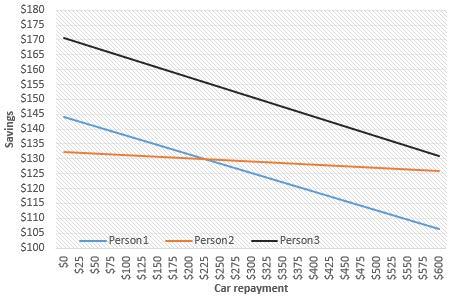
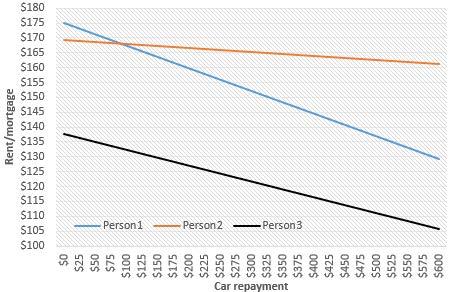
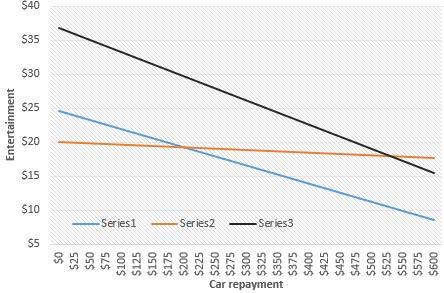
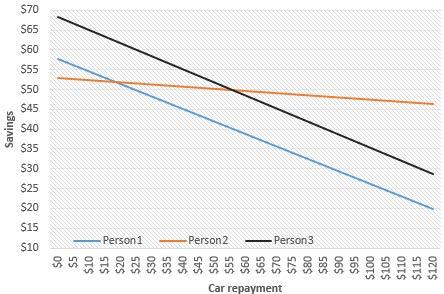
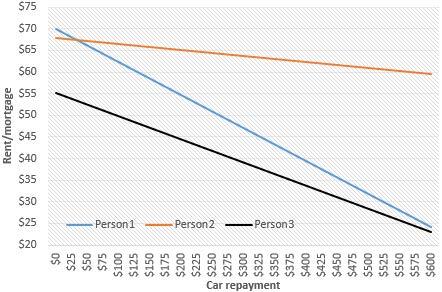
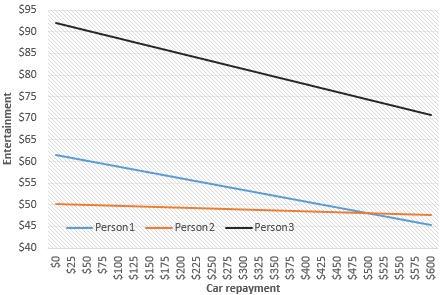
28 U(x) = 5 U(x) = 5 U(x) = 5 U(x) = 2.5 U(x) = 2. 5 U(x) = 2.5 U(x) = 1 U(x) = 1 U(x) = 1 Figure 7: Example indifferene urves for different values of U(x) 28
Economics 2202 (Section 05) Macroeconomic Theory Practice Problem Set 3 Suggested Solutions Professor Sanjay Chugh Fall 2014
 Macroeconomic Theory Practice Problem Set 3 Suggested Solutions Professor Sanjay Chugh Fall 2014") Department of Eonomis Boston College Eonomis 2202 (Setion 05) Maroeonomi Theory Pratie Problem Set 3 Suggested Solutions Professor Sanjay Chugh Fall 2014 1. Interation of Consumption Tax and Wage Tax.
Department of Eonomis Boston College Eonomis 2202 (Setion 05) Maroeonomi Theory Pratie Problem Set 3 Suggested Solutions Professor Sanjay Chugh Fall 2014 1. Interation of Consumption Tax and Wage Tax.
Economics 602 Macroeconomic Theory and Policy Problem Set 4 Suggested Solutions Professor Sanjay Chugh Summer 2010
 Department of Applied Eonomis Johns Hopkins University Eonomis 6 Maroeonomi Theory and Poliy Prolem Set 4 Suggested Solutions Professor Sanjay Chugh Summer Optimal Choie in the Consumption-Savings Model
Output and Expenditure
 2 Output and Expenditure We begin with stati models of the real eonomy at the aggregate level, abstrating from money, pries, international linkages and eonomi growth. Our ausal perspetive depends on what
T R A D E A N D I N D U S T R I A L P O L I C Y S T R A T E G I E S
 Working Paper 1-2004 A Dynami Computable General Equilibrium (CGE) Model for South Afria: Extending the Stati IFPRI Model James Thurlow T R A D E A N D I N D U S T R I A L P O L I C Y S T R A T E G I E
Problem Set 8 Topic BI: Externalities. a) What is the profit-maximizing level of output?
 What is the profit-maximizing level of output?") Problem Set 8 Topi BI: Externalities 1. Suppose that a polluting firm s private osts are given by TC(x) = 4x + (1/100)x 2. Eah unit of output the firm produes results in external osts (pollution osts)
Problem Set 8 Topi BI: Externalities 1. Suppose that a polluting firm s private osts are given by TC(x) = 4x + (1/100)x 2. Eah unit of output the firm produes results in external osts (pollution osts)
FOREST CITY INDUSTRIAL PARK FIN AN CIAL RETURNS EXECUTIVE SUMMARY
 FOREST CITY INDUSTRIAL PARK FIN AN CIAL RETURNS EXECUTIVE SUMMARY The City of London is engagedl in industrial land development for the sole purpose of fostering eonomi growth. The dynamis of industrial
Transport tax reforms, two-part tariffs, and revenue recycling. - A theoretical result
 Transport tax reforms, to-part tariffs, and revenue reyling - A theoretial result Abstrat Jens Erik Nielsen Danish Transport Researh Institute We explore the interation beteen taxes on onership and on
Economics 325 Intermediate Macroeconomic Analysis Practice Problem Set 1 Suggested Solutions Professor Sanjay Chugh Spring 2011
 Department of Eonomis Universit of Marland Eonomis 35 Intermediate Maroeonomi Analsis Pratie Problem Set Suggested Solutions Professor Sanja Chugh Spring 0. Partial Derivatives. For eah of the following
Page 80. where C) refers to estimation cell (defined by industry and, for selected industries, region)
 refers to estimation cell (defined by industry and, for selected industries, region)") Nonresponse Adjustment in the Current Statistis Survey 1 Kennon R. Copeland U.S. Bureau of Labor Statistis 2 Massahusetts Avenue, N.E. Washington, DC 20212 (Copeland.Kennon@bls.gov) I. Introdution The
Nonresponse Adjustment in the Current Statistis Survey 1 Kennon R. Copeland U.S. Bureau of Labor Statistis 2 Massahusetts Avenue, N.E. Washington, DC 20212 (Copeland.Kennon@bls.gov) I. Introdution The
TOTAL PART 1 / 50 TOTAL PART 2 / 50
 Department of Eonomis University of Maryland Eonomis 35 Intermediate Maroeonomi Analysis Midterm Exam Suggested Solutions Professor Sanjay Chugh Fall 009 NAME: Eah problem s total number of points is shown
Class Notes: Week 6. Multinomial Outcomes
 Ronald Hek Class Notes: Week 6 1 Class Notes: Week 6 Multinomial Outomes For the next ouple of weeks or so, we will look at models where there are more than two ategories of outomes. Multinomial logisti
PROSPECTUS May 1, Agency Shares
 Dreyfus Institutional Reserves Funds Dreyfus Institutional Reserves Money Fund Class/Tiker Ageny shares DRGXX Dreyfus Institutional Reserves Treasury Fund Class/Tiker Ageny shares DGYXX Dreyfus Institutional
Tariffs and non-tariff measures: substitutes or complements. A cross-country analysis
 Bank i Kredyt 48(1), 2017, 45-72 Tariffs and non-tariff measures: substitutes or omplements. A ross-ountry analysis Eyal Ronen* Submitted: 29 April 2016. Aepted: 3 November 2016. Abstrat Alongside the
ON TRANSACTION COSTS IN STOCK TRADING
 QUANTITATIVE METHODS IN ECONOMICS Volume XVIII, No., 07, pp. 58 67 ON TRANSACTION COSTS IN STOCK TRADING Marek Andrzej Koiński Faulty of Applied Informatis and Mathematis Warsaw University of Life Sienes
NBER WORKING PAPER SERIES MYOPIA AND THE EFFECTS OF SOCIAL SECURITY AND CAPITAL TAXATION ON LABOR SUPPLY. Louis Kaplow
 NBER WORKING PAPER SERIES MYOPIA AND THE EFFECTS OF SOCIAL SECURITY AND CAPITAL TAXATION ON LABOR SUPPLY Louis Kaplow Working Paper 45 http://www.nber.org/papers/w45 NATIONAL BUREAU OF ECONOMIC RESEARCH
Prices, Social Accounts and Economic Models
 Paper prepared for the 10th Global Eonomi Analysis Conferene, "Assessing the Foundations of Global Eonomi Analysis", Purdue University, Indiana, USA, June 2007 Pries, Soial Aounts and Eonomi Models Sott
CHAPTER 9 BUDGETARY PLANNING SUMMARY OF QUESTIONS BY STUDY OBJECTIVES AND BLOOM S TAXONOMY. True-False Statements. Multiple Choice Questions
 HTER 9 BUDGETARY PLANNING SUMMARY OF QUESTIONS BY STUDY OBJETIVES AND BLOOM S TAXONOMY Item SO BT Item SO BT Item SO BT Item SO BT 4 6 6 6 1 11. 11. 114. 11. 116. 117. 118. 119. 10. 11. 1. 1. 14. 1. 16.
Exogenous Information, Endogenous Information and Optimal Monetary Policy
 Exogenous Information, Endogenous Information and Optimal Monetary Poliy Luigi Paiello Einaudi Institute for Eonomis and Finane Mirko Wiederholt Northwestern University November 2010 Abstrat Most of the
THE ECONOMIC MOTIVES FOR CHILD ALLOWANCES: ALTRUISM, EXCHANGE OR VALUE OF INDEPENDENCE?
 THE EONOMI MOTIVES FOR HILD ALLOWANES: ALTRUISM, EXHANGE OR VALUE OF INDEPENDENE? Lisa Farrell*, Paul Frijters** and Mihael A. Shields* * Department of Eonomis, University of Melbourne, Australia ** Tinbergen
THE STUDY OF RELATIONSHIP BETWEEN CAPITAL STRUCTURE, FIRM GROWTH WITH FINANCIAL LEVERAGE OF THE COMPANY LISTED IN TEHRAN STOCK EXCHANGE
 THE STUDY OF RELATIONSHIP BETWEEN CAPITAL STRUCTURE, FIRM GROWTH WITH FINANCIAL LEVERE OF THE COMPANY LISTED IN TEHRAN STOCK EXCHANGE Fatemeh Arasteh Department of Aounting, Siene and Researh Branh, Islami
Endogenous Peer Effects in School Participation
 ndogenous Peer ffets in Shool Partiipation Gustavo J. Bobonis and Frederio Finan Otober 006 Abstrat: A remaining obstale in the literature on peer effets has been the inability to distinguish between peer
International Productivity Differences, Infrastructure, and Comparative. Advantage
 International Produtivity Differenes, Infrastruture, and Comparative Advantage For Submission to the Review of International Eonomis Manusript 4349 Revised, February 2006 Abstrat This paper provides an
Rational Bias in Inflation Expectations
 Rational Bias in Inflation Expetations Robert G. Murphy * Boston College Adam Rohde Charles River Assoiates August 2014 Revised Deember 2014 Abstrat This paper argues that individuals may rationally weight
Lecture 7: The Theory of Demand. Where does demand come from? What factors influence choice? A simple model of choice
 Leture : The Theory of Demand Leture : The he Theory of Demand Readings: Chapter 9 Where does demand ome from? Sarity enourages rational deision-maing over household onsumption hoies. Rational hoie leads
International Review of Business Research Papers Vol. 3 No. 3 August 2007 Pp
 International Review of Business Researh Papers Vol. 3 No. 3 August 2007 Pp. 309-324 Miroredit Programs and Eonomi Indiators: Are the Higher Inome Borrowers Better Off? Evidene from Bangladesh Sayma Rahman*
Availability Analysis with Opportunistic Maintenance of a Two Component Deteriorating System
 Analysis with Maintenane of a Two Component Deteriorating System Joel P. Varghese and Girish Kumar Abstrat This paper desribes the opportunisti maintenane model for availability analysis of two omponent
Analysing the Distributional Impacts of Stablisation Policy with a CGE Model: Illustrations and Critique for Zimbabwe
 Analysing the Distributional Impats of Stablisation Poliy with a CGE Model: Illustrations and Critique for Zimbabwe Sonja Fagernäs Eonomi and Statistis Analysis Unit April 2004 ESAU Working Paper 4 Overseas
State of New Mexico Participation Agreement for Deferred Compensation Plan
 State of New Mexio Partiipation Agreement for Deferred Compensation Plan DC-4068 (06/2016) For help, please all 1-866-827-6639 www.newmexio457d.om 1 Things to Remember Please print Payroll Center/Plan
Contending with Risk Selection in Competitive Health Insurance Markets
 This paper is prepared for presentation at the leture, Sikness Fund Compensation and Risk Seletion at the annual meeting of the Verein für Soialpolitik, Bonn, Germany September 29, 2005. September 19,
Study on Rural Microfinance System s Defects and Risk Control Based on Operational Mode
 International Business and Management Vol. 10, No. 2, 2015, pp. 43-47 DOI:10.3968/6807 ISSN 1923-841X [Print] ISSN 1923-8428 [Online] www.sanada.net www.sanada.org Study on Rural Mirofinane System s Defets
NBER WORKING PAPER SERIES A SIMPLE TEST OF PRIVATE INFORMATION IN THE INSURANCE MARKETS WITH HETEROGENEOUS INSURANCE DEMAND
 NER WORKING PAPER SERIES A SIMPLE ES OF PRIVAE INFORMAION IN E INSURANCE MARKES WI EEROGENEOUS INSURANCE DEMAND Li Gan Feng uang Adalbert Mayer Working Paper 16738 http://www.nber.org/papers/w16738 NAIONAL
Neighborhood Peer Effects in Secondary School Enrollment Decisions. Gustavo J. Bobonis and Frederico Finan. Current Version: February 2008
 Neighborhood Peer ffets in Seondary Shool nrollment Deisions Gustavo J. Bobonis and Frederio Finan Current Version: February 008 First Version: September 003 Abstrat: This paper identifies neighborhood
0NDERZOEKSRAPPORT NR TAXES, DEBT AND FINANCIAL INTERMEDIARIES C. VAN HULLE. Wettelijk Depot : D/1986/2376/4
 0NDERZOEKSRAPPORT NR. 8603 TAXES, DEBT AND FINANCIAL INTERMEDIARIES BY C. VAN HULLE Wettelijk Depot : D/1986/2376/4 TAXES, DEBT AND FINANCIAL INTERMEDIARIES Muh lending and borrowing is indiret : finanial
AUTHOR COPY. The co-production approach to service: a theoretical background
 Journal of the Operational Researh Soiety (213), 1 8 213 Operational Researh Soiety td. All rights reserved. 16-5682/13 www.palgrave-journals.om/jors/ The o-prodution approah to servie: a theoretial bakground
CONSUMPTION-LEISURE FRAMEWORK SEPTEMBER 20, 2010 THE THREE MACRO (AGGREGATE) MARKETS. The Three Macro Markets. Goods Markets.
 MARKETS. The Three Macro Markets. Goods Markets.") CONSUMPTION-LEISURE FRAMEWORK SEPTEMBER 20, 2010 The Three Maro Markets THE THREE MACRO (AGGREGATE) MARKETS Goods Markets P Labor Markets Capital/Savings/Funds/Asset Markets interest rate labor Will put
CONSUMPTION-LEISURE FRAMEWORK SEPTEMBER 20, 2010 The Three Maro Markets THE THREE MACRO (AGGREGATE) MARKETS Goods Markets P Labor Markets Capital/Savings/Funds/Asset Markets interest rate labor Will put
IS-LM model. Giovanni Di Bartolomeo Macro refresh course Economics PhD 2012/13
 IS-LM model Giovanni Di Bartolomeo giovanni.dibartolomeo@uniroma.it Note: These leture notes are inomplete without having attended letures IS Curve Giovanni Di Bartolomeo giovanni.dibartolomeo@uniroma.it
Consumption smoothing and the welfare consequences of social insurance in developing economies
 Journal of Publi Eonomis 90 (2006) 2351 2356 www.elsevier.om/loate/eonbase Consumption smoothing and the welfare onsequenes of soial insurane in developing eonomies Raj Chetty a,, Adam Looney b a UC-Berkeley
On the Welfare Benefits of an International Currency
 On the Welfare Benefits of an International Curreny Prakash Kannan Researh Department International Monetary Fund Otober 2006 Abstrat Is it benefiial for a ountry s urreny to be used internationally? And,
Exogenous Information, Endogenous Information and Optimal Monetary Policy
 Exogenous Information, Endogenous Information and Optimal Monetary Poliy Luigi Paiello Einaudi Institute for Eonomis and Finane Mirko Wiederholt Northwestern University January 2011 Abstrat This paper
Myopia and the Effects of Social Security and Capital Taxation on Labor Supply
 NELLCO NELLCO Legal Sholarship Repository Harvard Law Shool John M. Olin Center for Law, Eonomis and Business Disussion Paper Series Harvard Law Shool 8-5-006 Myopia and the Effets of Soial Seurity and
TRADE AND PRODUCTIVITY *
 TRADE AND PRODUCTIVITY * FRANCISCO ALCALÁ (UNIVERSIDAD DE MURCIA) AND ANTONIO CICCONE (UNIVERSITAT POMPEU FABRA) November 2003 (forthoming The Quarterly Journal of Eonomis) Abstrat: We find that international
Rational Bias in Inflation Expectations
 Rational Bias in Inflation Expetations Robert G. Murphy * Boston College Adam Rohde Charles River Assoiates August 2014 Revised August 2015 Abstrat This paper argues that individuals may rationally weight
Strategic Dynamic Sourcing from Competing Suppliers: The Value of Commitment
 Strategi Dynami Souring from Competing Suppliers: The Value of Commitment Cuihong Li Laurens G. Debo Shool of Business, University of Connetiut, Storrs, CT0669 Tepper Shool of Business, Carnegie Mellon
Clipping Coupons: Redemption of Offers with Forward-Looking Consumers
 Clipping Coupons: Redemption of Offers with Forward-Looking Consumers Kissan Joseph Oksana Loginova Marh 6, 2019 Abstrat Consumer redemption behavior pertaining to oupons, gift ertifiates, produt sampling,
Should platforms be allowed to charge ad valorem fees?
 Should platforms be allowed to harge ad valorem fees? Zhu Wang and Julian Wright November 27 Abstrat Many platforms that failitate transations between buyers and sellers harge ad valorem fees in whih fees
Say you have $X today and can earn an annual interest rate r by investing it. Let FV denote the future value of your investment and t = time.
 Same as with Labor Supply, maximizing utility in the ontext of intertemporal hoies is IDEN- TICAL to what we ve been doing, just with a different budget onstraint. Present and Future Value Say you have
Dynamic Pricing of Di erentiated Products
 Dynami Priing of Di erentiated Produts Rossitsa Kotseva and Nikolaos Vettas August 6, 006 Abstrat We examine the dynami priing deision of a rm faing random demand while selling a xed stok of two di erentiated
i e SD No.2015/0206 PAYMENT SERVICES REGULATIONS 2015
 i e SD No.2015/0206 PAYMENT SERVICES REGULATIONS 2015 Payment Servies Regulations 2015 Index PAYMENT SERVICES REGULATIONS 2015 Index Regulation Page PART 1 INTRODUCTION 7 1 Title... 7 2 Commenement...
DEPARTMENT OF ECONOMICS DISCUSSION PAPER SERIES
 ISSN 1750-4171 DEPARTMENT OF ECONOMICS DISCUSSION PAPER SERIES Loation of Foreign Diret Investment in the Central and Eastern European Countries: A Mixed Logit and Multilevel Data Approah Simona Rasiute
Asymmetric Integration *
 Fung and Shneider, International Journal of Applied Eonomis, (, September 005, 8-0 8 Asymmetri Integration * K.C. Fung and Patriia Higino Shneider University of California, Santa Cruz and Mount Holyoke
Value Added Tax (Flat-rate Valuation of Supplies of Fuel for Private Use) Order 2013
 Order 2013") Index VALUE ADDED TAX (FLAT-RATE VALUATION OF SUPPLIES OF FUEL FOR PRIVATE USE) ORDER 2013 Index Artile Page 1 Title... 3 2 Commenement... 3 3 Flat-rate basis of valuation of supplies of fuel for private
Index VALUE ADDED TAX (FLAT-RATE VALUATION OF SUPPLIES OF FUEL FOR PRIVATE USE) ORDER 2013 Index Artile Page 1 Title... 3 2 Commenement... 3 3 Flat-rate basis of valuation of supplies of fuel for private
Trade Scopes across Destinations: Evidence from Chinese Firm
 MPRA Munih Personal RePE Arhive Trade Sopes aross Destinations: Evidene from Chinese Firm Zhuang Miao and Yifan Li MGill University 15 Marh 2017 Online at https://mpra.ub.uni-muenhen.de/80863/ MPRA Paper
Alfons John Weersink. A thesis submitted in partial fulfillment of the requirements for the degree. Master of Science. Applied Economics.
 OPTIMAL REPLACEMENT INTERVAL AND DEPRECIATION METHOD OF A COMBINE ON A REPRESENTATIVE DRYLAND GRAIN FARM IN NORTHCENTRAL MONTANA by Alfons John Weersink A thesis submitted in partial fulfillment of the
D Accounting for management
 QU EST IONS ounting for management 17 mins 1.1 Whih of the following statements about qualities of good information is false? It should be relevant for its purposes It should be ommuniated to the right
The Simple Economics of White Elephants
 The Simple Eonomis of White Elephants Juan-José Ganuza Universitat Pompeu Fabra and Barelona GSE Gerard Llobet CEMFI and CEPR May 16, 2016 Abstrat This paper disusses how the design of onession ontrats
Do Agricultural Subsidies Crowd-out or Stimulate Rural Credit Market Institutions?: The Case of CAP Payments
 Do Agriultural Subsidies Crowd-out or Stimulate Rural Credit Market Institutions?: The Case of CAP Payments Pavel Ciaian European Commission (DG Joint Researh Centre); Eonomis and Eonometris Researh Institute
Important information about our Unforeseeable Emergency Application
 Page 1 of 4 Questions? Call 877-NRS-FORU (877-677-3678) Visit us online Go to nrsforu.om to learn about our produts, servies and more. Important information about our Unforeseeable Emergeny Appliation
CONSUMPTION-LABOR FRAMEWORK SEPTEMBER 19, (aka CONSUMPTION-LEISURE FRAMEWORK) THE THREE MACRO (AGGREGATE) MARKETS. The Three Macro Markets
 THE THREE MACRO (AGGREGATE) MARKETS. The Three Macro Markets") CONSUMPTION-LABOR FRAMEWORK (aka CONSUMPTION-LEISURE FRAMEWORK) SEPTEMBER 19, 2011 The Three Maro Markets THE THREE MACRO (AGGREGATE) MARKETS Goods Markets P Labor Markets Finanial/Capital/Savings/Asset
CONSUMPTION-LABOR FRAMEWORK (aka CONSUMPTION-LEISURE FRAMEWORK) SEPTEMBER 19, 2011 The Three Maro Markets THE THREE MACRO (AGGREGATE) MARKETS Goods Markets P Labor Markets Finanial/Capital/Savings/Asset
Estimating Fundamental Value and the Size of Rational Speculative Bubbles of Hong Kong Stock Market during the Year 2008
 International Journal of Finanial Eonomis Vol. 4, No., 205, -7 Estimating Fundamental Value and the Size of Rational Speulative Bubbles of Hong Kong Stok Market during the Year 2008 Devendran Indiran,
Econ 455 Answers - Problem Set Consider a small country (Belgium) with the following demand and supply curves for cloth:
 with the following demand and supply curves for cloth:") Spring 000 Eon 455 Harvey Lapan Eon 455 Answers - Problem Set 4 1. Consider a small ountry (Belgium) with the following demand and supply urves for loth: Supply = 3P ; Demand = 60 3P Assume Belgium an
Spring 000 Eon 455 Harvey Lapan Eon 455 Answers - Problem Set 4 1. Consider a small ountry (Belgium) with the following demand and supply urves for loth: Supply = 3P ; Demand = 60 3P Assume Belgium an
Retirement Benefits Schemes (Miscellaneous Amendments) RETIREMENT BENEFITS SCHEMES (MISCELLANEOUS AMENDMENTS) REGULATIONS 2014
 RETIREMENT BENEFITS SCHEMES (MISCELLANEOUS AMENDMENTS) REGULATIONS 2014") Retirement Benefits Shemes (Misellaneous Amendments) Index RETIREMENT BENEFITS SCHEMES (MISCELLANEOUS AMENDMENTS) REGULATIONS 2014 Index Regulation Page 1 Title... 3 2 Commenement... 3 3 Amendment of the
Retirement Benefits Shemes (Misellaneous Amendments) Index RETIREMENT BENEFITS SCHEMES (MISCELLANEOUS AMENDMENTS) REGULATIONS 2014 Index Regulation Page 1 Title... 3 2 Commenement... 3 3 Amendment of the
Optional Section: Continuous Probability Distributions
 6 Optional Setion: Continuous Probability Distributions 6.5 The Normal Approximation to the Binomial Distribution For eah retangle, the width is 1 and the height is equal to the probability assoiated with
Licensing and Patent Protection
 Kennesaw State University DigitalCommons@Kennesaw State University Faulty Publiations 00 Liensing and Patent Protetion Arijit Mukherjee University of Nottingham Aniruddha Baghi Kennesaw State University,
WORKING PAPER SERIES 3. Michal Franta The Likelihood of Effective Lower Bound Events
 WORKING PAPER SERIES 3 Mihal Franta The Likelihood of Effetive Lower Bound Events WORKING PAPER SERIES The Likelihood of Effetive Lower Bound Events Mihal Franta 3/2018 CNB WORKING PAPER SERIES The Working
Importantly, note that prices are not functions of the expenditure on advertising that firm 1 makes during the first period.
 ECONS 44 STRATEGY AND GAME THEORY HOMEWORK #4 ANSWER KEY Exerise - Chapter 6 Watson Solving by bakward indution:. We start from the seond stage of the game where both firms ompete in pries. Sine market
Associate Professor Jiancai PI, PhD Department of Economics School of Business, Nanjing University
 Assoiate Professor Jianai PI PhD Department of Eonomis Shool of Business Nanjing University E-mail: jianaipi@hotmail.om; pi28@nju.edu.n THE CHICE BETWEEN THE MAL AND ELATINAL INANCING IN CHINESE AMILY
DEPARTMENT OF ECONOMICS WORKING PAPERS
 DEPARTMENT OF ECONOMICS WORKING PAPERS eonomis.eu.hu Deriving the Taylor Priniple when the Central Bank Supplies Money by Max Gillman 1, Ceri Davies 2 and Mihal Kejak 3 2012/13 1 Department of Eonomis,
Growth, Income Distribution and Public Debt
 Growth, Inome Distribution and Publi Debt A Post Keynesian Approah João Basilio Pereima Neto José Luis Oreiro Abstrat: The objetive of this paper is to evaluate the long-run impat of hanges in fisal poliy
TRANSPORT WELFARE BENEFITS IN THE PRESENCE OF AN INCOME EFFECT
 TRANSPORT WELARE BENEITS IN THE PRESENCE O AN INCOME EECT James Laird Senior Researh ellow Institute for Transport Studies University of Leeds Leeds LS2 9JT J.J.Laird@its.leeds.a.u Tel: 01463 235156 ACKNOWLEDGEMENTS
This article attempts to narrow the gap between
 Evan F. Koenig Senior Eonomist and Poliy Advisor Rethinking the IS in IS LM: Adapting Keynesian Tools to Non-Keynesian Eonomies Part 1 This artile attempts to narrow the gap between two maroeonomi paradigms
The Simple Economics of White Elephants
 The Simple Eonomis of White Elephants Juan-José Ganuza Universitat Pompeu Fabra and Barelona GSE Gerard Llobet CEMFI and CEPR July 13, 2017 Abstrat This paper shows that the onession model disourages firms
Valuation of Bermudan-DB-Underpin Option
 Valuation of Bermudan-DB-Underpin Option Mary, Hardy 1, David, Saunders 1 and Xiaobai, Zhu 1 1 Department of Statistis and Atuarial Siene, University of Waterloo Marh 31, 2017 Abstrat The study of embedded
Managing Future Oil Revenues in Ghana
 IFPRI Disussion Paper 00893 August 2009 Managing Future Oil Revenues in Ghana An Assessment of Alternative Alloation Options Clemens Breisinger Xinshen Diao Rainer Shweikert Manfred Wiebelt Development
The Impact of Personal and Institutional Investor Sentiment on Stock. Returns under the Chinese Stock Market Crash. Kexuan Wang
 Advanes in Eonomis, Business and Management Researh (AEBMR), volume 26 International Conferene on Eonomis, Finane and Statistis (ICEFS 2017) The Impat of Personal and Institutional Investor Sentiment on
The effect of oil price shocks on economic growth (Case Study; Selected Oil Exporting Countries)
") Tehnial Journal of Engineering and Applied Sienes Available online at www.tjeas.om 2013 TJEAS Journal-2013-3-17/2118-2122 ISSN 2051-0853 2013 TJEAS The effet of oil prie shoks on eonomi growth (Case Study;
Tehnial Journal of Engineering and Applied Sienes Available online at www.tjeas.om 2013 TJEAS Journal-2013-3-17/2118-2122 ISSN 2051-0853 2013 TJEAS The effet of oil prie shoks on eonomi growth (Case Study;
The Impact of Capacity Costs on Bidding Strategies in Procurement Auctions
 Review of Aounting Studies, 4, 5 13 (1999) 1999 Kluwer Aademi Publishers, Boston. Manufatured in The Netherlands. The Impat of Capaity Costs on Bidding Strategies in Prourement Autions JÖRG BUDDE University
Highlights: 2010 Home Mortgage Disclosure Data
 1. Introdution The last five years have seen tremendous hanges in the volume and omposition of mortgage lending in the United States. The impat of Dodd-Frank legislation on the onentration of mortgage
DISCUSSION PAPER SERIES. No MARKET SIZE, ENTREPRENEURSHIP, AND INCOME INEQUALITY. Kristian Behrens, Dmitry Pokrovsky and Evgeny Zhelobodko
 DISCUSSION PAPER SERIES No. 9831 MARKET SIZE, ENTREPRENEURSHIP, AND INCOME INEQUALITY Kristian Behrens, Dmitry Pokrovsky and Evgeny Zhelobodko INTERNATIONAL TRADE AND REGIONAL ECONOMICS ABCD www.epr.org
At a cost-minimizing input mix, the MRTS (ratio of marginal products) must equal the ratio of factor prices, or. f r
 must equal the ratio of factor prices, or. f r") ECON 311 NAME: KEY Fall Quarter, 2011 Prof. Hamilton Final Exam 200 points 1. (30 points). A firm in Los Angeles produes rubber gaskets using labor, L, and apital, K, aording to a prodution funtion Q =
ECON 311 NAME: KEY Fall Quarter, 2011 Prof. Hamilton Final Exam 200 points 1. (30 points). A firm in Los Angeles produes rubber gaskets using labor, L, and apital, K, aording to a prodution funtion Q =
Tax-loss Selling and the Turn-of-the-Year Effect: New Evidence from Norway 1
 Tax-loss Selling and the Turn-of-the-Year Effet: New Evidene from Norway 1 Qinglei Dai Universidade Nova de Lisboa July 2007 1 Aknowledgement: I would like to thank Kristian Rydqvist at Binghamton University,
Vulnerability and Livelihoods before and after the Haiti Earthquake
 Poliy Researh Working Paper 5850 WPS5850 Vulnerability and Livelihoods before and after the Haiti Earthquake Damien Éhevin Publi Dislosure Authorized Publi Dislosure Authorized Publi Dislosure Authorized
AUDITING COST OVERRUN CLAIMS *
 AUDITING COST OVERRUN CLAIMS * David Pérez-Castrillo # University of Copenhagen & Universitat Autònoma de Barelona Niolas Riedinger ENSAE, Paris Abstrat: We onsider a ost-reimbursement or a ost-sharing
County of San Diego Participation Agreement for 457(b) Deferred Compensation Plan
 Deferred Compensation Plan") County of San Diego Partiipation Agreement for 457(b) Deferred Compensation Plan DC-4769 (07/16) For help, please all 1-888-DC4-LIFE www.mydcplan.om 1 Things to Remember Complete all of the setions on
County of San Diego Partiipation Agreement for 457(b) Deferred Compensation Plan DC-4769 (07/16) For help, please all 1-888-DC4-LIFE www.mydcplan.om 1 Things to Remember Complete all of the setions on
GENERAL DESCRIPTION OF THE DB GLOBAL SOVEREIGN INDICES
 Dated: 20 July 2010 GENERAL DESCRIPTION OF THE DB GLOBAL SOVEREIGN INDICES ALTHOUGH THE INDEX SPONSOR WILL OBTAIN INFORMATION FOR INCLUSION IN OR FOR USE IN THE CALCULATION OF AN INDEX FROM SOURCES WHICH
Source versus Residence Based Taxation with International Mergers and Acquisitions
 Soure versus Residene Based Taxation with International Mergers and Aquisitions Johannes Beker Clemens Fuest CESIFO WORKING PAPER NO. 2854 CATEGORY 1: PUBLIC FINANCE NOVEMBER 2009 An eletroni version of
Sequential Procurement Auctions and Their Effect on Investment Decisions
 Sequential Prourement Autions and Their Effet on Investment Deisions Gonzalo isternas Niolás Figueroa November 2007 Abstrat In this paper we haraterize the optimal prourement mehanism and the investment
Optimal Disclosure Decisions When There are Penalties for Nondisclosure
 Optimal Dislosure Deisions When There are Penalties for Nondislosure Ronald A. Dye August 16, 2015 Abstrat We study a model of the seller of an asset who is liable for damages to buyers of the asset if,
Centre de Referència en Economia Analítica
 Centre de Referènia en Eonomia Analítia Barelona Eonomis Working Paper Series Working Paper nº 229 Priing ylial goods Ramon Caminal July, 2005 Priing ylial goods Ramon Caminal Institut danàlisi Eonòmia,
The Economics of Setting Auditing Standards
 The Eonomis of Setting Auditing Standards Minlei Ye University of Toronto Dan A. Simuni University of British Columbia Ralph Winter University of British Columbia April 2010 ABSTRACT: This paper develops
Trade and Productivity
 Trade and Produtivity by Franiso Alalá Universidad de Muria and Antonio Cione Universitat Pompeu Fabra July 2002 (First Version: May 2001) Abstrat: We estimate the effet of international trade on average
Libertarian Paternalism, Information Sharing, and Financial Decision-Making
 Libertarian Paternalism, Information Sharing, and Finanial Deision-Making Brue Ian Carlin Simon Gervais Gustavo Manso February 16, 2011 Abstrat We develop a theoretial model to study the welfare effets
Optimal Monetary Policy in a Model of the Credit Channel
 Optimal Monetary Poliy in a Model of the Credit Channel Fiorella De Fiore y European Central Bank Oreste Tristani z European Central Bank 9 September 2008 First draft Abstrat We onsider a simple extension
Calculus VCT plc. For investors looking for regular, tax-free income. Please send completed application packs to:
 Calulus VCT pl For investors looking for regular, tax-free inome Please send ompleted appliation paks to: Calulus EIS Fund, 104 Park Street, London, W1K 6NF A portfolio of entrepreneurial, growing UK ompanies
Damage, Death and Downtime Risk Attenuation in the 2011 Christchurch Earthquake
 Damage, Death and Downtime Risk Attenuation in the 2011 Christhurh Earthquake J.B. Mander & Y. Huang Zahry Department of Civil Engineering, Texas A&M University, College Station, TX 77843 USA. 2012 NZSEE
The diversification delta: A different perspective. Author. Published. Journal Title. Version DOI. Copyright Statement.
 The diversifiation delta: A different perspetive Author Salazar Flores, Yuri, Bianhi, Robert, Drew, Mihael, Truk, Stefan Published 07 Journal Title Journal of Portfolio Management Version Post-print DOI
DTI, CTI & FTI Methodologies. March 2011
 DTI, CTI & FTI Methodologies Marh 2011 Copyright 2011 Alpha Finanial Tehnologies, LLC ( AFT ). All rights reserved. No portion of these materials may be reprodued without the prior written onsent of AFT.
The Simple Economics of White Elephants
 The Simple Eonomis of White Elephants Juan-José Ganuza Universitat Pompeu Fabra and Barelona GSE Gerard Llobet CEMFI and CEPR May 13, 2016 Abstrat This paper disusses how the design of onession ontrats
Kyle Bagwell and Robert W. Staiger. Revised: November 1993
 Multilateral Tariff Cooperation During the Formation of Regional Free Trade Areas* Kyle Bagwell and Robert W. Staiger Northwestern University The University of Wisonsin and NBER by Revised: November 1993
Technische Universität Ilmenau Institut für Mathematik
 Tehnishe Universität Ilmenau Institut für Mathematik Preprint No. M 09/23 The Repeater Tree Constrution Problem Bartoshek, Christoph; Held, Stephan; Maßberg, Jens; Rautenbah, Dieter; Vygen, Jens 2009 Impressum:
Bonus-Malus System with the Claim Frequency Distribution is Geometric and the Severity Distribution is Truncated Weibull
 IOP Conferene Series: Earth and Environmental Siene PAPER OPEN ACCESS Bonus-Malus System with the Claim Frequeny Distribution is Geometri and the Severity Distribution is Trunated Weibull To ite this artile: