City of Sacramento
|
|
|
- Bathsheba Banks
- 5 years ago
- Views:
Transcription
1 APPROVED

2 APPROVED CITY OF SACRAMENTO CAPITAL IMPROVEMENT PROGRAM Kevin Johnson Mayor RAYMOND L. TRETHEWAY III LAUREN R. HAMMOND Councilmember, District 1 Vice Mayor, District 5 SANDY SHEEDY KEVIN McCARTY Councilmember, District 2 Councilmember, District 6 STEVE COHN ROBBIE WATERS Councilmember, District 3 Councilmember, District 7 ROBERT KING FONG BONNIE J. PANNELL Councilmember, District 4 Councilmember, District 8 RAY KERRIDGE City Manager JOHN DANGBERG Assistant City Manager CASSANDRA JENNINGS Assistant City Manager MARTY HANNEMAN Assistant City Manager GUS VINA Assistant City Manager Prepared by DEPARTMENT OF FINANCE BUDGET, POLICY & STRATEGIC PLANNING DIVISION LEYNE MILSTEIN DAWN HOLM JASON BADER MARIAN FAHY DAVID LEVINE SCOTT PETTINGELL VIRGINIA SMITH in conjunction with Department CIP Coordinators/Staff: David Wilcox Desmond Parrington Ed Otte Gary Szydelko Jay Proffitt Karolyn Pelka Katrina Morgan Maria MacGunigal Nicole Henderson Scot Mende Teresa Haenggi and Sacramento Housing and Redevelopment Agency: La Shelle Dozier, Interim Executive Director Lisa Bates David Ossont
3
4 CITY OF SACRAMENTO I. OVERVIEW TABLE OF CONTENTS Page A. Executive Summary Transmittal Letter... 1 CSMFO Capital Budgeting Award for FY2008/ Program Highlights & Issues... 4 B. Background of Capital Improvement Process What is a Capital Improvement?... 8 The CIP Review Process... 8 How to Read This Document... 9 II. III. IV. BUDGET SCHEDULES FY2009/10 Capital Budget by Major Funding Source... A-1 FY2009/10 Capital Budget by Program... A Projects-by-Program... A-3 Summary of Capital Funding by Funding Source (Schedule 4A)... A-4 Summary of Capital Funding by Program (Schedule 4B)... A-6 SACRAMENTO AREA MAPS Council Districts... B-1 Neighborhood Service Areas... B-2 Community Plan Areas... B-3 Infill Areas... B-4 Neighborhood Commercial Revitalization Areas... B-5 Redevelopment Areas... B-6 PROGRAM SUMMARIES New Growth & Infill Program Overview/Summary... C-1 Growth Opportunity Map... C-3 South Area Map... C-5 Fruitridge/Broadway Map... C-7 North Sacramento Map... C-9 Arden Fair, Point West, Cal Expo, and Swanston Station Map... C-11 Greenbriar, North Natomas, and Panhandle Map... C-13 River District, Railyards, and Central City... C-15 General Government Program Overview/Summary... D-1 Project Detail... DD CAPITAL IMPROVEMENT PROGRAM
5 CITY OF SACRAMENTO TABLE OF CONTENTS Public Safety Program Overview/Summary/Map... E-1 Project Detail... EE-1 Convention, Culture and Leisure Program Overview/Summary... F-1 Map... F-6 Project Detail... FF-1 Parks and Recreation Program Overview/Summary... G-1 Map... G-8 Project Detail... GG-1 Economic Development Program Economic Development Overview/Summary... H-1 Transportation Program Overview/Summary... I-1 Map... I-8 Project Detail... II-1 City Utilities Program Overview/Summary... J-1 Map... J-12 Project Detail... JJ-1 Sacramento Housing and Redevelopment Agency (SHRA) Program Overview/Summary... K-1 SHRA Project Detail... KK-1 V. DESCRIPTION OF MAJOR FUNDING SOURCES Fund 1001 (101) General Fund and Fund 3008 (781) Capital City Projects... L-1 Funds 2001 (201) and 2005 (207) Measure A... L-2 Fund 2002 (202) Gas Tax... L-3 Fund 2006 (208) Traffic Safety... L-4 Fund 2007 (209) Major Street Construction... L-5 Fund 2008 (211) Street Cut... L-6 Fund 2009 (212) AB 2928 Street Maintenance... L-7 Fund 2010 (213) State Route L-8 Fund 2011 (217) State Route L-9 Fund 2012 (230) Transportations Systems Management... L-10 Fund 2013 (235) Transportation Development Act... L-11 Fund 2016 (258) Development Services... L-12 Funds 2020 (795) and 2021 (796) South Natomas Funds... L CAPITAL IMPROVEMENT PROGRAM
6 CITY OF SACRAMENTO TABLE OF CONTENTS Fund 2023 (291) New Measure A Construction... L-14 Fund 2024 (292) Historic Places Fund... L-15 Fund 2025 and 2026 New Measure A Construction and Maintenance... L-16 Funds 2232 (281) Citywide Landscape and Lighting (L&L)... L-17 Fund 2507 (588) Land Park Trust... L-18 Fund 2508 (710) Quimby Act... L-19 Fund 2603 (418) Golf... L-20 Fund 2700 (205) Block Grant/SHRA... L-21 Fund 3002 (711) 2002 CIRBs... L-22 Funds 3004 (713), 3005 (714), 3006 (715) and 3007 (716) 2006 CIRBs... L-23 Fund 3201 (780) North Natomas... L-24 Fund 3204 (791) Park Impact... L-25 Fund 3701 (206) Tax Increment Downtown... L-26 Funds 3702 (248), 3703 (511) and 3704 (512) Capital Grants... L-27 Fund 6004 (412) Parking... L-28 Fund 6005 (413) Water... L-29 Fund 6006 (414) Sewer... L-30 Fund 6007 (415) Solid Waste... L-31 Fund 6009 (417) Marina... L-32 Fund 6010 (419) Community Center... L-33 Fund 6011 (425) Storm Drainage... L-34 Fund 6501 (420) Fleet Management... L-35 Fund 9101 (983) SHRA/Community Development Block Grant Fund (CDBG)... L-36 Fund 9206 (986) SHRA/Tax Increment Alkali Flat... L-37 Fund 9211 (987) SHRA/Tax Increment Franklin Boulevard... L-38 Fund 9216 (988) SHRA/Tax Increment North Sacramento... L-39 Fund 9221 (989) SHRA/Tax Increment Oak Park... L-40 Fund 9226 (990) SHRA/Tax Increment Stockton Boulevard... L-41 Fund 9231 (991) SHRA/Tax Increment Del Paso Heights... L-42 Fund 9236 (992) SHRA/Tax Increment Army Depot... L-43 Fund 9241 (993) SHRA/Tax Increment Auburn Boulevard... L-44 Fund 9246 (994) SHRA/Tax Increment 65 th Street... L-45 Fund 9501 (999) Developer Credit/Obligation Projects... L-46 VI. INDEXES Projects Receiving New Funding: By Fund by Project Number... M-1 By Program Area by Project Number... N-1 Projects by Council District by Project Name... O-1 Projects by Project Number... P-1 Old CIP to New ecaps Number Conversion... Q-1 VII. GLOSSARY... R-1 VIII. RESOLUTIONS (white) AND (gray) CAPITAL IMPROVEMENT PROGRAM
7 CITY OF SACRAMENTO TABLE OF CONTENTS Quick Reference Guide WHAT DO I WANT TO KNOW? GENERAL INFORMATION WHERE TO FIND IT IN THE DOCUMENT PAGE NUMBER OR LETTERED SECTION Overview of the CIP Program Executive Summary 4-7 About the City s CIP Program Background 8-11 On Various Programs Program Overviews C-K Definitions of Funding Sources Summary of Funding Sources L 4 Digit CIP to 9 Digit ecaps CIP Crosswalk Index Q Definitions of CIP Terms Glossary R PROJECT INFORMATION FOR Specific New Projects Continuing Projects With Additional Funding Project Detail Sheets Indexes Project Detail Sheets Indexes D-K M-N D-K M-N Continuing Projects With No New Funding Indexes O-P SUMMARY OF PROJECTS WITH NEW FUNDING By Funding Source Index By Project Number M By Program Area Index By Project Number N SUMMARY OF ALL PROJECTS IN THE 5-YEAR CIP By Council District Index By Project Name O By Project Number Index By Project Number P CAPITAL IMPROVEMENT PROGRAM


8


9

10 The California Society of Municipal Finance Officers (CSMFO) presented an Excellence in Operational Budgeting Award to the, California for its annual budget for the fiscal year beginning July 1, In order to receive this award, a governmental unit must publish a budget document that meets the criteria for excellence established by CSMFO. This award is valid for a period of one year only. We believe our current budget continues to conform to program requirements, and we are submitting it to CSMFO to determine its eligibility for another award CAPITAL IMPROVEMENT PROGRAM 3
11 CITY OF SACRAMENTO EXECUTIVE SUMMARY THE CAPITAL IMPROVEMENT PROGRAM (CIP) The CIP totals $219.2 million from all funding sources. The General Fund portion of the fiveyear program is $17.9 million or 8 percent of the total. The FY2009/10 CIP Budget totals $50.1 million. The following is a summary of the larger projects included in the FY2009/10 CIP Budget: Citywide Deferred Maintenance for City Facilities (C , Section D); Fire Apparatus and Ambulances (F & F , Section E); Gardenland Park-Park Safety Improvement Program (PSIP) Tier III (L , Section G); Greenhaven Drive and Gloria Drive Traffic Signal (S , Section I); Interstate 5 Freeway Landscape (W , Section J); Major Street Improvements Program (T , Section I); Public Rights-of-Way Program (T , Section I); Residential Water Meters (Section J): City Farms (Z ); Fruitridge Manor (Z ); Golf Course Terrace (Z ); North Laguna (Z ); and South Land Park Phase 4 (Z ); and Tanzanite Community Park (L , Section G); Detailed information on the projects listed above can be found on the project detail sheets in the appropriate CIP Sections as referenced. Program Highlights & Issues The scope of an existing CIP description may include only the preliminary aspects of a project such as master planning or environmental review. In such projects, additional funding and a new CIP approved by the Mayor and City Council are required to fully develop the project. Other projects may include the development of Phase I of a new facility or the entire project. The level of funding and the project scope description in the CIP determine the parameters of the project at that point in time. General Government Projects: The General Government CIP totals $13 million. The FY2009/10 CIP budget for General Government projects totals $1.7 million. In an effort to address the City s significant budget challenges all General Fund CIPs were reviewed to determine funding requirements for FY2009/10. This review resulted in staff s recommendation to take a one-year funding hiatus for the ADA Program as there are adequate resources available to deliver the projects identified for FY2009/10. Additionally, a review of prior capital improvement revenue bonds (CIRBs) identified residual funds from the 2002 CIRBs that could be used on eligible capital improvement projects. As these are restricted funds staff is recommending that the General Fund contribution be reduced to $500,000 for the Deferred Maintenance Program with the other $500,000 being allocated from the 2002 CIRBs. Finally, the City Treasurer is returning $500,000 from the Treasurer s Investment CIP to provide funding for the Information Technology Operating Budget ($100,000) for web development and to the General Fund ($400,000) to provide resources toward closing the gap in the FY2009/10 operating budget CAPITAL IMPROVEMENT PROGRAM 4
12 CITY OF SACRAMENTO EXECUTIVE SUMMARY Despite the current fiscal challenges the City is facing, the General Government section continues to reflect the City s commitment to focus resources toward existing facilities and programs like the Citywide ADA Project (C ) and the Deferred Maintenance Program (C ) for City facilities. One of the key initiatives for the Deferred Maintenance Program will be to the City s commitment to green building practices, including upcoming energy surveys of existing City buildings. The General Government section also includes General Funded projects that are fully offset by user fees, development surcharges and management fee dedications. These projects include: Planning Technology (A ); Plan/Permit Network System (A ); City Treasurer Investment Reserve (D ); and Information Technology Improvements (A , A and A ). Public Safety Projects: The Public Safety CIP totals $9.5 million. The Public Safety section reflects the City s efforts to provide/replace public safety emergency generators throughout the City and to ensure sustainable funding for long-term capital equipment necessary for advanced life safety and fire fighting services. The FY2009/10 CIP budget for these projects is $1.45 million. In addition to the FY2009/10 CIP budget, an additional $1.2 million in General Funds is budgeted in the FY2009/10 Operating Budget to pay for fire apparatus purchased over the past several years. Parks and Recreation Projects: Sacramento s parks and recreation system provides the City with significant personal, social, environmental, and economic benefits. great cities have great parks systems. Our unique parks and recreation programs form the green and social infrastructure of a vital, livable City. Our parks, bikeways, community centers, swimming pools, sports fields, skate parks, dog parks, rivers and waterways, urban forest, and nature areas are public places for people to gather, celebrate, learn, connect, grow, relax, and recreate. The City's park system continues to expand as new parks are master planned and developed primarily in the northern and southern areas of Sacramento. In addition, expanding and rehabilitating existing parks and facilities is also a high priority for the Department with a focus on park safety and sustainability. New amenities help meet needs identified in the Parks and Recreation Master Plan and the Parks and Recreation Programming Guide. The CIP for Parks and Recreation totals $87.6 million, which includes a $2.6 million budget for FY2009/10. This includes $1.548 million in projects funded from the Park Development Impact Fee (PIF). In addition, capital grants supplement the PIF and Quimby Act fees and are often the primary source of funding for Regional Park and Parkways development. Transportation Projects: The Transportation Department s mission is to ensure the City s transportation system supports and enriches the quality of life for present and future generations. The department actively works with local, state and federal agencies to plan and deliver transportation improvements, which support the City s Strategic Plan Goals to improve and enhance public safety, achieve sustainability, enhance livability, and expand economic development throughout the City. The Transportation Capital Improvement Program (CIP) is designed to optimize the use of available local funds by leveraging state and federal funds to achieve the City s transportation priorities CAPITAL IMPROVEMENT PROGRAM 5
13 CITY OF SACRAMENTO EXECUTIVE SUMMARY The funds programmed in this year s CIP reflect the funding and revenue challenges that are being felt throughout the City and the region. Reductions in New Measure A Construction and Maintenance Sales Tax, Gas Tax, and private development have resulted in reductions in major local transportation revenue sources for the City s Transportation CIPs beginning in FY2009/10. As such, Gas Tax is anticipated to be down by ten percent (10%); New Measure A Maintenance and Construction sales tax down by twentyfive percent (25%) each; and Major Street Construction Tax down by seventy-five percent (75%). Both maintenance and capital programs are significantly impacted by these revenue reductions as programs will be reduced by $2.1 million (69%) for maintenance and $4.2 million (34%) for capital from FY2008/09 to FY2009/10. As per the January 15, 2008, FY2008/09 Measure A Expenditure Plan, old Measure A (Fund 2001) program fund balances are available for future citywide programming. The old Measure A program balance is $19 million and will be used per City Council direction to preserve/supplement many of the citywide program reductions through In FY 2009/10, a total of $12.2 million in new or additional funding will be programmed to 41 new and ongoing projects and programs. The Transportation CIP is divided into seven major areas: Major Streets (major roadway construction); Parking (parking facility maintenance and upgrades); Bridges (rehabilitation, maintenance, and replacement); Street Maintenance (overlays and seals); Traffic Operations and Safety (new traffic signals and signal modifications, Traffic Operations Center, Neighborhood Traffic Management Program, speed humps, pedestrian safety and safety light program); Community Enhancements/Economic Development (street light program, and economic development); and Public Rights-of-Way Accessibility (ADA compliance). Approximately 49% ($5.9 million) of funding is programmed to maintenance and operations projects and programs, 17 % ($2.1 million) of funding to Major Street construction projects, 23% ($2.8 million) of the funding is programmed to projects and programs related to public rights-of-way accessibility pursuant to the ADA settlement agreement, and 11% ($1.3 million) of funding to pedestrian and bicycle projects, community enhancements and economic development. Utilities Projects: The City Utilities CIP totals $104.5 million, which includes $55 million of the estimated $300 million construction costs for the state-mandated residential water meter installation program. Water projects receiving significant new or additional funding in the CIP include: Treatment Plants Rehab (Z ), to prepare the plans and specifications for improvements and rehabilitation of the two water treatment plants; and Residential Water Meter Retrofit Program (PN: Z Z ) as mandated by State law requiring that the City install meters on all residential water services by Sewer and Combined Sewer System (CSS) projects receiving significant new or additional funding in the CIP include: Fremont Area Sewer Rehab, Phase 3 (X ), to continue the effort to rehabilitate several of the combined sewer mains that lie in streets and backyard easements; and Sump 85 Influent Pipe, (X ): to replace or rehabilitate the 24-inch diameter trunk sewer that routes sewage to Sump 84. The CSS projects are part of the $132 million CSS Improvement Project adopted by City Council and approved by the Regional Water Quality Control Board. Solid Waste projects receiving new funding in the CIP include: Dellar Landfill Closure (Y ), to proceed with the closure and post-closure of the Dellar Landfill. Storm Drainage projects receiving new or additional funding in the CIP include: FY10-FY14 National Pollution Discharge Elimination System Program (W ) CAPITAL IMPROVEMENT PROGRAM 6
14 CITY OF SACRAMENTO EXECUTIVE SUMMARY Convention, Culture and Leisure Projects: The Convention, Culture and Leisure (CCL) Department s mission is to promote our unique culture and heritage by delivering accessible arts, leisure and educational experiences to enrich people s lives and enhance the metropolitan area. The department is unique in that it includes: Golf, Historic City Cemetery, Old Sacramento, Sacramento Archives, enterprise funds that operate like private businesses (Convention Center and Marina), non-profits (Crocker Art Museum, Sacramento History Museum, Discovery Museum Science and Space Center, Fairytale Town, and Sacramento Zoo), City and County funded divisions (Metropolitan Arts Commission), membership organizations, and boards and commissions. The CIP reflects the diverse and exciting activities that provide numerous educational, cultural, and regional experiences to residents of the, Northern California and beyond. The FY2009/10 CIP budget for CCL totals $1.9 million. The budget reflects funding of six projects at the Convention Center Complex ($1.6 million), two projects at the City s three golf courses ($70,000) and two projects at the Sacramento Marina ($200,000). These amounts include $60,000 in facility improvements to meet requirements of the ADA, which is included in the General Government program. The CIP for CCL totals $14.7 million and includes 11 projects at the Convention Center ($13.38 million), two projects for Golf ($350,000) and two projects at the Marina ($1.0 million). This funding includes $300,000 for the ADA modifications. Sacramento Housing and Redevelopment Agency (SHRA) Projects: SHRA s budget is completed on a calendar year basis, so the projects listed in this document were approved in late 2008 for the 2009 calendar year. As part of an ongoing collaborative effort to maximize the use of scarce resources, SHRA capital projects are included in this document so that a full picture of all City CIP projects can be presented. The SHRA section in this document details all Tax Increment (TI) projects by Redevelopment Area and all Community Development Block Grant (CDBG) funded projects for FY2009/10. Due to uncertainties in the future funding for both the Community Development Block Grant Program and Tax Increment revenues, SHRA is not including the use of funds for the five year period in this year s CIP. In cases where the City anticipates managing SHRA funds, funded projects are also found in that department s program section. Economic Development Projects: In an effort to assist in the development of projects that contribute toward economic development goals and objectives, funding from a variety of sources has been identified for capital projects. Funding sources include: Downtown Tax Increment (TI), Community Development Block Grant (CDBG), Measure A, and City Utility funds. Projects identified are matched with the appropriate funding source(s) based on the type of improvements proposed (refer to the Summary of Funding Source section for additional information on funding restrictions). Projects are initiated by the Economic Development Department in coordination with the Utilities and Transportation Departments, and SHRA. Related budgets are established in each of the three City departments and in SHRA s budget. The Economic Development FY2009/10 CIP budget totals $11.3 million. The Transportation and Utilities Departments provide funding annually to assist with the City s economic development efforts. Programming of these funds is subject to Mayor and City Council approval and is done in close coordination with the Economic Development, Transportation and Utilities Departments CAPITAL IMPROVEMENT PROGRAM 7
15 CITY OF SACRAMENTO BACKGROUND OF CAPITAL IMPROVEMENT PROCESS The (CIP) is a comprehensive five-year plan for capital project expenditures. The program is a guide for identifying current and future fiscal requirements and becomes the basis for determining annual capital budget expenditures. WHAT IS A CAPITAL IMPROVEMENT? Capital Improvements are major projects undertaken by the City that are generally not recurring and are for repairs, maintenance, improvement, or acquisition with a total cost of at least $20,000. THE CIP REVIEW PROCESS Each project proposal is scrutinized from a variety of approaches before it is included in the CIP. Projects that are included in the CIP are identified by department staff based upon: (1) input from the community received at neighborhood meetings during the year; (2) input from the Mayor and City Council on needs that develop or are identified during the year; (3) the Mayor and City Council approved Master Plans for growth, improvements, and rehabilitation for specific programs (examples include the Parks Master Plan, Library Master Plan, Transportation Planning Guide, etc.); (4) adopted criteria for selecting projects to meet the Mayor and City Council s goals; and (5) staff-identified projects based on critical need due to safety issues or to comply with new mandates. CIP projects are reviewed first by the appropriate operating departments. Projects are prioritized and presented for funding based upon the level of funding estimated to be available for the coming fiscal year and subsequent fiscal years. With the assistance of the Budget, Policy & Strategic Planning Division of the Department of Finance, the City Manager's Office reviews the proposed projects and prepares the CIP for submittal to the Mayor and City Council by May 1 st of each year. The proposed CIP is presented, discussed and acted upon by the Mayor and City Council in public session during the budget hearings. Members of the community can comment on the proposed CIP and provide input to the Mayor and City Council during the hearing process. The Mayor and City Council can make changes to the proposed CIP and then take action on final project approval for inclusion in the Approved Capital Improvement Budget and Program. projects are reviewed by Planning Division staff and/or the Planning Commission for consistency with the City s General and Specific Plan policies. In general, projects are introduced in accordance with existing approved Master Plans. This CIP incorporates several master plans, including the North Natomas Community and Financing Plan, the Parks and Recreation Programming Guide, the Transportation Programming Guide, and the Utility Master Plans. CIP NUMBERS AND ecaps The electronic Citywide Accounting and Personnel System (ecaps) is a new enterprise resource management system implemented in 2007 and 2008 to manage all City financial, human resource, and payroll transactions. As part of the citywide conversion to ecaps, the existing City financial structure (funds, project numbers, organizations, etc.) was converted to new financial numbers. Index Q has been added to provide a conversion chart reflecting old four-digit CIP numbers to the new nine-digit ecaps CIP numbers. Additionally, the Summary of Funding Sources provides the new four-digit ecaps fund numbers and the old three-digit fund numbers CAPITAL IMPROVEMENT PROGRAM 8
16 CITY OF SACRAMENTO BACKGROUND OF CAPITAL IMPROVEMENT PROCESS HOW TO READ THIS DOCUMENT The Capital Improvement Plan and Budget Document contains the following sections: 1) The Executive Summary contains the City Manager s transmittal letter, Program Highlights & Issues of the various capital program areas and a summary of the approved five-year plan. 2) The Background of the Capital Improvement Process includes information on the process and detail on how to utilize information included in the document. 3) The Sacramento Area Maps section includes Council District, Neighborhood Area, Community Plan Area, Infill Area, Neighborhood Commercial Revitalization, and Redevelopment Area maps. 4) Individual capital program area summaries include goals and project selection criteria, project budgets and how they are funded, program issues (including in some cases unmet needs), program long-range plans, and detail sheets for those projects that include funding in FY2009/10 through FY2013/14. 5) Description of Major Capital Funding Sources provides detail by various funding sources on historic levels of use of that fund, how those funds have been expended, restrictions on the use of the funds, and what legislation governs the use of these funds. 6) Indexes of funding for the FY2009/10 CIP Budget by Fund (Index M) and Program (Index N) and for all active and new projects included in the CIP by City Council District (Index O) and by Project Number (Index P). 7) A Glossary with definitions of commonly used terms. A quick reference guide is available at the back of the Table of Contents to provide easy reference to the information contained in this document. Program Area Summaries The bulk of the Capital Improvement Budget includes program area summaries and detailed project pages for each project being funded within those programs during the five-year plan period. The summaries include program goals and criteria used to select projects to meet those goals (project selection criteria); a summary of planned spending; a long-range plan and list of unmet needs (if completed); a summary of projects by fund; and maps detailing project location for FY funded projects. Nine program areas are presented within the Capital Budget. Each Program Area includes subprograms that are divided alphabetically, and in turn the subprograms include a number of different projects. Each project is assigned a four-digit account code when it is approved for funding. The first digit of this code must be the alphabetical letter assigned to the subprogram in which the project is included, with the exception of SHRA, which is numeric CAPITAL IMPROVEMENT PROGRAM 9
17 CITY OF SACRAMENTO BACKGROUND OF CAPITAL IMPROVEMENT PROCESS Individual projects are detailed in their respective program areas. New Growth/Infill Areas Includes a summary of projects by specified geographic areas (i.e. community plan, finance plan or other specific plan) that are included in various programming sections of the document. General Government A Technology B New Buildings C Facility Improvements D General Government Public Safety F Public Safety Convention, Culture & Leisure M Community Center, Cultural/Arts, Golf, Marina, and Zoo Parks & Recreation K Bikeways L Parks and Recreation Economic Development Various Letters dependent on type of project Transportation R Street Maintenance S Signals/Lighting/Traffic Control T Street Improvements V Parking Utilities W Drainage X Sewer Y Solid Waste Z Water Sacramento Housing & Redevelopment Agency 9-Digit numbers starting with 9 SHRA The discussion of an individual capital program area generally begins with summary information on total program expenditures and which major projects make up the bulk of those expenditures, what planning documents are referenced in identifying projects, the funding sources to support the projects, and issue statements that highlight significant unresolved fiscal and program policy issues. Each project is summarized within a project detail page. Detailed project information includes: The Project Title: Capital Improvement Project (CIP) Number. Project Description: A brief but specific description of the project. Project Objectives: The purpose(s) of the project. Existing Situation: The circumstances that result in the need for the project, including any pertinent history. Operating Budget Impact: Any annual operating impact of the completed project. Project Costs: For each funding source, the amount of current budget, the estimated amount of unspent budget funds available as of June 30, 2009, and the funding request for each year of the five-year program. Timelines: Reflects the relationship of budget expenditures to the project timeline CAPITAL IMPROVEMENT PROGRAM 10
18 CITY OF SACRAMENTO BACKGROUND OF CAPITAL IMPROVEMENT PROCESS City Council District: The number of the City Council District in which the project is located. Neighborhood Area: The number of the Neighborhood Area in which the project is located. Planning Area: The number(s) of the planning area(s) in which the project is located (e.g. South Natomas, Pocket, Central City, Meadowview, etc.). Planning areas are defined in the City's General Plan. A map of these planning areas is included in the Overview Section of this document. Project Location: Street address, intersection, building name, etc. Project Manager: The name of the department and/or the individual project manager responsible for delivering the capital project. The City Charter requires that the City adopt a budget for operations and capital improvements on or before June 30 each year. In adopting a capital plan for five years, we are providing a tool to allow for prudent and longer-term planning and allocation of resources for our facility and infrastructure needs. Each year, staff reaffirms the Mayor and City Council s direction for the following fiscal year and extends the program planning period out for additional years. In some program areas, such as transportation and utilities, the Mayor and City Council have adopted strategies for planning periods exceeding five years to meet the long-term needs of the City. Long-range needs and priorities, as well as programming guides, have not been adopted by the Mayor and City Council for all capital programs. Until current planning processes are completed and capital priorities are further identified, projects identified for approved funding within the CIP should be reviewed for consistency with the City s adopted Strategic Plan. CONTINUING PROJECTS In addition to new capital projects with funding in FY2009/10 or current projects with additional funding identified in the capital program, there are many continuing projects that have remaining budget authority but do not have additional funding allocated in future years. Section O of this document indexes these projects by City Council District, and Section P of this document indexes all CIP Projects by CIP Number CAPITAL IMPROVEMENT PROGRAM 11
19 CITY OF SACRAMENTO BUDGET SCHEDULES By Major Funding Source, the FY2009/10 Capital Budget is as follows: FY2009/10 Projects by Fund Dollars in Millions $50.1 General Fund $1.8 SHRA $10.7 Transportation $9.1 Park Development $1.5 Grants/Bonds $0.5 Others $6.5 Utilities $19.0 Lighting & Landscaping/ Development $1.0 Notes: 1) Because of the uncertainty of the State of California s budget crisis, and the possible shift of redevelopment tax increment funds to the state, funding for capital improvements through the Economic Development Program will not be reflected in the document at this time. FY2009/10 Projects by Fund A-1
20 CITY OF SACRAMENTO BUDGET SCHEDULES By Program Area, the FY2009/10 Capital Budget is as follows: FY2009/10 Projects by Program Dollars in Millions $50.1 Parks & Recreation $2.4 General Government/ Public Safety $3.1 Transportation $9.3 Utilities $20.0 Convention, Culture & Leisure $4.6 SHRA $10.7 Notes: 1) The total reflected for each program area includes all funding sources for the projects located in these program areas. 2) Because of the uncertainty of the State of California s budget crisis, and the possible shift of redevelopment tax increment funds to the state, funding for capital improvements through the Economic Development Program will not be reflected in the document at this time. FY2009/10 Projects by Program A-2
21 CITY OF SACRAMENTO BUDGET SCHEDULES The five-year, (CIP) is as follows: Projects by Program Dollars in Millions $219.2 Parks & Recreation $5.9 General Government/ Public Safety $22.5 Transportation $46.4 SHRA $10.7 Utilities $105.5 Convention, Culture & Leisure $28.2 Notes: 1) The total reflected for each program area includes all funding sources for the projects located in these program areas. 2) Because of the uncertainty of the State of California s budget crisis, and the possible shift of redevelopment tax increment funds to the state, funding for capital improvements through the Economic Development Program will not be reflected in the document at this time Projects by Program A-3
22 TOTAL FUND SUMMARY The following is a summary of all funding sources for the five-year capital budget. Schedule 4A Summary of Capital Funding by Funding Source Funding Source Budget through Total 5 Year 6/ / / / / /14 Funding 1001 GENERAL FUND $109,692,840 $1,817,791 $3,712,883 $3,962,883 $4,212,883 $4,212,883 $17,919, MEASURE A - PROJECT $58,995,827 $3,543,000 $3,543,000 $3,468,000 $3,387,000 $3,287,000 $17,228, GAS TAX 2106 $11,791,674 $580,000 $580,000 $580,000 $580,000 $580,000 $2,900, MEASURE A - MAINT. $11,193,172 $ TRAFFIC SAFETY $655,000 $ MAJOR STREET CONSTR. $37,135,716 $2,320,000 $2,320,000 $2,320,000 $2,320,000 $2,320,000 $11,600, STREET CUT $8,593,866 $150,000 $150,000 $150,000 $150,000 $150,000 $750, AB2928 STREET MAINT. $1,206,757 $ STATE RTE. 160 $1,217,952 $ STATE ROUTE 275 $1,357,000 $ TRANSPORTATION SYSTEMS MGMT $70,000 $20,000 $20,000 $20,000 $20,000 $20,000 $100, TRANSPORTATION DEV. $3,588,565 $292,172 $292,172 $292,172 $292,172 $292,172 $1,460, DEVELOPMENT SERVICES $3,128,480 $440,000 $440,000 $440,000 $440,000 $440,000 $2,200, SO NATOMAS COMM IMPROV $2,433,613 $ SO NATOMAS FACILITY BENEFIT 2023 MEASURE A - PROJECT CONSTR. $223,535 $0 $54,506,374 $ HISTORIC PLACES FUND $400,000 $ NEW MEASURE A CONSTRUCTION 2026 NEW MEASURE A MAINTENANCE $0 $1,991,000 $1,991,000 $2,066,000 $2,147,000 $2,247,000 $10,442,000 $0 $235,000 $235,000 $235,000 $235,000 $235,000 $1,175, CITYWIDE L&L DIST $8,490,557 $1,011,761 $1,011,761 $1,011,761 $1,011,761 $1,011,761 $5,058, ETHEL MACLEOD HART TRUST $70,000 $ SPECIAL RECREATION $87,201 $ PARK $150,015 $ QUIMBY ACT $20,999,095 $ OLD SAC MARKET $30,000 $ GOLF FUND $948,579 $70,000 $70,000 $70,000 $70,000 $70,000 $350, ZOO $1,343 $ ART IN PUBLIC PLACES PROJECTS $771,592 $ BLOCK GRANT/SHRA $6,780,374 $ DISASTER RELIEF ACT $3,067 $ CAL EPA $1,000,000 $ SERIES B COP $1,508,298 $ CIP BOND CAPITAL PROJECTS $60,607,565 $500,000 $0 $0 $0 $0 $500, CIRB - CIP $34,151,787 $ CIRB - TAX EXEMPT $78,383,903 $ CIRB - TAXABLE $36,948,892 $ CIRB C&D TAX EXEMPT $30,775,233 $ CIRB C&D TAXABLE $2,400,000 $0 Projects by Fund A-4
23 TOTAL FUND SUMMARY The following is a summary of all funding sources for the five-year capital budget. Schedule 4A Summary of Capital Funding by Funding Source Funding Source Budget through Total 5 Year 6/ / / / / /14 Funding 3008 CITY CAPITAL PROJECTS $2,344,483 $ CROCKER ART MUSEUM $31,913,021 $ N. NATOMAS COMM. IMPR. $17,897,729 $1,010,092 $11,500 $11,500 $11,500 $11,500 $1,056, RICHARDS/RAILYARDS IMPACT A 3203 JACINTO CREEK PLANNING AREA $580,906 $0 $320,000 $ PARK DEVELOPMENT $23,914,369 $1,548,000 $0 $0 $0 $0 $1,548, TAX INCREMENT $50,865,867 $ CAPITAL GRANTS $38,445,447 $ FEDERAL CAP. GRANTS $67,494,033 $ OTHER CAPITAL GRANTS $30,919,400 $ PARKING $30,810,459 $2,878,000 $2,878,000 $2,878,000 $2,878,000 $2,878,000 $14,390, WATER $115,968,844 $13,523,000 $14,723,001 $15,923,002 $17,123,003 $18,323,004 $79,615, SEWER $39,990,373 $3,315,000 $3,364,725 $3,415,196 $3,466,424 $3,518,420 $17,079, SOLID WASTE $30,157,877 $717,000 $417,000 $417,000 $417,000 $417,000 $2,385, LANDFILL CLOSURE $5,195,273 $ SACRAMENTO MARINA $11,712,597 $200,000 $200,000 $200,000 $200,000 $200,000 $1,000, COMMUNITY CENTER $8,265,223 $1,650,000 $2,525,000 $2,350,000 $2,850,000 $4,000,000 $13,375, STORM DRAINAGE $50,342,807 $1,425,000 $1,000,000 $1,000,000 $1,000,000 $1,000,000 $5,425, TH R PROGRAM $555,000 $ FLEET MANAGEMENT $6,858,936 $175,000 $175,000 $175,000 $175,000 $175,000 $875, SHRA - CDBG $0 $562,000 $0 $0 $0 $0 $562, TAX INC. - ALKALI FLAT $0 $361,553 $0 $0 $0 $0 $361, TAX INC. - FRANKLIN BLVD. $0 $1,642,839 $0 $0 $0 $0 $1,642, TAX INC. - N. SACRAMENTO $0 $1,785,807 $0 $0 $0 $0 $1,785, TAX INC. - OAK PARK $0 $921,307 $0 $0 $0 $0 $921, TAX INC. - STOCKTON BLVD. $0 $832,048 $0 $0 $0 $0 $832, TAX INC. - DEL PASO $0 $1,228,397 $0 $0 $0 $0 $1,228, TAX INC. - ARMY DEPOT $0 $2,828,036 $0 $0 $0 $0 $2,828, TAX INC. - AUBURN BLVD. $0 $342,854 $0 $0 $0 $0 $342, TAX INCREMENT-65TH STREET $0 $215,754 $0 $0 $0 $0 $215,754 Total Funds: $1,154,850,516 $50,132,411 $39,660,042 $40,985,514 $42,986,743 $45,388,740 $219,153,450 Projects by Fund A-5
24 TOTAL PROGRAM SUMMARY The following is a summary of all funding sources for the five-year capital budget. Program Schedule 4B Summary of Capital Funding by Program Budget through 6/ / / / / /14 Total 5 Year Funding ANIMAL CONTROL $1,500,000 $0 BIKEWAYS $19,786,474 $292,172 $292,172 $292,172 $292,172 $292,172 $1,460,860 COMMUNITY CENTER $132,466,907 $1,220,000 $2,425,000 $2,250,000 $2,750,000 $3,900,000 $12,545,000 COMMUNITY IMPROVEMENTS $7,745,638 $10,720,595 $0 $0 $0 $0 $10,720,595 COMPUTERS / COMMUNICATIONS $36,062,474 $134,368 $1,054,460 $1,024,460 $1,024,460 $1,024,460 $4,262,208 CULTURAL / ARTS $82,994,459 $330,000 $0 $0 $0 $0 $330,000 DRAINAGE $42,156,016 $2,423,592 $1,000,000 $1,000,000 $1,000,000 $1,000,000 $6,423,592 ECONOMIC DEVELOPMENT $23,722,559 $0 FIRE $11,564,652 $1,448,423 $1,698,423 $1,948,423 $2,198,423 $2,198,423 $9,492,115 GOLF $1,251,238 $60,000 $60,000 $60,000 $60,000 $60,000 $300,000 LIBRARY $48,878,587 $0 MARINA $11,684,128 $200,000 $200,000 $200,000 $200,000 $200,000 $1,000,000 MECHANICAL / ELECTRICAL $482,224 $0 NEW BUILDINGS $127,399,509 $0 PARKING $32,616,617 $2,800,000 $2,800,000 $2,800,000 $2,800,000 $2,800,000 $14,000,000 PARKS $340,000 $0 PARKS & RECREATION $84,186,583 $2,119,761 $571,761 $571,761 $571,761 $571,761 $4,406,805 POLICE $22,076,057 $0 RECREATION $600,000 $0 REPAIR / REMODELING $36,838,320 $1,558,000 $1,783,000 $1,813,000 $1,813,000 $1,813,000 $8,780,000 SEWER $51,880,624 $3,090,000 $3,164,725 $3,215,196 $3,266,424 $3,318,420 $16,054,765 SIGNALS / LIGHTING / TRAFFIC $27,427,454 $1,515,000 $1,515,000 $1,515,000 $1,515,000 $1,515,000 $7,575,000 CONTROL SOLID WASTE $14,327,161 $717,000 $417,000 $417,000 $417,000 $417,000 $2,385,000 STREET IMPROVEMENTS $176,938,737 $3,980,500 $3,980,500 $3,980,500 $3,980,500 $3,980,500 $19,902,500 STREET MAINTENANCE $44,250,843 $3,775,000 $3,775,000 $3,775,000 $3,775,000 $3,775,000 $18,875,000 WATER $115,673,255 $13,748,000 $14,923,001 $16,123,002 $17,323,003 $18,523,004 $80,640,010 Total Funds: $1,154,850,516 $50,132,411 $39,660,042 $40,985,514 $42,986,743 $45,388,740 $219,153,450 Projects by Program A-6

25 CITY COUNCIL DISTRICTS CAPITAL IMPROVEMENT PROGRAM B - 1
26 NEIGHBORHOOD SERVICE AREAS CAPITAL IMPROVEMENT PROGRAM B - 2

27 COMMUNITY PLAN AREAS CAPITAL IMPROVEMENT PROGRAM B - 3

28 INFILL AREAS CAPITAL IMPROVEMENT PROGRAM B - 4

29 NEIGHBORHOOD COMMERCIAL REVITALIZATION AREAS CAPITAL IMPROVEMENT PROGRAM B - 5

30 REDEVELOPMENT AREAS CAPITAL IMPROVEMENT PROGRAM B - 6
31 CITY OF SACRAMENTO NEW GROWTH & INFILL OVERVIEW INTRODUCTION This section of the (CIP) summarizes the planning policies, major development projects and planned public improvements within the City s New Growth and Infill sites. The following geographic areas represent the opportunity sites with the greatest potential for growth in the near term: Railyards Downtown River District (Richards Blvd. area) North Natomas, Panhandle, and Greenbriar Robla Swanston Station / Arden Fair / Point West / Cal Expo 65th Street / University Village / Granite Regional Park Florin Corridor and Light Rail Transit Station (LRT) Delta Shores A summary of planned growth and public facility improvements follows CAPITAL IMPROVEMENT PROGRAM C - 1
32 CITY OF SACRAMENTO NEW GROWTH & INFILL OVERVIEW CAPITAL IMPROVEMENT PROGRAM C - 2

33 CITY OF SACRAMENTO NEW GROWTH & INFILL OVERVIEW Growth Opportunity Areas as identified in the City s 2030 General Plan, adopted March 3, CAPITAL IMPROVEMENT PROGRAM C - 3
34 CITY OF SACRAMENTO NEW GROWTH & INFILL OVERVIEW South Area Community Plan New Growth Area This area has experienced relatively high levels of recent population growth, and this trend is expected to continue. This community s potential growth is mostly associated with the Delta Shores area, build out of the Jacinto Creek Planning Area, and development along the existing light rail line and future extension of the south line transit corridor. The Community Plan for the South Area was recently updated. The Plan evaluates the land uses and need for infrastructure, schools, and other community facilities and services required to address new growth in the area. Future development includes the approved College Square mixed-use project near Cosumnes River College and the future development of the Delta Shores area in the south. Delta Shores is one of the last major undeveloped areas within the. The Delta Shores area is generally located east of Freeport Boulevard, south of the existing Meadowview neighborhood, north of the Sacramento Regional County Sanitation District Wastewater Treatment Plant, and east of the Morrison Creek levee. The site is approximately 800 acres and will contribute to meeting the City's future housing and commercial needs. The planning entitlements and financing plan were approved by the City Council in January Major public improvements proposed to serve planned new growth include: Future Cosumnes Boulevard Extension and Interchange; Phase 2 extension of light rail transit from Meadowview to Calvine Road; Construction of the Sacramento Regional County Sanitation District interceptor line; and Construction of the new intake and pipeline from the Sacramento River to the Folsom South Canal CAPITAL IMPROVEMENT PROGRAM C - 4

35 CITY OF SACRAMENTO NEW GROWTH & INFILL OVERVIEW CAPITAL IMPROVEMENT PROGRAM C - 5
36 CITY OF SACRAMENTO NEW GROWTH & INFILL OVERVIEW Fruitridge/Broadway New Growth Area The Fruitridge/Broadway community includes Sacramento s manufacturing and warehousing district and the Granite Regional Office Park. Increased mixed-use development opportunities will be realized in proximity to Light Rail Transit (LRT) along Folsom Boulevard (e.g., 65 th Street, Power Inn, and Watt/Manlove LRT stations). Higher intensity uses will take advantage of LRT and freeway (US 50) access, which should attract housing, office development, and other employee and resident-serving uses. The Granite Regional Office Park (120-acres) is partially built out with total development to include over 3 million square feet of office space with supporting retail and light industrial development. As a portion of the Clean Tech Zone (formerly the Florin-Perkins Enterprise Zone) the area is home to Sacramento s newest clean and green technology enterprises. Aspen 1 (Teichert) is a proposed 400+ acre project south of Jackson Highway on the west side of South Watt Avenue. The Sacramento Area Local Agency Formation Commission (LAFCo) approved an amendment to the City s Sphere of Influence to include a 28 acre sliver of previously unincorporated vacant land as part of this project site. Development entitlements are anticipated to be approved in Summer Infrastructure improvements in the area include: Recently completed LRT bridge over Watt Avenue to eliminate LRT/auto conflicts South Watt Avenue widening (County project) CAPITAL IMPROVEMENT PROGRAM C - 6

37 CITY OF SACRAMENTO NEW GROWTH & INFILL OVERVIEW CAPITAL IMPROVEMENT PROGRAM C - 7
38 CITY OF SACRAMENTO NEW GROWTH & INFILL OVERVIEW North Sacramento (Robla) New Growth Area Recently approved developments are located in the Raley Boulevard Industrial area, adjacent to McClellan Business Park, and residential infill projects (single family & condominiums) within the Robla neighborhood. The lack of adequate water, drainage, and sewer improvements has hindered development in the area especially between Dry Creek Road and Raley Boulevard. As individual subdivisions are developed, the corresponding local infrastructure and limited off-site infrastructure is constructed, although subdivisions prior to annexation were often approved without provision for backbone infrastructure. Assessment Districts have been formed along Raley Boulevard, but there are a number of areas for which no funding mechanisms exist for improving the backbone utilities. The uncertainty of future land uses (industrial vs. residential) has probably contributed to this inertia. The current General Plan effort is analyzing the future needs of this area CAPITAL IMPROVEMENT PROGRAM C - 8
39 CITY OF SACRAMENTO NEW GROWTH & INFILL OVERVIEW CAPITAL IMPROVEMENT PROGRAM C - 9
40 CITY OF SACRAMENTO NEW GROWTH & INFILL OVERVIEW Swanston/Arden Fair/Point West/Cal Expo The Swanston/Point West/Arden Fair/Cal Expo opportunity area is split by Business 80. To the west of Business 80 is the Swanston light rail station and the Swanston Estates neighborhood, including single and multifamily residential, retail, commercial and industrial. To the east of Business 80 are the Point West, Arden Fair and Cal Expo areas. Arden Fair Mall, located on Arden Way, is Sacramento s largest regional retail center and tax generator in the City. Cal Expo, the home to the California State Fair since 1968, is located on 350 acres adjacent to the American River. Cal Expo is currently considering new plans predicated on a strong desire to pursue opportunities which would provide the resources for the facility improvements needed for the Fair and today s consumer and tradeshow environment. Point West, located between Arden Fair and Cal Expo, complements the surrounding land uses with professional offices, hotels and multifamily residential. The Point West area will be planned to complement the Arden Fair Mall and Cal Expo plans. Future development may include continued growth of retail, multifamily residential and employment uses. This center can provide close-in employment opportunities for surrounding residential areas to reduce commute distances and provide employment opportunities in housing rich communities. A major component of the area will be to promote development that fosters accessibility and connectivity with adjacent transit centers to safely and efficiently accommodate a mixture of cars, transit, bicyclists, and pedestrians CAPITAL IMPROVEMENT PROGRAM C - 10

41 CITY OF SACRAMENTO NEW GROWTH & INFILL OVERVIEW CAPITAL IMPROVEMENT PROGRAM C - 11
42 CITY OF SACRAMENTO NEW GROWTH & INFILL OVERVIEW North Natomas New Growth Area North Natomas is designated as a major growth area in the City for new housing and employment opportunities. In recent years, North Natomas accounted for 47 percent of the development in the City of Sacramento. Based on 2030 General Plan land use designations, North Natomas is projected to account for approximately 24 percent of new housing and 36 percent of new jobs in the City. Since 2005, more than 14,000 dwelling units have been built in North Natomas; the area is now about 2/3 built out for residential uses. Office employment, however, is only partially developed. North Natomas includes a well-integrated mixture of residential, employment, commercial, and civic uses, interdependent on quality transit service, surrounding a town center. An elementary school serves as the focal point of each of the fourteen proposed neighborhoods. Employment Centers, located at the light rail stations and along the freeways, are mixed-use centers consisting of primary employment generators and secondary retail, industrial, and residential uses serving the employees and employers of the center. The North Natomas New Growth Area is bounded by I-80 on the south, Elkhorn Boulevard on the north and City limits on the east and the west. North Natomas includes the Panhandle area including 595 vacant acres proposed predominantly for housing, scheduled for annexation in Summer Greenbriar a 577 acre vacant parcel proposed predominantly for housing is adjacent to the existing North Natomas Community Plan, and was annexed in May Development in the North Natomas area is currently restricted by the Federal Emergency Management Agency s new maps promulgated on December 8, No new construction is permitted in the Natomas Basin until such time that the area has at least 100-year flood protection expected sometime in The improvement projects in North Natomas are funded as part of the CIP program or are built by private landowners. The major infrastructure improvements are financed from the following funds based upon development impact fees and Mello-Roos Community Facilities Districts generally due at the time of building permit. Infrastructure and draft finance plans were recently adopted for Panhandle and Greenbriar. Project information for specific projects is listed in the appropriate section of this CIP document. Quimby Act (Fund 2508) dedication of land for parks North Natomas Public Facilities Fee (Fund 3201) backbone infrastructure Park Impact Fee (Fund 3204) park development Mello-Roos pay-as-you-go Community Facilities Districts and bond districts CAPITAL IMPROVEMENT PROGRAM C - 12

43 CITY OF SACRAMENTO NEW GROWTH & INFILL OVERVIEW CAPITAL IMPROVEMENT PROGRAM C - 13
44 CITY OF SACRAMENTO NEW GROWTH & INFILL OVERVIEW DESIGNATED INFILL AREAS The City s Infill Program focuses on new development and redevelopment to achieve infill development goals and policies adopted by the Mayor and City Council, and focuses on four types of infill areas: Central City; Commercial corridors; Transit-station areas; and Targeted residential neighborhoods. These areas are shown in the Sacramento Area Maps section of this document and overlap certain economic development and SHRA activities. The Infill Strategy includes four major types of infill target areas. The following describes CIPs attributable to each target area. Central City Major areas for infill, new growth, and redevelopment focus include: the Downtown Railyards new growth area, the Richards Boulevard redevelopment area, the J-K-L central business district area, the Alkali Flat redevelopment area, the R Street corridor, and the Waterfront area. Significant investment in infrastructure will be necessary to support additional higher density infill development. Funding to support future infill development in the Central City comes from: tax increment (TI) funds; Community Development Block Grant (CDBG) funds; and State grants. New tax increment funding is included in the SHRA budget, which occurs on a calendar year. The City has also been awarded funding from Propositions 1B (Highway Safety, Traffic Reduction, Air Quality and Port Security Bond Act) and 1C (Housing and Emergency Shelter Trust Fund Act) approved by the California voters in November 2006 that will be used to support major infrastructure projects such as the track relocation for the Railyards and transportation and utility infrastructure for the Township 9 project in the River District. In past years, the City completed an infrastructure assessment of the R Street Corridor and directly funded improvements to the combined sewer system through grant funds to support additional development. Grant funds were also used to acquire a park site to support existing and future residential development in the R Street Corridor CAPITAL IMPROVEMENT PROGRAM C - 14

45 CITY OF SACRAMENTO NEW GROWTH & INFILL OVERVIEW CAPITAL IMPROVEMENT PROGRAM C - 15
46 CITY OF SACRAMENTO NEW GROWTH & INFILL OVERVIEW Transit Station Areas The City s Infill Program identifies areas around existing City light rail stations as areas for new infill development and redevelopment. Some of the light rail station areas are located wholly or partly within redevelopment areas. Many of the targeted stations require additional planning entitlements and zoning changes and require infrastructure upgrades to support additional development. The 65 th Street Transit Village Plan area is included within a redevelopment area, offering additional opportunities to fund necessary infrastructure. In past years, the City devoted some state grant funds to support streetscape enhancements on 65 th Street. Additional analysis is being conducted to identify funding needs for infrastructure to support planned development. The City recently completed a circulation plan for the area and is now in the process of developing a finance plan to identify funding sources for the utility and transportation infrastructure improvements that would support job creation and additional development in the area. The City currently has infrastructure studies underway for the Florin, Meadowview, and Swanston light rail station areas that would serve as the first step in identifying needed capital improvements and financing options for those areas. The Florin and Meadowview studies are expected to be completed in The Draft Environmental Impact Report for the Swanston Transit Village Station was released in February Target Residential Neighborhoods The City s Infill Program targets neighborhoods that include a substantial number of vacant lots and infill opportunities. Most of the assistance in these areas is through fee reduction (e.g., sewer credits administered through the Economic Development Department) and waiver programs. In addition, these neighborhoods encompass many redevelopment areas, and development assistance is provided through SHRA. New tax increment funding is included in SHRA s budget that occurs on a calendar year basis. The City has also updated its Pre-Approved Infill House Plan Program which offers low-cost, pre-approved house plans to residents, property owners and developers to encourage well-designed housing development on the many vacant lots located in these neighborhoods. Commercial Corridors Commercial corridors are identified in the City s Infill and Economic Development Programs as target investment areas. These areas are primarily provided support indirectly through streetscape and urban design planning funded through the Transportation Department and SHRA programs. In addition, many corridors fall within redevelopment areas and can receive SHRA development assistance. The City is currently identifying infrastructure improvements as part of the Florin Road Corridor Plan, which is a joint City-County effort for that corridor. The plan is expected to be completed by summer CAPITAL IMPROVEMENT PROGRAM C - 16
47 CITY OF SACRAMENTO NEW GROWTH & INFILL OVERVIEW Shovel-Ready Sites Program The Shovel-Ready Sites Program was established in FY2004/05 with the intent of encouraging economic development at key locations in the City. The goal of the program is to promote economic development by leveraging and attracting private investment. The program works to address and provide solutions to infrastructure, transportation, planning and environmental challenges. City costs may be recaptured over time through assessment districts, fees or other financing mechanisms, as well as through increased property and sales tax revenue associated with new development. SOURCES OF CIP FUNDING This overview summarizes the CIPs that contribute toward the infill development goals and policies. Funding is provided from a variety of sources depending on the nature of, and funding available for, the improvement. Many projects supportive of the City s Infill Program are initiated by the City s Utilities, Transportation, and Economic Development Departments, as well as SHRA. Funding sources include the City s General and Utility Funds, various tax increment and other redevelopment funds, various transportation funds, Workforce Housing Reward Program grants, Community Development Block Grants (CDBG), and other local, state and federal grant funds. The Infill Program also includes a number of fee waiver and reduction programs and other programs funded through the General Fund and grants. As this document is a capital improvement budget, only project details on City and SHRA capital projects are included. Economic Development: The Economic Development Department has two sources of CIP funding that include the City s General Fund and Tax Increment (TI). The General Fund support is allocated through City Council resolution, and the TI is derived from assessments on property located within the defined Downtown and Richards Boulevard redevelopment areas. Transportation: The Transportation Program includes funding for economic development, infill, and redevelopment efforts from the one-half cent sales tax approved by the Sacramento County voters in 1988, also known as Measure A funds. The programming of these funds is at the discretion of the Economic Development Department, working in close coordination with Transportation staff and meeting fund eligibility requirements. City Utilities: The Utilities Department is comprised of several Enterprise Funds, including the Water, Sewer, Solid Waste, and Storm Drainage Funds. Since Utility Funds are derived from user fees, the use of the funds is restricted to those that are directly related to providing water, sewer, solid waste disposal and storm drainage to citizens and property. The programming of these funds is at the discretion of the Economic Development Department, working in close coordination with Utilities staff and meeting fund eligibility requirements. SHRA: SHRA is a joint City/County agency and is responsible for administering the Community Development Block Grant (CDBG) program, Home Investment Partnerships (HOME) program, and tax increment financing within adopted redevelopment areas. Many of these activities directly and indirectly support infill development either by providing backbone infrastructure to attract private development or by providing direct project assistance CAPITAL IMPROVEMENT PROGRAM C - 17
48 CITY OF SACRAMENTO NEW GROWTH & INFILL OVERVIEW Federal, State, and Local Grant Funds: Several infrastructure projects supportive of infill development were programmed in prior years and are underway. Funding has been provided through state, federal, and local grants in addition to matching City funds. The City has received federal grant funds and Sacramento Area Council of Governments (SACOG) funds to fund improvements in several infill areas in the City including the R Street Corridor and several light rail station areas. In addition to the aforementioned grant programs, the City has also pursued and received State grants including the Jobs-Housing Balance Program (JHB), and the Workforce Housing (WFH) Reward Program, which have been used to support infrastructure projects. As of January 2008, the City has received over $6.7 million from these grant funds. The City has also successfully pursued grant funding in the first round of funding for the State s 2006 Proposition 1C bond programs including the Transit Oriented Development (TOD) Program, the Infill Infrastructure Grant Program, and CALReUSE Remediation Program. As a result of City efforts, the City directly received $36 million and supported developer applications which received another $43 million. Projects benefiting from the first round of Proposition 1C program funding include: Downtown Railyards Township 9 Broadway Lofts Curtis Park Village La Valentina These funds are slated to assist with major infrastructure projects or brownfield remediation associated with the developments. The City plans to apply for additional funding in the second round of funding in CIP OPERATING BUDGET IMPACT Depending upon the specific department, the CIPs may or may not create an operating budget impact. When an improvement creates a new facility such as streetscape improvements, the possibility exists for increased maintenance costs. However, a sewer improvement might result in no operational impact or even a decrease based upon improved performance of the facility. The assumption is that departments are planning appropriately for possible increased operational costs as a consequence of the capital improvements CAPITAL IMPROVEMENT PROGRAM C - 18

 Program as there are adequate resources available to deliver the projects")
49 CITY OF SACRAMENTO GENERAL GOVERNMENT PROGRAM OVERVIEW INTRODUCTION The FY2009/10 Budget for General Government is $1.7 million. The General Fund portion of the General Government Program for FY2009/10 is $0.4 million. In an effort to address the City s significant budget challenges, all General Fund CIPs were reviewed to determine funding requirements for FY2009/10. This review resulted in staff s recommendation to take a one-year funding hiatus for the Americans with Disabilities (ADA) Program as there are adequate resources available to deliver the projects identified for FY2009/10. Additionally, a review of prior capital improvement revenue bonds (CIRBs) identified residual funds from the 2002 CIRBs that could be used on eligible capital improvement projects. As these are restricted funds, staff is recommending that the General Fund contribution be reduced to $500,000 for the Deferred Maintenance Program with the other $500,000 being allocated from the 2002 CIRBs. Finally, the City Treasurer is returning $500,000 from the Treasurer s Investment CIP to provide funding for the Information Technology Operating Budget ($100,000) for Web development and to the General Fund ($400,000) to provide resources toward closing the gap in the FY2009/10 operating budget. Despite the current fiscal challenges the City is facing, the General Government section continues to reflect the City s commitment to focus resources toward existing facilities and programs like the Citywide ADA Project (C , $0.2 million) and the Deferred Maintenance Program (C , $1.0 million) for City facilities. One of the key initiatives for the Deferred Maintenance Program will be to the City s commitment to green building practices, including upcoming energy surveys of existing City buildings. Old Sacramento Museum ADA Access Deferred Maintenance Project Roof Replacement at Fire Station 57 The General Government section also includes General Funded projects that are fully offset by user fees, development surcharges and management fee dedications. These projects include: Planning Technology (A ); Plan/Permit Network System (A ); City Treasurer Investment Reserve (D ); and Information Technology Improvements (A , A and A ). The five-year General Government Program totals $13 million. The General Fund portion of the General Government Program totals $8.4 million. The Program includes those projects discussed above and future funding of existing programs, as well as new programs and projects. Ongoing programs include the Citywide Facility ADA; and Information Technology improvements CAPITAL IMPROVEMENT PROGRAM D - 1
50 CITY OF SACRAMENTO GENERAL GOVERNMENT PROGRAM OVERVIEW The following provides an overview of the various allocations by program in the General Government Program: General Government Capital Program Totals (in 000 s) $13,042 Information Technology $2,144 Fee & Charge supported Programs/Projects $1,983 City Facility Deferred Maintenance $5,000 Americans with Disabilities (ADA) Compliance $2,940 Fleet Facilities (excluding ADA) $875 Corporation Yard $100 PROGRAMS AND PROJECTS The General Government Program includes a variety of projects and programs that are funded from a variety of sources including: General Funds, Enterprise Funds, Developer Fee Contributions, Gas Taxes, Bond Proceeds, and contributions from department budgets on a fee for service basis. The following pages provide an overview of the projects included in the CIP. Americans with Disabilities (ADA) Compliance Programs (C ) The ADA Facility Modifications are funded by the General Fund and other funds as shown below (for Transportation ADA modifications Curb Ramps, refer to the Transportation Program - II). Due to the overall decline in available resources that the City faces, there has been a one-year funding hiatus for the General fund portion of the ADA CIP. A review of available funding in the CIP reflects adequate resources to deliver general fund projects identified for completion in FY2009/ CAPITAL IMPROVEMENT PROGRAM D - 2

51 CITY OF SACRAMENTO GENERAL GOVERNMENT PROGRAM OVERVIEW Project C (CC01) - Facility ADA Compliance Program Fund 5-Year Programming 5-yr. Total Fund Name # 09/10 10/11 11/12 12/13 13/ General Fund 0 500, , , ,000 2,000, Golf Fund 10,000 10,000 10,000 10,000 10,000 50, Parking 78,000 78,000 78,000 78,000 78, , Community Center Fund 100, , , , , ,000 Totals: 188, , , , ,000 2,940,000 ADA Access to New City Hall ADA Access to East Portal Park Restroom City Facility Deferred Maintenance Program (C ) The Deferred Facility Maintenance Program CIP (C ) was initially established in FY1999/00. The program is designed to address maintenance and safety corrections at the more than 400 facilities and properties owned by the City. Deferred maintenance projects include roofing, painting, structural repairs, and renewals to existing plumbing, electrical and mechanical systems. Prioritization and selection of deferred maintenance projects is based on the following City Council approved criteria: (1) biggest risk to facility and occupant; (2) potential risk to public; (3) obsolete or failed components; (4) high energy consumption; (5) above normal request for immediate service; and (6) costeffective/combination of projects. The originally identified backlog was $23 million; to date almost $12 million has been spent on approximately 300 successful projects. The City is deferring facility maintenance at a rate of $1.5 million annually while currently being funded with $1 million annually. Over the past eight years, the City has successfully completed several hundred projects valued at over $15 million; however, the backlog has grown to $42 million. This deferred maintenance backlog includes $12 million at fire stations, $5 million at City museums, $2 million in repairs at community centers, $1 million in deferred maintenance at public restrooms and $15 million for repairs to the Sacramento Valley Intermodal Transportation Facility. A fiveyear project expenditure plan is currently under development CAPITAL IMPROVEMENT PROGRAM D - 3
 - Deferred Maintenance Program Fund 5-Year Programming")


 Central Library Chiller (after) 2009-2014 CAPITAL")
52 CITY OF SACRAMENTO GENERAL GOVERNMENT PROGRAM OVERVIEW Project C (CE21) - Deferred Maintenance Program Fund 5-Year Programming 5-yr. Total Fund Name # 09/10 10/11 11/12 12/13 13/ General Fund 500,000 1,000,000 1,000,000 1,000,000 1,000,000 4,500, CIRB Capital Projects 500, ,000 Totals: 1,000,000 1,000,000 1,000,000 1,000,000 1,000,000 5,000,000 Lawrence Park Restroom Repair (before) Lawrence Park Restroom Repair (after) Central Library Chiller (before) Central Library Chiller (after) CAPITAL IMPROVEMENT PROGRAM D - 4
53 CITY OF SACRAMENTO GENERAL GOVERNMENT PROGRAM OVERVIEW Fee and Charge Supported Programs/Projects The CIP includes projects that are funded with General Funds but are reimbursed through fees and charges. The following provides a description of these projects. Development Surcharges and Management Fee Dedications: In 1992, the Mayor and City Council approved a four percent (4%) automation surcharge on plan check and building permit fees to implement improvements in planning and permit processing (Resolution ). A four percent (4%) automation surcharge on planning entitlement applications was approved in 2004 (Resolution ). These fees reimburse project costs of the Planning and Permit Network Systems General Fund (1001) and Development Services Fund (2016) Project 5-Year Programming 5-yr. Total Title # 09/10 10/11 11/12 12/13 13/ A Planning Technology 56,600 56,600 56,600 56,600 56, ,000 D Treasurer's Investment (500,000) (500,000) Fund 1001 Subtotal: (443,400) 56,600 56,600 56,600 56,600 (217,000) A Plan/Permit Network System 440, , , , ,000 2,200,000 Fund 2016 Subtotal: 440, , , , ,000 2,200,000 Totals: (3,400) 496, , , ,600 1,983,000 Information Technology Projects: The Information Technology Department provides services to all City Departments and is supported by charging departments and other agencies for services received, and through capital grants. Information Technology projects have been established to address equipment needs, life-cycle standards, and technology changes Information Technology (IT) Projects - General Fund (1001) Project 5-Year Programming 5-yr. Total Title # 09/10 10/11 11/12 12/13 13/ A IT Equipment Replacement 437, , , , ,860 2,189,300 A Citywide Fiber Expansion 20,000 20,000 20,000 20,000 20, ,000 A Voic Replacement (145,092) (145,092) Totals: 312, , , , ,860 2,144, CAPITAL IMPROVEMENT PROGRAM D - 5

 Project 5-Year Programming 5-yr.")
54 CITY OF SACRAMENTO GENERAL GOVERNMENT PROGRAM OVERVIEW Fleet Management Fleet Fund revenue comes from charges to other City organizations for services received, including maintenance, repair and replacement of the City s fleet equipment. Projects supported by the Fleet Fund include: facilities and software upgrades, fueling infrastructure modifications and enhancement as mandated by federal, state and local regulatory agencies Fleet Fund (6501) Project 5-Year Programming 5-yr. Total Title # 09/10 10/11 11/12 12/13 13/ A Fleet Management Technology (175,000) 100,000 70,000 70,000 70, ,000 B Fleet Facilities Program 175, ,000 30,000 30, ,000 Fuel Management & Support C Equipment Program 175,000 75,000 75,000 75,000 75, ,000 Totals: 175, , , , , ,000 LNG Fueling Facility LNG Solid Waste Vehicle The 24th Street Corporation Yard (C ) The 24th Street Corporation Yard is supported through contributions from gas tax funds as reflected below Gas Tax Fund (2002) Project 5-Year Programming 5-yr. Total Fund Name # 09/10 10/11 11/12 12/13 13/ C Corporation Yard 20,000 20,000 20,000 20,000 20, ,000 Totals: 20,000 20,000 20,000 20,000 20, , CAPITAL IMPROVEMENT PROGRAM D - 6
55 Project Description IT EQUIPMENT REPLACEMENT A Ongoing Program to maintain and replace Information Technology (IT) telecommunications systems including Voice Over Internet Protocol (VOIP) equipment, Voic , unified messaging, software and hardware licensing, server consolidation, and all related components based on industry standard life cycles. Project Objectives Existing Situation Operating Budget Impact To ensure the integrity and availability of citywide IT enterprise resources based on life-cycle standards, current technologies, and best practices benchmarks. The current Voice Over Internet Protocol (VOIP) and Voic CIPs are being consolidated and expanded. The CIP consolidation efforts will allow for better management, coordination, and budgeting of citywide IT resources that will result in overall cost savings to the City. City departments are charged for telecommunications costs based on usage. This user fee will be charged to all departments and does not result in an additional general fund cost. Fund Budget through Est Balance Fund Source 6/2009 6/ / / / / /14 GENERAL FUND $1,736,499 $615,188 $437,860 $437,860 $437,860 $437,860 $437,860 CAPITAL GRANTS $75,000 $75,000 This Project Total $1,811,499 $690,188 $437,860 $437,860 $437,860 $437,860 $437, Funding Estimated Project Cost FY2009/10 Funding Prior Year Expenditures $2,189,300 $4,000,799 $437,860 $1,121,311 Project Start date Estimated Complete date Elapsed Time Percent Complete Council District Neighborhood Area Planning Area Project Location Project Manager City Wide Information Technology Project Number A AB66 DD - 1
56 CITYWIDE FIBER EXPANSION A Project Description Build 50 more miles (261,269 feet) of fiber optic infrastructure in the City. Project Objectives To achieve the level of connectivity that is needed for traffic control, network connectivity, and communication purposes among City facilities and other agencies. Existing Situation Operating Budget Impact After review of existing infrastructure, it has been determined that there is a need to build 50 more miles of fiber optic infrastructure in order to achieve the required level of City connectivity. Fiber maintenance fees are charged to other government agencies that use the City s fiber infrastructure. Other long range funding strategies to properly maintain the City s fiber infrastructure are being considered. Fund Budget through Est Balance Fund Source 6/2009 6/ / / / / /14 GENERAL FUND $217,351 $182,057 $20,000 $20,000 $20,000 $20,000 $20,000 DEVELOPMENT SERVICES $226,000 $ CIRB - CIP $15,000 $0 WATER $40,000 $0 This Project Total $498,351 $182,057 $20,000 $20,000 $20,000 $20,000 $20, Funding Estimated Project Cost FY2009/10 Funding Prior Year Expenditures $100,000 $598,351 $20,000 $316,294 Project Start date Estimated Complete date Elapsed Time Percent Complete Council District Neighborhood Area Planning Area Project Location Project Manager City Wide Information Technology Project Number A AB71 DD - 2
57 Project Description VOIC REPLACEMENT 1311 A Maintenance and replacement of the City s voic equipment and all related components based on industry standard life cycles. In FY2008/09 this project was consolidated with the IT Equipment Project A For FY2009/10, the balance of funds remaining in this CIP will be transferred to A Project Objectives Existing Situation Operating Budget Impact To maintain and replace the City s voic infrastructure by conforming with voic equipment life cycle standards, current technologies, and vendor support requirements. The majority of the City s existing voic equipment components will require replacement within the next 2-4 years. Funding has not previously been budgeted to address the anticipated equipment replacement. City departments will contribute to this project based on their total number of full-time equivalents (FTE) or employees that have voic . This user fee will be charged to all departments. Fund 1001 Budget through Est Balance Fund Source 6/2009 6/ / / / / /14 GENERAL FUND $1,464,643 $145,092 -$145,092 $0 $0 $0 $0 This Project Total $1,464,643 $145,092 -$145,092 $0 $0 $0 $ Funding Estimated Project Cost FY2009/10 Funding Prior Year Expenditures -$145,092 $1,319,551 -$145,092 $1,319,551 Project Start date Estimated Complete date Elapsed Time Percent Complete Council District Neighborhood Area Planning Area Project Location Project Manager Citywide Information Technology Project Number A DD - 3
58 Project Description FLEET MGMT TECHNOLOGY UPGRADES A Provides reserve funding for upgrades, replacement or additions to the Fleet Management computer system. Enables the division to track costs associated with fleet equipment, bill departments for services, and make cost-effective decisions when maintenance costs exceed the new equipment s life cycle cost. Project Objectives Existing Situation Operating Budget Impact Provide an updated web enabled Fleet management system that facilitates the capture of relevant data so that Fleet Management can operate more efficiently and competitively, and have improved benchmarking capability. Fleet Management business processes and work flow are being reviewed, updated and documented in preparation for upgrading existing software. This process will take place over two years. For FY 2009/10 $175,000 will be reprogrammed to the Fleet Facilities Program CIP (B ) to provide one time funding for the NACY space planning study. None Fund 6501 Budget through Est Balance Fund Source 6/2009 6/ / / / / /14 FLEET MANAGEMENT $1,764,000 $494,115 -$175,000 $100,000 $70,000 $70,000 $70,000 This Project Total $1,764,000 $494,115 -$175,000 $100,000 $70,000 $70,000 $70, Funding Estimated Project Cost FY2009/10 Funding Prior Year Expenditures Project Start date Estimated Complete date Elapsed Time Percent Complete $135,000 $1,899,000 -$175,000 $1,269,885 July 1994 June 2014 Council District Neighborhood Area Planning Area Project Location Project Manager Citywide General Services, Keith Leech Project Number A AA61 DD - 4
59 Project Description Project Objectives PLANNING TECHNOLOGY A Ongoing Program to implement automated processes and address technology needs for the Planning Division. Implement objectives of the Department Automation Master Plan; develop systems to replace existing programs or provide information not currently available on existing systems; and provide tracking systems for permits and entitlements. Existing Situation Operating Budget Impact The systems in use are incomplete, inconsistently utilized and do not address all of the Department s automation needs. An automation surcharge of 4% on all planning entitlement applications was approved by the City Council on September 14, 2004 (Resolution ). An increase from 4% to 8% was approved by the City Council on March 25, 2008 (Resolution ). This fee will be used to reduce the Department s reliance on General Funds to address technology needs related to development activities. Fund 1001 Budget through Est Balance Fund Source 6/2009 6/ / / / / /14 GENERAL FUND $1,092,747 $230,178 $56,600 $56,600 $56,600 $56,600 $56,600 This Project Total $1,092,747 $230,178 $56,600 $56,600 $56,600 $56,600 $56, Funding Estimated Project Cost FY2009/10 Funding Prior Year Expenditures $283,000 $1,375,747 $56,600 $862,569 Project Start date Estimated Complete date Elapsed Time Percent Complete Council District Neighborhood Area Planning Area Project Location Project Manager Citywide Development Services Project Number A AA64 DD - 5
60 Project Description PLAN/PERMIT NETWORK SYSTEM A Several new programs are needed, examples include: application tracking; plan check, permit application tracking and checklists; permit issuance; inspections scheduling and tracking; contractors license board and workers compensation interface; property and parcel history interface; and management reports. Project Objectives Existing Situation Operating Budget Impact Implement objectives of the Department Automation Master Plan; develop systems to replace existing programs or provide information not currently available on existing systems; provide tracking systems for permits and entitlements. The systems in use are incomplete, inconsistently utilized and do not address all of the Department s automation needs. An automation surcharge of 4% on plan check and permit fees was approved by the City Council on March 17, 1992 (Resolution ). An increase to 8% was approved by the City Council on March 25, 2008 (Resolution ). The fees collected will be used to address technology needs related to development activities. Fund Budget through Est Balance Fund Source 6/2009 6/ / / / / /14 GENERAL FUND $3,147,475 $0 DEVELOPMENT SERVICES $2,902,480 $993,082 $440,000 $440,000 $440,000 $440,000 $440,000 This Project Total $6,049,955 $993,082 $440,000 $440,000 $440,000 $440,000 $440, Funding Estimated Project Cost FY2009/10 Funding Prior Year Expenditures Project Start date Estimated Complete date Elapsed Time Percent Complete $2,200,000 $8,249,955 $440,000 $5,056,873 March 1992 Council District Neighborhood Area Planning Area Project Location Project Manager Citywide Development Services, Ryan Pham Project Number A DD - 6
61 FLEET FACILITIES PROGRAM B Project Description Consolidation and improvement of fleet service, repair facilities and parts stores. Project Objectives Improve building layout efficiency and sizes to accommodate larger vehicles, equipment. Replace older infrastructure and built-in equipment for improved efficiency, reduced environmental impact. Complete a Fleet facility master plan study and programming needs for a new fleet shop to service NACY. Existing Situation Operating Budget Impact Shop space is inadequate for increased numbers of refuse and utility trucks now being dispatched from NACY. Funding for FY2009/10 will be augmented by defunding the Fleet Management Technology Upgrades CIP (A ) in the amount of $175,000. Operating budget costs should decline as the services are consolidated. Fund 6501 Budget through Est Balance Fund Source 6/2009 6/ / / / / /14 FLEET MANAGEMENT $1,029,966 $173,165 $175,000 $0 $30,000 $30,000 $30,000 This Project Total $1,029,966 $173,165 $175,000 $0 $30,000 $30,000 $30, Funding Estimated Project Cost FY2009/10 Funding Prior Year Expenditures Project Start date Estimated Complete date Elapsed Time Percent Complete $265,000 $1,294,966 $175,000 $856,801 July 1999 June 2014 Council District Neighborhood Area Planning Area Project Location Project Manager Citywide General Services, Keith Leech Project Number B BA01 DD - 7
62 Project Description FUEL MANAGEMENT & SUPPORT EQUIPMENT PROGRAM C Fuel management, dispensing, storage, and monitoring systems require ongoing testing, maintenance, and upgrading to assure environmental protection. ows for making upgrades as mandated and for improved accountability and reconciliation. Project Objectives Existing Situation Operating Budget Impact Implement a pilot GPS monitoring system for fuel conservation and management efforts. Reduce the City's exposure to liability. Install, upgrade, repair, and replace fuel storage tanks, fuel monitoring systems, and fuel management software. This program is in response to ongoing state and federal regulations that require continued upgrading on increased levels of monitoring for leakage. Maintenance of new tank systems meeting regulatory guidelines is ongoing. The costs are charged to fleet vehicles and equipment through a fuel surcharge. Fund 6501 Budget through Est Balance Fund Source 6/2009 6/ / / / / /14 FLEET MANAGEMENT $3,028,000 $396,801 $175,000 $75,000 $75,000 $75,000 $75,000 This Project Total $3,028,000 $396,801 $175,000 $75,000 $75,000 $75,000 $75, Funding Estimated Project Cost FY2009/10 Funding Prior Year Expenditures Project Start date Estimated Complete date Elapsed Time Percent Complete $475,000 $3,503,000 $175,000 $2,631,199 July 1987 June 2014 Council District Neighborhood Area Planning Area Project Location Project Manager Citywide General Services, Keith Leech Project Number C CA91 DD - 8
63 CORP YARD MAINTENANCE PROGRAM C Project Description Maintenance, repair, and upgrades to the common infrastructure of the corporation yard. Project Objectives Provide safety for City equipment, property and employees. Enhance energy infrastructure and space efficiency for the facilities. Provide safety for vehicles in the Corporation Yard. Provide training and learning centers at the Corporation Yard. Existing Situation Operating Budget Impact Work continues on the installation of communication system and energy efficient modifications. None. Fund Budget through Est Balance Fund Source 6/2009 6/ / / / / /14 GAS TAX 2106 $110,000 $136 $20,000 $20,000 $20,000 $20,000 $20,000 MEASURE A - MAINT. $437,033 $ SERIES B COP $333,298 $659 WATER $232,702 $3,385 SEWER $193,736 $4,938 SOLID WASTE $324,774 $1,287 STORM DRAINAGE $460,784 $8,468 FLEET MANAGEMENT $714,682 $11,665 This Project Total $2,807,009 $30,969 $20,000 $20,000 $20,000 $20,000 $20, Funding Estimated Project Cost FY2009/10 Funding Prior Year Expenditures Project Start date Estimated Complete date Elapsed Time Percent Complete $100,000 $2,907,009 $20,000 $2,776,040 July 1994 June 2013 Council District Neighborhood Area Planning Area Project Location Project Manager th Street General Services, Tony Alexander Project Number C CB56 DD - 9
64 Project Description Project Objectives FACILITY ADA COMPLIANCE PROGRAM C Survey, classify and prioritize conditions in City facilities which do not comply with the Americans with Disabilities Act (ADA) and State requirements. Design and build the needed corrections. Comply with Federal and State Civil Rights Laws to eliminate physical barriers which cause discrimination to Americans with disabilities. The federal ADA was signed into law in July The ADA has far reaching implications for both public and private employers. Existing Situation City Staff are currently working on updating the City s ADA Facility Compliance Program to ensure that the most critical facilities are updated first. A review of available funding reflects adequate resources to deliver general fund projects identified for completion in FY2009/10. Operating Budget Impact The overall decline in available resources that the City faces in the context of the decline in the local, State and national economy have reduced the General Funds available for capital projects. A one-year funding hiatus for the General Fund portion of the ADA CIP will reduce the overall General Fund obligations for FY2009/10. Fund Budget through Est Balance Fund Source 6/2009 6/ / / / / /14 GENERAL FUND $2,976,200 $2,000,000 $0 $500,000 $500,000 $500,000 $500,000 GOLF FUND $62,640 $60,000 $10,000 $10,000 $10,000 $10,000 $10,000 ZOO $1,343 $0 OTHER CAPITAL GRANTS $26,421 $0 PARKING $856,191 $800,000 $78,000 $78,000 $78,000 $78,000 $78,000 COMMUNITY CENTER $979,729 $948,030 $100,000 $100,000 $100,000 $100,000 $100,000 FLEET MANAGEMENT $115,455 $0 This Project Total $5,017,980 $3,808,030 $188,000 $688,000 $688,000 $688,000 $688, Funding Estimated Project Cost FY2009/10 Funding Prior Year Expenditures Project Start date Estimated Complete date Elapsed Time Percent Complete $2,940,000 $7,957,980 $188,000 $1,209,950 July 1993 June 2013 Council District Neighborhood Area Planning Area Project Location Project Manager Citywide General Services, Brian Reilly Project Number C CC01 DD - 10
65 Project Description CITY FACILITY DEFERRED MAINTENANCE PROGRAM C The Deferred Facility Maintenance Program was established in FY1999/00. The program is designed to address maintenance and safety corrections at the more than 400 City facilities/sites. The prioritization and selection of projects is based upon City Council approved criteria. Project Objectives Existing Situation Operating Budget Impact Renewal of plumbing, electrical, structural, mechanical and additional building systems and components within facilities that have either failed or are beyond their useful life. The current estimated deferred maintenance backlog is estimated at $42 million for City facilities. This backlog includes $12 million at fire stations, $5 million at City museums, $2 million in repairs at community centers, $1 million in deferred maintenance at public restrooms and $15 million for repairs to the Sacramento Valley Intermodal Transportation Facility. A five-year project expenditure plan is currently under development. A review of prior capital improvement revenue bonds (CIRBs) identified residual funds from the 2002 CIRBS. The FY2009/10 budget for deferred maintenance includes $500,000 in restricted bond funds that can only be utilized for capital improvements. The use of these bond proceeds provides resources toward closing the gap in the FY2009/10 operating budget. Fund Budget through Est Balance Fund Source 6/2009 6/ / / / / /14 GENERAL FUND $11,200,135 $255,532 $500,000 $1,000,000 $1,000,000 $1,000,000 $1,000,000 CAL EPA $1,000,000 $18, CIP BOND CAPITAL PROJECTS $0 $0 $500,000 $0 $0 $0 $0 This Project Total $12,200,135 $274,308 $1,000,000 $1,000,000 $1,000,000 $1,000,000 $1,000, Funding Estimated Project Cost FY2009/10 Funding Prior Year Expenditures Project Start date Estimated Complete date Elapsed Time Percent Complete $5,000,000 $17,200,135 $1,000,000 $11,925,827 July 1999 June 2010 Council District Neighborhood Area Planning Area Project Location Project Manager 1, 2, 3, 4, 5, 6, 7 Citywide General Services, Tony Alexander Project Number C CE21 DD - 11
66 CTY TREASURER IVST MGT RSV D Project Description Program 20% of net investment management fees generated from services provided to Sacramento City Employees Retirement System (SCERS). Funds are used by the City Treasurer's Office to ensure necessary and appropriate resources are readily available to assist in the delivery of the various treasury services; this may include, but is not limited to, the development, acquisition, and maintenance of automated programs. Project Objectives To provide treasury management services at a less than fair market value without incurring City subsidy. Existing Situation The investment fees generated from treasury services currently results in a net positive return to the General Fund. Prior to implementation of an investment management fee, the City General Fund subsidized investment services provided to SCERS. The negative adjustment for FY2009/10 reflects a transfer of unobligated funds to the Information Technology Operating Budget ($100,000) for Web development and to the General Fund ($400,000) to provide resources toward closing the gap in the FY2009/10 operating budget. Operating Budget Impact None. The establishment of a Treasury Reserve for treasury management services will help to ensure there is no additional General Fund costs to maintain service levels. Fund 1001 Budget through Est Balance Fund Source 6/2009 6/ / / / / /14 GENERAL FUND $1,620,000 $730,085 -$500,000 $0 $0 $0 $0 This Project Total $1,620,000 $730,085 -$500,000 $0 $0 $0 $ Funding Estimated Project Cost FY2009/10 Funding Prior Year Expenditures -$500,000 $1,120,000 -$500,000 $889,915 Project Start date Estimated Complete date Elapsed Time Percent Complete Council District Neighborhood Area Planning Area Project Location Project Manager City Treasurer's Office City Treasurer Project Number D AB51 DD - 12

67 CITY OF SACRAMENTO PUBLIC SAFETY PROGRAM OVERVIEW INTRODUCTION The Public Safety includes capital projects that have been identified within the Fire Master Plan and/or the Police Strategic Plan, and are consistent with the City s General Plan. The map below reflects the locations of existing police stations, fire stations, and the public safety administration center CAPITAL IMPROVEMENT PROGRAM E - 1
68 CITY OF SACRAMENTO PUBLIC SAFETY PROGRAM OVERVIEW The FY2009/10 Public Safety Capital Improvement Budget totals approximately $1.4 million funded by the General Fund. This program includes the following three projects: Public Safety Emergency Generator Upgrades (F ), Advanced Life Support (ALS) equipment (F ), and Fire Apparatus/Equipment (F ). The Public Safety Program totals approximately $9.5 million, which includes continued funding for generator upgrades (twelve fire stations remaining) and capital equipment needs for Fire Stations. In addition to the capital funding included in the 5-year program, an additional $4 million has been programmed to fund the debt service associated with the FY2006/07 and FY2007/08 Fire Apparatus/Equipment purchases. FACILITIES PROGRAM GOALS/UNMET NEEDS Police The mission of the Sacramento Police Department is to work in partnership with the community to protect life and property, solve neighborhood problems, and enhance the quality of life in our City. The Sacramento Police Department s long-term facilities goals are to provide sufficient space to house all necessary police functions in a manner that is conducive to efficient and effective operations, as well as to facilitate the Department s capacity of projected service delivery goals. As the Department continues to meet its mission and fulfill the policy direction of the Mayor and City Council through decentralization, additional substations are needed for efficient police patrol functions. Currently, the Sacramento Police Department (SPD) has four facilities. As the City grows, new facilities will be needed to meet projected service demands, including a permanent facility in the downtown core and two substations to be located in the Meadowview and North Natomas areas to provide efficient police services. The Police Department's Master Plan delineates several Capital Improvement projects that address its facilities, technology, specialty vehicle and aircraft needs. These operational and infrastructure projects will become increasingly important to the Department's ability to maintain safety and security for citizens and businesses. Fire The Sacramento Fire Department has developed a plan for facilities that is based on an assessment of the Department s needs. The plan identifies eight stations that should be replaced primarily due to inadequate size and poor condition. Four of the eight stations are recommended for replacement due to their inefficient locations within their districts. The State of California passed the Essential Service Building Seismic Act of 1986, which requires certain public safety buildings to meet a higher earthquake standard. Fire stations are one of the designated types of buildings that fall under the Act. At present, only the Fire Stations completed in 2005 (Stations 5, 20 and 30), meet the Seismic Safety Act. the other stations will be evaluated to determine what is needed to retrofit the structures to meet the Seismic Safety Act. The plan developed by the Fire Department represents a thorough assessment of the Department s needs; however, the realization of the plan will be very difficult given current budget constraints. The major improvement projects and new facilities that have been identified as unmet needs must be addressed within the next decade to assure service levels keep pace with the changing population and to meet program goals for facility maintenance, rehabilitation, and replacement CAPITAL IMPROVEMENT PROGRAM E - 2


69 CITY OF SACRAMENTO PUBLIC SAFETY PROGRAM OVERVIEW Public Safety Emergency Generator Project Fire Station 10 Fire Station 12 Sacramento Fire Department Equipment and Apparatus CAPITAL IMPROVEMENT PROGRAM E - 3
70 ADVANCE LIFE SUPPORT ALS EQUIP F Project Description Purchase of medical defibrillators and ambulances for use in advanced life support (ALS) services. Project Objectives ALS equipment and vehicle purchases cross fiscal years. The objective of this project is to establish a long-term funding plan that will provide sustainable funding over multiple years to be used for the purchase of capital equipment needs. Existing Situation Operating Budget Impact Funding for the purchase of defibrillators and ambulances has been budgeted in the City s Annual Operating Budget through FY2005/06. Capital funding for replacement vehicles is provided on a pay as you go basis, which means budgeting for fleet equipment needs in the year they are due to be replaced. Expenditures related to defibrillators and ambulances are covered by revenues collected through the City s Advanced Life Support/Ambulance Service. Funding for operations and maintenance is budgeted in the Fire Department operating budget. Fund 1001 Budget through Est Balance Fund Source 6/2009 6/ / / / / /14 GENERAL FUND $1,080,000 $1,080,000 $1,080,000 $1,080,000 $1,080,000 $1,080,000 $1,080,000 This Project Total $1,080,000 $1,080,000 $1,080,000 $1,080,000 $1,080,000 $1,080,000 $1,080, Funding Estimated Project Cost FY2009/10 Funding Prior Year Expenditures $5,400,000 $6,480,000 $1,080,000 $0 Project Start date Estimated Complete date Elapsed Time Percent Complete Council District Neighborhood Area Planning Area Project Location Project Manager Citywide Fire Project Number F FB86 EE - 1
71 FIRE APPARATUS EQUIPMENT F Project Description Purchase of emergency response vehicles including fire trucks, engines, and hazardous materials vehicles. Project Objectives Fire Trucks, engines, hazardous material vehicles, and other large apparatus purchases cross fiscal years. The objective of this project is to establish a long-term funding plan that will provide sustainable funding over multiple years to be used for the purchase of capital equipment needs. Existing Situation Operating Budget Impact There is an existing replacement schedule established by the Fleet Management Division for all of the City s Fleet assets. Funding for the purchase of replacement fire equipment was budgeted in the City s Annual Operating Budget through FY2005/06. Capital funding for replacement vehicles is provided on a pay as you go basis, which means budgeting fleet equipment needs in the year they are due to be replaced. The debt service related to the acquisition of 13 vehicles is a general fund obligation. Future year funding is in addition to required debt payments totaling approximately $782,000 associated with these 13 vehicles as well as an additional $424,000 budgeted in the Fire Department operating budget. An additional debt borrowing is planning for FY2009/10. Fund 1001 Budget through Est Balance Fund Source 6/2009 6/ / / / / /14 GENERAL FUND $7,240,417 $814,850 $218,423 $468,423 $718,423 $968,423 $968,423 This Project Total $7,240,417 $814,850 $218,423 $468,423 $718,423 $968,423 $968, Funding Estimated Project Cost FY2009/10 Funding Prior Year Expenditures $3,342,115 $10,582,532 $218,423 $6,425,567 Project Start date Estimated Complete date Elapsed Time Percent Complete Council District Neighborhood Area Planning Area Project Location Project Manager Citywide General Services, Fleet Staff Project Number F FB87 EE - 2
72 Project Description PSAF GENERATOR UPGRADES F Install standby generators at fire stations and other facilities which are essential to emergency response and disaster recovery. Generator installation priority: Priority A-Stations 2, 11, 13, 16, 17, 18, and 57; and Priority B-Stations 3, 4, 9, 14, & 15. Project Objectives Existing Situation Operating Budget Impact Install generators at existing essential facilities. Since 1996 generators have been installed at the following fire stations: 1, 5-8, 10,12, 19, 20, 30, 56 and 60. Standby generators have also been installed at the Public Safety Administration Building, the Fire Department's Training Tower, a City Water Tower, and the City s main data center. Fire Station 2 is in the conceptual design phase and construction will be completed in FY2009/10. The current funding level for this program provides funding for one station to be completed every other year. Given inflation and the current funding level for this program, emergency generators will not be available at all fire stations until Maintenance cost is estimated to be $800 per year. Fund 1001 Budget through Est Balance Fund Source 6/2009 6/ / / / / /14 GENERAL FUND $1,673,382 $670,181 $150,000 $150,000 $150,000 $150,000 $150,000 This Project Total $1,673,382 $670,181 $150,000 $150,000 $150,000 $150,000 $150, Funding Estimated Project Cost FY2009/10 Funding Prior Year Expenditures $750,000 $2,423,382 $150,000 $1,003,201 Project Start date Estimated Complete date Elapsed Time Percent Complete Council District Neighborhood Area Planning Area Project Location Project Manager Various General Services, James Christensen Project Number F FB32 EE - 3
73 CITY OF SACRAMENTO CONVENTION, CULTURE AND LEISURE PROGRAM OVERVIEW INTRODUCTION The Convention, Culture and Leisure Department includes the following: Convention Center Complex, Capital City Golf, Sacramento Marina, Old Sacramento, Sacramento Archives, Historic City Cemetery, Crocker Art Museum, Metropolitan Arts Commission, Sacramento History Museum, Discovery Museum Science and Space Center, Sacramento Zoo, and Fairytale Town. The FY2009/10 (CIP) budget totals $1.87 million. The budget reflects funding of six projects at the Convention Center Complex ($1.6 million), two projects at the City s three golf course locations ($70,000), and two projects at the Sacramento Marina ($200,000). Included in this total is $60,000 for the Americans with Disabilities Act (ADA) modifications, which are included in the General Government program. The five-year CIP plan for Convention, Culture and Leisure totals $14.7 million and includes 11 projects at the Convention Center ($ million), two projects for Golf ($350,000), and two projects at the Marina ($1.0 million). Included in this total is $300,000 for the ADA modifications, which are also included in the General Government program. The figures below display the funding levels for the various components of the Convention, Culture and Leisure Program for FY2009/10 and the following four years. CONVENTION, CULTURE AND LEISURE FY2009/10 CIP PROGRAM (in 000 s) $1,870 Marina $200 Golf $70 Community Center $1, CAPITAL IMPROVEMENT PROGRAM F - 1
74 CITY OF SACRAMENTO CONVENTION, CULTURE AND LEISURE PROGRAM OVERVIEW CONVENTION, CULTURE AND LEISURE CIP PROGRAM (in 000 s) $14,730 Marina $1,000 Golf $350 SOURCES OF CIP FUNDING Community Center $13,375 Marina Fund: The Marina Fund is used for Marina maintenance and operations, capital requirements, and debt service. Marina revenues are derived from slip rental fees, fuel sales, concessions, and interest earnings. Golf Fund: The Golf Fund supports the operation, maintenance, capital requirements, and debt service of the City s five courses at three locations: Haggin Oaks, Bing Maloney and Bartley Cavanaugh. The Fund derives its revenues from green fees, golf lessons, cart rentals, golf merchandise sales, food and beverage concessions, and interest earnings. Community Center Fund: The Community Center Fund supports the operation, maintenance, capital requirements, and debt service of the Sacramento Convention Center Complex, which includes the Convention Center, Theater, and the Memorial Auditorium. It is supported by (1) the Transient Occupancy Tax (TOT), which is a tax charged to individuals who occupy a hotel or motel room; (2) User Fees which include facility rental, equipment and event service fees; and (3) interest earnings. CIP OPERATING BUDGET IMPACT A primary consideration in the selection of projects is the maintenance or improvement of City assets to keep these facilities competitive, safe and contribute to increasing revenues. The Department has given priority to those projects that have little or no operating impact. Wherever possible, operating costs associated with each approved CIP project have been identified. In many cases, there is little or no operating impact because the project generates cost savings, offsetting revenues, or the costs can be absorbed within the existing operating budget CAPITAL IMPROVEMENT PROGRAM F - 2


75 CITY OF SACRAMENTO CONVENTION, CULTURE AND LEISURE PROGRAM OVERVIEW SACRAMENTO MARINA (Fund 6009) Program Goals Provide high quality and safe berthing facilities with convenient access to area waterways Maintain facilities and make improvements to remain competitive with other marinas Provide clean and well-maintained facilities and equipment Project Selection Criteria Meet legal, health and safety requirements to protect public and employees Prevent damage to facilities and watercraft Increase tenant occupancy and revenues The FY2009/10 CIP Budget for the Sacramento Marina totals $200,000 and includes two projects. The Harbor Dredging project is the existing fund accumulation project for periodic dredging of the harbor and entrance channel. The Marina Improvements project accumulates funds for facility improvements including, but not limited to, replacement of deteriorated or damaged whaler and coverboard sections in the North Basin, replacement of the vent system in the North Basin, installation of sun shields in the North Basin, installation of restrooms and shower facilities in the North and South Basins, and installation of electrical meters at berths. Total programming over the next five years is $1.0 million. These projects are consistent with the City s General Plan and the Marina Business Plan. Revenues to the Sacramento Marina Fund are derived from slip rental fees, fuel, and concession sales at the Marina. The funds are used for the operation, maintenance, and debt service of the Marina. The chart below details the five-year funding levels for the various projects ($000 s) Sacramento Marina Fund (6009) Project # Section Title Budget 09/10 10/11 11/12 12/13 13/14 M M FF FF Harbor Dredging Marina Improvements Totals: CAPITAL IMPROVEMENT PROGRAM F - 3
76 CITY OF SACRAMENTO CONVENTION, CULTURE AND LEISURE PROGRAM OVERVIEW GOLF (Fund 2603) Program Goals Compete effectively with other golf facilities in the Sacramento area and Northern California Respond to public s demand for high quality golfing facilities Provide clean and well-maintained grounds and facilities Improve services and develop new revenue sources Maximize number of golf rounds played and revenues Implement a phased Americans with Disabilities Act (ADA) work plan and self-assessment Project Selection Criteria Meet legal, health and safety requirements to protect public and employees Maintain existing facilities Modernize outdated and inefficient facilities and equipment The FY2009/10 CIP Budget for Golf totals $70,000 and includes two projects. The ADA Compliance project will fund facility modifications required under the Americans with Disabilities Act. The Course/Facility Maintenance project is an existing fund accumulation project for general maintenance. Total programming over the next five years is $350,000. These projects are consistent with the City s General Plan and the Golf ADA Work Plan. The Golf Fund derives its revenue from green fees, golf lessons, golf cart rentals, golf merchandise sales, and food and beverage concessions from the City s three municipal golf facilities. The following chart details the five-year funding levels for Golf ($000 s) Golf Fund (2603) Project # Section Title Budget 09/10 10/11 11/12 12/13 13/14 C M DD FF ADA Compliance Various * Course/Facility Maintenance *This project is also funded from other sources see project detail Totals: COMMUNITY CENTER (Fund 6010) Program Goals Provide clean and well-maintained facilities and equipment Enhance appeal of the Convention Center Complex for the economic and cultural vitality of the Sacramento community Maintain and increase user satisfaction with the Convention Center Complex Project Selection Criteria Meet legal, health and safety requirements to protect public and employees Maintenance and facility improvements to ensure public s comfort and enjoyment Improve marketability of Community Center Complex and increase revenues CAPITAL IMPROVEMENT PROGRAM F - 4

77 CITY OF SACRAMENTO CONVENTION, CULTURE AND LEISURE PROGRAM OVERVIEW The FY2009/10 CIP Budget for the Convention Center Complex totals $1.6 million and includes six projects. The funding will increase resources in existing CIP s to meet project requirements. Existing projects with additional funding include the general maintenance CIP, fund accumulation for renovation of the Community Center Theater and fund accumulation for replacement of audio-visual equipment at the Convention Center, and fund accumulation for the maintenance and ongoing rehabilitation of the historic Memorial Auditorium. Also, additional funding is required to replace the emergency generator at the Convention Center in order to meet state air quality standards. Funds are also programmed for facility modifications required under the ADA. Total programming over the next five years is $ million and includes fund accumulation for the next cycle of carpet replacement at the Convention Center, replacement of the chiller units at the Convention Center, upgrades to the Convention Center Security Surveillance and Exhibit Hall lighting systems, replacement of the HVAC system at the administration building, and additional funds for improvements to the Memorial Auditorium. These projects are consistent with the City s General Plan. The major income sources for this enterprise fund are the Transient Occupancy (hotel/motel) Tax and facility user fees. These funds pay for operation of the Community Center Complex facilities, capital improvements and debt service payments. The chart below details the five-year funding levels for the various Convention Center Complex projects ($000 s) Community Center Fund (6010) Project # Section Title Budget 09/10 10/11 11/12 12/13 13/14 C M M M M M M M M M M DD FF FF FF FF FF FF FF FF FF FF ADA Compliance Various* Community Ctr Maintenance Theater Renovation Audio Visual Maintenance Convention Center Carpet Conv Ctr Chiller Replacement Conv Ctr Admin HVAC Conv Ctr Security Upgrades Exhibit Hall Lighting Mem. Auditorium Improvements* Conv Ctr Generator Replace , , , , , *This project is also funded from other sources - see project detail. Totals: 1,600 2,475 2,400 2,950 3, CAPITAL IMPROVEMENT PROGRAM F - 5
78 CITY OF SACRAMENTO CONVENTION, CULTURE AND LEISURE PROGRAM OVERVIEW CAPITAL IMPROVEMENT PROGRAM F - 6
79 Project Description Project Objectives COMMUNITY CENTER MAINTENANCE M This is an ongoing fund accumulation project to provide for scheduled and unscheduled major maintenance, repair, or equipment for the Convention Center Complex. To protect employees and the public from potential safety hazards. To ensure continued uninterrupted operation of the facility. Existing Situation Operating Budget Impact The Convention Center Complex facilities are more than 30 years old. Major maintenance, repair or equipment will be needed to operate the facilities. Accumulating funds for these needs is essential. None. Fund 6010 Budget through Est Balance Fund Source 6/2009 6/ / / / / /14 COMMUNITY CENTER $469,494 $284,422 $50,000 $105,000 $80,000 $230,000 $450,000 This Project Total $469,494 $284,422 $50,000 $105,000 $80,000 $230,000 $450, Funding Estimated Project Cost FY2009/10 Funding Prior Year Expenditures $915,000 $1,384,494 $50,000 $185,072 Project Start date Estimated Complete date Elapsed Time Percent Complete Council District Neighborhood Area Planning Area Project Location Project Manager J Street Convention, Culture & Leisure Project Number M PA51 FF - 1
80 Project Description Project Objectives THEATER RENOVATION M This project is an ongoing fund accumulation project and may include a major renovation of the Sacramento Community Center Theater, including a financial feasibility study. Increase appeal of the Community Center Theater as an events venue, ensure ADA requirements, improve customer service, and meet legal, health and safety requirements to protect public and employees. Existing Situation Operating Budget Impact The Community Center Theater has not had a major renovation since opening in It does not meet the technical needs of current users. Restroom facilities are inadequate and accessibility needs significant improvements. In its current condition, it will be at a competitive disadvantage to other performing arts venues planned in the region. None. Fund 6010 Budget through Est Balance Fund Source 6/2009 6/ / / / / /14 COMMUNITY CENTER $1,330,000 $1,117,268 $1,050,000 $2,000,000 $1,850,000 $2,000,000 $3,000,000 This Project Total $1,330,000 $1,117,268 $1,050,000 $2,000,000 $1,850,000 $2,000,000 $3,000, Funding Estimated Project Cost FY2009/10 Funding Prior Year Expenditures $9,900,000 $11,230,000 $1,050,000 $212,732 Project Start date Estimated Complete date Elapsed Time Percent Complete Council District Neighborhood Area Planning Area Project Location Project Manager L Street Convention, Culture & Leisure Project Number M PC11 FF - 2
81 Project Description Project Objectives CONVENTION CENTER AV MAINTENANCE M This is an ongoing fund accumulation project to maintain and replace City-owned audiovisual (AV) equipment at the Sacramento Convention Center. Meet client expectations for reliable equipment. Maintain operational competitiveness. Protect public and employees from potential hazards. Existing Situation Operating Budget Impact The Convention Center currently provides client audiovisual needs through a preferred audiovisual provider agreement. Under that agreement, the provider annually contributes $20,000, which is used to upgrade and replace existing equipment and incorporate new technologies to remain competitive in the industry. None. Fund 6010 Budget through Est Balance Fund Source 6/2009 6/ / / / / /14 COMMUNITY CENTER $120,000 $116,315 $20,000 $20,000 $20,000 $20,000 $20,000 This Project Total $120,000 $116,315 $20,000 $20,000 $20,000 $20,000 $20, Funding Estimated Project Cost FY2009/10 Funding Prior Year Expenditures $100,000 $220,000 $20,000 $3,685 Project Start date Estimated Complete date Elapsed Time Percent Complete Council District Neighborhood Area Planning Area Project Location Project Manager J Street Convention, Culture & Leisure Project Number M PC21 FF - 3
82 CONVENTION CENTER CARPET REPLACE M Project Description Fund accumulation project to maintain and periodically replace carpet in the Sacramento Convention Center. Project Objectives Enhance appearance of Convention Center for customers and the general public. Clean and well-maintained facility and equipment to remain competitive with other convention centers. Reduce maintenance costs. Existing Situation Operating Budget Impact New carpet was installed in Funding begins again in FY2012/13 for the next replacement cycle. Timely replacement of carpeting throughout the facility will reduce maintenance and repair costs. Fund 6010 Budget through Est Balance Fund Source 6/2009 6/ / / / / /14 COMMUNITY CENTER $750,000 $29,296 $0 $0 $0 $200,000 $200,000 This Project Total $750,000 $29,296 $0 $0 $0 $200,000 $200, Funding Estimated Project Cost FY2009/10 Funding Prior Year Expenditures $400,000 $1,150,000 $0 $720,704 Project Start date Estimated Complete date Elapsed Time Percent Complete Council District Neighborhood Area Planning Area Project Location Project Manager J Street Convention, Culture & Leisure Project Number M PC26 FF - 4
83 CONVENTION CENTER CHILLER REPLACEMENT M Project Description Replace the existing centrifugal chillers #1, #2 and #3 at the Sacramento Convention Center. Project Objectives Meet legal, health and safety requirements to protect public and employees. Clean and well-maintained facilities and equipment. Reliable air conditioning system for clients. Existing Situation Operating Budget Impact The chillers were first installed in They are not energy efficient by today s standards and the refrigerant that they use is no longer manufactured. Replacement would also comply with new refrigerant regulations from the Environmental Protection Agency. Maintenance, repair and utility savings from replacement of outdated and worn equipment. Fund 6010 Budget through Est Balance Fund Source 6/2009 6/ / / / / /14 COMMUNITY CENTER $276,000 $0 $0 $200,000 $200,000 $0 $0 This Project Total $276,000 $0 $0 $200,000 $200,000 $0 $ Funding Estimated Project Cost FY2009/10 Funding Prior Year Expenditures $400,000 $676,000 $0 $276,000 Project Start date Estimated Complete date Elapsed Time Percent Complete Council District Neighborhood Area Planning Area Project Location Project Manager J Street Convention, Culture & Leisure Project Number M PC46 FF - 5
84 COMMUNITY CENTER SECURITY SYSTEM M Project Description Fund accumulation project to assess and upgrade the existing security surveillance system at the Convention Center Complex, including new equipment to reflect current technology. Project Objectives Improve public safety. Increase user satisfaction. Minimize interruptions to facility operations. Existing Situation The current security surveillance system was installed during the 1996 Center expansion and needs to be upgraded to reflect current technologies and industry standards. Operating Budget Impact Fund 6010 Budget through Est Balance Fund Source 6/2009 6/ / / / / /14 COMMUNITY CENTER $125,000 $125,000 $0 $0 $0 $100,000 $30,000 This Project Total $125,000 $125,000 $0 $0 $0 $100,000 $30, Funding Estimated Project Cost FY2009/10 Funding Prior Year Expenditures $130,000 $255,000 $0 $0 Project Start date Estimated Complete date Elapsed Time Percent Complete Council District Neighborhood Area Planning Area Project Location Project Manager J Street Convention, Culture & Leisure Project Number M PC56 FF - 6
85 Project Description Project Objectives MEMORIAL AUDITORIUM IMPROVEMENTS M This is an ongoing fund accumulation project to address deferred maintenance, facility improvements, and renovation needs at the historic Sacramento Memorial Auditorium. To ensure historic City facility continues to provide a clean and well-maintained venue for the public. Meet health, safety and historic preservation requirements. Existing Situation Operating Budget Impact In May 2006, the City Council approved $3 million in Community Reinvestment CIP bond proceeds and $3 million in redevelopment tax increment funds for other priority needs. The first major project, waterproofing, lighting and landscaping were completed in Spring Improvements to the roof and restrooms are under construction. Ongoing funding will be used for future needs. The waterproofing project will save the foundation from water damage and improve the building s overall ability to repel water. Fund Budget through Est Balance Fund Source 6/2009 6/ / / / / /14 GENERAL FUND $80,000 $ CIRB - TAX EXEMPT $3,053,000 $1,999,987 TAX INCREMENT $3,053,000 $0 COMMUNITY CENTER $950,000 $707,440 $100,000 $100,000 $100,000 $200,000 $200,000 This Project Total $7,136,000 $2,707,427 $100,000 $100,000 $100,000 $200,000 $200, Funding Estimated Project Cost FY2009/10 Funding Prior Year Expenditures Project Start date Estimated Complete date Elapsed Time Percent Complete $700,000 $7,836,000 $100,000 $4,428,573 July 2006 Council District Neighborhood Area Planning Area Project Location Project Manager th And J Street Convention, Culture & Leisure, Yadi Kavakebi Project Number M PC71 FF - 7
86 CONVENTION CENTER GENERATOR REPLACEMENT M Project Description Replacement of the Emergency Generator required for operation of the Sacramento Convention Center. Project Objectives To ensure continued, uninterrupted power for the Convention Center if the primary power source is unavailable. To protect the employees and public from potential safety hazards. Existing Situation Operating Budget Impact The current generator was installed in 1995 during the Convention Center expansion. Replacement is necessary to meet State Air Quality standards. One-time expense to purchase the generator. Additional funding necessary in FY10 to complete project. Fund 6010 Budget through Est Balance Fund Source 6/2009 6/ / / / / /14 COMMUNITY CENTER $800,000 $777,622 $330,000 $0 $0 $0 $0 This Project Total $800,000 $777,622 $330,000 $0 $0 $0 $ Funding Estimated Project Cost FY2009/10 Funding Prior Year Expenditures Project Start date Estimated Complete date Elapsed Time Percent Complete $330,000 $1,130,000 $330,000 $22,378 October 2008 December 2009 Council District Neighborhood Area Planning Area Project Location Project Manager J Street Convention, Culture & Leisure Project Number M FF - 8
87 Project Description COURSE/FACILITY MAINTENANCE M This is an ongoing fund accumulation project to finance major maintenance activities at City-owned golf courses, including design and development activities. Projects include irrigation improvements, greens rehabilitation, and structural repairs. Project Objectives Existing Situation Operating Budget Impact Maintain golf courses to compete with other golf facilities. Provide clean and well-maintained grounds and facilities. Golf courses require regular maintenance to remain competitive. To maintain the greens, current irrigation systems need major maintenance and, in some cases, replacement. None Fund 2603 Budget through Est Balance Fund Source 6/2009 6/ / / / / /14 GOLF FUND $357,732 $75,602 $60,000 $60,000 $60,000 $60,000 $60,000 This Project Total $357,732 $75,602 $60,000 $60,000 $60,000 $60,000 $60, Funding Estimated Project Cost FY2009/10 Funding Prior Year Expenditures $300,000 $657,732 $60,000 $282,130 Project Start date Estimated Complete date Elapsed Time Percent Complete Council District Neighborhood Area Planning Area Project Location Project Manager City Golf Courses Convention, Culture & Leisure Project Number M OB61 FF - 9
88 Project Description HARBOR DREDGING M This is an ongoing fund accumulation project for annual dredging of Marina harbor entrance to eliminate silt buildup, navigational problems, and dock structure damage to maintain year-round safe access for boaters. This project also accumulates funds to perform full dredging of the entire Marina basin every years. Project Objectives Existing Situation Operating Budget Impact Provide sufficient water depth for vessels to navigate in the Marina. Prevent damage to docks. Maintain Marina in full operation. Silt buildup decreases the water depth of the Sacramento Marina, which results in navigational problems and potential damage to water craft and Marina structures. None. Fund Budget through Est Balance Fund Source 6/2009 6/ / / / / /14 GENERAL FUND $114,654 $114,654 DISASTER RELIEF ACT $3,067 $0 SACRAMENTO MARINA $595,194 $156,799 $65,000 $65,000 $65,000 $65,000 $65,000 This Project Total $712,915 $271,453 $65,000 $65,000 $65,000 $65,000 $65, Funding Estimated Project Cost FY2009/10 Funding Prior Year Expenditures $325,000 $1,037,915 $65,000 $441,462 Project Start date Estimated Complete date Elapsed Time Percent Complete Council District Neighborhood Area Planning Area Project Location Project Manager 4 1 Sacramento Marina 2710 Ramp Way Convention, Culture & Leisure Project Number M IA11 FF - 10
89 Project Description Project Objectives MARINA IMPROVEMENTS M This is an ongoing fund accumulation project that would fund retrofitting, major repairs and improvements at the Sacramento Marina. Provide clean and well-maintained facilities and equipment. Make improvements to remain competitive with other area marinas. Existing Situation Operating Budget Impact The Sacramento Marina completed a major renovation of the South Basin in This funding will initially focus on identified needs in the North Basin since those berths were constructed over 20 years ago. Replacement of damaged or outdated facilities are designed to reduce maintenance and repair costs. Fund 6009 Budget through Est Balance Fund Source 6/2009 6/ / / / / /14 SACRAMENTO MARINA $135,000 $135,000 $135,000 $135,000 $135,000 $135,000 $135,000 This Project Total $135,000 $135,000 $135,000 $135,000 $135,000 $135,000 $135, Funding Estimated Project Cost FY2009/10 Funding Prior Year Expenditures $675,000 $810,000 $135,000 $0 Project Start date Estimated Complete date Elapsed Time Percent Complete Council District Neighborhood Area Planning Area Project Location Project Manager 4 Sacramento Marina 2710 Ramp Way Convention, Culture & Leisure Project Number M FF - 11

90 CITY OF SACRAMENTO PARKS AND RECREATION PROGRAM OVERVIEW INTRODUCTION The Department of Parks and Recreation s mission is to optimize the experience of living through parks, programs, facilities, and the preservation of open space. Population and housing growth within the City of Sacramento and the surrounding regional area over the last six years has created increased demands and opportunities for new parks and recreation facilities including urban plazas, trails, river parkways, and passive open space areas. The Department continues to improve park sustainability through renovated irrigation systems, centralized water control systems, and native, water conserving plantings. The Department s (CIP) is a reflection of a slowing down of growth, and addresses the Mayor and City Council s commitment to improving the quality of life for all residents and visitors. The Department of Parks and Recreation s CIP consists of three programs: Parks, Recreation Facilities, and Off-Street Bikeways. As part of the annual budget process, the FY2009/10 Parks and Recreation CIP budget is recommended to increase by approximately $2.4 million. These projects will increase the total Department CIP to approximately 198 active projects and a total budget of $87.4 million. Parks and recreation projects are funded primarily through special revenue sources: Park Development Impact Fee (PIF); Quimby Act In Lieu Fees (where land dedication is not appropriate); Landscape and Lighting District Assessment; Land Park Trust Fund; Federal Transportation Development Act (TDA) grants; Sacramento Housing and Redevelopment Agency (SHRA) funding; state and federal grants; and private foundation grants or gifts. A challenge for the Department is to match growth in capital projects and facilities with ongoing maintenance, operational and programming needs. Although the Department has a sizable capital development program annually, funds to Five Star Park maintain, operate, and program new facilities and amenities are insufficient to meet the needs of a rapidly growing city. The Neighborhood Park Maintenance Facilities District provides only 60 percent of the funding for new neighborhood or community parks and does not provide maintenance funding for the remainder of a park s acreage, or new regional park acreage. Expanded community centers and gymnasiums struggle to provide staff and supplies without dedicated funding sources. Staff will continue to seek ways to increase efficiency and build capacity to operate and maintain new facilities. The City will be reducing the number of Community Planning Areas from eleven to ten in FY2009/10 with adoption of the City s new 2030 General Plan. This capital program reflects this restructuring of funds collected and allocations for the community planning areas affected (East Broadway, South Sacramento, and Airport-Meadowview) CAPITAL IMPROVEMENT PROGRAM G - 1

91 CITY OF SACRAMENTO PARKS AND RECREATION PROGRAM OVERVIEW The following plans, programs, and initiatives are the City s improvement plan for its parks and recreation capital facilities. DEPARTMENT OF PARKS AND RECREATION MASTER PLAN In Fall 2004, the Mayor and City Council adopted a comprehensive Parks and Recreation Master Plan for the City. The Master Plan is part of the City s General Plan. This policy document guides the City s parks and recreation planning, development, programs and services through The Parks and Recreation Master Plan addresses all aspects of the department including: recreation and human services; children s programs; community centers; park development; partnerships; maintenance and tree planting; park operations and maintenance; marketing and special events; and department-wide administrative services. Staff will continue to implement the plan s policies and recommendations through ENHANCED CAPITAL GRANT AND RESOURCE DEVELOPMENT PROGRAM The Department has made great strides over the past seven years to secure capital grant funds from external funding sources, to formulate public and private partnerships, and to engage in legislative activities to enhance regional and neighborhood park and recreation amenities. State bond funds and competitive grant awards have also grown significantly over the past six years and now account for approximately 20 percent of the Parks and Recreation CIP. Staff is currently managing $20 million in bonds and grants for a variety of acquisition, development, and rehabilitation projects as approved by the Mayor and City Council. The Department s continued success in securing competitive capital grants will depend on the ability to effectively scope projects and make them grant ready. The Department has maximized its ability to find creative ways to leverage existing resources for project planning. Increased funding for feasibility studies, scoping, and other planning enhance the City s competitiveness for capital grant funding and legislative earmarks. Nuevo Park Grand Opening CAPITAL IMPROVEMENT PROGRAM G - 2

92 CITY OF SACRAMENTO PARKS AND RECREATION PROGRAM OVERVIEW PARKS AND RECREATION PROGRAMMING GUIDE The 2008 Parks and Recreation Programming Guide (PRPG) is a planning document designed to identify, evaluate and prioritize unfunded park and recreation acquisitions, repair/rehabilitation, development, community facility, and regional projects. The top projects are identified in each of the City s community planning areas as well as the top regional projects citywide. The PRPG process ensures that the City Council and community are strategically involved in the development of a comprehensive list of unfunded project needs and that those needs are prioritized based on City Council policy and deficiencies identified. Throughout each year, staff pursues Fort Natomas at South Natomas Community Park Rebuild opportunities to fund the top scoring priority projects through existing City funding. Staff also works to fund projects as opportunities arise that are ideal for specific funding sources, such as a capital grant program or Community Development Block Grant (CDBG) funds. As projects are funded, they move into the CIP and are removed from the PRPG. A biennial review of the PRPG allows the community, Parks and Recreation Commission, and City Council the opportunity to add new projects to be evaluated, scored and integrated into the next PRPG. PARK DEVELOPMENT FEES INCREASED TO ADDRESS UNDEVELOPED PARK AND RECREATION FACILITIES IN GROWTH AREAS In Summer 2004, the Mayor and City Council responded to the need for park and recreation facilities for residents in growth areas by increasing the Park Impact Fee (PIF). The previous fee level provided for only minimal park development amenities in new parks; it was insufficient to provide for a range of recreational opportunities for Sacramento residents. The increased fee allows development of a more complete array of park facilities including shade structures for picnic areas and playgrounds, restrooms, innovative play features, sports courts, and sports field lighting. At the Mayor and City Council s request, the Department has updated the Park Development Impact Fee Nexus Study to include consideration of funding mechanisms for the acquisition and development of regional parks, trails and open space, and funding for larger community facilities such as aquatic complexes and community centers. Formal action by the City on the Nexus Study recommendations is, however, pending better economic times. FUNDING CHALLENGES FOR RIVER PARKWAYS, REGIONAL PARKS, TRAILS, AND BIKEWAY BRIDGE MAINTENANCE There is currently no dedicated funding source for acquiring, developing or maintaining the City s regional park and trail system, including river corridors and bikeway/pedestrian bridges. As identified in the PRPG, there are significant needs citywide for regional park and trail acquisition, park development, and CAPITAL IMPROVEMENT PROGRAM G - 3

93 CITY OF SACRAMENTO PARKS AND RECREATION PROGRAM OVERVIEW rehabilitation. Regional facilities included in the PRPG such as sports complexes, artificial turf sports fields, venues for sports tournaments, large public gathering places for festivals and special events, and river trail enhancements improve the quality of life in the City, as well as provide significant economic benefits. Maintaining and renovating high use regional facilities is a continuing challenge. Staff will continue to seek funding for these facilities, which are important to a growing community. PARK DEVELOPMENT PROCESS AND PRODUCTION SCHEDULE The park development process takes projects through a defined course, outlining how a park project evolves from project concept to a developed park. Important aspects of the process include: New ideas and concepts come from a variety of sources including the community, staff, the Mayor and City Council members, outside agencies and schools. The PRPG is updated every two years to show progress on existing projects and provide opportunities to include new projects. A new project becomes a part of the approved CIP when it has a defined project scope, adequate funding for that scope, a production schedule, and meets the readiness checklist criteria as outlined in the park development process. Shasta Community Park opening in Summer 2009 Consideration may be given to special opportunity projects where new funding has been identified for a previously unconsidered or under-funded project. Operations and maintenance resources need to be a primary consideration for project readiness. This process is consistent with the City s Strategic Plan goals which include implementing organizational improvements, as well as preserving and expanding park and recreation opportunities CAPITAL IMPROVEMENT PROGRAM G - 4
: The Transportation Development Act (TDA) is used to account for receipts and disbursements of money allocated pursuant to the State")

94 CITY OF SACRAMENTO PARKS AND RECREATION PROGRAM OVERVIEW Parks and Recreation Program CIP Fund Sources FY2009/10 (in 000 s) $2,411 Park Impact Fee, $1,548 Landscape and Lighting, $571 Transportation Development Act, $292 Transportation Development Act (Fund 2013): The Transportation Development Act (TDA) is used to account for receipts and disbursements of money allocated pursuant to the State of California Transportation Development Act, which dedicates a percentage of the state s sales tax allocated to Sacramento County. The City has traditionally dedicated these funds to off-street bikeway development, and implementation is coordinated with City Department of Transportation. The total budget amount of the Transportation Development Act programmed to parks in FY2009/10 is $292,172. Project # Title Transportation Development Act (Fund 2013) 5-Year Programming 09/10 10/11 11/12 12/13 13/14 K Bike Trail Maintenance 25,000 25,000 25,000 25,000 25,000 K Bike Trail/Pedestrian Bridge Repair 103, , , , ,000 K Bike Trail Planning 2,000 2,000 2,000 2,000 2,000 K TDA Fed and State Grants Match 162, , , , ,172 Totals: $292,172 $292,172 $292,172 $292,172 $292, CAPITAL IMPROVEMENT PROGRAM G - 5
95 CITY OF SACRAMENTO PARKS AND RECREATION PROGRAM OVERVIEW Landscape and Lighting Assessment District (Fund 2232): Landscape and Lighting (L&L) Funds are generated from a citywide assessment district with assessment based on benefit. The funds are used for advance planning in the four Neighborhood Services Areas, and parks repair and rehabilitation in the Community Planning Areas. Additionally, the L&L contributes $100,000 annually to swimming and wading pool maintenance, $75,000 to playground maintenance and $75,000 to sports court maintenance. The total budget amount of the L&L assessment programmed to parks in FY2009/10 is $571,761. Project # Neighborhood Services Area Sub-Projects (Fund 2232) Title 5-Year Programming 09/10 10/11 11/12 12/13 13/14 L Area 1 Planning 30,000 30,000 30,000 30,000 30,000 L Area 2 Planning 30,000 30,000 30,000 30,000 30,000 L Area 3 Planning 30,000 30,000 30,000 30,000 30,000 L Area 4 Planning 30,000 30,000 30,000 30,000 30,000 Subtotals: $120,000 $120,000 $120,000 $120,000 $120,000 Project # Title Rehabilitation Sub-Projects (Fund 2232) 5-Year Programming 09/10 10/11 11/12 12/13 13/14 L Sports Court Rehabilitation/Repair 75, , , , ,000 L Citywide L&L Park Repair 201, , , , ,761 L Playground Rehabilitation/Repair 75,000 75,000 75,000 75,000 75,000 L Swimming Pool Rehabilitation and Repair 100, , , , ,000 Subtotals: $451,761 $451,761 $451,761 $451,761 $451,761 Total of L&L Fund 2232 $571,761 $571,761 $571,761 $571,761 $571,761 Land Park Fund (Fund 2507): The Land Park Fund includes revenue generated from various activities in William Land Park including rentals, park permits, and concessions. These funds may only be used for operational and capital improvements within Land Park. No park projects have been programmed in this fund in FY2009/10. Park Impact Fee (Fund 3204): The Mayor and City Council established the Park Impact Fee in August 1999; this fund is comprised of fees collected from builders of industrial, commercial, and residential developments at the time a building permit is issued. The revenue must be used to benefit the residents of the Community Planning Area in which the fee is collected. These funds are programmed by the Community Planning Areas in accordance with this benefit requirement. The total budget amount of the Park Impact Fees programmed to parks in FY2009/10 is $1,548, CAPITAL IMPROVEMENT PROGRAM G - 6
96 CITY OF SACRAMENTO PARKS AND RECREATION PROGRAM OVERVIEW Project # Title Park Impact Fee (Fund 3204) 5-Year Programming 09/10 10/11 11/12 12/13 13/14 L Sycamore Park Improvements 65, L th and Q street Master Plan 50, L PA1 Park Sign replacement 24, L PA8 Park Sign Replacement 49, L Charlie Jensen Park Improvement 75, L Egret Park Master Plan Revision 50, L Regency Park Improvement 10, L Tanzanite Community Park Improvement 350, L Lewis Park Enhancement 50, L Sierra 2 Park Court Rehabilitation 75, L Cesar Chavez Plaza Improvements 100, L Redbud Park Rehabilitation/Development 275, L Gardenland Park PSIP Tier III 375, Totals: $1,548,000 $0 $0 $0 $ CAPITAL IMPROVEMENT PROGRAM G - 7
97 CITY OF SACRAMENTO PARKS AND RECREATION PROGRAM OVERVIEW CAPITAL IMPROVEMENT PROGRAM G - 8
98 Project Description Project Objectives BIKE TRAIL MAINTENANCE K Provide maintenance of off-street bike trails throughout the City. The maintenance of bike trails includes, but is not limited to, sweeping, debris removal, vegetation control, landscape maintenance, and graffiti removal. Provide maintenance of off-street bike trails to ensure safety to users and to protect the City's long-term investment in its bike trails. Consistent maintenance of the bike trails will reduce the cost of future repairs. Existing Situation Operating Budget Impact The bike trail maintenance program is necessary to keep the City's bike trails safe and prevent early deterioration. This project could potentially save the City significant General Fund money in future repair costs. Fund 2013 Budget through Est Balance Fund Source 6/2009 6/ / / / / /14 TRANSPORTATION DEV. $741,700 $50,401 $25,000 $25,000 $25,000 $25,000 $25,000 This Project Total $741,700 $50,401 $25,000 $25,000 $25,000 $25,000 $25, Funding Estimated Project Cost FY2009/10 Funding Prior Year Expenditures $125,000 $866,700 $25,000 $691,299 Project Start date Estimated Complete date Elapsed Time Percent Complete Council District Neighborhood Area Planning Area Project Location Project Manager City Wide Parks & Recreation, J.P. Tindell Project Number K HB31 GG - 1
99 Project Description Project Objectives BIKE TRAIL/PED BRIDGE REPAIR K This project is for citywide repairs and rehabilitation of existing off-street bike trails including pavement, striping, and bike/pedestrian trail shoulder repairs. Provide necessary repairs of the off-street bike/pedestrian trails to ensure safety to users and to protect the City s long-term investment in bike/pedestrian trails. Existing Situation Operating Budget Impact The bike/pedestrian trail repair program is needed to keep the City s bike/pedestrian trails safe and prevent deterioration. This project could potentially save the City significant General Fund money in future repair costs. Fund 2013 Budget through Est Balance Fund Source 6/2009 6/ / / / / /14 TRANSPORTATION DEV. $816,715 $347,445 $103,000 $103,000 $103,000 $103,000 $103,000 This Project Total $816,715 $347,445 $103,000 $103,000 $103,000 $103,000 $103, Funding Estimated Project Cost FY2009/10 Funding Prior Year Expenditures $515,000 $1,331,715 $103,000 $469,270 Project Start date Estimated Complete date Elapsed Time Percent Complete Council District Neighborhood Area Planning Area Project Location Project Manager City Wide Parks & Recreation, J.P. Tindell Project Number K HB32 GG - 2
100 BIKE TRAIL PLANNING PROGRAM K Project Description Plan and pursue funding for the development of off-street bike trails throughout the City. Project Objectives Ensure a well planned network of bike trails throughout the City. Existing Situation The bike trail planning program is needed to plan and pursue funds for the development of bike trails. Operating Budget Impact This project would save General Fund money which would be used to plan and pursue funds for bike trail projects. Fund 2013 Budget through Est Balance Fund Source 6/2009 6/ / / / / /14 TRANSPORTATION DEV. $72,962 $5,282 $2,000 $2,000 $2,000 $2,000 $2,000 This Project Total $72,962 $5,282 $2,000 $2,000 $2,000 $2,000 $2, Funding Estimated Project Cost FY2009/10 Funding Prior Year Expenditures $10,000 $82,962 $2,000 $67,680 Project Start date Estimated Complete date Elapsed Time Percent Complete Council District Neighborhood Area Planning Area Project Location Project Manager City Wide Parks & Recreation, J.P. Tindell Project Number K HB41 GG - 3
101 Project Description TDA FEDERAL AND STATE GRANTS MATCH K This project is the holding account for matching federal and state grants on bikeway projects. The matching funds will be transferred into the individual projects once the projects have received authorization to proceed from Caltrans. Project Objectives Existing Situation Operating Budget Impact Reserve the matching funds and startup funds needed for state and federal grants such as TEA21, TEA3 and STIP. None. None. Fund 2013 Budget through Est Balance Fund Source 6/2009 6/ / / / / /14 TRANSPORTATION DEV. $659,892 $659,690 $162,172 $162,172 $162,172 $162,172 $162,172 This Project Total $659,892 $659,690 $162,172 $162,172 $162,172 $162,172 $162, Funding Estimated Project Cost FY2009/10 Funding Prior Year Expenditures $810,860 $1,470,752 $162,172 $202 Project Start date Estimated Complete date Elapsed Time Percent Complete Council District Neighborhood Area Planning Area Project Location Project Manager Citywide Parks & Recreation, J.P. Tindell Project Number K HC26 GG - 4
102 Project Description Project Objectives Existing Situation AREA 1 PARK PLANNING L Provides funding for general area-wide advance park planning activities. Additionally, it may be used to cover new project costs until a project-specific CIP is established. Provides funding support for pre-cip activities in Neighborhood Services Area 1. Necessary for pre-cip activities in the communities of Neighborhood Services Area 1. A well planned and implemented park and recreation system will preserve and enhance the quality of life for all residents and visitors of Sacramento. Operating Budget Impact No operating budget impact because it is only for pre-cip activities.. Fund Budget through Est Balance Fund Source 6/2009 6/ / / / / /14 CITYWIDE L&L DIST $195,006 $25,452 $30,000 $30,000 $30,000 $30,000 $30,000 PARK DEVELOPMENT $30,000 $0 This Project Total $225,006 $25,452 $30,000 $30,000 $30,000 $30,000 $30, Funding Estimated Project Cost FY2009/10 Funding Prior Year Expenditures $150,000 $375,006 $30,000 $199,554 Project Start date Estimated Complete date Elapsed Time Percent Complete Council District Neighborhood Area Planning Area Project Location Project Manager 1, 3, 4, 6 1 1, 2, 5, 6 Neighborhood Area 1 Parks & Recreation, J.P. Tindell Project Number L LK92 GG - 5
103 Project Description Project Objectives Existing Situation AREA 2 PARK PLANNING L Provides funding for general area-wide advance park planning activities. Additionally, it may be used to cover new project costs until a project-specific CIP is established. Provides funding support for pre-cip activities in Neighborhood Services Area 2. Necessary for pre-cip activities in the communities of Neighborhood Services Area 2. A well planned and implemented park and recreation system will preserve and enhance the quality of life for all residents and visitors of Sacramento. Operating Budget Impact No operating budget impact because it is only for pre-cip activities. Fund Budget through Est Balance Fund Source 6/2009 6/ / / / / /14 CITYWIDE L&L DIST $157,353 $30,115 $30,000 $30,000 $30,000 $30,000 $30,000 PARK DEVELOPMENT $30,000 $0 This Project Total $187,353 $30,115 $30,000 $30,000 $30,000 $30,000 $30, Funding Estimated Project Cost FY2009/10 Funding Prior Year Expenditures $150,000 $337,353 $30,000 $157,238 Project Start date Estimated Complete date Elapsed Time Percent Complete Council District Neighborhood Area Planning Area Project Location Project Manager 4, 5, 7, 8 2 2, 3, 4, 11 Neighborhood Area 2 Parks & Recreation, J.P. Tindell Project Number L LK97 GG - 6
104 Project Description Project Objectives Existing Situation AREA 3 PARK PLANNING L Provides funding for general area-wide advance park planning activities. Additionally, it may be used to cover new project costs until a project-specific CIP is established. Provides funding support for pre-cip activities in Neighborhood Services Area 3. Necessary for pre-cip activities in the communities of Neighborhood Services Area 3. A well planned and implemented park and recreation system will preserve and enhance the quality of life for all residents and visitors of Sacramento. Operating Budget Impact No operating budget impact because it is only for pre-cip activities. Fund Budget through Est Balance Fund Source 6/2009 6/ / / / / /14 CITYWIDE L&L DIST $150,000 $31,032 $30,000 $30,000 $30,000 $30,000 $30,000 PARK DEVELOPMENT $30,000 $0 This Project Total $180,000 $31,032 $30,000 $30,000 $30,000 $30,000 $30, Funding Estimated Project Cost FY2009/10 Funding Prior Year Expenditures $150,000 $330,000 $30,000 $148,968 Project Start date Estimated Complete date Elapsed Time Percent Complete Council District Neighborhood Area Planning Area Project Location Project Manager 5, 6 3 2, 4, 5, 6 Neighborhood Area 3 Parks & Recreation, J.P. Tindell Project Number L LL02 GG - 7
105 Project Description Project Objectives Existing Situation AREA 4 PARK PLANNING L Provides funding for general area-wide advance park planning activities. Additionally, it may be used to cover new project costs until a project-specific CIP is established. Provides funding support for pre-cip activities in Neighborhood Services Area 4. Necessary for pre-cip activities in the communities of Neighborhood Services Area 4. A well planned and implemented park and recreation system will preserve and enhance the quality of life for all residents and visitors of Sacramento. Operating Budget Impact No operating budget impact because it is only for pre-cip activities. Fund Budget through Est Balance Fund Source 6/2009 6/ / / / / /14 CITYWIDE L&L DIST $150,882 $27,829 $30,000 $30,000 $30,000 $30,000 $30,000 PARK DEVELOPMENT $30,000 $0 This Project Total $180,882 $27,829 $30,000 $30,000 $30,000 $30,000 $30, Funding Estimated Project Cost FY2009/10 Funding Prior Year Expenditures $150,000 $330,882 $30,000 $153,053 Project Start date Estimated Complete date Elapsed Time Percent Complete Council District Neighborhood Area Planning Area Project Location Project Manager 1, 2, 3 4 7, 8, 9, 10 Neighborhood Area 4 Parks & Recreation, J.P. Tindell Project Number L LL07 GG - 8
106 Project Description Project Objectives SPORTS COURT REHABILITATION L This project is funded by Landscape and Lighting assessment fees. The project is for various repair and rehabilitation of the existing tennis and basketball courts throughout the City. To help maintain the City s system of tennis and basketball courts and keep them safe, fully operable and in a general state of good repair. Unused tennis courts may be converted to other uses. Existing Situation Operating Budget Impact Deterioration of sports courts is an unavoidable consequence of heavy use and aging. This project helps keep that deterioration to a minimum. This project is designed to lessen operating budget impact by supplying some of the funding necessary to keep the City s sports court system maintained at the most efficient and effective level possible. Fund 2232 Budget through Est Balance Fund Source 6/2009 6/ / / / / /14 CITYWIDE L&L DIST $356,400 $82,559 $75,000 $120,000 $120,000 $120,000 $120,000 This Project Total $356,400 $82,559 $75,000 $120,000 $120,000 $120,000 $120, Funding Estimated Project Cost FY2009/10 Funding Prior Year Expenditures $555,000 $911,400 $75,000 $273,841 Project Start date Estimated Complete date Elapsed Time Percent Complete Council District Neighborhood Area Planning Area Project Location Project Manager Citywide Parks & Recreation, Jeff Nittka Project Number L LL97 GG - 9
107 SYCAMORE PARK IMPROVEMENTS L Project Description Install centralized irrigation system repeaters and related infrastructure. Project Objectives Incorporate irrigation control into City's centralized control system. Existing Situation Phase 1 of park is complete. Phase 1 improvements included turf, walkways, playground, and associated landscaping. Operating Budget There is no operating budget impact. Maintenance will be absorbed into existing maintenance operations. Impact Fund 3204 Budget through Est Balance Fund Source 6/2009 6/ / / / / /14 PARK DEVELOPMENT $0 $0 $65,000 $0 $0 $0 $0 This Project Total $0 $0 $65,000 $0 $0 $0 $ Funding Estimated Project Cost FY2009/10 Funding Prior Year Expenditures Project Start date Estimated Complete date Elapsed Time Percent Complete $65,000 $65,000 $65,000 $0 July 2009 December 2010 Council District Neighborhood Area Planning Area Project Location Project Manager Banfield Drive Parks & Recreation, Gary Hyden Project Number L GG - 10
108 19TH AND Q STREET MASTER PLAN L Project Description Develop and adopt a park master plan for City-owned parcels at 19th and Q Streets. Project Objectives Provide a master plan for a neighborhood park that will serve the needs of the surrounding neighborhood in a park deficient area of the Central City, including R Street Corridor. Existing Situation Operating Budget Impact Park site is undeveloped. Soil remediation will be required There is no operating budget impact until the park is developed. Fund 3204 Budget through Est Balance Fund Source 6/2009 6/ / / / / /14 PARK DEVELOPMENT $0 $0 $50,000 $0 $0 $0 $0 This Project Total $0 $0 $50,000 $0 $0 $0 $ Funding Estimated Project Cost FY2009/10 Funding Prior Year Expenditures Project Start date Estimated Complete date Elapsed Time Percent Complete $50,000 $50,000 $50,000 $0 July 2009 June 2010 Council District Neighborhood Area Planning Area Project Location Project Manager th And Q Streets Parks & Recreation, Gary Hyden Project Number L GG - 11
109 Project Description Project Objectives Existing Situation Operating Budget Impact PA1 PARK SIGN REPLACEMENT L Replace signs for various parks in the Central City. To replace the existing deteriorating park signs and improve visual quality of park entry. Deterioration of park signage is an unavoidable consequence of an aging facility over time. There is no operating budget impact. Maintenance will be absorbed into existing maintenance operations. Fund 3204 Budget through Est Balance Fund Source 6/2009 6/ / / / / /14 PARK DEVELOPMENT $0 $0 $24,000 $0 $0 $0 $0 This Project Total $0 $0 $24,000 $0 $0 $0 $ Funding Estimated Project Cost FY2009/10 Funding Prior Year Expenditures Project Start date Estimated Complete date Elapsed Time Percent Complete $24,000 $24,000 $24,000 $0 July 2009 September 2009 Council District Neighborhood Area Planning Area Project Location Project Manager 1, 3, Various Parks & Recreation, Gary Hyden Project Number L GG - 12
110 Project Description Project Objectives Existing Situation Operating Budget Impact PA8 PARK SIGN REPLACEMENT L Replace signs for various parks in the North Sacramento. To replace the existing deteriorating park signs and improve visual quality of park entry. Deterioration of park signage is an unavoidable consequence of an aging facility over time. There is no operating budget impact. Maintenance will be absorbed into existing maintenance operations. Fund 3204 Budget through Est Balance Fund Source 6/2009 6/ / / / / /14 PARK DEVELOPMENT $0 $0 $49,000 $0 $0 $0 $0 This Project Total $0 $0 $49,000 $0 $0 $0 $ Funding Estimated Project Cost FY2009/10 Funding Prior Year Expenditures Project Start date Estimated Complete date Elapsed Time Percent Complete $49,000 $49,000 $49,000 $0 July 2009 October 2009 Council District Neighborhood Area Planning Area Project Location Project Manager 2, Various Parks & Recreation, Gary Hyden Project Number L GG - 13
111 Project Description Project Objectives Existing Situation Operating Budget Impact CHARLIE JENSEN PARK IMPROVEMENT L Provide a hard shell picnic shade structure over an existing group picnic area. Improve the existing group picnic area by providing permanent shade structure. Existing picnic area does not have a shade structure. There is no operating budget impact. Maintenance will be absorbed into existing maintenance operations. Fund 3204 Budget through Est Balance Fund Source 6/2009 6/ / / / / /14 PARK DEVELOPMENT $0 $0 $75,000 $0 $0 $0 $0 This Project Total $0 $0 $75,000 $0 $0 $0 $ Funding Estimated Project Cost FY2009/10 Funding Prior Year Expenditures Project Start date Estimated Complete date Elapsed Time Percent Complete $75,000 $75,000 $75,000 $0 July 2009 February 2010 Council District Neighborhood Area Planning Area Project Location Project Manager Park Village Street Parks & Recreation, Gary Hyden Project Number L GG - 14
112 EGRET PARK MASTER PLAN REVISION L Project Description Revise master plan. Project Objectives Improve park facilities to accommodate community requests for additional park amenities to the existing park. Existing Situation Phase 1 of park is complete. Phase 1 improvements included turf, walkways, playground, and associated landscaping. Operating Budget Impact There is no additional operating budget impact until the potential park improvements are implemented into the existing park. Fund 3204 Budget through Est Balance Fund Source 6/2009 6/ / / / / /14 PARK DEVELOPMENT $0 $0 $50,000 $0 $0 $0 $0 This Project Total $0 $0 $50,000 $0 $0 $0 $ Funding Estimated Project Cost FY2009/10 Funding Prior Year Expenditures Project Start date Estimated Complete date Elapsed Time Percent Complete $50,000 $50,000 $50,000 $0 July 2009 April 2010 Council District Neighborhood Area Planning Area Project Location Project Manager Westlake Parkway Parks & Recreation, Gary Hyden Project Number L GG - 15
113 Project Description Project Objectives Existing Situation Operating Budget Impact REGENCY PARK IMPROVEMENT L Install drinking fountain. To provide a drinking fountain to better meet the recreation needs of the community. Existing facility users have requested a drinking fountain be added. There is no operating budget impact. Maintenance will be absorbed into existing maintenance operations. Fund 3204 Budget through Est Balance Fund Source 6/2009 6/ / / / / /14 PARK DEVELOPMENT $0 $0 $10,000 $0 $0 $0 $0 This Project Total $0 $0 $10,000 $0 $0 $0 $ Funding Estimated Project Cost FY2009/10 Funding Prior Year Expenditures Project Start date Estimated Complete date Elapsed Time Percent Complete $10,000 $10,000 $10,000 $0 July 2009 September 2009 Council District Neighborhood Area Planning Area Project Location Project Manager Honor Parkway Parks & Recreation, Gary Hyden Project Number L GG - 16
114 Project Description Project Objectives Existing Situation Operating Budget Impact TANZANITE COMMUNITY PARK IMPROVEMENT L Install security lighting at skate park, renovate irrigation and landscaping adjacent to skate park. Plant trees and correct drainage problems in existing dog park. Address maintenance and security issues at existing park facilities. Phase 1 and 2 of park master plan are completed and implemented. There is no operating budget impact. Maintenance will be absorbed into existing maintenance operations. Fund 3204 Budget through Est Balance Fund Source 6/2009 6/ / / / / /14 PARK DEVELOPMENT $0 $0 $350,000 $0 $0 $0 $0 This Project Total $0 $0 $350,000 $0 $0 $0 $ Funding Estimated Project Cost FY2009/10 Funding Prior Year Expenditures Project Start date Estimated Complete date Elapsed Time Percent Complete $350,000 $350,000 $350,000 $0 July 2009 June 2011 Council District Neighborhood Area Planning Area Project Location Project Manager Tanzanite Way Parks & Recreation, Gary Hyden Project Number L GG - 17
115 Project Description Project Objectives Existing Situation Operating Budget Impact LEWIS PARK ENHANCEMENT L Planting and irrigation enhancements to an existing neighborhood park. Enhance tree planting in an existing neighborhood park. Lewis Park is an established neighborhood park. There is no operating budget impact. Maintenance will be absorbed into existing maintenance operations. Fund 3204 Budget through Est Balance Fund Source 6/2009 6/ / / / / /14 PARK DEVELOPMENT $0 $0 $50,000 $0 $0 $0 $0 This Project Total $0 $0 $50,000 $0 $0 $0 $ Funding Estimated Project Cost FY2009/10 Funding Prior Year Expenditures Project Start date Estimated Complete date Elapsed Time Percent Complete $50,000 $50,000 $50,000 $0 July 2009 September 2009 Council District Neighborhood Area Planning Area Project Location Project Manager Park Riviera Way Parks & Recreation, Gary Hyden Project Number L GG - 18
116 Project Description Project Objectives Existing Situation Operating Budget Impact SIERRA 2 PARK COURT REHABILITATION L Rehabilitate two existing basketball courts including but not limited to resurfacing and restriping. Rehabilitate an existing facility to mitigate impacts of extensive use (wear and tear) and age. Existing courts are in need of rehabilitation from extensive use (wear and tear) and age. There is no operating budget impact. Maintenance will be absorbed into existing maintenance operations. Fund 3204 Budget through Est Balance Fund Source 6/2009 6/ / / / / /14 PARK DEVELOPMENT $0 $0 $75,000 $0 $0 $0 $0 This Project Total $0 $0 $75,000 $0 $0 $0 $ Funding Estimated Project Cost FY2009/10 Funding Prior Year Expenditures Project Start date Estimated Complete date Elapsed Time Percent Complete $75,000 $75,000 $75,000 $0 July 2009 March 2010 Council District Neighborhood Area Planning Area Project Location Project Manager th Avenue Parks & Recreation, Gary Hyden Project Number L GG - 19
117 Project Description Project Objectives CESAR CHAVEZ PLAZA IMPROVEMENTS L Develop additional park amenities compatible with the existing amenities and uses. This may require a master plan amendment. To provide unique improvements to enhance the recreation experience of the existing user population and the new residential population. Existing Situation Operating Budget Impact Existing amenities include walkways, benches, tables, and chairs, a concession building, plaza and fountain, a bandstand, open turf areas, small landscape areas, and significant mature ornamental trees. This project will have some impact to the operating budget for any new amenities installed. Fund 3204 Budget through Est Balance Fund Source 6/2009 6/ / / / / /14 PARK DEVELOPMENT $0 $0 $100,000 $0 $0 $0 $0 This Project Total $0 $0 $100,000 $0 $0 $0 $ Funding Estimated Project Cost FY2009/10 Funding Prior Year Expenditures Project Start date Estimated Complete date Elapsed Time Percent Complete $100,000 $100,000 $100,000 $0 July 2009 December 2010 Council District Neighborhood Area Planning Area Project Location Project Manager I Street Parks & Recreation, Gary Hyden Project Number L GG - 20
118 Project Description Project Objectives Existing Situation Operating Budget Impact REDBUD PARK IMPROVEMENTS L Repair irrigation, landscape entry from North Park Drive to Babcock Way, east of the bike trail and west side of entrance under the sign. Put shade structure over the tot lot and add two swings for toddlers. Renovate and enhance existing park elements Phase 1 of park is complete. Phase 1 improvements included turf, walkways, playground, and associated landscaping. There is no operating budget impact. Maintenance will be absorbed into the existing maintenance operations. Fund 3204 Budget through Est Balance Fund Source 6/2009 6/ / / / / /14 PARK DEVELOPMENT $0 $0 $275,000 $0 $0 $0 $0 This Project Total $0 $0 $275,000 $0 $0 $0 $ Funding Estimated Project Cost FY2009/10 Funding Prior Year Expenditures Project Start date Estimated Complete date Elapsed Time Percent Complete $275,000 $275,000 $275,000 $0 July 2009 June 2011 Council District Neighborhood Area Planning Area Project Location Project Manager Brookemere Way Parks & Recreation, Gary Hyden Project Number L GG - 21
119 Project Description Project Objectives CITYWIDE L&L PARK REPAIR L The project is funded by Landscape and Lighting assessment fees and is for various repair and rehabilitation projects not covered by the Parks Maintenance operating budget. To help maintain the City s system of parks and keep them safe, fully operable and in a general state of good repair; thus avoiding more costly replacement of park facilities. Existing Situation Operating Budget Impact Deterioration of park facilities and amenities is an unavoidable consequence of heavily used parks in the City of Sacramento. This project helps to keep that deterioration to a minimum. This project is designed to lessen operating budget impacts by supplying some of the funding necessary to keep the City s park system maintained at the most efficient and effective level possible. Fund 2232 Budget through Est Balance Fund Source 6/2009 6/ / / / / /14 CITYWIDE L&L DIST $0 $0 $201,761 $156,761 $156,761 $156,761 $156,761 This Project Total $0 $0 $201,761 $156,761 $156,761 $156,761 $156, Funding Estimated Project Cost FY2009/10 Funding Prior Year Expenditures Project Start date Estimated Complete date Elapsed Time Percent Complete $828,805 $828,805 $201,761 $0 July 2009 June 2014 Council District Neighborhood Area Planning Area Project Location Project Manager Citywide Parks & Recreation, Dave Mitchell Project Number L GG - 22
120 Project Description Project Objectives PLAYGROUND REPAIRS L This project is funded by Landscape and Lighting assessment fees. The project is for various repair and rehabilitation of existing playground equipment and related appurtenances. To help maintain the City s system of playground equipment and keep them safe, fully operable and in a general state of good repair. Existing Situation Operating Budget Impact Deterioration of playground equipment is an unavoidable consequence of heavy use and age of the City s park and recreation facilities. This project helps to keep that deterioration to a minimum. This project is designed to lessen the operating budget impact by supplying some of the funding necessary to keep the City s playground equipment maintained at the most efficient and effective level possible. Fund 2232 Budget through Est Balance Fund Source 6/2009 6/ / / / / /14 CITYWIDE L&L DIST $450,000 $133,937 $75,000 $75,000 $75,000 $75,000 $75,000 This Project Total $450,000 $133,937 $75,000 $75,000 $75,000 $75,000 $75, Funding Estimated Project Cost FY2009/10 Funding Prior Year Expenditures $375,000 $825,000 $75,000 $316,063 Project Start date Estimated Complete date Elapsed Time Percent Complete Council District Neighborhood Area Planning Area Project Location Project Manager Citywide Parks & Recreation, Dave Mitchell Project Number L LL92 GG - 23
121 Project Description Project Objectives Existing Situation Operating Budget Impact SWIMMING POOL REHABILITATION L The Landscape & Lighting assessment fees fund repair and preventative maintenance on the City s swimming pools. To keep the City s swimming pools usable and efficient in operations. The City s swimming pools are aging and the maintenance costs continue to increase. The work performed under this project is matched with other funding sources to minimize the impact on the operating budget. Fund 2232 Budget through Est Balance Fund Source 6/2009 6/ / / / / /14 CITYWIDE L&L DIST $639,287 $92,101 $100,000 $100,000 $100,000 $100,000 $100,000 This Project Total $639,287 $92,101 $100,000 $100,000 $100,000 $100,000 $100, Funding Estimated Project Cost FY2009/10 Funding Prior Year Expenditures $500,000 $1,139,287 $100,000 $547,186 Project Start date Estimated Complete date Elapsed Time Percent Complete Council District Neighborhood Area Planning Area Project Location Project Manager Citywide Parks & Recreation, Dave Mitchell Project Number L LM47 GG - 24
122 Project Description GARDENLAND PARK PSIP TIER III L Parks and Recreation Safety Implementation Plan (PSIP) full build out of Tier 3 improvements which include a dirt BMX course, group picnic area with shelter, free game court, skate park, modifications to existing parking lot, additional park security lights, fitness course, and landscape and irrigation modifications. Project Objectives Existing Situation Operating Budget Impact Provide additional funding needed to fully fund Tier 3 improvements as described in the approved Master Plan. $750,000 of the estimated $1,125,000 required for full phase 1 build out has been encumbered. There is no operating budget impact. Maintenance will be absorbed into existing maintenance operations. Fund Budget through Est Balance Fund Source 6/2009 6/ / / / / /14 SO NATOMAS COMM IMPROV $20,000 $20,000 QUIMBY ACT $100,000 $100,000 PARK DEVELOPMENT $0 $0 $375,000 $0 $0 $0 $0 This Project Total $120,000 $120,000 $375,000 $0 $0 $0 $ Funding Estimated Project Cost FY2009/10 Funding Prior Year Expenditures Project Start date Estimated Complete date Elapsed Time Percent Complete $375,000 $495,000 $375,000 $0 July 2009 June 2011 Council District Neighborhood Area Planning Area Project Location Project Manager Bowman Avenue Parks & Recreation, Gary Hyden Project Number L GG - 25
123 CITY OF SACRAMENTO ECONOMIC DEVELOPMENT PROGRAM OVERVIEW INTRODUCTION This overview summarizes the Capital Improvement Projects (CIPs) that contribute towards the economic development goals and objectives adopted by the Mayor and City Council. Funding is provided from a variety of funding sources depending on the nature of, and funding available, for the improvement. Additional information on the various funds available to support the Economic Development Program is provided below. Projects are initiated by the City s Economic Development Department in coordination with Utilities and Transportation Departments as well as the Sacramento Housing and Redevelopment Agency (SHRA). Related budgets are established in each of the three City departments and in SHRA s budget. A total of $ million in SHRA, Utilities and Transportation Funds has been programmed for projects that support economic development activities. The funding allocation by departmental or Agency responsibility for FY2009/10 is portrayed in the figure shown below: FY2009/10 Economic Development Program Total Programming by Department (in 000 s) $11,284 Downtown TI $0 Utilities $600 Transportation $525 SHRA-TI $10,159 SOURCES OF ECONOMIC DEVELOPMENT CIP FUNDING Economic Development Department: The Economic Development Department has two primary funding sources for CIPs, the City s General Fund and Tax Increment (TI). The General Fund support is allocated through City Council resolution and the TI is derived from assessments on property located within the defined Downtown and Richards Boulevard redevelopment areas CAPITAL IMPROVEMENT PROGRAM H - 1
124 CITY OF SACRAMENTO ECONOMIC DEVELOPMENT PROGRAM OVERVIEW Utilities Department: The Utilities Department is comprised of several Enterprise Funds, including the Water Fund, Sewer Fund, Solid Waste Fund, and the Storm Drainage Fund. Since Utility Funds are derived from user fees, the use of the funds is restricted to those that are directly related to providing water, sewer waste disposal and storm drainage to citizens and property. Projects in this section not only must meet those requirements, but must also have a reasonable economic development nexus. The Utilities Department has allocated $600,000 annually toward economic development efforts. The programming of these funds is at the discretion of the Economic Development Department, working in close coordination with Utilities staff and meeting fund eligibility requirements. Transportation Department: The Transportation Department contributes funding for economic development efforts from the Major Street Construction Tax (MSCT) Funds and one-half cent sales tax approved by the Sacramento County voters in 1988, also known as Measure A Funds. The Transportation Department has allocated a total of $525,000 toward economic development efforts in FY2009/10. Like the Utilities Department, the funding from Transportation is at the discretion of the Economic Development Department, working in close coordination with Transportation staff. The funds must be programmed to projects that meet fund eligibility requirements. SHRA Funding: SHRA is a joint City and County Agency and is responsible for administering the Community Development Block Grant (CDBG) program, the Home Investment Partnerships (HOME) program, and the Grow Sacramento Business Loan program. of the programs have funding allocated for economic development purposes. CIP OPERATING BUDGET IMPACT Depending upon the specific department, the CIPs may, or may not, create an operational budget impact. When an improvement creates a new facility such as streetscape improvements, the possibility exists for increased maintenance costs. However, a sewer improvement might result in no operational impact or even a decrease based upon improved performance of the facility. The assumption is that the departments are planning appropriately for possible increased operational costs as a consequence of the capital improvements. ECONOMIC DEVELOPMENT CIP PROJECT SELECTION GOALS AND CRITERIA Program Goals Facilitate the development of key development opportunities. Use public funds to facilitate private development and leverage new private sector investment. Attract targeted industries, headquarters, businesses and commercial/retail uses. Retain and expand existing industries and businesses. Provide for appropriate infrastructure to serve the operational and aesthetic needs of the citizens and businesses of Sacramento CAPITAL IMPROVEMENT PROGRAM H - 2
125 CITY OF SACRAMENTO ECONOMIC DEVELOPMENT PROGRAM OVERVIEW Project Selection Criteria Leverage of private investment Increase in public tax revenues Job creation (includes number and salary levels) New business creation Potential of business area/corridor improvement Conforms to the City s General Plan Meets health, safety, and welfare legal obligations ECONOMIC DEVELOPMENT DEPARTMENT (Fund 3701) The Economic Development Department receives funding for CIPs from TI or bond proceeds due to the TI revenue. New TI funding budgeted in the SHRA budget occurs on a calendar year. The funding is then conveyed to the City through Individual Project Agreements (IPA) subject to the Master Project Agreement as adopted by the Mayor and City Council on December 18, 2001 (Resolution No ). There are no Economic Development projects have been programmed with SHRA funding for FY2009/10. TRANSPORTATION DEPARTMENT (Funds 2001 and 2007) The following chart details the current budget and the next five-year funding levels for the various economic development related Transportation projects. The FY2009/10 Economic Development project (T ) represents funding for economic development purposes that will be programmed to specific projects under separate Council action Transportation Program Project 5-Year Programming # Title Section 09/10 10/11 11/12 12/13 13/14 FY09/10 Economic T Development II 525, , , , ,000 Totals: $525,000 $525,000 $525,000 $525,000 $525, CAPITAL IMPROVEMENT PROGRAM H - 3
126 CITY OF SACRAMENTO ECONOMIC DEVELOPMENT PROGRAM OVERVIEW SACRAMENTO HOUSING AND REDEVELOPMENT AGENCY The following chart details the funding levels for the various SHRA projects. Please see the Document Section referenced below for further project detail information (SHRA funding is based on calendar years) Project 5-Year Programming # Title Section Alkali Flat Development Assistance KK 361, Army Depot Development Assistance KK 2,828, Auburn Blvd. Development Assistance KK 342, Del Paso Heights Development Assistance KK 1,228, Franklin Blvd. Development Assistance KK 1,642, North Sacramento Development Assistance KK 1,785, Oak Park Development Assistance KK 921, th Street Development Assistance KK 215, Stockton Blvd. Development Assistance KK 832, Totals: $10,158,595 $0 $0 $0 $0 UTILITIES DEPARTMENT (Funds 6005 and 6006) The following chart details the current budget and the next five-year funding levels for the various economic development related Utilities projects. The Economic Development Program project listed below represents funding that will be programmed to specific projects under separate Council action City Utilities Program Project 5-Year Programming # Title Section 09/10 10/11 11/12 12/13 13/14 Economic Development Z Program JJ 600, , , , ,000 Totals: $600,000 $600,000 $600,000 $600,000 $600, CAPITAL IMPROVEMENT PROGRAM H - 4

127 CITY OF SACRAMENTO ECONOMIC DEVELOPMENT PROGRAM OVERVIEW PROJECT HIGHLIGHTS Sacramento Docks Area Project A concerted effort is underway to revitalize a portion of the Sacramento Waterfront from an industrial area into a smart growth infill project. The vision for the Docks Area is to develop it into a new riverfront mixeduse neighborhood, complete with retail, parks and open space, and bicycle and pedestrian access. The first phase of the promenade began in February The project has many community benefits, such as: Create 1,825 new jobs Generate an annual Transit Occupancy Tax (TOT) revenue of $750,000 Attract more than 500,000 visitors annually Improve property values and generate tax increment revenue for future development and infill projects K Street Streetscape (Artist s Rendition) CAPITAL IMPROVEMENT PROGRAM H - 5

128 CITY OF SACRAMENTO ECONOMIC DEVELOPMENT PROGRAM OVERVIEW K Street Streetscape Project The K Street Streetscape Project will make improvements to the K Street Mall (Mall) and Regional Transit (RT) stations on K Street, between 7 th and 12 th Streets, and St. Rose of Lima Park. Planned improvements will include new and consistent paving materials, street furniture, trash receptacles, landscaping, lighting, enhanced intersection treatments, gateway elements and an interactive water feature at St. Rose of Lima Park. In an effort to strengthen transit connections, the Project also includes relocating an existing platform from the 700 block to the east side of 7 th Street, just south of the K-L alley and the existing 1000 block minihigh platform down one block to the north side of the 1100 block. Currently, phase one of the project is funded and will soon start construction. Phase one includes improvements on the 700 block, ST. Rose of Lima and the new 7 th Street RT Station. The key objectives are to: aesthetically improve the corridor, increase safety for pedestrians, enhance transit stops and connection to RT stations, strengthen pedestrian lighting, build connectivity, improve pedestrian mobility, and to create a safe and inviting public space. K Street Streetscape (Artist s Rendition) CAPITAL IMPROVEMENT PROGRAM H - 6

 2009-2014 CAPITAL IMPROVEMENT")
129 CITY OF SACRAMENTO ECONOMIC DEVELOPMENT PROGRAM OVERVIEW K Street Streetscape (Artist s Rendition) K Street Streetscape (Artist s Rendition) CAPITAL IMPROVEMENT PROGRAM H - 7
130 CITY OF SACRAMENTO TRANSPORTATION PROGRAM OVERVIEW INTRODUCTION The Transportation (CIP) reflects the City s funding strategy for delivering transportation improvements, which support the City s Strategic Plan Goals to improve and expand public safety, achieve sustainability, enhance livability, and expand economic development throughout the City. The Transportation CIP is designed to optimize the use of available local funds by leveraging state and federal funding to achieve the City s transportation priorities. The funds programmed in this year s CIP reflect many funding and revenue challenges that are being felt throughout the City and the region. Reductions in New Measure A Construction and Maintenance Sales Tax, Gas Tax, and private development have resulted in reductions in major local transportation revenue sources for the City s Transportation CIP beginning in FY2009/10: Gas Tax is anticipated to be down by ten percent (10%); New Measure A Maintenance and Construction Sales Tax down by twenty-five percent (25%) each over previous projections; and Major Street Construction Tax down by seventy-five percent (75%). Both maintenance and capital programs are significantly impacted by the revenue reductions. These programs are reduced by $2.1 million (69%) for maintenance and $4.2 million (34%) for capital from FY2008/09 to FY2009/10. As outlined in the January 15, 2008, FY08/09 Measure A Expenditure Plan, old Measure A (Fund 2001) program fund balances are available for future citywide programming. The old Measure A program balance is $19 million and will be used as directed by City Council to preserve/supplement many of the citywide program reductions through The Total Programming by Program Area Chart and the Total Programming by Fund Type Chart of page I- 2 and I-3 reflect a total of $12.2 million in programming to new and ongoing projects and programs. The table on page I-7, shows the 41 transportation projects and programs that will receive new or additional funding in FY2009/10. MAJOR PROGRAM AREA ALLOCATIONS The Total Programming by Program Area Chart on page I-2, shows the FY2009/10 Transportation CIP is divided into seven major areas: Major Streets (major roadway construction); Parking (parking facility maintenance and upgrades); Bridges (rehabilitation, maintenance, and replacement); Street Maintenance (overlays and seals); Traffic Operations and Safety (new traffic signals and signal modifications, Traffic Operations Center, Neighborhood Traffic Management Program, speed humps, pedestrian safety and safety light program); Community Enhancements/Economic Development (street light program, and economic development); and Public Rights-of-Way Accessibility (ADA compliance). Approximately 49 percent ($5.9 million) of funding is programmed to maintenance and operations which include projects and programs such as Street Maintenance, Bridges, Traffic Operations and Safety, and Parking. Examples of projects or programs receiving funding in these areas include: Street Overlays and Seals Program (R ); Bridge Maintenance Engineering Program (R ); Pedestrian Safety Program (T ); and the Parking Facilities Development Program (V ). Approximately 17 percent ($2.1 million) of funding is programmed to Major Street construction projects. In order to support the current and anticipated growth in Sacramento, the City must continue to design and construct new infrastructure to meet these needs. Major street projects receiving funding include $100, CAPITAL IMPROVEMENT PROGRAM I - 1
131 CITY OF SACRAMENTO TRANSPORTATION PROGRAM OVERVIEW for the Overwidth Pavement Reimbursement Program (T ), and $1.9 million to Major Street Improvements (T ). Approximately 23 percent ($2.8 million) of the funding is programmed to projects and programs related to public rights-of-way accessibility pursuant to the American with Disabilities Act (ADA) settlement agreement. Approximately 11 percent ($1.3 million) is programmed to pedestrian and bicycle projects, community enhancements and economic development. These projects and programs support the City s strategic plan goals to achieve sustainability, enhance livability, and expand economic development throughout the City. FY 2009/10 Transportation Funding Total Programming by Program Area (in'000) $12,169 Major Streets $2,110 Parking $2,878 Bridges $258 Public Rights-of-Way Accessibility (ADA) $2,780 Street Maintenance $495 Community Enhancements/ Economic Development $1,338 Traffic Operations and Safety $2, CAPITAL IMPROVEMENT PROGRAM I - 2
132 CITY OF SACRAMENTO TRANSPORTATION PROGRAM OVERVIEW MAJOR FUNDING SOURCES The Total Programming by Fund Type on page I-3, shows the FY2009/10 Transportation CIP by funding source. The local funding is divided into eight major areas: Measure A Construction (Fund 2001); Gas Tax (Fund 2002); Major Street (Fund 2007); New Measure A Construction (Fund 2025); New Measure A Maintenance (Fund 2026); Landscape and Lighting (Fund 2232); Parking (Fund 6004); and Other [Street Cut Fund (Fund 2008), Transportation System Management (Fund 2012) and North Natomas Public Facilities Fee Improvement (Fund 3201). FY 2009/10 Transportation Funding Total Programming by Fund Type (in '000) $12,169 Other*** $182 Parking** Fund 6004 $2,878 Measure A Construction Fund 2001 $3,543 Landscape and Lighting Fund 2232 $440 New Measure A Maintenance Fund 2026 $235 New Measure A Construction Fund 2025 $1,991 Major Street Fund 2007 $2,320 Gas Tax* Fund 2002 $580 * The amount of Gas Tax Funds ($20,000-C Corp Yard Maintenance) includes funding for projects that appear in the General Government Section of this document. ** The amount of Parking Funds ($78,000-C Facility ADA Compliance Program) includes funding for projects that appear in the General Government Section of this document. *** Other funding includes Street Cut ($150,000 - Fund 2008), Transportation System Management ($20,000 - Fund 2012), and North Natomas Community Improvement ($11,500 - Fund 3201). Transportation Sales Tax - Measure A (Funds 2001): This local one-half cent transportation sales tax was approved by Sacramento County voters in November 1988 under the State Local Transportation Authority and Improvement Act of 1987, and will continue through March 31, This revenue can only be used for certain projects listed in the original ballot measure, and specifically approved by the Sacramento Transportation Authority (STA) through a Countywide Transportation Expenditure Plan (CTEP) Amendment CAPITAL IMPROVEMENT PROGRAM I - 3
133 CITY OF SACRAMENTO TRANSPORTATION PROGRAM OVERVIEW Both maintenance and capital programs are significantly impacted by the reduced revenue projections to all funding sources. The balance in the Measure A Construction (Fund 2001) Program is available to supplement the citywide programs through For FY2009/10, a total of $3.5 million of Transportation Sales Tax Measure A Construction funds (Fund 2001) are programmed to capital projects and programs. A summary of these projects and programs can be found in Index M, New Funding: Projects by Fund/by Project Number. Gas Tax (Fund 2002, Fund 2003 and Fund 2004): Gas Tax revenue is generated from the 18 cents per gallon state tax on fuel used to propel a motor vehicle or aircraft. Approximately thirty percent (30%) of Gas Tax revenues are allocated to cities and counties as directed by the Streets and Highways Code Sections 2106, 2107, and Gas Tax funds can be used for construction of improvements, studies and/or maintenance of public streets. For FY2009/10, a total of $580,000 of Gas Tax funds is programmed to capital projects and programs. A summary of these projects and programs can be found in Index M, New Funding: Projects by Fund/by Project Number. Additionally, a total of $6.6 million is programmed for maintenance of City streets, pavement, streetlights, and traffic signals by City work crews, which is included in the operating budget. Major Street Construction Tax (MSCT) (Fund 2007): This tax is a City-imposed surcharge on all new construction or reconstruction of buildings (excluding disaster reconstruction). The funds can only be used for construction, replacement or alteration, but not maintenance, of major roadways, bridges, traffic control, and lighting as provided in City Code Section The MSCT is also used for overwidth pavement reimbursement to developers. These expenditures are projected based on anticipated development activity. The funds cannot be used for maintenance or operations. For FY2009/10, a total of $2.3 million MSCT funds is programmed to capital projects and programs. A summary of these projects and programs can be found in Index M, New Funding: Projects by Fund/by Project Number. Street Cut Fund (Fund 2008): On September 23, 1997, the City Council adopted an Ordinance amending Chapter of the Sacramento City Code to establish new excavation requirements in city streets and a new Trench Cut Cost Recovery Fee Program. The fee is imposed on utilities and City Departments that trench into City streets that are not scheduled for resurfacing or repair. The fee was established to recover a fair share of the cost of mitigating the pavement damage caused to the street surface from excavations. The fees are also intended to provide an incentive for utilities to coordinate their excavations with other utilities and with the City s street resurfacing schedule. The collected fees can be expended on street repairs in the same geographic area that the cut generated fees. For FY2009/10, a total of $150,000 of Street Cut Funds is programmed to the Trench Cut Fee Program (R ). This project is also referenced in Index M, New Funding: Projects by Fund/by Project Number CAPITAL IMPROVEMENT PROGRAM I - 4
134 CITY OF SACRAMENTO TRANSPORTATION PROGRAM OVERVIEW Transportation Systems Management (TSM) (Fund 2012): This fund was established by City Ordinance No requiring developers of projects that will accommodate 25 or more employees to comply with one of several TSM (Transportation Systems Management) measures to better utilize existing transportation facilities and to pay for capital improvements that would benefit the city s downtown transportation network as fulfillments of the TSM measure. Funds can only be used on facilities that increase the people moving capacity of the existing transportation system. For FY2009/10, a total of $20,000 of TSM Funds is programmed to the Downtown TSM Capital Improvements (T ). This project is also referenced in Index M, New Funding: Projects by Fund/by Project Number. Transportation Sales Tax New Measure A (Funds 2023/2025/2026): The New Measure A program for a local one-half cent transportation sales tax approved by Sacramento County voters will become effective April 1, The New Measure A has three funding components: 1) New Measure A - Project Construction (Fund 2023) consisting of voter approved projects (Intermodal Transportation Facility, Cosumnes Blvd Extension and I-5 Interchange, Richards Blvd/I-5 Interchange, and Folsom Blvd Watt to 65 th ); 2) New Measure A - Construction (Fund 2025) consisting of two programs: Traffic Control and Safety, and Safety, Landscape, and Pedestrian and Bike Facilities; and 3) New Measure A - Maintenance (Fund 2026). For FY2009/10, a total of $2.2 million New Measure A funds is programmed to capital projects and programs. A summary of these projects and programs can be found in Index M, New Funding: Projects by Fund/by Project Number. Additionally, approximately $8 million in New Measure A Maintenance funds (Fund 2026) is utilized by the City s concrete and pavement maintenance operations, which is included in the operating budget. Landscape and Lighting (L&L) (Fund 2232): This is an assessment district for specific improvements citywide. A total of $440,000 in L&L Assessment District Funds is programmed to the Street Light Relamp Program (R ) and the Neighborhood Street Light Replacement Program (T ) in FY2009/10. Only transportation projects are included in this section. other improvements may be found in the appropriate program section of this document. For a summary of the citywide projects/programs, see Index M, New Funding: Projects by Fund/by Project Number. Additionally, approximately $4.2 million in L&L funds (Fund 2232) is utilized by the City s street light and streetscape maintenance operations, which is included in the operating budget. North Natomas Public Facilities Fee (PFF) Improvement (Fund 3201): The North Natomas New Growth Area is bounded by I-80 on the south, Elkhorn Boulevard on the north and city limits on the east and the west. The improved projects in North Natomas are funded as part of the CIP Program or are built by private land owners. The Public Facilities Fee (PFF) fund was established with the adoption of the North Natomas Financing Plan, which was first approved in 1994 and was last updated in The PFF funds backbone infrastructure in the new growth area and is paid for by developers prior to issuance of building permits. The impact fee is structured to insure that each developer pays a fair-share for necessary infrastructure, and that basic infrastructure is in place when needed for the development CAPITAL IMPROVEMENT PROGRAM I - 5
135 CITY OF SACRAMENTO TRANSPORTATION PROGRAM OVERVIEW The PFF will ultimately fund $209.1 million in public improvement facilities. These include a fire station, police sub-station, a community center library, shuttles, bikeways, freeway improvements, landscaping, major roads, bridges and signals. A total of $11,500 in North Natomas Public Facilities Fees Improvements funds is programmed to the North Natomas Freeway Monitoring Program (T ) in FY2009/10. Only transportation projects are included in this section. other improvements may be found in the appropriate program section of this document. For a summary of the citywide projects/programs, see Index M, New Funding: Projects by Fund/by Project Number. Parking Fund (Fund 6004): The Parking Fund finances the operation, maintenance, and capital improvements of city-owned off-street parking garages and surface parking lots. The Fund s primary sources of revenue are parking fees charged to users of these facilities, rental income, and interest earnings. A total of $2.8 million of Parking Funds is programmed for the FY2009/10. A summary of these projects and programs can be found in Index M, New Funding: Projects by Fund/by Project Number. Federal Fund (Fund 3703): The Department relies on federal transportation funds to achieve the City s transportation priorities. Approximately $71 million in federal funds is currently programmed in existing transportation Capital Improvement Projects. The Department will continue to pursue and recommend programming of federal transportation funds and grants. The Department has maximized its ability to find creative ways to leverage existing resources for project planning. Increased funding for feasibility studies, scoping, and other planning enhance the City s competitiveness for federal funding and legislative earmarks. PROJECTS AND PROGRAMS Detail sheets for the new and ongoing transportation projects and programs can be found beginning on page II-1, listed in alphabetical order by number with the exception of two (2) projects that are listed in the General Government Section. Detail sheets for North Natomas transportation improvements that will be constructed by private developers are also included in the Parks and Recreation Section. The private developer projects are indicated with a credit in the title and are listed in Fund Upon completion of the private developer project and acceptance by the City, the City issues fee credits to the developer that offset a portion of the building permit fees. Additional information of the Public Facility Fee (PFF) status and summary of improvements is provided in the New Growth/Infill Section of this document. Transportation Improvement Projects: The table below includes transportation projects and programs that will receive funding in FY2009/10. Program names followed by * are partially funded with Transportation funds. The detailed project information can be found in the General Government Section of this document CAPITAL IMPROVEMENT PROGRAM I - 6
136 CITY OF SACRAMENTO TRANSPORTATION PROGRAM OVERVIEW FY2009/10 Transportation Projects and Programs Total Funding C Corp Yard Maintenance Program* $ 20,000 C Facility ADA Compliance Program* $ 78,000 R Pavement Management Application Update Program $ 50,000 R Street Overlay and Seal Program $ 50,000 R Hollow Sidewalk Monitoring Program $ 65,000 R Bridge Maintenance Engineering Program $ 25,000 R Bridge Construction and Maintenance $ 50,000 R Guardrail Replacement Program $ 50,000 R Trench Cut Fee Program $ 150,000 R Street Repair Partnering Program $ 100,000 R Traffic Signal Equipment Upgrade Program $ 205,000 R Work Management System-Street/Facilities $ 60,000 R Street Light Relamp Program $ 125,000 S Traffic Signs and Markings Program $ 140,000 S Neighborhood Traffic Management Program $ 400,000 S Speed Humps Program $ 300,000 S Traffic Operations Center (TOC) Program $ 375,000 S Captain Jerry's Safety Program $ 15,000 S On-Street Angled Parking Program $ 25,000 S Median Turn Lane Program $ 50,000 S Traffic Signal Safety Program $ 125,000 S Greenhaven Drive and Gloria Drive Traffic Signal $ 300,000 S Signal Pre-Emption Program $ 75,000 T North Natomas Freeway Monitoring Program $ 11,500 T Bikeway Program $ 150,000 T Advanced Transportation Planning Program $ 400,000 T Overwidth Pavement Reimbursement Program $ 100,000 T Pedestrian Improvements Program $ 50,000 T Pedestrian Safety Program $ 75,000 T Public Rights-of-Way Accessibility Program $ 2,780,000 T Downtown TSM $ 20,000 T ey Abatement Program $ 60,000 T Neighborhood Street Light Replacement Program $ 400,000 T Major Street Lighting Replacement Program $ 100,000 T FY09/10 Economic Development Program $ 525,000 T Major Street Improvements $ 1,867,000 V Retail and Office Space Improvements Program $ 50,000 V Structure Repairs and Major Maintenance Program $ 500,000 V Mechanical/Electrical Equipment Repair Program $ 50,000 V Parking Facilities Paint/Signage Program $ 200,000 V Parking Facilities Development Program $ 2,000,000 Totals $ 12,168, CAPITAL IMPROVEMENT PROGRAM I - 7

137 CITY OF SACRAMENTO TRANSPORTATION PROGRAM OVERVIEW CAPITAL IMPROVEMENT PROGRAM I - 8
138 PAVEMENT MANAGEMENT APPLICATION UPDATE PROGRAM R Project Description The Pavement Management Application (PMA) inventory system requires regular updates, as well as other required hardware and software upgrades to keep the City's infrastructure management system current. Project Objectives Update the infrastructure management systems used by Street Services Division. Existing Situation The City is required by the Federal Highway Administration to have a Pavement Management Application (PMA system). An annual allocation is required to update and maintain the PMA system. Operating Budget Impact Fund 2026 Budget through Est Balance Fund Source 6/2009 6/ / / / / /14 NEW MEASURE A MAINTENANCE $0 $0 $50,000 $50,000 $50,000 $50,000 $50,000 This Project Total $0 $0 $50,000 $50,000 $50,000 $50,000 $50, Funding Estimated Project Cost FY2009/10 Funding Prior Year Expenditures Project Start date Estimated Complete date Elapsed Time Percent Complete $250,000 $250,000 $50,000 $0 July 2009 June 2014 Council District Neighborhood Area Planning Area Project Location Project Manager Citywide Transportation, Juan Montanez Project Number R II - 1
139 STREET OVERLAY AND SEAL PROGRAM R Project Description Overlay and seal of City streets. Project Objectives Extend the life of the existing streets and avoid major street reconstruction costs. Contribute to public safety and encourage neighborhood revitalization. Existing Situation Operating Budget Impact The Streets Services Division is pursuing an active program of street overlays and street slurry seals to maintain streets in a state of good repair. The preventative maintenance effort associated with this program is funded with local transportation funds. Overall annual operating costs are reduced through preventative maintenance. Fund 2026 Budget through Est Balance Fund Source 6/2009 6/ / / / / /14 NEW MEASURE A MAINTENANCE $0 $0 $50,000 $50,000 $50,000 $50,000 $50,000 This Project Total $0 $0 $50,000 $50,000 $50,000 $50,000 $50, Funding Estimated Project Cost FY2009/10 Funding Prior Year Expenditures Project Start date Estimated Complete date Elapsed Time Percent Complete $250,000 $250,000 $50,000 $0 June 2009 June 2014 Council District Neighborhood Area Planning Area Project Location Project Manager Citywide Transportation, Juan Montanez Project Number R II - 2
140 Project Description HOLLOW SIDEWALK MONITORING PROGRAM R Identify, evaluate, and monitor conditions of hollow sidewalks. Perform annual inspections and prepare recommendations for needed repairs. Notify property owners of any repairs required or recommended to hollow sidewalk locations for which they are responsible. Project Objectives Existing Situation Operating Budget Impact Maintain and improve public safety. Approximately 24 blocks of hollow sidewalks exist in the downtown area. The sidewalks and many of the retaining walls supporting them date back over 100 years and require routine safety inspection for structural stability. None. Fund 2001 Budget through Est Balance Fund Source 6/2009 6/ / / / / /14 MEASURE A - PROJECT $0 $0 $65,000 $65,000 $65,000 $65,000 $65,000 This Project Total $0 $0 $65,000 $65,000 $65,000 $65,000 $65, Funding Estimated Project Cost FY2009/10 Funding Prior Year Expenditures Project Start date Estimated Complete date Elapsed Time Percent Complete $325,000 $325,000 $65,000 $0 July 2009 June 2014 Council District Neighborhood Area Planning Area Project Location Project Manager Citywide Transportation, Matthew Johns Project Number R II - 3
141 Project Description BRIDGE MAINTENANCE ENGINEERING PROGRAM R Provides funding for engineering work required to investigate, scope, prioritize, and design repair and rehabilitation of bridges within the City s bridge inventory. Repair work is contracted out through the public contracting process or performed through city forces. Project Objectives Existing Situation Operating Budget Impact Perform bridge repairs, as specified by State bridge inspections, in a timely, cost-efficient manner. Contribute to public safety and revitalization of the City s existing infrastructure. Vehicular bridges are inspected biannually by state forces. Bicycle and pedestrian bridges are inspected as needed by city forces or contractors. Repair needs identified during the inspections are constructed by city forces or the public contracting process. None. Fund 2026 Budget through Est Balance Fund Source 6/2009 6/ / / / / /14 NEW MEASURE A MAINTENANCE $0 $0 $25,000 $25,000 $25,000 $25,000 $25,000 This Project Total $0 $0 $25,000 $25,000 $25,000 $25,000 $25, Funding Estimated Project Cost FY2009/10 Funding Prior Year Expenditures Project Start date Estimated Complete date Elapsed Time Percent Complete $125,000 $125,000 $25,000 $0 July 2009 June 2014 Council District Neighborhood Area Planning Area Project Location Project Manager Citywide Transportation, Josh Werner Project Number R II - 4
142 Project Description Project Objectives Existing Situation Operating Budget Impact BRIDGE CONSTRUCTION AND MAINTENANCE R Funding for construction of citywide bridge maintenance projects, including providing local match for federal and state grants. Repair city bridges on an annual basis until maintenance backlog is complete. Current funding needs, including identified match funds, are programmed to specific projects. Operating costs are reduced by eliminating ongoing maintenance work. Fund 2026 Budget through Est Balance Fund Source 6/2009 6/ / / / / /14 NEW MEASURE A MAINTENANCE $0 $0 $50,000 $50,000 $50,000 $50,000 $50,000 This Project Total $0 $0 $50,000 $50,000 $50,000 $50,000 $50, Funding Estimated Project Cost FY2009/10 Funding Prior Year Expenditures Project Start date Estimated Complete date Elapsed Time Percent Complete $250,000 $250,000 $50,000 $0 July 2009 June 2014 Council District Neighborhood Area Planning Area Project Location Project Manager Citywide Transportation, Ryan Moore Project Number R II - 5
143 Project Description Project Objectives Existing Situation Operating Budget Impact GUARDRAIL REPLACEMENT PROGRAM R Replacement and repair of guardrails damaged by traffic collisions or which have reached the end of their useful life. Maintain the existing guardrails in a state of good repair. Guardrails that are damaged or have reached the end of their useful life require repair or replacement. None. Fund 2025 Budget through Est Balance Fund Source 6/2009 6/ / / / / /14 NEW MEASURE A CONSTRUCTION $0 $0 $50,000 $50,000 $50,000 $50,000 $50,000 This Project Total $0 $0 $50,000 $50,000 $50,000 $50,000 $50, Funding Estimated Project Cost FY2009/10 Funding Prior Year Expenditures Project Start date Estimated Complete date Elapsed Time Percent Complete $250,000 $250,000 $50,000 $0 July 2009 June 2014 Council District Neighborhood Area Planning Area Project Location Project Manager Citywide Transportation, Juan Montanez Project Number R II - 6
144 Project Description Project Objectives Existing Situation Operating Budget Impact TRENCH CUT FEE PROGRAM R The Trench Cut Fee Program is used to mitigate damage caused by trenching of streets by providing additional funding for the city s annual resurfacing program. Extend the useful life of streets that have been damaged by trenching. The useful life of streets damaged by trenching is reduced. None. Fund 2008 Budget through Est Balance Fund Source 6/2009 6/ / / / / /14 STREET CUT $0 $0 $150,000 $150,000 $150,000 $150,000 $150,000 This Project Total $0 $0 $150,000 $150,000 $150,000 $150,000 $150, Funding Estimated Project Cost FY2009/10 Funding Prior Year Expenditures Project Start date Estimated Complete date Elapsed Time Percent Complete $750,000 $750,000 $150,000 $0 June 2009 June 2014 Council District Neighborhood Area Planning Area Project Location Project Manager Citywide Transportation, Juan Montanez Project Number R II - 7
145 Project Description Project Objectives Existing Situation STREET REPAIR PARTNERING PROGRAM R The Street Repair Partnering Program is used to fund additional street improvements in conjunction with other construction projects. Maintain streets in a state of good repair after underground work has been completed. Currently, the Department of Utilities digs trenches to make necessary repairs and then fills and patches the cut. Oftentimes, the area could use more extensive street repairs. It is more efficient to make necessary street repairs in coordination with the Utility project. Operating Budget Impact None. Fund 2025 Budget through Est Balance Fund Source 6/2009 6/ / / / / /14 NEW MEASURE A CONSTRUCTION $0 $0 $100,000 $100,000 $100,000 $100,000 $100,000 This Project Total $0 $0 $100,000 $100,000 $100,000 $100,000 $100, Funding Estimated Project Cost FY2009/10 Funding Prior Year Expenditures Project Start date Estimated Complete date Elapsed Time Percent Complete $500,000 $500,000 $100,000 $0 July 2009 June 2014 Council District Neighborhood Area Planning Area Project Location Project Manager Citywide Transportation, Juan Montanez Project Number R II - 8
146 Project Description Project Objectives Existing Situation Operating Budget Impact TRAFFIC SIGNAL EQUIPMENT UPGRADE PROGRAM R Replacement of signal controllers and light emitting diodes (LED) and replacement and modification of traffic signals. Replace signal related equipment that has reached the end of its operational efficiency. Traffic signal equipment that has reached the end of its useful life requires replacement or modification. None. Fund 2001 Budget through Est Balance Fund Source 6/2009 6/ / / / / /14 MEASURE A - PROJECT $0 $0 $205,000 $205,000 $205,000 $205,000 $205,000 This Project Total $0 $0 $205,000 $205,000 $205,000 $205,000 $205, Funding Estimated Project Cost FY2009/10 Funding Prior Year Expenditures Project Start date Estimated Complete date Elapsed Time Percent Complete $1,025,000 $1,025,000 $205,000 $0 July 2009 June 2014 Council District Neighborhood Area Planning Area Project Location Project Manager Citywide Transportation, Juan Montanez Project Number R II - 9
147 WORK MANAGEMENT SYSTEM- STREETS/FACILITIES R Project Description Procurement and implementation of a maintenance work management system. Project Objectives Upgrade the existing work order system to a web based environment with GIS capabilities. Existing Situation Work requests are currently received over the phone and hard copy work orders are forwarded to field crews for completion. There is currently no automated record keeping system to track work order costs and associated services. Operating Budget Impact Establishment of a work management system achieves significant efficiencies in the street maintenance operating units. Fund 2026 Budget through Est Balance Fund Source 6/2009 6/ / / / / /14 NEW MEASURE A MAINTENANCE $0 $0 $60,000 $60,000 $60,000 $60,000 $60,000 This Project Total $0 $0 $60,000 $60,000 $60,000 $60,000 $60, Funding Estimated Project Cost FY2009/10 Funding Prior Year Expenditures Project Start date Estimated Complete date Elapsed Time Percent Complete $300,000 $300,000 $60,000 $0 July 2009 June 2014 Council District Neighborhood Area Planning Area Project Location Project Manager Citywide Transportation, Juan Montanez Project Number R II - 10
148 STREET LIGHT RELAMP PROGRAM R Project Description Proactively relamp street lights that have reached the end of their useful life. Project Objectives Street lights have an average life span of 6 to 8 years. This program provides a proactive effort to have street lights relamped prior to burn out. Existing Situation Operating Budget Impact Street lights burn out and create safety issues for communities. Without a current proactive relamping effort, keeping up with the demand to replace street light outages is challenging. None, as this program replaces existing infrastructure that has reached the end of its useful life. Fund Budget through Est Balance Fund Source 6/2009 6/ / / / / /14 GAS TAX 2106 $0 $0 $85,000 $85,000 $85,000 $85,000 $85,000 CITYWIDE L&L DIST $0 $0 $40,000 $40,000 $40,000 $40,000 $40,000 This Project Total $0 $0 $125,000 $125,000 $125,000 $125,000 $125, Funding Estimated Project Cost FY2009/10 Funding Prior Year Expenditures Project Start date Estimated Complete date Elapsed Time Percent Complete $625,000 $625,000 $125,000 $0 July 2009 June 2014 Council District Neighborhood Area Planning Area Project Location Project Manager Citywide Transportation, Juan Montanez Project Number R II - 11
149 NEW TRAFFIC SIGNALS PROGRAM S Project Description Installation of new traffic signals where warranted. Project Objectives Enhance safety and efficiency of intersections in the that meet warrants for traffic signals. Locations are prioritized in the City s Transportation Programming Guide. Existing Situation Operating Budget Impact Several unsignalized intersections within the city have met traffic signal warrants. Minimal increase to operating costs are associated with the maintenance of a new traffic signal. the operating costs are funded through local transportation funds. Fund Budget through Est Balance Fund Source 6/2009 6/ / / / / /14 MEASURE A - PROJECT $32,954 $32,954 GAS TAX 2106 $830 $830 MAJOR STREET CONSTR. $184,153 $76,803 $0 $300,000 $300,000 $300,000 $300,000 SO NATOMAS COMM IMPROV $11,353 $1 This Project Total $229,290 $110,588 $0 $300,000 $300,000 $300,000 $300, Funding Estimated Project Cost FY2009/10 Funding Prior Year Expenditures Project Start date Estimated Complete date Elapsed Time Percent Complete $1,200,000 $1,429,290 $0 $118,702 October 1999 June 2014 Council District Neighborhood Area Planning Area Project Location Project Manager Citywide Transportation, Ryan Moore Project Number S SM01 II - 12
150 Project Description Project Objectives Existing Situation Operating Budget Impact TRAFFIC SIGNS AND MARKINGS PROGRAM S Installation of new traffic signs and markings that are needed to enhance traffic control and safety, which are not related to maintenance. Enhance public safety. Upon completion of a traffic investigation or evaluation, it may be necessary to modify existing or install new traffic signs and markings, and equipment. Minimal increase to operating costs associated with the maintenance of new signs and markings. The operating costs are funded through local transportation funds. Fund 2025 Budget through Est Balance Fund Source 6/2009 6/ / / / / /14 NEW MEASURE A CONSTRUCTION $0 $0 $140,000 $140,000 $140,000 $140,000 $140,000 This Project Total $0 $0 $140,000 $140,000 $140,000 $140,000 $140, Funding Estimated Project Cost FY2009/10 Funding Prior Year Expenditures Project Start date Estimated Complete date Elapsed Time Percent Complete $700,000 $700,000 $140,000 $0 June 2010 June 2014 Council District Neighborhood Area Planning Area Project Location Project Manager Citywide Transportation, John Perez Project Number S II - 13
151 Project Description Project Objectives NEIGHBORHOOD TRAFFIC MANAGEMENT PROGRAM S Development and implementation of neighborhood traffic plans to control volume and speed of neighborhood traffic. Enhance public safety and neighborhood livability by raising public awareness and educating residents on traffic safety issues; develop and implement new neighborhood traffic management plans, including neighborhood participation in identification of neighborhood traffic issues and solutions. Existing Situation Operating Budget Impact Neighborhood-wide speed and volume concerns need to be addressed through traffic calming. Operating costs are increased due to maintenance associated with improvements constructed with this program. Operating costs are funded with local transportation funds. Fund 2001 Budget through Est Balance Fund Source 6/2009 6/ / / / / /14 MEASURE A - PROJECT $0 $0 $400,000 $400,000 $400,000 $400,000 $400,000 This Project Total $0 $0 $400,000 $400,000 $400,000 $400,000 $400, Funding Estimated Project Cost FY2009/10 Funding Prior Year Expenditures Project Start date Estimated Complete date Elapsed Time Percent Complete $2,000,000 $2,000,000 $400,000 $0 July 2009 June 2014 Council District Neighborhood Area Planning Area Project Location Project Manager Citywide Transportation, Angie Louie Project Number S II - 14
152 SPEED HUMPS PROGRAM S Project Description Installation of speed humps, lumps and tables. Project Objectives Reduce vehicle speeds on residential neighborhoods and increase safety. Existing Situation Streets meeting certain criteria are eligible for speed humps to control speeds. Operating Budget Impact Operating costs are increased due to maintenance associated with improvements constructed with this program. Operating costs are funded with local transportation funds. Fund Budget through Est Balance Fund Source 6/2009 6/ / / / / /14 MEASURE A - PROJECT $0 $0 $6,000 $6,000 $6,000 $0 $0 NEW MEASURE A CONSTRUCTION $0 $0 $294,000 $294,000 $294,000 $300,000 $300,000 This Project Total $0 $0 $300,000 $300,000 $300,000 $300,000 $300, Funding Estimated Project Cost FY2009/10 Funding Prior Year Expenditures Project Start date Estimated Complete date Elapsed Time Percent Complete $1,500,000 $1,500,000 $300,000 $0 July 2009 June 2014 Council District Neighborhood Area Planning Area Project Location Project Manager Citywide Transportation, Deb Newton Project Number S II - 15
153 Project Description TRAFFIC OPERATIONS CENTER (TOC) PROGRAM S Program includes corridor timing studies and implementation; related equipment maintenance, upgrade/replacement and expansion; TOC evaluation and expansion studies; related Plans, Specification and Estimates (PS&E); communications conduit infrastructure and maintenance; and Regional Intelligent Transportation System (ITS) partnership strategic plan studies. Project Objectives Existing Situation Operating Budget Impact Connect traffic signals into the TOC so traffic signal operations and timing can be evaluated, monitored, and managed from the TOC to reduce travel delay and congestion on City streets. Approximately 300 of the 770 traffic signals in the city are tied into the TOC. Minimal increase to operating costs associated with traffic operations infrastructure. The operating costs are funded through local transportation funds. Fund Budget through Est Balance Fund Source 6/2009 6/ / / / / /14 MEASURE A - PROJECT $0 $0 $50,000 $50,000 $50,000 $25,000 $0 NEW MEASURE A CONSTRUCTION $0 $0 $325,000 $325,000 $325,000 $350,000 $375,000 This Project Total $0 $0 $375,000 $375,000 $375,000 $375,000 $375, Funding Estimated Project Cost FY2009/10 Funding Prior Year Expenditures Project Start date Estimated Complete date Elapsed Time Percent Complete $1,875,000 $1,875,000 $375,000 $0 July 2009 June 2014 Council District Neighborhood Area Planning Area Project Location Project Manager Citywide Transportation, Angie Louie Project Number S II - 16
154 Project Description Project Objectives CAPTAIN JERRY S SAFETY PROGRAM S Materials and staff time to support education of elementary school children about traffic safety and to support the Captain Jerry Traffic Safety House at Safetyville. Educate elementary school children on traffic safety, safe travel to and from school, the use of seatbelts, walking in crosswalks, watching for cars, bicycle rules, and school bus safety. Existing Situation Operating Budget Impact Staff goes to approximately 16 elementary schools annually to provide the Captain Jerry Traffic Safety Program to over 10,000 children per year. None. Fund 2002 Budget through Est Balance Fund Source 6/2009 6/ / / / / /14 GAS TAX 2106 $0 $0 $15,000 $15,000 $15,000 $15,000 $15,000 This Project Total $0 $0 $15,000 $15,000 $15,000 $15,000 $15, Funding Estimated Project Cost FY2009/10 Funding Prior Year Expenditures Project Start date Estimated Complete date Elapsed Time Percent Complete $75,000 $75,000 $15,000 $0 July 2009 June 2014 Council District Neighborhood Area Planning Area Project Location Project Manager Citywide Transportation, John Perez Project Number S II - 17
155 ON STREET ANGLED PARKING PROGRAM S Project Description Replace parallel parking with angled parking as requested and where feasible. Project Objectives Increase parking supply in the. Existing Situation Streets with parallel parking provided fewer parking spaces than streets with angled parking. Operating Budget Impact Minimal increase to operating costs associated with maintaining additional striping. The operating costs are funded with local transportation funds. Fund Budget through Est Balance Fund Source 6/2009 6/ / / / / /14 MEASURE A - PROJECT $0 $0 $25,000 $25,000 $0 $0 $0 NEW MEASURE A CONSTRUCTION $0 $0 $0 $0 $25,000 $25,000 $25,000 This Project Total $0 $0 $25,000 $25,000 $25,000 $25,000 $25, Funding Estimated Project Cost FY2009/10 Funding Prior Year Expenditures Project Start date Estimated Complete date Elapsed Time Percent Complete $125,000 $125,000 $25,000 $0 July 2009 June 2014 Council District Neighborhood Area Planning Area Project Location Project Manager Citywide Transportation, Mahesh Bhatt Project Number S II - 18
156 Project Description Project Objectives Existing Situation Operating Budget Impact MEDIAN TURN LANE PROGRAM S Construction or modification of medians, left turn lanes, two-way left turn lanes and striping at various locations within the city. Enhance public safety by providing a safer and more efficient traffic movement pattern at congested locations. Many larger intersections within the city are congested due to inadequate turn lane storage and can operate more efficiently with minor median improvements. None. Fund 2001 Budget through Est Balance Fund Source 6/2009 6/ / / / / /14 MEASURE A - PROJECT $0 $0 $50,000 $50,000 $50,000 $50,000 $50,000 This Project Total $0 $0 $50,000 $50,000 $50,000 $50,000 $50, Funding Estimated Project Cost FY2009/10 Funding Prior Year Expenditures Project Start date Estimated Complete date Elapsed Time Percent Complete $250,000 $250,000 $50,000 $0 July 2009 June 2014 Council District Neighborhood Area Planning Area Project Location Project Manager Citywide Transportation, David Edrosolan Project Number S II - 19
157 Project Description Project Objectives Existing Situation Operating Budget Impact TRAFFIC SIGNAL SAFETY PROGRAM S The program includes safety studies and the design and construction of traffic signal modifications, advanced flashers and other traffic related intersection improvements to improve safety. Improve public safety at various locations. Some intersections have a history of collisions and may require traffic signal related improvements. Minimal increase to operating costs associated with the maintenance of signal modifications, advanced flashers and other traffic improvements. The operating costs are funded through local transportation funds. Fund 2025 Budget through Est Balance Fund Source 6/2009 6/ / / / / /14 NEW MEASURE A CONSTRUCTION $0 $0 $125,000 $125,000 $125,000 $125,000 $125,000 This Project Total $0 $0 $125,000 $125,000 $125,000 $125,000 $125, Funding Estimated Project Cost FY2009/10 Funding Prior Year Expenditures Project Start date Estimated Complete date Elapsed Time Percent Complete $625,000 $625,000 $125,000 $0 June 2009 June 2014 Council District Neighborhood Area Planning Area Project Location Project Manager Citywide Transportation, David Edrosolan Project Number S II - 20
158 GREENHAVEN DRIVE AND GLORIA DRIVE TRAFFIC SIGNAL S Project Description Design and construct a new traffic signal at the intersection of Greenhaven Drive and Gloria Drive. Project Objectives Increase safety and enhance pedestrian and vehicular circulation. Existing Situation Intersection is currently unsignalized. The intersection is the top ranked signal in the Transportation Programming Guide (TPG). Operating Budget Impact Minimal increase to operating costs associated with the maintenance of a new traffic signal. The operating costs are funded through local transportation funds. Fund 2007 Budget through Est Balance Fund Source 6/2009 6/ / / / / /14 MAJOR STREET CONSTR. $0 $0 $300,000 $0 $0 $0 $0 This Project Total $0 $0 $300,000 $0 $0 $0 $ Funding Estimated Project Cost FY2009/10 Funding Prior Year Expenditures Project Start date Estimated Complete date Elapsed Time Percent Complete $300,000 $300,000 $300,000 $0 July 2009 June 2010 Council District Neighborhood Area Planning Area Project Location Project Manager Intersection Of Greenhaven Drive And Gloria Drive Transportation, Ryan Moore Project Number S II - 21
159 SIGNAL PRE-EMPTION PROGRAM S Project Description Retrofit signals along segments of selected corridors to include emergency vehicle pre-emption equipment. Project Objectives Reduce accidents at equipped intersections and reduce response times of emergency vehicles along select corridors. Existing Situation Operating Budget Impact Pre-emption equipment is currently installed only on new reconstructed signals. Many corridors do not have signal pre-emption. Minimal increase to operating costs associated with installation of pre-emption equipment. The operating costs are funded through local transportation funds. Fund 2025 Budget through Est Balance Fund Source 6/2009 6/ / / / / /14 NEW MEASURE A CONSTRUCTION $0 $0 $75,000 $75,000 $75,000 $75,000 $75,000 This Project Total $0 $0 $75,000 $75,000 $75,000 $75,000 $75, Funding Estimated Project Cost FY2009/10 Funding Prior Year Expenditures Project Start date Estimated Complete date Elapsed Time Percent Complete $375,000 $375,000 $75,000 $0 July 2009 June 2014 Council District Neighborhood Area Planning Area Project Location Project Manager Citywide Transportation, Angie Louie Project Number S II - 22
160 Project Description Project Objectives NORTH NATOMAS FREEWAY MONITORING PROGRAM T Annual monitoring of the freeway interchanges serving North Natomas is required by the cooperative agreement between the and the State of California (City Agreement No ). Monitors traffic operations at the freeway off-ramps and adjacent intersections. The monitoring is intended to identify when the freeway interchanges have begun to be impacted by traffic growth in North Natomas. Results are used to identify when performance thresholds for the interchanges have been met and impact mitigation measures are needed. This report is sent directly to Caltrans. Existing Situation Operating Budget Impact This monitoring has been performed since 1996 None, as no operating expenses are associated with this activity. Fund 3201 Budget through Est Balance Fund Source 6/2009 6/ / / / / /14 N. NATOMAS COMM. IMPR. $97,500 $21,757 $11,500 $11,500 $11,500 $11,500 $11,500 This Project Total $97,500 $21,757 $11,500 $11,500 $11,500 $11,500 $11, Funding Estimated Project Cost FY2009/10 Funding Prior Year Expenditures Project Start date Estimated Complete date Elapsed Time Percent Complete $57,500 $155,000 $11,500 $75,743 July 2000 June 2014 Council District Neighborhood Area Planning Area Project Location Project Manager Freeway Interchanges Serving North Natomas Transportation, Mark Griffin Project Number T TW16 II - 23
161 BIKEWAY PROGRAM T Project Description Provision of on-street bicycle facilities within the. Project Objectives Promote alternative transportation needs and improve air quality and public safety. Existing Situation Streets identified in this project have no existing bikeway improvements or are in need of upgrading. Operating Budget Impact Minimal cost associated with maintaining additional signing and striping. The operating costs are funded with local transportation funds. Fund 2025 Budget through Est Balance Fund Source 6/2009 6/ / / / / /14 NEW MEASURE A CONSTRUCTION $0 $0 $150,000 $150,000 $150,000 $150,000 $150,000 This Project Total $0 $0 $150,000 $150,000 $150,000 $150,000 $150, Funding Estimated Project Cost FY2009/10 Funding Prior Year Expenditures Project Start date Estimated Complete date Elapsed Time Percent Complete $750,000 $750,000 $150,000 $0 July 2009 June 2014 Council District Neighborhood Area Planning Area Project Location Project Manager Citywide Transportation, Ed Cox Project Number T II - 24
162 Project Description Project Objectives Existing Situation Operating Budget Impact ADVANCED TRANSPORTATION PLANNING PROGRAM T Citywide transportation planning and project scoping activities, transportation policy support, and transportation funding support. Provide funding for transportation planning, project scoping and related activities. City staff provides transportation planning, project scoping and policy support and works with transportation agencies to advance projects for funding and delivery. None. Fund 2002 Budget through Est Balance Fund Source 6/2009 6/ / / / / /14 GAS TAX 2106 $0 $0 $400,000 $400,000 $400,000 $400,000 $400,000 This Project Total $0 $0 $400,000 $400,000 $400,000 $400,000 $400, Funding Estimated Project Cost FY2009/10 Funding Prior Year Expenditures Project Start date Estimated Complete date Elapsed Time Percent Complete $2,000,000 $2,000,000 $400,000 $0 July 2009 June 2014 Council District Neighborhood Area Planning Area Project Location Project Manager Citywide Transportation, Ryan Moore Project Number T II - 25
163 OVERWIDTH PAVEMENT REIMBURSEMENT PROGRAM T Project Description Reimbursement of overwidth street pavement improvements. Project Objectives Reimburse developers costs in constructing street pavement that is over and above their project responsibility. Existing Situation Operating Budget Impact In areas adjacent to proposed development, streets may not be built to their ultimate configuration. Development projects may be required to construct the street to its ultimate configuration, yet are only responsible to pay their fair share of costs. Additional operating costs associated with maintenance of additional roadway operations. The operating costs are funded with local transportation funds. Fund 2007 Budget through Est Balance Fund Source 6/2009 6/ / / / / /14 MAJOR STREET CONSTR. $0 $0 $100,000 $100,000 $100,000 $100,000 $100,000 This Project Total $0 $0 $100,000 $100,000 $100,000 $100,000 $100, Funding Estimated Project Cost FY2009/10 Funding Prior Year Expenditures Project Start date Estimated Complete date Elapsed Time Percent Complete $500,000 $500,000 $100,000 $0 July 2009 June 2014 Council District Neighborhood Area Planning Area Project Location Project Manager Citywide Transportation, Ryan Moore Project Number T II - 26
164 Project Description PEDESTRIAN IMPROVEMENT PROGRAM T Installation of pedestrian improvements consistent with the City's Pedestrian Master Plan including curbs, gutters, sidewalks, and crosswalks. Includes preparation of a pedestrian safety education and enforcement program. Project Objectives Existing Situation Operating Budget Impact To make walking a safe and viable form of transportation and improve public safety. Many areas in the city lack pedestrian facilities such as curbs, gutters, sidewalks, and crosswalks. Additionally, the City does not have a comprehensive public outreach and education program addressing pedestrian safety. None. Fund 2001 Budget through Est Balance Fund Source 6/2009 6/ / / / / /14 MEASURE A - PROJECT $0 $0 $50,000 $50,000 $50,000 $50,000 $50,000 This Project Total $0 $0 $50,000 $50,000 $50,000 $50,000 $50, Funding Estimated Project Cost FY2009/10 Funding Prior Year Expenditures Project Start date Estimated Complete date Elapsed Time Percent Complete $250,000 $250,000 $50,000 $0 July 2009 June 2014 Council District Neighborhood Area Planning Area Project Location Project Manager Citywide Transportation, Ryan Moore Project Number T II - 27
165 Project Description Project Objectives Existing Situation Operating Budget Impact PEDESTRIAN SAFETY PROGRAM T Installation of pedestrian enhancements including marked crosswalks, countdown pedestrian signals, signalized pedestrian crossings and associated improvements. Enhance pedestrian safety. Marked crosswalks and other pedestrian enhancements are often requested. Requests are evaluated and enhancements are made where feasible. Minimal increase to operating costs associated with maintenance of pedestrian improvements. The operating costs are funded with local transportation funds. Fund 2025 Budget through Est Balance Fund Source 6/2009 6/ / / / / /14 NEW MEASURE A CONSTRUCTION $0 $0 $75,000 $75,000 $75,000 $75,000 $75,000 This Project Total $0 $0 $75,000 $75,000 $75,000 $75,000 $75, Funding Estimated Project Cost FY2009/10 Funding Prior Year Expenditures Project Start date Estimated Complete date Elapsed Time Percent Complete $375,000 $375,000 $75,000 $0 July 2009 June 2014 Council District Neighborhood Area Planning Area Project Location Project Manager Citywide Transportation, John Perez Project Number T II - 28
166 Project Description Project Objectives Existing Situation Operating Budget Impact PUBLIC RIGHTS-OF-WAY ACCESSIBILITY PROGRAM T Upgrading, retrofitting, construction and/or reconstruction of curb ramps, crosswalks, audible pedestrian signals and/or other elements within the public rights-of-way. To bring the public rights-of-way into compliance with all access laws and regulations. There are locations around the within the public rights-of-way which need to be upgraded, retrofitted, or constructed to meet current access laws and regulations. Reduced operating costs associated with ADA compliance issues. Fund Budget through Est Balance Fund Source 6/2009 6/ / / / / /14 MEASURE A - PROJECT $0 $0 $2,123,000 $2,123,000 $2,073,000 $2,023,000 $1,948,000 NEW MEASURE A CONSTRUCTION $0 $0 $657,000 $657,000 $707,000 $757,000 $832,000 This Project Total $0 $0 $2,780,000 $2,780,000 $2,780,000 $2,780,000 $2,780, Funding Estimated Project Cost FY2009/10 Funding Prior Year Expenditures Project Start date Estimated Complete date Elapsed Time Percent Complete $13,900,000 $13,900,000 $2,780,000 $0 July 2009 June 2014 Council District Neighborhood Area Planning Area Project Location Project Manager Citywide Transportation, Rocky Burks Project Number T II - 29
167 Project Description Project Objectives DOWNTOWN TSM CAPITAL IMPROVEMENT PROGRAM T Provision of facilities that increase the people moving capacity of the existing transportation system using transportation system management (TSM) measures. To enable the city to develop, build and/or implement enhancements to the downtown transportation system which encourage alternate mode use. Existing Situation Operating Budget Impact Several facilities that enhance bicycle, walking, transit and carpooling already exist. This program will contribute to these facilities or develop new similar facilities. Operating costs are fully funded with local transportation funds. Fund 2012 Budget through Est Balance Fund Source 6/2009 6/ / / / / /14 TRANSPORTATION SYSTEMS MGMT $0 $0 $20,000 $20,000 $20,000 $20,000 $20,000 This Project Total $0 $0 $20,000 $20,000 $20,000 $20,000 $20, Funding Estimated Project Cost FY2009/10 Funding Prior Year Expenditures Project Start date Estimated Complete date Elapsed Time Percent Complete $100,000 $100,000 $20,000 $0 July 2009 June 2014 Council District Neighborhood Area Planning Area Project Location Project Manager 1, 3, Downtown Transportation, Ed Cox Project Number T II - 30
168 ALLEY ABATEMENT PROGRAM T Project Description Install gates in alley public-right-of way for public safety purposes. Project Objectives To address crime related and nuisance activities in public alleys. Existing Situation Property owners adjacent to alleys request gating of public alleys due to crime and nuisance issues. If deemed appropriate, the City installs gates. Property owners and SHRA contribute funding to offset costs. The ey Abatement Program was approved by the City Council on 3/24/09 (Item 14). Operating Budget Impact This program is funded with local transportation funds. Fund 2002 Budget through Est Balance Fund Source 6/2009 6/ / / / / /14 GAS TAX 2106 $60,000 $45,000 $60,000 $60,000 $60,000 $60,000 $60,000 This Project Total $60,000 $45,000 $60,000 $60,000 $60,000 $60,000 $60, Funding Estimated Project Cost FY2009/10 Funding Prior Year Expenditures Project Start date Estimated Complete date Elapsed Time Percent Complete $300,000 $360,000 $60,000 $15,000 July 2009 June 2014 Council District Neighborhood Area Planning Area Project Location Project Manager Citywide Transportation, Thomas Adams Project Number T II - 31
169 Project Description Project Objectives Existing Situation Operating Budget Impact NEIGHBORHOOD STREET LIGHT REPLACEMENT PROGRAM T Replacement of neighborhood street lighting components or systems which are unsafe or have reached the end of their useful life. Replace unsafe or deteriorated neighborhood street lights. Many neighborhood street lights are years old and have reached the end of their useful life. This program replaces these unsafe or deteriorated street lights. Operating costs are reduced through replacement of high maintenance listing infrastructure. Fund 2232 Budget through Est Balance Fund Source 6/2009 6/ / / / / /14 CITYWIDE L&L DIST $0 $0 $400,000 $400,000 $400,000 $400,000 $400,000 This Project Total $0 $0 $400,000 $400,000 $400,000 $400,000 $400, Funding Estimated Project Cost FY2009/10 Funding Prior Year Expenditures Project Start date Estimated Complete date Elapsed Time Percent Complete $2,000,000 $2,000,000 $400,000 $0 July 2009 June 2014 Council District Neighborhood Area Planning Area Project Location Project Manager Citywide Transportation, Sompol Chatusripitak Project Number T II - 32
170 Project Description Project Objectives Existing Situation Operating Budget Impact MAJOR STREET LIGHTING REPLACEMENT PROGRAM Replacement of lighting along major streets which have reached the end of their useful life. Replace existing street light systems that have reached the end of their useful life. Many older street light systems are in need of replacement. Operating costs are reduced through replacement of high maintenance infrastructure. T Fund 2007 Budget through Est Balance Fund Source 6/2009 6/ / / / / /14 MAJOR STREET CONSTR. $0 $0 $100,000 $100,000 $100,000 $100,000 $100,000 This Project Total $0 $0 $100,000 $100,000 $100,000 $100,000 $100, Funding Estimated Project Cost FY2009/10 Funding Prior Year Expenditures Project Start date Estimated Complete date Elapsed Time Percent Complete $500,000 $500,000 $100,000 $0 July 2009 June 2014 Council District Neighborhood Area Planning Area Project Location Project Manager Citywide Transportation, Sompol Chatusripitak Project Number T II - 33
171 Project Description FY09/10 ECONOMIC DEVELOPMENT PROGRAM T Design and construction of infrastructure related to economic development activities. Project funds will be leveraged with private funds, as well as Utility and SHRA funds when possible. Final projects and funding amounts to the approved by City Council. Project Objectives Existing Situation Operating Budget Impact Design and construct infrastructure projects that create and/or support the City s economic development goals. Older areas have inadequate infrastructure affecting financial viability and redevelopment. Infrastructure costs can cause some projects to be cost prohibitive or create a funding gap. Increased operating costs associated with maintenance of roadway infrastructure. Operating costs are funded with local transportation funds. Fund 2007 Budget through Est Balance Fund Source 6/2009 6/ / / / / /14 MAJOR STREET CONSTR. $0 $0 $525,000 $525,000 $525,000 $525,000 $525,000 This Project Total $0 $0 $525,000 $525,000 $525,000 $525,000 $525, Funding Estimated Project Cost FY2009/10 Funding Prior Year Expenditures Project Start date Estimated Complete date Elapsed Time Percent Complete $2,625,000 $2,625,000 $525,000 $0 July 2009 June 2014 Council District Neighborhood Area Planning Area Project Location Project Manager Citywide Transportation, Ryan Moore Project Number T II - 34
172 Project Description Project Objectives Existing Situation Operating Budget Impact MAJOR STREET IMPROVEMENTS T Funding for citywide major street projects including providing local match for Federal and State Grant requirements. Budget for projects within the five year budget cycle. The city s major street inventory needs enhancement and expansion. Increase to operating costs associated with maintenance of additional infrastructure. The operating costs are funded with local transportation funds. Fund Budget through Est Balance Fund Source 6/2009 6/ / / / / /14 MEASURE A - PROJECT $0 $0 $569,000 $569,000 $569,000 $569,000 $569,000 MAJOR STREET CONSTR. $0 $0 $1,295,000 $1,295,000 $1,295,000 $1,295,000 $1,295,000 This Project Total $0 $0 $1,864,000 $1,864,000 $1,864,000 $1,864,000 $1,864, Funding Estimated Project Cost FY2009/10 Funding Prior Year Expenditures Project Start date Estimated Complete date Elapsed Time Percent Complete $9,320,000 $9,320,000 $1,864,000 $0 July 2009 June 2014 Council District Neighborhood Area Planning Area Project Location Project Manager Citywide Transportation, Ryan Moore Project Number T II - 35
173 RETAIL AND OFFICE SPACE IMPROVEMENTS PROGRAM V Project Description Retail and office space improvements in City-owned facilities that will benefit parking operations. Project Objectives Attract quality tenants by maintaining retail and office spaces within City-owned parking facilities which will generate revenues for parking operations, and provide for and improve office space for parking operations. Existing Situation Operating Budget Impact The City has over 60,000 square feet of retail/office space in five downtown garages. In many cases these spaces need to be upgraded to attract businesses. None. Fund 6004 Budget through Est Balance Fund Source 6/2009 6/ / / / / /14 PARKING $1,811,712 $712,236 $50,000 $50,000 $50,000 $50,000 $50,000 This Project Total $1,811,712 $712,236 $50,000 $50,000 $50,000 $50,000 $50, Funding Estimated Project Cost FY2009/10 Funding Prior Year Expenditures Project Start date Estimated Complete date Elapsed Time Percent Complete $250,000 $2,061,712 $50,000 $1,099,476 July 2002 June 2014 Council District Neighborhood Area Planning Area Project Location Project Manager Downtown City Parking Facilities Transportation Project Number V VD91 II - 36
174 STRUCTURE REPAIRS & MAJOR MAINTENANCE PROGRAM V Project Description Assessment, design and implementation of preventative and restorative building maintenance. Project Objectives Repair structural damage to City parking facilities and ensure that the parking garages meet building codes. Avoid ongoing, long-term structural deterioration. Existing Situation Operating Budget Impact Annual assessment of site conditions. None. Fund 6004 Budget through Est Balance Fund Source 6/2009 6/ / / / / /14 PARKING $6,030,000 $2,357,911 $500,000 $500,000 $500,000 $500,000 $500,000 This Project Total $6,030,000 $2,357,911 $500,000 $500,000 $500,000 $500,000 $500, Funding Estimated Project Cost FY2009/10 Funding Prior Year Expenditures Project Start date Estimated Complete date Elapsed Time Percent Complete $2,500,000 $8,530,000 $500,000 $3,672,089 July 2001 June 2014 Council District Neighborhood Area Planning Area Project Location Project Manager Downtown City Parking Facilities Transportation, Mike George Project Number V VD26 II - 37
175 Project Description Project Objectives MECHANICAL/ELECTRICAL EQUIPMENT REPAIR PROGRAM V Annual fund accumulation program to replace, repair, and upgrade existing mechanical/electrical equipment in City parking facilities as identified by Facilities Management. Maintain effective and safe operation of City parking facilities. Upgrade existing mechanical and electrical infrastructure systemwide. Existing Situation Operating Budget Impact Annual assessment of mechanical and electrical systems. None. Fund 6004 Budget through Est Balance Fund Source 6/2009 6/ / / / / /14 PARKING $2,302,732 $504,907 $50,000 $50,000 $50,000 $50,000 $50,000 This Project Total $2,302,732 $504,907 $50,000 $50,000 $50,000 $50,000 $50, Funding Estimated Project Cost FY2009/10 Funding Prior Year Expenditures Project Start date Estimated Complete date Elapsed Time Percent Complete $250,000 $2,552,732 $50,000 $1,797,825 April 2006 June 2014 Council District Neighborhood Area Planning Area Project Location Project Manager Downtown City Parking Facilities Transportation Project Number V VD51 II - 38
176 Project Description Project Objectives PARKING FACILITIES PAINT/SIGNAGE PROGRAM V Plan, design and paint interior of City-operated parking garages, including ceilings and beams. Install informational and directional signage to assist motorists and pedestrians. Assist garage patrons by replacing deficient directional signage for easier and safer navigation within parking facilities. Improve lighting, aesthetics and safety. Existing Situation Operating Budget Impact Capitol Garage painting and signage project, phase 3, in construction. Completion Date: August Four phases remaining. Reduction in maintenance costs. Fund 6004 Budget through Est Balance Fund Source 6/2009 6/ / / / / /14 PARKING $3,411,992 $1,825,151 $200,000 $200,000 $200,000 $200,000 $200,000 This Project Total $3,411,992 $1,825,151 $200,000 $200,000 $200,000 $200,000 $200, Funding Estimated Project Cost FY2009/10 Funding Prior Year Expenditures Project Start date Estimated Complete date Elapsed Time Percent Complete $1,000,000 $4,411,992 $200,000 $1,586,841 July 2001 June 2014 Council District Neighborhood Area Planning Area Project Location Project Manager Downtown City Parking Facilities Transportation Project Number V VD82 II - 39
177 Project Description PARKING FACILITIES DEVELOPMENT PROGRAM Planning and development of new parking facilities for the. V Project Objectives Existing Situation Operating Budget Impact Provide resources for anticipated future parking demands. Currently new parking facilities are financed through available cash, debt financing, or other borrowing. None. Fund Budget through Est Balance Fund Source 6/2009 6/ / / / / /14 GENERAL FUND $204,942 $0 PARKING $6,817,134 $6,354,556 $2,000,000 $2,000,000 $2,000,000 $2,000,000 $2,000,000 This Project Total $7,022,076 $6,354,556 $2,000,000 $2,000,000 $2,000,000 $2,000,000 $2,000, Funding Estimated Project Cost FY2009/10 Funding Prior Year Expenditures Project Start date Estimated Complete date Elapsed Time Percent Complete $10,000,000 $17,022,076 $2,000,000 $667,520 July 2002 June 2014 Council District Neighborhood Area Planning Area Project Location Project Manager Downtown City Parking Facilities Transportation Project Number V VD96 II - 40
178 CITY OF SACRAMENTO UTILITIES PROGRAM OVERVIEW INTRODUCTION The City Utilities consists of four programs, each of which is funded by an enterprise fund. The four programs are Water, Sewer, Storm Drainage, and Solid Waste. The projected City Utilities (CIP) totals $104.5 million. The five-year program includes construction costs for the continued improvements and rehabilitation of the Combined Sewer System (CSS) as outlined in the CSS Improvement Project, which began in 1995 and was projected to cost approximately $132 million. The five-year program also contains $55 million of the estimated $300 million construction costs for the residential water meter installation program mandated by state law. The FY2009/10 City Utilities budget totals $19 million. The projects in the City Utilities were selected using an asset management approach to systematically address infrastructure criticality, condition assessment, life cycle costing, and prioritized replacement timetables. Projects in the City Utilities are consistent with the City's General Plan. The projects often involve upgrades to or replacement of existing facilities. Other projects involve additions or extensions of existing facilities in response to ongoing development, which is compatible with the General Plan. The projects in the FY2009/10 City Utilities budget are projects for which the scope is clearly defined and the design work can be performed within a reasonable time period by existing engineering staff. The out-year projects have been selected in accordance with the prioritization process described above. The overall goal for infrastructure construction projects is to design and construct each project within a maximum time period of three years. The following graph shows the distribution of the FY2009/10 City Utilities Capital Program budget among the four funds. The total amount programmed is $19 million. Utilities Capital Programs by Fund FY2009/10 - $18,980,000 Drainage $1,425,000 Water $13,523,000 Solid Waste $717,000 Sewer $3,315, CAPITAL IMPROVEMENT PROGRAM J - 1
179 CITY OF SACRAMENTO UTILITIES PROGRAM OVERVIEW The following graph shows projections for the next five years in the four City Utilities Capital Programs. 20,000 Utilities Capital Programs By Fund Proposed Five Years (FY10 - FY14) Total Funds (000) 18,000 16,000 14,000 12,000 10,000 8,000 6,000 4,000 2, Water Sewer Solid Waste Drainage Utilities Enterprise Funds WATER (Fund 6005) The Water Enterprise Fund supports both the capital and operating costs of providing potable water throughout the city, including production, treatment, storage, and distribution systems. Revenues are generated primarily from user fees. In addition, the fund generates resources from system connection fees and development fees, which are used for system improvements necessitated by growth. Program Goals The Department of Utilities established the following goals for implementation of the Water Fund capital improvement program: Provide a reliable supply of high quality drinking water to city residents and businesses. Ensure that water production and treatment complies with all state and federal regulations. Ensure that expansion of the water treatment plant capacity, storage, and distribution systems meets present and future needs and conforms to the City's General Plan. Upgrade or replace existing water treatment, storage, and distribution systems in conformance with water system master plans. Increase reliability and reduce maintenance costs by upgrading or replacing inadequate or deteriorated systems CAPITAL IMPROVEMENT PROGRAM J - 2
180 CITY OF SACRAMENTO UTILITIES PROGRAM OVERVIEW Project Selection Criteria The Department of Utilities adopted the following criteria for initiating a capital improvement project in the Water Fund: Required by health, safety, or regulatory requirement. Reduce maintenance costs. Maintain existing facilities. Replace existing facilities. Meet demands of increased growth. Costs offset by grants or other revenue. By measuring any approved project against these criteria, the Department directs its resources to those projects most cost-beneficial to the residents and businesses of the city. Summary of Project Types and Funding Distribution Type of Project Number of Projects FY09/10 Funding Regulatory ,000 System Maintenance 1-230,000 Repair/Rehabilitation 7 460,000 System Improvements 5 2,060,000 Technology 2 875,000 Residential Metering 7 8,696,000 Other 2 800,000 Total 35 13,523,000 Overview The focus of the Water over the next five years will be on rehabilitating or replacing critical infrastructure, upgrading the existing water treatment plants, constructing transmission mains and reservoirs for new development and wholesale customers within the City place of use, and continuing the City s water meter retrofit program. The City s water master plan reflects the future growth within the proposed sphere of influence, wholesaling surface water to districts within the City s place of use, and expanding the City s surface water treatment capacity. Major Projects Two of the largest water projects for FY2009/10 include: Treatment Plant Rehabilitation Program (PN: Z ): Rehabilitate components of the Sacramento River and Fairbairn Water Treatment Plants. Portions of the treatment plants were constructed in 1924 and 1960 and require rehabilitation of filters, sedimentation basins, grit basins, and electrical systems. This program will improve the reliability, safety and capacity of the city s water supply system. Residential water meter retrofit program (PN: Z Z ): State law requires that the City install meters on all residential water services by These projects make up the phased approach to implement and comply with this continuing program CAPITAL IMPROVEMENT PROGRAM J - 3
181 CITY OF SACRAMENTO UTILITIES PROGRAM OVERVIEW Operating Budget Impact Water transmission main, distribution system rehabilitation, and water production capital projects generally do not increase operating costs. Operating costs will increase at the water treatment facilities when water production increases as the result of the water plant expansion projects. Asset Management - Water The need to renew areas of the water system due to age and deterioration is of great importance to the City in order to maintain a reliable and high quality water supply. The city s infrastructure, including many of the larger water mains located in the downtown area, is nearing the end of its useful life. The aging water system that includes pipelines, services, reservoirs, wells, and treatment plants is becoming more difficult to maintain as the infrastructure ages. As a result, the City is utilizing an asset management process for its capital improvement program to systematically prioritize and rank its rehabilitation and replacement needs, ensuring long-term sustainability of the water system infrastructure as well as its ability to deliver the required level of service perpetually. While the City faces many challenges ahead, asset management programs with long-range planning, life-cycle costing, proactive operations and maintenance, long-term funding strategies, and capital replacement plans based on cost-benefit analysis can be the most efficient method of meeting this challenge. Master Planning The master planning goal of the Department of Utilities is to provide a healthful, reliable water system that will meet the needs of a growing community and satisfy all State and Federal regulations. Meeting this goal requires improvement of existing facilities and development of new facilities. The improvements and new facilities will be designed according to the following specific criteria: During maximum water demand days at peak hours, the operating or "residual" pressure at all water connections will be at least 30 pounds per square inch (psi). During a maximum water demand day, considering the average demand plus fire flow, the operating or "residual" pressure available in the area for fire protection will not be less than 20 pounds per square inch (psi). federal and state drinking water regulations will be met. Within the water system, there will be a minimum storage volume equal to 20 percent of the discharge on a day of maximum water demand. In an attempt to attain these water system goals, the City will be updating its Water Distribution System Master Plan to assist in planning, financing, constructing, and operating the water transmission and distribution system. The distribution system network has been analyzed to identify existing system deficiencies and determine future distribution requirements. Future capital improvements, such as transmission mains and storage reservoirs, have been mapped and prioritized. In addition to the master plan, the Department is involved in a regional feasibility study and Environmental Impact Report (EIR)/Environmental Impact Study (EIS) called the Sacramento River Reliability Study. This study will evaluate a future surface water diversion off the Sacramento River that will be consistent with the Water Forum Agreement CAPITAL IMPROVEMENT PROGRAM J - 4
182 CITY OF SACRAMENTO UTILITIES PROGRAM OVERVIEW The City is actively involved in the Regional Water Authority, Sacramento Groundwater Authority, and Water Forum Successor Effort. The City has participated for more than twelve years in the Sacramento Water Forum to develop a regional water master plan. This effort resulted in the adoption of the Water Forum Agreement by the Mayor and City Council in November The Capital Improvement Program reflects elements of the Water Forum Agreement. Water Issues The City must continue to expand its water diversion and treatment capacity to meet regulatory requirements and increased future demands projected to occur within the City's sphere of influence and authorized place of use. Additional demand for treated water outside the City's authorized place of use will also be generated as a result of existing and future wholesale and wheeling agreements. SEWER (Fund 6006) The Sewer Enterprise Fund provides for the maintenance, repair, and replacement of facilities for collecting, conveying and pumping sanitary and combined sewage to the interceptor sewers of the Sacramento Regional County Sanitation District. User fees finance both operating costs and capital improvements. Program Goals The Department of Utilities established the following goals for implementation of the Sewer Fund capital improvement program: Provide for the safe and reliable collection and conveyance of wastewater. Ensure that the sewer collection and conveyance systems comply with all state and federal regulations. Ensure that expansion and extension of the sewer collection and pumping systems conform to the City's General Plan. Upgrade or replace existing sewer collection and pumping systems in conformance with sewer system master plans. Increase reliability and reduce maintenance costs by upgrading or replacing inadequate or deteriorated systems. Project Selection Criteria The Department of Utilities adopted the following criteria for initiating a capital improvement project in the Sewer Fund: Required by health, safety, or regulatory requirement. Reduce maintenance costs. Maintain existing facilities. Replace existing facilities. Meet demands of increased growth. Costs offset by grants or other revenue CAPITAL IMPROVEMENT PROGRAM J - 5
183 CITY OF SACRAMENTO UTILITIES PROGRAM OVERVIEW By measuring any approved project against these criteria, the Department directs its resources to those projects most cost-beneficial to the residents and businesses of the City. Summary of Project Types and Funding Distribution Type of Project Number of Projects FY09/10 Funding Regulatory 2 375,000 System Maintenance 6 425,000 Rehab Critical 4 1,600,000 Rehab Non-Critical 2 440,000 Technology 2 50,000 Other 3 425,000 Total 19 3,315,000 Overview The increasing age of the sewer infrastructure, especially in the combined system, remains a focus of the Sewer capital improvement program. The restrictions on raising drainage rates due to the passage of Proposition 218 is a factor that reduces the rehabilitation and improvement projects in the combined system since, in the past, these projects were partially funded by the Storm Drainage Fund. Since much of the combined system infrastructure is original, some more than 100 years old, its performance and reliability have been reduced due to wear and tear, thereby increasing the amount of maintenance effort. Other portions of the system, particularly areas of North Sacramento, also require increasing amounts of rehabilitation due to age. In the Pocket Area and other low lying regions, infiltration and inflow of rainfall and groundwater into the sewer pipes cause excess flows in the pipes and is another focus of concern. Finally, there is increasing scrutiny from regulators including EPA and the State Water Quality Control Board that is likely to result in new requirements including capacity analysis, greater closed circuit television inspection, and more spending. Major Projects The Sewer project receiving new or additional significant funding in FY2009/10 is: Sump 85 Influent Pipe Rehab/Replacement (X ): Funding is added in FY2009/10 for the construction portion of this project. The 24-inch diameter influent pipe, which collects flows from a large portion of north Sacramento, has been found to have major cracks and sags and is in danger of collapse. It is necessary to restore the reliability of this pipe to ensure continued service to this area and to protect the public from major sanitary sewer overflows. Operating Budget Impact Sewer system improvements and replacement or rehabilitation of sewer conveyance pipes, sewer pumps, and other facilities have no measurable operating budget impact. The effect of these projects is to reduce maintenance efforts in problematic portions of the system and to reallocate resources to other locations. Master Planning Master planning studies identify deficiencies in the sewer and combined systems and prioritize rehabilitation and replacement needs. Master planning also identifies new facilities and mitigation required by development projects that add flows to the system. The master planning goal of the CAPITAL IMPROVEMENT PROGRAM J - 6
184 CITY OF SACRAMENTO UTILITIES PROGRAM OVERVIEW Department of Utilities is to provide a reliable sewer collection system that will meet the needs of the community, prevent sanitary sewer overflows, and effectively conveys wastewater to the County's regional sewer interceptors. Meeting this goal will require rehabilitation and improvements to existing facilities and development of new facilities, which will be designed to handle both the peak sewage flows as well as infiltration flows. Flow monitoring is done to measure flows at critical locations in pipes and to establish rainfall to infiltration/inflow relationships. Observation of the system by closed circuit television of the pipes and direct visual inspection of manholes is also used to identify defects and relative quantity of non-sewage water in the pipes. In addition, a new Waste Discharge Requirement, currently being proposed by the State Water Quality Control Board, requires a comprehensive capacity assurance plan for the entire separated sewer system. Asset Management - Sewer As infrastructure assets continue to age and deteriorate, the need to restore parts of the sewer system is becoming of higher significance to the city. Much of the city, especially in the combined system, is served by a sewer infrastructure that is beyond its useful life. Aging sewer system components such as pipelines, sewer services, and electrical equipment become more difficult to maintain and the level of service provided by these components becomes less reliable. As a result, the City is utilizing an asset management process for its capital improvement program to systematically prioritize and rank its rehabilitation and replacement needs ensuring long-term sustainability of the sewer system infrastructure and its ability to deliver the required level of service continuously. While the City faces many challenges ahead, asset management programs with long-range planning, life-cycle costing, proactive operations and maintenance, long term funding strategies, and capital replacement plans based on cost-benefit analysis can be the most efficient method of meeting this challenge. Sewer Issues The s Combined Sewer System (CSS) is the portion of the city s sewer system that conveys both sanitary sewage and storm water in the same pipelines. The CSS encompasses approximately 7,500 acres of the Downtown, East Sacramento, and Land Park areas. An additional area of approximately 3,700 acres encompassing the River Park, California State University, and far eastern Sacramento areas contribute only sanitary sewage flows to the CSS. The City discontinued the practice of building combined sanitary sewage and storm water sewer systems in 1946 except for infill development within the existing combined system. The City initiated a comprehensive CSS Improvement Plan in July 1995 after extensive studies, which were instigated subsequent to a Cease and Desist Order issued to the City in June The Cease and Desist Order required the City to eliminate outflows to the city streets and non-permitted combined sewer overflows (CSOs) to the Sacramento River from the CSS. To satisfy the Cease and Desist Order, the City submitted to the Regional Water Quality Control Board (RWQCB) in July 1995 a CSS Improvement Plan that would reduce outflows and flooding throughout the CSS service area and reduce CSOs to the Sacramento River. The initial phase of the CSS Improvement Plan, currently underway, is estimated to cost $132 million. Most of the large projects have been completed, including: Sump 2 Improvement, Sump 1/1A and CAPITAL IMPROVEMENT PROGRAM J - 7
185 CITY OF SACRAMENTO UTILITIES PROGRAM OVERVIEW Pioneer Reservoir Improvements, 42 nd Street Storage, UC Davis Med Center, Tahoe Broadway Parallel Sewer, Land Park Relief, and others. Planning efforts and preliminary engineering have commenced for the following improvements to the CSS: Underground storage at the old Union Pacific Railroad yard near Sacramento City College Improvements to the Combined Wastewater Treatment Plant on 35 th Avenue. Underground storage or other improvements in the 65 th Street and Oak Park areas. Rehabilitation of various portions of the collection system. Increasing the size of a network of CSS interceptors in the downtown area, primarily in 5 th Street, 7 th Street, S Street, and L Street. City staff has obtained additional funding for the CSS Improvement Program from several sources, including $10.5 million in federal grants and $53 million in low-interest loans from the State Revolving Fund administered by the State Water Resources Control Board. The current CIP budget includes additional funding to the existing project, titled Combined System Improvement Plan Update, that will initiate work on an updated and more precise computer model of the system and commence work on a new plan to guide future improvement projects. Infiltration and Inflow More focused planning efforts have been initiated recently to address the need to reduce infiltration and inflow, especially in low-lying areas close to the Sacramento River. These planning efforts include flow monitoring during both the rainy season and the summer and fall, and visual inspection of manholes. As a member of the Sacramento County Regional Sanitation District, the City is cooperating in a regional effort to reduce infrastructure and inflow in order to reduce the need for the District to construct more interceptors and treatment capacity. SOLID WASTE (Fund 6007) The Solid Waste Fund is an enterprise fund that is financially responsible for the operation and maintenance of the city's refuse collection and disposal services and related capital improvement projects. Services generally include the collection of garbage, garden refuse, and recycling, as well as street sweeping and a variety of related community service programs (intra-city services). Revenues are generated from fees charged for service. Solid Waste funds are also used to finance landfill site post-closure expenses including the Landfill Site Closure capital improvement project, as required by state law. Program Goals The Solid Waste Division established the following goals for implementation of the Solid Waste Fund capital improvement program: Provide for safe and environmentally sound landfill closure and maintenance including groundwater remediation, landfill gas control, and landfill maintenance. Provide a portion of funds for cross-departmental projects. Provide for cost-effective collection and transport of solid waste through equipment purchase CAPITAL IMPROVEMENT PROGRAM J - 8
186 CITY OF SACRAMENTO UTILITIES PROGRAM OVERVIEW Project Selection Criteria The Solid Waste Division adopted the following criteria for initiating a capital improvement project in the Solid Waste Fund: Helps meet and/or is required by state and federal law. Meets demand of increased growth and/or equipment and technology requirements. Offset by user fees. Summary of Project Types and Funding Distribution Type of Project Number of Projects FY09/10 Funding Regulatory 2 717,000 Total 2 717,000 Operating Budget Impact The FY2009/10 Solid Waste budget contains funding for the closure of the two landfills in the amount of $717,000. The five year program includes funding for the old landfill project each year and also includes funding in an existing project for new equipment necessary to add new routes due to the significant growth in the North area. Any vehicles added result in increases to fuel and maintenance costs in the operating budget. STORM DRAINAGE (Fund 6011) The Storm Drainage Enterprise Fund supports the operations, maintenance, repair, and rehabilitation of the storm drainage system. This system consists of in-ground pipes, 90 storm drainage pumping stations, ditches, channels, and secondary levees. Revenues are generated primarily by user fees. Program Goals The Department of Utilities established the following goals for implementation of the Storm Drainage Fund capital improvement program: Provide for the safe and reliable collection and conveyance of storm water runoff. Prevent streets from flooding higher than the top of the curb during 10-year return storms, and prevent flooding of structures during 100-year return storms at complete build out in each drainage basin. Ensure the storm drainage collection system complies with all government regulations. Ensure that expansion of the storm drainage collection and pumping systems conforms to the City's General Plan. Upgrade or replace existing storm drainage collection and pumping systems in conformance with storm drainage master plans. Increase reliability and reduce maintenance costs by upgrading or replacing inadequate or deteriorated systems. Project Selection Criteria The Department of Utilities adopted the following criteria for initiating a capital improvement project in the Storm Drainage Fund: CAPITAL IMPROVEMENT PROGRAM J - 9
187 CITY OF SACRAMENTO UTILITIES PROGRAM OVERVIEW Required by health, safety, or regulatory requirement. Maintain existing facilities. Replace existing facilities. Meet demands of increased growth. Costs offset by grants or other revenue. By measuring any approved project against these criteria, the Department directs its resources to those projects most cost-beneficial to the residents and businesses of the city. Summary of Project Types and Funding Distribution Type of Project Number of Projects FY09/10 Funding Regulatory 3 1,395,000 Rehab Critical 3 30,000 Total 6 1,425,000 Overview The effect of Proposition 218, which requires that drainage rate increases be approved by a vote of the property owners, and the ever-increasing cost of regulatory compliance, continues to have a serious impact on the capital improvement program. As a result, there will be no funding available next fiscal year for capital projects in drainage, and there will be decreased funding available to maintain the present system. Major Projects There are no major new construction projects being funded in FY2009/10 and none in the foreseeable future. Instead, all the funding will be used for ongoing contracts needed to comply with the City s National Pollution Discharge Elimination System (NPDES) Permit and regulatory efforts. Operating Budget Impact Without any capital projects to replace or rehabilitate critical drainage facilities such as pipes, electrical facilities, pump stations, and other facilities, the requirement for maintenance will increase. Without rate increases or other funding sources, funding for such maintenance will also continue to decrease over time due to inflation. The expected result is increased flooding, particularly in the most vulnerable areas. Asset Management Storm Drainage Since the passage of Proposition 218 in 1996, drainage rates have been frozen and the storm drainage system has seen a significant drop in its capital improvement program. Rising operation and maintenance and regulatory compliance costs now consume almost all of the storm drainage fund revenues. While funding is limited, the storm drainage infrastructure continues to age and decline at a level far surpassing the available funding needed to maintain the level of service adopted by the City Council. Without rate increases or other funding sources, no funding for capital improvement projects will be available, further impacting the reliability of the drainage system. To effectively and efficiently allocate drainage funding, the City is utilizing an asset management process for its capital improvement program to systematically prioritize and rank its rehabilitation and replacement needs. Assuming that the funding issues are eventually resolved, this approach will CAPITAL IMPROVEMENT PROGRAM J - 10
188 CITY OF SACRAMENTO UTILITIES PROGRAM OVERVIEW ensure the long-term sustainability of the drainage system infrastructure and its ability to deliver the required level of service perpetually. While the City faces many challenges ahead, asset management programs with long-range planning, life-cycle costing, proactive operations and maintenance, long term funding strategies, and capital replacement plans based on cost-benefit analysis can be the most efficient method of meeting this challenge. Master Planning The master planning goal of the Department of Utilities is to provide a safe, reliable drainage system that will meet the needs of a growing community so that, within all parts of the city, the 10-year water surface will not rise above the top of the curb and the 100-year water surface will not rise above the first floor of any structure. For new development, drainage facilities will be designed so that the ten-year water surface will be 6 inches below the drainage inlets and the 100-year water surface will be 12 inches below the first floor of any structure. Existing areas with inadequate drainage systems are subject to flooding, inundated streets, homes, or garages. In some cases, homes have been flooded due to loss of electrical power. Our master planning program has identified critical areas in an attempt to respond to these concerns in a cohesive, organized manner. Past planning efforts of the Department of Utilities for the storm drainage Capital Improvement Program have been detailed in the "Utility Infrastructure Report," November 1995, presented to the City Council in January 1996 and updated in January Master plans have been completed for all the A (highest) priority basins, save one, and for a number of B priority and C priority basins where problem areas have been identified based on flooding and subsequent analysis. North Sacramento, Hollywood Park, Franklin Boulevard, River Park, Valley Hi, Hagginwood, Woodlake/Ben Ali, 65 th Street, Colonial Village, McClellan Heights, Campus Commons, Golf Course Terrace, Robla, Del Paso Heights, Strawberry Manor and others have received master planning efforts which have identified and prioritized needed improvements: detention facilities, increased pump station capacities, and enlarged pipes. However, due to lack of funding these prioritized improvements will be postponed until funding for design and construction becomes available. There is currently no funding available to complete master planning of the remaining critical basins throughout the city CAPITAL IMPROVEMENT PROGRAM J - 11
189 CITY OF SACRAMENTO UTILITIES PROGRAM OVERVIEW CAPITAL IMPROVEMENT PROGRAM J - 12
190 FLOOD CONTROL PLANNING W Project Description To monitor activity to develop and execute flood control projects relating to the city. Project Objectives To ensure that the city has adequate protection from floods. To ensure that the City's interests are represented when flood control projects are studied, designed, and constructed at the regional, state, and federal levels. Existing Situation Operating Budget Impact The City needs to dedicate specific resources to coordinating flood control projects that can be funded through the Sacramento Area Flood Control Agency (SAFCA), the State of California, and the federal government. None. Fund 6011 Budget through Est Balance Fund Source 6/2009 6/ / / / / /14 STORM DRAINAGE $2,318,933 $0 $220,000 $0 $0 $0 $0 This Project Total $2,318,933 $0 $220,000 $0 $0 $0 $ Funding Estimated Project Cost FY2009/10 Funding Prior Year Expenditures Project Start date Estimated Complete date Elapsed Time Percent Complete $220,000 $2,538,933 $220,000 $2,318,933 July 1997 Council District Neighborhood Area Planning Area Project Location Project Manager City Wide Utilities Project Number W WG01 JJ - 1
191 Project Description FLOODPLAIN MANAGEMENT W Operation of a program to reduce flood damage, including floodplain management regulations, public information and education, and participation in the FEMA National Flood Insurance Program and Community Rating System. Project Objectives Existing Situation Operating Budget Impact Ensure compliance with the City's floodplain management regulations; regulating development in flood hazard areas to ensure that such development will not aggravate existing flooding conditions and that new buildings will be protected from flood damage. The City has been involved in the National Flood Insurance Program since January 1975 and with FEMA's Community Rating System (CRS) since December 1990, and continues to implement those activities credited under its modified CRS application. None. Fund 6011 Budget through Est Balance Fund Source 6/2009 6/ / / / / /14 STORM DRAINAGE $3,045,480 $148,658 $175,000 $0 $0 $0 $0 This Project Total $3,045,480 $148,658 $175,000 $0 $0 $0 $ Funding Estimated Project Cost FY2009/10 Funding Prior Year Expenditures Project Start date Estimated Complete date Elapsed Time Percent Complete $175,000 $3,220,480 $175,000 $2,896,822 July 1996 Council District Neighborhood Area Planning Area Project Location Project Manager City Wide Utilities Project Number W WG06 JJ - 2
192 Project Description Project Objectives I-5 FREEWAY LANDSCAPE W This project consists of designing and installing landscaping improvements conforming to the North Natomas Landscape Corridor guidelines as approved by the City Council To develop a landscape corridor as a gateway to the city and to enhance open space and create an aesthetic view shed between the freeway and adjacent lands. Existing Situation Operating Budget Impact This is a newly developing buffer in North Natomas in need of landscaping improvements. None Fund Budget through Est Balance Fund Source 6/2009 6/ / / / / /14 N. NATOMAS COMM. IMPR. $5,204,368 $4,091,130 $998,592 $0 $0 $0 $0 PARK DEVELOPMENT $231,070 $0 This Project Total $5,435,438 $4,091,130 $998,592 $0 $0 $0 $ Funding Estimated Project Cost FY2009/10 Funding Prior Year Expenditures Project Start date Estimated Complete date Elapsed Time Percent Complete $998,592 $6,434,030 $998,592 $1,344,308 January 2005 June 2010 Council District Neighborhood Area Planning Area Project Location Project Manager 1 4 I-5 Between San Juan Road And Elkhorn Blvd. Utilities Project Number W JJ - 3
193 SUMP 115 ELECTRICAL REHAB W Project Description Replace electrical equipment at Sump 115. Project Objectives Protect public health and safety by improving reliability of the pump station. Existing Situation Existing electrical equipment is antiquated, making repair difficult due to the lack of available parts. Failure of electrical equipment would cause stormwater to back up into streets and properties. Operating Budget None Impact Fund 6011 Budget through Est Balance Fund Source 6/2009 6/ / / / / /14 STORM DRAINAGE $0 $0 $10,000 $0 $0 $0 $0 This Project Total $0 $0 $10,000 $0 $0 $0 $ Funding Estimated Project Cost FY2009/10 Funding Prior Year Expenditures Project Start date Estimated Complete date Elapsed Time Percent Complete $10,000 $10,000 $10,000 $0 July 2009 January 2011 Council District Neighborhood Area Planning Area Project Location Project Manager Brookfield Drive Near Franklin Boulevard Utilities, Dave Hansen Project Number W JJ - 4
194 SUMP 47 ELECTRICAL REHAB W Project Description Replace electrical equipment at Sump 47. Project Objectives Protect public health and safety by improving reliability of the pump station. Existing Situation Existing electrical equipment is antiquated, making repair difficult due to the lack of available parts. Failure of electrical equipment would cause stormwater to back up into streets and properties. Operating Budget None Impact Fund 6011 Budget through Est Balance Fund Source 6/2009 6/ / / / / /14 STORM DRAINAGE $0 $0 $10,000 $0 $0 $0 $0 This Project Total $0 $0 $10,000 $0 $0 $0 $ Funding Estimated Project Cost FY2009/10 Funding Prior Year Expenditures Project Start date Estimated Complete date Elapsed Time Percent Complete $10,000 $10,000 $10,000 $0 July 2009 January 2011 Council District Neighborhood Area Planning Area Project Location Project Manager th Street Between South Land Park Drive And Swenson Way Utilities, Dave Hansen Project Number W JJ - 5
195 SUMP 117 ELECTRICAL REHAB W Project Description Replace electrical equipment at Sump 117. Project Objectives Protect public health and safety by improving reliability of the pump station. Existing Situation Existing electrical equipment is antiquated, making repair difficult due to the lack of available parts. Failure of electrical equipment would cause stormwater to back up into streets and properties. Operating Budget None Impact Fund 6011 Budget through Est Balance Fund Source 6/2009 6/ / / / / /14 STORM DRAINAGE $0 $0 $10,000 $0 $0 $0 $0 This Project Total $0 $0 $10,000 $0 $0 $0 $ Funding Estimated Project Cost FY2009/10 Funding Prior Year Expenditures Project Start date Estimated Complete date Elapsed Time Percent Complete $10,000 $10,000 $10,000 $0 July 2009 January 2011 Council District Neighborhood Area Planning Area Project Location Project Manager Bell Ave. Inside The Village Green Mobile Park Utilities, Dave Hansen Project Number W JJ - 6
196 Project Description Project Objectives Existing Situation Operating Budget Impact FY10-FY14 NPDES STORMWATER PROGRAM W Develop, implement, and enforce various programs mandated under federal National Pollution Discharge Elimination System (NPDES) regulations for stormwater runoff. Reduce pollutants in stormwater runoff to the maximum extent practicable and protect local rivers and creeks. The City is required by permit and law to comply with federal and state regulations regarding stormwater runoff under its current NPDES permit. None Fund 6011 Budget through Est Balance Fund Source 6/2009 6/ / / / / /14 STORM DRAINAGE $0 $0 $1,000,000 $1,000,000 $1,000,000 $1,000,000 $1,000,000 This Project Total $0 $0 $1,000,000 $1,000,000 $1,000,000 $1,000,000 $1,000, Funding Estimated Project Cost FY2009/10 Funding Prior Year Expenditures Project Start date Estimated Complete date Elapsed Time Percent Complete $5,000,000 $5,000,000 $1,000,000 $0 July 2009 June 2014 Council District Neighborhood Area Planning Area Project Location Project Manager Citywide Utilities, Sherill Huun Project Number W JJ - 7
197 Project Description Project Objectives SEWER SYS REHABILITATION X Provide funds for unforeseen needs for sewer additions or replacements in various locations throughout the city. The scope of work will not exceed $50,000 per location. Having the flexibility to augment project budgets for small scale rehabilitation projects or sewer system projects provides the most cost-effective solution to an unforeseen sewer problem. Existing Situation Operating Budget Impact During the year it may become necessary to resolve an unanticipated failure in the sewer collection system. This can be accomplished with funding in this project when the cost does not exceed $50,000. None Fund 6006 Budget through Est Balance Fund Source 6/2009 6/ / / / / /14 SEWER $1,352,052 $155,980 $75,000 $789,725 $900,000 $1,000,000 $1,100,000 This Project Total $1,352,052 $155,980 $75,000 $789,725 $900,000 $1,000,000 $1,100, Funding Estimated Project Cost FY2009/10 Funding Prior Year Expenditures Project Start date Estimated Complete date Elapsed Time Percent Complete $3,864,725 $5,216,777 $75,000 $1,196,072 July 1985 Council District Neighborhood Area Planning Area Project Location Project Manager Various Utilities Project Number X XB16 JJ - 8
198 Project Description Project Objectives Existing Situation PUMP STATIONS RADIO TELEMETRY X To implement a Supervisory Control and Data Acquisition (SCADA) system, which will allow Wastewater and Drainage operations to monitor and control system operations from a central location. To improve Wastewater and Drainage operations and improve system efficiency. The telemetry base station is connected to remote sewer and storm pumping stations by land telephone lines, transmitting critical operating data, allowing staff to remotely monitor pumping stations operations. The system has had numerous failures. Operating Budget Impact There is no operating budget impact because resources will be reallocated to other needs. Fund Budget through Est Balance Fund Source 6/2009 6/ / / / / /14 SEWER $1,866,500 $0 $25,000 $0 $0 $0 $0 STORM DRAINAGE $3,676,500 $188,760 This Project Total $5,543,000 $188,760 $25,000 $0 $0 $0 $ Funding Estimated Project Cost FY2009/10 Funding Prior Year Expenditures Project Start date Estimated Complete date Elapsed Time Percent Complete $25,000 $5,568,000 $25,000 $5,354,240 July 1985 June 2012 Council District Neighborhood Area Planning Area Project Location Project Manager Various Utilities, Dave Hansen Project Number X XB21 JJ - 9
199 Project Description Project Objectives SEWER PUMP STATION REHAB X Construct various sewer pump station additions or improvements in various locations throughout the city. The scope of work will not exceed $50,000 per location. To ensure public health and safety by the prompt rehabilitation of inoperative wastewater pumping stations or equipment. Existing Situation Operating Budget Impact Not all needs can be foreseen in the Capital Improvement Plan. During the year, problems arise at pumping facilities that require the expenditure of capital funds in order to solve them. Any funds not obligated at the end of the fiscal year will be defunded, None Fund 6006 Budget through Est Balance Fund Source 6/2009 6/ / / / / /14 SEWER $2,019,126 $130,209 $25,000 $500,000 $500,000 $500,000 $500,000 This Project Total $2,019,126 $130,209 $25,000 $500,000 $500,000 $500,000 $500, Funding Estimated Project Cost FY2009/10 Funding Prior Year Expenditures Project Start date Estimated Complete date Elapsed Time Percent Complete $2,025,000 $4,044,126 $25,000 $1,888,917 July 1985 Council District Neighborhood Area Planning Area Project Location Project Manager Various Utilities Project Number X XB46 JJ - 10
200 BASE CIP RESERVE - SEWER X Project Description Reserve sewer funds for unforeseen capital program needs. Project Objectives To facilitate the completion of capital projects by reserving appropriations for minor overruns, and to provide a source of funds for small projects that could not be anticipated before the start of the fiscal year. Existing Situation Operating Budget Impact It is prudent to maintain a capital program reserve, renewed annually as needed, as a source of funding should the need arise to create a new project or to provide additional funding for an existing project due to previously unforeseen conditions. None Fund 6006 Budget through Est Balance Fund Source 6/2009 6/ / / / / /14 SEWER $261,424 $261,424 $200,000 $200,000 $200,000 $200,000 $200,000 This Project Total $261,424 $261,424 $200,000 $200,000 $200,000 $200,000 $200, Funding Estimated Project Cost FY2009/10 Funding Prior Year Expenditures Project Start date Estimated Complete date Elapsed Time Percent Complete $1,000,000 $1,261,424 $200,000 $0 July 1991 Council District Neighborhood Area Planning Area Project Location Project Manager Citywide Utilities Project Number X XE01 JJ - 11
201 SEWER ASSET MGMNT PROGRAM X Project Description Continue to collect and analyze data regarding the age and condition of sewer infrastructure. Project Objectives Determine the age and overall condition of all sewer pipes and pump stations in order to prioritize upcoming projects and to assess short and long-term funding needs for sewer infrastructure. Existing Situation Operating Budget Impact Precise information is not readily available for assessment and analysis. None Fund 6006 Budget through Est Balance Fund Source 6/2009 6/ / / / / /14 SEWER $100,000 $55,747 $25,000 $0 $0 $0 $0 This Project Total $100,000 $55,747 $25,000 $0 $0 $0 $ Funding Estimated Project Cost FY2009/10 Funding Prior Year Expenditures Project Start date Estimated Complete date Elapsed Time Percent Complete $25,000 $125,000 $25,000 $44,253 July 2007 December 2012 Council District Neighborhood Area Planning Area Project Location Project Manager Citywide Utilities Project Number X XJ11 JJ - 12
202 Project Description FLOW MONITORING/HYDROLOGY CONTRACTS X Contract with outside vendor to provide flow monitoring services, including installation and maintenance of city-owned flow meters, and interpretation of data. In addition, contract with vendor to provide customized doppler radar hydrologic data. Project Objectives Existing Situation Operating Budget Impact Measure and interpret flow data and provide detailed rainfall data for sewer planning. Without flow data and accurate rainfall data, staff cannot accurately assess system performance and plan future projects. None Fund 6006 Budget through Est Balance Fund Source 6/2009 6/ / / / / /14 SEWER $100,000 $81,250 $50,000 $0 $0 $0 $0 This Project Total $100,000 $81,250 $50,000 $0 $0 $0 $ Funding Estimated Project Cost FY2009/10 Funding Prior Year Expenditures Project Start date Estimated Complete date Elapsed Time Percent Complete $50,000 $150,000 $50,000 $18,750 July 2008 July 2009 Council District Neighborhood Area Planning Area Project Location Project Manager Citywide Utilities, Rick Batha Project Number X JJ - 13
203 SUMP 85 INFLUENT PIPE REPLACEMENT/REHAB X Project Description Replace and/or rehabilitate existing 24-inch diameter trunk sewer that routes sewage to Sump 85. Project Objectives Protect public health and safety and improve reliability by replacing a deteriorating, critical pipeline that serves a large neighborhood. Existing Situation Operating Budget Impact The pipe has cracked and failed in numerous places, causing it to be unreliable and allowing extraneous groundwater into the system. Fund 6006 Budget through Est Balance Fund Source 6/2009 6/ / / / / /14 SEWER $100,000 $98,786 $1,100,000 $0 $0 $0 $0 This Project Total $100,000 $98,786 $1,100,000 $0 $0 $0 $ Funding Estimated Project Cost FY2009/10 Funding Prior Year Expenditures Project Start date Estimated Complete date Elapsed Time Percent Complete $1,100,000 $1,200,000 $1,100,000 $1,214 July 2008 December 2010 Council District Neighborhood Area Planning Area Project Location Project Manager 2 4 In Backyard Easements And Open Ground From Arcade Boulevard South To Santiago Avenue Utilities, Rick Batha Project Number X JJ - 14
204 Project Description Project Objectives SANITARY SEWER MANAGEMENT PLAN X Produce a sanitary sewer management plan in accordance with recently adopted statewide sanitary sewer systems permit. Plan will meet all requirements stipulated in the permit and help guide staff to improve performance of sewer system and reduce sanitary sewer overflows. Existing Situation Operating Budget Impact There is currently no comprehensive plan. None Fund 6006 Budget through Est Balance Fund Source 6/2009 6/ / / / / /14 SEWER $75,000 $5,000 $75,000 $0 $0 $0 $0 This Project Total $75,000 $5,000 $75,000 $0 $0 $0 $ Funding Estimated Project Cost FY2009/10 Funding Prior Year Expenditures Project Start date Estimated Complete date Elapsed Time Percent Complete $75,000 $150,000 $75,000 $70,000 July 2008 July 2010 Council District Neighborhood Area Planning Area Project Location Project Manager Citywide Utilities, Delia McGrath Project Number X JJ - 15
205 Project Description Project Objectives ROOT CONTROL PROGRAM 2010 X This is an annual contract to apply chemicals to sewer pipes that have been found to contain excessive tree roots in order to control future growth of roots. To control growth of tree roots that have entered sewer mains, causing blockages, and potential sanitary sewer overflows, and impairing service. Existing Situation Operating Budget Impact Older sewer mains, especially those located in backyard easements under trees, tend to clog with tree roots resulting in backups and excessive maintenance. Fund 6006 Budget through Est Balance Fund Source 6/2009 6/ / / / / /14 SEWER $0 $0 $100,000 $0 $0 $0 $0 This Project Total $0 $0 $100,000 $0 $0 $0 $ Funding Estimated Project Cost FY2009/10 Funding Prior Year Expenditures Project Start date Estimated Complete date Elapsed Time Percent Complete $100,000 $100,000 $100,000 $0 July 2009 January 2011 Council District Neighborhood Area Planning Area Project Location Project Manager Citywide Utilities, Rick Batha Project Number X JJ - 16
206 Project Description Project Objectives SEWER SERVICE LINING 2010 X Rehabilitate by internally lining the portion of existing sewer services between the property line and the sewer main in various portions of the city. Protect public health, improve service, and prevent sanitary sewer overflows that result from deteriorated sewer services. Existing Situation Operating Budget Impact Via customer complaints, City crews encounter various sewer services that have failed, causing back-ups and occasional sanitary sewer overflows. None Fund 6006 Budget through Est Balance Fund Source 6/2009 6/ / / / / /14 SEWER $0 $0 $100,000 $0 $0 $0 $0 This Project Total $0 $0 $100,000 $0 $0 $0 $ Funding Estimated Project Cost FY2009/10 Funding Prior Year Expenditures Project Start date Estimated Complete date Elapsed Time Percent Complete $100,000 $100,000 $100,000 $0 July 2009 January 2011 Council District Neighborhood Area Planning Area Project Location Project Manager Citywide Utilities, Rick Batha Project Number X JJ - 17
207 CSS IMPROVEMENT PLAN UPDATE X Project Description Begin scoping efforts for an update of the Combined Sewer System (CSS) Improvement Plan Project Objectives Determine a scope for contracting with a consulting firm to update the Combined System Improvement Plan that was completed June Existing Situation Operating Budget Impact Since completion of the 1995 Combined System Improvement Plan, the City has completed much of the work proposed in the Plan, and new guidelines for future improvements are needed. None. Fund Budget through Est Balance Fund Source 6/2009 6/ / / / / /14 SEWER $571,400 $30,176 $300,000 $0 $0 $0 $0 STORM DRAINAGE $2,500 $2,500 This Project Total $573,900 $32,676 $300,000 $0 $0 $0 $ Funding Estimated Project Cost FY2009/10 Funding Prior Year Expenditures Project Start date Estimated Complete date Elapsed Time Percent Complete $300,000 $873,900 $300,000 $541,224 July 2006 July 2012 Council District Neighborhood Area Planning Area Project Location Project Manager 1, 3, 4, 5, 6 1, 2 In Combined Sewer System, Which Is Located North Of Sutterville Road, West Of 65th Street And Utilities Project Number X XN44 JJ - 18
208 Project Description Project Objectives Existing Situation Operating Budget Impact CSS MISCELLANEOUS REHAB X Repair combined sewer system (CSS) collection lines that are deteriorated and do not require significant engineering. To ensure public health and safety by promptly repairing or replacing damaged combined system mains. Within the combined system, there are numerous locations at which spot rehabilitation can be accomplished with minimal engineering and construction effort. None. Fund Budget through Est Balance Fund Source 6/2009 6/ / / / / /14 SEWER $1,000,986 $137,871 $75,000 $750,000 $1,615,196 $1,566,424 $1,518,420 STORM DRAINAGE $1,501,397 $0 This Project Total $2,502,383 $137,871 $75,000 $750,000 $1,615,196 $1,566,424 $1,518, Funding Estimated Project Cost FY2009/10 Funding Prior Year Expenditures Project Start date Estimated Complete date Elapsed Time Percent Complete $5,525,040 $8,027,423 $75,000 $2,364,512 July 1996 Council District Neighborhood Area Planning Area Project Location Project Manager 1, 3, 4, 5, 6 1, 2, 3 Throughout The Combined Sewer System Utilities Project Number X XM25 JJ - 19
209 Project Description Project Objectives Existing Situation Operating Budget Impact E/F ALLEY SEWER REPLACEMENT, 42ND TO LA PURISSIMA X Replace combined sewer main, service laterals, manholes, drain inlets, and drain leads and associated work. Protect public health and safety by ensuring reliable function of combined syewer and drainage system. Existing pipeline has failed, causing interrupted service to neighborhoods. None Fund 6006 Budget through Est Balance Fund Source 6/2009 6/ / / / / /14 SEWER $210,000 $0 $210,000 $0 $0 $0 $0 This Project Total $210,000 $0 $210,000 $0 $0 $0 $ Funding Estimated Project Cost FY2009/10 Funding Prior Year Expenditures Project Start date Estimated Complete date Elapsed Time Percent Complete $210,000 $420,000 $210,000 $210,000 July 2009 December 2010 Council District Neighborhood Area Planning Area Project Location Project Manager 3 1 The ey Between E And F Streets From 42nd Avenue To La Purissima Utilities, Rick Batha Project Number X JJ - 20
210 Project Description Project Objectives Existing Situation Operating Budget Impact 36/37 ALLEY SEWER REPLACEMENT, P TO R STREETS X Replace combined system main, service laterals, manholes, drain inlets and drain leads, and associated work. Protect public health by ensuring reliable function of combined sewer system. Existing main has major cracks, crushed portions, and generally has failed, making it prone to stoppages. None Fund 6006 Budget through Est Balance Fund Source 6/2009 6/ / / / / /14 SEWER $0 $0 $230,000 $0 $0 $0 $0 This Project Total $0 $0 $230,000 $0 $0 $0 $ Funding Estimated Project Cost FY2009/10 Funding Prior Year Expenditures Project Start date Estimated Complete date Elapsed Time Percent Complete $230,000 $230,000 $230,000 $0 July 2009 December 2010 Council District Neighborhood Area Planning Area Project Location Project Manager 3 1 In ey Between 36 And 37th Streets, From P To R Street Utilities, Rick Batha Project Number X JJ - 21
211 Project Description Project Objectives Existing Situation Operating Budget Impact 35TH/ SANTA YNEZ ALLEY SEWER REPLACEMENT, P TO R X Replace combined system main, service laterals, manholes, drain inlets and leads, and associated work. Protect public health by ensuring reliable function of combined system. Existing main has numerous crushed portions, causing unreliable service and excessive maintenance. None Fund 6006 Budget through Est Balance Fund Source 6/2009 6/ / / / / /14 SEWER $0 $0 $0 $140,000 $0 $0 $0 This Project Total $0 $0 $0 $140,000 $0 $0 $ Funding Estimated Project Cost FY2009/10 Funding Prior Year Expenditures Project Start date Estimated Complete date Elapsed Time Percent Complete $140,000 $140,000 $0 $0 July 2009 December 2010 Council District Neighborhood Area Planning Area Project Location Project Manager 3 1 In ey Between 35th Street And Santa Ynez Way, From P To R Street Utilities, Rick Batha Project Number X JJ - 22
212 Project Description Project Objectives Existing Situation Operating Budget Impact O/P ALLEY SEWER REPLACEMENT, 13TH TO 15TH X Replace combined system main, service laterals, manholes, drain inlets and leads, and associated work. Protect public health by ensuring reliable function of combined sewer system. The existing main has failed, with numerous sags and large cracks. None Fund 6006 Budget through Est Balance Fund Source 6/2009 6/ / / / / /14 SEWER $0 $0 $0 $225,000 $0 $0 $0 This Project Total $0 $0 $0 $225,000 $0 $0 $ Funding Estimated Project Cost FY2009/10 Funding Prior Year Expenditures Project Start date Estimated Complete date Elapsed Time Percent Complete $225,000 $225,000 $0 $0 July 2009 December 2010 Council District Neighborhood Area Planning Area Project Location Project Manager 4 1 In The ey Between O And P Streets, From 13th To 15th. Utilities, Rick Batha Project Number X JJ - 23
213 Project Description Project Objectives Existing Situation Operating Budget Impact MARSHALL WAY SEWER REPLACEMENT, 27TH TO FRANKLIN X Replace combined system main, service laterals, manholes, drain inlets and leads, and associated work. Protect public health by ensuring reliable function of combined sewer system. Existing combined sewer main has failed, with numerous sags and large cracks. None Fund 6006 Budget through Est Balance Fund Source 6/2009 6/ / / / / /14 SEWER $0 $0 $0 $260,000 $0 $0 $0 This Project Total $0 $0 $0 $260,000 $0 $0 $ Funding Estimated Project Cost FY2009/10 Funding Prior Year Expenditures Project Start date Estimated Complete date Elapsed Time Percent Complete $260,000 $260,000 $0 $0 July 2009 December 2010 Council District Neighborhood Area Planning Area Project Location Project Manager 5 1 In Marshall Way Between 27th Street And Franklin Boulevard Utilities, Rick Batha Project Number X JJ - 24
214 Project Description Project Objectives Existing Situation Operating Budget Impact T STREET SEWER REPLACEMENT, 19TH TO 21ST X Replace combined system main, service laterals, manholes, drain inlets and drain leads, and assosciated work. Protect public health by ensuring reliable function of combined sewer and drainage system. Existing main is deteriorated. None Fund 6006 Budget through Est Balance Fund Source 6/2009 6/ / / / / /14 SEWER $0 $0 $0 $300,000 $0 $0 $0 This Project Total $0 $0 $0 $300,000 $0 $0 $ Funding Estimated Project Cost FY2009/10 Funding Prior Year Expenditures Project Start date Estimated Complete date Elapsed Time Percent Complete $300,000 $300,000 $0 $0 July 2009 January 2010 Council District Neighborhood Area Planning Area Project Location Project Manager 3 1 In T Street From 19th To 21st Street Utilities, Rick Batha Project Number X JJ - 25
215 Project Description Project Objectives FREMONT AREA SEWER REHAB, PHASE 3 X Rehabilitate by internal lining, several of the combined sewer pipes in the Fremont Area. This is the third in a four phase project. To reduce infiltration into combined sewers to protect adjacent properties from sudden failures caused by deteriorated sewers. Existing Situation Operating Budget Impact The pipes are about 75 years old and deteriorated. High groundwater and loose, sandy soil have been known to infiltrate into the leaky pipes, destabilizing the ground. None Fund 6006 Budget through Est Balance Fund Source 6/2009 6/ / / / / /14 SEWER $0 $0 $450,000 $0 $0 $0 $0 This Project Total $0 $0 $450,000 $0 $0 $0 $ Funding Estimated Project Cost FY2009/10 Funding Prior Year Expenditures Project Start date Estimated Complete date Elapsed Time Percent Complete $450,000 $450,000 $450,000 $0 July 2009 January 2011 Council District Neighborhood Area Planning Area Project Location Project Manager 4 1 In Various Streets And Easements In The Northwest Portion Of Land Park Neighborhood, Utilities, Rick Batha Project Number X JJ - 26
216 Project Description Project Objectives CWTP ELECTRICAL REPLACEMENT MCC N X Replace deteriorated and unreliable motor control center (MCC), transfer switch, and associated electrical equipment that supports the Combined Wastewater Treatment Plant (CWTP) effluent pump station. Protect public health and safety and ensure compliance of the City s National Pollutant Discharge Elimination System (NPDES) permit by securing the continued function of the effluent pump station at the CWTP. Existing Situation Operating Budget Impact Electrical equipment is old, deteriorated, and difficult to repair and maintain. None Fund 6006 Budget through Est Balance Fund Source 6/2009 6/ / / / / /14 SEWER $0 $0 $25,000 $0 $0 $0 $0 This Project Total $0 $0 $25,000 $0 $0 $0 $ Funding Estimated Project Cost FY2009/10 Funding Prior Year Expenditures Project Start date Estimated Complete date Elapsed Time Percent Complete $25,000 $25,000 $25,000 $0 July 2009 January 2011 Council District Neighborhood Area Planning Area Project Location Project Manager 4 2 Combined Wastewater Treatment Plant, Located On 35th Avenue, Near South Land Park Drive Utilities, Dave Hansen Project Number X JJ - 27
217 Project Description Project Objectives CWTP ELECTRICAL MCC L X Replace deteriorated and unreliable motor control center (MCC), transfer switch, and associated electrical equipment that supports the Combined Wastewater Treatment Plant (CWTP) effluent pump station. Protect public health and safety and ensure compliance of the City s National Pollutant Discharge Elimination System (NPDES) permit by securing the continued function of the effluent pump station at the CWTP. Existing Situation Operating Budget Impact Electrical equipment is old, deteriorated, and difficult to repair and maintain. None Fund 6006 Budget through Est Balance Fund Source 6/2009 6/ / / / / /14 SEWER $0 $0 $25,000 $0 $0 $0 $0 This Project Total $0 $0 $25,000 $0 $0 $0 $ Funding Estimated Project Cost FY2009/10 Funding Prior Year Expenditures $25,000 $25,000 $25,000 $0 Project Start date Estimated Complete date Elapsed Time Percent Complete Council District Neighborhood Area Planning Area Project Location Project Manager th Ave Utilities, Dave Hansen Project Number X JJ - 28
218 Project Description Project Objectives Existing Situation Operating Budget Impact LANDFILL SITE CLOSURE PROGRAM Y The City Landfill is inspected by the State of California. State law requires that funding be budgeted each year. This budget is intended to ensure that there will be sufficient funds to cover future closure activities. Keep the closed City Landfill in compliance with the approved Final Closure/Post- Closure Plan. The City has completed the Landfill closure. However, as part of the annual 30-year post-closure care, the City must provide annual funds. None. Fund Budget through Est Balance Fund Source 6/2009 6/ / / / / /14 SOLID WASTE $2,231,799 $962,352 $217,000 $217,000 $217,000 $217,000 $217,000 LANDFILL CLOSURE $5,195,273 $0 This Project Total $7,427,072 $962,352 $217,000 $217,000 $217,000 $217,000 $217, Funding Estimated Project Cost FY2009/10 Funding Prior Year Expenditures Project Start date Estimated Complete date Elapsed Time Percent Complete $1,085,000 $8,512,072 $217,000 $6,464,720 July 1994 June 2012 Council District Neighborhood Area Planning Area Project Location Project Manager th Street Landfill Utilities Project Number Y YA06 JJ - 29
219 VEHICLES/ADDITIONAL ROUTES Y Project Description Ongoing program to provide sufficient resources for the purchase of additional vehicles for garbage service. Project Objectives Provide cost-effective and efficient service to all customers. Existing Situation The City is experiencing significant growth in the northern area. The Solid Waste Division cannot continue to meet service needs with the current fleet. Additional vehicles and new garbage routes in the northern sections of the City are needed. Operating Budget Impact Reduction in overtime by reducing some of the current longer routes. Fund 6007 Budget through Est Balance Fund Source 6/2009 6/ / / / / /14 SOLID WASTE $1,586,000 $147,554 $0 $200,000 $200,000 $200,000 $200,000 This Project Total $1,586,000 $147,554 $0 $200,000 $200,000 $200,000 $200, Funding Estimated Project Cost FY2009/10 Funding Prior Year Expenditures $800,000 $2,386,000 $0 $1,438,446 Project Start date Estimated Complete date Elapsed Time Percent Complete Council District Neighborhood Area Planning Area Project Location Project Manager Citywide Utilities Project Number Y YB61 JJ - 30
220 DELLAR LANDFILL CLOSURE Y Project Description Closure of Non-Sub Title D Landfill located directly west of the 28th Street Landfill Project Objectives Complete closure plan, grade to drain, and commence post-closure monitoring to comply with Regional Water Quality Control Board s Corrective Action Notice by completing work by September 2010 Existing Situation Operating Budget Impact There is an unclosed landfill with exposed rubble None. Fund 6007 Budget through Est Balance Fund Source 6/2009 6/ / / / / /14 SOLID WASTE $0 $0 $500,000 $0 $0 $0 $0 This Project Total $0 $0 $500,000 $0 $0 $0 $ Funding Estimated Project Cost FY2009/10 Funding Prior Year Expenditures Project Start date Estimated Complete date Elapsed Time Percent Complete $500,000 $500,000 $500,000 $0 July 2009 September 2010 Council District Neighborhood Area Planning Area Project Location Project Manager 3 1 North Of A Street Near 24th Street Utilities Project Number Y JJ - 31
221 Project Description Project Objectives WATER SYSTEM MISC IMPROVMT Z Install main extensions for circulation, pressure, and fire flow improvements as part of an annual program. Projects can be done directly from this project or funding can be transferred to another project. To maintain an efficient and reliable water distribution system. To minimize the number of small capital projects and the number of budget and accounting transactions needed to maintain projects. Existing Situation Operating Budget Impact The Department has funded several small water distribution capital improvements with a lower level of budget and accounting activity. None. Fund 6005 Budget through Est Balance Fund Source 6/2009 6/ / / / / /14 WATER $2,065,800 $699,175 $0 $845,001 $825,002 $915,003 $2,764,004 This Project Total $2,065,800 $699,175 $0 $845,001 $825,002 $915,003 $2,764, Funding Estimated Project Cost FY2009/10 Funding Prior Year Expenditures Project Start date Estimated Complete date Elapsed Time Percent Complete $5,349,010 $7,414,810 $0 $1,366,625 July 1986 Council District Neighborhood Area Planning Area Project Location Project Manager Various Utilities Project Number Z ZB31 JJ - 32
222 Project Description Project Objectives Existing Situation Operating Budget Impact COMMERCIAL WATER METER RETROFIT Z Retrofit water meters to existing commercial accounts without meters. This is an ongoing City program. To standardize revenue and ensure equity in water costs among similar businesses. This is an ongoing program to retrofit water meters to all commercial accounts. None. Fund 6005 Budget through Est Balance Fund Source 6/2009 6/ / / / / /14 WATER $5,822,351 $352,843 $350,000 $350,000 $350,000 $350,000 $350,000 This Project Total $5,822,351 $352,843 $350,000 $350,000 $350,000 $350,000 $350, Funding Estimated Project Cost FY2009/10 Funding Prior Year Expenditures Project Start date Estimated Complete date Elapsed Time Percent Complete $1,750,000 $7,572,351 $350,000 $5,469,508 July 1986 Council District Neighborhood Area Planning Area Project Location Project Manager Various Utilities Project Number Z ZB46 JJ - 33
223 WELL SYSTEM MISC IMPROV Z Project Description Miscellaneous improvements and maintenance on 43 wells operated by the Department. Project Objectives To enable repairs needed to continue operating efficiently. Existing Situation The Department recognized that numerous small projects required more financial monitoring than the level of the project warranted. The Department has designated a single project, funded annually, to do small capital improvements. Operating Budget Impact There will not be any additional costs to the operations budget; resources will be reallocated to other requirements. Fund 6005 Budget through Est Balance Fund Source 6/2009 6/ / / / / /14 WATER $1,361,000 $227,337 $0 $90,000 $90,000 $90,000 $0 This Project Total $1,361,000 $227,337 $0 $90,000 $90,000 $90,000 $ Funding Estimated Project Cost FY2009/10 Funding Prior Year Expenditures Project Start date Estimated Complete date Elapsed Time Percent Complete $270,000 $1,631,000 $0 $1,133,663 July 1990 Council District Neighborhood Area Planning Area Project Location Project Manager Various Utilities Project Number Z ZD26 JJ - 34
224 Project Description Project Objectives WATER SUPPLY MASTER PLAN Z Water System Master Planning includes planning of major transmission mains, pumping and storage facilities, and water supply. This is an ongoing program. Recommend water system improvements which are cost-effective and meet water system service goals. Recommend operational changes to reduce operation costs, or increase system efficiency and performance. Existing Situation Operating Budget Impact Currently, the water system supplies water in sufficient capacity and quality to meet the city's needs. Ongoing development has put demands on the system that need to be analyzed and planned for on a citywide basis to minimize impacts to the system. None. Fund 6005 Budget through Est Balance Fund Source 6/2009 6/ / / / / /14 WATER $2,839,587 $72,332 $250,000 $100,000 $100,000 $100,000 $100,000 This Project Total $2,839,587 $72,332 $250,000 $100,000 $100,000 $100,000 $100, Funding Estimated Project Cost FY2009/10 Funding Prior Year Expenditures Project Start date Estimated Complete date Elapsed Time Percent Complete $650,000 $3,489,587 $250,000 $2,767,255 July 1990 Council District Neighborhood Area Planning Area Project Location Project Manager Citywide Utilities Project Number Z ZD36 JJ - 35
225 Project Description SAC RIVER SOURCE WATER Z Conduct sanitary survey updates every 5 years to evaluate watershed contaminant sources and assess the level of treatment required, and conduct annual follow-up activities. The City of West Sacramento will cost share portions of work. Project Objectives Existing Situation Operating Budget Impact To comply with Article 7 of the California Surface Water Treatment Rule and to maintain safe drinking water quality and protect water supply from contaminants. The Cities of Sacramento and West Sacramento completed a sanitary survey update in December The is conducting a variety of activities as follow-up, including a boating education campaign and information collection on special topics. None. Fund Budget through Est Balance Fund Source 6/2009 6/ / / / / /14 CAPITAL GRANTS $383,436 $44,037 WATER $855,500 $40,486 $70,000 $102,000 $60,000 $60,000 $0 This Project Total $1,238,936 $84,523 $70,000 $102,000 $60,000 $60,000 $ Funding Estimated Project Cost FY2009/10 Funding Prior Year Expenditures Project Start date Estimated Complete date Elapsed Time Percent Complete $292,000 $1,530,936 $70,000 $1,154,413 July 1995 Council District Neighborhood Area Planning Area Project Location Project Manager Various Sites Along The Sacramento River Watershed Utilities Project Number Z ZE31 JJ - 36
226 Project Description Project Objectives SAC RIVER - KEEP OUR WATERS CLEAN (KOWC) PROGRAM Z To provide educational outreach to boaters and recreationalists regarding behaviors that help to keep local drinking water sources clean. To partner with other cities and water companies to keep local waterways clean by reducing the effects of boating and recreation on source water quality. Existing Situation Operating Budget Impact Sacramento and other local water companies and cities have partnered since 2000 in order to effect greater cleanliness in local waterways used for drinking water. Drawing cleaner water for water production results in reduced use of chemicals for purification. Fund Budget through Est Balance Fund Source 6/2009 6/ / / / / /14 CAPITAL GRANTS $36,000 $3,028 WATER $109,000 $22,168 $30,000 $31,000 $31,000 $31,000 $0 This Project Total $145,000 $25,196 $30,000 $31,000 $31,000 $31,000 $ Funding Estimated Project Cost FY2009/10 Funding Prior Year Expenditures Project Start date Estimated Complete date Elapsed Time Percent Complete $123,000 $268,000 $30,000 $119,804 February 2006 Council District Neighborhood Area Planning Area Project Location Project Manager Citywide Utilities Project Number Z ZE32 JJ - 37
227 BASE CIP RESERVE-WATER Z Project Description Reserve funds for unforeseen capital program needs. Project Objectives To facilitate completion of capital projects by reserving appropriations for minor overruns. To provide a source of funds for small projects that could not be anticipated before the start of the fiscal year. Existing Situation Operating Budget Impact It is prudent to maintain a capital program reserve, renewed annually as needed, as a source of funding should the need arise to create a new project or to provide additional funding for an existing project due to previously unforeseen conditions. None. Fund 6005 Budget through Est Balance Fund Source 6/2009 6/ / / / / /14 WATER $548,038 $548,038 $400,000 $400,000 $400,000 $400,000 $400,000 This Project Total $548,038 $548,038 $400,000 $400,000 $400,000 $400,000 $400, Funding Estimated Project Cost FY2009/10 Funding Prior Year Expenditures Project Start date Estimated Complete date Elapsed Time Percent Complete $2,000,000 $2,548,038 $400,000 $0 July 1995 Council District Neighborhood Area Planning Area Project Location Project Manager Citywide Utilities Project Number Z ZE46 JJ - 38
228 BACKFLOW PREVENTION DEVICE Z Project Description To purchase backflow prevention assemblies for City-owned facilities. Project Objectives To protect the city s water distribution system from possible contamination and bring City facilities into compliance with state cross-connection control regulations. Existing Situation Operating Budget Impact The California Health Code, Title 17, mandated that backflow prevention devices must be installed on water supply lines to prevent contamination of the water supply. Costs associated with the installation, testing and repair of the devices will be the responsibility of the department that owns the facilities where the backflow prevention devices are installed. Fund 6005 Budget through Est Balance Fund Source 6/2009 6/ / / / / /14 WATER $2,831,913 $593,150 $50,000 $205,000 $205,000 $205,000 $200,000 This Project Total $2,831,913 $593,150 $50,000 $205,000 $205,000 $205,000 $200, Funding Estimated Project Cost FY2009/10 Funding Prior Year Expenditures Project Start date Estimated Complete date Elapsed Time Percent Complete $865,000 $3,696,913 $50,000 $2,238,763 July 1994 Council District Neighborhood Area Planning Area Project Location Project Manager Citywide Utilities Project Number Z ZF26 JJ - 39
229 Project Description Project Objectives Existing Situation SCADA SYSTEM UPGRADE PROGRAM Z This is an ongoing project to replace the on-spec system to improve communications and access to information associated with the water distribution system and water production plants. To make operations of the water distribution system and water treatment plants more efficient. Deficiencies in the water distribution system are identified primarily through customer complaints. A Supervisory Control and Data Acquisition (SCADA) system will enable staff to monitor the system through remote sensors and to have remote control and monitoring of outlying wells. Operating Budget Impact None Fund 6005 Budget through Est Balance Fund Source 6/2009 6/ / / / / /14 WATER $2,726,000 $245,043 $100,000 $100,000 $100,000 $100,000 $100,000 This Project Total $2,726,000 $245,043 $100,000 $100,000 $100,000 $100,000 $100, Funding Estimated Project Cost FY2009/10 Funding Prior Year Expenditures $500,000 $3,226,000 $100,000 $2,480,957 Project Start date Estimated Complete date Elapsed Time Percent Complete Council District Neighborhood Area Planning Area Project Location Project Manager Citywide Utilities Project Number Z ZF36 JJ - 40
230 Project Description AMR RIVER SOURCE WATER Z Conduct sanitary survey updates every 5 years to evaluate watershed contaminant sources and assess the level of treatment required, and conduct annual follow-up activities. Other American River water purveyors will cost share portions of work. Project Objectives Existing Situation Operating Budget Impact To comply with Article 7 of the California Surface Water Treatment Rule; and to maintain safe drinking water quality and protect water supply from contaminants. The American River water purveyors completed a sanitary survey update in December The City of Sacramento is conducting a variety of activities as follow-up, such as a boating/restroom education campaign and information collection on special topics. None. Fund Budget through Est Balance Fund Source 6/2009 6/ / / / / /14 CAPITAL GRANTS $321,098 $446 WATER $366,500 $32,061 $15,000 $24,000 $27,000 $27,000 $0 This Project Total $687,598 $32,507 $15,000 $24,000 $27,000 $27,000 $ Funding Estimated Project Cost FY2009/10 Funding Prior Year Expenditures Project Start date Estimated Complete date Elapsed Time Percent Complete $93,000 $780,598 $15,000 $655,091 July 1998 Council District Neighborhood Area Planning Area Project Location Project Manager Various Sites Along The American River Watershed Utilities Project Number Z ZF61 JJ - 41
231 Project Description Project Objectives AMER RVR - KEEP OUR WATERS CLEAN (KOWC) PROGRAM Z This is an ongoing program to provide educational outreach to boaters and recreationalists regarding behaviors that help to keep local drinking water sources clean. To partner with other cities and water companies to keep local waterways clean by reducing the effects of boating and recreation on source water quality. Existing Situation Operating Budget Impact Sacramento and other local water companies and cities have partnered since 2000 in order to effect greater cleanliness in local waterways used for drinking water. Not quantifiable. Drawing cleaner water for water production results in reduced use of chemicals for purification. Fund Budget through Est Balance Fund Source 6/2009 6/ / / / / /14 CAPITAL GRANTS $50,000 $15,957 WATER $85,000 $12,975 $25,000 $26,000 $26,000 $26,000 $0 This Project Total $135,000 $28,932 $25,000 $26,000 $26,000 $26,000 $ Funding Estimated Project Cost FY2009/10 Funding Prior Year Expenditures Project Start date Estimated Complete date Elapsed Time Percent Complete $103,000 $238,000 $25,000 $106,068 February 2006 Council District Neighborhood Area Planning Area Project Location Project Manager Citywide Utilities Project Number Z ZF62 JJ - 42
232 UTILITIES ADA IMPROVEMENT Z Project Description To modify existing buildings for conformance to requirements of Americans with Disabilities Act (ADA). Project Objectives To bring existing buildings at th Avenue and Building #20 at the Corporation Yard up to ADA existing requirements. Existing Situation Operating Budget Impact Existing buildings and structures are not completely up to current ADA requirements. None. Fund Budget through Est Balance Fund Source 6/2009 6/ / / / / /14 WATER $80,000 $50,563 $5,000 $5,000 $5,000 $0 $0 SEWER $10,000 $7,387 SOLID WASTE $5,000 $5,000 STORM DRAINAGE $51,000 $31,671 This Project Total $146,000 $94,621 $5,000 $5,000 $5,000 $0 $ Funding Estimated Project Cost FY2009/10 Funding Prior Year Expenditures Project Start date Estimated Complete date Elapsed Time Percent Complete $15,000 $161,000 $5,000 $51,379 June 1999 June 2012 Council District Neighborhood Area Planning Area Project Location Project Manager Various Utilities Project Number Z ZG86 JJ - 43
233 Project Description Project Objectives DRINKING WATER QUALITY Z This project provides for source water regulatory efforts specific to the city's water production wells and common to both surface water and groundwater. This is an ongoing City program. To comply with source water requirements of the California Surface Water Treatment Rule and Clean Water Act. Existing Situation Operating Budget Impact The conducts studies and efforts to provide source water protection including required monitoring, tracking upcoming source water related regulations, and information collection on special topics. None. Fund 6005 Budget through Est Balance Fund Source 6/2009 6/ / / / / /14 WATER $1,335,996 $41,322 $85,000 $233,000 $341,000 $310,000 $0 This Project Total $1,335,996 $41,322 $85,000 $233,000 $341,000 $310,000 $ Funding Estimated Project Cost FY2009/10 Funding Prior Year Expenditures Project Start date Estimated Complete date Elapsed Time Percent Complete $969,000 $2,304,996 $85,000 $1,294,674 July 2000 Council District Neighborhood Area Planning Area Project Location Project Manager Various Utilities Project Number Z ZH41 JJ - 44
234 Project Description Project Objectives DISTRIBUTION FLUSHING PROGRAM Z Prepare a study that provides a systematic approach and schedule for flushing the city s water distribution mains. Develop a program to flush the city s water distribution system that will improve water quality and system hydraulics while minimizing impacts to customer service. Existing Situation Operating Budget Impact The City does not currently have a flushing program, but does flush mains when there is a water quality complaint. None required for the study. The flushing program may require additional O&M staff. Fund 6005 Budget through Est Balance Fund Source 6/2009 6/ / / / / /14 WATER $100,000 $99,351 $50,000 $0 $0 $0 $0 This Project Total $100,000 $99,351 $50,000 $0 $0 $0 $ Funding Estimated Project Cost FY2009/10 Funding Prior Year Expenditures Project Start date Estimated Complete date Elapsed Time Percent Complete $50,000 $150,000 $50,000 $649 July 2007 January 2010 Council District Neighborhood Area Planning Area Project Location Project Manager City Wide Utilities, Mike Malone Project Number Z ZH42 JJ - 45
235 GROUNDWATER PROTECTION PRGM Z Project Description Pilot project to determine best possible well site treatment technologies. Project Objectives To identify the level of and test technologies for well head treatment to meet future health regulations, particularly at sites with space constraints. Existing Situation Operating Budget Impact Currently, well water is chlorinated and fluoridated at the well head. New regulations may require treatment for other constituents, as well. None. Fund 6005 Budget through Est Balance Fund Source 6/2009 6/ / / / / /14 WATER $205,877 $198,719 $62,000 $0 $0 $0 $0 This Project Total $205,877 $198,719 $62,000 $0 $0 $0 $ Funding Estimated Project Cost FY2009/10 Funding Prior Year Expenditures Project Start date Estimated Complete date Elapsed Time Percent Complete $62,000 $267,877 $62,000 $7,158 July 2002 July 2012 Council District Neighborhood Area Planning Area Project Location Project Manager Citywide Utilities Project Number Z ZI91 JJ - 46
236 Project Description SAC RVR WTR RELIAB STUDY Z To conduct a feasibility study and prepare an Environmental Impact Statement/Report (EIS/EIR) of identified water supply alternatives as the basis for seeking necessary biological opinions and permits from resource agencies to allow execution of necessary agreements and construction of the recommended water supply infrastructure. Project Objectives Existing Situation Operating Budget Impact Develop a plan that is consistent with the Water Forum Agreement objectives of pursuing a Sacramento River diversion to meet water supply needs of the Placer-Sacramento region and promoting ecosystem preservation along the lower American River. None. None. Fund 6005 Budget through Est Balance Fund Source 6/2009 6/ / / / / /14 WATER $3,320,000 $545,428 $210,000 $500,000 $500,000 $500,000 $0 This Project Total $3,320,000 $545,428 $210,000 $500,000 $500,000 $500,000 $ Funding Estimated Project Cost FY2009/10 Funding Prior Year Expenditures Project Start date Estimated Complete date Elapsed Time Percent Complete $1,710,000 $5,030,000 $210,000 $2,774,572 July 2003 June 2007 Council District Neighborhood Area Planning Area Project Location Project Manager Sacramento County Regional Study Utilities Project Number Z ZJ76 JJ - 47
237 Project Description BUILDING SECURITY SYSTEMS Z Install or modify building security systems to monitor and control access into Utilities buildings at th Ave., Sump 2, Pioneer reservoir, Sump 1/1A, Sacramento River Water Treatment Plant (SRWTP), Fairbairn Water Treatment Plant (FWTP), and Corp yard buildings 7, 8, 19, 20 and 21. Project Objectives Existing Situation Operating Budget Impact To improve building access security and response to a change in threat level. These buildings are secured with non-standard equipment, or secured by door locks only. None. Fund Budget through Est Balance Fund Source 6/2009 6/ / / / / /14 WATER $190,000 $92,789 $0 $5,000 $5,000 $0 $0 SEWER $70,000 $55,607 STORM DRAINAGE $140,000 $110,901 This Project Total $400,000 $259,297 $0 $5,000 $5,000 $0 $ Funding Estimated Project Cost FY2009/10 Funding Prior Year Expenditures Project Start date Estimated Complete date Elapsed Time Percent Complete $10,000 $410,000 $0 $140,703 July 2004 June 2007 Council District Neighborhood Area Planning Area Project Location Project Manager 1, 4, 5, 6 Various Buildings Utilities Project Number Z ZK21 JJ - 48
238 Project Description Project Objectives Existing Situation Operating Budget Impact ASSET MANAGEMENT - WTR Develop and manage the water systems asset management program. Develop a CIP and maintenance program that is linked to the condition and criticality of each asset. Program development. None. Z Fund 6005 Budget through Est Balance Fund Source 6/2009 6/ / / / / /14 WATER $170,000 $91,148 $0 $50,000 $50,000 $50,000 $0 This Project Total $170,000 $91,148 $0 $50,000 $50,000 $50,000 $ Funding Estimated Project Cost FY2009/10 Funding Prior Year Expenditures Project Start date Estimated Complete date Elapsed Time Percent Complete $150,000 $320,000 $0 $78,852 July 2005 June 2012 Council District Neighborhood Area Planning Area Project Location Project Manager City Wide Utilities Project Number Z ZK61 JJ - 49
239 RESID WTR MTR PRGM Z Project Description Develop and manage the residential water meter retrofit program. Project Objectives Comply with new AB2572 that requires the City to meter all residential water services by year 2025 Existing Situation Homes constructed prior to year 1993 don t have water meters. That equates to approximately 100,000 water services requiring water meter retrofits. Operating Budget Approximately $300M over the next 15 years Impact Fund 6005 Budget through Est Balance Fund Source 6/2009 6/ / / / / /14 WATER $799,809 $232,007 $0 $9,896,000 $11,096,000 $12,296,000 $13,496,000 This Project Total $799,809 $232,007 $0 $9,896,000 $11,096,000 $12,296,000 $13,496, Funding Estimated Project Cost FY2009/10 Funding Prior Year Expenditures Project Start date Estimated Complete date Elapsed Time Percent Complete $46,784,000 $47,583,809 $0 $567,802 July 2005 June 2010 Council District Neighborhood Area Planning Area Project Location Project Manager City Wide Utilities Project Number Z ZK66 JJ - 50
240 Project Description Project Objectives IT PROJECTS Z Develop Information Technology (IT) projects that support Utilities maintenance programs, asset management program, and customer service efforts. Deploy computerized maintenance management systems (CMMS) in both Field Services and Plant Services, and improve the existing Geographical Information System to support the CMMS effort. Existing Situation Operating Budget Impact The Department of Utilities IT master plan has identified specific projects that will promote best practices and improve efficiencies in operations, asset maintenance and condition assessment, and improve customer service. None. Fund Budget through Est Balance Fund Source 6/2009 6/ / / / / /14 WATER $200,000 $168,122 $0 $200,000 $200,000 $200,000 $0 SEWER $100,000 $100,000 $25,000 $0 $0 $0 $0 SOLID WASTE $25,000 $25,000 STORM DRAINAGE $100,000 $100,000 This Project Total $425,000 $393,122 $25,000 $200,000 $200,000 $200,000 $ Funding Estimated Project Cost FY2009/10 Funding Prior Year Expenditures Project Start date Estimated Complete date Elapsed Time Percent Complete $625,000 $1,050,000 $25,000 $31,878 July 2005 June 2010 Council District Neighborhood Area Planning Area Project Location Project Manager Citywide Utilities Project Number Z ZK71 JJ - 51
241 Project Description Project Objectives T-MAIN POWER INN RD Z Construct approx. 32,000 feet of pipeline from the Fairbairn Water Treatment Plant to the Florin Reservoir. Pipe size ranges from 66-inch diameter to 36-inch diameter. To provide water to new development within the city and new wholesale and wheeling customers with the City s Place of Use (Sacramento County Zone 40 Florin Gap/Vineyard area). Existing Situation Operating Budget Impact Currently the City is only wheeling water to the County Zone 40 area at Franklin Blvd. and city limits None. Fund 6005 Budget through Est Balance Fund Source 6/2009 6/ / / / / /14 WATER $1,496,000 $788,266 $500,000 $0 $0 $0 $0 This Project Total $1,496,000 $788,266 $500,000 $0 $0 $0 $ Funding Estimated Project Cost FY2009/10 Funding Prior Year Expenditures Project Start date Estimated Complete date Elapsed Time Percent Complete $500,000 $1,996,000 $500,000 $707,734 July 2005 June 2012 Council District Neighborhood Area Planning Area Project Location Project Manager 6 3 Power Inn Road From The Fwtp To The Florin Res. Project Number Z ZK91 JJ - 52
242 Project Description Project Objectives TREATMENT PLANT REHAB DESIGN Z Prepare plans and specifications for necessary improvements and rehabilitation work at both E.A. Fairbairn Water Treatment Plant (FWTP) and Sacramento River Water Treatment Plant (SRWTP). Improve water treatment reliability and provide treatment capacity to meet future water demands within the City s place of use. Existing Situation Operating Budget Impact The SRWTP was constructed in the 1920 s and 1930 s and FWTP was constructed in the early 1960 s. The City recently completed the 1st phase of work at the treatment plants by expanding treatment capacity. The 2nd phase of work is to rehabilitate or replace the older components at the Treatment Plants. Reduce future maintenance at the treatment plants. Fund 6005 Budget through Est Balance Fund Source 6/2009 6/ / / / / /14 WATER $1,000,000 $999,857 $1,000,000 $0 $0 $0 $0 This Project Total $1,000,000 $999,857 $1,000,000 $0 $0 $0 $ Funding Estimated Project Cost FY2009/10 Funding Prior Year Expenditures Project Start date Estimated Complete date Elapsed Time Percent Complete $1,000,000 $2,000,000 $1,000,000 $143 January 2008 January 2010 Council District Neighborhood Area Planning Area Project Location Project Manager 1, 3 1 Sacramento River Wtp And E.a. Fairbairn Wtp Utilities, Craig Chalmers Project Number Z ZL91 JJ - 53
243 Project Description Project Objectives UNPLANNED CORRECTIVE MAINTENANCE Project to correct and repair unexpected critical failures with the city s water infrastructure. To enable repairs needed to continue operating efficiently. Z Existing Situation Operating Budget Impact Due to the size and age of the city s infrastructure, unplanned failures occur. In order to have funding to make the necessary repairs, the Department has designated a single project, funded annually for response to these events. None Fund 6005 Budget through Est Balance Fund Source 6/2009 6/ / / / / /14 WATER $480,000 $480,000 -$230,000 $500,000 $500,000 $500,000 $0 This Project Total $480,000 $480,000 -$230,000 $500,000 $500,000 $500,000 $ Funding Estimated Project Cost FY2009/10 Funding Prior Year Expenditures $1,270,000 $1,750,000 -$230,000 $0 Project Start date Estimated Complete date Elapsed Time Percent Complete Council District Neighborhood Area Planning Area Project Location Project Manager Citywide Utilities Project Number Z JJ - 54
244 Project Description SACRAMENTO RIVER WTP CHLORINATION Z Install three evaporators in the chlorine storage building. Modify existing gas piping to incorporate new evaporators and connect to plant SCADA system for alarm and status monitoring. Add additional application points in treatment process. Project Objectives Existing Situation Operating Budget Impact Provide for operational flexibility in the application of chlorine in the water treatment process. Existing chlorination system is a limiting factor in water treatment production. Fund 6005 Budget through Est Balance Fund Source 6/2009 6/ / / / / /14 WATER $100,000 $100,000 -$100,000 $0 $0 $0 $0 This Project Total $100,000 $100,000 -$100,000 $0 $0 $0 $ Funding Estimated Project Cost FY2009/10 Funding Prior Year Expenditures -$100,000 $0 -$100,000 $0 Project Start date Estimated Complete date Elapsed Time Percent Complete Council District Neighborhood Area Planning Area Project Location Project Manager 1 1 Sacramento River Water Treatment Plant Utilities Project Number Z JJ - 55
245 Project Description FAIRBAIRN WTP CHLORINATION Z Install two evaporators in the chlorine storage building. Modify existing gas piping to incorporate new evaporators and connect to plant SCADA system for alarm and status monitoring. Add additional application points in treatment process. Project Objectives Provide for operational flexibility in the application of chlorine in the water treatment process. Existing Situation Existing chlorination system is a limiting factor in water treatment production. The project has been canceled and the funding will return to operations. Another project is currently in the planning stages for a chlorination system at Fairbairn WTP. Operating Budget Impact Fund 6005 Budget through Est Balance Fund Source 6/2009 6/ / / / / /14 WATER $60,000 $60,000 -$60,000 $0 $0 $0 $0 This Project Total $60,000 $60,000 -$60,000 $0 $0 $0 $ Funding Estimated Project Cost FY2009/10 Funding Prior Year Expenditures -$60,000 $0 -$60,000 $0 Project Start date Estimated Complete date Elapsed Time Percent Complete Council District Neighborhood Area Planning Area Project Location Project Manager 6 1 Fairbairn Water Treatment Plant Utilities Project Number Z JJ - 56
246 Project Description FY10 ECONOMIC DEVELOP PRGM Z Provide funding for water, sewer, and drainage improvements in support of economic development projects under the direction of the City s Economic Development Department, Planning, and Sacramento Housing and Redevelopment Agency (SHRA). Project Objectives Existing Situation Operating Budget Impact Enable development by re-prioritizing water, sewer, and drainage projects that support selected development projects. In many redevelopment areas the city s infrastructure is undersized and deteriorating. None. Fund Budget through Est Balance Fund Source 6/2009 6/ / / / / /14 WATER $0 $0 $400,000 $400,000 $400,000 $400,000 $400,000 SEWER $0 $0 $200,000 $200,000 $200,000 $200,000 $200,000 This Project Total $0 $0 $600,000 $600,000 $600,000 $600,000 $600, Funding Estimated Project Cost FY2009/10 Funding Prior Year Expenditures Project Start date Estimated Complete date Elapsed Time Percent Complete $3,000,000 $3,000,000 $600,000 $0 July 2009 June 2010 Council District Neighborhood Area Planning Area Project Location Project Manager City Wide Utilities Project Number Z JJ - 57
247 Project Description WATER METER READING AUTOMATION Z Implementing an Automated Meter Reading, Fixed Network Wireless solution for automating the City's water meter reading processes that will simplify meter reading collection efforts and enable the City to enhance the service to its customers and reduce costs. Project Objectives Existing Situation Operating Budget Impact To collect accurate meter readings, reduce data collection costs and capture meter information and events that will be used for water usage profiling, demand forecasting, demand response, rate of flow recording, flow monitoring, time of use billing, and water conservation enforcement. The City's current TRACE water meter transponders are obsolete and the cost to operate the associated Orion Mobile Meter Reading System to collect existing meter reads is very high. Reduced risks and improved safety for Meter Readers in collecting reads. Improved reliability, meter reads collection and reporting. Improved customer satisfaction. Reduced operation costs. Fund 6005 Budget through Est Balance Fund Source 6/2009 6/ / / / / /14 WATER $0 $0 $775,000 $661,000 $612,000 $563,000 $513,000 This Project Total $0 $0 $775,000 $661,000 $612,000 $563,000 $513, Funding Estimated Project Cost FY2009/10 Funding Prior Year Expenditures Project Start date Estimated Complete date Elapsed Time Percent Complete $3,124,000 $3,124,000 $775,000 $0 July 2009 October 2014 Council District Neighborhood Area Planning Area Project Location Project Manager Citywide Utilities, Dave Hansen Project Number Z JJ - 58
248 Project Description Project Objectives ALHAMBRA BOULEVARD RS T-MAIN REPLACEMENT, HWY 50 TO Z Replace approximately 520 feet of 20-inch riveted steel water transmission main along Alhambra Boulevard from Highway 50 to Broadway. To ensure the reliability of the water distribution system and reduce potential damage from transmission main breaks. Existing Situation Operating Budget Impact Approximately 63,000 feet of riveted steel water transmission main was placed between 1870 and Approximately 59,000 has been replaced or abandoned to date. Reduces operation and maintenance staff time repairing mains. Fund 6005 Budget through Est Balance Fund Source 6/2009 6/ / / / / /14 WATER $0 $0 $450,000 $0 $0 $0 $0 This Project Total $0 $0 $450,000 $0 $0 $0 $ Funding Estimated Project Cost FY2009/10 Funding Prior Year Expenditures Project Start date Estimated Complete date Elapsed Time Percent Complete $450,000 $450,000 $450,000 $0 July 2009 January 2011 Council District Neighborhood Area Planning Area Project Location Project Manager 4, 5 2, 3 Alhambra Boulevard From Highway 50 To Broadway. Utilities, Michelle Carey Project Number Z JJ - 59
249 Z WS T-MAIN REPLACEMENT, 19TH STR - Q STREET TO BROADWAY Project Description Remove and replace approximately 3500 feet of 24-inch welded steel main along 19th Street. Project Objectives To ensure the reliability of the water distribution system and reduce potential damage from transmission main breaks. Existing Situation Operating Budget Impact Approximately 24,450 feet of welded steel main was placed between 1935 and The main is deteriorating and is nearing the end of its useful life. Reduces operation and maintenance staff time repairing mains. Fund 6005 Budget through Est Balance Fund Source 6/2009 6/ / / / / /14 WATER $0 $0 $50,000 $0 $0 $0 $0 This Project Total $0 $0 $50,000 $0 $0 $0 $ Funding Estimated Project Cost FY2009/10 Funding Prior Year Expenditures Project Start date Estimated Complete date Elapsed Time Percent Complete $50,000 $50,000 $50,000 $0 July 2009 January 2011 Council District Neighborhood Area Planning Area Project Location Project Manager 3, 4 1, 2 19th Street, Q Street To Broadway Utilities, Michelle Carrey Project Number Z JJ - 60
250 Project Description Z WS T-MAIN REPLACEMENT, FREEPORT BLVD - BROADWAY TO 4TH Replace approximately 3400 feet of 24-inch welded steel main along Freeport Blvd. The existing transmission main alignment is parallel to the railroad and light rail tracks. Consider placing new transmission main in Freeport Blvd. Project Objectives Existing Situation Operating Budget Impact To ensure the reliability of the water distribution system and reduce potential damage from transmission main breaks. Approximately 24,450 feet of welded steel main was placed between 1935 and The main is deteriorating and is nearing the end of its useful life. Reduces operation and maintenance staff time repairing mains Fund 6005 Budget through Est Balance Fund Source 6/2009 6/ / / / / /14 WATER $0 $0 $50,000 $0 $0 $0 $0 This Project Total $0 $0 $50,000 $0 $0 $0 $ Funding Estimated Project Cost FY2009/10 Funding Prior Year Expenditures Project Start date Estimated Complete date Elapsed Time Percent Complete $50,000 $50,000 $50,000 $0 July 2009 January 2011 Council District Neighborhood Area Planning Area Project Location Project Manager 4, 5 2, 3 Freeport Blvd. - Broadway To 4th Ave. Utilities, Michelle Carrey Project Number Z JJ - 61
251 Project Description Project Objectives Z WS T-MAIN REPLACEMENT, RAILROAD TRACKS - 4TH AVE TO CITY Remove and replace approximately 3500 feet of 24-inch welded steel main parallel to the railroad and light rail tracks. To ensure the reliability of the water distribution system and reduce potential damage from transmission main breaks. Existing Situation Operating Budget Impact Approximately 24,450 feet of welded steel main was placed between 1935 and The main is deteriorating and is nearing the end of its useful life. Reduces operation and maintenance staff time repairing mains Fund 6005 Budget through Est Balance Fund Source 6/2009 6/ / / / / /14 WATER $0 $0 $50,000 $0 $0 $0 $0 This Project Total $0 $0 $50,000 $0 $0 $0 $ Funding Estimated Project Cost FY2009/10 Funding Prior Year Expenditures Project Start date Estimated Complete date Elapsed Time Percent Complete $50,000 $50,000 $50,000 $0 July 2009 January 2011 Council District Neighborhood Area Planning Area Project Location Project Manager 4, 5 3 Railroad Tracks - From 4th Avenue To City College Reservoir Utilities, Michelle Carrey Project Number Z JJ - 62
252 SRWTP 5 MG RESERVOIR BAFFLE WALL REHABILITATION Z Project Description Rehabilitate deteriorated baffle walls inside the SRWTP 5 MG Reservoir Project Objectives Provide necessary structural improvements to baffle walls inside the 5 MG Reservoir to ensure a safe and functional facility. Existing Situation Operating Budget Impact 5 MG Reservoir was constructed with the original plant in 1920s. Inside the reservoir is a series of 4 inch thick concrete baffle walls. Sections of this wall have significant structural deterioration including holes completely through the wall. None Fund 6005 Budget through Est Balance Fund Source 6/2009 6/ / / / / /14 WATER $0 $0 $20,000 $0 $0 $0 $0 This Project Total $0 $0 $20,000 $0 $0 $0 $ Funding Estimated Project Cost FY2009/10 Funding Prior Year Expenditures Project Start date Estimated Complete date Elapsed Time Percent Complete $20,000 $20,000 $20,000 $0 July 2009 June 2010 Council District Neighborhood Area Planning Area Project Location Project Manager Sacramento River Water Treatment Plant Utilities, Bill Zehnder Project Number Z JJ - 63
253 Project Description Project Objectives CONNECTION TO COUNTY SEWER MAIN FOR FWTP DEWATERING Z To accelerate FWTP dewatering time, prepare an evaluation and design for connecting to the Sacramento County Sewer force main that runs near the northwest corner of the FWTP. Shortening the time required to perform dewatering of FWTP during shutdown by connecting to a new County of Sacramento force main that has a greater capacity than the section of sewer system currently used. Existing Situation Operating Budget Impact Dewatering FWTP during a shutdown requires discharging to a section of the County sewer main that has limited capacity. This prolongs the dewatering process. In 2007, County installed a sewer force main at the northwest corner with greater capacity. Potentially saves money by reducing O&M time to dewater facility Fund 6005 Budget through Est Balance Fund Source 6/2009 6/ / / / / /14 WATER $0 $0 $100,000 $0 $0 $0 $0 This Project Total $0 $0 $100,000 $0 $0 $0 $ Funding Estimated Project Cost FY2009/10 Funding Prior Year Expenditures Project Start date Estimated Complete date Elapsed Time Percent Complete $100,000 $100,000 $100,000 $0 July 2009 October 2010 Council District Neighborhood Area Planning Area Project Location Project Manager 3 Ea Fairbarin Water Treatment Plant Utilities, Craig Chalmers Project Number Z JJ - 64
254 FLORIN RES. ENGINE 2 REBUILD Z Project Description Rebuilding natural gas engine #2 at the Florin Reservoir pump station Project Objectives Provide reliable supply of potable water to South Sacramento Existing Situation Existing engine has failed and must be replaced for efficiency. Operating Budget Impact Will reduce maintenance costs at site; no specific impact on operations because resources will be directed to resolve other problems. Fund 6005 Budget through Est Balance Fund Source 6/2009 6/ / / / / /14 WATER $0 $0 $120,000 $0 $0 $0 $0 This Project Total $0 $0 $120,000 $0 $0 $0 $ Funding Estimated Project Cost FY2009/10 Funding Prior Year Expenditures Project Start date Estimated Complete date Elapsed Time Percent Complete $120,000 $120,000 $120,000 $0 July 2009 June 2010 Council District Neighborhood Area Planning Area Project Location Project Manager 6 3 Florin Reservoir Utilities Project Number Z JJ - 65
255 Project Description Project Objectives Existing Situation Operating Budget Impact RWM-PROJECT MGMNT FY Provide funding for the Residential Water Meter program project management. Provide program management to implement the water meter program. None. None. Z Fund 6005 Budget through Est Balance Fund Source 6/2009 6/ / / / / /14 WATER $182,627 $24,027 $100,000 $0 $0 $0 $0 This Project Total $182,627 $24,027 $100,000 $0 $0 $0 $ Funding Estimated Project Cost FY2009/10 Funding Prior Year Expenditures Project Start date Estimated Complete date Elapsed Time Percent Complete $100,000 $282,627 $100,000 $158,600 July 2006 July 2010 Council District Neighborhood Area Planning Area Project Location Project Manager Citywide Utilities Project Number Z JJ - 66
256 Project Description Project Objectives Existing Situation Operating Budget Impact RWM-PUBLIC OUTREACH Residential water meter program public outreach. Provide public outreach support on meter retrofit and backyard replacement projects. None. None. Z Fund 6005 Budget through Est Balance Fund Source 6/2009 6/ / / / / /14 WATER $108,000 $68,558 $36,000 $0 $0 $0 $0 This Project Total $108,000 $68,558 $36,000 $0 $0 $0 $ Funding Estimated Project Cost FY2009/10 Funding Prior Year Expenditures Project Start date Estimated Complete date Elapsed Time Percent Complete $36,000 $144,000 $36,000 $39,442 July 2006 July 2010 Council District Neighborhood Area Planning Area Project Location Project Manager Citywide Utilities Project Number Z ZS04 JJ - 67
257 Project Description RWM PR 4PIPE REPL3A SO LAND PK PH 4 Z Replace undersized and deteriorated steel water mains. Upgrade fire hydrants. Construct new water services and meters to each home or business. Project Objectives Existing Situation Operating Budget Impact Comply with SB2572. Reduce maintenance costs, ensure system reliability and bring water distribution system up to current standards. This is one of many phases of the water meter program pipeline replacement project that replaces thin-walled steel water mains. The existing steel pipes require continuous maintenance and do not meet current City standards. Reduces maintenance staff time repairing mains. Fund 6005 Budget through Est Balance Fund Source 6/2009 6/ / / / / /14 WATER $475,000 $450,000 $1,860,000 $0 $0 $0 $0 This Project Total $475,000 $450,000 $1,860,000 $0 $0 $0 $ Funding Estimated Project Cost FY2009/10 Funding Prior Year Expenditures Project Start date Estimated Complete date Elapsed Time Percent Complete $1,860,000 $2,335,000 $1,860,000 $25,000 July 2008 July 2010 Council District Neighborhood Area Planning Area Project Location Project Manager 4 2 South Land Park Dr To Riverside Blvd And Sutterville Rd To Brownwyk Dr Utilities Project Number Z JJ - 68
258 Project Description Project Objectives Existing Situation RWM PIPE REPL 5METER1 CITY FARMS Z Replace undersized and deteriorated water mains. Upgrade fire hydrants. Construct new water services and meters to each home or business. Comply with SB 2572 by installing water meters on all residential water services by year This is one of many phases of the water meter program pipeline replacement projects that replaces old backyard water mains. Replacing the main in the street allows the meter to be installed in the front of the property. Operating Budget Impact None. Fund 6005 Budget through Est Balance Fund Source 6/2009 6/ / / / / /14 WATER $0 $0 $1,450,000 $0 $0 $0 $0 This Project Total $0 $0 $1,450,000 $0 $0 $0 $ Funding Estimated Project Cost FY2009/10 Funding Prior Year Expenditures Project Start date Estimated Complete date Elapsed Time Percent Complete $1,450,000 $1,450,000 $1,450,000 $0 July 2009 July 2010 Council District Neighborhood Area Planning Area Project Location Project Manager th St To Franklin Blvd And 26th Ave To 33th Ave Utilities Project Number Z JJ - 69
259 Project Description Project Objectives RWM PR 5PIPE REPL2 GOLF COURSE TERRACE PH1 Z Replace undersized and deteriorated water mains. Upgrade fire hydrants. Construct new water services and meters to each home or business. Comply with SB 2572 by installing water meters on all residential water services by year Reduce maintenance costs, ensure system reliability and bring water distribution system up to current City standards. Existing Situation Operating Budget Impact This is one of many phases of the water meter program pipeline replacement projects that replaces old water mains. The existing pipe requires continuous maintenance, is difficult to access and does not meet the City s current standards. Reduces operations and maintenance staff time on repairing mains. Fund 6005 Budget through Est Balance Fund Source 6/2009 6/ / / / / /14 WATER $0 $0 $650,000 $0 $0 $0 $0 This Project Total $0 $0 $650,000 $0 $0 $0 $ Funding Estimated Project Cost FY2009/10 Funding Prior Year Expenditures Project Start date Estimated Complete date Elapsed Time Percent Complete $650,000 $650,000 $650,000 $0 July 2009 July 2011 Council District Neighborhood Area Planning Area Project Location Project Manager 5 3 Golf View Dr To Hogan Dr And 47th Ave To 53rd Ave Utilities Project Number Z JJ - 70
260 Project Description Project Objectives Existing Situation Operating Budget Impact RWM RETRO 6METER1 FRUITRIDGE MANOR Z Place new meter boxes, setters, and meters on existing front yard water services. Meet the objective of SBA 2572 by installing water meters on all residential water services by year Residential water services constructed prior to 1993 were not required to have a water meter. Increase in staff time to read and maintain meters. Fund 6005 Budget through Est Balance Fund Source 6/2009 6/ / / / / /14 WATER $0 $0 $2,000,000 $0 $0 $0 $0 This Project Total $0 $0 $2,000,000 $0 $0 $0 $ Funding Estimated Project Cost FY2009/10 Funding Prior Year Expenditures Project Start date Estimated Complete date Elapsed Time Percent Complete $2,000,000 $2,000,000 $2,000,000 $0 July 2009 July 2010 Council District Neighborhood Area Planning Area Project Location Project Manager 6 3 Stockton Blvd To 65th St And Fruitridge Rd To Lemon Hill Ave Utilities Project Number Z JJ - 71
261 Project Description Project Objectives Existing Situation Operating Budget Impact RWM RETRO 8METER6 NORTH LAGUNA CREEK Z Place new meter boxes, setters, and meters on existing front yard water services. Meet the objective of SBA 2572 by installing water meters on all residential water services by year Residential water services constructed prior to 1993 were not required to have a water meter. Increase in staff time to read and maintain meters. Fund 6005 Budget through Est Balance Fund Source 6/2009 6/ / / / / /14 WATER $0 $0 $2,600,000 $0 $0 $0 $0 This Project Total $0 $0 $2,600,000 $0 $0 $0 $ Funding Estimated Project Cost FY2009/10 Funding Prior Year Expenditures Project Start date Estimated Complete date Elapsed Time Percent Complete $2,600,000 $2,600,000 $2,600,000 $0 July 2009 July 2010 Council District Neighborhood Area Planning Area Project Location Project Manager 8 2 Franklin Blvd To Center Parkway And Troutdale Way To Jacinto Ave Utilities Project Number Z JJ - 72
262 CITY OF SACRAMENTO SHRA PROGRAM OVERVIEW INTRODUCTION The Sacramento Housing and Redevelopment Agency (SHRA) is a joint City and County agency that serves as the Redevelopment Agency and Housing Authority for both jurisdictions. SHRA is responsible for implementing Redevelopment Plans in the 65 th Street, Alkali Flat, Army Depot, Del Paso Heights, North Sacramento and Oak Park redevelopment project areas, as well as the City/County shared Auburn Boulevard, Franklin Boulevard and Stockton Boulevard project areas. The City manages the Merged Downtown and Richards/Railyards project areas. SHRA also administers the Community Development Block Grant (CDBG) program, Home Investment Partnerships (HOME) program, Low-Income Housing Trust Fund (HTF) and Neighborhood Stabilization Program (NSP) on behalf of the City and County of Sacramento. This is the twelfth year for SHRA projects to be included in the City s (CIP) budget. As part of an ongoing collaborative effort to more efficiently use scarce resources, the capital projects of SHRA are included in this document so that a full picture of all CIP projects can be presented. Because the citywide priorities and targeted SHRA priorities are aligned, some redevelopment Tax Increment (TI) and CDBG funded projects are also found in other sections of this document. SHRA utilizes two primary funding sources to carry out capital improvement projects: CDBG funds and TI funds or bond proceeds. HOME, HTF, NSP and Housing Authority operational funding are restricted to housing activities, and thus are not included in the CIP. The chart below shows how the funding is appropriated. SHRA Community Development Appropriations 2009 Calendar Year Budget Financial Transactions - Redevelopment 19% Housing and Community Development 25% Debt Service - Redevelopment 44% Real Estate & Construction Services 12% CAPITAL IMPROVEMENT PROGRAM K - 1
263 CITY OF SACRAMENTO SHRA PROGRAM OVERVIEW The CDBG capital improvement projects and programs must improve and enhance the livability of low/moderate income neighborhoods throughout the City. These projects can be classified in four main categories: residential street improvements, commercial strip improvements, park and recreation improvements and buildings for neighborhood activities. Redevelopment TI funds and bond proceeds are primarily invested in economic development and commercial revitalization activities (including public infrastructure) within the designated boundaries of the adopted redevelopment plan. While not the primary objective, TI and bond proceeds may also be invested in buildings and spaces for neighborhood activities. In addition, 20 percent of available TI funding must be invested in affordable housing activities. The Economic Stimulus Package of 2009 proposes to increase CDBG funding in 2009, so the use of these funds in capital improvement projects will be expanded as well. SHRA s budget is set on a calendar year basis. Projects previously approved by the Mayor and City Council as part of the SHRA s 2009 budget are included in this CIP budget as year one funding in the five-year CIP. The allocation of new CDBG funds as part of the stimulus has not been determined by the U.S. Department of Housing and Urban Development as of yet, thus the allocation has not been included in this year s CIP. The following table shows a summary of all 2009 funding sources. SACRAMENTO HOUSING AND REDEVELOPMENT AGENCY 2009 FUNDING SOURCES FUNDING SOURCE 2009 HUD Section 8 (HCV) $ 98,099,491 HUD Public Housing $ 15,319,195 HUD Community Development $ 50,320,664 Redevelopment Tax Increment (TI) $ 74,563,719 Other $ 6,776,645 TOTAL $245,079,714 Since this document is a Capital Improvement Budget, only project details on City and joint City/County Capital projects are included. However, as shown on the above chart, SHRA is involved with many other types of projects, as well CAPITAL IMPROVEMENT PROGRAM K - 2
264 CITY OF SACRAMENTO SHRA PROGRAM OVERVIEW Sacramento Housing and Redevelopment Agency 2009 Calendar Year Budgeted Capital Improvement Projects (in 000 s) Total $19,338 Public Improvements, $5,670 Developer Assistance, $13,668 The SHRA 2009 calendar year project budget funding is $19.3 million. Projects located within the unincorporated County are not discussed in the City s CIP. The projects included in SHRA s section of the CIP total approximately $10.7 million. REDEVELOPMENT Program Goals Revitalization of older commercial corridors. Promotion of new and continuing private sector investment. Retention and expansion of businesses. Creation and development of local job opportunities. Rehabilitation and construction of affordable housing. Achievement of high level architectural, landscape, urban design and land use principles. Elimination of environmental deficiencies within the public infrastructure system. Elimination and prevention of the spread of blight and deterioration. Project Selection Criteria Compliance with adopted five-year redevelopment area implementation plans. Compliance with adopted five-year investment strategies. Compliance with urban design plans. Return on investment - tax base, jobs and community improvements. Economic viability of project. Leverage of private capital CAPITAL IMPROVEMENT PROGRAM K - 3
265 CITY OF SACRAMENTO SHRA PROGRAM OVERVIEW SHRA budgets for redevelopment capital projects by designating dollars for specific projects and also by designating dollars for development assistance. This latter category is available for commercial projects as they are identified, negotiated and approved. Generally, the staff report process is used to transfer appropriations from development assistance to a specific project. The following table reflects project appropriations for calendar year 2009 by funding source for SHRA: SHRA Tax Increment (TI) Project # Project Name Fund # Fund Name Del Paso Heights Development Assistance 9231 Del Paso Heights TI 1,228, Alkali Flat Development Assistance 9206 Alkali Flat TI 361, Oak Park Development Assistance 9221 Oak Park TI 921, North Sacramento Development Assistance 9216 North Sacramento TI 1,785, Franklin Boulevard Development Assistance 9211 Franklin Boulevard TI 1,642, Stocton Blvd. Development Assistance 9226 Stockton Boulevard TI 832, Auburn Boulevard Development Assistance 9241 Auburn Boulevard TI 342, Army Depot Development Assistance 9236 Army Depot TI 2,828, th Street Development Assistance th Street TI 215,754 Totals: 10,158,595 COMMUNITY DEVELOPMENT BLOCK GRANT Program Goals Construct and improve infrastructure in low/moderate income areas. Improve and enhance the livability of low/moderate income neighborhoods. Expand economic opportunities. Provide decent housing and a suitable living environment. Eliminate slums and blight. Project Selection Criteria Compliance with adopted five-year consolidated plan. Improve the social fabric of the community. Improve the physical condition of the community. Serve children and families. Strong neighborhood (volunteer) support. Ready to commence immediately and to be completed within 18 months CAPITAL IMPROVEMENT PROGRAM K - 4
266 CITY OF SACRAMENTO SHRA PROGRAM OVERVIEW The CDBG includes projects and programs that improve and enhance the livability of low/moderate income neighborhoods throughout the City. The projects can be classified in four main categories: residential street improvements, commercial strip improvements, park and recreation improvements, and buildings for neighborhood activities. Only projects approved in the 2009 Action Plan by the City Council and Housing and Urban Development (HUD) are included in this document. Project # SHRA Community Development Block Grant (CDBG - Fund 9101) Title Budget River Gardens/Gardenland Project 114, ADA Sidewalk Improvements 348, Ben Ali/ Hagginwood Design 100, Total $562, CAPITAL IMPROVEMENT PROGRAM K - 5
267 Project Description Project Objectives Existing Situation Operating Budget Impact DEL PASO HEIGHTS RDA DEVELOPMENT ASSISTANCE The funds will be used for gap financing for commercial expansion, rehabilitation or new construction. Provides incentives for new development and helps create jobs. Blighted land and buildings on commercial corridors. There is no impact on the operating budget. Fund 9231 Budget through Est Balance Fund Source 6/2009 6/ / / / / /14 TAX INC. - DEL PASO HEIGHTS $0 $0 $1,228,397 $0 $0 $0 $0 This Project Total $0 $0 $1,228,397 $0 $0 $0 $ Funding Estimated Project Cost FY2009/10 Funding Prior Year Expenditures Project Start date Estimated Complete date Elapsed Time Percent Complete $1,228,397 $1,228,397 $1,228,397 $0 January 2009 December 2009 Council District Neighborhood Area Planning Area Project Location Project Manager Del Paso Heights Redevelopment Project Area SHRA Project Number KK - 1
268 Project Description Project Objectives Existing Situation Operating Budget Impact ALIKALI FLAT RDA DEVELOPMENT ASSISTANCE The funds will be used for gap financing for commercial expansion, rehabilitation or new construction. Provides incentives for new development and helps create jobs. Blighted land and buildings on commercial corridors. There is no impact on the operating budget. Fund 9206 Budget through Est Balance Fund Source 6/2009 6/ / / / / /14 TAX INC. - ALKALI FLAT $0 $0 $361,553 $0 $0 $0 $0 This Project Total $0 $0 $361,553 $0 $0 $0 $ Funding Estimated Project Cost FY2009/10 Funding Prior Year Expenditures Project Start date Estimated Complete date Elapsed Time Percent Complete $361,553 $361,553 $361,553 $0 January 2009 December 2009 Council District Neighborhood Area Planning Area Project Location Project Manager 1, Aakli Flat Redevelopment Project Area SHRA Project Number KK - 2
269 Project Description Project Objectives Existing Situation Operating Budget Impact OAK PARK RDA DEVELOPMENT ASSISTANCE The funds will be used for gap financing for commercial expansion, rehabilitation or new construction. Provides incentives for new development and helps create jobs. Blighted land and buildings on commercial corridors. There is no impact on the operating budget. Fund 9221 Budget through Est Balance Fund Source 6/2009 6/ / / / / /14 TAX INC. - OAK PARK $0 $0 $921,307 $0 $0 $0 $0 This Project Total $0 $0 $921,307 $0 $0 $0 $ Funding Estimated Project Cost FY2009/10 Funding Prior Year Expenditures Project Start date Estimated Complete date Elapsed Time Percent Complete $921,307 $921,307 $921,307 $0 January 2009 December 2009 Council District Neighborhood Area Planning Area Project Location Project Manager Oak Park Redevelopment Project Area SHRA Project Number KK - 3
270 Project Description Project Objectives Existing Situation Operating Budget Impact NORTH SACRAMENTO RDA DEVELOPMENT ASSISTANCE The funds will be used for gap financing for commercial expansion, rehabilitation or new construction. Provides incentives for new development and helps create jobs. Blighted land and buildings on commercial corridors. There is no impact on the operating budget. Fund 9216 Budget through Est Balance Fund Source 6/2009 6/ / / / / /14 TAX INC. - N. SACRAMENTO $0 $0 $1,785,807 $0 $0 $0 $0 This Project Total $0 $0 $1,785,807 $0 $0 $0 $ Funding Estimated Project Cost FY2009/10 Funding Prior Year Expenditures Project Start date Estimated Complete date Elapsed Time Percent Complete $1,785,807 $1,785,807 $1,785,807 $0 January 2009 December 2009 Council District Neighborhood Area Planning Area Project Location Project Manager North Sacramento Redevelopment Project Area SHRA Project Number KK - 4
271 Project Description Project Objectives Existing Situation Operating Budget Impact FRANKLIN BLVD RDA DEVELOPMENT ASSISTANCE The funds will be used for gap financing for commercial expansion, rehabilitation or new construction. Provides incentives for new development and helps create jobs. Blighted land and buildings on commercial corridors. There is no impact on the operating budget. Fund 9211 Budget through Est Balance Fund Source 6/2009 6/ / / / / /14 TAX INC. - FRANKLIN BLVD. $0 $0 $1,642,839 $0 $0 $0 $0 This Project Total $0 $0 $1,642,839 $0 $0 $0 $ Funding Estimated Project Cost FY2009/10 Funding Prior Year Expenditures Project Start date Estimated Complete date Elapsed Time Percent Complete $1,642,839 $1,642,839 $1,642,839 $0 January 2009 December 2009 Council District Neighborhood Area Planning Area Project Location Project Manager Franklin Blvd Redevelopment Project Area SHRA Project Number KK - 5
272 Project Description Project Objectives Existing Situation Operating Budget Impact STOCKTON BLVD RDA DEVELOPMENT ASSISTANCE The funds will be used for gap financing for commercial expansion, rehabilitation or new construction. Provides incentives for new development and helps create jobs. Blighted land and buildings on commercial corridors. There is no impact on the operating budget. Fund 9226 Budget through Est Balance Fund Source 6/2009 6/ / / / / /14 TAX INC. - STOCKTON BLVD. $0 $0 $832,048 $0 $0 $0 $0 This Project Total $0 $0 $832,048 $0 $0 $0 $ Funding Estimated Project Cost FY2009/10 Funding Prior Year Expenditures Project Start date Estimated Complete date Elapsed Time Percent Complete $832,048 $832,048 $832,048 $0 January 2009 December 2009 Council District Neighborhood Area Planning Area Project Location Project Manager 5, 6 3 4, 5 Stockton Blvd Redevelopment Project Area SHRA Project Number KK - 6
273 Project Description Project Objectives Existing Situation Operating Budget Impact AUBURN BLVD RDA DEVELOPMENT ASSISTANCE The funds will be used for gap financing for commercial expansion, rehabilitation or new construction. Provides incentives for new development and helps create jobs. Blighted land and buildings on commercial corridors. There is no impact on the operating budget. Fund 9241 Budget through Est Balance Fund Source 6/2009 6/ / / / / /14 TAX INC. - AUBURN BLVD. $0 $0 $342,854 $0 $0 $0 $0 This Project Total $0 $0 $342,854 $0 $0 $0 $ Funding Estimated Project Cost FY2009/10 Funding Prior Year Expenditures Project Start date Estimated Complete date Elapsed Time Percent Complete $342,854 $342,854 $342,854 $0 January 2009 December 2009 Council District Neighborhood Area Planning Area Project Location Project Manager 2, Auburn Blvd Redevelopment Project Area SHRA Project Number KK - 7
274 Project Description Project Objectives Existing Situation Operating Budget Impact ARMY DEPOT RDA DEVELOPMENT ASSISTANCE The funds will be used for gap financing for commercial expansion, rehabilitation or new construction. Provides incentives for new development and helps create jobs. Blighted land and buildings on commercial corridors. There is no impact on the operating budget. Fund 9236 Budget through Est Balance Fund Source 6/2009 6/ / / / / /14 TAX INC. - ARMY DEPOT $0 $0 $2,828,036 $0 $0 $0 $0 This Project Total $0 $0 $2,828,036 $0 $0 $0 $ Funding Estimated Project Cost FY2009/10 Funding Prior Year Expenditures Project Start date Estimated Complete date Elapsed Time Percent Complete $2,828,036 $2,828,036 $2,828,036 $0 January 2009 December 2009 Council District Neighborhood Area Planning Area Project Location Project Manager 6 3 4, 5 Army Depot Redevelopment Project Area SHRA Project Number KK - 8
275 Project Description Project Objectives Existing Situation Operating Budget Impact 65TH STREET RDA DEVELOPMENT ASSISTANCE The funds will be used for gap financing for commercial expansion, rehabilitation or new construction. Provides incentives for new development and helps create jobs. Blighted land and buildings on commercial corridors. There is no impact on the operating budget. Fund 9246 Budget through Est Balance Fund Source 6/2009 6/ / / / / /14 TAX INCREMENT-65TH STREET $0 $0 $215,754 $0 $0 $0 $0 This Project Total $0 $0 $215,754 $0 $0 $0 $ Funding Estimated Project Cost FY2009/10 Funding Prior Year Expenditures Project Start date Estimated Complete date Elapsed Time Percent Complete $215,754 $215,754 $215,754 $0 January 2009 December 2009 Council District Neighborhood Area Planning Area Project Location Project Manager 3, 6 1, 3 5, 6 65th Street Redevelopment Project Area SHRA Project Number KK - 9
276 Project Description Project Objectives Existing Situation Operating Budget Impact RIVER GARDENS/GARDENLAND NEIGHBORHOOD Development and or rehabilitation of a new or existing neighborhood park/community center. Improve facilities and amenities. The current facilities are inadequate. There is no impact on the operating budget. Fund 9101 Budget through Est Balance Fund Source 6/2009 6/ / / / / /14 SHRA - CDBG $0 $0 $114,000 $0 $0 $0 $0 This Project Total $0 $0 $114,000 $0 $0 $0 $ Funding Estimated Project Cost FY2009/10 Funding Prior Year Expenditures Project Start date Estimated Complete date Elapsed Time Percent Complete $114,000 $114,000 $114,000 $0 January 2009 December 2009 Council District Neighborhood Area Planning Area Project Location Project Manager River Gardens/gardenland Neighborhoods SHRA Project Number KK - 10
277 Project Description Project Objectives Existing Situation Operating Budget Impact ADA SIDEWALKS IMPROVEMENTS ADA curb ramps within the defined neighborhoods. Improve facilities and amenities. The current facilities are inadequate. There is no impact on the operating budget. Fund 9101 Budget through Est Balance Fund Source 6/2009 6/ / / / / /14 SHRA - CDBG $0 $0 $348,000 $0 $0 $0 $0 This Project Total $0 $0 $348,000 $0 $0 $0 $ Funding Estimated Project Cost FY2009/10 Funding Prior Year Expenditures Project Start date Estimated Complete date Elapsed Time Percent Complete $348,000 $348,000 $348,000 $0 January 2009 December 2009 Council District Neighborhood Area Planning Area Project Location Project Manager Carleton Heights & Colonial Tract Neighborhoods, Fruitridge Road From 24th To 28th Street SHRA Project Number KK - 11
278 Project Description Project Objectives Existing Situation Operating Budget Impact BEN ALI/ HAGGINWOOD DESIGN Design work for the Ben Ali/ Hagginwood Strategic Neighborhood Action Plans infrastructure and public facilities projects. Improve facilities and amenities The current facilities are inadequate. There is no impact on the operating budget. Fund 9101 Budget through Est Balance Fund Source 6/2009 6/ / / / / /14 SHRA - CDBG $0 $0 $100,000 $0 $0 $0 $0 This Project Total $0 $0 $100,000 $0 $0 $0 $ Funding Estimated Project Cost FY2009/10 Funding Prior Year Expenditures Project Start date Estimated Complete date Elapsed Time Percent Complete $100,000 $100,000 $100,000 $0 January 2009 December 2009 Council District Neighborhood Area Planning Area Project Location Project Manager Ben Ali/ Hagginwood Neighborhoods SHRA Project Number KK - 12
279 CITY OF SACRAMENTO SUMMARY OF FUNDING SOURCES Fund 1001 (101) General Fund & Fund 3008 (781) City Capital Projects Fund The General Fund accounts for the general government programs of the City such as Police, Fire, Attorney, Clerk, Treasurer and City Council. Revenue to the General Fund includes all monies not legally (or by sound financial management) accounted for in another fund. General Fund revenues include Property Taxes, Sales Taxes, Licenses and Permits, Fines, Forfeitures and Penalties, Charges for Services and Miscellaneous revenues such as interest. Fund 3008 (781) is used for large General Fund supported capital expenditures to prevent large spikes in the General Fund. Where were these funds spent in the past? The General Fund has had an ongoing program of $750,000 annually with $500,000 dedicated to facility ADA improvements, $150,000 for Public Safety generators, and $100,000 for fire station facility improvements. In the fall of 1999, a 3-year, $57 million program of expenditures was approved. This included construction of the Meadowview Pool and funding to complete Phase I of the South Natomas Community Center. 5,000 4,000 3,000 2,000 1,000 0 Annual CIP Appropriation GENERAL FUND 2,590 4,199 4,502 2,991 1,818 FY06 FY07 FY08 FY09 FY10 Dollars in Thousands Are there restrictions on the use of the funds? General fund revenues are available for any use as directed by the City Council. What legislation mandates use of these funds? There is no specific ordinance or legislation directing the use of funds CAPITAL IMPROVEMENT PROGRAM L-1
280 CITY OF SACRAMENTO SUMMARY OF FUNDING SOURCES Funds 2001 (201) and 2005 (207) Measure A Funds Measure A Funds account for revenue generated from a 20-year additional one-half cent local sales tax for transportation improvements approved by voters on November 8, 1988, under the State Local Transportation Authority and Improvement Act of Measure A is effective through March 31, 2009, at which point New Measure A (Funds 2025 and 2026) begins. Sales tax is imposed on retailers selling tangible personal property in California. A specific amount of the local funds must be spent on maintenance and a specific amount on capital construction. Each year the City Council approves an expenditure plan for these funds which is submitted to the Sacramento Transportation Authority for final approval. Where were these funds spent in the past? Measure A funds have largely supported street maintenance, signals/lighting, and ongoing citywide programs. Both maintenance and capital programs are significantly impacted by the reduced revenue projections for New Measure A. The balance in the Measure A Construction (Fund 2001) Program is available to supplement the citywide programs through Programs include the Street Overlay and Seals program, Public Right-of-Way Accessibility program, and the state and federal grant match. 20,000 15,000 10,000 5,000 0 Annual CIP Appropriation MEASURE A FUNDS 15,794 17,344 16,564 10,840 3,543 FY06 FY07 FY08 FY09 FY10 Dollars in Thousands Are there restrictions on the use of the funds? Maintenance funds must be spent on right-of-way maintenance, and funds used for capital improvements must be spent on specific projects adopted as part of the original ballot measure. Amendments to the project list can be made but must be approved by the Sacramento Transportation Authority Board. What legislation mandates use of these funds? Local Transportation Authority and Improvement Act (Public Utilities Code Division 19, Section et seq. Added by Statutes of 1987, Chapter 786) CAPITAL IMPROVEMENT PROGRAM L-2
281 CITY OF SACRAMENTO SUMMARY OF FUNDING SOURCES Fund 2002 (202) Gas Tax Fund Gas Tax Funds account for the $0.18 per gallon state tax on fuel used to propel a motor vehicle or aircraft. The State Board of Equalization administers the tax, and the State Controller distributes the revenues from the tax. Where were these funds spent in the past? Gas Tax funds largely support street maintenance and traffic engineering operations. Due to the reduction in Gas Tax and New Measure A Maintenance revenues projected in FY2010, the Gas Tax funds previously used for Transportation CIPs have been redirected to operational needs Annual CIP Appropriation GAS TAX FUND 792 2,029 2,089 2, FY06 FY07 FY08 FY09 FY10 Dollars in Thousands Are there restrictions on the use of the funds? Use of the gas tax is limited to research, planning, construction, improvement, maintenance, and operating of public streets and highways or public transit guideways. What legislation mandates use of these funds? Streets and Highways Code Section 2106, 2107, of the State of California CAPITAL IMPROVEMENT PROGRAM L-3
282 CITY OF SACRAMENTO SUMMARY OF FUNDING SOURCES Fund 2006 (208) Traffic Safety Fund In 1998 funding was generated primarily through the red light running program, traffic citations, and traffic school fees. In August 2003 the management of the red light running program was transferred to the County. The City continues to generate revenue through traffic citations and traffic school fees. Where were these funds spent in the past? Since August 2003 funding has been allocated primarily to traffic signs and markings, as well as traffic safety programs Annual CIP Appropriation TRAFFIC SAFETY FY06 FY07 FY08 FY09 FY10 Dollars in Thousands Are there restrictions on the use of the funds? The Traffic Safety Fund shall be used exclusively for official traffic control devices and maintenance thereof; equipment and supplies for traffic law enforcement and traffic accident prevention; and for the maintenance, improvement, or construction of public streets, bridges, and culverts within the city. This fund is not used to pay the compensation of traffic officers or other police officers. The fund may be used to pay the compensation of school crossing guards who are not regular full-time members of the City s Police Department. What legislation mandates use of these funds? California Vehicle Code, Division 18, Chapter 2, Article 1, Section CAPITAL IMPROVEMENT PROGRAM L-4
283 CITY OF SACRAMENTO SUMMARY OF FUNDING SOURCES Fund 2007 (209) Major Street Construction Fund The Major Street Construction Fund derives revenues from a tax imposed by the City in 1978 on all building valuations for new construction or for alterations, which add area to existing buildings (disaster reconstruction is excluded). Where were these funds spent in the past? Major Street Construction funding has been used exclusively for transportation projects, specifically the construction of major street-related improvements. 6,000 5,000 4,000 3,000 2,000 1,000 Annual CIP Appropriation MAJOR STREET CONSTRUCTION 0 2,464 5,687 4,910 3,703 2,320 FY06 FY07 FY08 FY09 FY10 Dollars in Thousands Are there restrictions on the use of the funds? The use of these funds is restricted to construction replacement, or alteration of roadways, traffic control, and lighting; use for maintenance and/or operations is not permitted. What legislation mandates use of these funds? Sacramento City Code Section CAPITAL IMPROVEMENT PROGRAM L-5
284 CITY OF SACRAMENTO SUMMARY OF FUNDING SOURCES Fund 2008 (211) Street Cut Fund Street Cut Funds account for fees collected from Utility companies and City Departments that cut or trench through city streets. The fees are used to compensate the City for damage caused to the streets. Fee revenues must be used to offset the cost of future street repairs in the same geographic area as the cut that generated the fees. Where were these funds spent in the past? Street Cut Funds have been used exclusively for street repairs from trenching or cutting into city streets Annual CIP Appropriation STREET CUT FUNDS FY06 FY07 FY08 FY09 FY10 Dollars in Thousands Are there restrictions on the use of the funds? Street cut funds must be spent in the same geographic area as the cut or trench that generated the fees. What legislation mandates use of these funds? Sacramento City Code Section CAPITAL IMPROVEMENT PROGRAM L-6
285 CITY OF SACRAMENTO SUMMARY OF FUNDING SOURCES Fund 2009 (212) Assembly Bill 2928 Funds Assembly Bill 2928 Maintenance of Effort Program was passed in August 2000 and established the Traffic Congestion Relief Fund (TCRF) in the State Treasury for allocating to cities and counties for the purpose of street or road maintenance or reconstruction. Where were these funds spent in the past? Eligible uses include: Maintenance (defined as patching, overlay and sealing). Reconstruction (includes any overlay, sealing or widening of roadway project. Widening cannot increase traffic capacity of the street or highway). Storm damage repair (within jurisdictions that have been declared disaster areas by the President of the United States) Annual CIP Appropriation ASSEMBLY BILL 2928 FUNDS 0 1, FY06 FY07 FY08 FY09 FY10 Dollars in Thousands 0 Are there restrictions on the use of the funds? In order to receive any allocation, the shall annually expend from its General Fund for street, road and highway purposes an amount not less than the annual average of its expenditures from its General Fund. AB 2928 defines the General Fund as any unrestricted funds that the City or County may expend at its discretion, including vehicle in-lieu tax revenues and revenues from fines and forfeitures expended for street and highway purposes. What legislation mandates use of these funds? Assembly Bill 2928-Maintenance of Effort Program CAPITAL IMPROVEMENT PROGRAM L-7
286 CITY OF SACRAMENTO SUMMARY OF FUNDING SOURCES Fund 2010 (213) State Route 160 Funds On October 3, 2001, the California Transportation Commission (CTC) passed Resolution No. R3497 approving relinquishment of State Route 160 to the from the south city limits to the south abutment of the American River Bridge. Effective October 19, 2001, the day following recordation of the Resolution of Relinquishment at the Sacramento County Recorder s office, the City officially owns State Route 160 within the limits stated above. Where were these funds spent in the past? The City Council received $7,401,976 as lump sum compensation for the relinquishment. Pursuant to Council direction, the funding is in a separate fund account to be used for financing of the state of good repair and maintenance of existing roadway facilities on the relinquishment section Annual CIP Appropriation STATE ROUTE 160 FUNDS FY06 FY07 FY08 FY09 FY10 Dollars in Thousands Are there restrictions on the use of the funds? The funding provided to the under CTC Resolution No. R3497 is for state of good repair and maintenance of existing roadway facilities on the relinquishment section in a manner consistent with good maintenance practices. These funds can be programmed as operational or capital in order to meet this goal. What legislation mandates use of these funds? California Transportation Commission Resolution No.R CAPITAL IMPROVEMENT PROGRAM L-8
287 CITY OF SACRAMENTO SUMMARY OF FUNDING SOURCES Fund 2011 (217) State Route 275 Funds On July 14, 2005, the California Transportation Commission passed Resolution No. R3601 approving relinquishment of State Route 275 (Capitol Mall Drive) to the from the east abutment of the Tower Bridge to 9 th Street. Where were these funds spent in the past? The City received $2,053,000 as lump sum compensation for the relinquishment. Per Council direction, the funds were placed in a separate fund account to be used for financing of the state of good repair and maintenance of existing roadway facilities on the relinquishment section. 1,500 1, Annual CIP Appropriation STATE ROUTE , FY06 FY07 FY08 FY09 FY10 Dollars in Thousands Are there restrictions on the use of the funds? The funds are to be spent on the relinquished section of Capitol Mall Drive for financing the state of good repair including rehabilitation, curb, gutter and sidewalk repair, accessibility compliance, street lighting, traffic signals, signing and striping, irrigation and maintenance for ten years. What legislation mandates use of these funds? California Transportation Commission Resolution No. R CAPITAL IMPROVEMENT PROGRAM L-9
288 CITY OF SACRAMENTO SUMMARY OF FUNDING SOURCES Fund 2012 (230) Transportation Systems Management (TSM) Fund City Ordinance No requires developers of projects that will accommodate 25 or more employees to comply with one of several Traffic System Management (TSM) measures to better utilize existing transportation facilities and to pay for capital improvements that would benefit the city s downtown transportation network as fulfillments of the TSM measure. Where were these funds spent in the past? TSM funds will be used to support downtown transit and downtown bicycle and pedestrian projects Annual CIP Appropriation TSM FUNDS FY06 FY07 FY08 FY09 FY10 Dollars in Thousands Are there restrictions on the use of the funds? Funds can only be used on facilities that increase the people moving capacity of the existing transportation system. What legislation mandates use of these funds? Comprehensive Zoning Ordinance of the, Ordinance No CAPITAL IMPROVEMENT PROGRAM L-10
289 CITY OF SACRAMENTO SUMMARY OF FUNDING SOURCES Fund 2013 (235) Transportation Development Act Funds The Transportation Development Act funds are used to account for receipts and disbursements of monies allocated pursuant to the State of California Transportation Development Act. These monies are obtained via application to the Sacramento Area Council of Governments (SACOG), which administers these funds. The City has traditionally dedicated these funds to bikeway development. Where were these funds spent in the past? Transportation Development Act funds have largely supported the maintenance and development of offstreet bikeway projects Annual CIP Appropriation TRANSPORTATION DEV. ACT FY06 FY07 FY08 FY09 FY10 Dollars in Thousands Are there restrictions on the use of the funds? Transportation and Development Act monies are eligible for expenditure for pedestrian and bikeway improvements, or for community transit improvements. What legislation mandates use of these funds? The State of California Transportation and Development Act (Government Code Title III, Division 3, Chapter 2, Article II) CAPITAL IMPROVEMENT PROGRAM L-11
290 CITY OF SACRAMENTO SUMMARY OF FUNDING SOURCES Fund 2016 (258) Development Services Fund This fund was established to reserve permit fees collected for development-related work that has not been completed. The fees are collected at the time of building permit issuance. Construction inspections occur over the life of the project(s), which may be 18 months or more for large projects. The fund includes a reserve to provide a soft landing during economic downturns. This fund will provide the City with the resources needed to retain a core of experienced and trained staff as the economy recovers. Where were these funds spent in the past? The fund has been used to support the Development Oversight Commission initiatives, advance monies for the General Plan update, and other development-related projects. 1,200 1, Annual CIP Appropriation DEVELOPMENT SERVICES 1, FY06 FY07 FY08 FY09 FY10 Dollars in Thousands Are there restrictions on the use of the funds? The fund must be used for development-related projects or activities. What legislation mandates use of these funds? City Council resolution # CAPITAL IMPROVEMENT PROGRAM L-12
291 CITY OF SACRAMENTO SUMMARY OF FUNDING SOURCES Funds 2020 (795) and 2021 (796) South Natomas Funds Fund 2020 (795)-South Natomas Community Infrastructure Fund (SNCIF) SNCIF was established in 1983 through development agreements for three properties adjacent to Interstate 5: Metropolitan Center, Gateway Center and Corporate Center. This program established special fees paid by developers for construction of various capital improvements to partially mitigate the impact of new commercial construction within the South Natomas area. The SNCIF development agreements expired in New development in these areas now requires payment of SNCIF fees at the FBA rate. Fund 2021 (796)-Facilities Benefit Assessment (FBA) District The FBA was formed in undeveloped or underdeveloped property within the South Natomas Community Plan area was included in the district, with the exception of property subject to the South Natomas development agreements. Fees are paid by developers and collected when building permits are issued. The purpose of the FBA District was to provide funding for infrastructure needs and community enhancements within the South Natomas Community Plan area. At the time of district formation, the City Council adopted a list of twenty-one specific projects to be paid with FBA funds. This program will ultimately fund $12.9 million dollars in transportation improvements. Where were these funds spent in the past? South Natomas is an area bounded by Garden Highway to the south, Interstate 80 on the west and north sides, and the Natomas East Main Drainage Canal on the east side Annual CIP Appropriation SOUTH NATOMAS FUNDS FY06 FY07 FY08 FY09 FY10 Dollars in Thousands Are there restrictions on the use of funds? The assessment district authorization identifies specific uses. What legislation mandates use of these funds? On June 10, 1986, the City Council adopted Ordinance number which establishes procedures for the formation of a Facility Benefit Assessment CAPITAL IMPROVEMENT PROGRAM L-13
292 CITY OF SACRAMENTO SUMMARY OF FUNDING SOURCES Fund 2023 (291) New Measure A Construction Funds New Measure A Project Funds account for revenue generated from a one-half percent sales tax, and countywide development impact fee program, beginning April 1, 2009, through March 31, Sales tax revenues and development impact fee revenues are allocated annually by percentage to specific programs according to ordinance number STA Where were these funds spent in the past? New Measure A Project Construction Funds will support five major transportation projects as approved in the ballot measure. Current allocations have been dedicated to the Intermodal Station project in the Railyards. Annual CIP Appropriation NEW MEASURE Annual CIP A Appropriation CONSTRUCTION NEW MEASURE A CONSTRUCTION , ,000 15, , , , FY06 FY07 FY08 FY09 FY10 FY03 FY04 FY05 FY06 FY07 Dollars in Thousands FY08 Dollars in Thousands Are there restrictions on the use of the funds? New Measure A Project Construction Funds are limited to the following projects: - Cosumnes River Blvd. (I-5 to Franklin Blvd.) - Cosumnes River Blvd. (I-5 Interchange Upgrade) - Folsom Blvd. (65th Street to Watt Ave.) - Richards Blvd. /I-5 Interchange Upgrade - Sacramento Intermodal Station. What legislation mandates use of these funds? Local Transportation Authority and Improvement Act (Pubic Utility Code Division 19, Section and Revenue and Taxation Code, Section ) CAPITAL IMPROVEMENT PROGRAM L-14
293 CITY OF SACRAMENTO SUMMARY OF FUNDING SOURCES Fund 2024 (292) Historic Places Fund This fund was established with one-time surplus funds to facilitate the preservation of Sacramento s historic properties by providing funds for the Sacramento Valley Station Historic Renovation Project and financial assistance in the form of loans or grants to owners of historic properties for repair and rehabilitation needs, with special consideration for low-income property owners and properties requiring urgent attention. Where were these funds spent in the past? Funds were first appropriated in FY2007/08. The funds will be used for the Sacramento Valley Station Historic Renovation Project Annual CIP Appropriation HISTORIC PLACE FUND FY06 FY07 FY08 FY09 FY10 Dollars in Thousands Are there restrictions on the use of the funds? The fund must be used for the Sacramento Valley Station Historic Renovation Project and for loans or grants to owners of historic properties for historic preservation. What legislation mandates use of these funds? City Council Resolution # CAPITAL IMPROVEMENT PROGRAM L-15
294 CITY OF SACRAMENTO SUMMARY OF FUNDING SOURCES Fund 2025 and 2026 New Measure A Construction and Maintenance Funds New Measure A Project, Construction and Maintenance Funds account for revenue generated from a one-half percent sales tax beginning April 1, 2009, through March 31, New Measure A also introduces and incorporates a countywide development impact fee program. Sales tax revenues and development impact fee revenues are allocated annually by percentage to specific programs according to ordinance number STA Where were these funds spent in the past? New Measure A Funds will largely support the ongoing citywide programs, including the Street Overlay and Seals Program and the Public Right-of-Way Accessibility Program starting in FY2009/10. Annual CIP Appropriation NEW MEASURE Annual CIP A Appropriation CONSTRUCTION NEW MEASURE A CONSTRUCTION , ,913 15, , ,226 5, FY06 FY07 FY08 FY09 FY10 FY03 FY04 FY05 FY06 FY07 Dollars in Thousands FY08 Dollars in Thousands Are there restrictions on the use of the funds? New Measure A Construction Funds have two program components (affecting the City of Sacramento): Traffic Control and Safety (traffic control system improvements, high priority pedestrian and vehicle safety projects, and emergency vehicle preemption systems); and Safety, Landscaping, Pedestrian and Bike Facilities (non-motorized, pedestrian and bicycle safety improvements). New Measure A Maintenance is restricted to the preservation and safety of public streets and road rights-of-way, including road reconstruction and repair, bridge maintenance, streetscape and lighting maintenance. What legislation mandates use of these funds? Local Transportation Authority and Improvement Act (Pubic Utility Code Division 19, Section and Revenue and Taxation Code, Section ) CAPITAL IMPROVEMENT PROGRAM L-16
295 CITY OF SACRAMENTO SUMMARY OF FUNDING SOURCES Funds 2232 (281) Landscape and Lighting Fund Landscape and Lighting Funds account for revenues generated from a citywide assessment district with assessments based on benefits to be received in each assessment area. Funds are used for safety lighting, median maintenance, parks rehabilitation, and neighborhood lighting maintenance. The Landscaping and Lighting Act of 1972 allows cities, counties and special districts to levy assessments for land purchase and the construction, operation and maintenance of parks, landscaping, lighting, traffic signals and graffiti abatement. Where were these funds spent in the past? Landscape and Lighting funds have largely supported landscaping, rehabilitation of structures and facilities, lighting and other park and recreational improvements. Lighting and Landscaping Bonds of $7.2 million were issued in FY1995/96 to finance capital improvements of parks. The debt service on these bonds is paid from the assessments. 1,400 1,200 1, Annual CIP Appropriation LANDSCAPE & LIGHTING 1,176 1,218 1,021 1,140 1,012 FY06 FY07 FY08 FY09 FY10 Dollars in Thousands Are there restrictions on the use of the funds? Funds are restricted according to an assessment formula; revenues are collected for specific expenditure categories park maintenance, lighting, capital projects, and median maintenance. Funds are available for expenditure within the Planning Area originally assessed. What legislation mandates use of these funds? California Streets & Highways Code Sec et Seq CAPITAL IMPROVEMENT PROGRAM L-17
296 CITY OF SACRAMENTO SUMMARY OF FUNDING SOURCES Fund 2507 (588) Land Park Trust Fund The purpose of the Land Park Trust Fund is to account for assessments in the area around Land Park for improvements to Land Park. Where were these funds spent in the past? Most recently, these funds have been spent for tree maintenance, a jogging trail, a rock garden and master planning Annual CIP Appropriation WILLIAM LAND PARK TRUST FY06 FY07 FY08 FY09 FY10 Dollars in Thousands Are there restrictions on the use of the funds? Funds must be used for improvements within William Land Park. What legislation mandates use of these funds? Sacramento City Code (Prior code ) CAPITAL IMPROVEMENT PROGRAM L-18
297 CITY OF SACRAMENTO SUMMARY OF FUNDING SOURCES Fund 2508 (710) Quimby Act Funds Quimby Fund is used to account for fees collected from developers in-lieu of land dedication for parks and recreation facilities. The revenues must be used for the purpose of developing new or rehabilitating existing neighborhoods or community parks or recreational facilities to serve the subdivision. Where were these funds spent in the past? Quimby Act funds have largely supported repair/remodeling projects for parks and recreation. Funds are allocated by planning areas which are: Central City, Land Park, Pocket, South Sacramento, East Broadway, East Sacramento, Arden Arcade, North Sacramento, South Natomas, North Natomas and Airport/Meadowview. 10,000 8,000 6,000 4,000 2,000 - Annual CIP Appropriation QUIMBY ACT FUNDS 3,078 1,655 8, FY06 FY07 FY08 FY09 FY10 Dollars in Thousands Are there restrictions on the use of the funds? Funds are restricted to the rehabilitation or new development of parks or recreational facilities that will serve the residential subdivisions that are assessed the fee. What legislation mandates use of these funds? Chapter of the Sacramento City Code. Pursuant to California Government Code Section 66477, the ordinance provides the authority and formula for the dedication or the payment of fees for subdivisions CAPITAL IMPROVEMENT PROGRAM L-19
298 CITY OF SACRAMENTO SUMMARY OF FUNDING SOURCES Fund 2603 (418) Golf Fund The Golf Fund derives its revenues from green fees, golf lessons, golf cart rentals, golf merchandise sales, and food and beverage concessions from the City s three municipal golf facilities. The City golf courses are: Haggin Oaks with two courses Alister MacKenzie and Arcade Creek; Bing Maloney and Bing Maloney Executive; and Bartley Cavanaugh. Where were these funds spent in the past? Projects that have received Golf funding include improvements to golf course greens and irrigation systems, and drainage systems and pathway improvements Annual CIP Appropriation GOLF FUND FY06 FY07 FY08 FY09 FY10 Dollars in Thousands Are there restrictions on the use of the funds? Funds are restricted for use in the operation, maintenance and debt service of City golf courses and may not exceed the estimated reasonable cost of providing these services. What legislation mandates use of these funds? Cities have the general authority to impose fees, sometimes called charges or rates, under the City s policy powers as defined by Article XIIIB, Section 8 of the California Constitution. There are specific procedures for fee and rate adoption (Government Code Section and et seq.) CAPITAL IMPROVEMENT PROGRAM L-20
299 CITY OF SACRAMENTO SUMMARY OF FUNDING SOURCES Fund 2700 (205) Block Grant/SHRA Funds SHRA designates some funds to be administered by the City for capital improvements in the City. These funds are Community Development Block Grant (CDBG) funds allocated under the Federal Housing and Community Development Act of 1977, to be used for providing decent housing and expanded economic opportunities for low and moderate-income persons, or from other sources. Funds are budgeted by the Sacramento Housing and Redevelopment Agency. Where were these funds spent in the past? Block Grant/SHRA Funds have largely supported street improvements, parks and community facility improvement projects Annual CIP Appropriation BLOCK GRANT / SHRA FUNDS FY06 FY07 FY08 FY09 FY10 Dollars in Thousands 0 Are there restrictions on the use of the funds? CDBG funds are restricted for use in geographic areas meeting federal guidelines which measure the need for decent housing and an improved living environment, and that can benefit from expanded economic opportunities. Specific improvement projects are submitted for approval and funding to the U.S. Department of Housing and Urban Development (HUD). Funding from HUD is restricted to the project awarded. What legislation mandates use of these funds? Housing and Community Development Act of CAPITAL IMPROVEMENT PROGRAM L-21
300 CITY OF SACRAMENTO SUMMARY OF FUNDING SOURCES Fund 3002 (711) 2002 Capital Improvement Revenue Bond The 2002 CIRB Funds [Fund 3002 (711)] are tax-exempt bond proceeds that will be used to finance the acquisition, construction and development of New City Hall, refurbishment of Historic City Hall and various other governmental capital improvement projects. Where were these funds spent in the past? These funds have been used to fund construction of New City Hall, the refurbishment of Historic City Hall, improvements at fire stations, and the acquisition of park land and fire apparatus Annual CIP Appropriation 2002 CIRB FUNDS FY06 FY07 FY08 FY09 FY10 Dollars in Thousands Are there restrictions on the use of the funds? These funds are must be used for authorized capital improvements and acquisitions as outlined in the original bond disclosure documents. What legislation mandates use of these funds? Resolution approved by the City Council on May 7, 2002 authorized the establishment of the 2002 Capital Improvement Revenue Bond (CIRB) Fund (Fund 711) CAPITAL IMPROVEMENT PROGRAM L-22
301 CITY OF SACRAMENTO SUMMARY OF FUNDING SOURCES Funds 3004 (713), 3005 (714), 3006 (715) and 3007 (716) 2002 and 2006 Capital Improvement Revenue Bonds (CIRBs) The 2002 CIRB Funds [Fund 3002 (711)] are tax-exempt, and the 2006 CIRB Funds are taxexempt [Fund 3004 (713) & 3006 (715)] and taxable [Fund 3005 (714) & 3007 (716)] bond proceeds that will be used to finance the acquisition, construction and development of parks, recreation facilities, libraries, transportation improvements, community and other governmental facilities. Where were these funds spent in the past? The 2006 CIRB is a funding source approved by the City Council in This funding is for capital improvement projects (CIPs). The projects funded by the 2006 CIRB include the Community Reinvestment Capital Improvement Program (CRCIP) and the acquisition and improvement of 300 Richards Boulevard Annual CIP Appropriation 2006 CIRB FUNDS 0 99, FY06 FY07 FY08 FY09 FY10 Dollars in Thousands Are there restrictions on the use of the funds? These funds must be used on Tier I and Tier II Community Reinvestment Capital Improvement Program (CRCIP) projects and for 300 Richards Boulevard site acquisition and improvements. What legislation mandates use of these funds? Resolution approved by the City Council on May 23, 2006 established Funds 3004 (713) and 3005 (714) and Resolution approved by the City Council on November 21, 2006 established Funds 3006 (715) and 3007 (716) CAPITAL IMPROVEMENT PROGRAM L-23
302 CITY OF SACRAMENTO SUMMARY OF FUNDING SOURCES Fund 3201 (780) North Natomas Fund This Public Facility Fee (PFF) was established with the adoption of the North Natomas Financing Plan. The plan was first approved in 1994, and was last updated in The PFF area includes the entire North Natomas Community Plan. The PFF will ultimately fund $209.1 million dollars in public improvement facilities. These include a fire station, police sub-station, a community center library, shuttles, bikeways, freeway improvements, landscaping, major roads, bridges and signals. Payment of the PFF is required of all private development projects in North Natomas. The impact fee is structured to insure that basic infrastructure is in place when deeded for the development; the cost of major infrastructure is distributed equally among the property owners; and each developer pays a fair-share for necessary infrastructure. Where were these funds spent in the past? This fee has been spent in accordance with the North Natomas Financing Plan. 4,000 3,000 2,000 1,000 0 Annual CIP Appropriation NORTH NATOMAS 3,324 3,796 1,010 1,010 1,010 FY06 FY07 FY08 FY09 FY10 Dollars in Thousands Are there restrictions on the use of the funds? These funds must be used as specified in the North Natomas Financing Plan. What legislation mandates use of these funds? Sacramento City Ordinance No CAPITAL IMPROVEMENT PROGRAM L-24
303 CITY OF SACRAMENTO SUMMARY OF FUNDING SOURCES Fund 3204 (791) Park Impact Fee The Park Impact Fee is a revenue source approved by City Council in August This fund is comprised of fees collected from developers at the time a building permit is issued. The revenue must be used to benefit the residents of the planning area from which the fee was collected. Where were these funds spent in the past? The Park Development Impact Fee has largely supported new development and rehabilitation projects for parks and recreation. Funds are allocated by community planning areas which are: Central City, Land Park, Pocket, South Area, Fruitridge Broadway, East Sacramento, Arden Arcade, North Sacramento, South Natomas, and North Natomas. 10,000 8,000 6,000 4,000 2,000 - Annual CIP Appropriation PARK IMPACT FEE 6,481 4,091 8, ,548 FY06 FY07 FY08 FY09 FY10 Dollars in Thousands Are there restrictions on the use of the funds? Funds are restricted for use in the Planning Area from where the fees were paid. What legislation mandates use of these funds? Sacramento City Ordinance No CAPITAL IMPROVEMENT PROGRAM L-25
304 CITY OF SACRAMENTO SUMMARY OF FUNDING SOURCES Fund 3701 (206) SHRA/Redevelopment Tax Increment Downtown The Sacramento Housing and Redevelopment Agency receives tax increment revenue from redevelopment project areas that are designated by the City Council. Tax increment revenue is derived from property taxes resulting from increases in assessed value on all properties in excess of the assessed value that existed in the year that the project area was created. These funds are under the control of the s Economic Development Department (for Downtown and Richards Boulevard) and administered by SHRA for the remaining redevelopment areas. Where were these funds spent in the past? In each redevelopment area, funds are used for bonded indebtedness principal and interest, operations, infrastructure, housing projects and commercial projects Annual CIP Appropriation SHRA - DOWNTOWN FUNDS FY06 FY07 FY08 FY09 FY10 Dollars in Thousands 0 Are there restrictions on the use of the funds? An agency must establish debt in order to receive tax increment revenue. Tax increment revenue must be used only for redevelopment purposes and to the benefit of the project area in which the revenue was generated. Twenty or thirty percent of the revenue must be allocated for low- and moderate-income housing, depending upon the rules affecting the particular redevelopment project area. Funds may not be used for employees or contractual purposes unless the services are directly related to defined redevelopment purposes. Funds may not be used for normal maintenance or operations of buildings, facilities, structures or other publicly owned properties, or for the construction of city halls or county administration buildings. What legislation mandates use of these funds? Community Redevelopment Law (Health and Safety Code Section et seq.) CAPITAL IMPROVEMENT PROGRAM L-26
305 CITY OF SACRAMENTO SUMMARY OF FUNDING SOURCES Funds 3702 (248), 3703 (511) and 3704 (512) Capital Grants Funds Capital Grants Funds account for various grants received from developers, the state, the federal government and other agencies, that are designated to be used for specific projects or purposes. Each dollar spent must be accounted for and is audited to assure that the monies were spent for the project intended. Where were these funds spent in the past? Capital Grants have largely supported bikeways, street improvements, and streetscape enhancements, as well as Parks and Utilities projects. 35,000 30,000 25,000 20,000 15,000 10,000 5,000 0 Annual CIP Appropriation CAPITAL GRANTS FUNDS 9,121 4,224 14,345 32,799 FY06 FY07 FY08 FY09 FY10 Dollars in Thousands 0 Are there restrictions on the use of the funds? Funds are restricted to the specific project or purpose for which the grant was awarded or as designated in the development agreement. What legislation mandates use of these funds? There is no specific ordinance or legislation directing the use of Capital Grants Funds. Granting agencies that allocate funds to the City for capital projects administer any legal or administrative requirements specific to each grant CAPITAL IMPROVEMENT PROGRAM L-27
306 CITY OF SACRAMENTO SUMMARY OF FUNDING SOURCES Fund 6004 (412) Parking Fund The Parking Fund provides for the operation, maintenance, and improvements of City-owned parking facilities. Parking Fund revenues are from parking and retail lease charges within offstreet parking facilities. These revenues are then used to pay for parking facility operations, capital improvements, and new facility development. Where were these funds spent in the past? Parking funds have mainly supported parking projects. The construction of the Memorial Garage was one of the larger projects undertaken in recent years. Other projects that are currently underway include the Downtown Plaza Way Finding project, the structural repairs to City-owned parking facilities, and the upgrading of the parking revenue control system. 3,400 3,200 3,000 2,800 2,600 2,400 Annual CIP Appropriation PARKING FUND 2,788 2,878 3,325 2,878 2,878 FY06 FY07 FY08 FY09 FY10 Dollars in Thousands Are there restrictions on the use of the funds? The Parking Fund is an Enterprise Fund. Generally, revenues are to be used to offset Enterprise operations and improvements, and may not exceed the estimated reasonable cost of providing these services. What legislation mandates use of these funds? Cities have general authority to impose fees, sometimes called charges or rates, under the City s police powers as defined by Article XI, Section 7 or Article XIIIB, Section 8 of the California Constitution. There are no specific procedures for fee and rate adoption (Government Code & et seq.) CAPITAL IMPROVEMENT PROGRAM L-28
307 CITY OF SACRAMENTO SUMMARY OF FUNDING SOURCES Fund 6005 (413) Water Fund The Water Fund is used to account for the activities associated with the production, distribution and transmission of potable water by the City to its users. The Water Fund supports both the capital and operating costs of providing potable water throughout the city including production, treatment, and distribution systems. Revenues are generated by user fees. In addition, the fund receives revenues from development fees, which are used for system improvements necessitated by growth. Where were these funds spent in the past? Water funds have largely supported projects in maintaining a healthy water supply system in conjunction with a comprehensive infrastructure maintenance and expansion program. 30,000 25,000 20,000 15,000 10,000 5,000 0 Annual CIP Appropriation WATER FUND 10,653 21,621 25,953 14,313 13,523 FY06 FY07 FY08 FY09 FY10 Dollars in Thousands Are there restrictions on the use of the funds? The Water Fund is an Enterprise Fund. Generally, revenues are to be used to offset Enterprise operations and improvements and may not exceed the estimated reasonable cost of providing these services, plus overhead. What legislation mandates use of these funds? Cities have the general authority to impose fees, sometimes called charges or rates, under the City s policy powers as defined by Article XI, Section 7 or Article IIIB, Section 8 of the California Constitution. There are specific procedures for fee and rate adoption (Government Code Section and et seq.) CAPITAL IMPROVEMENT PROGRAM L-29
308 CITY OF SACRAMENTO SUMMARY OF FUNDING SOURCES Fund 6006 (414) Sewer Fund The Sewer Fund accounts for the maintenance, repair and replacement of facilities for collecting, conveying, and pumping sanitary and combined sewage to the major interceptor sewers of the Regional Sanitation District. User fees finance operating costs and capital improvements. Where were these funds spent in the past? Sewer funds have largely supported sewer projects, which include repairing, rehabilitating, and improving the sanitary and combined sewer systems. 10,000 8,000 6,000 4,000 Annual CIP Appropriation SEWER FUND 6,071 8,288 4,240 4,101 3,315 2,000 0 FY06 FY07 FY08 FY09 FY10 Dollars in Thousands Are there restrictions on the use of the funds? The Sewer Fund is an Enterprise Fund. Generally, revenues are to be used to offset Enterprise operations and improvements and may not exceed the estimated reasonable cost of providing these services, plus overhead. What legislation mandates use of these funds? Cities have the general authority to impose fees, sometimes called charges or rates, under the City s police powers as defined by Article XI, Section 7 or Article IIIB, Section 8 of the California Constitution. There are specific procedures for fee and rate adoption (Gov t Code Sec and et. seq.) CAPITAL IMPROVEMENT PROGRAM L-30
309 CITY OF SACRAMENTO SUMMARY OF FUNDING SOURCES Funds 6007 (415) Solid Waste Fund The Solid Waste Fund accounts for the operation, maintenance and related capital improvements of the City s refuse collection and disposal services. In addition, garden refuse, street sweeping, recycling, and a variety of community service programs are provided from this Fund. Revenues are generated from user fees. Where were these funds spent in the past? Solid Waste funds have largely supported solid waste projects such as maintenance, operations, and vehicle needs Annual CIP Appropriation SOLID WASTE FUND 1, FY06 FY07 FY08 FY09 FY10 Dollars in Thousands Are there restrictions on the use of the funds? The Solid Waste Fund is an Enterprise Fund. Generally, revenues are to be used to offset Enterprise operations and improvements and may not exceed the estimated reasonable cost of providing these services, plus overhead. What legislation mandates use of these funds? Cities have the general authority to impose fees, sometimes called charges or rates, under the City s policy powers as defined by Article XI, Section 7 or Article IIIB, Section 8 of the California Constitution. There are specific procedures for fee and rate adoption (Gov t. Code Sec and et seq.) CAPITAL IMPROVEMENT PROGRAM L-31
310 CITY OF SACRAMENTO SUMMARY OF FUNDING SOURCES Fund 6009 (417) Marina Fund The Marina operates as an Enterprise Fund in which revenues must offset the full cost of Marina operations, capital improvements, and debt service for 475 berths. Marina revenues are derived from berth rental fees, fuel sales, concession and interest earnings at the Sacramento Marina, located on the Sacramento River at Miller Park. Where were these funds spent in the past? Marina Funds support Marina operations and capital projects such as docking facility replacement, harbor dredging, and bank stabilization. 7,000 6,000 5,000 4,000 3,000 2,000 1,000 0 Annual CIP Appropriation MARINA FUND 5,915 1,090 1, FY06 FY07 FY08 FY09 FY10 Dollars in Thousands Are there restrictions on the use of the funds? Funds are restricted for use in Marina operations and capital improvements and may not exceed the estimated reasonable cost of providing services. What legislation mandates use of these funds? Cities have general authority to impose fees, sometimes called charges or rates, under the City s police powers as defined by Article XI, Section 7 or Article XIIIB, Section 8 of the California Constitution. There are no specific procedures for fee and rate adoption (Government Code Section & et seq.) CAPITAL IMPROVEMENT PROGRAM L-32
311 CITY OF SACRAMENTO SUMMARY OF FUNDING SOURCES Fund 6010 (419) Community Center Fund The Community Center Fund, which accounts for the operation of the Sacramento Convention Center Complex (including the Community Center Theater) and Memorial Auditorium, is supported mainly by Transient Occupancy Taxes (TOT), facility user fees and interest earnings. The Transient Occupancy Tax is a general tax charged to individuals who occupy a room(s) in a hotel, motel, etc. User fees include facility rental fees, equipment and service fees. Where were these funds spent in the past? Community Center funds have supported Community Center Complex projects including the needs assessment and initial design for the Community Center Theater renovation, repair of the Memorial Auditorium stage and replacement of the Convention Center carpeting. 3,000 2,500 2,000 1,500 1, Annual CIP Appropriation COMMUNITY CENTER FUND ,105 2,420 1,650 FY06 FY07 FY08 FY09 FY10 Dollars in Thousands Are there restrictions on the use of the funds? These funding sources are directed to support Community Center Complex operations, capital requirements, and debt service. What legislation mandates use of these funds? Revenue and Taxation Code, Sections 7280 and 7281 and City Ordinance CAPITAL IMPROVEMENT PROGRAM L-33
312 CITY OF SACRAMENTO SUMMARY OF FUNDING SOURCES Fund 6011 (425) Storm Drainage Fund The Storm Drainage Fund is an Enterprise Fund, which is self-supporting through fees and charges to the consumers. The fees collected for storm drainage are used to account for the activities and maintenance of the city s surface drainage system and 90 storm-pumping stations. Revenues are generated through user fees. Where were these funds spent in the past? Storm Drainage funds have largely supported Sewer and Storm Drainage projects such as repairing, rehabilitating and improving its storm drainage infrastructure, as well as maintaining the system in a manner which balances system-wide projections in individual drainage basins. 7,000 6,000 5,000 4,000 3,000 2,000 1,000 0 Annual CIP Appropriation STORM DRAINAGE FUND 5,165 5,228 6,062 1,000 1,425 FY06 FY07 FY08 FY09 FY10 Dollars in Thousands Are there restrictions on the use of the funds? The Storm Drainage Fund is an Enterprise Fund. Generally, revenues are to be used to offset Enterprise operations and improvements and may not exceed the estimated reasonable cost of providing these services, plus overhead. What legislation mandates use of these funds? Cities have the general authority to impose fees, sometimes called charges or rates, under the City s police powers as defined by Article XI, Section 7 or Article IIIB, Section 8 of the California Constitution. There are specific procedures for fee and rate adoption (Government Code Section and et. seq.) CAPITAL IMPROVEMENT PROGRAM L-34
313 CITY OF SACRAMENTO SUMMARY OF FUNDING SOURCES Fund 6501 (420) Fleet Management Fund The Fleet Management Fund was established to finance and account for services and commodities furnished by Fleet Services to other departments. Services and commodities, supplied exclusively to other departments of the City include the maintenance, repair, fueling, and replacement of the City s vehicular equipment. The Fund receives its revenue from charges to other City organizations for services received. Where were these funds spent in the past? Fleet Management funds have largely supported repair/remodel and technology projects. The larger of these projects include: Underground fuel storage and support, 24 th Street City Corporation Center maintenance, fleet facilities, and fleet management technology upgrades Annual CIP Appropriation FLEET FUND FY06 FY07 FY08 FY09 FY10 Dollars in Thousands Are there restrictions on the use of the funds? Funds are used for fleet operations, fleet replacement, and fleet facility improvements. What legislation mandates use of these funds? There is no specific ordinance or legislation directing the use of funds CAPITAL IMPROVEMENT PROGRAM L-35
314 CITY OF SACRAMENTO SUMMARY OF FUNDING SOURCES Fund 9101 (983) SHRA/Community Development Block Grant Fund Community Development Block Grant Funds in this area are those projects which are administered by SHRA within City boundaries. The allocation is authorized by the Federal Housing and Community Development Act of 1974, to be used for providing decent housing and a suitable living environment, and expanding economic opportunities, principally for persons of low- and moderate-income. Funds are administered by SHRA in accordance with the Consolidated Plan (a strategic planning document), and allocated by the annual Action Plan (a budget document), both of which are adopted by the City Council after public review. Some of the projects funded in the Action Plan are City capital improvements projects which are carried out by City departments. Where were these funds spent in the past? In the past, CDBG funds have supported street improvements, park projects and community centers, and other resource facilities Annual CIP Appropriation SHRA - BLOCK GRANT FUNDS 980 1, FY06 FY07 FY08 FY09 FY10 Dollars in Thousands Are there restrictions on the use of the funds? Eligible uses of CDBG funds include capital improvements which: 1) provide direct benefits to low- moderate-income individuals; 2) provide benefits to a community which is composed predominantly of low- moderate-income households; 3) remove architectural barriers; and/or 4) eliminate blight. Ineligible uses include assistance to buildings or portions thereof used for the general conduct of government. What legislation mandates use of these funds? Title One of the Housing and Community Development Act of 1974 as amended CAPITAL IMPROVEMENT PROGRAM L-36
315 CITY OF SACRAMENTO SUMMARY OF FUNDING SOURCES Fund 9206 (986) SHRA/Redevelopment Tax Increment Alkali Flat The Sacramento Housing and Redevelopment Agency receives tax increment revenue from redevelopment project areas that are designated by the City Council. Tax increment revenue is derived from property taxes resulting from increases in assessed value on all properties in excess of the assessed value that existed in the year that the project area was created. Where were these funds spent in the past? In each redevelopment area, funds are used for bonded indebtedness principal and interest, operations, infrastructure, housing projects and commercial projects. 1, Annual CIP Appropriation SHRA - ALKALI FLAT FUNDS FY06 FY07 FY08 FY09 FY10 Dollars in Thousands Are there restrictions on the use of the funds? An agency must establish debt in order to receive tax increment revenue. Tax increment revenue must be used only for redevelopment purposes and to the benefit of the project area in which the revenue was generated. Twenty percent of the revenue must be allocated for lowand moderate-income housing. Funds may not be used for employees or contractual purposes unless the services are directly related to defined redevelopment purposes. Funds may not be used for normal maintenance or operations of buildings, facilities, structures or other publicly owned properties, or for the construction of city halls or county administration buildings. What legislation mandates use of these funds? Community Redevelopment Law (Health and Safety Code Section et seq.) CAPITAL IMPROVEMENT PROGRAM L-37
316 CITY OF SACRAMENTO SUMMARY OF FUNDING SOURCES Fund 9211 (987) SHRA/Redevelopment Tax Increment - Franklin Boulevard Funds The Sacramento Housing and Redevelopment Agency receives tax increment revenue from redevelopment project areas that are designated by the City Council. Tax increment revenue is derived from property taxes resulting from increases in assessed value on all properties in excess of the assessed value that existed in the year that the project area was created. The Franklin Boulevard Redevelopment Area is located in both the and the County of Sacramento. Projects located in either jurisdiction must be approved by that jurisdiction. Where were these funds spent in the past? In each redevelopment area, funds are used for bonded indebtedness principal and interest, operations, infrastructure, housing projects and commercial projects Annual CIP Appropriation SHRA - FRANKLIN BLVD. FUNDS 927 1,075 1,803 2,101 1, FY06 FY07 FY08 FY09 FY10 Dollars in Thousands Are there restrictions on the use of the funds? An agency must establish debt in order to receive tax increment revenue. Tax increment revenue must be used only for redevelopment purposes and to the benefit of the project area in which the revenue was generated. Twenty percent of the revenue must be allocated for lowand moderate-income housing. Funds may not be used for employees or contractual purposes unless the services are directly related to defined redevelopment purposes. Funds may not be used for normal maintenance or operations of buildings, facilities, structures or other publicly owned properties, or for the construction of city halls or county administration buildings. What legislation mandates use of these funds? Community Redevelopment Law (Health and Safety Code Section et seq.) CAPITAL IMPROVEMENT PROGRAM L-38
317 CITY OF SACRAMENTO SUMMARY OF FUNDING SOURCES Fund 9216 (988) SHRA/Redevelopment Tax Increment North Sacramento The Sacramento Housing and Redevelopment Agency receives tax increment revenue from redevelopment project areas that are designated by the City Council. Tax increment revenue is derived from property taxes resulting from increases in assessed value on all properties in excess of the assessed value that existed in the year that the project area was created. Where were these funds spent in the past? In each redevelopment area, funds are used for bonded indebtedness principal and interest, operations, infrastructure, housing projects and commercial projects. 2,000 1,500 1, Annual CIP Appropriation SHRA - NORTH SACRAMENTO FUNDS ,786 0 FY06 FY07 FY08 FY09 FY10 Dollars in Thousands Are there restrictions on the use of the funds? An agency must establish debt in order to receive tax increment revenue. Tax increment revenue must be used only for redevelopment purposes and to the benefit of the project area in which the revenue was generated. Twenty percent of the revenue must be allocated for lowand moderate-income housing. Funds may not be used for employees or contractual purposes unless the services are directly related to defined redevelopment purposes. Funds may not be used for normal maintenance or operations of buildings, facilities, structures or other publicly owned properties, or for the construction of city halls or county administration buildings. What legislation mandates use of these funds? Community Redevelopment Law (Health and Safety Code Section et seq.) CAPITAL IMPROVEMENT PROGRAM L-39
318 CITY OF SACRAMENTO SUMMARY OF FUNDING SOURCES Fund 9221 (989) SHRA/Redevelopment Tax Increment Oak Park Funds The Sacramento Housing and Redevelopment Agency receives tax increment revenue from redevelopment project areas that are designated by the City Council. Tax increment revenue is derived from property taxes resulting from increases in assessed value on all properties in excess of the assessed value that existed in the year that the project area was created. Where were these funds spent in the past? In each redevelopment area, funds are used for bonded indebtedness principal and interest, operations, infrastructure, housing projects and commercial projects. 4,000 3,000 2,000 1,000 Annual CIP Appropriation SHRA - OAK PARK FUNDS 1,812 1,149 3,642 3, FY06 FY07 FY08 FY09 FY10 Dollars in Thousands Are there restrictions on the use of the funds? An agency must establish debt in order to receive tax increment revenue. Tax increment revenue must be used only for redevelopment purposes and to the benefit of the project area in which the revenue was generated. Twenty percent of the revenue must be allocated for lowand moderate-income housing. Funds may not be used for employees or contractual purposes unless the services are directly related to defined redevelopment purposes. Funds may not be used for normal maintenance or operations of buildings, facilities, structures or other publicly owned properties, or for the construction of city halls or county administration buildings. What legislation mandates use of these funds? Community Redevelopment Law (Health and Safety Code Section et seq.) CAPITAL IMPROVEMENT PROGRAM L-40
319 CITY OF SACRAMENTO SUMMARY OF FUNDING SOURCES Fund 9226 (990) SHRA/Redevelopment Tax Increment Stockton Boulevard Funds The Sacramento Housing and Redevelopment Agency receives tax increment revenue from redevelopment project areas that are designated by the City Council. Tax increment revenue is derived from property taxes resulting from increases in assessed value on all properties in excess of the assessed value that existed in the year that the project area was created. The Stockton Boulevard Redevelopment Area is located in both the and the County of Sacramento. Projects located in either jurisdiction must be approved by that jurisdiction. Where were these funds spent in the past? In each redevelopment area, funds are used for bonded indebtedness principal and interest, operations, infrastructure, housing projects and commercial projects Annual CIP Appropriation SHRA - STOCKTON BLVD. FUNDS 771 1,145 1,357 1, FY06 FY07 FY08 FY09 FY10 Dollars in Thousands Are there restrictions on the use of the funds? An agency must establish debt in order to receive tax increment revenue. Tax increment revenue must be used only for redevelopment purposes and to the benefit of the project area in which the revenue was generated. Twenty percent of the revenue must be allocated for lowand moderate- income housing. Funds may not be used for employees or contractual purposes unless the services are directly related to defined redevelopment purposes. Funds may not be used for normal maintenance or operations of buildings, facilities, structures or other publicly owned properties, or for the construction of city halls or county administration buildings. What legislation mandates use of these funds? Community Redevelopment Law (Health and Safety Code Section et seq.) CAPITAL IMPROVEMENT PROGRAM L-41
320 CITY OF SACRAMENTO SUMMARY OF FUNDING SOURCES Fund 9231 (991) SHRA/Redevelopment Tax Increment Del Paso Heights The Sacramento Housing and Redevelopment Agency receives tax increment revenue from redevelopment project areas that are designated by the City Council. Tax increment revenue is derived from property taxes resulting from increases in assessed value on all properties in excess of the assessed value that existed in the year that the project area was created. Where were these funds spent in the past? In each redevelopment area, funds are used for bonded indebtedness principal and interest, operations, infrastructure, housing projects and commercial projects. 3,000 2,500 2,000 1,500 1, Annual CIP Appropriation SHRA - DEL PASO HEIGHTS FUNDS ,579 1,228 FY06 FY07 FY08 FY09 FY10 Dollars in Thousands Are there restrictions on the use of the funds? An agency must establish debt in order to receive tax increment revenue. Tax increment revenue must be used only for redevelopment purposes and to the benefit of the project area in which the revenue was generated. Twenty percent of the revenue must be allocated for lowand moderate-income housing. Funds may not be used for employees or contractual purposes unless the services are directly related to defined redevelopment purposes. Funds may not be used for normal maintenance or operations of buildings, facilities, structures or other publicly owned properties, or for the construction of city halls or county administration buildings. What legislation mandates use of these funds? Community Redevelopment Law (Health and Safety Code Section et seq.) CAPITAL IMPROVEMENT PROGRAM L-42
321 CITY OF SACRAMENTO SUMMARY OF FUNDING SOURCES Fund 9236 (992) SHRA/Redevelopment Tax Increment Army Depot Fund The Sacramento Housing and Redevelopment Agency receives tax increment revenue from redevelopment project areas that are designated by the City Council. Tax increment revenue is derived from property taxes resulting from increases in assessed value on all properties in excess of the assessed value that existed in the year that the project area was created. Where were these funds spent in the past? In each redevelopment area, funds are used for bonded indebtedness principal and interest, operations, infrastructure, housing projects and commercial projects. 3,500 3,000 2,500 2,000 1,500 1, Annual CIP Appropriation SHRA - ARMY DEPOT FUNDS 1, ,779 3,116 2,828 FY06 FY07 FY08 FY09 FY10 Dollars in Thousands Are there restrictions on the use of the funds? An agency must establish debt in order to receive tax increment revenue. Tax increment revenue must be used only for redevelopment purposes and to the benefit of the project area in which the revenue was generated. Twenty percent of the revenue must be allocated for lowand moderate- income housing. Funds may not be used for employees or contractual purposes unless the services are directly related to defined redevelopment purposes. Funds may not be used for normal maintenance or operations of buildings, facilities, structures or other publicly owned properties, or for the construction of city halls or county administration buildings. What legislation mandates use of these funds? Community Redevelopment Law (Health and Safety Code Section et seq.) CAPITAL IMPROVEMENT PROGRAM L-43
322 CITY OF SACRAMENTO SUMMARY OF FUNDING SOURCES Fund 9241 (993) SHRA/Redevelopment Tax Increment Auburn Boulevard Redevelopment Area The Sacramento Housing and Redevelopment Agency receives tax increment revenue from redevelopment project areas that are designated by the City Council. Tax increment revenue is derived from property taxes resulting from increases in assessed value on all properties in excess of the assessed value that existed in the year that the project area was created. Where were these funds spent in the past? In each redevelopment area, funds are used for bonded indebtedness principal and interest, operations, infrastructure, housing projects and commercial projects Annual CIP Appropriation SHRA - AUBURN BLVD FUNDS FY06 FY07 FY08 FY09 FY10 Dollars in Thousands Are there restrictions on the use of the funds? An agency must establish debt in order to receive tax increment revenue. Tax increment revenue must be used only for redevelopment purposes and to the benefit of the project area in which the revenue was generated. Twenty percent of the revenue must be allocated for lowand moderate- income housing. Funds may not be used for employees or contractual purposes unless the services are directly related to defined redevelopment purposes. Funds may not be used for normal maintenance or operations of buildings, facilities, structures or other publicly owned properties, or for the construction of city halls or county administration buildings. What legislation mandates use of these funds? Community Redevelopment Law (Health and Safety Code Section et seq.) CAPITAL IMPROVEMENT PROGRAM L-44
323 CITY OF SACRAMENTO SUMMARY OF FUNDING SOURCES Fund 9246 (994) SHRA/Redevelopment Tax Increment 65 th Street Redevelopment Area The Sacramento Housing and Redevelopment Agency receives tax increment revenue from redevelopment project areas that are designated by the City Council. Tax increment revenue is derived from property taxes resulting from increases in assessed value on all properties in excess of the assessed value that existed in the year that the project area was created. Where were these funds spent in the past? In each redevelopment area, funds are used for bonded indebtedness principal and interest, operations, infrastructure, housing projects and commercial projects. 1, Annual CIP Appropriation SHRA - 65TH STREET FUNDS FY06 FY07 FY08 FY09 FY10 Dollars in Thousands Are there restrictions on the use of the funds? An agency must establish debt in order to receive tax increment revenue. Tax increment revenue must be used only for redevelopment purposes and to the benefit of the project area in which the revenue was generated. Twenty percent of the revenue must be allocated for lowand moderate-income housing. Funds may not be used for employees or contractual purposes unless the services are directly related to defined redevelopment purposes. Funds may not be used for normal maintenance or operations of buildings, facilities, structures or other publicly owned properties, or for the construction of city halls or county administration buildings. What legislation mandates use of these funds? Community Redevelopment Law (Health and Safety Code Section et seq.) CAPITAL IMPROVEMENT PROGRAM L-45
324 CITY OF SACRAMENTO SUMMARY OF FUNDING SOURCES Fund 9501 (999) Developer Credit/Obligation Projects This fund was established in the five-year capital improvement program to facilitate the appropriation process for projects resulting from developer reimbursement agreements involving fee credits. Fee credits represent foregone fee revenue accepted by the City in exchange for dedicated infrastructure or park improvements. Fee credits are obligations of the City until they are redeemed and are used by developers to offset future City fees. What is the purpose of this fund? This fund was established in the fiveyear capital improvement program to facilitate the appropriation process for projects resulting from developer reimbursement agreements involving fee credits. 20,000 15,000 10,000 5,000 0 Annual CIP Appropriation DEVELOPER CREDITS 18,773 9,512 9, FY06 FY07 FY08 FY09 FY10 Dollars in Thousands Are there restrictions on the use of the funds? Reimbursements for developer-funded projects are restricted to the development impact fee program associated with the infrastructure received by the City. What legislation mandates use of these funds? Development impact fee programs enabled by City Code Title 18 of the Sacramento City Code and Government Code Section et seq. allows the use of these funds CAPITAL IMPROVEMENT PROGRAM L-46
325 CITY OF SACRAMENTO CIP INDEX BY PROGRAM AREA Projects Receiving New Funding: By Project Number By Funding Source CAPITAL IMPROVEMENT PROGRAM M
326
327 Projects Receiving New Funding Est Detail Org Project Budget through FY Complete Sheet 6/2009 Unobligated 2009/ / / / /14 Initiated Date Section Availabl 1001 GENERAL FUND A IT EQUIPMENT REPLACEMENT $1,736,499 $615,188 $437,860 $437,860 $437,860 $437,860 $437, DD Yes A CITYWIDE FIBER EXPANSION $217,351 $182,057 $20,000 $20,000 $20,000 $20,000 $20, DD Yes A VOIC REPLACEMENT 1311 $1,464,643 $145,092 -$145,092 $0 $0 $0 $ DD Yes A PLANNING TECHNOLOGY $1,092,747 $230,178 $56,600 $56,600 $56,600 $56,600 $56, DD Yes C FACILITY ADA COMPLIANCE $2,976,200 $2,000,000 $0 $500,000 $500,000 $500,000 $500, /2013 DD Yes C CITY FACILITY DEFERRED $11,200,135 $255,532 $500,000 $1,000,000 $1,000,000 $1,000,000 $1,000, /2010 DD Yes D CTY TREASURER IVST MGT RSV $1,620,000 $730,085 -$500,000 $0 $0 $0 $ DD Yes F ADVANCE LIFE SUPPORT ALS $1,080,000 $1,080,000 $1,080,000 $1,080,000 $1,080,000 $1,080,000 $1,080, EE Yes F FIRE APPARATUS EQUIPMENT $7,240,417 $814,850 $218,423 $468,423 $718,423 $968,423 $968, EE Yes F PSAF GENERATOR UPGRADES $1,673,382 $670,181 $150,000 $150,000 $150,000 $150,000 $150, EE Yes $30,301,374 $6,723,163 $1,817,791 $3,712,883 $3,962,883 $4,212,883 $4,212, MEASURE A - PROJECT R HOLLOW SIDEWALK $0 $0 $65,000 $65,000 $65,000 $65,000 $65, /2014 II Yes R TRAFFIC SIGNAL EQUIPMENT $0 $0 $205,000 $205,000 $205,000 $205,000 $205, /2014 II Yes S NEIGHBORHOOD TRAFFIC $0 $0 $400,000 $400,000 $400,000 $400,000 $400, /2014 II Yes S SPEED HUMPS PROGRAM $0 $0 $6,000 $6,000 $6,000 $0 $ /2014 II Yes S TRAFFIC OPERATIONS CENTER $0 $0 $50,000 $50,000 $50,000 $25,000 $ /2014 II Yes S ON STREET ANGLED PARKING $0 $0 $25,000 $25,000 $0 $0 $ /2014 II Yes S MEDIAN TURN LANE PROGRAM $0 $0 $50,000 $50,000 $50,000 $50,000 $50, /2014 II Yes T PEDESTRIAN IMPROVEMENT $0 $0 $50,000 $50,000 $50,000 $50,000 $50, /2014 II Yes T PUBLIC RIGHTS-OF-WAY $0 $0 $2,123,000 $2,123,000 $2,073,000 $2,023,000 $1,948, /2014 II Yes T MAJOR STREET $0 $0 $569,000 $569,000 $569,000 $569,000 $569, /2014 II Yes $0 $0 $3,543,000 $3,543,000 $3,468,000 $3,387,000 $3,287, GAS TAX 2106 C CORP YARD MAINTENANCE $110,000 $136 $20,000 $20,000 $20,000 $20,000 $20, /2013 DD Yes R STREET LIGHT RELAMP $0 $0 $85,000 $85,000 $85,000 $85,000 $85, /2014 II Yes S CAPTAIN JERRY S SAFETY $0 $0 $15,000 $15,000 $15,000 $15,000 $15, /2014 II Yes T ADVANCED TRANSPORTATION $0 $0 $400,000 $400,000 $400,000 $400,000 $400, /2014 II Yes T ALLEY ABATEMENT PROGRAM $60,000 $45,000 $60,000 $60,000 $60,000 $60,000 $60, /2014 II Yes $170,000 $45,136 $580,000 $580,000 $580,000 $580,000 $580, MAJOR STREET CONSTR. S NEW TRAFFIC SIGNALS $184,153 $76,803 $0 $300,000 $300,000 $300,000 $300, /2014 II Yes S GREENHAVEN DRIVE AND $0 $0 $300,000 $0 $0 $0 $ /2010 II Yes T OVERWIDTH PAVEMENT $0 $0 $100,000 $100,000 $100,000 $100,000 $100, /2014 II Yes T MAJOR STREET LIGHTING $0 $0 $100,000 $100,000 $100,000 $100,000 $100, /2014 II Yes T FY09/10 ECONOMIC $0 $0 $525,000 $525,000 $525,000 $525,000 $525, /2014 II Yes T MAJOR STREET $0 $0 $1,295,000 $1,295,000 $1,295,000 $1,295,000 $1,295, /2014 II Yes NEW FUNDING: Projects by Fund by Project Number M - 1
328 Projects Receiving New Funding Budget through Org Project 6/2009 Unobligated 2009/ / / / /14 $184,153 $76,803 $2,320,000 $2,320,000 $2,320,000 $2,320,000 $2,320,000 Est FY Complete Initiated Date Section 2008 STREET CUT R TRENCH CUT FEE PROGRAM $0 $0 $150,000 $150,000 $150,000 $150,000 $150, /2014 II Yes $0 $0 $150,000 $150,000 $150,000 $150,000 $150, TRANSPORTATION SYSTEMS MGMT T DOWNTOWN TSM CAPITAL $0 $0 $20,000 $20,000 $20,000 $20,000 $20, /2014 II Yes $0 $0 $20,000 $20,000 $20,000 $20,000 $20, TRANSPORTATION DEV. K BIKE TRAIL MAINTENANCE $741,700 $50,401 $25,000 $25,000 $25,000 $25,000 $25, GG Yes K BIKE TRAIL/PED BRIDGE REPAIR $816,715 $347,445 $103,000 $103,000 $103,000 $103,000 $103, GG Yes K BIKE TRAIL PLANNING $72,962 $5,282 $2,000 $2,000 $2,000 $2,000 $2, GG Yes K TDA FEDERAL AND STATE $659,892 $659,690 $162,172 $162,172 $162,172 $162,172 $162, GG Yes $2,291,269 $1,062,818 $292,172 $292,172 $292,172 $292,172 $292, DEVELOPMENT SERVICES A PLAN/PERMIT NETWORK $2,902,480 $993,082 $440,000 $440,000 $440,000 $440,000 $440, DD Yes $2,902,480 $993,082 $440,000 $440,000 $440,000 $440,000 $440, NEW MEASURE A CONSTRUCTION R GUARDRAIL REPLACEMENT $0 $0 $50,000 $50,000 $50,000 $50,000 $50, /2014 II Yes R STREET REPAIR PARTNERING $0 $0 $100,000 $100,000 $100,000 $100,000 $100, /2014 II Yes S TRAFFIC SIGNS AND MARKINGS $0 $0 $140,000 $140,000 $140,000 $140,000 $140, /2014 II Yes S SPEED HUMPS PROGRAM $0 $0 $294,000 $294,000 $294,000 $300,000 $300, /2014 II Yes S TRAFFIC OPERATIONS CENTER $0 $0 $325,000 $325,000 $325,000 $350,000 $375, /2014 II Yes S ON STREET ANGLED PARKING $0 $0 $0 $0 $25,000 $25,000 $25, /2014 II Yes S TRAFFIC SIGNAL SAFETY $0 $0 $125,000 $125,000 $125,000 $125,000 $125, /2014 II Yes S SIGNAL PRE-EMPTION $0 $0 $75,000 $75,000 $75,000 $75,000 $75, /2014 II Yes T BIKEWAY PROGRAM $0 $0 $150,000 $150,000 $150,000 $150,000 $150, /2014 II Yes T PEDESTRIAN SAFETY PROGRAM $0 $0 $75,000 $75,000 $75,000 $75,000 $75, /2014 II Yes T PUBLIC RIGHTS-OF-WAY $0 $0 $657,000 $657,000 $707,000 $757,000 $832, /2014 II Yes $0 $0 $1,991,000 $1,991,000 $2,066,000 $2,147,000 $2,247, NEW MEASURE A MAINTENANCE R PAVEMENT MANAGEMENT $0 $0 $50,000 $50,000 $50,000 $50,000 $50, /2014 II Yes R STREET OVERLAY AND SEAL $0 $0 $50,000 $50,000 $50,000 $50,000 $50, /2014 II Yes R BRIDGE MAINTENANCE $0 $0 $25,000 $25,000 $25,000 $25,000 $25, /2014 II Yes R BRIDGE CONSTRUCTION AND $0 $0 $50,000 $50,000 $50,000 $50,000 $50, /2014 II Yes R WORK MANAGEMENT SYSTEM- $0 $0 $60,000 $60,000 $60,000 $60,000 $60, /2014 II Yes Detail Sheet Availabl NEW FUNDING: Projects by Fund by Project Number M - 2
329 Projects Receiving New Funding Budget through Org Project 6/2009 Unobligated 2009/ / / / /14 $0 $0 $235,000 $235,000 $235,000 $235,000 $235,000 Est FY Complete Initiated Date Section 2232 CITYWIDE L&L DIST L AREA 1 PARK PLANNING $195,006 $25,452 $30,000 $30,000 $30,000 $30,000 $30, GG Yes L AREA 2 PARK PLANNING $157,353 $30,115 $30,000 $30,000 $30,000 $30,000 $30, GG Yes L AREA 3 PARK PLANNING $150,000 $31,032 $30,000 $30,000 $30,000 $30,000 $30, GG Yes L AREA 4 PARK PLANNING $150,882 $27,829 $30,000 $30,000 $30,000 $30,000 $30, GG Yes L SPORTS COURT $356,400 $82,559 $75,000 $120,000 $120,000 $120,000 $120, GG Yes L CITYWIDE L&L PARK REPAIR $0 $0 $201,761 $156,761 $156,761 $156,761 $156, /2014 GG Yes L PLAYGROUND REPAIRS $450,000 $133,937 $75,000 $75,000 $75,000 $75,000 $75, GG Yes L SWIMMING POOL $639,287 $92,101 $100,000 $100,000 $100,000 $100,000 $100, GG Yes R STREET LIGHT RELAMP $0 $0 $40,000 $40,000 $40,000 $40,000 $40, /2014 II Yes T NEIGHBORHOOD STREET LIGHT $0 $0 $400,000 $400,000 $400,000 $400,000 $400, /2014 II Yes $2,098,928 $423,025 $1,011,761 $1,011,761 $1,011,761 $1,011,761 $1,011, GOLF FUND C FACILITY ADA COMPLIANCE $62,640 $60,000 $10,000 $10,000 $10,000 $10,000 $10, /2013 DD Yes M COURSE/FACILITY $357,732 $75,602 $60,000 $60,000 $60,000 $60,000 $60, FF Yes $420,372 $135,602 $70,000 $70,000 $70,000 $70,000 $70, CIP BOND CAPITAL PROJECTS C CITY FACILITY DEFERRED $0 $0 $500,000 $0 $0 $0 $ /2010 DD Yes $0 $0 $500,000 $0 $0 $0 $ N. NATOMAS COMM. IMPR. T NORTH NATOMAS FREEWAY $97,500 $21,757 $11,500 $11,500 $11,500 $11,500 $11, /2014 II Yes W I-5 FREEWAY LANDSCAPE $5,204,368 $4,091,130 $998,592 $0 $0 $0 $ /2010 JJ Yes $5,301,868 $4,112,887 $1,010,092 $11,500 $11,500 $11,500 $11, PARK DEVELOPMENT L SYCAMORE PARK $0 $0 $65,000 $0 $0 $0 $ /2010 GG Yes L TH AND Q STREET MASTER $0 $0 $50,000 $0 $0 $0 $ /2010 GG Yes L PA1 PARK SIGN REPLACEMENT $0 $0 $24,000 $0 $0 $0 $ /2009 GG Yes L PA8 PARK SIGN REPLACEMENT $0 $0 $49,000 $0 $0 $0 $ /2009 GG Yes L CHARLIE JENSEN PARK $0 $0 $75,000 $0 $0 $0 $ /2010 GG Yes L EGRET PARK MASTER PLAN $0 $0 $50,000 $0 $0 $0 $ /2010 GG Yes L REGENCY PARK IMPROVEMENT $0 $0 $10,000 $0 $0 $0 $ /2009 GG Yes L TANZANITE COMMUNITY PARK $0 $0 $350,000 $0 $0 $0 $ /2011 GG Yes L LEWIS PARK ENHANCEMENT $0 $0 $50,000 $0 $0 $0 $ /2009 GG Yes L SIERRA 2 PARK COURT $0 $0 $75,000 $0 $0 $0 $ /2010 GG Yes L CESAR CHAVEZ PLAZA $0 $0 $100,000 $0 $0 $0 $ /2010 GG Yes L REDBUD PARK IMPROVEMENTS $0 $0 $275,000 $0 $0 $0 $ /2011 GG Yes Detail Sheet Availabl NEW FUNDING: Projects by Fund by Project Number M - 3
330 Projects Receiving New Funding Budget through Org Project 6/2009 Unobligated 2009/ / / / /14 Est FY Complete Initiated Date Section L GARDENLAND PARK PSIP TIER $0 $0 $375,000 $0 $0 $0 $ /2011 GG Yes $0 $0 $1,548,000 $0 $0 $0 $ PARKING C FACILITY ADA COMPLIANCE $856,191 $800,000 $78,000 $78,000 $78,000 $78,000 $78, /2013 DD Yes V RETAIL AND OFFICE SPACE $1,811,712 $712,236 $50,000 $50,000 $50,000 $50,000 $50, /2014 II Yes V STRUCTURE REPAIRS & MAJOR $6,030,000 $2,357,911 $500,000 $500,000 $500,000 $500,000 $500, /2014 II Yes V MECHANICAL/ELECTRICAL $2,302,732 $504,907 $50,000 $50,000 $50,000 $50,000 $50, /2014 II Yes V PARKING FACILITIES $3,411,992 $1,825,151 $200,000 $200,000 $200,000 $200,000 $200, /2014 II Yes V PARKING FACILITIES $6,817,134 $6,354,556 $2,000,000 $2,000,000 $2,000,000 $2,000,000 $2,000, /2014 II Yes $21,229,761 $12,554,761 $2,878,000 $2,878,000 $2,878,000 $2,878,000 $2,878, WATER Z WATER SYSTEM MISC $2,065,800 $699,175 $0 $845,001 $825,002 $915,003 $2,764, JJ Yes Z COMMERCIAL WATER METER $5,822,351 $352,843 $350,000 $350,000 $350,000 $350,000 $350, JJ Yes Z WELL SYSTEM MISC IMPROV $1,361,000 $227,337 $0 $90,000 $90,000 $90,000 $ JJ Yes Z WATER SUPPLY MASTER PLAN $2,839,587 $72,332 $250,000 $100,000 $100,000 $100,000 $100, JJ Yes Z SAC RIVER SOURCE WATER $855,500 $40,486 $70,000 $102,000 $60,000 $60,000 $ JJ Yes Z SAC RIVER - KEEP OUR WATERS $109,000 $22,168 $30,000 $31,000 $31,000 $31,000 $ JJ Yes Z BASE CIP RESERVE-WATER $548,038 $548,038 $400,000 $400,000 $400,000 $400,000 $400, JJ Yes Z BACKFLOW PREVENTION $2,831,913 $593,150 $50,000 $205,000 $205,000 $205,000 $200, JJ Yes Z SCADA SYSTEM UPGRADE $2,726,000 $245,043 $100,000 $100,000 $100,000 $100,000 $100, JJ Yes Z AMR RIVER SOURCE WATER $366,500 $32,061 $15,000 $24,000 $27,000 $27,000 $ JJ Yes Z AMER RVR - KEEP OUR WATERS $85,000 $12,975 $25,000 $26,000 $26,000 $26,000 $ JJ Yes Z UTILITIES ADA IMPROVEMENT $80,000 $50,563 $5,000 $5,000 $5,000 $0 $ /2012 JJ Yes Z DRINKING WATER QUALITY $1,335,996 $41,322 $85,000 $233,000 $341,000 $310,000 $ JJ Yes Z DISTRIBUTION FLUSHING $100,000 $99,351 $50,000 $0 $0 $0 $ /2010 JJ Yes Z GROUNDWATER PROTECTION $205,877 $198,719 $62,000 $0 $0 $0 $ /2012 JJ Yes Z SAC RVR WTR RELIAB STUDY $3,320,000 $545,428 $210,000 $500,000 $500,000 $500,000 $ /2007 JJ Yes Z BUILDING SECURITY SYSTEMS $190,000 $92,789 $0 $5,000 $5,000 $0 $ /2007 JJ Yes Z ASSET MANAGEMENT - WTR $170,000 $91,148 $0 $50,000 $50,000 $50,000 $ /2012 JJ Yes Z RESID WTR MTR PRGM $799,809 $232,007 $0 $9,896,000 $11,096,000 $12,296,000 $13,496, /2010 JJ Yes Z IT PROJECTS $200,000 $168,122 $0 $200,000 $200,000 $200,000 $ /2010 JJ Yes Z T-MAIN POWER INN RD $1,496,000 $788,266 $500,000 $0 $0 $0 $ /2012 JJ Yes Z TREATMENT PLANT REHAB $1,000,000 $999,857 $1,000,000 $0 $0 $0 $ /2010 JJ Yes Z UNPLANNED CORRECTIVE $480,000 $480,000 -$230,000 $500,000 $500,000 $500,000 $ JJ Yes Z SACRAMENTO RIVER WTP $100,000 $100,000 -$100,000 $0 $0 $0 $ JJ Yes Z FAIRBAIRN WTP CHLORINATION $60,000 $60,000 -$60,000 $0 $0 $0 $ JJ Yes Z FY10 ECONOMIC DEVELOP $0 $0 $400,000 $400,000 $400,000 $400,000 $400, /2010 JJ Yes Z WATER METER READING $0 $0 $775,000 $661,000 $612,000 $563,000 $513, /2014 JJ Yes Z ALHAMBRA BOULEVARD RS $0 $0 $450,000 $0 $0 $0 $ /2011 JJ Yes Z WS T-MAIN REPLACEMENT, $0 $0 $50,000 $0 $0 $0 $ /2011 JJ Yes Z WS T-MAIN REPLACEMENT, $0 $0 $50,000 $0 $0 $0 $ /2011 JJ Yes Detail Sheet Availabl NEW FUNDING: Projects by Fund by Project Number M - 4
331 Projects Receiving New Funding Budget through Org Project 6/2009 Unobligated 2009/ / / / /14 Est FY Complete Initiated Date Section Z WS T-MAIN REPLACEMENT, $0 $0 $50,000 $0 $0 $0 $ /2011 JJ Yes Z SRWTP 5 MG RESERVOIR $0 $0 $20,000 $0 $0 $0 $ /2010 JJ Yes Z CONNECTION TO COUNTY $0 $0 $100,000 $0 $0 $0 $ /2010 JJ Yes Z FLORIN RES. ENGINE 2 REBUILD $0 $0 $120,000 $0 $0 $0 $ /2010 JJ Yes Z RWM-PROJECT MGMNT FY07 $182,627 $24,027 $100,000 $0 $0 $0 $ /2010 JJ Yes Z RWM-PUBLIC OUTREACH $108,000 $68,558 $36,000 $0 $0 $0 $ /2010 JJ Yes Z RWM PR 4PIPE REPL3A SO $475,000 $450,000 $1,860,000 $0 $0 $0 $ /2010 JJ Yes Z RWM PIPE REPL 5METER1 CITY $0 $0 $1,450,000 $0 $0 $0 $ /2010 JJ Yes Z RWM PR 5PIPE REPL2 GOLF $0 $0 $650,000 $0 $0 $0 $ /2011 JJ Yes Z RWM RETRO 6METER1 $0 $0 $2,000,000 $0 $0 $0 $ /2010 JJ Yes Z RWM RETRO 8METER6 NORTH $0 $0 $2,600,000 $0 $0 $0 $ /2010 JJ Yes $29,913,998 $7,335,765 $13,523,000 $14,723,001 $15,923,002 $17,123,003 $18,323, SEWER X SEWER SYS REHABILITATION $1,352,052 $155,980 $75,000 $789,725 $900,000 $1,000,000 $1,100, JJ Yes X PUMP STATIONS RADIO $1,866,500 $0 $25,000 $0 $0 $0 $ /2012 JJ Yes X SEWER PUMP STATION REHAB $2,019,126 $130,209 $25,000 $500,000 $500,000 $500,000 $500, JJ Yes X BASE CIP RESERVE - SEWER $261,424 $261,424 $200,000 $200,000 $200,000 $200,000 $200, JJ Yes X SEWER ASSET MGMNT $100,000 $55,747 $25,000 $0 $0 $0 $ /2012 JJ Yes X FLOW $100,000 $81,250 $50,000 $0 $0 $0 $ /2009 JJ Yes X SUMP 85 INFLUENT PIPE $100,000 $98,786 $1,100,000 $0 $0 $0 $ /2010 JJ Yes X SANITARY SEWER $75,000 $5,000 $75,000 $0 $0 $0 $ /2010 JJ Yes X ROOT CONTROL PROGRAM 2010 $0 $0 $100,000 $0 $0 $0 $ /2011 JJ Yes X SEWER SERVICE LINING 2010 $0 $0 $100,000 $0 $0 $0 $ /2011 JJ Yes X CSS IMPROVEMENT PLAN $571,400 $30,176 $300,000 $0 $0 $0 $ /2012 JJ Yes X CSS MISCELLANEOUS REHAB $1,000,986 $137,871 $75,000 $750,000 $1,615,196 $1,566,424 $1,518, JJ Yes X E/F ALLEY SEWER $210,000 $0 $210,000 $0 $0 $0 $ /2010 JJ Yes X /37 ALLEY SEWER $0 $0 $230,000 $0 $0 $0 $ /2010 JJ Yes X TH/ SANTA YNEZ ALLEY $0 $0 $0 $140,000 $0 $0 $ /2010 JJ Yes X O/P ALLEY SEWER $0 $0 $0 $225,000 $0 $0 $ /2010 JJ Yes X MARSHALL WAY SEWER $0 $0 $0 $260,000 $0 $0 $ /2010 JJ Yes X T STREET SEWER $0 $0 $0 $300,000 $0 $0 $ /2010 JJ Yes X FREMONT AREA SEWER REHAB, $0 $0 $450,000 $0 $0 $0 $ /2011 JJ Yes X CWTP ELECTRICAL $0 $0 $25,000 $0 $0 $0 $ /2011 JJ Yes X CWTP ELECTRICAL MCC L $0 $0 $25,000 $0 $0 $0 $ JJ Yes Z IT PROJECTS $100,000 $100,000 $25,000 $0 $0 $0 $ /2010 JJ Yes Z FY10 ECONOMIC DEVELOP $0 $0 $200,000 $200,000 $200,000 $200,000 $200, /2010 JJ Yes $7,756,488 $1,056,443 $3,315,000 $3,364,725 $3,415,196 $3,466,424 $3,518, SOLID WASTE Y LANDFILL SITE CLOSURE $2,231,799 $962,352 $217,000 $217,000 $217,000 $217,000 $217, /2012 JJ Yes Y VEHICLES/ADDITIONAL ROUTES $1,586,000 $147,554 $0 $200,000 $200,000 $200,000 $200, JJ Yes Y DELLAR LANDFILL CLOSURE $0 $0 $500,000 $0 $0 $0 $ /2010 JJ Yes Detail Sheet Availabl NEW FUNDING: Projects by Fund by Project Number M - 5
332 Projects Receiving New Funding Budget through Org Project 6/2009 Unobligated 2009/ / / / /14 $3,817,799 $1,109,906 $717,000 $417,000 $417,000 $417,000 $417,000 Est FY Complete Initiated Date Section 6009 SACRAMENTO MARINA M HARBOR DREDGING $595,194 $156,799 $65,000 $65,000 $65,000 $65,000 $65, FF Yes M MARINA IMPROVEMENTS $135,000 $135,000 $135,000 $135,000 $135,000 $135,000 $135, FF Yes $730,194 $291,799 $200,000 $200,000 $200,000 $200,000 $200, COMMUNITY CENTER C FACILITY ADA COMPLIANCE $979,729 $948,030 $100,000 $100,000 $100,000 $100,000 $100, /2013 DD Yes M COMMUNITY CENTER $469,494 $284,422 $50,000 $105,000 $80,000 $230,000 $450, FF Yes M THEATER RENOVATION $1,330,000 $1,117,268 $1,050,000 $2,000,000 $1,850,000 $2,000,000 $3,000, FF Yes M CONVENTION CENTER AV $120,000 $116,315 $20,000 $20,000 $20,000 $20,000 $20, FF Yes M CONVENTION CENTER CARPET $750,000 $29,296 $0 $0 $0 $200,000 $200, FF Yes M CONVENTION CENTER CHILLER $276,000 $0 $0 $200,000 $200,000 $0 $ FF Yes M COMMUNITY CENTER SECURITY $125,000 $125,000 $0 $0 $0 $100,000 $30, FF Yes M MEMORIAL AUDITORIUM $950,000 $707,440 $100,000 $100,000 $100,000 $200,000 $200, FF Yes M CONVENTION CENTER $800,000 $777,622 $330,000 $0 $0 $0 $ /2009 FF Yes $5,800,223 $4,105,393 $1,650,000 $2,525,000 $2,350,000 $2,850,000 $4,000, STORM DRAINAGE W FLOOD CONTROL PLANNING $2,318,933 $0 $220,000 $0 $0 $0 $ JJ Yes W FLOODPLAIN MANAGEMENT $3,045,480 $148,658 $175,000 $0 $0 $0 $ JJ Yes W SUMP 115 ELECTRICAL REHAB $0 $0 $10,000 $0 $0 $0 $ /2011 JJ Yes W SUMP 47 ELECTRICAL REHAB $0 $0 $10,000 $0 $0 $0 $ /2011 JJ Yes W SUMP 117 ELECTRICAL REHAB $0 $0 $10,000 $0 $0 $0 $ /2011 JJ Yes W FY10-FY14 NPDES $0 $0 $1,000,000 $1,000,000 $1,000,000 $1,000,000 $1,000, /2014 JJ Yes $5,364,413 $148,658 $1,425,000 $1,000,000 $1,000,000 $1,000,000 $1,000, FLEET MANAGEMENT A FLEET MGMT TECHNOLOGY $1,764,000 $494,115 -$175,000 $100,000 $70,000 $70,000 $70, /2014 DD Yes B FLEET FACILITIES PROGRAM $1,029,966 $173,165 $175,000 $0 $30,000 $30,000 $30, /2014 DD Yes C FUEL MANAGEMENT & $3,028,000 $396,801 $175,000 $75,000 $75,000 $75,000 $75, /2014 DD Yes $5,821,966 $1,064,081 $175,000 $175,000 $175,000 $175,000 $175, SHRA - CDBG RIVER GARDENS/GARDENLAND $0 $0 $114,000 $0 $0 $0 $ /2009 KK Yes ADA SIDEWALKS $0 $0 $348,000 $0 $0 $0 $ /2009 KK Yes BEN ALI/ HAGGINWOOD DESIGN $0 $0 $100,000 $0 $0 $0 $ /2009 KK Yes $0 $0 $562,000 $0 $0 $0 $0 Detail Sheet Availabl NEW FUNDING: Projects by Fund by Project Number M - 6
333 Projects Receiving New Funding Est Detail Org Project Budget through FY Complete Sheet 6/2009 Unobligated 2009/ / / / /14 Initiated Date Section Availabl 9206 TAX INC. - ALKALI FLAT ALIKALI FLAT RDA $0 $0 $361,553 $0 $0 $0 $ /2009 KK Yes $0 $0 $361,553 $0 $0 $0 $ TAX INC. - FRANKLIN BLVD FRANKLIN BLVD RDA $0 $0 $1,642,839 $0 $0 $0 $ /2009 KK Yes $0 $0 $1,642,839 $0 $0 $0 $ TAX INC. - N. SACRAMENTO NORTH SACRAMENTO RDA $0 $0 $1,785,807 $0 $0 $0 $ /2009 KK Yes $0 $0 $1,785,807 $0 $0 $0 $ TAX INC. - OAK PARK OAK PARK RDA DEVELOPMENT $0 $0 $921,307 $0 $0 $0 $ /2009 KK Yes $0 $0 $921,307 $0 $0 $0 $ TAX INC. - STOCKTON BLVD STOCKTON BLVD RDA $0 $0 $832,048 $0 $0 $0 $ /2009 KK Yes $0 $0 $832,048 $0 $0 $0 $ TAX INC. - DEL PASO HEIGHTS DEL PASO HEIGHTS RDA $0 $0 $1,228,397 $0 $0 $0 $ /2009 KK Yes $0 $0 $1,228,397 $0 $0 $0 $ TAX INC. - ARMY DEPOT ARMY DEPOT RDA $0 $0 $2,828,036 $0 $0 $0 $ /2009 KK Yes $0 $0 $2,828,036 $0 $0 $0 $ TAX INC. - AUBURN BLVD AUBURN BLVD RDA $0 $0 $342,854 $0 $0 $0 $ /2009 KK Yes $0 $0 $342,854 $0 $0 $0 $ TAX INCREMENT-65TH STREET TH STREET RDA $0 $0 $215,754 $0 $0 $0 $ /2009 KK Yes $0 $0 $215,754 $0 $0 $0 $0 $124,105,286 $41,239,322 $50,132,411 $39,660,042 $40,985,514 $42,986,743 $45,388,740 NEW FUNDING: Projects by Fund by Project Number M - 7
334 CITY OF SACRAMENTO CIP INDEX BY PROGRAM AREA Projects Receiving New Funding: By Project Number By Program Area CAPITAL IMPROVEMENT PROGRAM N
335
336 Projects Receiving New Funding Budget Est Project Number Project Name through 6/2009 Balance 6/ / / / / /14 FY Initiated Est Complete Date Section Detail Sheet Available BIKEWAYS K BIKE TRAIL MAINTENANCE $741,700 $50,401 $25,000 $25,000 $25,000 $25,000 $25,000 GG Yes K BIKE TRAIL/PED BRIDGE $816,715 $347,445 $103,000 $103,000 $103,000 $103,000 $103,000 GG Yes K BIKE TRAIL PLANNING $72,962 $5,282 $2,000 $2,000 $2,000 $2,000 $2,000 GG Yes K TDA FEDERAL AND STATE $659,892 $659,690 $162,172 $162,172 $162,172 $162,172 $162,172 GG Yes $292,172 $292,172 $292,172 $292,172 $292,172 COMMUNITY CENTER M COMMUNITY CENTER $469,494 $284,422 $50,000 $105,000 $80,000 $230,000 $450,000 FF Yes M THEATER RENOVATION $1,330,000 $1,117,268 $1,050,000 $2,000,000 $1,850,000 $2,000,000 $3,000,000 FF Yes M CONVENTION CENTER AV $120,000 $116,315 $20,000 $20,000 $20,000 $20,000 $20,000 FF Yes M CONVENTION CENTER CARPET $750,000 $29,296 $0 $0 $0 $200,000 $200,000 FF Yes M CONVENTION CENTER $276,000 $0 $0 $200,000 $200,000 $0 $0 FF Yes M COMMUNITY CENTER $125,000 $125,000 $0 $0 $0 $100,000 $30,000 FF Yes M MEMORIAL AUDITORIUM $7,136,000 $2,707,427 $100,000 $100,000 $100,000 $200,000 $200, FF Yes $1,220,000 $2,425,000 $2,250,000 $2,750,000 $3,900,000 COMMUNITY IMPROVEMENTS DEL PASO HEIGHTS RDA $0 $0 $1,228,397 $0 $0 $0 $ /2009 KK Yes ALIKALI FLAT RDA $0 $0 $361,553 $0 $0 $0 $ /2009 KK Yes OAK PARK RDA DEVELOPMENT $0 $0 $921,307 $0 $0 $0 $ /2009 KK Yes NORTH SACRAMENTO RDA $0 $0 $1,785,807 $0 $0 $0 $ /2009 KK Yes FRANKLIN BLVD RDA $0 $0 $1,642,839 $0 $0 $0 $ /2009 KK Yes STOCKTON BLVD RDA $0 $0 $832,048 $0 $0 $0 $ /2009 KK Yes AUBURN BLVD RDA $0 $0 $342,854 $0 $0 $0 $ /2009 KK Yes ARMY DEPOT RDA $0 $0 $2,828,036 $0 $0 $0 $ /2009 KK Yes TH STREET RDA $0 $0 $215,754 $0 $0 $0 $ /2009 KK Yes RIVER GARDENS/GARDENLAND $0 $0 $114,000 $0 $0 $0 $ /2009 KK Yes ADA SIDEWALKS $0 $0 $348,000 $0 $0 $0 $ /2009 KK Yes BEN ALI/ HAGGINWOOD $0 $0 $100,000 $0 $0 $0 $ /2009 KK Yes NEW FUNDING: Projects by Program Area by Project Number N - 1
337 Projects Receiving New Funding Budget Est Project Number Project Name through 6/2009 Balance 6/ / / / / /14 $10,720,595 $0 $0 $0 $0 FY Initiated Est Complete Date Section Detail Sheet Available COMPUTERS / COMMUNICATIONS A IT EQUIPMENT REPLACEMENT $1,811,499 $690,188 $437,860 $437,860 $437,860 $437,860 $437,860 DD Yes A CITYWIDE FIBER EXPANSION $498,351 $182,057 $20,000 $20,000 $20,000 $20,000 $20,000 DD Yes A VOIC REPLACEMENT $1,464,643 $145,092 -$145,092 $0 $0 $0 $0 DD Yes A FLEET MGMT TECHNOLOGY $1,764,000 $494,115 -$175,000 $100,000 $70,000 $70,000 $70, /2014 DD Yes A PLANNING TECHNOLOGY $1,092,747 $230,178 $56,600 $56,600 $56,600 $56,600 $56,600 DD Yes A PLAN/PERMIT NETWORK $6,049,955 $993,082 $440,000 $440,000 $440,000 $440,000 $440, DD Yes D CTY TREASURER IVST MGT $1,620,000 $730,085 -$500,000 $0 $0 $0 $0 DD Yes $134,368 $1,054,460 $1,024,460 $1,024,460 $1,024,460 CULTURAL / ARTS M CONVENTION CENTER $800,000 $777,622 $330,000 $0 $0 $0 $ /2009 FF Yes $330,000 $0 $0 $0 $0 DRAINAGE W FLOOD CONTROL PLANNING $2,318,933 $0 $220,000 $0 $0 $0 $ JJ Yes W FLOODPLAIN MANAGEMENT $3,045,480 $148,658 $175,000 $0 $0 $0 $ JJ Yes W I-5 FREEWAY LANDSCAPE $5,435,438 $4,091,130 $998,592 $0 $0 $0 $ /2010 JJ Yes W SUMP 115 ELECTRICAL REHAB $0 $0 $10,000 $0 $0 $0 $ /2011 JJ Yes W SUMP 47 ELECTRICAL REHAB $0 $0 $10,000 $0 $0 $0 $ /2011 JJ Yes W SUMP 117 ELECTRICAL REHAB $0 $0 $10,000 $0 $0 $0 $ /2011 JJ Yes W FY10-FY14 NPDES $0 $0 $1,000,000 $1,000,000 $1,000,000 $1,000,000 $1,000, /2014 JJ Yes $2,423,592 $1,000,000 $1,000,000 $1,000,000 $1,000,000 FIRE F ADVANCE LIFE SUPPORT ALS $1,080,000 $1,080,000 $1,080,000 $1,080,000 $1,080,000 $1,080,000 $1,080,000 EE Yes F FIRE APPARATUS EQUIPMENT $7,240,417 $814,850 $218,423 $468,423 $718,423 $968,423 $968,423 EE Yes F PSAF GENERATOR UPGRADES $1,673,382 $670,181 $150,000 $150,000 $150,000 $150,000 $150,000 EE Yes NEW FUNDING: Projects by Program Area by Project Number N - 2
338 Projects Receiving New Funding Budget Est Project Number Project Name through 6/2009 Balance 6/ / / / / /14 $1,448,423 $1,698,423 $1,948,423 $2,198,423 $2,198,423 FY Initiated Est Complete Date Section Detail Sheet Available GOLF M COURSE/FACILITY $357,732 $75,602 $60,000 $60,000 $60,000 $60,000 $60,000 FF Yes $60,000 $60,000 $60,000 $60,000 $60,000 MARINA M HARBOR DREDGING $712,915 $271,453 $65,000 $65,000 $65,000 $65,000 $65,000 FF Yes M MARINA IMPROVEMENTS $135,000 $135,000 $135,000 $135,000 $135,000 $135,000 $135,000 FF Yes $200,000 $200,000 $200,000 $200,000 $200,000 PARKING V RETAIL AND OFFICE SPACE $1,811,712 $712,236 $50,000 $50,000 $50,000 $50,000 $50, /2014 II Yes V STRUCTURE REPAIRS & $6,030,000 $2,357,911 $500,000 $500,000 $500,000 $500,000 $500, /2014 II Yes V MECHANICAL/ELECTRICAL $2,302,732 $504,907 $50,000 $50,000 $50,000 $50,000 $50, /2014 II Yes V PARKING FACILITIES $3,411,992 $1,825,151 $200,000 $200,000 $200,000 $200,000 $200, /2014 II Yes V PARKING FACILITIES $7,022,076 $6,354,556 $2,000,000 $2,000,000 $2,000,000 $2,000,000 $2,000, /2014 II Yes $2,800,000 $2,800,000 $2,800,000 $2,800,000 $2,800,000 PARKS & RECREATION L AREA 1 PARK PLANNING $225,006 $25,452 $30,000 $30,000 $30,000 $30,000 $30,000 GG Yes L AREA 2 PARK PLANNING $187,353 $30,115 $30,000 $30,000 $30,000 $30,000 $30,000 GG Yes L AREA 3 PARK PLANNING $180,000 $31,032 $30,000 $30,000 $30,000 $30,000 $30,000 GG Yes L AREA 4 PARK PLANNING $180,882 $27,829 $30,000 $30,000 $30,000 $30,000 $30,000 GG Yes L SPORTS COURT $356,400 $82,559 $75,000 $120,000 $120,000 $120,000 $120,000 GG Yes L SYCAMORE PARK $0 $0 $65,000 $0 $0 $0 $ /2010 GG Yes L TH AND Q STREET MASTER $0 $0 $50,000 $0 $0 $0 $ /2010 GG Yes L PA1 PARK SIGN REPLACEMENT $0 $0 $24,000 $0 $0 $0 $ /2009 GG Yes L PA8 PARK SIGN REPLACEMENT $0 $0 $49,000 $0 $0 $0 $ /2009 GG Yes L CHARLIE JENSEN PARK $0 $0 $75,000 $0 $0 $0 $ /2010 GG Yes NEW FUNDING: Projects by Program Area by Project Number N - 3
339 Projects Receiving New Funding Budget Est Project Number Project Name through 6/2009 Balance 6/ / / / / /14 FY Initiated Est Complete Date Section Detail Sheet Available L EGRET PARK MASTER PLAN $0 $0 $50,000 $0 $0 $0 $ /2010 GG Yes L REGENCY PARK $0 $0 $10,000 $0 $0 $0 $ /2009 GG Yes L TANZANITE COMMUNITY PARK $0 $0 $350,000 $0 $0 $0 $ /2011 GG Yes L LEWIS PARK ENHANCEMENT $0 $0 $50,000 $0 $0 $0 $ /2009 GG Yes L SIERRA 2 PARK COURT $0 $0 $75,000 $0 $0 $0 $ /2010 GG Yes L CESAR CHAVEZ PLAZA $0 $0 $100,000 $0 $0 $0 $ /2010 GG Yes L REDBUD PARK $0 $0 $275,000 $0 $0 $0 $ /2011 GG Yes L CITYWIDE L&L PARK REPAIR $0 $0 $201,761 $156,761 $156,761 $156,761 $156, /2014 GG Yes L PLAYGROUND REPAIRS $450,000 $133,937 $75,000 $75,000 $75,000 $75,000 $75,000 GG Yes L SWIMMING POOL $639,287 $92,101 $100,000 $100,000 $100,000 $100,000 $100,000 GG Yes L GARDENLAND PARK PSIP TIER $120,000 $120,000 $375,000 $0 $0 $0 $ /2011 GG Yes $2,119,761 $571,761 $571,761 $571,761 $571,761 REPAIR / REMODELING B FLEET FACILITIES PROGRAM $1,029,966 $173,165 $175,000 $0 $30,000 $30,000 $30, /2014 DD Yes C FUEL MANAGEMENT & $3,028,000 $396,801 $175,000 $75,000 $75,000 $75,000 $75, /2014 DD Yes C CORP YARD MAINTENANCE $2,807,009 $30,969 $20,000 $20,000 $20,000 $20,000 $20, /2013 DD Yes C FACILITY ADA COMPLIANCE $5,017,980 $3,808,030 $188,000 $688,000 $688,000 $688,000 $688, /2013 DD Yes C CITY FACILITY DEFERRED $12,200,135 $274,308 $1,000,000 $1,000,000 $1,000,000 $1,000,000 $1,000, /2010 DD Yes $1,558,000 $1,783,000 $1,813,000 $1,813,000 $1,813,000 SEWER X SEWER SYS REHABILITATION $1,352,052 $155,980 $75,000 $789,725 $900,000 $1,000,000 $1,100, JJ Yes X PUMP STATIONS RADIO $5,543,000 $188,760 $25,000 $0 $0 $0 $ /2012 JJ Yes X SEWER PUMP STATION REHAB $2,019,126 $130,209 $25,000 $500,000 $500,000 $500,000 $500, JJ Yes X BASE CIP RESERVE - SEWER $261,424 $261,424 $200,000 $200,000 $200,000 $200,000 $200, JJ Yes X SEWER ASSET MGMNT $100,000 $55,747 $25,000 $0 $0 $0 $ /2012 JJ Yes X FLOW $100,000 $81,250 $50,000 $0 $0 $0 $ /2009 JJ Yes X SUMP 85 INFLUENT PIPE $100,000 $98,786 $1,100,000 $0 $0 $0 $ /2010 JJ Yes X SANITARY SEWER $75,000 $5,000 $75,000 $0 $0 $0 $ /2010 JJ Yes NEW FUNDING: Projects by Program Area by Project Number N - 4
340 Projects Receiving New Funding Budget Est Project Number Project Name through 6/2009 Balance 6/ / / / / /14 FY Initiated Est Complete Date Section Detail Sheet Available X ROOT CONTROL PROGRAM $0 $0 $100,000 $0 $0 $0 $ /2011 JJ Yes X SEWER SERVICE LINING 2010 $0 $0 $100,000 $0 $0 $0 $ /2011 JJ Yes X CSS IMPROVEMENT PLAN $573,900 $32,676 $300,000 $0 $0 $0 $ /2012 JJ Yes X CSS MISCELLANEOUS REHAB $2,502,383 $137,871 $75,000 $750,000 $1,615,196 $1,566,424 $1,518, JJ Yes X E/F ALLEY SEWER $210,000 $0 $210,000 $0 $0 $0 $ /2010 JJ Yes X /37 ALLEY SEWER $0 $0 $230,000 $0 $0 $0 $ /2010 JJ Yes X TH/ SANTA YNEZ ALLEY $0 $0 $0 $140,000 $0 $0 $ /2010 JJ Yes X O/P ALLEY SEWER $0 $0 $0 $225,000 $0 $0 $ /2010 JJ Yes X MARSHALL WAY SEWER $0 $0 $0 $260,000 $0 $0 $ /2010 JJ Yes X T STREET SEWER $0 $0 $0 $300,000 $0 $0 $ /2010 JJ Yes X FREMONT AREA SEWER $0 $0 $450,000 $0 $0 $0 $ /2011 JJ Yes X CWTP ELECTRICAL $0 $0 $25,000 $0 $0 $0 $ /2011 JJ Yes X CWTP ELECTRICAL MCC L $0 $0 $25,000 $0 $0 $0 $0 JJ Yes $3,090,000 $3,164,725 $3,215,196 $3,266,424 $3,318,420 SIGNALS / LIGHTING / TRAFFIC CONTROL R STREET LIGHT RELAMP $0 $0 $125,000 $125,000 $125,000 $125,000 $125, /2014 II Yes S NEW TRAFFIC SIGNALS $229,290 $110,588 $0 $300,000 $300,000 $300,000 $300, /2014 II Yes S TRAFFIC OPERATIONS CENTER $0 $0 $375,000 $375,000 $375,000 $375,000 $375, /2014 II Yes S CAPTAIN JERRY S SAFETY $0 $0 $15,000 $15,000 $15,000 $15,000 $15, /2014 II Yes S TRAFFIC SIGNAL SAFETY $0 $0 $125,000 $125,000 $125,000 $125,000 $125, /2014 II Yes S GREENHAVEN DRIVE AND $0 $0 $300,000 $0 $0 $0 $ /2010 II Yes S SIGNAL PRE-EMPTION $0 $0 $75,000 $75,000 $75,000 $75,000 $75, /2014 II Yes T NEIGHBORHOOD STREET $0 $0 $400,000 $400,000 $400,000 $400,000 $400, /2014 II Yes T MAJOR STREET LIGHTING $0 $0 $100,000 $100,000 $100,000 $100,000 $100, /2014 II Yes $1,515,000 $1,515,000 $1,515,000 $1,515,000 $1,515,000 SOLID WASTE Y LANDFILL SITE CLOSURE $7,427,072 $962,352 $217,000 $217,000 $217,000 $217,000 $217, /2012 JJ Yes Y VEHICLES/ADDITIONAL $1,586,000 $147,554 $0 $200,000 $200,000 $200,000 $200,000 JJ Yes NEW FUNDING: Projects by Program Area by Project Number N - 5
341 Projects Receiving New Funding Budget Est Project Number Project Name through 6/2009 Balance 6/ / / / / /14 FY Initiated Est Complete Date Section Detail Sheet Available Y DELLAR LANDFILL CLOSURE $0 $0 $500,000 $0 $0 $0 $ /2010 JJ Yes $717,000 $417,000 $417,000 $417,000 $417,000 STREET IMPROVEMENTS R BRIDGE MAINTENANCE $0 $0 $25,000 $25,000 $25,000 $25,000 $25, /2014 II Yes S NEIGHBORHOOD TRAFFIC $0 $0 $400,000 $400,000 $400,000 $400,000 $400, /2014 II Yes S SPEED HUMPS PROGRAM $0 $0 $300,000 $300,000 $300,000 $300,000 $300, /2014 II Yes S ON STREET ANGLED PARKING $0 $0 $25,000 $25,000 $25,000 $25,000 $25, /2014 II Yes S MEDIAN TURN LANE PROGRAM $0 $0 $50,000 $50,000 $50,000 $50,000 $50, /2014 II Yes T NORTH NATOMAS FREEWAY $97,500 $21,757 $11,500 $11,500 $11,500 $11,500 $11, /2014 II Yes T BIKEWAY PROGRAM $0 $0 $150,000 $150,000 $150,000 $150,000 $150, /2014 II Yes T ADVANCED TRANSPORTATION $0 $0 $400,000 $400,000 $400,000 $400,000 $400, /2014 II Yes T OVERWIDTH PAVEMENT $0 $0 $100,000 $100,000 $100,000 $100,000 $100, /2014 II Yes T PEDESTRIAN IMPROVEMENT $0 $0 $50,000 $50,000 $50,000 $50,000 $50, /2014 II Yes T DOWNTOWN TSM CAPITAL $0 $0 $20,000 $20,000 $20,000 $20,000 $20, /2014 II Yes T ALLEY ABATEMENT PROGRAM $60,000 $45,000 $60,000 $60,000 $60,000 $60,000 $60, /2014 II Yes T FY09/10 ECONOMIC $0 $0 $525,000 $525,000 $525,000 $525,000 $525, /2014 II Yes T MAJOR STREET $0 $0 $1,864,000 $1,864,000 $1,864,000 $1,864,000 $1,864, /2014 II Yes $3,980,500 $3,980,500 $3,980,500 $3,980,500 $3,980,500 STREET MAINTENANCE R PAVEMENT MANAGEMENT $0 $0 $50,000 $50,000 $50,000 $50,000 $50, /2014 II Yes R STREET OVERLAY AND SEAL $0 $0 $50,000 $50,000 $50,000 $50,000 $50, /2014 II Yes R HOLLOW SIDEWALK $0 $0 $65,000 $65,000 $65,000 $65,000 $65, /2014 II Yes R BRIDGE CONSTRUCTION AND $0 $0 $50,000 $50,000 $50,000 $50,000 $50, /2014 II Yes R GUARDRAIL REPLACEMENT $0 $0 $50,000 $50,000 $50,000 $50,000 $50, /2014 II Yes R TRENCH CUT FEE PROGRAM $0 $0 $150,000 $150,000 $150,000 $150,000 $150, /2014 II Yes R STREET REPAIR PARTNERING $0 $0 $100,000 $100,000 $100,000 $100,000 $100, /2014 II Yes R TRAFFIC SIGNAL EQUIPMENT $0 $0 $205,000 $205,000 $205,000 $205,000 $205, /2014 II Yes R WORK MANAGEMENT SYSTEM- $0 $0 $60,000 $60,000 $60,000 $60,000 $60, /2014 II Yes NEW FUNDING: Projects by Program Area by Project Number N - 6
342 Projects Receiving New Funding Budget Est Project Number Project Name through 6/2009 Balance 6/ / / / / /14 FY Initiated Est Complete Date Section Detail Sheet Available S TRAFFIC SIGNS AND $0 $0 $140,000 $140,000 $140,000 $140,000 $140, /2014 II Yes T PEDESTRIAN SAFETY $0 $0 $75,000 $75,000 $75,000 $75,000 $75, /2014 II Yes T PUBLIC RIGHTS-OF-WAY $0 $0 $2,780,000 $2,780,000 $2,780,000 $2,780,000 $2,780, /2014 II Yes $3,775,000 $3,775,000 $3,775,000 $3,775,000 $3,775,000 WATER Z WATER SYSTEM MISC $2,065,800 $699,175 $0 $845,001 $825,002 $915,003 $2,764, JJ Yes Z COMMERCIAL WATER METER $5,822,351 $352,843 $350,000 $350,000 $350,000 $350,000 $350, JJ Yes Z WELL SYSTEM MISC IMPROV $1,361,000 $227,337 $0 $90,000 $90,000 $90,000 $ JJ Yes Z WATER SUPPLY MASTER PLAN $2,839,587 $72,332 $250,000 $100,000 $100,000 $100,000 $100, JJ Yes Z SAC RIVER SOURCE WATER $1,238,936 $84,523 $70,000 $102,000 $60,000 $60,000 $ JJ Yes Z SAC RIVER - KEEP OUR $145,000 $25,196 $30,000 $31,000 $31,000 $31,000 $ JJ Yes Z BASE CIP RESERVE-WATER $548,038 $548,038 $400,000 $400,000 $400,000 $400,000 $400, JJ Yes Z BACKFLOW PREVENTION $2,831,913 $593,150 $50,000 $205,000 $205,000 $205,000 $200, JJ Yes Z SCADA SYSTEM UPGRADE $2,726,000 $245,043 $100,000 $100,000 $100,000 $100,000 $100,000 JJ Yes Z AMR RIVER SOURCE WATER $687,598 $32,507 $15,000 $24,000 $27,000 $27,000 $ JJ Yes Z AMER RVR - KEEP OUR $135,000 $28,932 $25,000 $26,000 $26,000 $26,000 $ JJ Yes Z UTILITIES ADA IMPROVEMENT $146,000 $94,621 $5,000 $5,000 $5,000 $0 $ /2012 JJ Yes Z DRINKING WATER QUALITY $1,335,996 $41,322 $85,000 $233,000 $341,000 $310,000 $ JJ Yes Z DISTRIBUTION FLUSHING $100,000 $99,351 $50,000 $0 $0 $0 $ /2010 JJ Yes Z GROUNDWATER PROTECTION $205,877 $198,719 $62,000 $0 $0 $0 $ /2012 JJ Yes Z SAC RVR WTR RELIAB STUDY $3,320,000 $545,428 $210,000 $500,000 $500,000 $500,000 $ /2007 JJ Yes Z BUILDING SECURITY SYSTEMS $400,000 $259,297 $0 $5,000 $5,000 $0 $ /2007 JJ Yes Z ASSET MANAGEMENT - WTR $170,000 $91,148 $0 $50,000 $50,000 $50,000 $ /2012 JJ Yes Z RESID WTR MTR PRGM $799,809 $232,007 $0 $9,896,000 $11,096,000 $12,296,000 $13,496, /2010 JJ Yes Z IT PROJECTS $425,000 $393,122 $25,000 $200,000 $200,000 $200,000 $ /2010 JJ Yes Z T-MAIN POWER INN RD $1,496,000 $788,266 $500,000 $0 $0 $0 $ /2012 JJ Yes Z TREATMENT PLANT REHAB $1,000,000 $999,857 $1,000,000 $0 $0 $0 $ /2010 JJ Yes Z UNPLANNED CORRECTIVE $480,000 $480,000 -$230,000 $500,000 $500,000 $500,000 $0 JJ Yes Z SACRAMENTO RIVER WTP $100,000 $100,000 -$100,000 $0 $0 $0 $0 JJ Yes NEW FUNDING: Projects by Program Area by Project Number N - 7
343 Projects Receiving New Funding Budget Est Project Number Project Name through 6/2009 Balance 6/ / / / / /14 FY Initiated Est Complete Date Section Detail Sheet Available Z FAIRBAIRN WTP $60,000 $60,000 -$60,000 $0 $0 $0 $0 JJ Yes Z FY10 ECONOMIC DEVELOP $0 $0 $600,000 $600,000 $600,000 $600,000 $600, /2010 JJ Yes Z WATER METER READING $0 $0 $775,000 $661,000 $612,000 $563,000 $513, /2014 JJ Yes Z ALHAMBRA BOULEVARD RS $0 $0 $450,000 $0 $0 $0 $ /2011 JJ Yes Z WS T-MAIN REPLACEMENT, $0 $0 $50,000 $0 $0 $0 $ /2011 JJ Yes Z WS T-MAIN REPLACEMENT, $0 $0 $50,000 $0 $0 $0 $ /2011 JJ Yes Z WS T-MAIN REPLACEMENT, $0 $0 $50,000 $0 $0 $0 $ /2011 JJ Yes Z SRWTP 5 MG RESERVOIR $0 $0 $20,000 $0 $0 $0 $ /2010 JJ Yes Z CONNECTION TO COUNTY $0 $0 $100,000 $0 $0 $0 $ /2010 JJ Yes Z FLORIN RES. ENGINE 2 $0 $0 $120,000 $0 $0 $0 $ /2010 JJ Yes Z RWM-PROJECT MGMNT FY07 $182,627 $24,027 $100,000 $0 $0 $0 $ /2010 JJ Yes Z RWM-PUBLIC OUTREACH $108,000 $68,558 $36,000 $0 $0 $0 $ /2010 JJ Yes Z RWM PR 4PIPE REPL3A SO $475,000 $450,000 $1,860,000 $0 $0 $0 $ /2010 JJ Yes Z RWM PIPE REPL 5METER1 CITY $0 $0 $1,450,000 $0 $0 $0 $ /2010 JJ Yes Z RWM PR 5PIPE REPL2 GOLF $0 $0 $650,000 $0 $0 $0 $ /2011 JJ Yes Z RWM RETRO 6METER1 $0 $0 $2,000,000 $0 $0 $0 $ /2010 JJ Yes Z RWM RETRO 8METER6 NORTH $0 $0 $2,600,000 $0 $0 $0 $ /2010 JJ Yes $13,748,000 $14,923,001 $16,123,002 $17,323,003 $18,523,004 NEW FUNDING: Projects by Program Area by Project Number N - 8
344 CITY OF SACRAMENTO CIP INDEX BY PROGRAM AREA Projects By Council District: By Project Name CAPITAL IMPROVEMENT PROGRAM O
345 Projects Budget Est Est Project through Balance FY Complete Number Project Name 6/2009 6/ / / / / /14 Initiated Date Section Council District(s): 1 B TH AND K PROJECT $249,000 $7,478 DD No T TH & 16TH STREET $25,299 $24, /2008 II No Z TH & NORTH B ST TO 19TH $160,000 $160, /2010 JJ No B RICHARDS $35,153,861 $3,492,225 DD No B RICHARDS IT 4811 $891,372 $46,324 DD No B /800 K STREET DEVELOP $298,500 $127,411 DD No X TH ST, H-K STS, SWR REHAB $440,000 $365, /2003 JJ No T TH STREET $2,311,733 $111, /2010 II No T ACCESS $1,536,239 $113, /2010 II No C ADA DM HISTORY CENTER $585,000 $71, /2007 DD No C ADA PARKING FACILITIES $151,500 $21, /2004 DD No T ALLEYWAYS SAFETY $50,000 $48, /2008 II No C ANIMAL CONTROL IMPS 3131 $1,066,847 $289, /2010 DD No M APP-SO NATOMAS ART PROJ $100,000 $79,310 FF No T ARENA BL LANDSCAPING 3431 $355,000 $91, /2007 II No L BANNON CREEK $5,000 $5,000 GG No T BOAT SECTION $800,000 $22,306 II No L BURBERRY COMM PARK 9A $139,778 $134, /2008 GG No L BURBERRY PARK $1,275,000 $1,257, /2008 GG No B CALIFORNIA INDIAN HERITAGE $300,000 $67, /2009 GG No B CAPITOL MALL $185,000 $85,568 DD No B CAPITOL MALL/TOWER BRIDGE $600,000 $600, /2006 DD No L CENTRAL CITY L&L PARK $86,093 $19,543 GG No T CENTRAL CITY TWO WAY 9TH $456,000 $405, /2009 II No L CESAR CHAVEZ PLAZA $0 $0 $100,000 $0 $0 $0 $ /2010 GG Yes L CHUCKWAGON PARK $62,740 $18, /2008 GG No A CITY CLERK AUTOMATION $301,634 $182,501 DD No D CNF - DISTRICT 1 $317,269 $247,269 DD No Detail Sheet Available Projects by Council District by Project Name O - 1
346 Projects Budget Est Est Project through Balance FY Complete Number Project Name 6/2009 6/ / / / / /14 Initiated Date Section C CNTL IT AC-SERVER ROOM AC $40,000 $40,000 DD No T CNTRLL CITY CNVSN- 3RD-I TO $400,000 $114,899 II No M COMMUNITY CENTER $469,494 $284,422 $50,000 $105,000 $80,000 $230,000 $450,000 FF Yes M COMMUNITY CENTER $125,000 $125,000 $0 $0 $0 $100,000 $30,000 FF Yes C CONV CNTR ADA AUTOMATIC $23,000 $23,000 DD No M CONVENTION CENTER $220,000 $220,000 FF No M CONVENTION CENTER AV $120,000 $116,315 $20,000 $20,000 $20,000 $20,000 $20,000 FF Yes M CONVENTION CENTER CARPET $750,000 $29,296 $0 $0 $0 $200,000 $200,000 FF Yes M CONVENTION CENTER $276,000 $0 $0 $200,000 $200,000 $0 $0 FF Yes M CONVENTION CENTER $800,000 $777,622 $330,000 $0 $0 $0 $ /2009 FF Yes M CONVENTION CENTER $700,000 $700,000 FF No M CONVENTION CENTER $100,000 $23,642 FF No L COUNCIL DISTRICT 1 PARK $147,651 $145,297 GG No L CREEK DOGWOOD PARK $1,352,988 $1,318, /2011 GG No M CROCKER ARCHITECTS AND $1,872,221 $1,390 FF No M CROCKER ART MUSEUM $63,270,799 $15,000, /2010 FF No M CROCKER ENVIRONMENTAL $530,000 $26,575 FF No M CROCKER MGMT & ADMIN $340,000 $28,031 FF No M CROCKER PERMITS & INSP $561,636 $236,714 FF No T DEL PASO ROAD $5,004,083 $9, /2008 II No T DEL PASO ROAD $120,000 $120, /2010 II No L DOGWOOD PARK - APP $30,000 $6,000 GG No D DOWNTOWN PRTNSHP ICE $100,000 $95 DD No D DOWNTOWN PRTNSHP INF $10,000 $10,000 DD No K EAST DRAIN CANAL BIKEWAY $259,300 $259, /2009 GG No V EAST END DEVELOPMENT $100,000 $89, /2009 II No X ED-GLOBE MILLS SEWER $70,000 $70,000 JJ No L EGRET PARK MASTER PLAN $0 $0 $50,000 $0 $0 $0 $ /2010 GG Yes T EL CENTRO RD/ARENA BL TS $168,454 $8, /2005 II No T EL CENTRO ROAD $300,000 $292, /2010 II No Detail Sheet Available Projects by Council District by Project Name O - 2
347 Projects Budget Est Est Project through Balance FY Complete Number Project Name 6/2009 6/ / / / / /14 Initiated Date Section Z EL CNTRO RD TM TNK-CTY LMT $1,500,000 $1,433, JJ No V ELEVATOR RENO/MODERN $1,156,376 $495, /2014 II No Z ELKHORN 3MG RESERVOIR $7,330,000 $115, /2005 JJ No M EXHIBIT HALLS C, D, AND E $300,000 $300,000 FF No L FISHERMAN'S LAKE PARK - APP $37,200 $4,390 GG No L FISHERMAN'S LAKE PARKWAY $1,844,998 $1,725, /2007 GG No X FLOOD GATES REHAB AT BLUE $255,000 $38, /2006 JJ No L FORT JEFFERSON $25,000 $8,896 GG No L FORT S. $1,027,000 $138,798 GG No V GARAGE INTERIOR LIGHTING $1,190,078 $845, /2014 II No K GARDEN HIGHWAY BIKETRAIL $215,000 $212, /2005 GG No L GARDENLAND PARK MP $35,000 $8,222 GG No L GARDENLAND PARK PSIP TIER $120,000 $120,000 $375,000 $0 $0 $0 $ /2011 GG Yes L GARDENLAND PARK SAFETY $162,900 $52,594 GG No L GOLDEN POPPY PARK $869,660 $138, /2010 GG No B GREYHOUND - $200,000 $199,917 DD No B GREYHOUND - SEQOUIA $800,000 $755,867 DD No B GREYHOUND - SITE $1,000,000 $1,000,000 DD No Z H ST RV STL MN RPL 5TH TO $1,799,732 $170, /2004 JJ No L HERON ELEMENTARY 4TH R $425,000 $197,668 GG No S HERON PARK $25,000 $24, /2009 II No R HOLLOW SIDEWALK $977,400 $231, /2009 II No Z I ST RS TM RPL FRNT-5 ST $2,300,000 $203, JJ No S I-5 / DEL PASO ROAD SIGNALS $500,000 $100, /2009 II No W I-5 FREEWAY LANDSCAPE $5,435,438 $4,091,130 $998,592 $0 $0 $0 $ /2010 JJ Yes K WEST CANAL BIKE $1,095,500 $107, /2009 GG No S I-80 / WEST EL CAMINO SIGNAL $525,000 $62, /2010 II No T INTERMODAL CIRCULATION $900,260 $540, /2010 II No T INTERMODAL DEPOT $1,742,500 $1,735, /2013 II No T INTERMODAL $6,951,004 $3,248, /2020 II No Detail Sheet Available Projects by Council District by Project Name O - 3
348 Projects Budget Est Est Project through Balance FY Complete Number Project Name 6/2009 6/ / / / / /14 Initiated Date Section T INTERSTATE 5 & RICHARDS $1,120,000 $1,120, /2010 II No T ITF - SITE ACQUISITION $61,738,337 $5,401, /2009 II No X J/K ALLEY SEWER $705,000 $134, /2006 JJ No L JEFFERSON PARK MP & DEV $425,000 $402,157 GG No Z JIBBOOM ST REHAB/PARK $283,000 $175, /2005 JJ No B JOES CRABSHACK REPAIRS $59,380 $59,380 DD No B K STREET STREETSCAPE $4,730,000 $3,817,522 DD No C LABOR RELATIONS REMODEL $48,625 $44,664 DD No L MAGNOLIA PARK - APP $30,000 $17,000 GG No L MAGNOLIA PARK $2,172,280 $1,972, /2010 GG No L MAGNOLIA PARK EXPANSION $600,000 $44, /2007 GG No Z MAIN REPLACEMENT, 9TH ST - $65,000 $60, /2011 JJ No L MEADOWS PARK $515,368 $490,518 GG No V MECHANICAL/ELECTRICAL $2,302,732 $504,907 $50,000 $50,000 $50,000 $50,000 $50, /2014 II Yes T MIDTOWN TRANSPORTATION $2,951,760 $76, /2009 II No L N. NATOMAS REG PARK - APP $38,700 $4,340 GG No L N NATOMAS REGIONAL PK DEV $3,565,430 $41, /2009 GG No T NATOMAS BLVD $200,417 $190,566 II No S NATOMAS CROSSING NTMP $54,700 $39, /2009 II No L NATOMAS OAKS PARK $15,000 $15, /2009 GG No T NCBD - 7TH STREET WIDENING $70,000 $11, /2009 II No D NEIGH PRGM FOR GRANTS $25,000 $20,500 DD No L NINOS PARK SAFETY IMP $49,300 $23,293 GG No K NINOS PARKWAY PHASE 1B $230,175 $9, /2008 GG No K NINOS PKWY BIKE TRL-PHS I $430,000 $130, /2008 GG No L NINOS PKWY/RIO TIERRA DVLP $596,784 $62, /2006 GG No W NO NATOMAS DRAINAGE $1,624,271 $84, /2010 JJ No Z NORTH B ST - SRWTP TO 18TH $400,000 $400,000 JJ No T NORTH CENTRAL BUSINESS $1,562,568 $599, /2010 II No B NORTH NATOMAS CC $600,000 $600, /2012 DD No Detail Sheet Available Projects by Council District by Project Name O - 4
349 Projects Budget Est Est Project through Balance FY Complete Number Project Name 6/2009 6/ / / / / /14 Initiated Date Section T NORTH NATOMAS FREEWAY $97,500 $21,757 $11,500 $11,500 $11,500 $11,500 $11, /2014 II Yes L NORTH NATOMAS L&L PARK $47,609 $12,077 GG No B NORTH NATOMAS LIBRARY $15,813,485 $6,183, /2009 DD No T NORTHGATE BLVD/ ARDEN $222,271 $78, /2011 II No L NORTHGATE PARK $510,000 $510, GG No L OAKBROOK PARK MASTER $845,703 $824, /2008 GG No K OFF-STREET BIKE TRAIL AT $268,000 $206, /2006 GG No M OLD SACRAMENTO DISTRICT $63,396 $63,396 FF No Y OLD SACRAMENTO SERVICE $135,000 $39,555 JJ No M OLD SACRAMENTO $155,363 $148,071 FF No L PA10 PUBLIC PLACES $50,000 $38,557 GG No L PA9 PUBLIC PLACES PLANNING $50,000 $38,708 GG No V PARKING FACILITIES $7,022,076 $6,354,556 $2,000,000 $2,000,000 $2,000,000 $2,000,000 $2,000, /2014 II Yes V PARKING FACILITIES $3,411,992 $1,825,151 $200,000 $200,000 $200,000 $200,000 $200, /2014 II Yes V PARKING GARAGE ATTENDANT $632,552 $303, /2011 II No V PARKING LOT C-APP $298,276 $23, /2010 II No V PARKING VIDEO $750,000 $577, /2014 II No L PEREGRINE PARK 3E $1,994,931 $461, /2007 GG No X PIONEER RESERVOIR ROOF $323,261 $2, /2005 JJ No T RAILYARDS DEVELOPMENT $2,198,349 $131, /2009 II No L REDBUD PARK $0 $0 $275,000 $0 $0 $0 $ /2011 GG Yes L REGENCY PARK - APP $53,831 $5,600 GG No L REGENCY PARK $0 $0 $10,000 $0 $0 $0 $ /2009 GG Yes C RELOCATION OF CITY OFFICES $94,960 $8,127 DD No V RETAIL AND OFFICE SPACE $1,811,712 $712,236 $50,000 $50,000 $50,000 $50,000 $50, /2014 II Yes V REVENUE CONTROL SYSTEM $4,646,872 $1,510, /2014 II No T RICHARDS/ I-5 ULTIMATE $300,000 $299, /2017 II No L RIVER BIRCH (GOLDENLAND) $1,014,489 $897, /2007 GG No RIVER GARDENS/GARDENLAND $0 $0 $114,000 $0 $0 $0 $ /2009 KK Yes Z RWM-BOWMAN/WISCONSIN $414,500 $401, JJ No Detail Sheet Available Projects by Council District by Project Name O - 5
350 Projects Budget Est Est Project through Balance FY Complete Number Project Name 6/2009 6/ / / / / /14 Initiated Date Section Z RWM-BOWMAN/WISCONSIN $424,500 $1,249 JJ No L S. NATOMAS COMM PK - APP $31,360 $22,858 GG No C SAC HISTORY MUSEUM HVAC $450,000 $450,000 DD No Z SACRAMENTO RIVER WTP $100,000 $100,000 -$100,000 $0 $0 $0 $0 JJ Yes T SACTO VALLEY STATION- $50,000 $49, /2010 II No Z SAN JUAN 3MG RESERVOIR $5,240,000 $74, /2003 JJ No L SAND COVE STREAM BANK $507,827 $36,367 GG No B SCHOOL HOUSE LANDING DEV $150,000 $17,347 DD No V SIGN & STRIPE ALL PARKING $213,827 $56, /2014 II No C SO NATOMAS COMM PARK $235,000 $37, /2008 DD No B SO SIDE BOARDWALK EXT $100,000 $34,109 DD No L SOUTH NATOMAS L&L PARK $103,356 $9,811 GG No L SOUTH NATOMAS YTH SPORTS $1,225,260 $1,129, /2008 GG No B SPORTS & ENT DISTRICT DEV $253,000 $6,500 DD No T SR275 ADA COMPLIANCE $323,000 $322, /2014 II No T SR275 IRRIGATION $18,000 $17, /2014 II No T SR275 ROADWAY $399,000 $398, /2014 II No T SR275 SIGNING AND STRIPING $21,000 $20, /2014 II No T SR275 STREET LIGHTING $361,000 $360, /2014 II No T SR275 TRAFFIC SIGNALS $230,000 $229, /2014 II No Z SRWTP 5 MG RESERVOIR $0 $0 $20,000 $0 $0 $0 $ /2010 JJ Yes Z SRWTP 9.5 MG RESERVOIR $2,270,000 $13, /2009 JJ No Z SRWTP FLOWMETERS $300,000 $292,247 JJ No Z SRWTP INTAKE TREE $100,000 $47,643 JJ No Z SRWTP N VLT MANIFOLD REPL $110,000 $22, /2006 JJ No Z SRWTP PROP ACQUISITION $239,000 $225, /2006 JJ No Z SRWTP SWITCHGEAR RPL $1,295,000 $421, /2006 JJ No T STATE ROUTE 275 CURB, $5,000 $4, /2014 II No V STRUCTURE REPAIRS & $6,030,000 $2,357,911 $500,000 $500,000 $500,000 $500,000 $500, /2014 II Yes B STUDIO FOR THE PERFORMING $14,055,039 $9,841, /2010 DD No Detail Sheet Available Projects by Council District by Project Name O - 6
351 Projects Budget Est Est Project through Balance FY Complete Number Project Name 6/2009 6/ / / / / /14 Initiated Date Section B STUDIOS PERFORMING $180,000 $167,922 DD No W SUMP 130 ELEC REHAB $517,000 $145, /2006 JJ No L SUNDANCE PARK 2E $222,000 $26, /2009 GG No L SWAINSON HAWK PARK (TK) - $40,500 $5,330 GG No L SWAINSON S HAWK PARK $271,277 $168,098 GG No L SYCAMORE PARK $0 $0 $65,000 $0 $0 $0 $ /2010 GG Yes Z T-MAIN JIBBOOM ST STEEL MN $1,336,000 $1,335, JJ No L TANZANITE COMMUNITY PARK $0 $0 $350,000 $0 $0 $0 $ /2011 GG Yes M THEATER ORCHESTRA SHELL $400,000 $400,000 FF No M THEATER RENOVATION $1,330,000 $1,117,268 $1,050,000 $2,000,000 $1,850,000 $2,000,000 $3,000,000 FF Yes Z TM REPL 6TH ST I-Q ST $2,000,000 $1,919, JJ No T TRACK RELOCATION CF48 $3,254,596 $1,447,521 II No S TRUXEL RD COORDINATION $100,000 $24, /2009 II No L VALLEY OAK PARK - APP $58,880 $11,880 GG No L VALLEY OAK PARK $3,002,132 $2,947, /2011 GG No C VETERINARIAN/VOLUNTEER $50,000 $50,000 DD No T WEST EL CAMINO/1-80 $500,000 $98, /2010 II No L WEST HAMPTON (TK) $159,885 $30,450 GG No L WESTLAKE PARK $1,068,779 $74, /2007 GG No L WILD ROSE PARK $2,774,400 $2,731, /2011 GG No T WYNDVIEW PEDESTRIAN $141,300 $131, /2009 II No L ZAPATA PARK COMMUNITY $67,000 $60, /2009 GG No Council District(s): 1, 2 $6,519,092 $5,136,500 $4,961,500 $5,361,500 $6,511,500 T EL CAMINO NEMDC $250,000 $82, /2008 II No T MAIN AVE BRIDGE REPLACEMT $23,977,140 $4,794, /2007 II No Z MAIN AVE TM BLCKRK-RIO LIN $800,000 $665, /2010 JJ No K UEDA PARKWAY HABITAT $250,000 $218,228 11/2006 GG No K UEDA PKWY BIKE TRL $4,352,816 $177, /2006 GG No Detail Sheet Available Projects by Council District by Project Name O - 7
352 Projects Budget Est Est Project through Balance FY Complete Number Project Name 6/2009 6/ / / / / /14 Initiated Date Section T WEST EL CAMINO AVENUE $8,358,058 $984, /2009 II No Council District(s): 1, 2, 3 L AREA 4 PARK PLANNING $180,882 $27,829 $30,000 $30,000 $30,000 $30,000 $30,000 GG Yes T SR160 BRIDGES $60,000 $57,373 II No T SR160 STATE OF GOOD $2,441 $2, /2014 II No T STATE ROUTE 160 $19,758 $10, /2004 II No T STATE ROUTE 160 TREE $105,575 $90, /2013 II No Z TM N CRS TIE ALIGNMENT $130,000 $130, /2009 JJ No Council District(s): 1, 2, 3, 4, 5, 6, 7 $30,000 $30,000 $30,000 $30,000 $30,000 C CITY FACILITY DEFERRED $12,200,135 $274,308 $1,000,000 $1,000,000 $1,000,000 $1,000,000 $1,000, /2010 DD Yes Council District(s): 1, 2, 6 $1,000,000 $1,000,000 $1,000,000 $1,000,000 $1,000,000 R FY08 CITY STREET OVERLAY $269,208 $113,618 II No Council District(s): 1, ALIKALI FLAT RDA $0 $0 $361,553 $0 $0 $0 $ /2009 KK Yes Z H ST RS TM RPL ST $2,224,719 $177, JJ No Z I ST - 11TH TO 23RD ST MAIN $150,000 $150, /2010 JJ No B PRE-DEVELOPMENT SERVICES $381,336 $29, /2025 DD No T SR160-STRUCTURES 12TH AND $31,529 $30, /2012 II No T SR160-TEA PROJECT 15TH AND $110,044 $103, /2011 II No Z TREATMENT PLANT REHAB $1,000,000 $999,857 $1,000,000 $0 $0 $0 $ /2010 JJ Yes K TWO RIVERS TRAIL ACQ RSVR $164,070 $67,314 GG No $1,361,553 $0 $0 $0 $0 Detail Sheet Available Projects by Council District by Project Name O - 8
353 Projects Budget Est Est Project through Balance FY Complete Number Project Name 6/2009 6/ / / / / /14 Initiated Date Section Council District(s): 1, 3, 4 T BIKE LANE IMPROVEMENTS $208,010 $136, /2008 II No T CENTRAL CITY TWO-WAY $1,886,299 $969, /2009 II No T DOWNTOWN TSM CAPITAL $70,000 $45, /2009 II No T DOWNTOWN TSM CAPITAL $0 $0 $20,000 $20,000 $20,000 $20,000 $20, /2014 II Yes L PA1 PARK SIGN REPLACEMENT $0 $0 $24,000 $0 $0 $0 $ /2009 GG Yes L PA1 PUBLIC PLACES PLANNING $30,000 $15,738 GG No B PRE-DEV SVCS - DOWNTOWN $2,677,705 $782, /2020 DD No Council District(s): 1, 3, 4, 5 $44,000 $20,000 $20,000 $20,000 $20,000 B CENTRAL CITY WAYFINDING $725,000 $122, /2002 DD No Council District(s): 1, 3, 4, 5, 6 X COMBINED SEWER SYS $8,763,366 $13, /2009 JJ No X CONDITION ASSESSMENT OF $190,000 $179, /2008 JJ No X CONDITION ASSMNT LARGE $402,000 $401, JJ No X CSS IMPROVEMENT PLAN $573,900 $32,676 $300,000 $0 $0 $0 $ /2012 JJ Yes X CSS MISCELLANEOUS REHAB $2,502,383 $137,871 $75,000 $750,000 $1,615,196 $1,566,424 $1,518, JJ Yes X CSS PLANNING $30,000 $9, /2006 JJ No X DI REPLACEMNT COMBINED $456,000 $58, JJ No X FLOW METERS CSS FACILITIES $225,000 $131, JJ No Council District(s): 1, 3, 4, 5, 8 $375,000 $750,000 $1,615,196 $1,566,424 $1,518,420 R FY07/08 FEDERAL OVERLAY $4,036,618 $512,551 II No T SR160-STREET LIGHTING $103,052 $101, /2012 II No T SR160-TRAFFIC SIGNALS $430,381 $255, /2013 II No Detail Sheet Available Projects by Council District by Project Name O - 9
354 Projects Budget Est Est Project through Balance FY Complete Number Project Name 6/2009 6/ / / / / /14 Initiated Date Section Council District(s): 1, 3, 4, 6 L AREA 1 PARK PLANNING $225,006 $25,452 $30,000 $30,000 $30,000 $30,000 $30,000 GG Yes Council District(s): 1, 4 $30,000 $30,000 $30,000 $30,000 $30,000 T & 12 ST ROW IMPRVMENTS $200,000 $199, /2010 II No X TH ST UPSIZING, U - R STS $2,140,000 $2,064, /2008 JJ No T BRIDGING I-5 $5,332,709 $701, /2009 II No B DOCKS PROMENADE COMM $229,505 $183,600 DD No B PIONEER BRIDGE PROJECT $2,079,129 $261, /2010 DD No K R STREET BIKE/PEDESTRIAN $481,000 $381, /2008 GG No X S STREET SEWER $2,420,000 $2,341, /2006 JJ No Z TM RPL 13TH-H TO Q ST $4,598,000 $4,297, /2007 JJ No Council District(s): 1, 4, 5, 6 Z BUILDING SECURITY SYSTEMS $400,000 $259,297 $0 $5,000 $5,000 $0 $ /2007 JJ Yes Council District(s): 2 $0 $5,000 $5,000 $0 $0 C ADA DM SCIENCE CENTER $299,750 $181, /2004 DD No C ADA ROBERTSON CC - PHASE II $244,287 $12,055 DD No C ADA ROBERTSON COMMUNITY $86,000 $19,287 DD No W BASIN 157 MASTER PLAN $325,691 $9, /2003 JJ No X BASIN 85 SEWER MASTERPLAN $467,000 $58, /2007 JJ No S BELDEN/D2 NTMP $25,000 $13, /2008 II No D COMM. IMPROVEMENTS - CD2 $1,813,277 $1,698, /2009 DD No L COUNCIL DISTRICT 2 PARK $9,315 $9,315 GG No Detail Sheet Available Projects by Council District by Project Name O - 10
355 Projects Budget Est Est Project through Balance FY Complete Number Project Name 6/2009 6/ / / / / /14 Initiated Date Section T DEL PASO BLVD $600,000 $589,433 II No D DEL PASO BOULEVARD CCTV $25,000 $25,000 DD No B DEL PASO ENTITLEMENTS $1,178,490 $87, /2008 DD No DEL PASO HEIGHTS RDA $0 $0 $1,228,397 $0 $0 $0 $ /2009 KK Yes B DEL PASO INFRASTRUCTURE $4,631,242 $ /2008 DD No B DEL PASO REMEDIATION $543,174 $ /2008 DD No T DEL PASO/GROVE $1,817,610 $ /2008 II No T DIXIEANNE AREA $871,262 $12, /2008 II No T DIXIEANNE AVENUE $2,028,000 $1,659, /2009 II No L DIXIEANNE TOT LOT - APP $35,000 $19,500 GG No X ED-RALEY AT ASCOT IMPROVM $525,906 $525,906 JJ No X ED-RAPTON UTILITIES 3351 $338,693 $338,693 JJ No S EL CAMINO AVENUE AND $390,000 $313, /2009 II No S EL MONTE (D2) $25,000 $25, /2009 II No F FIRE STN #20 ARDEN RPLC $5,591,600 $180, /2004 EE No B FULTON AVENUE $3,000,364 $22, /2008 DD No T FY 08 MARYSVILLE BLVD. $330,000 $222, /2009 II No L HAGGINWOOD PARK PSIP TIER $84,905 $84,905 GG No L HAGGINWOOD PARK SAFETY $341,083 $256,991 GG No T HOWE AVENUE BRIDGE STUDY $75,000 $70, /2012 II No T JESSIE AVE SIDEWALKS $800,000 $754, /2010 II No L JOHNSTON PARK MP $50,000 $356 GG No L JOHNSTON PARK PSIP TIER III $400,000 $400,000 GG No L JOHNSTON PARK SAFETY IMP $182,600 $156,586 GG No T MAIN AVE SIDEWALKS $1,100,000 $1,084, /2010 II No L MAMA MARKS PARK $61,000 $3, /2009 GG No T MCCLELLAN HEIGHTS $3,000,000 $2,278, /2010 II No W N. SAC RURAL DRAIN DESIGN $4,000 $4,000 JJ No C NACY IMPROVEMENTS $40,000 $20,123 DD No C NACY REMEDIATION $2,604,658 $1,115, /2010 DD No Detail Sheet Available Projects by Council District by Project Name O - 11
356 Projects Budget Est Est Project through Balance FY Complete Number Project Name 6/2009 6/ / / / / /14 Initiated Date Section W NORTH AREA DRYING $82,500 $80, /2007 JJ No NORTH SACRAMENTO RDA $0 $0 $1,785,807 $0 $0 $0 $ /2009 KK Yes T NORWOOD AVENUE BRIDGE $996,669 $680, /2010 II No L PLAYGROUND SHADE $244,848 $20, /2008 GG No T POINT WEST STREETLIGHTS $350,000 $208, /2009 II No L REA PARK IMPROVEMENTS $400,000 $400,000 GG No T RIO LINDA/MAIN FEASIBILITY $115,000 $10, /2009 II No C ROBERTSON C FIRE ALARM $125,000 $125,000 DD No L ROBERTSON PARK $312,500 $240, /2010 GG No L ROBLA COMM PARK PHASE 3 $502,666 $181, /2009 GG No L ROBLA PARK WETLAND $112,000 $107, /2009 GG No T ROBLA SIGN MONUMENTS $67,000 $65, /2009 II No T ROSEVILLE ROAD BRIDGE $1,863,975 $800, /2009 II No Z RWM PR 2PIPE REPL1 $915,000 $210, /2008 JJ No S SIGNAL-RIO LINDA AND BELL $15,000 $6, /2010 II No L STRAWBERRY MANOR PARK $50,000 $21,083 GG No L STRAWBERRY MANOR PK $400,000 $352,649 GG No W SUMP 117 ELECTRICAL REHAB $0 $0 $10,000 $0 $0 $0 $ /2011 JJ Yes X SUMP 131 ELECTRICAL REHAB $150,000 $135, /2006 JJ No W SUMP 153 ELECTRICAL REHAB $350,000 $279, /2007 JJ No W SUMP 157 ELECTRICAL REHAB $330,000 $306, /2008 JJ No W SUMP 157 TRASHRACKS $713,557 $710, JJ No X SUMP 85 INFLUENT PIPE $100,000 $98,786 $1,100,000 $0 $0 $0 $ /2010 JJ Yes X SUMP 85 VFD REPLACEMENT $150,000 $133, /2009 JJ No B TRAP SHOOT CLEAN UP $39,604 $ /2008 DD No L TRIANGLE PARK $150,000 $150,000 GG No S XANDRIA $25,000 $25, /2010 II No T YOUNGS HEIGHTS STREET $288,738 $28, /2008 II No $4,124,204 $0 $0 $0 $0 Detail Sheet Available Projects by Council District by Project Name O - 12
357 Projects Budget Est Est Project through Balance FY Complete Number Project Name 6/2009 6/ / / / / /14 Initiated Date Section Council District(s): 2, 3 L ARDEN ARCADE L&L PARK $52,137 $6,419 GG No AUBURN BLVD RDA $0 $0 $342,854 $0 $0 $0 $ /2009 KK Yes L NORTH SACRAMENTO L&L $124,326 $11,388 GG No L PA7 PUBLIC PLACES PLANNING $6,000 $596 GG No L PA8 PARK SIGN REPLACEMENT $0 $0 $49,000 $0 $0 $0 $ /2009 GG Yes L PA8 PUBLIC PLACES PLANNING $50,000 $29,600 GG No T SWANSTON STATION INFRAST. $854,286 $7, /2007 II No Council District(s): 2, 7, 8 $391,854 $0 $0 $0 $0 W SUMPS 33, 90, AND 157 $36,443 -$4, /2007 JJ No Council District(s): 3 L TH AND Q STREET MASTER $0 $0 $50,000 $0 $0 $0 $ /2010 GG Yes T TH/ 28TH STREET UPRR $705,000 $569, /2009 II No Y TH ST LANDFILL PLEDGE $551,100 $551, /2010 JJ No X /35 ALLEY SEWER $200,000 $173, /2006 JJ No T TH STREET ENTRY PROJECT $10,000 $9, /2010 II No X TH/ SANTA YNEZ ALLEY $0 $0 $0 $140,000 $0 $0 $ /2010 JJ Yes X /37 ALLEY SEWER $0 $0 $230,000 $0 $0 $0 $ /2010 JJ Yes T ARDEN WAY STREETSCAPE $341,951 $95, /2007 II No BEN ALI/ HAGGINWOOD $0 $0 $100,000 $0 $0 $0 $ /2009 KK Yes T BEN ALI STREET LIGHTS $465,000 $245, /2008 II No T BEN ALI STREETLIGHTING $535,000 $88, /2008 II No S C STREET CANNERY PROJECT $10,000 $10,000 II No X CAPITOL/L ALLEY SEWER $160,000 $140, /2006 JJ No T CENTRAL CITY TWO WAY $258,000 $62, /2009 II No T CNTRLL CITY J ST 30TH TO $450,000 $444,250 II No Detail Sheet Available Projects by Council District by Project Name O - 13
358 Projects Budget Est Est Project through Balance FY Complete Number Project Name 6/2009 6/ / / / / /14 Initiated Date Section D COMM. IMPROVEMENTS - CD 3 $500,000 $500, /2009 DD No Z CONNECTION TO COUNTY $0 $0 $100,000 $0 $0 $0 $ /2010 JJ Yes L COUNCIL DISTRICT 3 PARK $95,699 $35,269 GG No X D/E ALLEY SEWER REP, 25TH $400,000 $354, /2005 JJ No Y DELLAR LANDFILL CLOSURE $0 $0 $500,000 $0 $0 $0 $ /2010 JJ Yes X E/F ALLEY SEWER REP, 25TH $410,000 $387, /2005 JJ No X E/F ALLEY SEWER $210,000 $0 $210,000 $0 $0 $0 $ /2010 JJ Yes L EAST PORTAL PARK JOGGING $50,000 $46, /2008 GG No T ELVAS AVENUE $150,000 $132, /2008 II No C FIRE STN#4 GRANADA WAY $30,000 $29,884 DD No Z FWTP CLARIFIER MOTOR CNTL $203,000 $75, JJ No Z FWTP FILTER MOTOR $175,000 $32, /2006 JJ No Z FWTP HVAC UPGRADE 3351 $100,000 $100,000 JJ No Z FWTP INTAKE PHASE 3 $750,000 $749, /2008 JJ No Z FWTP LOW LFT PMP PH1 $274,000 $80, /2008 JJ No Z FWTP LOW LIFT PUMP PH 2 $417,000 $48, JJ No Z FWTP MECHANICAL $1,250,000 $1,244, JJ No Z FWTP SLUDGE PILOT $760,883 $18, /2007 JJ No Z FWTP SWITCHGEAR UPGRADE $1,260,000 $199, /2007 JJ No Y GROUNDWATER REMEDIATION $441,900 $194, /2008 JJ No X H STREET SEWER REHAB, $80,000 $78, /2006 JJ No S HAGGINWOOD $30,000 $5, /2009 II No Z HOWE AVE PIPE SUPRT $150,000 $134, /2008 JJ No X J/K ALLEY SWR, 22ND - 23RD $150,000 $145, JJ No Y LANDFILL GAS CONTROL $1,950,546 $500, /2008 JJ No Y LANDFILL SITE CLOSURE $7,427,072 $962,352 $217,000 $217,000 $217,000 $217,000 $217, /2012 JJ Yes W MASTER PLAN BASIN 152 $250,000 $250,000 JJ No T MCKINLEY PARK STREET $1,197,372 $876, /2008 II No X MCKINLEY SEWER $2,760,000 $100,667 JJ No S MEISTER TERRANCE NTMP $25,000 $14, /2009 II No Detail Sheet Available Projects by Council District by Project Name O - 14
359 Projects Budget Est Est Project through Balance FY Complete Number Project Name 6/2009 6/ / / / / /14 Initiated Date Section M MEMORIAL AUD ELECTRICL $125,000 $25,036 FF No M MEMORIAL AUDITORIUM $7,136,000 $2,707,427 $100,000 $100,000 $100,000 $200,000 $200, FF Yes S MERCY HOSPITAL NTMP $200,000 $199,922 II No L MUIR CHILDREN'S PARK $704,102 $55, /2007 GG No Y OLD ELVAS QUARRY $1,335,543 $147, /2010 JJ No L R STREET CORRIDOR ACQ $1,497,910 $195,744 GG No T RICHARDS AT SR160 $5,320,615 $267, /2007 II No Z RWM RETRO 3METER2 56TH/J $1,874,000 $401, /2008 JJ No Z RWM RETRO 3METER4 26TH/D $1,140,000 $450, /2008 JJ No X S/T ALLEY SWR, 18TH-19TH $176,000 $170, JJ No Y ST. FRANCIS-CLOSURE $900,000 $77, /2010 JJ No T STREETLIGHT REPLACEMENT J $608,000 $608, /2009 II No W SUMP 101 ELECTRICAL REHAB $900,000 $894, /2009 JJ No X SUMP 79 RECONSTRUCTION $210,000 $203, /2006 JJ No L SUTTERS LANDING PARK PH 2 $1,639,057 $388, /2007 GG No L SUTTERS LANDING REGIONAL $1,666,667 $1, /2009 GG No X T ST SEWER REPLAC, 19TH - $300,000 $290, JJ No X T STREET SEWER $0 $0 $0 $300,000 $0 $0 $ /2010 JJ Yes W UPPER HAGGINWOOD $324,473 $76, /2007 JJ No L WASHINGTON & MUIR PARKS $220,000 $218,809 GG No Council District(s): 3, 4 $1,507,000 $757,000 $317,000 $417,000 $417,000 Z WS T-MAIN REPLACEMENT, $0 $0 $50,000 $0 $0 $0 $ /2011 JJ Yes Council District(s): 3, 4, 5 $50,000 $0 $0 $0 $0 Z DOU CAMERAS $231,616 $151, /2007 JJ No Detail Sheet Available Projects by Council District by Project Name O - 15
360 Projects Budget Est Est Project through Balance FY Complete Number Project Name 6/2009 6/ / / / / /14 Initiated Date Section Council District(s): 3, 4, 5, 6 Z STOCKTON BLVD T-MAIN R-2ND $3,000,000 $664, JJ No Council District(s): 3, TH STREET RDA $0 $0 $215,754 $0 $0 $0 $ /2009 KK Yes R CITY BRIDGE REPAIR - PHASE 1 $260,777 $ /2008 II No L EAST SACRAMENTO L&L PARK $95,453 $14,134 GG No T FOLSOM BLVD IMPROVEMENT $2,540,967 $2,539, /2014 II No T FOLSOM BLVD IMPROVEMENT $2,580,534 $119, /2012 II No T REDDING AVENUE BIKE $1,195,243 $475, /2008 II No Council District(s): 3, 6, 8 $215,754 $0 $0 $0 $0 L PA6 PUBLIC PLACES PLANNING $14,000 $3,268 GG No Council District(s): 4 X TH ST SEWER, O/P TO Q/R $630,000 $114, JJ No T TH & 16TH STREET LIGHT $532,135 $327, /2008 II No X TH AND 12TH AVENUE $700,000 $13, /2006 JJ No T TH AVENUE BRIDGE OVER $139,321 $62, /2009 II No C ANIMAL SHELTER CATTERY $1,500,000 $70, /2008 DD No M ARCHIVES MAINTENANCE AND $251,500 $31,500 FF No T BROADWAY BRIDGE $200,000 $193, /2008 II No T BROADWAY STREETSCAPE $180,000 $179, /2008 II No L CHARLIE JENSEN PARK $0 $0 $75,000 $0 $0 $0 $ /2010 GG Yes D CNF - DISTRICT 4 $362,997 $362,997 DD No S COLLEGE PLAZA (D4) NTMP $25,000 $24, /2009 II No L COUNCIL DISTRICT 4 PARK $42,130 $41,130 GG No Detail Sheet Available Projects by Council District by Project Name O - 16
361 Projects Budget Est Est Project through Balance FY Complete Number Project Name 6/2009 6/ / / / / /14 Initiated Date Section X CWTP ELECTRICAL MCC L $0 $0 $25,000 $0 $0 $0 $0 JJ Yes X CWTP ELECTRICAL $0 $0 $25,000 $0 $0 $0 $ /2011 JJ Yes X CWTP MCC E REPLACEMENT $430,000 $425, /2008 JJ No X CWTP MCC F REPLACEMENT $600,000 $572, /2007 JJ No B DOCKS PROMENADE $5,159,981 $5,025,719 DD No C EVELYN MOORE CENTER $15,236 $5, /2004 DD No F FIRE STN #5 BROADWAY RPLC $4,995,000 $8, /2003 EE No X FREMONT AREA REHAB $425,000 $126, /2008 JJ No X FREMONT AREA REHAB - $450,000 $449, /2009 JJ No X FREMONT AREA SEWER $0 $0 $450,000 $0 $0 $0 $ /2011 JJ Yes L FREMONT PARK - APP $30,569 $10,479 GG No L FREMONT PK SAFETY ACTION $5,000 $4,795 GG No M HARBOR DREDGING $712,915 $271,453 $65,000 $65,000 $65,000 $65,000 $65,000 FF Yes L LAND PARK REC TRAIL $329,015 $2, /2008 GG No S LAND TERRACE VISTA $25,000 $25, /2010 II No M MARINA IMPROVEMENTS $135,000 $135,000 $135,000 $135,000 $135,000 $135,000 $135,000 FF Yes Z MTR PR 4PR2B SLP PH3 $1,695,000 $1,596, /2008 JJ No T NEIGHBORHOOD GATEWAY - $25,000 $11, /2010 II No S NEWTON BOOTH NTMP $38,500 $2, /2008 II No X O/P ALLEY SEWER $0 $0 $0 $225,000 $0 $0 $ /2010 JJ Yes F PUBLIC SAFETY HDQTRS BLDG $5,521,805 $518, /2003 EE No T R STREET IMPROVEMENTS $2,920,000 $2,068, /2010 II No T R STREET MARKET PLAZA $715,000 $157, /2008 II No L REICHMUTH PARK - APP $38,500 $10, /2009 GG No L REICHMUTH PARK $465,500 $413, /2009 GG No C ROOF REPLACEM- ZOO $5,000 $3,221 DD No C ROOF REPLACEMT- APE $70,000 $7,285 DD No C ROOF REPLNT SNOW $35,000 $3,629 DD No Z RWM PR 4PIPE REPL3A SO $475,000 $450,000 $1,860,000 $0 $0 $0 $ /2010 JJ Yes X S ST INLINE STORAGE $200,000 $183, /2008 JJ No Detail Sheet Available Projects by Council District by Project Name O - 17
362 Projects Budget Est Est Project through Balance FY Complete Number Project Name 6/2009 6/ / / / / /14 Initiated Date Section X S/T ALLEY SWR, 22ND TO 29TH $990,000 $237, /2006 JJ No M SAC MARINA-FUEL DOCK REPL $50,000 $36,213 FF No M SAC MARINA-N BASIN BANK ST $75,000 $66,000 FF No M SACRAMENTO ZOO $270,050 $34,379 FF No Z SLP SM REPL PH 1 $1,860,000 $71, JJ No Z SO. LAND PARK DIST MAIN $2,150,000 $682, /2007 JJ No M SOUTH BASIN DOCK $10,711,213 $111,932 FF No S SOUTH LAND PARK HILLS $25,000 $4, /2009 II No L SOUTHSIDE CLUBHOUSE PHII $95,000 $5, /2003 GG No L SOUTHSIDE GARDEN - APP $156,200 $10,000 GG No L SOUTHSIDE PARK LAKE IMP $155,523 $151,360 GG No L SOUTHSIDE PARK LAKE $183,750 $1, /2008 GG No L SOUTHSIDE PARK LIGHTING $360,000 $168,766 GG No S SOUTHSIDE PARK NTMP $25,000 $25,000 II No L SOUTHSIDE PARK $373,200 $160, /2009 GG No X SUMP 1 AUTOMATION $225,000 $224, /2008 JJ No W SUMP 132 ELECTRICAL REHAB $30,000 $29, /2008 JJ No X SUMP 2 MCC REPLACEMENT $1,900,000 $766, /2007 JJ No W SUMP 26 ELEC REHAB $340,000 $ /2006 JJ No X SUMP 2A PUMP REPLACEMENT $825,000 $261,732 JJ No W SUMP 47 ELECTRICAL REHAB $0 $0 $10,000 $0 $0 $0 $ /2011 JJ Yes W SUMP 65 ELECTRICAL REHAB $330,000 $111, JJ No W SUMP 94 ELECTRICAL REHAB $30,000 $21, JJ No X U & S STS INLINE STORAGE $5,990,068 $134, /2006 JJ No X U/V ALLEY SWR, 8TH - 9TH $150,000 $137, JJ No Council District(s): 4, 5 $2,645,000 $425,000 $200,000 $200,000 $200,000 Z WS T-MAIN REPLACEMENT, $0 $0 $50,000 $0 $0 $0 $ /2011 JJ Yes Z WS T-MAIN REPLACEMENT, $0 $0 $50,000 $0 $0 $0 $ /2011 JJ Yes Detail Sheet Available Projects by Council District by Project Name O - 18
363 Projects Budget Est Est Project through Balance FY Complete Number Project Name 6/2009 6/ / / / / /14 Initiated Date Section Z ALHAMBRA BOULEVARD RS $0 $0 $450,000 $0 $0 $0 $ /2011 JJ Yes T CITY COLLEGE BIKE/ $500,000 $311, /2009 II No T FREEPORT BOULEVARD AND $3,394,082 $696, /2008 II No L LAND PARK L&L PARK REPAIR $113,269 $9,092 GG No L PA2 PUBLIC PLACES PLANNING $30,000 $24,865 GG No Council District(s): 4, 5, 7, 8 $550,000 $0 $0 $0 $0 L AREA 2 PARK PLANNING $187,353 $30,115 $30,000 $30,000 $30,000 $30,000 $30,000 GG Yes L PA 11 PUBLIC PLACES $15,000 $6,539 GG No L PA4 PUBLIC PLACES PLANNING $50,000 $42,503 GG No Council District(s): 4, 7 $30,000 $30,000 $30,000 $30,000 $30,000 X BASIN 55 I&I REDUCTION 2006 $976,250 $963, /2006 JJ No L PA3 PUBLIC PLACES PLANNING $20,000 $17,412 GG No L POCKET AREA L&L PARK $101,351 $25,280 GG No Council District(s): 4, 8 W BASIN 26 DETENTION $2,714,000 -$324, /2007 JJ No Council District(s): 5 R CITY BRIDGE REPAIR - $296,372 $232, /2008 II No T TH STREET LANDSCAPING $204,000 $198,858 II No A CALL CENTER 3114 $630,500 $62,967 DD No T TH AND MLK SIDEWALKS $50,400 $50,400 II No ADA SIDEWALKS $0 $0 $348,000 $0 $0 $0 $ /2009 KK Yes W AIRPORT DITCH LINING $260,000 $178, /2004 JJ No Detail Sheet Available Projects by Council District by Project Name O - 19
364 Projects Budget Est Est Project through Balance FY Complete Number Project Name 6/2009 6/ / / / / /14 Initiated Date Section L AIRPORT LITTLE LEAGUE PARK $168,551 $17,279 5/2005 GG No T ALLEY GATE INSTALLATION $18,000 $18, /2009 II No T ALLEY GATE MATCHING FUND $10,000 $6, /2008 II No Z APP-FIELD SVCS ADMIN BLDG $60,000 $28,105 JJ No T BACK LOT FENCING $13,500 $10, /2010 II No B BING MALONEY CART $853,433 $16, DD No C BING MLY GOLF CRS ADA $40,073 $1, /2007 DD No T BROADWAY & MARTIN LUTHER $1,754,727 $1,529, /2008 II No T BROADWAY STREETSCAPE $1,300,000 $1,067, /2008 II No L CHORLEY PARK MP $126,000 $62,085 GG No L CHORLEY PARK SAFETY IMP $76,500 $15,299 GG No S CITY FARMS (D5) $25,000 $25, /2009 II No D CNF - DISTRICT 5 $470,105 $470,105 DD No T COL HGHTS SDWLK IMP 50 ST $238,500 $ /2006 II No T COLONIAL HEIGHTS-52ND ST $315,000 $101, /2007 II No C CORP YARD MAINTENANCE $2,807,009 $30,969 $20,000 $20,000 $20,000 $20,000 $20, /2013 DD Yes L COUNCIL DISTRICT 5 PARK $67,500 $63,500 GG No S CURTIS PARK NTMP $46,600 $ /2008 II No F FB34-FIRE STN 56 GENERATOR $200,000 $57,010 EE No D FLORIN ROAD SHOVEL READY $100,000 $47,500 DD No FRANKLIN BLVD RDA $0 $0 $1,642,839 $0 $0 $0 $ /2009 KK Yes T FRANKLIN BLVD/FRUITRIDGE $805,000 $25, /2007 II No T FRANKLIN BOULEVARD $150,000 $126, /2008 II No S HELIBRON OAKS (D5) NTMP $25,000 $9, /2009 II No X MARSHALL WAY SEWER $0 $0 $0 $260,000 $0 $0 $ /2010 JJ Yes T MCCLATCHY NTMP $50,000 $50, /2011 II No L MCCLATCHY PARK MASTER $100,000 $23,943 GG No L MCCLATCHY PARK $1,214,700 $1,115, /2009 GG No L MCCLATCHY PARK SAFETY IMP $85,800 $65,291 GG No T MLK JR BLVD IMPROVEMENTS $5,253,592 $5,253, /2012 II No Detail Sheet Available Projects by Council District by Project Name O - 20
365 Projects Budget Est Est Project through Balance FY Complete Number Project Name 6/2009 6/ / / / / /14 Initiated Date Section T NEIGHBORHOOD WATCH $1,400 $1, /2010 II No L OAK PARK CC - APP $77,875 $10,054 GG No L OAK PARK COMMUNITY $5,622,125 $1,684, /2009 GG No T OAK PARK NTMP $25,000 $25, /2011 II No S OAK PARK NTMP $25,000 $25,000 II No OAK PARK RDA DEVELOPMENT $0 $0 $921,307 $0 $0 $0 $ /2009 KK Yes X OAK PARK REGIONAL $200,000 $16, /2007 JJ No T OAK PARK STREETLIGHTS $2,254,369 $933, /2008 II No L PHILLIPS PARK MASTER PLAN $25,000 $24, GG No T QUALITY OF LIFE $10,000 $1, /2011 II No T RAMPS-SIDEWALKS-SPEED $251,700 $251, /2010 II No Z RWM PIPE REPL 5METER1 CITY $0 $0 $1,450,000 $0 $0 $0 $ /2010 JJ Yes Z RWM PR 5PIPE REPL2 GOLF $0 $0 $650,000 $0 $0 $0 $ /2011 JJ Yes Z RWM RETRO 5METER1 CITY $1,935,000 $1,870,224 JJ No C SIERRA 2 COMMUNITY CENTER $1,526,138 $428, DD No L SIERRA 2 PARK COURT $0 $0 $75,000 $0 $0 $0 $ /2010 GG Yes C SIERRA II COMM CENTER $1,341,000 $779, /2007 DD No W SUMP 19 ELECTRICAL REHAB $250,000 $249, JJ No Z TMAIN CITY COLLEGE RES $200,000 $185, /2008 JJ No T TRAFFIC CIRCLES $40,000 $34, /2010 II No X UP RAILYARD REGIONAL $950,000 $754, /2005 JJ No Council District(s): 5, 6 $5,107,146 $280,000 $20,000 $20,000 $20,000 T TH STREET STATION AREA $999,700 $412, /2008 II No L AREA 3 PARK PLANNING $180,000 $31,032 $30,000 $30,000 $30,000 $30,000 $30,000 GG Yes L EAST BROADWAY L&L PARK $102,131 $18,066 GG No T HOWE AVE BRIDGE JOUNT $200,000 $200, II No L PA5 PUBLIC PLACES PLANNING $30,000 $23,214 GG No STOCKTON BLVD RDA $0 $0 $832,048 $0 $0 $0 $ /2009 KK Yes Detail Sheet Available Projects by Council District by Project Name O - 21
366 Projects Budget Est Est Project through Balance FY Complete Number Project Name 6/2009 6/ / / / / /14 Initiated Date Section T STRATEGIC NEIGHBORHOOD $424,825 $160, /2008 II No Council District(s): 5, 6, 7, 8 $862,048 $30,000 $30,000 $30,000 $30,000 L SOUTH SACRAMENTO L&L $153,584 $24,207 GG No Council District(s): 5, 7, 8 L AIRPORT MEADOWVIEW L&L $57,182 $13,086 GG No Council District(s): 5, 8 T FLORIN ROAD MEDIANS $682,477 $219, /2009 II No Council District(s): 6 F DISPATCH & TRNG FAC $22,076,057 $847, /2006 EE No K ARMY DEPOT BIKE $220,000 $123, /2008 GG No ARMY DEPOT RDA $0 $0 $2,828,036 $0 $0 $0 $ /2009 KK Yes L ARMY DEPOT SPORTS MASTER $25,000 $1, /2006 GG No L BAER PARK (MAX) $889,352 $199, /2009 GG No W BASIN 31 DET 65TH BROADWAY $4,875,000 $1,052, /2006 JJ No L BILL BEAN JR. PARK SAFETY $94,700 $50,073 GG No L BILL BEAN JR PK SFTY TIER II $187,949 $187,949 GG No S CAMELLIA NTMP (D6) $25,000 $25, /2010 II No L CAMELLIA PARK MASTER PLAN $60,000 $60, /2009 GG No D CNF - DISTRICT 6 $125,023 $125,023 DD No L COLOMA CC FIRE SAFETY $600,000 $108, /2008 GG No L COUNCIL DISTRICT 6 PARK $80,905 $58,225 GG No T DISTRICT 6 NEIGHBORHOOD $150,000 $89, /2009 II No Detail Sheet Available Projects by Council District by Project Name O - 22
367 Projects Budget Est Est Project through Balance FY Complete Number Project Name 6/2009 6/ / / / / /14 Initiated Date Section S EAST FRUITRIDGE NTMP (D6) $25,000 $1, /2008 II No T EL PARAISO AVENUE $1,161,000 $1,049, /2010 II No S ELDER CREEK (D6) $30,300 $17, /2009 II No S ELMHURST NTMP $78,735 $1, /2009 II No Z FAIRBAIRN WTP $60,000 $60,000 -$60,000 $0 $0 $0 $0 JJ Yes Z FAIRBAIRN WTP GRIT BASIN $100,000 $100,000 JJ No F FIRE STN 10 GENERATOR $200,000 $41,603 EE No Z FLORIN RES. ENGINE 2 $0 $0 $120,000 $0 $0 $0 $ /2010 JJ Yes T FOLSOM BL MASTER $240,000 $49, /2007 II No T FRUITRIDGE ROAD $234,775 $54, /2009 II No S FRUITRIDGE/BRADFORD SGNL $523,000 $166, /2007 II No L GEORGE SIM COMMUNITY $7,396,000 $869, /2009 GG No L GEORGE SIMS COMM CENTER $10,994,913 $1,207,188 GG No L GEORGE SIMS POOL REHAB $150,000 $148,385 GG No L GRANITE DOG PARK $1,221,566 $136, /2009 GG No T GRANITE PARK $1,258,236 $470, /2010 II No L GRANITE SAFETY FENCING IMP $25,000 $25,000 GG No L GRANITE SKATE PARK DEV $2,781,016 $175, /2007 GG No L GRANITE SOCCER FIELD DEV $1,566,248 $ /2008 GG No T KROY PATHWAY $120,000 $117,588 II No L OKI PARK OPEN SPACE $44,150 $4, /2008 GG No T POWER INN ROAD RAIL ROAD $250,000 $200, /2008 II No L REDDING AVENUE PARK $50,000 $39, /2009 GG No Z RWM RETRO 6METER1 $0 $0 $2,000,000 $0 $0 $0 $ /2010 JJ Yes T SOUTH WATT AVENUE AND $1,595,359 $30, /2008 II No W SUMP 51 ELECTRICAL REHAB $30,000 $21, JJ No Z SWANSTON ESTATES $15,000 $15, /2008 JJ No Z T-MAIN 45TH ST R - X STS $1,500,000 $1,439, JJ No Z T-MAIN CAL-AMER TO $126,000 $8,751 JJ No Z T-MAIN POWER INN RD $1,496,000 $788,266 $500,000 $0 $0 $0 $ /2012 JJ Yes Detail Sheet Available Projects by Council District by Project Name O - 23
368 Projects Budget Est Est Project through Balance FY Complete Number Project Name 6/2009 6/ / / / / /14 Initiated Date Section Z T-MAIN ZN40 FLORIN GAP $97,000 $97, /2009 JJ No L WARREN PARK (EARL) $700,000 $508, /2009 GG No Council District(s): 7 $5,388,036 $0 $0 $0 $0 L CENTRAL IRRIGATION INFRA $60,988 $60,277 GG No D CNF - DISTRICT 7 $27 $27 DD No L COUNCIL DISTRICT 7 PARK $158,877 $153,939 GG No B D7 POCKET LIBRARY APP $171,309 $162,139 DD No S FRANKLIN BLVD $40,000 $40,000 II No D FREEPORT RESERVOIR $85,000 $23,790 DD No K FREEPORT SHORES $956,035 $529, /2008 GG No S GREENHAVEN DRIVE AND $0 $0 $300,000 $0 $0 $0 $ /2010 II Yes L LEWIS PARK ENHANCEMENT $0 $0 $50,000 $0 $0 $0 $ /2009 GG Yes L LEWIS PARK PICNIC $150,000 $19, /2010 GG No W LINE POCKET CANAL PH 2 $138,625 -$3,917 JJ No W LINE POCKET CANAL PHASE 2 $40,000 $38, /2007 JJ No W MORRISON CK FOUR ACCESS $175,502 $87, /2002 JJ No X POCKET AD 2 SEWER $2,513,442 $2,512,338 JJ No B POCKET LIBRARY $14,821,678 $4,762, /2010 DD No Z RWM RETRO 7METER4 $1,635,000 $1,627,591 JJ No L SEYMOUR PARK $343,000 $183, /2009 GG No L SOJOURNER TRUTH PARK $188,465 $170, GG No W SUMP 112 ELECTRICAL REHAB $30,000 $29, JJ No X SUMP 134 RECONSTRUCTION $1,172,000 $18, JJ No X SUMP 136 RECONSTRUCTION $200,000 $183, /2005 JJ No X SUMP135 RECONSTRUCTION $200,000 $182, /2006 JJ No L VALLEY HI PARK $500,000 $380, /2010 GG No $350,000 $0 $0 $0 $0 Detail Sheet Available Projects by Council District by Project Name O - 24
369 Projects Budget Est Est Project through Balance FY Complete Number Project Name 6/2009 6/ / / / / /14 Initiated Date Section Council District(s): 7, 8 T CENTER PARKWAY BRIDGE $280,000 $268, /2009 II No T COSUMNES RIVER BLVD/ I-5 $12,862,630 $7,402, /2011 II No Z SOUTH SACRAMENTO 3MG $4,016,000 $3,957, /2010 JJ No Council District(s): 8 R CITY BRIDGE REPAIR - $143,066 $85, /2008 II No L TH ST BYPASS $665,030 $40, /2007 GG No S TH ST AND W ST TRAFFIC $355,000 $348, /2009 II No W ANTIOCH DETENTION ACCESS $77,266 $20, /2006 JJ No W BASIN 67 DET BASIN $282,000 $89, /2007 JJ No L BROOKFIELD/MEADOWVIEW $200,000 $31, /2008 GG No T BRUCEVILLE RD WIDENING $7,581,176 $414, /2006 II No S CARELLA GARDENS (D8) $45,000 $35, /2009 II No D CNF - DISTRICT 8 $273 $273 DD No L COUNCIL DISTRICT 8 PARK $2,045 $439 GG No L DELTA SHORES REGNL PARK $400,000 $392,633 GG No X FACIILITY RELOCATION - $775,000 $83,866 JJ No L FRANKLIN/BOYCE PARK $102,400 $86, /2007 GG No L HAMPTON PARK - APP $30,000 $6,028 GG No L HAMPTON STATION PARK - TK $133,493 $80,784 GG No L JACINTO CREEK PARK - APP $46,075 $20,000 GG No L JACINTO CREEK PARK PH 2 $1,138,925 $126, /2008 GG No L MARTIN LUTHER KING JR. $50,000 $25,200 GG No C MEADOWVIEW CCTR TOXIC $1,133,000 $65,584 DD No C MEADOWVIEW CCTR TOXIC $582,590 -$155,452 DD No C MEADOWVIEW CCTR TOXIC $2,300,000 $537,944 DD No Y MEADOWVIEW CTY SVC $21,985,142 $43, /2001 JJ No Detail Sheet Available Projects by Council District by Project Name O - 25
370 Projects Budget Est Est Project through Balance FY Complete Number Project Name 6/2009 6/ / / / / /14 Initiated Date Section S MEADOWVIEW PHASE 2 (D8) $68,600 $36, /2009 II No T MEADOWVIEW ROAD $130,000 $38, /2007 II No L MLK JR. PARK SAFETY IMP $30,300 $6,491 GG No L MLK PHASE I IMPROVEMENTS $150,000 $150,000 GG No L NO LAGUNA CREEK PARK $580,000 $554,678 GG No K NO LAGUNA CREEK WILDLIFE $509,194 $77, /2007 GG No K NO LAGUNA WILDLIFE BIKE TRL $451,283 $144,817 GG No L PANNELL MEADOWVIEW $50,000 $25, /2007 GG No Z RWM RETRO 8METER6 NORTH $0 $0 $2,600,000 $0 $0 $0 $ /2010 JJ Yes L SHASTA COMM PARK - APP $120,000 $27,165 GG No L SHASTA COMMUNITY PARK $2,940,000 $2,645,548 GG No L SHASTA PARK DEVELOPMENT $4,080,000 $898, /2009 GG No L SHASTA PARK PLANNING AND $4,980,600 $19,683 12/2006 GG No L STEVE JONES PARK $616,836 $67, /2008 GG No L STEVE JONES PARK IMP $117,000 $117,000 GG No W SUMP 115 ELECTRICAL REHAB $0 $0 $10,000 $0 $0 $0 $ /2011 JJ Yes W SUMP 128 ELECTRICAL REHAB $430,000 $22, /2007 JJ No W SUMP 33 DETENTION BASIN $443,000 $83, /2004 JJ No B VALLEY HI-N. LAGUNA LIB-APP $179,552 $91,144 DD No B VALLEY HI-NORTH LAGUNA $18,063,872 $5,788, /2009 DD No T WYNDHAM PEDESTRIAN $40,000 $4,016 II No Council District(s): ALL $2,610,000 $0 $0 $0 $0 C ADA COMPLIANCE $100,000 $8,761 DD No C ADA POOL LOAN $634,184 $634,184 DD No T ADA PROGRAM MONITOR 3431 $90,000 $10, /2007 II No F ADVANCE LIFE SUPPORT ALS $1,080,000 $1,080,000 $1,080,000 $1,080,000 $1,080,000 $1,080,000 $1,080,000 EE Yes T ADVANCED TRANSPORTATION $2,107,299 $233, /2009 II No T ADVANCED TRANSPORTATION $0 $0 $400,000 $400,000 $400,000 $400,000 $400, /2014 II Yes Detail Sheet Available Projects by Council District by Project Name O - 26
371 Projects Budget Est Est Project through Balance FY Complete Number Project Name 6/2009 6/ / / / / /14 Initiated Date Section T ALLEY ABATEMENT PROGRAM $60,000 $45,000 $60,000 $60,000 $60,000 $60,000 $60, /2014 II Yes Z AMER RVR - KEEP OUR $135,000 $28,932 $25,000 $26,000 $26,000 $26,000 $ JJ Yes Z AMR RIVER SOURCE WATER $687,598 $32,507 $15,000 $24,000 $27,000 $27,000 $ JJ Yes M APP-MAINTENANCE $671,592 $126,963 FF No W ASSET MANAGEMENT $100,000 $92, /2010 JJ No Z ASSET MANAGEMENT - WTR $170,000 $91,148 $0 $50,000 $50,000 $50,000 $ /2012 JJ Yes A ATTORNEY RELOCATION $116,000 $53,647 DD No Z BACKFLOW PREVENTION $2,831,913 $593,150 $50,000 $205,000 $205,000 $205,000 $200, JJ Yes X BASE CIP RESERVE - SEWER $261,424 $261,424 $200,000 $200,000 $200,000 $200,000 $200, JJ Yes W BASE CIP RESERVE-DRAINAGE $274,022 $273, JJ No Z BASE CIP RESERVE-WATER $548,038 $548,038 $400,000 $400,000 $400,000 $400,000 $400, JJ Yes K BIKE TRAIL MAINTENANCE $741,700 $50,401 $25,000 $25,000 $25,000 $25,000 $25,000 GG Yes K BIKE TRAIL PLANNING $72,962 $5,282 $2,000 $2,000 $2,000 $2,000 $2,000 GG Yes K BIKE TRAIL/PED BRIDGE $816,715 $347,445 $103,000 $103,000 $103,000 $103,000 $103,000 GG Yes T BIKEWAY PROGRAM $721,797 $202, /2009 II No T BIKEWAY PROGRAM $0 $0 $150,000 $150,000 $150,000 $150,000 $150, /2014 II Yes R BRIDGE CONSTRUCTION AND $0 $0 $50,000 $50,000 $50,000 $50,000 $50, /2014 II Yes T BRIDGE MAINTENANCE DESIGN $315,543 $313, /2009 II No R BRIDGE MAINTENANCE $436,962 $2, /2009 II No R BRIDGE MAINTENANCE $0 $0 $25,000 $25,000 $25,000 $25,000 $25, /2014 II Yes T BRIDGE $920,000 $445, /2009 II No L CAMP SACRAMENTO REHAB $280,000 $136,075 GG No S CAPTAIN JERRY S SAFETY $65,000 $45, /2009 II No S CAPTAIN JERRY S SAFETY $0 $0 $15,000 $15,000 $15,000 $15,000 $15, /2014 II Yes X CHEMICAL ROOT CONTROL $192,000 $3, /2008 JJ No A CITY ATTORNEY AUTOMATION $1,851,283 $1,107,273 DD No A CITYWIDE FIBER EXPANSION $498,351 $182,057 $20,000 $20,000 $20,000 $20,000 $20,000 DD Yes L CITYWIDE L&L PARK REPAIR $0 $0 $201,761 $156,761 $156,761 $156,761 $156, /2014 GG Yes T CITYWIDE NEW STREET $462,265 $107, /2009 II No B CIVIC CENTER ADMN 3282 $59,869,014 $139, /2005 DD No Detail Sheet Available Projects by Council District by Project Name O - 27
372 Projects Budget Est Est Project through Balance FY Complete Number Project Name 6/2009 6/ / / / / /14 Initiated Date Section D CNF - MAYOR $466,667 $466, /2009 DD No D COMM GARDENS PKS $40,000 $40,000 DD No D COMM. NEIGHBORHOOD $3,000,000 $3,000, /2009 DD No L COMM SCHOOLS-JNT SEED $1,774,770 $578 GG No D COMM/NEIGH UNDESIGNATED $20,000 $20,000 DD No Z COMMERCIAL WATER METER $5,822,351 $352,843 $350,000 $350,000 $350,000 $350,000 $350, JJ Yes M COURSE/FACILITY $357,732 $75,602 $60,000 $60,000 $60,000 $60,000 $60,000 FF Yes D CTY TREASURER IVST MGT $1,620,000 $730,085 -$500,000 $0 $0 $0 $0 DD Yes W DELTA SHORES/SOI MSTR $124,309 $117, /2006 JJ No Z DISTRIBUTION FLUSHING $100,000 $99,351 $50,000 $0 $0 $0 $ /2010 JJ Yes Z DISTRIBUTION SYSTEM $250,000 $250,000 JJ No Z DOU FIBER OPTICS $504,832 $203, /2012 JJ No X DRAIN INLET REPLACEMENTS - $388,650 $388, /2009 JJ No W DRAINAGE SYSTEM MASTER $3,194,362 $29, /2010 JJ No Z DRINKING WATER QUALITY $1,335,996 $41,322 $85,000 $233,000 $341,000 $310,000 $ JJ Yes D E BANKING 1320 $350,000 $254,975 DD No W ECONOMIC DEVELOP PRGM $400,000 $400, /2006 JJ No X ECONOMIC DEVELOP PRGM $540,000 $540, /2007 JJ No Z ECONOMIC DEVELOPMENT $296,956 $296,956 JJ No X ECONOMIC DEVELOPMENT $600,000 $600, /2009 JJ No A ELECTRONIC CONTENT $2,525,039 $316,389 DD No C ENERGY CONSERVATION $236,324 $40, /2006 DD No A ERP SYSTEM STAFFING $3,000,000 $578,916 DD No A ERP SYSTEMS REPLACEMENT $13,343,190 $1,000 DD No C FACILITY ADA COMPLIANCE $5,017,980 $3,808,030 $188,000 $688,000 $688,000 $688,000 $688, /2013 DD Yes Z FIELD SERVICES CMMS $1,092,000 $18, /2009 JJ No F FIRE APPARATUS EQUIPMENT $7,240,417 $814,850 $218,423 $468,423 $718,423 $968,423 $968,423 EE Yes A FIRE DEPT TECHNOLOGY IMP $250,000 $1,440 DD No C FIRE STATION 56 ADA RESTRO $266,000 $265,800 DD No F FIRE STATION IMPROVEMENTS $1,320,853 $66, /2003 EE No Detail Sheet Available Projects by Council District by Project Name O - 28
373 Projects Budget Est Est Project through Balance FY Complete Number Project Name 6/2009 6/ / / / / /14 Initiated Date Section B FLEET FACILITIES PROGRAM $1,029,966 $173,165 $175,000 $0 $30,000 $30,000 $30, /2014 DD Yes A FLEET MGMT TECHNOLOGY $1,764,000 $494,115 -$175,000 $100,000 $70,000 $70,000 $70, /2014 DD Yes W FLOOD CONTROL PLANNING $2,318,933 $0 $220,000 $0 $0 $0 $ JJ Yes W FLOODPLAIN MANAGEMENT $3,045,480 $148,658 $175,000 $0 $0 $0 $ JJ Yes X FLOW MONITORING 2007 $192,142 $19, /2007 JJ No X FLOW $100,000 $81,250 $50,000 $0 $0 $0 $ /2009 JJ Yes C FUEL MANAGEMENT & $3,028,000 $396,801 $175,000 $75,000 $75,000 $75,000 $75, /2014 DD Yes C FULLERTOWN IMPROVEMENTS $42,705 $712 DD No T FY 07/08 PUBLIC $1,463,500 $1,364, /2008 II No T FY 08 CITIZEN REQEST RAMP $687,500 $572, /2008 II No T FY 08 DEVELOPER $50,000 $8, /2008 II No T FY 08 GEN'L ACCESS $75,000 $53, /2008 II No T FY 08 PROJECT FOR THIRD $50,000 $49, /2008 II No T FY 08 PUBLIC RIGHTS-OF-WAY $2,430,650 $53, /2008 II No T FY 08 SIDEWALK REPAIR $987,500 $7, /2008 II No T FY 08 TRAFFIC ENGINEER - $385,000 $249, /2008 II No W FY04-FY08 NPDES PROGRAM $9,632,944 $1,259, /2009 JJ No T FY05/06 ECONOMIC $204,177 $149, /2010 II No R FY06/07 CONTROLLER & $336,752 $139, /2009 II No T FY06/07 ECONOMIC $668,307 $668, /2010 II No R FY06/07 LED REPLACEMENT $104,600 $31, /2009 II No R FY06/07 VEHICLE LOOP $100,000 $27, /2009 II No R FY07/08 - CONTROLLER & $263,451 $166, /2009 II No T FY07/08 ECONOMIC $800,000 $800, /2010 II No R FY07/08 - LED REPLACEMENT $100,000 $28, /2009 II No S FY07/08 - NTMP $270,000 $269, /2012 II No R FY07/08 STREET SEALS $5,396,782 $418, /2008 II No R FY07/08 - VEHICLE LOOP $132,096 $131, /2009 II No T FY08 DI UPGRADE RAMPS $387,500 $74, /2008 II No T FY08 ITS EXPANSION SU26 $212,358 $159, /2009 II No Detail Sheet Available Projects by Council District by Project Name O - 29
374 Projects Budget Est Est Project through Balance FY Complete Number Project Name 6/2009 6/ / / / / /14 Initiated Date Section R FY08 OVERLAYS AND SEALS $1,191,250 $162, /2010 II No S FY08 TRAFFIC SIGNAL SAFETY $200,000 $200, /2009 II No T FY08/09 ECONOMIC $525,000 $525, /2010 II No T FY09 CITIZEN REQUESTED $712,500 $443, /2009 II No R FY09 CITY OVERLAY RM91 $100,000 $69,295 II No R FY09 CONTR & CABINET REPL $205,000 $205, /2010 II No T FY09 DEVELOPER $50,000 $44, /2009 II No T FY09 DI UPGRADE CURB $570,000 $391, /2009 II No R FY09 LED REPLACEMENT SS92 $188,800 $188, /2010 II No T FY09 OTHER CITIZEN ADA $75,000 $23, /2009 II No T FY09 PROGRAM $1,593,500 $1,530, /2009 II No T FY09 RAMPS SUPPORTING $1,852,500 $1,236, /2009 II No T FY09 RAMPS SUPPORTING THE $855,500 $287, /2009 II No R FY09 ST OVERLAY & SEALS $1,726,691 $1,724,402 II No R FY09 STREET SEALS RM92 $100,000 $100,000 II No T FY09 THIRD PARTY PROJECT $50,000 $49, /2009 II No T FY09 TRAFFIC PROGRAM $241,000 $183, /2009 II No R FY09 VEHICLE LOOP REPLACE $100,000 $100, /2010 II No T FY09/10 ECONOMIC $0 $0 $525,000 $525,000 $525,000 $525,000 $525, /2014 II Yes Z FY10 ECONOMIC DEVELOP $0 $0 $600,000 $600,000 $600,000 $600,000 $600, /2010 JJ Yes W FY10-FY14 NPDES $0 $0 $1,000,000 $1,000,000 $1,000,000 $1,000,000 $1,000, /2014 JJ Yes C GREEN ENERGY PROJECTS $300,000 $15,000 DD No Z GROUNDWATER PROTECTION $205,877 $198,719 $62,000 $0 $0 $0 $ /2012 JJ Yes R GUARDRAIL REPLACEMENT $275,000 $55, /2009 II No R GUARDRAIL REPLACEMENT $0 $0 $50,000 $50,000 $50,000 $50,000 $50, /2014 II Yes R HIGHWAY BRIDGE PROGRAM- $102,635 $89, /2009 II No R HOLLOW SIDEWALK $0 $0 $65,000 $65,000 $65,000 $65,000 $65, /2014 II Yes C HVAC-ENERGY $100,163 $85, /2006 DD No X IN-HOUSE FLOW MONITORING $30,000 $30, /2009 JJ No A INTERACTIVE VOICE $51,300 $4,026 DD No Detail Sheet Available Projects by Council District by Project Name O - 30
375 Projects Budget Est Est Project through Balance FY Complete Number Project Name 6/2009 6/ / / / / /14 Initiated Date Section W INVENTORY & O&M MGMNT $780,000 $744,515 JJ No L IRRIGATION SYSTEM $400,000 $390,642 GG No A IT EQUIPMENT REPLACEMENT $1,811,499 $690,188 $437,860 $437,860 $437,860 $437,860 $437,860 DD Yes Z IT PROJECTS $425,000 $393,122 $25,000 $200,000 $200,000 $200,000 $ /2010 JJ Yes R LANDSCAPE FRONTAGE $24,000 $22, /2014 II No X LIFT STATION FLOW METERS $100,000 $72, /2008 JJ No Z LOCAL AREA NETWORK $1,135,000 $167, /2012 JJ No T MAJOR STREET $2,000,000 $2,000, /2009 II No T MAJOR STREET $0 $0 $1,864,000 $1,864,000 $1,864,000 $1,864,000 $1,864, /2014 II Yes T MAJOR STREET LIGHTING $1,303,093 $1,146, /2009 II No T MAJOR STREET LIGHTING $0 $0 $100,000 $100,000 $100,000 $100,000 $100, /2014 II Yes S MEDIAN TURN LANE PROGRAM $345,013 $260, /2009 II No S MEDIAN TURN LANE PROGRAM $0 $0 $50,000 $50,000 $50,000 $50,000 $50, /2014 II Yes T NEIGHBORHOOD STREET $2,734,591 $2,504, /2009 II No T NEIGHBORHOOD STREET $0 $0 $400,000 $400,000 $400,000 $400,000 $400, /2014 II Yes S NEIGHBORHOOD TRAFFIC $1,268,076 $591, /2009 II No S NEIGHBORHOOD TRAFFIC $0 $0 $400,000 $400,000 $400,000 $400,000 $400, /2014 II Yes S NEW TRAFFIC SIGNALS $229,290 $110,588 $0 $300,000 $300,000 $300,000 $300, /2014 II Yes T NSD PUBLIC SAFETY PROJECT $50,000 $48, /2010 II No S NTMP CONSULTANT SERVICES $430,000 $24, /2014 II No S NTMP DATA COLLECTION $461,317 $8, /2014 II No C OCCUPANCY $22,000 $ /2006 DD No S ON STREET ANGLED PARKING $310,000 $96, /2009 II No S ON STREET ANGLED PARKING $0 $0 $25,000 $25,000 $25,000 $25,000 $25, /2014 II Yes R OVERLAY VIDEO DETECTION $1,101,000 $400, /2009 II No T OVERWIDTH PAVEMENT $13,303,978 $400, /2009 II No T OVERWIDTH PAVEMENT $0 $0 $100,000 $100,000 $100,000 $100,000 $100, /2014 II Yes L P&R RESERVATION SYSTEM $200,000 $54,208 GG No L PARK MAINTENANCE $1,063,944 $326 GG No L PARK MAINTENANCE $2,430,418 $240, /2005 GG No Detail Sheet Available Projects by Council District by Project Name O - 31
376 Projects Budget Est Est Project through Balance FY Complete Number Project Name 6/2009 6/ / / / / /14 Initiated Date Section L PARK SAFETY ASSESSMENTS $50,000 $11,706 GG No V PARKING METER $3,348,400 $32, /2009 II No R PAVEMENT MANAGEMENT $518,000 $161, /2009 II No R PAVEMENT MANAGEMENT $0 $0 $50,000 $50,000 $50,000 $50,000 $50, /2014 II Yes T PEDESTRIAN IMPROVEMENT $850,000 $791, /2009 II No T PEDESTRIAN IMPROVEMENT $0 $0 $50,000 $50,000 $50,000 $50,000 $50, /2014 II Yes T PEDESTRIAN SAFETY $628,313 $211, /2009 II No T PEDESTRIAN SAFETY $0 $0 $75,000 $75,000 $75,000 $75,000 $75, /2014 II Yes Z PIPE COND ASSESSMT $500,000 $500, /2009 JJ No X PIPE REHABILITATION $251,000 $19, /2006 JJ No X PIPE REHABS 2007 $670,000 $92, JJ No A PLAN/PERMIT NETWORK $6,049,955 $993,082 $440,000 $440,000 $440,000 $440,000 $440, DD Yes A PLANNING TECHNOLOGY $1,092,747 $230,178 $56,600 $56,600 $56,600 $56,600 $56,600 DD Yes Z PLANT SERVICES CMMS $635,000 $141, /2007 JJ No L PLAYGROUND REPAIRS $450,000 $133,937 $75,000 $75,000 $75,000 $75,000 $75,000 GG Yes L PROP 12 ADMINISTRATION $200,000 $69,670 GG No F PSAF GENERATOR UPGRADES $1,673,382 $670,181 $150,000 $150,000 $150,000 $150,000 $150,000 EE Yes T PUBLIC RIGHTS-OF-WAY $8,668,951 $3,277, /2009 II No T PUBLIC RIGHTS-OF-WAY $0 $0 $2,780,000 $2,780,000 $2,780,000 $2,780,000 $2,780, /2014 II Yes X PUMP STATIONS RADIO $5,543,000 $188,760 $25,000 $0 $0 $0 $ /2012 JJ Yes W PUMP STN OUTFALL REPR PH3 $532,500 $102, /2003 JJ No A RADIO REBAND FIRE $167,708 $167,708 DD No A RADIO REBAND PD $367,623 $359,932 DD No A RADIO REBANDING IT $132,000 $20,821 DD No L REGIONAL PARK/PKWAY $595,013 $371,586 GG No X REHAB PROJECT 2008 $200,000 $181, JJ No Z RESID WTR MTR PRGM $799,809 $232,007 $0 $9,896,000 $11,096,000 $12,296,000 $13,496, /2010 JJ Yes X ROOT CONTROL 2008 $230,000 $18, /2012 JJ No X ROOT CONTROL PROGRAM $0 $0 $100,000 $0 $0 $0 $ /2011 JJ Yes Z RWM-METER RETROFITS FY07 $2,172,000 $6, JJ No Detail Sheet Available Projects by Council District by Project Name O - 32
377 Projects Budget Est Est Project through Balance FY Complete Number Project Name 6/2009 6/ / / / / /14 Initiated Date Section Z RWM-PROJECT MGMNT FY07 $182,627 $24,027 $100,000 $0 $0 $0 $ /2010 JJ Yes Z RWM-PUBLIC OUTREACH $108,000 $68,558 $36,000 $0 $0 $0 $ /2010 JJ Yes Z RWM-SERVICE RETROFIT $735,725 $383, JJ No Z RWM-SETTING MTRS ONLY $431,006 $149, JJ No Z SAC RIVER - KEEP OUR $145,000 $25,196 $30,000 $31,000 $31,000 $31,000 $ JJ Yes Z SAC RIVER SOURCE WATER $1,238,936 $84,523 $70,000 $102,000 $60,000 $60,000 $ JJ Yes Z SAC RVR WTR RELIAB STUDY $3,320,000 $545,428 $210,000 $500,000 $500,000 $500,000 $ /2007 JJ Yes X SANITARY SEWER $75,000 $5,000 $75,000 $0 $0 $0 $ /2010 JJ Yes Z SCADA DOWNTOWN IT $20,000 $6,429 JJ No Z SCADA SYSTEM UPGRADE $2,726,000 $245,043 $100,000 $100,000 $100,000 $100,000 $100,000 JJ Yes A SCAN BUILDING PERMITS $49,500 $65 DD No X SEWER ASSET MGMNT $100,000 $55,747 $25,000 $0 $0 $0 $ /2012 JJ Yes X SEWER MANHOLES CONST $112,500 $1, JJ No X SEWER PUMP STATION REHAB $2,019,126 $130,209 $25,000 $500,000 $500,000 $500,000 $500, JJ Yes X SEWER REHAB PROJECT $486,000 $486, /2009 JJ No X SEWER SERVICE LINING $100,000 $60, /2008 JJ No X SEWER SERVICE LINING $50,000 $49, /2009 JJ No X SEWER SERVICE LINING 2010 $0 $0 $100,000 $0 $0 $0 $ /2011 JJ Yes X SEWER SYS REHABILITATION $1,352,052 $155,980 $75,000 $789,725 $900,000 $1,000,000 $1,100, JJ Yes X SEWER SYSTEM MASTER PLNG $1,802,564 $2, JJ No T SIDEWALK GAP CLOSURE $525,000 $271, /2009 II No S SIGNAL INTEGRATION $69,270 $50, /2008 II No S SIGNAL INTEGRATION, TIMING, $100,000 $25, /2009 II No S SIGNAL PRE-EMPTION $475,000 $87, /2009 II No S SIGNAL PRE-EMPTION $0 $0 $75,000 $75,000 $75,000 $75,000 $75, /2014 II Yes C SMUD INCENTIVE-ENERGY $123,737 $122, /2004 DD No S SPEED HUMP PROGRAM $2,344,985 $124, /2009 II No S SPEED HUMPS PROGRAM $0 $0 $300,000 $300,000 $300,000 $300,000 $300, /2014 II Yes L SPORTS COURT $356,400 $82,559 $75,000 $120,000 $120,000 $120,000 $120,000 GG Yes T STATE AND FEDERAL GRANT $3,229,648 $3,229, /2014 II No Detail Sheet Available Projects by Council District by Project Name O - 33
378 Projects Budget Est Est Project through Balance FY Complete Number Project Name 6/2009 6/ / / / / /14 Initiated Date Section W STORM DRAIN SYSTEM $450,000 $384, /2008 JJ No T STREET LIGHT RELAMP $369,381 $264, /2009 II No R STREET LIGHT RELAMP $0 $0 $125,000 $125,000 $125,000 $125,000 $125, /2014 II Yes R STREET OVERLAY AND SEAL $0 $0 $50,000 $50,000 $50,000 $50,000 $50, /2014 II Yes R STREET OVERLAY AND SEALS $15,299,469 $15,264, /2009 II No R STREET REPAIR PARTNERING $735,471 $363, /2009 II No R STREET REPAIR PARTNERING $0 $0 $100,000 $100,000 $100,000 $100,000 $100, /2014 II Yes R STREET UTILITY SIDEWALK $40,000 $40,000 II No T STREETLIGHT INVESTMENT $364,319 $361, /2009 II No W SUMP ELECTRICAL REHAB $581,500 $17, /2009 JJ No L SWIMMING POOL $639,287 $92,101 $100,000 $100,000 $100,000 $100,000 $100,000 GG Yes K TDA FEDERAL AND STATE $659,892 $659,690 $162,172 $162,172 $162,172 $162,172 $162,172 GG Yes S TOC FIBER CONNECTIONS $50,000 $44, /2009 II No S TOC $104,515 $28, /2009 II No K TOWER BRIDGE $12,185,648 $430, /2008 GG No S TRAFFIC OPERATIONS CENTER $995,884 $472, /2009 II No S TRAFFIC OPERATIONS CENTER $0 $0 $375,000 $375,000 $375,000 $375,000 $375, /2014 II Yes R TRAFFIC SIGNAL EQUIPMENT $19,433 $16, /2009 II No R TRAFFIC SIGNAL EQUIPMENT $0 $0 $205,000 $205,000 $205,000 $205,000 $205, /2014 II Yes S TRAFFIC SIGNAL MODELING $50,000 $50,000 II No S TRAFFIC SIGNAL POLES $50,000 $49, /2014 II No S TRAFFIC SIGNAL REBATE $98,102 $98, /2009 II No S TRAFFIC SIGNAL SAFETY $1,341,841 $1,117, /2009 II No S TRAFFIC SIGNAL SAFETY $0 $0 $125,000 $125,000 $125,000 $125,000 $125, /2014 II Yes S TRAFFIC SIGNS AND $0 $0 $140,000 $140,000 $140,000 $140,000 $140, /2014 II Yes T TRAIN HORN QUIET ZONE $620,000 $475, /2009 II No T TRANSP CORRIDOR PLANNING $113,421 $57, /2007 II No Z TREATMENT PLANTS $515,379 -$ JJ No R TRENCH CUT FEE PROGRAM $576,972 $432, /2014 II No R TRENCH CUT FEE PROGRAM $0 $0 $150,000 $150,000 $150,000 $150,000 $150, /2014 II Yes Detail Sheet Available Projects by Council District by Project Name O - 34
379 Projects Budget Est Est Project through Balance FY Complete Number Project Name 6/2009 6/ / / / / /14 Initiated Date Section A UNINTERRUPTABLE POWER $1,473,285 $36,007 DD No Z UNPLANNED CORRECTIVE $480,000 $480,000 -$230,000 $500,000 $500,000 $500,000 $0 JJ Yes T URBAN FOREST $1,150,000 $579,580 II No Z UTILITIES ADA IMPROVEMENT $146,000 $94,621 $5,000 $5,000 $5,000 $0 $ /2012 JJ Yes Z UTILITY ENERGY EFFICIENCY $401,840 $278, /2009 JJ No Y VEHICLES/ADDITIONAL $1,586,000 $147,554 $0 $200,000 $200,000 $200,000 $200,000 JJ Yes W VFD REPLACEMENTS $100,000 $97, JJ No A VOIC REPLACEMENT $1,464,643 $145,092 -$145,092 $0 $0 $0 $0 DD Yes Z WATER FACILITIES SECURITY $60,000 $17, /2009 JJ No Z WATER METER READING $0 $0 $775,000 $661,000 $612,000 $563,000 $513, /2014 JJ Yes Z WATER PROD MISC IMP $3,321,991 $483, JJ No Z WATER SUPPLY MASTER PLAN $2,839,587 $72,332 $250,000 $100,000 $100,000 $100,000 $100, JJ Yes Z WATER SYSTEM MISC $2,065,800 $699,175 $0 $845,001 $825,002 $915,003 $2,764, JJ Yes L WATER USE EFFICIENCY $611,000 $37,439 GG No Z WELL SYSTEM MISC IMPROV $1,361,000 $227,337 $0 $90,000 $90,000 $90,000 $ JJ Yes Z WHOLESALE CONNECTION FEE $9,494,000 $9,494,000 JJ No R WORK MANAGEMENT SYSTEM $492,500 $10, /2009 II No R WORK MANAGEMENT SYSTEM- $0 $0 $60,000 $60,000 $60,000 $60,000 $60, /2014 II Yes L YOUTH RECREATION $204,226 $130,849 GG No $16,941,724 $31,166,542 $32,726,818 $34,281,819 $35,581,820 Detail Sheet Available Projects by Council District by Project Name O - 35
380
381 CITY OF SACRAMENTO CIP INDEX BY PROGRAM AREA Projects: By Project Number CAPITAL IMPROVEMENT PROGRAM P
382
383 Budget Est Est Project through Balance FY Complete Number Project Name 6/2009 6/ / / / / /14 Initiated Date Section DEL PASO HEIGHTS RDA $0 $0 $1,228,397 $0 $0 $0 $ /2009 KK Yes ALIKALI FLAT RDA $0 $0 $361,553 $0 $0 $0 $ /2009 KK Yes OAK PARK RDA DEVELOPMENT $0 $0 $921,307 $0 $0 $0 $ /2009 KK Yes NORTH SACRAMENTO RDA $0 $0 $1,785,807 $0 $0 $0 $ /2009 KK Yes FRANKLIN BLVD RDA $0 $0 $1,642,839 $0 $0 $0 $ /2009 KK Yes STOCKTON BLVD RDA $0 $0 $832,048 $0 $0 $0 $ /2009 KK Yes AUBURN BLVD RDA $0 $0 $342,854 $0 $0 $0 $ /2009 KK Yes ARMY DEPOT RDA $0 $0 $2,828,036 $0 $0 $0 $ /2009 KK Yes TH STREET RDA $0 $0 $215,754 $0 $0 $0 $ /2009 KK Yes RIVER GARDENS/GARDENLAND $0 $0 $114,000 $0 $0 $0 $ /2009 KK Yes ADA SIDEWALKS $0 $0 $348,000 $0 $0 $0 $ /2009 KK Yes BEN ALI/ HAGGINWOOD $0 $0 $100,000 $0 $0 $0 $ /2009 KK Yes A CITY ATTORNEY AUTOMATION $1,851,283 $1,107,273 DD No A ATTORNEY RELOCATION $116,000 $53,647 DD No A CITY CLERK AUTOMATION $301,634 $182,501 DD No A RADIO REBANDING IT $132,000 $20,821 DD No A RADIO REBAND PD $367,623 $359,932 DD No A RADIO REBAND FIRE $167,708 $167,708 DD No A ELECTRONIC CONTENT $2,525,039 $316,389 DD No A IT EQUIPMENT REPLACEMENT $1,811,499 $690,188 $437,860 $437,860 $437,860 $437,860 $437,860 DD Yes A CITYWIDE FIBER EXPANSION $498,351 $182,057 $20,000 $20,000 $20,000 $20,000 $20,000 DD Yes A VOIC REPLACEMENT $1,464,643 $145,092 -$145,092 $0 $0 $0 $0 DD Yes A ERP SYSTEMS REPLACEMENT $13,343,190 $1,000 DD No A ERP SYSTEM STAFFING $3,000,000 $578,916 DD No A FIRE DEPT TECHNOLOGY IMP $250,000 $1,440 DD No A SCAN BUILDING PERMITS $49,500 $65 DD No A INTERACTIVE VOICE $51,300 $4,026 DD No A UNINTERRUPTABLE POWER $1,473,285 $36,007 DD No A FLEET MGMT TECHNOLOGY $1,764,000 $494,115 -$175,000 $100,000 $70,000 $70,000 $70, /2014 DD Yes A CALL CENTER 3114 $630,500 $62,967 DD No Detail Sheet Available Projects by Project Number P - 1
384 Budget Est Est Project through Balance FY Complete Number Project Name 6/2009 6/ / / / / /14 Initiated Date Section A PLANNING TECHNOLOGY $1,092,747 $230,178 $56,600 $56,600 $56,600 $56,600 $56,600 DD Yes A PLAN/PERMIT NETWORK $6,049,955 $993,082 $440,000 $440,000 $440,000 $440,000 $440, DD Yes B FLEET FACILITIES PROGRAM $1,029,966 $173,165 $175,000 $0 $30,000 $30,000 $30, /2014 DD Yes B CIVIC CENTER ADMN 3282 $59,869,014 $139, /2005 DD No B RICHARDS $35,153,861 $3,492,225 DD No B RICHARDS IT 4811 $891,372 $46,324 DD No B STUDIO FOR THE PERFORMING $14,055,039 $9,841, /2010 DD No B STUDIOS PERFORMING $180,000 $167,922 DD No B POCKET LIBRARY $14,821,678 $4,762, /2010 DD No B D7 POCKET LIBRARY APP $171,309 $162,139 DD No B BING MALONEY CART $853,433 $16, DD No B NORTH NATOMAS LIBRARY $15,813,485 $6,183, /2009 DD No B VALLEY HI-NORTH LAGUNA $18,063,872 $5,788, /2009 DD No B VALLEY HI-N. LAGUNA LIB-APP $179,552 $91,144 DD No B NORTH NATOMAS CC $600,000 $600, /2012 DD No B JOES CRABSHACK REPAIRS $59,380 $59,380 DD No B SPORTS & ENT DISTRICT DEV $253,000 $6,500 DD No B CAPITOL MALL $185,000 $85,568 DD No B TH AND K PROJECT $249,000 $7,478 DD No B PIONEER BRIDGE PROJECT $2,079,129 $261, /2010 DD No B DOCKS PROMENADE COMM $229,505 $183,600 DD No B SCHOOL HOUSE LANDING DEV $150,000 $17,347 DD No B SO SIDE BOARDWALK EXT $100,000 $34,109 DD No B /800 K STREET DEVELOP $298,500 $127,411 DD No B CALIFORNIA INDIAN HERITAGE $300,000 $67, /2009 GG No B PRE-DEVELOPMENT SERVICES $381,336 $29, /2025 DD No B PRE-DEV SVCS - DOWNTOWN $2,677,705 $782, /2020 DD No B K STREET STREETSCAPE $4,730,000 $3,817,522 DD No B CAPITOL MALL/TOWER BRIDGE $600,000 $600, /2006 DD No B CENTRAL CITY WAYFINDING $725,000 $122, /2002 DD No Detail Sheet Available Projects by Project Number P - 2
385 Budget Est Est Project through Balance FY Complete Number Project Name 6/2009 6/ / / / / /14 Initiated Date Section B TRAP SHOOT CLEAN UP $39,604 $ /2008 DD No B DEL PASO ENTITLEMENTS $1,178,490 $87, /2008 DD No B DEL PASO INFRASTRUCTURE $4,631,242 $ /2008 DD No B DEL PASO REMEDIATION $543,174 $ /2008 DD No B FULTON AVENUE $3,000,364 $22, /2008 DD No B GREYHOUND - $200,000 $199,917 DD No B GREYHOUND - SITE $1,000,000 $1,000,000 DD No B GREYHOUND - SEQOUIA $800,000 $755,867 DD No B DOCKS PROMENADE $5,159,981 $5,025,719 DD No C FUEL MANAGEMENT & $3,028,000 $396,801 $175,000 $75,000 $75,000 $75,000 $75, /2014 DD Yes C MEADOWVIEW CCTR TOXIC $1,133,000 $65,584 DD No C MEADOWVIEW CCTR TOXIC $2,300,000 $537,944 DD No C MEADOWVIEW CCTR TOXIC $582,590 -$155,452 DD No C CORP YARD MAINTENANCE $2,807,009 $30,969 $20,000 $20,000 $20,000 $20,000 $20, /2013 DD Yes C FULLERTOWN IMPROVEMENTS $42,705 $712 DD No C NACY IMPROVEMENTS $40,000 $20,123 DD No C FACILITY ADA COMPLIANCE $5,017,980 $3,808,030 $188,000 $688,000 $688,000 $688,000 $688, /2013 DD Yes C ADA COMPLIANCE $100,000 $8,761 DD No C ADA DM HISTORY CENTER $585,000 $71, /2007 DD No C ADA DM SCIENCE CENTER $299,750 $181, /2004 DD No C ADA ROBERTSON COMMUNITY $86,000 $19,287 DD No C SIERRA 2 COMMUNITY CENTER $1,526,138 $428, DD No C ADA ROBERTSON CC - PHASE II $244,287 $12,055 DD No C ADA PARKING FACILITIES $151,500 $21, /2004 DD No C BING MLY GOLF CRS ADA $40,073 $1, /2007 DD No C ADA POOL LOAN $634,184 $634,184 DD No C CONV CNTR ADA AUTOMATIC $23,000 $23,000 DD No C FIRE STATION 56 ADA RESTRO $266,000 $265,800 DD No C CITY FACILITY DEFERRED $12,200,135 $274,308 $1,000,000 $1,000,000 $1,000,000 $1,000,000 $1,000, /2010 DD Yes C ROOF REPLACEM- ZOO $5,000 $3,221 DD No Detail Sheet Available Projects by Project Number P - 3
386 Budget Est Est Project through Balance FY Complete Number Project Name 6/2009 6/ / / / / /14 Initiated Date Section C ROOF REPLNT SNOW $35,000 $3,629 DD No C ROOF REPLACEMT- APE $70,000 $7,285 DD No C FIRE STN#4 GRANADA WAY $30,000 $29,884 DD No C ROBERTSON C FIRE ALARM $125,000 $125,000 DD No C SAC HISTORY MUSEUM HVAC $450,000 $450,000 DD No C CNTL IT AC-SERVER ROOM AC $40,000 $40,000 DD No C ANIMAL CONTROL IMPS 3131 $1,066,847 $289, /2010 DD No C ANIMAL SHELTER CATTERY $1,500,000 $70, /2008 DD No C VETERINARIAN/VOLUNTEER $50,000 $50,000 DD No C ENERGY CONSERVATION $236,324 $40, /2006 DD No C OCCUPANCY $22,000 $ /2006 DD No C HVAC-ENERGY $100,163 $85, /2006 DD No C SMUD INCENTIVE-ENERGY $123,737 $122, /2004 DD No C GREEN ENERGY PROJECTS $300,000 $15,000 DD No C SO NATOMAS COMM PARK $235,000 $37, /2008 DD No C SIERRA II COMM CENTER $1,341,000 $779, /2007 DD No C NACY REMEDIATION $2,604,658 $1,115, /2010 DD No C RELOCATION OF CITY OFFICES $94,960 $8,127 DD No C LABOR RELATIONS REMODEL $48,625 $44,664 DD No C EVELYN MOORE CENTER $15,236 $5, /2004 DD No D COMM. NEIGHBORHOOD $3,000,000 $3,000, /2009 DD No D CNF - DISTRICT 1 $317,269 $247,269 DD No D NEIGH PRGM FOR GRANTS $25,000 $20,500 DD No D DOWNTOWN PRTNSHP INF $10,000 $10,000 DD No D COMM. IMPROVEMENTS - CD2 $1,813,277 $1,698, /2009 DD No D COMM. IMPROVEMENTS - CD 3 $500,000 $500, /2009 DD No D CNF - DISTRICT 4 $362,997 $362,997 DD No D CNF - DISTRICT 5 $470,105 $470,105 DD No D CNF - DISTRICT 6 $125,023 $125,023 DD No D CNF - DISTRICT 7 $27 $27 DD No Detail Sheet Available Projects by Project Number P - 4
387 Budget Est Est Project through Balance FY Complete Number Project Name 6/2009 6/ / / / / /14 Initiated Date Section D FREEPORT RESERVOIR $85,000 $23,790 DD No D CNF - DISTRICT 8 $273 $273 DD No D CNF - MAYOR $466,667 $466, /2009 DD No D DOWNTOWN PRTNSHP ICE $100,000 $95 DD No D COMM GARDENS PKS $40,000 $40,000 DD No D COMM/NEIGH UNDESIGNATED $20,000 $20,000 DD No D DEL PASO BOULEVARD CCTV $25,000 $25,000 DD No D CTY TREASURER IVST MGT $1,620,000 $730,085 -$500,000 $0 $0 $0 $0 DD Yes D E BANKING 1320 $350,000 $254,975 DD No D FLORIN ROAD SHOVEL READY $100,000 $47,500 DD No F ADVANCE LIFE SUPPORT ALS $1,080,000 $1,080,000 $1,080,000 $1,080,000 $1,080,000 $1,080,000 $1,080,000 EE Yes F FIRE APPARATUS EQUIPMENT $7,240,417 $814,850 $218,423 $468,423 $718,423 $968,423 $968,423 EE Yes F DISPATCH & TRNG FAC $22,076,057 $847, /2006 EE No F PUBLIC SAFETY HDQTRS BLDG $5,521,805 $518, /2003 EE No F PSAF GENERATOR UPGRADES $1,673,382 $670,181 $150,000 $150,000 $150,000 $150,000 $150,000 EE Yes F FB34-FIRE STN 56 GENERATOR $200,000 $57,010 EE No F FIRE STN 10 GENERATOR $200,000 $41,603 EE No F FIRE STATION IMPROVEMENTS $1,320,853 $66, /2003 EE No F FIRE STN #5 BROADWAY RPLC $4,995,000 $8, /2003 EE No F FIRE STN #20 ARDEN RPLC $5,591,600 $180, /2004 EE No K FREEPORT SHORES $956,035 $529, /2008 GG No K WEST CANAL BIKE $1,095,500 $107, /2009 GG No K R STREET BIKE/PEDESTRIAN $481,000 $381, /2008 GG No K NINOS PKWY BIKE TRL-PHS I $430,000 $130, /2008 GG No K NINOS PARKWAY PHASE 1B $230,175 $9, /2008 GG No K OFF-STREET BIKE TRAIL AT $268,000 $206, /2006 GG No K ARMY DEPOT BIKE $220,000 $123, /2008 GG No K UEDA PKWY BIKE TRL $4,352,816 $177, /2006 GG No K TOWER BRIDGE $12,185,648 $430, /2008 GG No K BIKE TRAIL MAINTENANCE $741,700 $50,401 $25,000 $25,000 $25,000 $25,000 $25,000 GG Yes Detail Sheet Available Projects by Project Number P - 5
388 Budget Est Est Project through Balance FY Complete Number Project Name 6/2009 6/ / / / / /14 Initiated Date Section K BIKE TRAIL/PED BRIDGE $816,715 $347,445 $103,000 $103,000 $103,000 $103,000 $103,000 GG Yes K BIKE TRAIL PLANNING $72,962 $5,282 $2,000 $2,000 $2,000 $2,000 $2,000 GG Yes K TDA FEDERAL AND STATE $659,892 $659,690 $162,172 $162,172 $162,172 $162,172 $162,172 GG Yes K UEDA PARKWAY HABITAT $250,000 $218,228 11/2006 GG No K TWO RIVERS TRAIL ACQ RSVR $164,070 $67,314 GG No K GARDEN HIGHWAY BIKETRAIL $215,000 $212, /2005 GG No K NO LAGUNA CREEK WILDLIFE $509,194 $77, /2007 GG No K NO LAGUNA WILDLIFE BIKE TRL $451,283 $144,817 GG No K EAST DRAIN CANAL BIKEWAY $259,300 $259, /2009 GG No L OAK PARK COMMUNITY $5,622,125 $1,684, /2009 GG No L OAK PARK CC - APP $77,875 $10,054 GG No L GEORGE SIMS COMM CENTER $10,994,913 $1,207,188 GG No L GEORGE SIMS POOL REHAB $150,000 $148,385 GG No L GEORGE SIM COMMUNITY $7,396,000 $869, /2009 GG No L SOUTHSIDE CLUBHOUSE PHII $95,000 $5, /2003 GG No L COLOMA CC FIRE SAFETY $600,000 $108, /2008 GG No L COUNCIL DISTRICT 1 PARK $147,651 $145,297 GG No L COUNCIL DISTRICT 2 PARK $9,315 $9,315 GG No L COUNCIL DISTRICT 3 PARK $95,699 $35,269 GG No L COUNCIL DISTRICT 4 PARK $42,130 $41,130 GG No L COUNCIL DISTRICT 5 PARK $67,500 $63,500 GG No L COUNCIL DISTRICT 6 PARK $80,905 $58,225 GG No L COUNCIL DISTRICT 7 PARK $158,877 $153,939 GG No L COUNCIL DISTRICT 8 PARK $2,045 $439 GG No L AREA 1 PARK PLANNING $225,006 $25,452 $30,000 $30,000 $30,000 $30,000 $30,000 GG Yes L AREA 2 PARK PLANNING $187,353 $30,115 $30,000 $30,000 $30,000 $30,000 $30,000 GG Yes L AREA 3 PARK PLANNING $180,000 $31,032 $30,000 $30,000 $30,000 $30,000 $30,000 GG Yes L AREA 4 PARK PLANNING $180,882 $27,829 $30,000 $30,000 $30,000 $30,000 $30,000 GG Yes L SPORTS COURT $356,400 $82,559 $75,000 $120,000 $120,000 $120,000 $120,000 GG Yes L REGIONAL PARK/PKWAY $595,013 $371,586 GG No Detail Sheet Available Projects by Project Number P - 6
389 Budget Est Est Project through Balance FY Complete Number Project Name 6/2009 6/ / / / / /14 Initiated Date Section L DELTA SHORES REGNL PARK $400,000 $392,633 GG No L SAND COVE STREAM BANK $507,827 $36,367 GG No L WASHINGTON & MUIR PARKS $220,000 $218,809 GG No L CENTRAL IRRIGATION INFRA $60,988 $60,277 GG No L SYCAMORE PARK $0 $0 $65,000 $0 $0 $0 $ /2010 GG Yes L PA1 PUBLIC PLACES PLANNING $30,000 $15,738 GG No L PA2 PUBLIC PLACES PLANNING $30,000 $24,865 GG No L PA3 PUBLIC PLACES PLANNING $20,000 $17,412 GG No L PA4 PUBLIC PLACES PLANNING $50,000 $42,503 GG No L PA5 PUBLIC PLACES PLANNING $30,000 $23,214 GG No L PA6 PUBLIC PLACES PLANNING $14,000 $3,268 GG No L PA7 PUBLIC PLACES PLANNING $6,000 $596 GG No L PA8 PUBLIC PLACES PLANNING $50,000 $29,600 GG No L PA9 PUBLIC PLACES PLANNING $50,000 $38,708 GG No L PA10 PUBLIC PLACES $50,000 $38,557 GG No L PA 11 PUBLIC PLACES $15,000 $6,539 GG No L R STREET CORRIDOR ACQ $1,497,910 $195,744 GG No L TH AND Q STREET MASTER $0 $0 $50,000 $0 $0 $0 $ /2010 GG Yes L PA1 PARK SIGN REPLACEMENT $0 $0 $24,000 $0 $0 $0 $ /2009 GG Yes L PA8 PARK SIGN REPLACEMENT $0 $0 $49,000 $0 $0 $0 $ /2009 GG Yes L TH ST BYPASS $665,030 $40, /2007 GG No L AIRPORT LITTLE LEAGUE PARK $168,551 $17,279 5/2005 GG No L ARMY DEPOT SPORTS MASTER $25,000 $1, /2006 GG No L BAER PARK (MAX) $889,352 $199, /2009 GG No L BANNON CREEK $5,000 $5,000 GG No L BROOKFIELD/MEADOWVIEW $200,000 $31, /2008 GG No L BURBERRY COMM PARK 9A $139,778 $134, /2008 GG No L BURBERRY PARK $1,275,000 $1,257, /2008 GG No L CHARLIE JENSEN PARK $0 $0 $75,000 $0 $0 $0 $ /2010 GG Yes L DIXIEANNE TOT LOT - APP $35,000 $19,500 GG No Detail Sheet Available Projects by Project Number P - 7
390 Budget Est Est Project through Balance FY Complete Number Project Name 6/2009 6/ / / / / /14 Initiated Date Section L EGRET PARK MASTER PLAN $0 $0 $50,000 $0 $0 $0 $ /2010 GG Yes L FISHERMAN'S LAKE PARKWAY $1,844,998 $1,725, /2007 GG No L FISHERMAN'S LAKE PARK - APP $37,200 $4,390 GG No L FRANKLIN/BOYCE PARK $102,400 $86, /2007 GG No L FREMONT PARK - APP $30,569 $10,479 GG No L RIVER BIRCH (GOLDENLAND) $1,014,489 $897, /2007 GG No L GRANITE DOG PARK $1,221,566 $136, /2009 GG No L GRANITE SKATE PARK DEV $2,781,016 $175, /2007 GG No L GRANITE SOCCER FIELD DEV $1,566,248 $ /2008 GG No L JACINTO CREEK PARK PH 2 $1,138,925 $126, /2008 GG No L JACINTO CREEK PARK - APP $46,075 $20,000 GG No L FORT JEFFERSON $25,000 $8,896 GG No L JEFFERSON PARK MP & DEV $425,000 $402,157 GG No L LAND PARK REC TRAIL $329,015 $2, /2008 GG No L MAGNOLIA PARK $2,172,280 $1,972, /2010 GG No L MAGNOLIA PARK EXPANSION $600,000 $44, /2007 GG No L MAGNOLIA PARK - APP $30,000 $17,000 GG No L GOLDEN POPPY PARK $869,660 $138, /2010 GG No L MCCLATCHY PARK $1,214,700 $1,115, /2009 GG No L MEADOWS PARK $515,368 $490,518 GG No L MUIR CHILDREN'S PARK $704,102 $55, /2007 GG No L N NATOMAS REGIONAL PK DEV $3,565,430 $41, /2009 GG No L N. NATOMAS REG PARK - APP $38,700 $4,340 GG No L NINOS PKWY/RIO TIERRA DVLP $596,784 $62, /2006 GG No L NO LAGUNA CREEK PARK $580,000 $554,678 GG No L NORTHGATE PARK $510,000 $510, GG No L OAKBROOK PARK MASTER $845,703 $824, /2008 GG No L PANNELL MEADOWVIEW $50,000 $25, /2007 GG No L PEREGRINE PARK 3E $1,994,931 $461, /2007 GG No L PHILLIPS PARK MASTER PLAN $25,000 $24, GG No Detail Sheet Available Projects by Project Number P - 8
391 Budget Est Est Project through Balance FY Complete Number Project Name 6/2009 6/ / / / / /14 Initiated Date Section L REDDING AVENUE PARK $50,000 $39, /2009 GG No L REGENCY PARK - APP $53,831 $5,600 GG No L REGENCY PARK $0 $0 $10,000 $0 $0 $0 $ /2009 GG Yes L REICHMUTH PARK $465,500 $413, /2009 GG No L REICHMUTH PARK - APP $38,500 $10, /2009 GG No L ROBLA COMM PARK PHASE 3 $502,666 $181, /2009 GG No L ROBLA PARK WETLAND $112,000 $107, /2009 GG No L S. NATOMAS COMM PK - APP $31,360 $22,858 GG No L FORT S. $1,027,000 $138,798 GG No L SEYMOUR PARK $343,000 $183, /2009 GG No L PLAYGROUND SHADE $244,848 $20, /2008 GG No L SHASTA PARK PLANNING AND $4,980,600 $19,683 12/2006 GG No L SHASTA PARK DEVELOPMENT $4,080,000 $898, /2009 GG No L SHASTA COMM PARK - APP $120,000 $27,165 GG No L SHASTA COMMUNITY PARK $2,940,000 $2,645,548 GG No L SOUTHSIDE PARK LAKE $183,750 $1, /2008 GG No L SOUTHSIDE PARK $373,200 $160, /2009 GG No L SOUTHSIDE PARK LIGHTING $360,000 $168,766 GG No L SOUTHSIDE PARK LAKE IMP $155,523 $151,360 GG No L SOUTHSIDE GARDEN - APP $156,200 $10,000 GG No L STEVE JONES PARK $616,836 $67, /2008 GG No L STEVE JONES PARK IMP $117,000 $117,000 GG No L SUNDANCE PARK 2E $222,000 $26, /2009 GG No L SUTTERS LANDING PARK PH 2 $1,639,057 $388, /2007 GG No L SUTTERS LANDING REGIONAL $1,666,667 $1, /2009 GG No L SWAINSON S HAWK PARK $271,277 $168,098 GG No L SWAINSON HAWK PARK (TK) - $40,500 $5,330 GG No L TANZANITE COMMUNITY PARK $0 $0 $350,000 $0 $0 $0 $ /2011 GG Yes L VALLEY HI PARK $500,000 $380, /2010 GG No L WARREN PARK (EARL) $700,000 $508, /2009 GG No Detail Sheet Available Projects by Project Number P - 9
392 Budget Est Est Project through Balance FY Complete Number Project Name 6/2009 6/ / / / / /14 Initiated Date Section L WEST HAMPTON (TK) $159,885 $30,450 GG No L WESTLAKE PARK $1,068,779 $74, /2007 GG No L SOUTH NATOMAS YTH SPORTS $1,225,260 $1,129, /2008 GG No L LEWIS PARK PICNIC $150,000 $19, /2010 GG No L LEWIS PARK ENHANCEMENT $0 $0 $50,000 $0 $0 $0 $ /2009 GG Yes L SIERRA 2 PARK COURT $0 $0 $75,000 $0 $0 $0 $ /2010 GG Yes L VALLEY OAK PARK $3,002,132 $2,947, /2011 GG No L VALLEY OAK PARK - APP $58,880 $11,880 GG No L CREEK DOGWOOD PARK $1,352,988 $1,318, /2011 GG No L DOGWOOD PARK - APP $30,000 $6,000 GG No L OKI PARK OPEN SPACE $44,150 $4, /2008 GG No L WILD ROSE PARK $2,774,400 $2,731, /2011 GG No L EAST PORTAL PARK JOGGING $50,000 $46, /2008 GG No L ROBERTSON PARK $312,500 $240, /2010 GG No L HAMPTON STATION PARK - TK $133,493 $80,784 GG No L HAMPTON PARK - APP $30,000 $6,028 GG No L MAMA MARKS PARK $61,000 $3, /2009 GG No L CHUCKWAGON PARK $62,740 $18, /2008 GG No L ZAPATA PARK COMMUNITY $67,000 $60, /2009 GG No L NATOMAS OAKS PARK $15,000 $15, /2009 GG No L CAMELLIA PARK MASTER PLAN $60,000 $60, /2009 GG No L REA PARK IMPROVEMENTS $400,000 $400,000 GG No L TRIANGLE PARK $150,000 $150,000 GG No L MLK PHASE I IMPROVEMENTS $150,000 $150,000 GG No L CESAR CHAVEZ PLAZA $0 $0 $100,000 $0 $0 $0 $ /2010 GG Yes L REDBUD PARK $0 $0 $275,000 $0 $0 $0 $ /2011 GG Yes L CENTRAL CITY L&L PARK $86,093 $19,543 GG No L LAND PARK L&L PARK REPAIR $113,269 $9,092 GG No L POCKET AREA L&L PARK $101,351 $25,280 GG No L SOUTH SACRAMENTO L&L $153,584 $24,207 GG No Detail Sheet Available Projects by Project Number P - 10
393 Budget Est Est Project through Balance FY Complete Number Project Name 6/2009 6/ / / / / /14 Initiated Date Section L EAST BROADWAY L&L PARK $102,131 $18,066 GG No L EAST SACRAMENTO L&L PARK $95,453 $14,134 GG No L ARDEN ARCADE L&L PARK $52,137 $6,419 GG No L NORTH SACRAMENTO L&L $124,326 $11,388 GG No L SOUTH NATOMAS L&L PARK $103,356 $9,811 GG No L NORTH NATOMAS L&L PARK $47,609 $12,077 GG No L AIRPORT MEADOWVIEW L&L $57,182 $13,086 GG No L CITYWIDE L&L PARK REPAIR $0 $0 $201,761 $156,761 $156,761 $156,761 $156, /2014 GG Yes L PLAYGROUND REPAIRS $450,000 $133,937 $75,000 $75,000 $75,000 $75,000 $75,000 GG Yes L PARK MAINTENANCE $1,063,944 $326 GG No L IRRIGATION SYSTEM $400,000 $390,642 GG No L WATER USE EFFICIENCY $611,000 $37,439 GG No L PARK MAINTENANCE $2,430,418 $240, /2005 GG No L SWIMMING POOL $639,287 $92,101 $100,000 $100,000 $100,000 $100,000 $100,000 GG Yes L CAMP SACRAMENTO REHAB $280,000 $136,075 GG No L HERON ELEMENTARY 4TH R $425,000 $197,668 GG No L YOUTH RECREATION $204,226 $130,849 GG No L GRANITE SAFETY FENCING IMP $25,000 $25,000 GG No L COMM SCHOOLS-JNT SEED $1,774,770 $578 GG No L PARK SAFETY ASSESSMENTS $50,000 $11,706 GG No L FREMONT PK SAFETY ACTION $5,000 $4,795 GG No L HAGGINWOOD PARK SAFETY $341,083 $256,991 GG No L GARDENLAND PARK SAFETY $162,900 $52,594 GG No L JOHNSTON PARK SAFETY IMP $182,600 $156,586 GG No L MCCLATCHY PARK SAFETY IMP $85,800 $65,291 GG No L NINOS PARK SAFETY IMP $49,300 $23,293 GG No L STRAWBERRY MANOR PARK $50,000 $21,083 GG No L BILL BEAN JR. PARK SAFETY $94,700 $50,073 GG No L MLK JR. PARK SAFETY IMP $30,300 $6,491 GG No L CHORLEY PARK SAFETY IMP $76,500 $15,299 GG No Detail Sheet Available Projects by Project Number P - 11
394 Budget Est Est Project through Balance FY Complete Number Project Name 6/2009 6/ / / / / /14 Initiated Date Section L GARDENLAND PARK MP $35,000 $8,222 GG No L JOHNSTON PARK MP $50,000 $356 GG No L STRAWBERRY MANOR PK $400,000 $352,649 GG No L MARTIN LUTHER KING JR. $50,000 $25,200 GG No L CHORLEY PARK MP $126,000 $62,085 GG No L MCCLATCHY PARK MASTER $100,000 $23,943 GG No L BILL BEAN JR PK SFTY TIER II $187,949 $187,949 GG No L HAGGINWOOD PARK PSIP TIER $84,905 $84,905 GG No L JOHNSTON PARK PSIP TIER III $400,000 $400,000 GG No L GARDENLAND PARK PSIP TIER $120,000 $120,000 $375,000 $0 $0 $0 $ /2011 GG Yes L SOJOURNER TRUTH PARK $188,465 $170, GG No L P&R RESERVATION SYSTEM $200,000 $54,208 GG No L PROP 12 ADMINISTRATION $200,000 $69,670 GG No M CROCKER PERMITS & INSP $561,636 $236,714 FF No M CROCKER MGMT & ADMIN $340,000 $28,031 FF No M CROCKER ARCHITECTS AND $1,872,221 $1,390 FF No M CROCKER ART MUSEUM $63,270,799 $15,000, /2010 FF No M CROCKER ENVIRONMENTAL $530,000 $26,575 FF No M ARCHIVES MAINTENANCE AND $251,500 $31,500 FF No M COMMUNITY CENTER $469,494 $284,422 $50,000 $105,000 $80,000 $230,000 $450,000 FF Yes M THEATER RENOVATION $1,330,000 $1,117,268 $1,050,000 $2,000,000 $1,850,000 $2,000,000 $3,000,000 FF Yes M MEMORIAL AUD ELECTRICL $125,000 $25,036 FF No M CONVENTION CENTER AV $120,000 $116,315 $20,000 $20,000 $20,000 $20,000 $20,000 FF Yes M CONVENTION CENTER CARPET $750,000 $29,296 $0 $0 $0 $200,000 $200,000 FF Yes M CONVENTION CENTER $276,000 $0 $0 $200,000 $200,000 $0 $0 FF Yes M CONVENTION CENTER $220,000 $220,000 FF No M COMMUNITY CENTER $125,000 $125,000 $0 $0 $0 $100,000 $30,000 FF Yes M CONVENTION CENTER $100,000 $23,642 FF No M EXHIBIT HALLS C, D, AND E $300,000 $300,000 FF No M MEMORIAL AUDITORIUM $7,136,000 $2,707,427 $100,000 $100,000 $100,000 $200,000 $200, FF Yes Detail Sheet Available Projects by Project Number P - 12
395 Budget Est Est Project through Balance FY Complete Number Project Name 6/2009 6/ / / / / /14 Initiated Date Section M CONVENTION CENTER $700,000 $700,000 FF No M CONVENTION CENTER $800,000 $777,622 $330,000 $0 $0 $0 $ /2009 FF Yes M THEATER ORCHESTRA SHELL $400,000 $400,000 FF No M COURSE/FACILITY $357,732 $75,602 $60,000 $60,000 $60,000 $60,000 $60,000 FF Yes M HARBOR DREDGING $712,915 $271,453 $65,000 $65,000 $65,000 $65,000 $65,000 FF Yes M SAC MARINA-N BASIN BANK ST $75,000 $66,000 FF No M SAC MARINA-FUEL DOCK REPL $50,000 $36,213 FF No M SOUTH BASIN DOCK $10,711,213 $111,932 FF No M MARINA IMPROVEMENTS $135,000 $135,000 $135,000 $135,000 $135,000 $135,000 $135,000 FF Yes M APP-SO NATOMAS ART PROJ $100,000 $79,310 FF No M APP-MAINTENANCE $671,592 $126,963 FF No M OLD SACRAMENTO $155,363 $148,071 FF No M OLD SACRAMENTO DISTRICT $63,396 $63,396 FF No M SACRAMENTO ZOO $270,050 $34,379 FF No R STREET OVERLAY AND SEALS $15,299,469 $15,264, /2009 II No R OVERLAY VIDEO DETECTION $1,101,000 $400, /2009 II No R FY08 OVERLAYS AND SEALS $1,191,250 $162, /2010 II No R FY08 CITY STREET OVERLAY $269,208 $113,618 II No R FY07/08 FEDERAL OVERLAY $4,036,618 $512,551 II No R FY07/08 STREET SEALS $5,396,782 $418, /2008 II No R FY09 ST OVERLAY & SEALS $1,726,691 $1,724,402 II No R FY09 CITY OVERLAY RM91 $100,000 $69,295 II No R FY09 STREET SEALS RM92 $100,000 $100,000 II No R HOLLOW SIDEWALK $977,400 $231, /2009 II No R BRIDGE MAINTENANCE $436,962 $2, /2009 II No R HIGHWAY BRIDGE PROGRAM- $102,635 $89, /2009 II No R CITY BRIDGE REPAIR - PHASE 1 $260,777 $ /2008 II No R CITY BRIDGE REPAIR - $143,066 $85, /2008 II No R CITY BRIDGE REPAIR - $296,372 $232, /2008 II No R PAVEMENT MANAGEMENT $518,000 $161, /2009 II No Detail Sheet Available Projects by Project Number P - 13
396 Budget Est Est Project through Balance FY Complete Number Project Name 6/2009 6/ / / / / /14 Initiated Date Section R GUARDRAIL REPLACEMENT $275,000 $55, /2009 II No R TRENCH CUT FEE PROGRAM $576,972 $432, /2014 II No R STREET REPAIR PARTNERING $735,471 $363, /2009 II No R STREET UTILITY SIDEWALK $40,000 $40,000 II No R TRAFFIC SIGNAL EQUIPMENT $19,433 $16, /2009 II No R FY06/07 CONTROLLER & $336,752 $139, /2009 II No R FY06/07 LED REPLACEMENT $104,600 $31, /2009 II No R FY06/07 VEHICLE LOOP $100,000 $27, /2009 II No R FY07/08 - VEHICLE LOOP $132,096 $131, /2009 II No R FY07/08 - LED REPLACEMENT $100,000 $28, /2009 II No R FY07/08 - CONTROLLER & $263,451 $166, /2009 II No R FY09 VEHICLE LOOP REPLACE $100,000 $100, /2010 II No R FY09 LED REPLACEMENT SS92 $188,800 $188, /2010 II No R FY09 CONTR & CABINET REPL $205,000 $205, /2010 II No R WORK MANAGEMENT SYSTEM $492,500 $10, /2009 II No R LANDSCAPE FRONTAGE $24,000 $22, /2014 II No R PAVEMENT MANAGEMENT $0 $0 $50,000 $50,000 $50,000 $50,000 $50, /2014 II Yes R STREET OVERLAY AND SEAL $0 $0 $50,000 $50,000 $50,000 $50,000 $50, /2014 II Yes R HOLLOW SIDEWALK $0 $0 $65,000 $65,000 $65,000 $65,000 $65, /2014 II Yes R BRIDGE MAINTENANCE $0 $0 $25,000 $25,000 $25,000 $25,000 $25, /2014 II Yes R BRIDGE CONSTRUCTION AND $0 $0 $50,000 $50,000 $50,000 $50,000 $50, /2014 II Yes R GUARDRAIL REPLACEMENT $0 $0 $50,000 $50,000 $50,000 $50,000 $50, /2014 II Yes R TRENCH CUT FEE PROGRAM $0 $0 $150,000 $150,000 $150,000 $150,000 $150, /2014 II Yes R STREET REPAIR PARTNERING $0 $0 $100,000 $100,000 $100,000 $100,000 $100, /2014 II Yes R TRAFFIC SIGNAL EQUIPMENT $0 $0 $205,000 $205,000 $205,000 $205,000 $205, /2014 II Yes R WORK MANAGEMENT SYSTEM- $0 $0 $60,000 $60,000 $60,000 $60,000 $60, /2014 II Yes R STREET LIGHT RELAMP $0 $0 $125,000 $125,000 $125,000 $125,000 $125, /2014 II Yes S TRAFFIC SIGNAL REBATE $98,102 $98, /2009 II No S NEIGHBORHOOD TRAFFIC $1,268,076 $591, /2009 II No S NTMP CONSULTANT SERVICES $430,000 $24, /2014 II No Detail Sheet Available Projects by Project Number P - 14
397 Budget Est Est Project through Balance FY Complete Number Project Name 6/2009 6/ / / / / /14 Initiated Date Section S NTMP DATA COLLECTION $461,317 $8, /2014 II No S ELMHURST NTMP $78,735 $1, /2009 II No S CURTIS PARK NTMP $46,600 $ /2008 II No S NEWTON BOOTH NTMP $38,500 $2, /2008 II No S COLLEGE PLAZA (D4) NTMP $25,000 $24, /2009 II No S EAST FRUITRIDGE NTMP (D6) $25,000 $1, /2008 II No S MEISTER TERRANCE NTMP $25,000 $14, /2009 II No S BELDEN/D2 NTMP $25,000 $13, /2008 II No S HELIBRON OAKS (D5) NTMP $25,000 $9, /2009 II No S MEADOWVIEW PHASE 2 (D8) $68,600 $36, /2009 II No S SOUTH LAND PARK HILLS $25,000 $4, /2009 II No S FY07/08 - NTMP $270,000 $269, /2012 II No S EL MONTE (D2) $25,000 $25, /2009 II No S CITY FARMS (D5) $25,000 $25, /2009 II No S CARELLA GARDENS (D8) $45,000 $35, /2009 II No S ELDER CREEK (D6) $30,300 $17, /2009 II No S HAGGINWOOD $30,000 $5, /2009 II No S XANDRIA $25,000 $25, /2010 II No S HERON PARK $25,000 $24, /2009 II No S LAND TERRACE VISTA $25,000 $25, /2010 II No S NATOMAS CROSSING NTMP $54,700 $39, /2009 II No S MERCY HOSPITAL NTMP $200,000 $199,922 II No S CAMELLIA NTMP (D6) $25,000 $25, /2010 II No S SOUTHSIDE PARK NTMP $25,000 $25,000 II No S OAK PARK NTMP $25,000 $25,000 II No S SPEED HUMP PROGRAM $2,344,985 $124, /2009 II No S C STREET CANNERY PROJECT $10,000 $10,000 II No S TRAFFIC OPERATIONS CENTER $995,884 $472, /2009 II No S SIGNAL INTEGRATION $69,270 $50, /2008 II No S TRUXEL RD COORDINATION $100,000 $24, /2009 II No Detail Sheet Available Projects by Project Number P - 15
398 Budget Est Est Project through Balance FY Complete Number Project Name 6/2009 6/ / / / / /14 Initiated Date Section S TOC FIBER CONNECTIONS $50,000 $44, /2009 II No S SIGNAL INTEGRATION, TIMING, $100,000 $25, /2009 II No S TOC $104,515 $28, /2009 II No S FRANKLIN BLVD $40,000 $40,000 II No S TRAFFIC SIGNAL MODELING $50,000 $50,000 II No S CAPTAIN JERRY S SAFETY $65,000 $45, /2009 II No S ON STREET ANGLED PARKING $310,000 $96, /2009 II No S MEDIAN TURN LANE PROGRAM $345,013 $260, /2009 II No S TRAFFIC SIGNAL SAFETY $1,341,841 $1,117, /2009 II No S FY08 TRAFFIC SIGNAL SAFETY $200,000 $200, /2009 II No S NEW TRAFFIC SIGNALS $229,290 $110,588 $0 $300,000 $300,000 $300,000 $300, /2014 II Yes S FRUITRIDGE/BRADFORD SGNL $523,000 $166, /2007 II No S EL CAMINO AVENUE AND $390,000 $313, /2009 II No S TRAFFIC SIGNAL POLES $50,000 $49, /2014 II No S SIGNAL PRE-EMPTION $475,000 $87, /2009 II No S SIGNAL-RIO LINDA AND BELL $15,000 $6, /2010 II No S I-80 / WEST EL CAMINO SIGNAL $525,000 $62, /2010 II No S I-5 / DEL PASO ROAD SIGNALS $500,000 $100, /2009 II No S TH ST AND W ST TRAFFIC $355,000 $348, /2009 II No S TRAFFIC SIGNS AND $0 $0 $140,000 $140,000 $140,000 $140,000 $140, /2014 II Yes S NEIGHBORHOOD TRAFFIC $0 $0 $400,000 $400,000 $400,000 $400,000 $400, /2014 II Yes S SPEED HUMPS PROGRAM $0 $0 $300,000 $300,000 $300,000 $300,000 $300, /2014 II Yes S TRAFFIC OPERATIONS CENTER $0 $0 $375,000 $375,000 $375,000 $375,000 $375, /2014 II Yes S CAPTAIN JERRY S SAFETY $0 $0 $15,000 $15,000 $15,000 $15,000 $15, /2014 II Yes S ON STREET ANGLED PARKING $0 $0 $25,000 $25,000 $25,000 $25,000 $25, /2014 II Yes S MEDIAN TURN LANE PROGRAM $0 $0 $50,000 $50,000 $50,000 $50,000 $50, /2014 II Yes S TRAFFIC SIGNAL SAFETY $0 $0 $125,000 $125,000 $125,000 $125,000 $125, /2014 II Yes S GREENHAVEN DRIVE AND $0 $0 $300,000 $0 $0 $0 $ /2010 II Yes S SIGNAL PRE-EMPTION $0 $0 $75,000 $75,000 $75,000 $75,000 $75, /2014 II Yes T BIKEWAY PROGRAM $721,797 $202, /2009 II No Detail Sheet Available Projects by Project Number P - 16
399 Budget Est Est Project through Balance FY Complete Number Project Name 6/2009 6/ / / / / /14 Initiated Date Section T BIKE LANE IMPROVEMENTS $208,010 $136, /2008 II No T ADVANCED TRANSPORTATION $2,107,299 $233, /2009 II No T SR160 BRIDGES $60,000 $57,373 II No T STATE AND FEDERAL GRANT $3,229,648 $3,229, /2014 II No T CENTRAL CITY TWO-WAY $1,886,299 $969, /2009 II No T CENTRAL CITY TWO WAY $258,000 $62, /2009 II No T CENTRAL CITY TWO WAY 9TH $456,000 $405, /2009 II No T CNTRLL CITY CNVSN- 3RD-I TO $400,000 $114,899 II No T CNTRLL CITY J ST 30TH TO $450,000 $444,250 II No T TRANSP CORRIDOR PLANNING $113,421 $57, /2007 II No T MAIN AVE BRIDGE REPLACEMT $23,977,140 $4,794, /2007 II No T EL CAMINO NEMDC $250,000 $82, /2008 II No T NSD PUBLIC SAFETY PROJECT $50,000 $48, /2010 II No T GRANITE PARK $1,258,236 $470, /2010 II No T NORTH NATOMAS FREEWAY $97,500 $21,757 $11,500 $11,500 $11,500 $11,500 $11, /2014 II Yes T ALLEY GATE MATCHING FUND $10,000 $6, /2008 II No T STREETLIGHT INVESTMENT $364,319 $361, /2009 II No T FLORIN ROAD MEDIANS $682,477 $219, /2009 II No T NEIGHBORHOOD GATEWAY - $25,000 $11, /2010 II No T MCCLELLAN HEIGHTS $3,000,000 $2,278, /2010 II No T COSUMNES RIVER BLVD/ I-5 $12,862,630 $7,402, /2011 II No T FRANKLIN BLVD/FRUITRIDGE $805,000 $25, /2007 II No T FOLSOM BLVD IMPROVEMENT $2,580,534 $119, /2012 II No T FOLSOM BLVD IMPROVEMENT $2,540,967 $2,539, /2014 II No T BRUCEVILLE RD WIDENING $7,581,176 $414, /2006 II No T NORTH CENTRAL BUSINESS $1,562,568 $599, /2010 II No T NCBD - 7TH STREET WIDENING $70,000 $11, /2009 II No T INTERSTATE 5 & RICHARDS $1,120,000 $1,120, /2010 II No T INTERMODAL $6,951,004 $3,248, /2020 II No T ITF - SITE ACQUISITION $61,738,337 $5,401, /2009 II No Detail Sheet Available Projects by Project Number P - 17
400 Budget Est Est Project through Balance FY Complete Number Project Name 6/2009 6/ / / / / /14 Initiated Date Section T SACTO VALLEY STATION- $50,000 $49, /2010 II No T INTERMODAL DEPOT $1,742,500 $1,735, /2013 II No T TRACK RELOCATION CF48 $3,254,596 $1,447,521 II No T BROADWAY & MARTIN LUTHER $1,754,727 $1,529, /2008 II No T BROADWAY STREETSCAPE $1,300,000 $1,067, /2008 II No T FOLSOM BL MASTER $240,000 $49, /2007 II No T FRUITRIDGE ROAD $234,775 $54, /2009 II No T SR160 STATE OF GOOD $2,441 $2, /2014 II No T SR160-STREET LIGHTING $103,052 $101, /2012 II No T SR160-TRAFFIC SIGNALS $430,381 $255, /2013 II No T SR160-STRUCTURES 12TH AND $31,529 $30, /2012 II No T SR160-TEA PROJECT 15TH AND $110,044 $103, /2011 II No T WEST EL CAMINO AVENUE $8,358,058 $984, /2009 II No T BROADWAY STREETSCAPE $180,000 $179, /2008 II No T & 12 ST ROW IMPRVMENTS $200,000 $199, /2010 II No T TH & 16TH STREET LIGHT $532,135 $327, /2008 II No T TH & 16TH STREET $25,299 $24, /2008 II No T EL PARAISO AVENUE $1,161,000 $1,049, /2010 II No T BRIDGE $920,000 $445, /2009 II No T CENTER PARKWAY BRIDGE $280,000 $268, /2009 II No T DEL PASO ROAD $5,004,083 $9, /2008 II No T STRATEGIC NEIGHBORHOOD $424,825 $160, /2008 II No T ARENA BL LANDSCAPING 3431 $355,000 $91, /2007 II No T SWANSTON STATION INFRAST. $854,286 $7, /2007 II No T DIXIEANNE AVENUE $2,028,000 $1,659, /2009 II No T FRANKLIN BOULEVARD $150,000 $126, /2008 II No T R STREET IMPROVEMENTS $2,920,000 $2,068, /2010 II No T NATOMAS BLVD $200,417 $190,566 II No T TRAIN HORN QUIET ZONE $620,000 $475, /2009 II No T TH/ 28TH STREET UPRR $705,000 $569, /2009 II No Detail Sheet Available Projects by Project Number P - 18
401 Budget Est Est Project through Balance FY Complete Number Project Name 6/2009 6/ / / / / /14 Initiated Date Section T WEST EL CAMINO/1-80 $500,000 $98, /2010 II No T SOUTH WATT AVENUE AND $1,595,359 $30, /2008 II No T RAILYARDS DEVELOPMENT $2,198,349 $131, /2009 II No T OAK PARK STREETLIGHTS $2,254,369 $933, /2008 II No T COL HGHTS SDWLK IMP 50 ST $238,500 $ /2006 II No T COLONIAL HEIGHTS-52ND ST $315,000 $101, /2007 II No T MEADOWVIEW ROAD $130,000 $38, /2007 II No T CITY COLLEGE BIKE/ $500,000 $311, /2009 II No T REDDING AVENUE BIKE $1,195,243 $475, /2008 II No T ARDEN WAY STREETSCAPE $341,951 $95, /2007 II No T FY05/06 ECONOMIC $204,177 $149, /2010 II No T SR275 ROADWAY $399,000 $398, /2014 II No T SR275 STREET LIGHTING $361,000 $360, /2014 II No T SR275 TRAFFIC SIGNALS $230,000 $229, /2014 II No T SR275 IRRIGATION $18,000 $17, /2014 II No T SR275 ADA COMPLIANCE $323,000 $322, /2014 II No T STATE ROUTE 275 CURB, $5,000 $4, /2014 II No T SR275 SIGNING AND STRIPING $21,000 $20, /2014 II No T NORTHGATE BLVD/ ARDEN $222,271 $78, /2011 II No T TH STREET STATION AREA $999,700 $412, /2008 II No T INTERMODAL CIRCULATION $900,260 $540, /2010 II No T R STREET MARKET PLAZA $715,000 $157, /2008 II No T NORWOOD AVENUE BRIDGE $996,669 $680, /2010 II No T ROSEVILLE ROAD BRIDGE $1,863,975 $800, /2009 II No T TH AVENUE BRIDGE OVER $139,321 $62, /2009 II No T POWER INN ROAD RAIL ROAD $250,000 $200, /2008 II No T BROADWAY BRIDGE $200,000 $193, /2008 II No T CITYWIDE NEW STREET $462,265 $107, /2009 II No T NEIGHBORHOOD STREET $2,734,591 $2,504, /2009 II No T MCKINLEY PARK STREET $1,197,372 $876, /2008 II No Detail Sheet Available Projects by Project Number P - 19
402 Budget Est Est Project through Balance FY Complete Number Project Name 6/2009 6/ / / / / /14 Initiated Date Section T STREETLIGHT REPLACEMENT J $608,000 $608, /2009 II No T MAJOR STREET LIGHTING $1,303,093 $1,146, /2009 II No T POINT WEST STREETLIGHTS $350,000 $208, /2009 II No T STREET LIGHT RELAMP $369,381 $264, /2009 II No T DEL PASO/GROVE $1,817,610 $ /2008 II No T DIXIEANNE AREA $871,262 $12, /2008 II No T YOUNGS HEIGHTS STREET $288,738 $28, /2008 II No T EL CENTRO RD/ARENA BL TS $168,454 $8, /2005 II No T PEDESTRIAN SAFETY $628,313 $211, /2009 II No T PEDESTRIAN IMPROVEMENT $850,000 $791, /2009 II No T SIDEWALK GAP CLOSURE $525,000 $271, /2009 II No T ELVAS AVENUE $150,000 $132, /2008 II No T PUBLIC RIGHTS-OF-WAY $8,668,951 $3,277, /2009 II No T ADA PROGRAM MONITOR 3431 $90,000 $10, /2007 II No T WYNDHAM PEDESTRIAN $40,000 $4,016 II No T FY 07/08 PUBLIC $1,463,500 $1,364, /2008 II No T FY 08 PUBLIC RIGHTS-OF-WAY $2,430,650 $53, /2008 II No T FY 08 SIDEWALK REPAIR $987,500 $7, /2008 II No T FY 08 DEVELOPER $50,000 $8, /2008 II No T FY 08 CITIZEN REQEST RAMP $687,500 $572, /2008 II No T FY 08 GEN'L ACCESS $75,000 $53, /2008 II No T FY08 DI UPGRADE RAMPS $387,500 $74, /2008 II No T FY 08 TRAFFIC ENGINEER - $385,000 $249, /2008 II No T FY 08 PROJECT FOR THIRD $50,000 $49, /2008 II No T FY09 RAMPS SUPPORTING $1,852,500 $1,236, /2009 II No T FY09 RAMPS SUPPORTING THE $855,500 $287, /2009 II No T FY09 DEVELOPER $50,000 $44, /2009 II No T FY09 CITIZEN REQUESTED $712,500 $443, /2009 II No T FY09 OTHER CITIZEN ADA $75,000 $23, /2009 II No T FY09 DI UPGRADE CURB $570,000 $391, /2009 II No Detail Sheet Available Projects by Project Number P - 20
403 Budget Est Est Project through Balance FY Complete Number Project Name 6/2009 6/ / / / / /14 Initiated Date Section T FY09 TRAFFIC PROGRAM $241,000 $183, /2009 II No T FY09 THIRD PARTY PROJECT $50,000 $49, /2009 II No T FY09 PROGRAM $1,593,500 $1,530, /2009 II No T FY06/07 ECONOMIC $668,307 $668, /2010 II No T BRIDGE MAINTENANCE DESIGN $315,543 $313, /2009 II No T HOWE AVE BRIDGE JOUNT $200,000 $200, II No T STATE ROUTE 160 TREE $105,575 $90, /2013 II No T STATE ROUTE 160 $19,758 $10, /2004 II No T URBAN FOREST $1,150,000 $579,580 II No T BEN ALI STREETLIGHTING $535,000 $88, /2008 II No T BEN ALI STREET LIGHTS $465,000 $245, /2008 II No T TH STREET ENTRY PROJECT $10,000 $9, /2010 II No T JESSIE AVE SIDEWALKS $800,000 $754, /2010 II No T FY07/08 ECONOMIC $800,000 $800, /2010 II No T FY 08 MARYSVILLE BLVD. $330,000 $222, /2009 II No T DOWNTOWN TSM CAPITAL $70,000 $45, /2009 II No T FY08 ITS EXPANSION SU26 $212,358 $159, /2009 II No T RICHARDS/ I-5 ULTIMATE $300,000 $299, /2017 II No T ACCESS $1,536,239 $113, /2010 II No T QUALITY OF LIFE $10,000 $1, /2011 II No T RAMPS-SIDEWALKS-SPEED $251,700 $251, /2010 II No T MCCLATCHY NTMP $50,000 $50, /2011 II No T OAK PARK NTMP $25,000 $25, /2011 II No T NEIGHBORHOOD WATCH $1,400 $1, /2010 II No T ALLEY GATE INSTALLATION $18,000 $18, /2009 II No T TRAFFIC CIRCLES $40,000 $34, /2010 II No T BACK LOT FENCING $13,500 $10, /2010 II No T TH AND MLK SIDEWALKS $50,400 $50,400 II No T RIO LINDA/MAIN FEASIBILITY $115,000 $10, /2009 II No T HOWE AVENUE BRIDGE STUDY $75,000 $70, /2012 II No Detail Sheet Available Projects by Project Number P - 21
404 Budget Est Est Project through Balance FY Complete Number Project Name 6/2009 6/ / / / / /14 Initiated Date Section T BOAT SECTION $800,000 $22,306 II No T TH STREET $2,311,733 $111, /2010 II No T WYNDVIEW PEDESTRIAN $141,300 $131, /2009 II No T TH STREET LANDSCAPING $204,000 $198,858 II No T KROY PATHWAY $120,000 $117,588 II No T DEL PASO ROAD $120,000 $120, /2010 II No T EL CENTRO ROAD $300,000 $292, /2010 II No T FY08/09 ECONOMIC $525,000 $525, /2010 II No T DISTRICT 6 NEIGHBORHOOD $150,000 $89, /2009 II No T ROBLA SIGN MONUMENTS $67,000 $65, /2009 II No T MAJOR STREET $2,000,000 $2,000, /2009 II No T MAIN AVE SIDEWALKS $1,100,000 $1,084, /2010 II No T DEL PASO BLVD $600,000 $589,433 II No T MLK JR BLVD IMPROVEMENTS $5,253,592 $5,253, /2012 II No T BIKEWAY PROGRAM $0 $0 $150,000 $150,000 $150,000 $150,000 $150, /2014 II Yes T ADVANCED TRANSPORTATION $0 $0 $400,000 $400,000 $400,000 $400,000 $400, /2014 II Yes T OVERWIDTH PAVEMENT $0 $0 $100,000 $100,000 $100,000 $100,000 $100, /2014 II Yes T PEDESTRIAN IMPROVEMENT $0 $0 $50,000 $50,000 $50,000 $50,000 $50, /2014 II Yes T PEDESTRIAN SAFETY $0 $0 $75,000 $75,000 $75,000 $75,000 $75, /2014 II Yes T PUBLIC RIGHTS-OF-WAY $0 $0 $2,780,000 $2,780,000 $2,780,000 $2,780,000 $2,780, /2014 II Yes T DOWNTOWN TSM CAPITAL $0 $0 $20,000 $20,000 $20,000 $20,000 $20, /2014 II Yes T ALLEY ABATEMENT PROGRAM $60,000 $45,000 $60,000 $60,000 $60,000 $60,000 $60, /2014 II Yes T NEIGHBORHOOD STREET $0 $0 $400,000 $400,000 $400,000 $400,000 $400, /2014 II Yes T MAJOR STREET LIGHTING $0 $0 $100,000 $100,000 $100,000 $100,000 $100, /2014 II Yes T FY09/10 ECONOMIC $0 $0 $525,000 $525,000 $525,000 $525,000 $525, /2014 II Yes T MAJOR STREET $0 $0 $1,864,000 $1,864,000 $1,864,000 $1,864,000 $1,864, /2014 II Yes T OVERWIDTH PAVEMENT $13,303,978 $400, /2009 II No T FREEPORT BOULEVARD AND $3,394,082 $696, /2008 II No T MIDTOWN TRANSPORTATION $2,951,760 $76, /2009 II No T BRIDGING I-5 $5,332,709 $701, /2009 II No Detail Sheet Available Projects by Project Number P - 22
405 Budget Est Est Project through Balance FY Complete Number Project Name 6/2009 6/ / / / / /14 Initiated Date Section T RICHARDS AT SR160 $5,320,615 $267, /2007 II No T ALLEYWAYS SAFETY $50,000 $48, /2008 II No V RETAIL AND OFFICE SPACE $1,811,712 $712,236 $50,000 $50,000 $50,000 $50,000 $50, /2014 II Yes V STRUCTURE REPAIRS & $6,030,000 $2,357,911 $500,000 $500,000 $500,000 $500,000 $500, /2014 II Yes V GARAGE INTERIOR LIGHTING $1,190,078 $845, /2014 II No V ELEVATOR RENO/MODERN $1,156,376 $495, /2014 II No V MECHANICAL/ELECTRICAL $2,302,732 $504,907 $50,000 $50,000 $50,000 $50,000 $50, /2014 II Yes V PARKING FACILITIES $3,411,992 $1,825,151 $200,000 $200,000 $200,000 $200,000 $200, /2014 II Yes V SIGN & STRIPE ALL PARKING $213,827 $56, /2014 II No V REVENUE CONTROL SYSTEM $4,646,872 $1,510, /2014 II No V PARKING VIDEO $750,000 $577, /2014 II No V PARKING METER $3,348,400 $32, /2009 II No V PARKING FACILITIES $7,022,076 $6,354,556 $2,000,000 $2,000,000 $2,000,000 $2,000,000 $2,000, /2014 II Yes V EAST END DEVELOPMENT $100,000 $89, /2009 II No V PARKING LOT C-APP $298,276 $23, /2010 II No V PARKING GARAGE ATTENDANT $632,552 $303, /2011 II No W NO NATOMAS DRAINAGE $1,624,271 $84, /2010 JJ No W BASE CIP RESERVE-DRAINAGE $274,022 $273, JJ No W DRAINAGE SYSTEM MASTER $3,194,362 $29, /2010 JJ No W FLOOD CONTROL PLANNING $2,318,933 $0 $220,000 $0 $0 $0 $ JJ Yes W FLOODPLAIN MANAGEMENT $3,045,480 $148,658 $175,000 $0 $0 $0 $ JJ Yes W BASIN 26 DETENTION $2,714,000 -$324, /2007 JJ No W SUMP 33 DETENTION BASIN $443,000 $83, /2004 JJ No W BASIN 31 DET 65TH BROADWAY $4,875,000 $1,052, /2006 JJ No W MORRISON CK FOUR ACCESS $175,502 $87, /2002 JJ No W BASIN 157 MASTER PLAN $325,691 $9, /2003 JJ No W AIRPORT DITCH LINING $260,000 $178, /2004 JJ No W SUMP ELECTRICAL REHAB $581,500 $17, /2009 JJ No W FY04-FY08 NPDES PROGRAM $9,632,944 $1,259, /2009 JJ No W ANTIOCH DETENTION ACCESS $77,266 $20, /2006 JJ No Detail Sheet Available Projects by Project Number P - 23
406 Budget Est Est Project through Balance FY Complete Number Project Name 6/2009 6/ / / / / /14 Initiated Date Section W SUMP 26 ELEC REHAB $340,000 $ /2006 JJ No W SUMP 130 ELEC REHAB $517,000 $145, /2006 JJ No W BASIN 67 DET BASIN $282,000 $89, /2007 JJ No W STORM DRAIN SYSTEM $450,000 $384, /2008 JJ No W ASSET MANAGEMENT $100,000 $92, /2010 JJ No W SUMP 128 ELECTRICAL REHAB $430,000 $22, /2007 JJ No W SUMP 153 ELECTRICAL REHAB $350,000 $279, /2007 JJ No W SUMP 157 ELECTRICAL REHAB $330,000 $306, /2008 JJ No W SUMP 132 ELECTRICAL REHAB $30,000 $29, /2008 JJ No W SUMPS 33, 90, AND 157 $36,443 -$4, /2007 JJ No W NORTH AREA DRYING $82,500 $80, /2007 JJ No W LINE POCKET CANAL PHASE 2 $40,000 $38, /2007 JJ No W ECONOMIC DEVELOP PRGM $400,000 $400, /2006 JJ No W SUMP 157 TRASHRACKS $713,557 $710, JJ No W SUMP 101 ELECTRICAL REHAB $900,000 $894, /2009 JJ No W SUMP 19 ELECTRICAL REHAB $250,000 $249, JJ No W SUMP 65 ELECTRICAL REHAB $330,000 $111, JJ No W VFD REPLACEMENTS $100,000 $97, JJ No W SUMP 112 ELECTRICAL REHAB $30,000 $29, JJ No W SUMP 94 ELECTRICAL REHAB $30,000 $21, JJ No W SUMP 51 ELECTRICAL REHAB $30,000 $21, JJ No W N. SAC RURAL DRAIN DESIGN $4,000 $4,000 JJ No W LINE POCKET CANAL PH 2 $138,625 -$3,917 JJ No W MASTER PLAN BASIN 152 $250,000 $250,000 JJ No W PUMP STN OUTFALL REPR PH3 $532,500 $102, /2003 JJ No W UPPER HAGGINWOOD $324,473 $76, /2007 JJ No W DELTA SHORES/SOI MSTR $124,309 $117, /2006 JJ No W I-5 FREEWAY LANDSCAPE $5,435,438 $4,091,130 $998,592 $0 $0 $0 $ /2010 JJ Yes W INVENTORY & O&M MGMNT $780,000 $744,515 JJ No W SUMP 115 ELECTRICAL REHAB $0 $0 $10,000 $0 $0 $0 $ /2011 JJ Yes Detail Sheet Available Projects by Project Number P - 24
407 Budget Est Est Project through Balance FY Complete Number Project Name 6/2009 6/ / / / / /14 Initiated Date Section W SUMP 47 ELECTRICAL REHAB $0 $0 $10,000 $0 $0 $0 $ /2011 JJ Yes W SUMP 117 ELECTRICAL REHAB $0 $0 $10,000 $0 $0 $0 $ /2011 JJ Yes W FY10-FY14 NPDES $0 $0 $1,000,000 $1,000,000 $1,000,000 $1,000,000 $1,000, /2014 JJ Yes X SEWER SYS REHABILITATION $1,352,052 $155,980 $75,000 $789,725 $900,000 $1,000,000 $1,100, JJ Yes X PUMP STATIONS RADIO $5,543,000 $188,760 $25,000 $0 $0 $0 $ /2012 JJ Yes X SEWER PUMP STATION REHAB $2,019,126 $130,209 $25,000 $500,000 $500,000 $500,000 $500, JJ Yes X COMBINED SEWER SYS $8,763,366 $13, /2009 JJ No X BASE CIP RESERVE - SEWER $261,424 $261,424 $200,000 $200,000 $200,000 $200,000 $200, JJ Yes X SEWER SYSTEM MASTER PLNG $1,802,564 $2, JJ No X SUMP 136 RECONSTRUCTION $200,000 $183, /2005 JJ No X BASIN 55 I&I REDUCTION 2006 $976,250 $963, /2006 JJ No X BASIN 85 SEWER MASTERPLAN $467,000 $58, /2007 JJ No X SUMP 79 RECONSTRUCTION $210,000 $203, /2006 JJ No X SUMP 131 ELECTRICAL REHAB $150,000 $135, /2006 JJ No X SUMP135 RECONSTRUCTION $200,000 $182, /2006 JJ No X PIPE REHABILITATION $251,000 $19, /2006 JJ No X FACIILITY RELOCATION - $775,000 $83,866 JJ No X SEWER MANHOLES CONST $112,500 $1, JJ No X CHEMICAL ROOT CONTROL $192,000 $3, /2008 JJ No X SUMP 134 RECONSTRUCTION $1,172,000 $18, JJ No X PIPE REHABS 2007 $670,000 $92, JJ No X SEWER SERVICE LINING $100,000 $60, /2008 JJ No X POCKET AD 2 SEWER $2,513,442 $2,512,338 JJ No X ED-RALEY AT ASCOT IMPROVM $525,906 $525,906 JJ No X ECONOMIC DEVELOP PRGM $540,000 $540, /2007 JJ No X ED-RAPTON UTILITIES 3351 $338,693 $338,693 JJ No X ED-GLOBE MILLS SEWER $70,000 $70,000 JJ No X SEWER ASSET MGMNT $100,000 $55,747 $25,000 $0 $0 $0 $ /2012 JJ Yes X REHAB PROJECT 2008 $200,000 $181, JJ No X ROOT CONTROL 2008 $230,000 $18, /2012 JJ No Detail Sheet Available Projects by Project Number P - 25
408 Budget Est Est Project through Balance FY Complete Number Project Name 6/2009 6/ / / / / /14 Initiated Date Section X LIFT STATION FLOW METERS $100,000 $72, /2008 JJ No X FLOW MONITORING 2007 $192,142 $19, /2007 JJ No X SUMP 2A PUMP REPLACEMENT $825,000 $261,732 JJ No X ECONOMIC DEVELOPMENT $600,000 $600, /2009 JJ No X SEWER SERVICE LINING $50,000 $49, /2009 JJ No X FLOW $100,000 $81,250 $50,000 $0 $0 $0 $ /2009 JJ Yes X IN-HOUSE FLOW MONITORING $30,000 $30, /2009 JJ No X SUMP 85 INFLUENT PIPE $100,000 $98,786 $1,100,000 $0 $0 $0 $ /2010 JJ Yes X SUMP 85 VFD REPLACEMENT $150,000 $133, /2009 JJ No X SANITARY SEWER $75,000 $5,000 $75,000 $0 $0 $0 $ /2010 JJ Yes X SEWER REHAB PROJECT $486,000 $486, /2009 JJ No X ROOT CONTROL PROGRAM $0 $0 $100,000 $0 $0 $0 $ /2011 JJ Yes X SEWER SERVICE LINING 2010 $0 $0 $100,000 $0 $0 $0 $ /2011 JJ Yes X UP RAILYARD REGIONAL $950,000 $754, /2005 JJ No X TH ST, H-K STS, SWR REHAB $440,000 $365, /2003 JJ No X S/T ALLEY SWR, 22ND TO 29TH $990,000 $237, /2006 JJ No X PIONEER RESERVOIR ROOF $323,261 $2, /2005 JJ No X D/E ALLEY SEWER REP, 25TH $400,000 $354, /2005 JJ No X E/F ALLEY SEWER REP, 25TH $410,000 $387, /2005 JJ No X MCKINLEY SEWER $2,760,000 $100,667 JJ No X OAK PARK REGIONAL $200,000 $16, /2007 JJ No X CSS PLANNING $30,000 $9, /2006 JJ No X DRAIN INLET REPLACEMENTS - $388,650 $388, /2009 JJ No X FLOOD GATES REHAB AT BLUE $255,000 $38, /2006 JJ No X S STREET SEWER $2,420,000 $2,341, /2006 JJ No X J/K ALLEY SEWER $705,000 $134, /2006 JJ No X CWTP MCC F REPLACEMENT $600,000 $572, /2007 JJ No X CAPITOL/L ALLEY SEWER $160,000 $140, /2006 JJ No X /35 ALLEY SEWER $200,000 $173, /2006 JJ No X TH AND 12TH AVENUE $700,000 $13, /2006 JJ No Detail Sheet Available Projects by Project Number P - 26
409 Budget Est Est Project through Balance FY Complete Number Project Name 6/2009 6/ / / / / /14 Initiated Date Section X H STREET SEWER REHAB, $80,000 $78, /2006 JJ No X DI REPLACEMNT COMBINED $456,000 $58, JJ No X CONDITION ASSESSMENT OF $190,000 $179, /2008 JJ No X CSS IMPROVEMENT PLAN $573,900 $32,676 $300,000 $0 $0 $0 $ /2012 JJ Yes X SUMP 1 AUTOMATION $225,000 $224, /2008 JJ No X SUMP 2 MCC REPLACEMENT $1,900,000 $766, /2007 JJ No X CWTP MCC E REPLACEMENT $430,000 $425, /2008 JJ No X FLOW METERS CSS FACILITIES $225,000 $131, JJ No X TH ST SEWER, O/P TO Q/R $630,000 $114, JJ No X T ST SEWER REPLAC, 19TH - $300,000 $290, JJ No X U/V ALLEY SWR, 8TH - 9TH $150,000 $137, JJ No X J/K ALLEY SWR, 22ND - 23RD $150,000 $145, JJ No X S/T ALLEY SWR, 18TH-19TH $176,000 $170, JJ No X TH ST UPSIZING, U - R STS $2,140,000 $2,064, /2008 JJ No X FREMONT AREA REHAB $425,000 $126, /2008 JJ No X CONDITION ASSMNT LARGE $402,000 $401, JJ No X S ST INLINE STORAGE $200,000 $183, /2008 JJ No X U & S STS INLINE STORAGE $5,990,068 $134, /2006 JJ No X CSS MISCELLANEOUS REHAB $2,502,383 $137,871 $75,000 $750,000 $1,615,196 $1,566,424 $1,518, JJ Yes X FREMONT AREA REHAB - $450,000 $449, /2009 JJ No X E/F ALLEY SEWER $210,000 $0 $210,000 $0 $0 $0 $ /2010 JJ Yes X /37 ALLEY SEWER $0 $0 $230,000 $0 $0 $0 $ /2010 JJ Yes X TH/ SANTA YNEZ ALLEY $0 $0 $0 $140,000 $0 $0 $ /2010 JJ Yes X O/P ALLEY SEWER $0 $0 $0 $225,000 $0 $0 $ /2010 JJ Yes X MARSHALL WAY SEWER $0 $0 $0 $260,000 $0 $0 $ /2010 JJ Yes X T STREET SEWER $0 $0 $0 $300,000 $0 $0 $ /2010 JJ Yes X FREMONT AREA SEWER $0 $0 $450,000 $0 $0 $0 $ /2011 JJ Yes X CWTP ELECTRICAL $0 $0 $25,000 $0 $0 $0 $ /2011 JJ Yes X CWTP ELECTRICAL MCC L $0 $0 $25,000 $0 $0 $0 $0 JJ Yes Y LANDFILL SITE CLOSURE $7,427,072 $962,352 $217,000 $217,000 $217,000 $217,000 $217, /2012 JJ Yes Detail Sheet Available Projects by Project Number P - 27
410 Budget Est Est Project through Balance FY Complete Number Project Name 6/2009 6/ / / / / /14 Initiated Date Section Y ST. FRANCIS-CLOSURE $900,000 $77, /2010 JJ No Y OLD ELVAS QUARRY $1,335,543 $147, /2010 JJ No Y OLD SACRAMENTO SERVICE $135,000 $39,555 JJ No Y LANDFILL GAS CONTROL $1,950,546 $500, /2008 JJ No Y GROUNDWATER REMEDIATION $441,900 $194, /2008 JJ No Y TH ST LANDFILL PLEDGE $551,100 $551, /2010 JJ No Y MEADOWVIEW CTY SVC $21,985,142 $43, /2001 JJ No Y VEHICLES/ADDITIONAL $1,586,000 $147,554 $0 $200,000 $200,000 $200,000 $200,000 JJ Yes Y DELLAR LANDFILL CLOSURE $0 $0 $500,000 $0 $0 $0 $ /2010 JJ Yes Z WATER SYSTEM MISC $2,065,800 $699,175 $0 $845,001 $825,002 $915,003 $2,764, JJ Yes Z COMMERCIAL WATER METER $5,822,351 $352,843 $350,000 $350,000 $350,000 $350,000 $350, JJ Yes Z WATER PROD MISC IMP $3,321,991 $483, JJ No Z WELL SYSTEM MISC IMPROV $1,361,000 $227,337 $0 $90,000 $90,000 $90,000 $ JJ Yes Z WATER SUPPLY MASTER PLAN $2,839,587 $72,332 $250,000 $100,000 $100,000 $100,000 $100, JJ Yes Z SAC RIVER SOURCE WATER $1,238,936 $84,523 $70,000 $102,000 $60,000 $60,000 $ JJ Yes Z SAC RIVER - KEEP OUR $145,000 $25,196 $30,000 $31,000 $31,000 $31,000 $ JJ Yes Z BASE CIP RESERVE-WATER $548,038 $548,038 $400,000 $400,000 $400,000 $400,000 $400, JJ Yes Z BACKFLOW PREVENTION $2,831,913 $593,150 $50,000 $205,000 $205,000 $205,000 $200, JJ Yes Z SCADA SYSTEM UPGRADE $2,726,000 $245,043 $100,000 $100,000 $100,000 $100,000 $100,000 JJ Yes Z SCADA DOWNTOWN IT $20,000 $6,429 JJ No Z SRWTP INTAKE TREE $100,000 $47,643 JJ No Z AMR RIVER SOURCE WATER $687,598 $32,507 $15,000 $24,000 $27,000 $27,000 $ JJ Yes Z AMER RVR - KEEP OUR $135,000 $28,932 $25,000 $26,000 $26,000 $26,000 $ JJ Yes Z LOCAL AREA NETWORK $1,135,000 $167, /2012 JJ No Z UTILITIES ADA IMPROVEMENT $146,000 $94,621 $5,000 $5,000 $5,000 $0 $ /2012 JJ Yes Z DOU FIBER OPTICS $504,832 $203, /2012 JJ No Z DRINKING WATER QUALITY $1,335,996 $41,322 $85,000 $233,000 $341,000 $310,000 $ JJ Yes Z DISTRIBUTION FLUSHING $100,000 $99,351 $50,000 $0 $0 $0 $ /2010 JJ Yes Z SRWTP 9.5 MG RESERVOIR $2,270,000 $13, /2009 JJ No Z SAN JUAN 3MG RESERVOIR $5,240,000 $74, /2003 JJ No Detail Sheet Available Projects by Project Number P - 28
411 Budget Est Est Project through Balance FY Complete Number Project Name 6/2009 6/ / / / / /14 Initiated Date Section Z GROUNDWATER PROTECTION $205,877 $198,719 $62,000 $0 $0 $0 $ /2012 JJ Yes Z UTILITY ENERGY EFFICIENCY $401,840 $278, /2009 JJ No Z ELKHORN 3MG RESERVOIR $7,330,000 $115, /2005 JJ No Z JIBBOOM ST REHAB/PARK $283,000 $175, /2005 JJ No Z H ST RV STL MN RPL 5TH TO $1,799,732 $170, /2004 JJ No Z SRWTP PROP ACQUISITION $239,000 $225, /2006 JJ No Z SAC RVR WTR RELIAB STUDY $3,320,000 $545,428 $210,000 $500,000 $500,000 $500,000 $ /2007 JJ Yes Z H ST RS TM RPL ST $2,224,719 $177, JJ No Z I ST RS TM RPL FRNT-5 ST $2,300,000 $203, JJ No Z FWTP SWITCHGEAR UPGRADE $1,260,000 $199, /2007 JJ No Z SLP SM REPL PH 1 $1,860,000 $71, JJ No Z SRWTP SWITCHGEAR RPL $1,295,000 $421, /2006 JJ No Z FWTP SLUDGE PILOT $760,883 $18, /2007 JJ No Z BUILDING SECURITY SYSTEMS $400,000 $259,297 $0 $5,000 $5,000 $0 $ /2007 JJ Yes Z DOU CAMERAS $231,616 $151, /2007 JJ No Z EL CNTRO RD TM TNK-CTY LMT $1,500,000 $1,433, JJ No Z ASSET MANAGEMENT - WTR $170,000 $91,148 $0 $50,000 $50,000 $50,000 $ /2012 JJ Yes Z RESID WTR MTR PRGM $799,809 $232,007 $0 $9,896,000 $11,096,000 $12,296,000 $13,496, /2010 JJ Yes Z IT PROJECTS $425,000 $393,122 $25,000 $200,000 $200,000 $200,000 $ /2010 JJ Yes Z PLANT SERVICES CMMS $635,000 $141, /2007 JJ No Z FIELD SERVICES CMMS $1,092,000 $18, /2009 JJ No Z TM RPL 13TH-H TO Q ST $4,598,000 $4,297, /2007 JJ No Z FWTP FILTER MOTOR $175,000 $32, /2006 JJ No Z T-MAIN POWER INN RD $1,496,000 $788,266 $500,000 $0 $0 $0 $ /2012 JJ Yes Z T-MAIN ZN40 FLORIN GAP $97,000 $97, /2009 JJ No Z T-MAIN CAL-AMER TO $126,000 $8,751 JJ No Z SWANSTON ESTATES $15,000 $15, /2008 JJ No Z TM REPL 6TH ST I-Q ST $2,000,000 $1,919, JJ No Z SRWTP N VLT MANIFOLD REPL $110,000 $22, /2006 JJ No Z FWTP LOW LFT PMP PH1 $274,000 $80, /2008 JJ No Detail Sheet Available Projects by Project Number P - 29
412 Budget Est Est Project through Balance FY Complete Number Project Name 6/2009 6/ / / / / /14 Initiated Date Section Z SO. LAND PARK DIST MAIN $2,150,000 $682, /2007 JJ No Z FWTP MECHANICAL $1,250,000 $1,244, JJ No Z STOCKTON BLVD T-MAIN R-2ND $3,000,000 $664, JJ No Z T-MAIN JIBBOOM ST STEEL MN $1,336,000 $1,335, JJ No Z T-MAIN 45TH ST R - X STS $1,500,000 $1,439, JJ No Z FWTP CLARIFIER MOTOR CNTL $203,000 $75, JJ No Z TREATMENT PLANTS $515,379 -$ JJ No Z SOUTH SACRAMENTO 3MG $4,016,000 $3,957, /2010 JJ No Z FWTP LOW LIFT PUMP PH 2 $417,000 $48, JJ No Z MAIN AVE TM BLCKRK-RIO LIN $800,000 $665, /2010 JJ No Z FWTP HVAC UPGRADE 3351 $100,000 $100,000 JJ No Z TMAIN CITY COLLEGE RES $200,000 $185, /2008 JJ No Z TREATMENT PLANT REHAB $1,000,000 $999,857 $1,000,000 $0 $0 $0 $ /2010 JJ Yes Z PIPE COND ASSESSMT $500,000 $500, /2009 JJ No Z HOWE AVE PIPE SUPRT $150,000 $134, /2008 JJ No Z TM N CRS TIE ALIGNMENT $130,000 $130, /2009 JJ No Z FWTP INTAKE PHASE 3 $750,000 $749, /2008 JJ No Z ECONOMIC DEVELOPMENT $296,956 $296,956 JJ No Z APP-FIELD SVCS ADMIN BLDG $60,000 $28,105 JJ No Z WHOLESALE CONNECTION FEE $9,494,000 $9,494,000 JJ No Z UNPLANNED CORRECTIVE $480,000 $480,000 -$230,000 $500,000 $500,000 $500,000 $0 JJ Yes Z DISTRIBUTION SYSTEM $250,000 $250,000 JJ No Z SACRAMENTO RIVER WTP $100,000 $100,000 -$100,000 $0 $0 $0 $0 JJ Yes Z FAIRBAIRN WTP GRIT BASIN $100,000 $100,000 JJ No Z SRWTP FLOWMETERS $300,000 $292,247 JJ No Z FAIRBAIRN WTP $60,000 $60,000 -$60,000 $0 $0 $0 $0 JJ Yes Z MAIN REPLACEMENT, 9TH ST - $65,000 $60, /2011 JJ No Z I ST - 11TH TO 23RD ST MAIN $150,000 $150, /2010 JJ No Z NORTH B ST - SRWTP TO 18TH $400,000 $400,000 JJ No Z TH & NORTH B ST TO 19TH $160,000 $160, /2010 JJ No Detail Sheet Available Projects by Project Number P - 30
413 Budget Est Est Project through Balance FY Complete Number Project Name 6/2009 6/ / / / / /14 Initiated Date Section Z WATER FACILITIES SECURITY $60,000 $17, /2009 JJ No Z FY10 ECONOMIC DEVELOP $0 $0 $600,000 $600,000 $600,000 $600,000 $600, /2010 JJ Yes Z WATER METER READING $0 $0 $775,000 $661,000 $612,000 $563,000 $513, /2014 JJ Yes Z ALHAMBRA BOULEVARD RS $0 $0 $450,000 $0 $0 $0 $ /2011 JJ Yes Z WS T-MAIN REPLACEMENT, $0 $0 $50,000 $0 $0 $0 $ /2011 JJ Yes Z WS T-MAIN REPLACEMENT, $0 $0 $50,000 $0 $0 $0 $ /2011 JJ Yes Z WS T-MAIN REPLACEMENT, $0 $0 $50,000 $0 $0 $0 $ /2011 JJ Yes Z SRWTP 5 MG RESERVOIR $0 $0 $20,000 $0 $0 $0 $ /2010 JJ Yes Z CONNECTION TO COUNTY $0 $0 $100,000 $0 $0 $0 $ /2010 JJ Yes Z FLORIN RES. ENGINE 2 $0 $0 $120,000 $0 $0 $0 $ /2010 JJ Yes Z RWM-BOWMAN/WISCONSIN $424,500 $1,249 JJ No Z RWM-PROJECT MGMNT FY07 $182,627 $24,027 $100,000 $0 $0 $0 $ /2010 JJ Yes Z RWM-PUBLIC OUTREACH $108,000 $68,558 $36,000 $0 $0 $0 $ /2010 JJ Yes Z RWM-SERVICE RETROFIT $735,725 $383, JJ No Z RWM-SETTING MTRS ONLY $431,006 $149, JJ No Z RWM-METER RETROFITS FY07 $2,172,000 $6, JJ No Z RWM RETRO 3METER2 56TH/J $1,874,000 $401, /2008 JJ No Z RWM RETRO 3METER4 26TH/D $1,140,000 $450, /2008 JJ No Z RWM PR 2PIPE REPL1 $915,000 $210, /2008 JJ No Z MTR PR 4PR2B SLP PH3 $1,695,000 $1,596, /2008 JJ No Z RWM-BOWMAN/WISCONSIN $414,500 $401, JJ No Z RWM PR 4PIPE REPL3A SO $475,000 $450,000 $1,860,000 $0 $0 $0 $ /2010 JJ Yes Z RWM RETRO 5METER1 CITY $1,935,000 $1,870,224 JJ No Z RWM RETRO 7METER4 $1,635,000 $1,627,591 JJ No Z RWM PIPE REPL 5METER1 CITY $0 $0 $1,450,000 $0 $0 $0 $ /2010 JJ Yes Z RWM PR 5PIPE REPL2 GOLF $0 $0 $650,000 $0 $0 $0 $ /2011 JJ Yes Z RWM RETRO 6METER1 $0 $0 $2,000,000 $0 $0 $0 $ /2010 JJ Yes Z RWM RETRO 8METER6 NORTH $0 $0 $2,600,000 $0 $0 $0 $ /2010 JJ Yes $50,132,411 $39,660,042 $40,985,514 $42,986,743 $45,388,740 Detail Sheet Available Projects by Project Number P - 31
414 CITY OF SACRAMENTO CIP INDEX BY PROGRAM AREA Crosswalk Index Old CIP Number to New ecaps Number: CAPITAL IMPROVEMENT PROGRAM Q
415
416 Old CIP Number New CIP Number Section Detail Sheet Available AA08 A DD No AA61 A DD Yes AA64 A DD Yes AA68 A DD No AB16 A DD No AB26 A DD No AB44 A DD No AB45 A DD No AB51 D DD Yes AB55 A DD No AB66 A DD Yes AB71 A DD Yes AB81 A DD No AB82 A DD No BA01 B DD Yes BB91 B DD No BC36 B DD No BC41 L GG No C175 C DD No C180 C DD No C190 C DD No C192 C DD No C193 C DD No C514 C DD No C706 C DD No C732 C DD No C857 C DD No C858 C DD No CA91 C DD Yes CB24 C DD No CB27 C DD No Old CIP Number New CIP Number C Section Detail Sheet Available CB28 DD No CB33 B DD No CB34 B DD No CB37 B DD No CB38 B DD No CB39 B DD No CB56 C DD Yes CC01 C DD Yes CC04 C DD No CD03 D DD No CE21 C DD Yes CE36 C DD No CE82 A DD No CF02 D DD No CF03 D DD No CF11 M FF No CF41 T II No CF42 T II No CF61 M FF No CF66 M FF No CN02 D DD No CN03 D DD No CN04 D DD No CN06 D DD No CN10 D DD No CN11 D DD No CN12 D DD No CN13 D DD No CN14 D DD No CN15 D DD No CN16 D DD No Old CIP Number New CIP Number D Section Detail Sheet Available CN17 DD No CN18 D DD No DB31 C DD No DB35 C DD No DB36 C DD No DB38 C DD No DB39 C DD No EC21 F EE No EC31 F EE No FB32 F EE Yes FB71 F EE No FB86 F EE Yes FB87 F EE Yes GA13 C DD No HB18 K GG No HB31 K GG Yes HB32 K GG Yes HB41 K GG Yes HB67 K GG No HC06 K GG No HC11 K GG No HC21 K GG No HC26 K GG Yes HC36 K GG No HC46 K GG No HC47 K GG No HC51 K GG No HC61 K GG No HC71 K GG No IA11 M FF Yes IA56 M FF No Old CIP Number New CIP Number M Section Detail Sheet Available IA61 FF No IA66 M FF No KB29 L GG No KC41 L GG No KC48 C DD No KC66 B DD No KC67 B DD No KC81 B DD No KC86 B DD No KD21 B DD No KD31 B DD No KD36 B DD No KD41 B DD No KD42 B DD No KD46 B DD No KD51 B DD No KD56 B DD No KD61 B GG No KD71 B DD No LB97 L GG No LK92 L GG Yes LK97 L GG Yes LL02 L GG Yes LL07 L GG Yes LL13 L GG No LL17 L GG No LL22 L GG No LL27 L GG No LL32 L GG No LL37 L GG No LL42 L GG No Crosswalk Index: Old CIP Number to New ecaps Number Q - 1
417 Old CIP Number New CIP Number Section Detail Sheet Available LL47 L GG No LL52 L GG No LL57 L GG No LL92 L GG Yes LL97 L GG Yes LM03 L GG No LM07 L GG No LM12 L GG No LM17 L GG No LM22 L GG No LM27 L GG No LM32 L GG No LM37 L GG No LM47 L GG Yes LM58 L GG No LN11 L GG No LN64 L GG No LN68 L GG No LN72 L GG No LQ01 L GG No LQ48 L GG No LR67 L GG No LR82 L GG No LS01 L GG No LS03 L GG No LS12 L GG No LS13 L GG No LS48 L GG No LS49 L GG No LS71 K GG No LS78 L GG No Old CIP Number New CIP Number L Section Detail Sheet Available LT18 GG No LT19 L GG No LU04 L GG No LU07 L GG No LU12 L GG No LU38 L GG No LU62 L GG No LV02 L GG No LV31 L GG No LV41 L GG No LV42 L GG No LV56 T II No LV57 T II No LV67 L GG No LV82 L GG No LV94 L GG No LV98 L GG No LW07 L GG No LW26 L GG No LW32 C DD No LW72 L GG No LW81 L GG No LW86 L GG No LX21 L GG No LX26 L GG No LX46 L GG No LX66 L GG No LX72 L GG No LX76 L GG No LX78 L GG No LX97 T II No Old CIP Number New CIP Number L Section Detail Sheet Available LY26 GG No LY36 L GG No LY41 L GG No LY42 L GG No LY53 L GG No LY56 L GG No LY61 L GG No LY62 L GG No LY63 L GG No LY64 L GG No LY66 L GG No LY67 L GG No LY68 L GG No LY69 L GG No LY71 L GG No LY72 L GG No LY73 L GG No LY74 L GG No LY78 L GG No LY81 L GG No LY83 L GG No LZ06 L GG No LZ26 L GG No LZ31 L GG No MA96 M FF No OB61 M FF Yes OB66 B DD No PA51 M FF Yes PC11 M FF Yes PC16 M FF No PC21 M FF Yes Old CIP Number New CIP Number M Section Detail Sheet Available PC26 FF Yes PC46 M FF Yes PC51 M FF No PC56 M FF Yes PC61 M FF No PC66 M FF No PC71 M FF Yes PC76 M FF No QA03 B DD No QA33 B DD No QA36 B DD No RA26 R II No RA32 R II No RA33 R II No RA37 R II No RA38 R II No RC46 R II No RG26 R II No RG76 T II No RH01 R II No RH31 R II No RH40 R II No RI21 R II No RI26 T II No RJ01 R II No RJ27 T II No RJ81 T II No RK01 T II No RK03 T II No RK04 T II No RK07 T II No Crosswalk Index: Old CIP Number to New ecaps Number Q - 2
418 Old CIP Number New CIP Number Section Detail Sheet Available RK08 T II No RK21 R II No RO01 T II No RR01 R II No RR06 S II No RR16 T II No RR26 T II No RR32 T II No RR33 T II No RR34 T II No RR35 T II No RR36 T II No RR37 T II No RR38 T II No RR41 T II No RR46 T II No RR51 T II No RR56 T II No SB96 T II No SH89 S II No SI41 T II No SI61 T II No SJ96 T II No SK01 T II No SK12 T II No SK61 T II No SL01 T II No SL26 S II No SM01 S II Yes SM21 S II No SN31 T II No Old CIP Number New CIP Number T Section Detail Sheet Available SO71 II No SP56 T II No SQ06 S II No SR01 S II No SR72 S II No SR76 S II No SR81 S II No SR86 S II No SS01 R II No SS71 R II No SS72 R II No SS73 R II No ST26 S II No ST31 T II No ST36 S II No SU06 T II No SU16 T II No SU31 T II No TE01 T II No TE02 T II No TF76 T II No TG86 T II No TG94 T II No TH16 T II No TI11 T II No TI16 S II No TI21 T II No TJ94 T II No TK81 T II No TK86 T II No TK87 T II No Old CIP Number New CIP Number T Section Detail Sheet Available TL63 II No TM76 T II No TN40 S II No TN50 S II No TN63 S II No TN71 S II No TN72 S II No TN73 S II No TN74 S II No TN81 S II No TN82 S II No TN83 S II No TN84 S II No TN85 S II No TN86 S II No TN87 S II No TN88 S II No TP06 T II No TP07 T II No TP08 T II No TR36 T II No TR41 T II No TR61 T II No TR71 T II No TR81 T II No TR91 T II No TS11 T II No TS31 S II No TS40 S II No TS41 S II No TS76 S II No Old CIP Number New CIP Number S Section Detail Sheet Available TT61 II No TU07 T II No TU37 T II No TU38 T II No TU91 T II No TV01 S II No TV11 T II No TV16 T II No TV31 T II No TV46 T II No TV61 T II No TV76 T II No TV96 T II No TW16 T II Yes TW21 T II No TW65 T II No TW76 T II No TW81 T II No TW86 T II No TX01 T II No TX56 T II No TX81 T II No TX96 T II No TX97 T II No TY31 T II No TY46 T II No TZ01 T II No TZ02 T II No TZ71 T II No VD26 V II Yes VD41 V II No Crosswalk Index: Old CIP Number to New ecaps Number Q - 3
419 Old CIP Number New CIP Number Section Detail Sheet Available VD46 V II No VD51 V II Yes VD56 V II No VD72 V II No VD82 V II Yes VD86 V II No VD91 V II Yes VD96 V II Yes VE06 V II No VE11 V II No WB16 W JJ No WE23 W JJ No WE71 W JJ No WE76 W JJ No WG01 W JJ Yes WG06 W JJ Yes WI71 W JJ No WJ96 W JJ No WK06 W JJ No WL51 W JJ No WM16 W JJ No WM21 W JJ No WM46 W JJ No WM56 W JJ No WM66 W JJ No WN11 W JJ No WN16 W JJ No WN21 W JJ No WN26 W JJ No WN41 W JJ No WN46 W JJ No Old CIP Number New CIP Number W Section Detail Sheet Available WN51 JJ No WN61 W JJ No WN66 W JJ No WN76 W JJ No WN81 W JJ No WN86 W JJ No WN91 W JJ No WN96 W JJ No WO06 W JJ No WP01 W JJ No WP06 W JJ No WP11 W JJ No WP16 W JJ No WP21 W JJ No WP26 W JJ No WP31 W JJ No WP36 W JJ No WP41 W JJ No XB16 X JJ Yes XB21 X JJ Yes XB46 X JJ Yes XE01 X JJ Yes XE06 X JJ No XI01 X JJ No XI06 X JJ No XI16 X JJ No XI41 X JJ No XI46 X JJ No XI51 X JJ No XI61 X JJ No XI66 X JJ No Old CIP Number New CIP Number X Section Detail Sheet Available XI71 JJ No XI76 X JJ No XI81 X JJ No XI86 X JJ No XI91 X JJ No XI96 X JJ No XJ01 X JJ No XJ11 X JJ Yes XJ16 X JJ No XJ21 X JJ No XJ26 X JJ No XJ31 X JJ No XM25 X JJ Yes XM78 X JJ No XM79 X JJ No XM97 X JJ No XN15 X JJ No XN23 X JJ No XN24 X JJ No XN25 X JJ No XN28 X JJ No XN30 X JJ No XN31 X JJ No XN32 X JJ No XN33 X JJ No XN34 X JJ No XN35 X JJ No XN36 X JJ No XN38 X JJ No XN39 X JJ No XN40 X JJ No Old CIP Number New CIP Number X Section Detail Sheet Available XN41 JJ No XN42 X JJ No XN43 X JJ No XN44 X JJ Yes XN45 X JJ No XN46 X JJ No XN47 X JJ No XN48 X JJ No XN50 X JJ No XN51 X JJ No XN52 X JJ No XN54 X JJ No XN55 X JJ No XN56 X JJ No XN59 X JJ No XN60 X JJ No XO03 X JJ No XO06 X JJ No YA06 Y JJ Yes YA07 Y JJ No YA08 Y JJ No YA26 Y JJ No YA36 Y JJ No YB36 Y JJ No YB37 Y JJ No YB56 Y JJ No YB61 Y JJ Yes ZB31 Z JJ Yes ZB46 Z JJ Yes ZB71 Z JJ No ZD26 Z JJ Yes Crosswalk Index: Old CIP Number to New ecaps Number Q - 4
420 Old CIP Number New CIP Number Section Detail Sheet Available ZD36 Z JJ Yes ZE31 Z JJ Yes ZE32 Z JJ Yes ZE46 Z JJ Yes ZF26 Z JJ Yes ZF36 Z JJ Yes ZF37 Z JJ No ZF58 Z JJ No ZF61 Z JJ Yes ZF62 Z JJ Yes ZG11 Z JJ No ZG86 Z JJ Yes ZG91 Z JJ No ZH22 Z JJ No ZH41 Z JJ Yes ZH42 Z JJ Yes ZH51 Z JJ No ZI36 Z JJ No ZI91 Z JJ Yes ZJ01 Z JJ No ZJ36 Z JJ No ZJ46 Z JJ No ZJ51 Z JJ No ZJ56 Z JJ No ZJ76 Z JJ Yes ZJ86 Z JJ No ZJ91 Z JJ No ZJ96 Z JJ No ZK01 Z JJ No ZK06 Z JJ No ZK11 Z JJ No Old CIP Number New CIP Number Z Section Detail Sheet Available ZK21 JJ Yes ZK26 Z JJ No ZK31 Z JJ No ZK61 Z JJ Yes ZK66 Z JJ Yes ZK71 Z JJ Yes ZK72 Z JJ No ZK73 Z JJ No ZK76 Z JJ No ZK81 Z JJ No ZK91 Z JJ Yes ZK96 Z JJ No ZL01 Z JJ No ZL06 Z JJ No ZL11 Z JJ No ZL16 Z JJ No ZL21 Z JJ No ZL26 Z JJ No ZL31 Z JJ No ZL41 Z JJ No ZL46 Z JJ No ZL51 Z JJ No ZL56 Z JJ No ZL61 Z JJ No ZL66 Z JJ No ZL71 Z JJ No ZL86 Z JJ No ZL91 Z JJ Yes ZL96 Z JJ No ZM01 Z JJ No ZM06 Z JJ No Old CIP Number New CIP Number Z Section Detail Sheet Available ZM11 JJ No ZM16 Z JJ No ZO06 Z JJ No ZS02 Z JJ No ZS04 Z JJ Yes ZS05 Z JJ No ZS07 Z JJ No ZS08 Z JJ No ZS09 Z JJ No ZS10 Z JJ No ZS11 Z JJ No Old CIP Number New CIP Number Section Detail Sheet Available Crosswalk Index: Old CIP Number to New ecaps Number Q - 5
421 CITY OF SACRAMENTO GLOSSARY ocation Plan: A financial plan used to allocate resources among program operations, which lists an estimate of required expenditures and the means of financing them for the fiscal year. Americans with Disabilities Act of 1990 (ADA): A federal law providing for a wide range of protection to individuals with disabilities ranging from prohibitions against discrimination in employment to specific requirements for modifications of public facilities and transportation systems. Appropriation: An authorization by the City Council, which permits officials to incur obligations and expend City resources within a fiscal year. Assessment District: A separate local government agency formed to provide specific services. Property owners within the Assessment District boundary pay the district in proportion to the benefits or services they receive. Budget: An annual financial plan consisting of proposed expenditures for specified purposes and the proposed means for financing them. Budget through 6/2009: Reflects the total project funding from all funding sources. In some situations, funds are moved into sub- CIP projects to allow for better project management and accounting. Capital Improvements: Construction or major repair of City buildings and facilities such as streets, roads, storm drains, traffic signals, parks, community centers, etc. Capital Project: A specific undertaking involving procurement, construction or installation of facilities or related equipment which improves, preserves, enhances or modernizes the City's provision of municipal services, has a useful life of at least five years, and costs in excess of $20,000. Carryover: Appropriated funds remaining unspent at the end of the fiscal year, which are allowed to be retained by the department to which they were appropriated so that they may be expended in the next fiscal year. Certificates of Participation (C.O.P.s): Debt instrument, commonly called C.O.P., that provides long-term financing through a lease (with an option to purchase) or through an installment agreement. Construction Engineering: Engineering work during the construction process. This ensures that projects are constructed in accordance with design parameters and specifications. Continuing Project: Project which is not completed within the fiscal year initially budgeted. Unobligated or unspent project budget is carried forward and is available for expenditure in the next fiscal year. Debt Financing: Issuance of bonds and other debt instruments to finance municipal improvements and services. Debt Service: The costs of paying the principal and interest on borrowed money according to a predetermined payment schedule. Defund: Any unspent balance for a completed project is zeroed out, added back into the originating fund balance, and is available for appropriation to another project. Design Engineering: The process of identifying project options, developing a project scope, conducting feasibility analyses, and creating plans, specifications and estimates for a capital improvement. ecaps: electronic Citywide Accounting and Personnel System (ecaps): New Enterprise Resource Management system implemented in 2007 and 2008 to manage all City financial, human resource, and payroll transactions. Encumbrance: An amount of money committed for the payment of goods ordered but not yet received. Enterprise Funds: A governmental facility or service that is self-supporting through fee and charge revenues. Used to account for the City's ongoing activities that are similar to those found in the private sector, e.g. solid waste management, water utilities, sewer utilities, etc. Expenditures: The cost for personnel, materials, equipment, and contractual obligations required for a department to operate or for a capital program to be completed. Fiscal Year: A time period designated by the City signifying the beginning and ending period for recording financial transactions. Sacramento has a fiscal year July 1-June 30. Fund: An accounting entity with a selfbalancing set of accounts recording financial resources and transactions for specific activities. Fund Balance: The difference between the assets and liabilities of a fund at any given point in time. General Fund: Fund used to account for all financial resources except those required to be accounted for in another fund (e.g., enterprise or grant funds). Grants: Contributions of cash or other assets from another governmental agency to be used or expended for a specific purpose. Inflationary Increase: An adjustment made to reflect current year or estimated future year national or regional change to categories of expense. Generally, inflationary increases are based on the Consumer Price Index (CPI). Lighting and Landscaping Act of 1972: The 1972 Act lets cities, counties and special districts levy assessments for land purchase and construction, operation and maintenance of parks, landscaping, lighting, traffic signals, and graffiti abatement. Ordinance: A formal legislative enactment by the governing board of a municipality. If it is not in conflict with any higher form of law, it has the full force and effect of law within the boundaries of the municipality to which it applies. Program: A logical grouping of capital projects according to type of projects completed; i.e. public safety, transportation. Project Detail Sheet: A summary page for a single project detailing project need, objective, and budget. Resources: Total dollars available for appropriations including estimated revenues, fund transfers, and beginning fund balances. Safe, Accountable, Flexible, Efficient Transportation Equity Act (SAFETEA-LU: The federal transportation program authorizing the expenditure of $286.4 billion over five years and providing states with the flexibility to set their own transportation priorities and explore creative financing mechanisms within certain guidelines. Special Funds: Account for the proceeds of specific revenue sources that are restricted by law to expend for specific purposes. Subprogram: A more defined grouping of capital projects within each Program; i.e. within the Transportation Program, Subprograms include Street Maintenance, Street Improvements, Signals/Lighting, and Parking. User Charges/Fees: The payment of a fee for direct receipt of a public service by the party benefiting from the service CAPITAL IMPROVEMENT PROGRAM R - 1
422 CAPITAL IMPROVEMENT PROGRAM R - 2

423

424

425

426

427

428

429

430

431

432

433

434

435


436

437
438

439

440

441


442

443


444


445
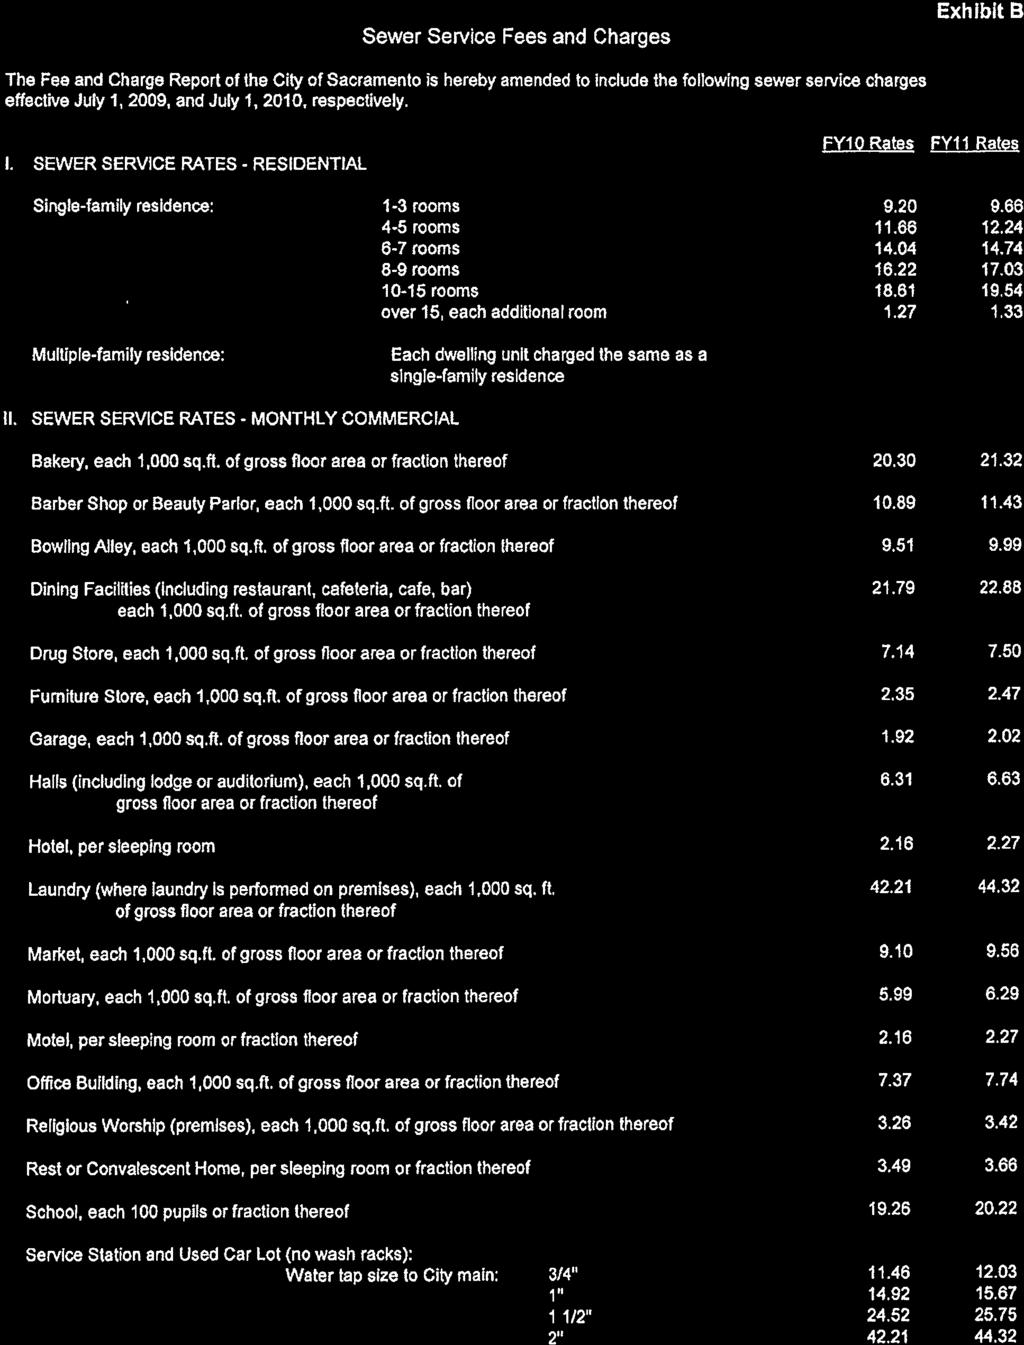
446


447


448


449
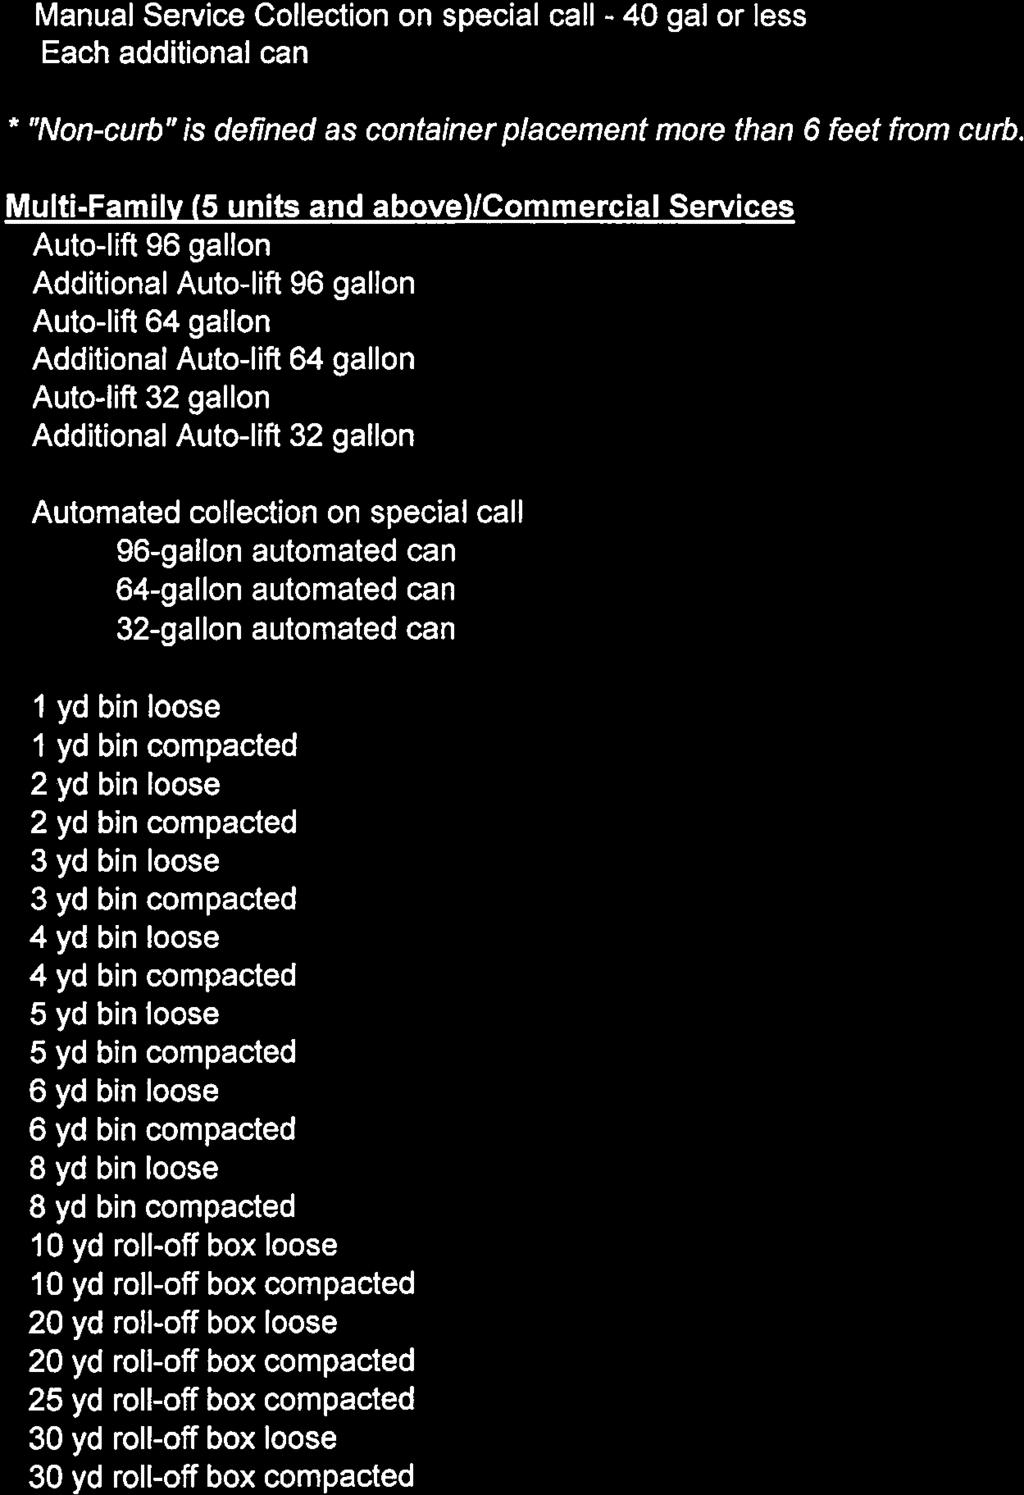


450

451


452
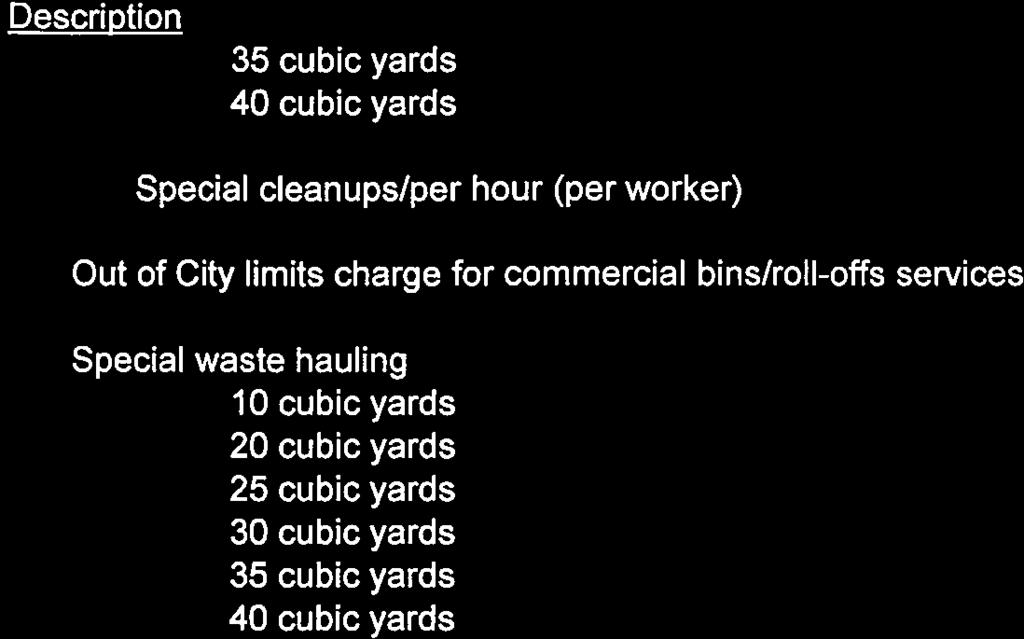


453

454


455


456 KEVIN JOHNSON Mayor Raymond L. Tretheway III Councilmember, District 1 Sandy Sheedy Councilmember, District 2 STEVE COHN Councilmember, District 3 Robert King Fong Councilmember, District 4 Lauren R. Hammond Vice Mayor Councilmember, District 5 Kevin McCarty Councilmember, District 6 Robbie Waters Councilmember, District 7 Facts The was founded in 1849 and is the oldest incorporated city in California. In 1920, city voters adopted a Charter (municipal constitution) and a City Council/City Manager form of government. The City is divided into eight districts. Elected members of the City Council serve a four-year term. The Mayor is elected by all voters in the City. In 2002, voters approved a measure for the Mayor to serve full-time. other Councilmembers are elected by district and serve part-time. The Mayor and other Councilmembers have an equal vote in all matters. The currently encompasses approximately 99 square miles. The current estimated population is 475,750. Bonnie J. Pannell Councilmember, District 8 Ray Kerridge City Manager
CITY OF SACRAMENTO CALIFORNIA. April 27, 2012
 OFFICE OF THE CITY MANAGER CALIFORNIA April 27, 2012 CITY HALL 5 th FLOOR 915 I STREET SACRAMENTO, CA 95814-2684 PH 916-808-5704 FAX 916-808-7618 Honorable Mayor and City Council Sacramento, California
CAPITAL IMPROVEMENT PROGRAM K-1
 Fund # begins with a Fund Type Fund Type Description/Restrictions 1 General The City's principal operating fund, which is supported by taxes and fees and which, generally, has no restrictions on its use.
CAPITAL IMPROVEMENT PROGRAM K-1
 Fund # begins with a Fund Type Fund Type Description/Restrictions 1 General The City's principal operating fund, which is supported by taxes and fees and which, generally, has no restrictions on its use.
Projects Receiving New Funding by. Funding Source and Project Number
 20172022 Approved Capital Improvement Program s Receiving New Funding by Funding Source and Number 1001 GENERAL FUND A04000100 A07000300 A07000400 CITY CLER AUTOMATION IT EQUIPMENT REPLACEMENT CITYWIDE
CAPITAL IMPROVEMENT PROGRAM K-1
 Fund # begins with a Fund Type Fund Type Description/Restrictions 1 General The City's principal operating fund that is supported by taxes and fees and which, generally, has no restrictions on its use.
City Council Report 915 I Street, 1 st Floor Sacramento, CA
 City Council Report 915 I Street, 1 st Floor Sacramento, CA 95814 www.cityofsacramento.org File ID: 2017-01623 January 9, 2018 Consent Item 04 Title: Mitigation Fee Act Annual Report for the Year Ending
Chapter VIII. General Plan Implementation A. INTRODUCTION B. SUBMITTAL AND APPROVAL OF SUBSEQUENT PROJECTS C. SPHERE OF INFLUENCE
 Chapter VIII General Plan Implementation A. INTRODUCTION This chapter presents a variety of tools available to the (City) to help build the physical city envisioned in Chapter III. While the Modesto provides
FY2014/15 Approved Budget. SECTION 22 Citywide and Community Support
 22 SECTION 22 Citywide and Community Support 185 Citywide and Community Support Debt Service The Debt Service Program finances the cost of capital improvements through revenue bonds, capital leases, notes
Public Works and Development Services
 City of Commerce Capital Improvement Program Prioritization Policy Public Works and Development Services SOP 101 Version No. 1.0 Effective 05/19/15 Purpose The City of Commerce s (City) Capital Improvement
Central City Impact Fee
 Central City Impact Fee Fee Breakdown For Projects Currently In The Area Subject To The Downtown Transportation Impact Fee Net Increase Residential (per unit) Retail (per bldg. sqft) Office (per bldg.
FY2017/18 Approved Budget. SECTION 14 Finance
 14 SECTION 14 Finance 169 Finance The mission of the Finance Department is to educate, inform, and provide excellent internal and external customer service with integrity, efficiency, and quality. The
Revised Public Review Draft Report
 Revised Public Review Draft Report Central City Specific Plan Public Facilities Finance Plan Prepared for: City of Sacramento Prepared by: Economic & Planning Systems, Inc. (EPS) February 6, 2018 EPS #152140
City of Sacramento. Proposed Budget in Brief FISCAL YEAR 2016/17 CITY OF SACRAMENTO PROPOSED BUDGET IN BRIEF 2016/17
 City of Sacramento Proposed Budget in Brief FISCAL YEAR 2016/17 CITY OF SACRAMENTO PROPOSED BUDGET IN BRIEF 2016/17 1 FISCAL YEAR 2016/17 The Total Budget: $961.1 million The Proposed Budget reflects the
CONVENTION, CULTURE AND LEISURE PROGRAM OVERVIEW
 CITY OF SACRAMENTO CONVENTION, CULTURE AND LEISURE PROGRAM OVERVIEW INTRODUCTION The Convention, Culture and Leisure Department includes the following: Convention Center Complex, Capital City Golf, Sacramento
Capital Improvement Projects
 Capital Improvement Projects This section highlights the Capital Improvement Program (CIP) projects proposed for FY 2017-2018. Capital projects are designed to enhance the City s infrastructure, extend
City of Sacramento Annual Continuing Disclosure Report Fiscal Year 2013/14
 City of Sacramento Annual Continuing Disclosure Report Fiscal Year 2013/14 Issue Sacramento City Financing Authority 1999 Capital Bonds (Solid Waste and Redevelopment Projects) Par $ 71,180,000 Issued
CITY OF SALEM FINANCIAL SUMMARY
 CITY OF SALEM FINANCIAL SUMMARY Through Q2 / FY 2015-16 Financial summaries through the second quarter of each year complement development of both the five-year forecast for the General Fund and the upcoming
LEGEND Bridges Parks Fire Stations Project Locations Libraries Schools A
 LEGEND Bridges Parks Fire Stations Project Locations Libraries Schools A Aid to Construction Fund The Aid to Construction Fund (Water) are funds received from customers for requested water service and
FY2014/15 Approved Budget. SECTION 13 Finance
 13 SECTION 13 Finance 129 Finance The mission of the Finance Department is to educate, inform, and provide excellent internal and external customer service with integrity, efficiency, and quality. The
FY2016/17 Approved Budget. SECTION 5 Budget Schedules
 5 SECTION 5 Budget Schedules 85 Schedule 1A Current Operations Appropriations by Fund (in 000s) FY2013/14 FY2014/15 FY2015/16 FY2015/16 FY2016/17 Change Actuals Actuals Approved Amended Approved Amended/Approved
City of Sacramento City Council 915 I Street, Sacramento, CA,
 City of Sacramento City Council 915 I Street, Sacramento, CA, 95814 www.cityofsacramento.org Meeting Date: 1/18/2011 Title: Mack Road Median Fence Improvement (T15116700) Report Type: Consent 4 Report
Comprehensive Annual Financial Report Fiscal Year Ended June 30, 2016
 CITY OF SACRAMENTO FACTS Mayor The City of Sacramento was founded in 1849 and is the oldest incorporated city in California. ANGELIQUE ASHBY Councilmember, District 1 ALLEN WARREN Councilmember, District
ACTION STRATEGIES. Aurora Places is the guidebook
 ACTION STRATEGIES Aurora Places is the guidebook for growth and development throughout city for the next 20 years. It outlines specific recommendations to successfully use the plan on a daily basis. This
1. I N T R O D U C T I O N
 INTRODUCTION The Chico 2030 General Plan is a statement of community priorities to guide public decisionmaking. It provides a comprehensive, long-range, and internally consistent policy framework for the
SACRAMENTO COUNTY MEASURE B TRANSPORTATION SALES TAX EXPENDITURE PLAN ( )
") THE ROAD MAINTENANCE & TRAFFIC RELIEF ACT OF 2016 NATOMAS ELVERTA ANTELOPE RIO LINDA NORTH HIGHLANDS SACRAMENTO COUNTY MEASURE B TRANSPORTATION SALES TAX EXPENDITURE PLAN (2017-2047) CITRUS HEIGHTS ORANGEVALE
THE ROAD MAINTENANCE & TRAFFIC RELIEF ACT OF 2016 NATOMAS ELVERTA ANTELOPE RIO LINDA NORTH HIGHLANDS SACRAMENTO COUNTY MEASURE B TRANSPORTATION SALES TAX EXPENDITURE PLAN (2017-2047) CITRUS HEIGHTS ORANGEVALE
Meetings of Sacramento City Council Redevelopment Agency Housing Authority Financing Authority
 Meetings of Sacramento City Council Redevelopment Agency Housing Authority Financing Authority Agenda Tuesday, May 6, 2008 City Hall-915 I Street, 1 st Floor Council Chamber Published by the Office of
City of Sacramento City Council 915 I Street, Sacramento, CA,
 City of Sacramento City Council 915 I Street, Sacramento, CA, 95814 www.cityofsacramento.org Meeting Date: 2/15/2011 Report Type: Consent Title: FY2010/11 s to the Utilities Capital Improvement Program
POLICY TOPIC PAPER 1.0: SPECIFIC PLANS AND SPECIAL PLANNING AREAS
 POLICY TOPIC PAPER 1.0: SPECIFIC PLANS AND SPECIAL PLANNING AREAS BACKGROUND The City uses a number of tools to guide and manage development. In addition to the General Plan, there are a number of Specific
CITY. RIALTO W w w. R I a l t o c a. g o v. Fiscal Year 2009/10 Interim Financial Report. 5 months ended November 30, 2009
 CITY of RIALTO W w w. R I a l t o c a. g o v Fiscal Year 2009/10 Interim Financial Report 5 months ended November 30, 2009 To: The Mayor and City Council City Administrator From: Chief Financial Officer
EXHIBIT A. The Road Maintenance & Traffic Relief Act of 2016 Sacramento County Measure B Transportation Sales Tax Expenditure Plan ( )
") EXHIBIT A The Road Maintenance & Traffic Relief Act of 2016 Sacramento County Measure B Transportation Sales Tax Expenditure Plan (2017-2047) I. Implementation Guidelines A. Revenue Estimates and Distribution.
EXHIBIT A The Road Maintenance & Traffic Relief Act of 2016 Sacramento County Measure B Transportation Sales Tax Expenditure Plan (2017-2047) I. Implementation Guidelines A. Revenue Estimates and Distribution.
CAPITAL IMPROVEMENTS ELEMENT GOALS, OBJECTIVES AND POLICIES. Goal 1: [CI] (EFF. 7/16/90)
![CAPITAL IMPROVEMENTS ELEMENT GOALS, OBJECTIVES AND POLICIES. Goal 1: [CI] (EFF. 7/16/90)](/thumbs/93/114312533.jpg "CAPITAL IMPROVEMENTS ELEMENT GOALS, OBJECTIVES AND POLICIES. Goal 1: [CI] (EFF. 7/16/90)") CAPITAL IMPROVEMENTS ELEMENT GOALS, OBJECTIVES AND POLICIES Goal 1: [CI] (EFF. 7/16/90) To use sound fiscal policies to provide adequate public facilities concurrent with, or prior to development in order
CAPITAL IMPROVEMENTS ELEMENT GOALS, OBJECTIVES AND POLICIES Goal 1: [CI] (EFF. 7/16/90) To use sound fiscal policies to provide adequate public facilities concurrent with, or prior to development in order
FY2013/14 CONVENTION, CULTURE, AND LEISURE PROGRAM Total Programming by Fund (in 000s) $1,765. Golf $15. Community Center $1,700
 $1,765. Golf $15. Community Center $1,700") CITY OF SACRAMENTO CONVENTION, CULTURE, AND LEISURE PROGRAM OVERVIEW INTRODUCTION The Convention, Culture, and Leisure Program delivers accessible arts, leisure, and educational experiences to enrich people
CITY OF SACRAMENTO CONVENTION, CULTURE, AND LEISURE PROGRAM OVERVIEW INTRODUCTION The Convention, Culture, and Leisure Program delivers accessible arts, leisure, and educational experiences to enrich people
Policy CIE The following are the minimum acceptable LOS standards to be utilized in planning for capital improvement needs:
 Vision Statement: Provide high quality public facilities that meet and exceed the minimum level of service standards. Goals, Objectives and Policies: Goal CIE-1. The City shall provide for facilities and
CAPITAL IMPROVEMENT ELEMENT Inventory Analysis
 CAPITAL IMPROVEMENT ELEMENT Inventory Analysis 2.191 INTRODUCTION The principal purpose of this element is to identify the capital improvements that are needed to implement the comprehensive plan and ensure
SUMMARY OF SERVICES BY STRATEGIC PRIORITY
 Public Safety City Attorney's Office Municipal Prosecution $2,287,153 $2,343,199 $2,287,153 $2,343,199 Police Legal Liaison $768,508 $785,703 $768,508 $785,703 Court and Detention Services Adjudication
PUBLIC FACILITIES ELEMENT
 PUBLIC FACILITIES ELEMENT E l C e n t r o G e n e r a l P l a n This Implementation Program provides actions to implement the adopted policies and plans identified in the Public Facilities Element. The
RESOLUTION NO Adopted by the Sacramento City Council. May 12, 2011
 RESOLUTION NO. 2011-272 Adopted by the Sacramento City Council May 12, 2011 AMENDMENT TO THE TRANSPORTATION DEVELOPMENT ACT CLAIM FOR FISCAL YEAR 2010/11 BACKGROUND: A. The Transportation Development Act
glenmont sector plan S C O P E O F W O R K J AN U A R Y MONTGOMERY COUNTY PLANNING DEPARTMENT M-NCPPC MontgomeryPlanning.
 glenmont sector plan S C O P E O F W O R K J AN U A R Y 2 0 1 2 MONTGOMERY COUNTY PLANNING DEPARTMENT M-NCPPC MontgomeryPlanning.org glenmont sector plan S C O P E O F W O R K 1 glenmont sector plan Scope
SUMMARY OF SERVICES BY STRATEGIC PRIORITY
 Public Safety Building Services Security Service for City Facilities $4,196,367 $4,262,299 $4,196,367 $4,262,299 City Attorney's Office Municipal Prosecution $2,343,624 $2,397,112 $2,343,624 $2,397,112
Community Budget Priorities FY
 Community Budget Priorities FY 2014-15 The City is seeking the community s input on priorities for the upcoming Fiscal Year. This presentation gives an overview of the City s budget, as well as the financial
RESOLUTION - APPROVING FINAL FISCAL YEAR BUDGET
 ITEM 12 TO: FROM: SUBJECT: Sacramento Area Flood Control Agency Board of Directors Richard M. Johnson, Executive Director (916) 874-7606 RESOLUTION - APPROVING FINAL FISCAL YEAR 2015-16 BUDGET OVERVIEW:
SRCSD Final Budget
 SRCSD 2006-07 Final Budget SRCSD Service Area Contents Organizational Chart.................................................................... 4 Board of Directors.......................................................................
EXPENDITURE AND PROPERTY TAX OVERVIEW
 EXPENDITURE AND PROPERTY TAX OVERVIEW The City of Dallas has been consistently recognized for its judicious management of financial resources. An excellent bond rating, steady tax rate, and fair fee structures
Resident Strategic Plan Input Report
 City of Warrenville, Illinois Strategic/Economic Development Plan DuPage Forest Preserve Warrenville Grove Bridge Report 1 Resident Strategic Plan Input Report Page Intentionally Left Blank for Double-Sided
City of Phoenix, Arizona. Monthly Financial Report
 City of Phoenix, Arizona Monthly Financial Report March 212 Monthly Financial Report March 212 Executive Summary The budget amounts in this report represent the official adopted budget, as approved by
REGIONAL EVALUATION FRAMEWORK 1.0 INTRODUCTION 2.0 PURPOSE 3.0 DEFINITIONS. Edmonton Metropolitan Region Planning Toolkit
 Edmonton Metropolitan Region Planning Toolkit Re-imagine. Plan. Build. Edmonton Metropolitan Region Growth Plan 1.0 INTRODUCTION On October 26, 2017, the Government of Alberta approved the Edmonton Metropolitan
City of San Mateo San Mateo, California
 City of San Mateo San Mateo, California Comprehensive Annual Financial Report For the Year Ended June 30, 2005 The City provides a full range of municipal services. These include police and fire
City of Tarpon Springs, Florida
 City of Tarpon Springs, Florida Comprehensive Annual Financial Report Fiscal Year Ended September 30, 2018 CITY OF TARPON SPRINGS, FLORIDA COMPREHENSIVE ANNUAL FINANCIAL REPORT For the Fiscal Year Ended
FINANCIAL REPORT. Report o verv. ~ ~~W - August General Fund Governmental Capital Fund. Water Fund Sewer Fund
 ~,.;!\.city~~---.'. _. T1i~~rl)~on -.,-' ''"---,--~ ~-- Report o verv. ~ ~~W - FINANCIAL REPORT ~:-----~ ;-;;:.-. '. August 2018 General Fund Governmental Capital Fund Water Fund Sewer Fund Thornton Development
CITY OF LIVINGSTON ORGANIZATIONAL STRATEGIC PLAN APPROVED 05 MARCH 2019
 CITY OF LIVINGSTON ORGANIZATIONAL STRATEGIC PLAN 2019- APPROVED 05 MARCH 2019 What is an Organizational Strategic Plan? Strategic planning is an organizational management activity that is used to set priorities,
VILLAGE OF NEW MARYLAND 2015 GENERAL OPERATING FUND BUDGET. 1. Total Budget - Total Page 17 $4,466,360
 1. Total Budget - Total Page 17 $4,466,360 2. Less: Non-Tax Revenue - Total Page 7 $311,392 3. Net Budget $4,154,968 4. Less: Community Funding and Equalization Grant $6,108 5. Warrant to be Raised by
TRANSPORTATION EXECUTIVE SUMMARY
 EXECUTIVE SUMMARY The Sacramento County Department of Transportation (SACDOT) is responsible for improving, operating and maintaining the transportation infrastructure of the Unincorporated Area of the
METRO AIR PARK COUNTY OF SACRAMENTO
 PUBLIC FACILITIES FINANCING PLAN METRO AIR PARK COUNTY OF SACRAMENTO Prepared for the Hearing of the Board of Supervisors On December 11, 2007 DECEMBER 11, 2007 COUNTY OF SACRAMENTO METRO AIR PARK PROJECT
Chapter 5. REMAINING REVIEW FACTORS
 Chapter 5. REMAINING REVIEW FACTORS Section 5.1 Finance Constraints and Opportunities Chapter 5 REMAINING REVIEW FACTORS Introduction The remaining review factors required by the Cortese Knox Hertzberg
EVANSTON. FY 2019 Proposed Budget Presentation. October 22, City Manager s Office
 EVANSTON FY 2019 Proposed Budget Presentation October 22, 2019 1 2019 BUDGET PRESENTATION Today FY 2019 Budget Overview Budget Balancing Worksheet Proposals Capital Improvements Plan Overview Upcoming
Self-Supported Municipal Improvement districts
 Self-Supported Municipal Improvement districts Combined Annual Report Downtown Highland Park Ingersoll Sherman Hill June 30, 2012 FAQ s What is a self-supported municipal improvement district or SSMID?
City of Des Moines. Citizen Engagement Capital Improvement Program. November 29, 2016
 City of Des Moines Citizen Engagement Capital Improvement Program November 29, 2016 Goals of Citizen Engagement Goal Focus on service levels Department definitions of adequate service and opportunities
TOWNSHIP OF UPPER ST. CLAIR LONG-TERM PLAN
 FIVE YEAR PROJECTION FIVE YEAR PROJECTION OVERVIEW The Five Year Projection for all Township Funds is a tool in which the Board of Commissioners and Township Staff can monitor potential funding impacts
2017 Preliminary Operating and Capital Budgets. November 22, 2016
 2017 Preliminary Operating and Capital Budgets November 22, 2016 1 Overview Budget Consultation Public Engagement Multi Year Budget View Budget Priorities Preliminary Operating and Capital Budgets Future
City of Stockton Page 1
 City of Stockton City Council Special Meeting Meeting Agenda - Final City Council Special Michael D. Tubbs Mayor/Chair Elbert H. Holman Jr. Vice Mayor/Vice Chair (District 1) Daniel R. Wright (District
Your Consultant Team
 Your Consultant Team Kimley Horn Keith Greminger, Jared Schneider, Dawn Dodge Fred Hearns Tours, LLC Fred Hearns Ferrell Redevelopment Stephanie Ferrell Urbanomics Ken Creveling, Tony Mondae Community
I $82.0. To: The Honorable Mayor and Members of the Dallas City Council
 ~ City of Dallas To: The Honorable Mayor and Members of the Dallas City Council The FY 2013-14 proposed budget is balanced and reflects a fiscally responsible approach to address the challenges and leverage
GUIDE TO THE OPERATING BUDGET
 GUIDE TO THE OPERATING BUDGET I. INTRODUCTION Why This Guide? The purpose of this guide is to explain Anchorage's operating budget process and how to read the forms contained in the budget document. Budgets
INTRODUCTION INTRODUCTION 1
 INTRODUCTION The provides a blueprint for the future growth and development of the City in the coming decade. The Comprehensive Plan is long-range in scope and represents a comprehensive update of the
TOWN OF CARY CAPITAL IMPROVEMENTS BUDGET OVERVIEW FOR FISCAL YEAR 2015
 TOWN OF CARY CAPITAL IMPROVEMENTS BUDGET OVERVIEW FOR FISCAL YEAR 2015 The Capital Improvements Budget/Plan Process Each year, staff prepares a capital improvements budget and a long range capital improvements
SPECIAL REVENUE FUNDS
 SPECIAL REVENUE FUNDS INTEGRITY INNOVATION ACCOUNTABILITY COMMITMENT TO EXCELLENCE TEAMWORK This section provides a detailed spending plan to account for proceeds of specific revenue sources that are legally
 Project Description & Fund Overview Account Number Fund Name *C* September 2015 Additional Appropriation Mid-Year Adjustment Adjustments Approved by Council as separate actions Proposed & Approved Adjustments
City of Sacramento City Council 915 I Street, Sacramento, CA,
 City of Sacramento City Council 915 I Street, Sacramento, CA, 95814 www.cityofsacramento.org Meeting Date: 2/8/2011 Report Type: Consent Title: Agreement: Streetcar Planning Study Report ID: 2011-00051
This page intentionally left blank
 197 This page intentionally left blank 198 Capital Improvement Program PROCEDURE Each year the Capital Improvement Program (CIP) is prepared from project requests submitted by the various departments.
2016 Budget Highlights
 During the regular meeting of Leduc City Council on Dec. 8, 2015, council adopted the 2016 operating and capital budgets outlining a 2.26 per cent tax increase; two-year forecasted operating budget (2017-2018)
Strategic Growth in the Rangeview Area Structure Plan
 2018 March 22 Page 1 of 8 EXECUTIVE SUMMARY Administration has received and reviewed an Outline Plan/Land Use (OP/LU) application within the Rangeview Area Structure Plan (ASP). The developer of these
A loyal three made stronger in one. Loyalist Township Strategic Plan ( )
") A loyal three made stronger in one Loyalist Township Strategic Plan (2012-2015) Adopted by Council on August 13, 2012 Loyalist Township Strategic Plan I. Community Profile As prescribed by the Ministry
A loyal three made stronger in one Loyalist Township Strategic Plan (2012-2015) Adopted by Council on August 13, 2012 Loyalist Township Strategic Plan I. Community Profile As prescribed by the Ministry
Five-Year Capital Improvement Plan
 FiveYear Capital Improvement Plan 2016 2020 CITY OF RANCHO CORDOVA City of Rancho Cordova Council: Mayor:. Robert J. McGarvey Vice Mayor: David Sander Council Member:.. Linda Budge Council Member:.. Dan
City Council Budget Work Session. City of McKinney August 4, 2017
 City Council Budget Work Session City of McKinney August 4, 2017 Agenda Budget Process & FY18 Overview Property Tax General Fund Revenues & Expenditures Capital Improvements Program Debt Service Water
CITY OF LIVINGSTON ORGANIZATIONAL STRATEGIC PLAN MARCH 2019
 CITY OF LIVINGSTON ORGANIZATIONAL STRATEGIC PLAN 2019-05 MARCH 2019 What is an Organizational Strategic Plan? Strategic planning is an organizational management activity that is used to set priorities,
City of Des Moines. City Manager Recommended Two-Year General Fund Operating Budget Plan FY 2013 and FY December 5, 2011
 City of Des Moines City Manager Recommended Two-Year General Fund Operating Budget Plan FY 2013 and FY 2014 December 5, 2011 Actions to Balance Past Budgets Focused on expense reductions- all options were
I. Introduction and Background
 I. Introduction and Background The purpose of the Midterm Review of the 2007 Five-Year Implementation Plan (Implementation Plan) is to provide a review of the current status of the goals, programs and
Financial Tables BUDGET SUMMARY ACTUAL ADOPTED AMENDED RECOMM. % TOTAL ALL CITY FUNDS - EXPENDITURE BUDGET General 150
 BUDGET SUMMARY 2016-17 ACTUAL ADOPTED AMENDED RECOMM. % TOTAL ALL CITY FUNDS - EXPENDITURE BUDGET General 150,772,063 157,004,711 155,448,503 158,973,765 26% Special Revenue 105,738,661 110,778,338 113,004,933
CITY OF AUBURN CALIFORNIA Comprehensive Annual Financial Report
 CALIFORNIA 2012 Comprehensive Annual Financial Report Fiscal Year Ended June 30, 2012 THIS PAGE INTENTIONALLY LEFT BLANK City of Auburn, California Comprehensive Annual Financial Report For the Year Ended
Implementation Project Development and Review 255
 Introduction 248 Implementation Principles 249 Public Agency Fiduciary Responsibilities 250 Project Development and Review Process 252 Project Development and Review 255 Maintenance 23 Implementation Implementation
CITY OF JOPLIN FY 2018 PROPOSED BUDGET
 CITY OF JOPLIN FY 2018 PROPOSED BUDGET CITY OF JOPLIN ESTIMATE OF NEEDS PROJECTED FUND BALANCES FOR FISCAL YEAR 2017-2018 Audited Projected Projected Fund Projected 2016-2017 Activity Fund Projected 2017-2018
AGENDA ITEM I-1 City Manager's Office
 AGENDA ITEM I-1 STAFF REPORT City Council Meeting Date: 8/6/2018 Staff Report Number: 18-153-CC Informational Item: Quarterly update on the 2018 City Council work plan Recommendation This is an informational
Queen Creek Annual Budget Organizational Structure
 Organizational Structure Town Organizational Chart Employees by Department Staffing Level Changes Fund Structure Chart Fund Structure Narrative Where the Money Comes From Where the Money Goes 60 TOWN ORGANIZATIONAL
EXPENDITURE AND PROPERTY TAX OVERVIEW
 EXPENDITURE AND PROPERTY TAX OVERVIEW The City of Dallas has been consistently recognized for its judicious management of financial resources. An excellent bond rating, steady tax rate, and fair fee structures
CITY OF MODESTO COMMUNITY FACILITIES DISTRICT NO (HETCH HETCHY) CFD REPORT
 CFD REPORT") CITY OF MODESTO COMMUNITY FACILITIES DISTRICT NO. 2005-1 (HETCH HETCHY) CFD REPORT September 23, 2005 Goodwin Consulting Group, Inc. 555 University Avenue, Suite 280 Sacramento, California 95825 Phone
CITY OF MODESTO COMMUNITY FACILITIES DISTRICT NO. 2005-1 (HETCH HETCHY) CFD REPORT September 23, 2005 Goodwin Consulting Group, Inc. 555 University Avenue, Suite 280 Sacramento, California 95825 Phone
INTRODUCING THE CITY OF CASA GRANDE S ANNUAL REPORT
 INTRODUCING THE CITY OF CASA GRANDE S ANNUAL REPORT Each year, the City of Casa Grande produces a Popular Annual Financial Report (PAFR) to provide a glimpse of the City s financial condition. This report
2019 BUDGET MESSAGE. September 18, Honorable Mayor and Town Council Members,
 2019 BUDGET MESSAGE September 18, 2018 Honorable Mayor and Town Council Members, On behalf of Town staff, I am pleased to submit the 2019 Budget to Town Council and the community. The budget includes a
Projects Receiving New Funding by. Funding Source and Project Number
 CITY OF SACRAMENTO CIP INDEX BY FUNDING SOURCE s Receiving New Funding by Funding Source and Number 20152020 CAPITA IMPROVEMENT Number Name Budget Unobligated 2015/16 2016/17 2017/18 2018/19 2019/20 1001
GRASS VALLEY TRANSPORTATION IMPACT FEE PROGRAM NEXUS STUDY
 HEARING REPORT GRASS VALLEY TRANSPORTATION IMPACT FEE PROGRAM NEXUS STUDY Prepared for: City of Grass Valley Prepared by: Economic & Planning Systems, Inc. March 2008 EPS #17525 S A C R A M E N T O 2150
Executive Summary Operating Budget and Forecast
 Executive Summary The 2017 Budget Discussion Document presents the proposed 2017 operating budget, 2018-2019 forecasts and the 2017 Capital Budget for the Town of Oakville. The document represents the
June 29, Honorable Mayor and Commissioners: 1. Introduction
 June 29, 2004 Honorable Mayor and Commissioners: 1. Introduction In accordance with the authority granted me by City ordinance and State Statute, I submit for your review and approval the recommended budget
University Link LRT Extension
 (November 2007) The Central Puget Sound Regional Transit Authority, commonly known as Sound Transit, is proposing to implement an extension of the Central Link light rail transit (LRT) Initial Segment
CITY OF BOYNTON BEACH FY ADOPTED SUMMARY BUDGET
 CITY OF BOYNTON BEACH, FLORIDA CITY OF BOYNTON BEACH FY 2017-2018 ADOPTED SUMMARY BUDGET P a g e 1 46 Boynton Beach Mayor and City Commission Commissioner Joe Casello, Commissioner Christina Romelus, Vice
CHAPTER 11: Economic Development and Sustainability
 AGLE AREA COMMUNITY Plan CHAPTER 11 CHAPTER 11: Economic Development and Sustainability Economic Development and Sustainability The overall economy of the Town and the Town government s finances are inextricably
MEMORANDUM. Attached for your review is the quarterly budget update for third quarter of the fiscal year.
 Finance Department MEMORANDUM DATE: TO: FROM: April30, 2015 Steven A. Preston, City Manager ~ Thomas C. Marston, Finance Director'-\""~ SUBJECT: Quarterly Budget Update- July through March 2015 Attached
TABLE OF CONTENTS LIST OF TABLES
 TABLE OF CONTENTS A. GOALS, OBJECTIVES, AND POLICIES... 3 B. SUMMARY... 17 LIST OF TABLES Table IX 1: City of Winter Springs Five-Year Schedule of Capital Improvements (SCI) FY 2013/14-2017/18... 11 Table
PALM BEACH COUNTY CAPITAL IMPROVEMENT PROGRAM
 Palm Beach County (the County) provides the needed and desired urban services to the public. In order to provide these services, the County must furnish and maintain capital facilities and equipment, such
10-Year Capital Highway Investment Plan DRAFT
 This document is made available electronically by the Minnesota Legislative Reference Library as part of an ongoing digital archiving project. http://www.leg.state.mn.us/lrl/lrl.asp 10-Year Capital Highway
This page intentionally blank. Capital Facilities Chapter Relationship to Vision. Capital Facilities Chapter Concepts
 This page intentionally blank. Capital Facilities Chapter Relationship to Vision Vision County Government. County government that is accountable and accessible; encourages citizen participation; seeks
Capital Improvement Program 2014/ /20
 Capital Improvement Program 2014/15 2019/20 Chamber of Commerce May 21, 2014 Schedule Mayor s Letter and Instruction Dec 6, 2013 Department Submittals Feb 7, 2014 Planning Dept. Version Feb 21, 2014 CIAC