Implementing Goods and Services Tax in Malaysia
|
|
|
- Solomon Johns
- 5 years ago
- Views:
Transcription

1 Implementing Goods and Services Tax in Malaysia Lim Kim-Hwa & Ooi Pei Qi 9 Nov
2 Structure Household impact from GST Who pays? How much? Net effect after Budget s measures Why was GST predicted to be in the Budget? Economic impact 2015
3 Key Issues What is the impact of GST on households? Average household pays RM 90/month 2.52% of income Will GST hit the poor more? Yes. GST = Regressive tax Monthly income: RM 30,815: 1.32% RM 605: 2.35% RM 2,579: 2.67%
4 Key Issues Net effect after Budget s measures Income tax payers get tax cuts Non-income tax payers get BR1M Low income: more cash Middle income: less cash High income: more cash Budget: negative for middle income How much will GST raise? RM 6 billion from households After RM 500k business registration threshold Before GST fraud
5 Key Issues How inflationary is GST? SST abolished, additional inflation: Max: 3.38% Min: 0.56% Most likely: 1.32% Computed using official CPI method might vary from real world Recommendations QE taper risk remain Malaysia should insulate itself Need income tax adjustments for middle income
6 Household Impact Latest Household Expenditure Survey (2009/2010) 0% rated and exempted items 6% standard rated items Average household pays 3.80% of expenditure or 2.52% of income Essential food Basic nonvalue added items Healthcare Public transportation Education Clothes & footwear Restaurants & Hotels Household equipment Tobacco & alcohol RM 90 per month
, housing, water, electricity, gas and other fuels (1.42%) Transport (5.")
 Spending pattern GST payment Restaurants and hotels, furnishing, household equipment and routine")
7 GST rate (%) Health, Education (0.00%) Food and nonalcoholic beverages (1.66%), housing, water, electricity, gas and other fuels (1.42%) Transport (5.39%), recreation services and culture (5.73%), miscellaneous goods and services (5.74%) Spending pattern GST payment Restaurants and hotels, furnishing, household equipment and routine household maintenance, clothing and footwear, communication, alcoholic beverages and tobacco (6.00%)

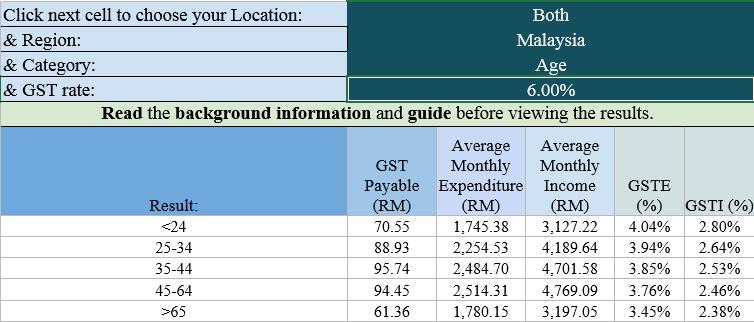
8 Higher GST burden if you are: Low and middle income Single person household Young (less than 24 years old) household Bumiputera-led households Clerical workers, skilled agricultural and fishery workers Peninsular Malaysia
9 Calculating GST burden (GSTI) GSTI GST (RM) Total Income Income increases Expenditure increases; but lower magnitude Income expenditure relationship is concave
10 Expenditure Income expenditure relationship (from Bank Negara estimates) ,940 5,840 3,040 0 Income
11 Higher GSTI: Low and middle income household 35, % 30, % 25, % 20,000 15,000 10,000 Worst hit: monthly income RM2, % 1.00% 5, % 0 Less than RM500 RM RM RM RM RM RM RM RM RM RM5000 and over 0.00% Expenditure (RM) Income (RM) GSTI (%)
12 Higher GSTI: Single person household 7, % 6, % 5, % 4, % 3, % 2, % 1, % 0 One Two Three Four Five Six Seven Eight Nine Ten and over Expenditure (RM) Income (RM) GSTI (%) 0.00%
13 Higher GSTI: Young (less than 24 years old) household 6, % 5, % 4, % 3, % 2, % 1, % 0 < >65 Expenditure (RM) Income (RM) GSTI (%) 0.00%
14 Higher GSTI: Bumiputera-led & non-malaysian household 7,000 6,000 5,000 4,000 3,000 2,000 1, % 2.50% 2.00% 1.50% 1.00% 0.50% 0.00% Expenditure (RM) Income (RM) GSTI (%)
15 Higher GSTI: Clerical & services workers, Farmers, Fishermen 12, % 10,000 8,000 6,000 4,000 2, % 2.00% 1.50% 1.00% 0.50% 0.00% Expenditure (RM) Income (RM) GSTI (%)
16 Higher GST contribution: Peninsular Malaysia

17 Our interactive spreadsheet:
18 Measures in the Budget Cash outflow Cash inflow Income tax cut GST BR1M

19 RM Annual Household Income 400, , , , , , ,000 50,000 - Monthly Expenditure
20 RM Budget s measures: Income tax cuts, BR1M & GST 10,000 8,000 7,857 6,000 4,000 2,000 - (2,000) 2, (162) (235) (289) (347) (403) (448) (776) (1,400) (2,054) (2,642) (4,000) (6,000) Income tax saving (household) BR1M GST payment (household) (4,730)
21 Income tax savings + BR1M GST: Middle income worse off 3,500 3,000 2,500 2,000 Middle income: worse off 3,127 1,500 1, (500) (1,000) (1,500) (326) (937) (1,123) Income tax saving + BR1M - GST payment (household) (412)
22 Budget: households with current annual income RM 30k- 150k to pay more tax Annual income (household) 7,266 10,407 12,380 14,443 16,551 18,662 30,950 60,177 94, , ,778 Chargeable income (individual) - 1,238 3,178 4,115 4,787 5,509 13,559 32,282 52,242 74, ,646 Income tax saving (household) ,230 7,857 BR1M GST payment (household) (162) (235) (289) (347) (403) (448) (776) (1,400) (2,054) (2,642) (4,730) Income tax saving + BR1M - GST (household) (326) (937) (1,123) (412) 3,127 More tax
23 Mitigate negative effect on middle income 1: Our proposed income tax rates Chargeable Income (upper limit) Our proposal Change vs. current Change vs. Budget 5, % 0.0% 0.0% 20, % -1.0% 0.0% 35, % -4.5% -3.5% 50, % -3.0% -2.0% 70, % -1.0% 2.0% 100, % 0.0% 3.0% 250, % -1.0% 1.0% 400, % -1.0% 0.5% 9,999, % -1.0% 0.0% Bigger cuts at lower income Smaller cuts at higher income Expenditure efficiency improvements to make up any revenue shortfall
24 Budget vs. Our Proposal: Income tax savings + BR1M GST 3,500 3,000 2,500 2,000 1,500 1, Middle income: less worse off (500) (1,000) (1,500) (326) (318) Income tax saving + BR1M - GST payment (Budget) Income tax saving + BR1M - GST payment (Proposal) Highest income: less better off
25 Total GST Revenue from Households Perfect condition: RM 6.5 billion Simplify tax administration (GST register if > RM 0.5m sales) Practical condition: RM 6 billion Simplify tax administration (GST register if > RM 0.5m sales) GST Fraud? Realistic condition: Less than RM 6 billion
26 GST Revenue Source Furnishings, household equipment and routine household maintenance 6% Miscellaneous goods and services 13% Food and non-alcoholic beverages 9% Clothing and footwear 5% Communication 9% Restaurants and hotels 17% Housing, water, electricity, gas and other fuels 9% Recreation services and culture 7% Transport 21% Alcoholic beverages and tobacco 4%


27 Mitigate negative effect on middle income 2: Make GST less regressive Top 2 GST revenue source Transport Hotels & Restaurants Multi-tier GST High GST rate on selected items
28 RM Why target Transport? Transport as % of income increases as income rises 60% 2% 40,000 50% 40% 6.7% 30,000 30% 20% 10% 20, % 10,000 0% Less than RM500 RM Food and non-alcoholic beverages Restaurants and hotels Alcohol beverages and tobacco RM RM RM RM5000 and over Housing, water, electricity, gas and other fuels Transport Income (RM Jul '13) 0
29 Raise same amount of revenue but make GST less regressive? Difficult middle income groups still pay higher GSTI
30 Base 6% vs: Multi-tiered, High GST rate on selected items 35, % 30,000 25,000 20,000 15,000 10,000 5,000 0 Less than RM500 RM RM Income (RM) RM RM Base: Flat 6% standard rate Cannot make middle income pay less GSTI than highest income RM RM RM RM RM %: transport (excl public transportation); 2% standard GST rate 17.5%: transport (excl public transportation), restaurants & hotels RM5000 and over 2.50% 2.00% 1.50% 1.00% 0.50% 0.00%
31 GST is a strongly regressive tax Higher income households still pay lower GSTI GST is intrinsically regressive Middle income households still pay higher GSTI Hence, need income tax reduction, refundable tax credits/rebates
32 Why was GST predicted to be in the Budget? High debt Sovereign: RM 519 billion (Q2 2013) Household: 80.5% GDP (2012) Low US interest rates about to end Now: 2.6% : 4.7% Foreigners hold RM 126 billion Malaysia Government Debt Fiscal deficits since 1998 Credit rating downgrade risk First Budget after GE13 GST Introduced Government s credibility

33 Foreigners holdings in Malaysia Government Debt Jul 13: RM 126 billion Jun/Jul 2013: Foreign capital withdrawn Jan 05: RM 9 billion
 Jun/Jul 2013: Foreign capital exert significant")
34 Foreign Capital withdrawn Borrowing Costs Increase (3.4% 4%) Jun/Jul 2013: Foreign capital exert significant influence

35 Significance Sovereign Debt: RM 519 billion (Q2 2013) Low US interest rates end Fiscal Deficit Deteriorates 1% higher interest rate Slower Economic Growth Credit Rating Downgrade Additional RM 5.19 billion interest Borrowing Costs Increase Foreign Capital Withdraw
36 Likely Economic Impact 2015 Q Mar Apr 2015 Q Dec 2015 Consumers/businesses front load expenditure: big ticket items (cars), IT Economy booms GST imposed Economy sluggish Minimal expenditure; but BR1M insulates domestic demand High inflation, likely to peak around Q4 AEC starts minimal impact as most goods are already tariff free US Fed Yellen appointed 2014; tapering in 2015? Economic cycle every 6/7 years. So, possible economic downcycle in 2015? Domestic Global
MONTHLY ECONOMIC INDICATORS
 MONTHLY ECONOMIC INDICATORS SEPTEMBER 0 Table of Contents 1. INFLATION... 2 2. MONEY, CREDIT AND INTEREST RATES... 6 3. REAL SECTOR INDICATORS... 9 4. BALANCE OF PAYMENTS AND EXTERNAL SECTOR INDICATORS...
Consumer Price Index (Base year 2014) Consumer Price Index
 Consumer Price Index") Consumer Price Index December 2017 (Base year 2014) Consumer Price Index 1 Release Date: January 2018 Detailed by: Expenditure groups Household welfare levels Household type Regions Briefing This publication
Consumer Price Index December 2017 (Base year 2014) Consumer Price Index 1 Release Date: January 2018 Detailed by: Expenditure groups Household welfare levels Household type Regions Briefing This publication
Consumer Price Index (Base year 2014) Consumer Price Index
 Consumer Price Index") Consumer Price Index December 2016 (Base year 2014) Consumer Price Index 1 Release Date: January 2017 Detailed by: Expenditure groups Household welfare levels Household type Regions Briefing This publication
Consumer Price Index December 2016 (Base year 2014) Consumer Price Index 1 Release Date: January 2017 Detailed by: Expenditure groups Household welfare levels Household type Regions Briefing This publication
Consumer Price Index (Base year 2014) Consumer Price Index
 Consumer Price Index") Consumer Price Index July 207 (Base year 204) Consumer Price Index Release Date: Augest 207 Detailed by: Expenditure groups Household welfare levels Household type Regions Briefing This publication provides
Consumer Price Index July 207 (Base year 204) Consumer Price Index Release Date: Augest 207 Detailed by: Expenditure groups Household welfare levels Household type Regions Briefing This publication provides
Consumer Price Index (Base year 2014) Consumer Price Index
 Consumer Price Index") Consumer Price Index uary 2018 (Base year 2014) Consumer Price Index 1 Release Date: uary 2018 Detailed by: Expenditure groups Household welfare levels Household type Regions Briefing This publication
Consumer Price Index uary 2018 (Base year 2014) Consumer Price Index 1 Release Date: uary 2018 Detailed by: Expenditure groups Household welfare levels Household type Regions Briefing This publication
Consumer Price Index (Base year 2014) Consumer Price Index
 Consumer Price Index") Consumer Price Index ruary 2018 (Base year 2014) Consumer Price Index 1 Release Date: March 2018 Detailed by: Expenditure groups Household welfare levels Household type Regions Briefing This publication
Consumer Price Index ruary 2018 (Base year 2014) Consumer Price Index 1 Release Date: March 2018 Detailed by: Expenditure groups Household welfare levels Household type Regions Briefing This publication
Inflation rate in Camarines Sur decreases to 5.2 percent in June 2018
 Inflation Rate (in Percent) [ Inflation rate in Camarines Sur decreases to 5.2 percent in Date of Release: July 13, Reference No. -028 The provincial headline inflation rate slightly decreased to 5.2 percent
Inflation rate in Camarines Sur increases to 5.3 percent in May 2018
 Inflation Rate (in Percent) [ Inflation rate in Camarines Sur increases to 5.3 percent in May Date of Release: July 13, Reference No. -027 The provincial headline inflation rate significantly increased
Consumer Price Index (Base year 2014) Consumer Price Index
 Consumer Price Index") Consumer Price Index Annual Report of 2016 (Base year 2014) Consumer Price Index 1 Release Date: March 2017 Detailed by: Expenditure groups Household welfare levels Household type Regions 1. Consumer Price
Consumer Price Index Annual Report of 2016 (Base year 2014) Consumer Price Index 1 Release Date: March 2017 Detailed by: Expenditure groups Household welfare levels Household type Regions 1. Consumer Price
Camarines Sur Consumer Price Index
 Inflation Rates (in Percent) Camarines Sur Consumer Price Index SR No. - 50 JULY Inflation rate in Camarines Sur increases to 6.4 percent in April The provincial headline inflation rate in Camarines Sur
CPI annual rate of change increased to 1.5%
 Consumer Prices Index June 2018 11 July 2018 CPI annual rate of change increased to 1.5% The CPI annual rate moved from 1.0% in May to 1.5% in June 2018. The annual core inflation rate, which excludes
Consumer Price Index, August 2012
 Consumer Price Index, August 2012 (Base year 2007) Detailed by: Expenditure groups Household welfare levels Household type September 5, 2012 Issue No. 8 SCAD. Consumer Price Index 2012 1 Table of Contents
Consumer Price Index (Base year 2014) Consumer Price Index
 Consumer Price Index") Consumer Price Index 2018 (Base year 2014) Consumer Price Index 1 Release Date: Jun 2018 Detailed by: Expenditure groups Household welfare levels Household type Regions Briefing This publication provides
Consumer Price Index 2018 (Base year 2014) Consumer Price Index 1 Release Date: Jun 2018 Detailed by: Expenditure groups Household welfare levels Household type Regions Briefing This publication provides
Inflation rate in Camarines Sur increases to 6.8 percent in September 2017
 Inflation Rate (in Percent) [ Inflation rate in Camarines Sur increases to 6.8 percent in September Date of Release: October 30, Reference No. -83 The provincial headline inflation rate in September increased
CPI annual rate of change increased to 0.7%
 Consumer Prices Index March 2018 11 April 2018 CPI annual rate of change increased to 0.7% The CPI annual rate moved from 0.6% in February to 0.7% in March 2018. The annual core inflation rate, which excludes
Inflation rate in Camarines Sur decreases to 5.1 percent in December 2017
 Inflation Rate (in Percent) [ Inflation rate in Camarines Sur decreases to 5.1 percent in ember Date of Release: January 11, 2018 Reference No. 2018-4 The provincial headline inflation rate in ember decreased
CPI annual rate of change increased to 1.4%
 Consumer Prices Index September 2018 11 October 2018 CPI annual rate of change increased to 1.4% The CPI annual rate moved from 1.2% in August to 1.4% in September 2018. The annual core inflation rate,
INFLATION AND CONSUMER PRICE INDICES IN MARCH 2015
 Consumer price index (CPI) INFLATION AND CONSUMER PRICE INDICES IN MARCH 2015 The consumer price index in March 2015 compared to February 2015 was 100.4%, i.e. the monthly inflation was 0.4%. The inflation
INFLATION AND CONSUMER PRICE INDICES IN JULY 2014
 Consumer price index (CPI) INFLATION AND CONSUMER PRICE INDICES IN JULY 2014 The consumer price index in July 2014 compared to June 2014 was 100.4%, i.e. the monthly inflation was 0.4%. The inflation rate
Figure 1. Inflation measured by CPI by months
 INFLATION AND CONSUMER PRICE INDICES IN SEPTEMBER 2014 Consumer price index (CPI) The consumer price index in September 2014 compared to August 2014 was 99.8%, i.e. the monthly inflation was -0.2%. The
INFLATION AND CONSUMER PRICE INDICES IN SEPTEMBER
 INFLATION AND CONSUMER PRICE INDICES IN SEPTEMBER 2015 Consumer price index (CPI) The consumer price index in September 2015 compared to August 2015 was 99.9%, i.e. the monthly inflation was -0.1%. The
D R L I M C H E E H A N M R T I M N I K L A S S C H O E P P M S O N G WO O I L E N G ECONOMIC S T U D I E S
 THE 2016 BUDGET AND ECONOMIC OUTLOOK 28 NOV 2015 D R L I M C H E E H A N M R T I M N I K L A S S C H O E P P M S O N G WO O I L E N G ECONOMIC S T U D I E S Contents 1. General Information / Highlights
The CPI annual average rate of change was 1.0% in 2018 and the rate of change on a year earlier was 0.7% in December
 Consumer Price Index December 2018 11 de January 2019 The CPI annual average rate of change was 1.0% in 2018 and the rate of change on a year earlier was 0.7% in December In 2018, the average rate of change
Benign inflation rate in September
 Dr. Mohd Afzanizam Abdul Rashid Chief Economist 03-2088 8075 afzanizam@bankislam.com.my Shafiz Jamaluddin Economic Analyst 03-2088 8399 shafiz@bankislam.com.my Nor Jannah Abdullah FSTEP Trainee 03-2088
INFLATION AND CONSUMER PRICE INDICES IN NOVEMBER
 INFLATION AND CONSUMER PRICE INDICES IN NOVEMBER 2012 Consumer price index (CPI) The consumer price index in November 2012 compared to October 2012 was 99.9%, i.e. the monthly inflation was -0.1%. The
INFLATION AND CONSUMER PRICE INDICES IN AUGUST 2013
 Consumer price index (CPI) INFLATION AND CONSUMER PRICE INDICES IN AUGUST 2013 The consumer price index in August 2013 compared to July 2013 was 99.4%, i.e. the monthly inflation was -0.6%. The inflation
Consumer Price Index (Base year 2014) Consumer Price Index
 Consumer Price Index") Consumer Price Index y 2018 (Base year 2014) Consumer Price Index 1 Release Date: August 2018 Detailed by: Expenditure groups Household welfare levels Household type Regions Briefing This publication provides
Consumer Price Index y 2018 (Base year 2014) Consumer Price Index 1 Release Date: August 2018 Detailed by: Expenditure groups Household welfare levels Household type Regions Briefing This publication provides
Inflation Remains Tepid in November at 0.2% as Transport Cost Trending Downward
 19 December 2018 ECONOMIC REVIEW November 2018 Consumer Price Index Inflation Remains Tepid in November at 0.2% as Transport Cost Trending Downward Headline inflation back to near 4-year low. Consumer
The national monthly CPI (2008=100) increased from per cent in September, 2017 to per cent
 increased from per cent in September, 2017 to per cent") CONSUMER PRICE INDEX (CPI) October, 2017: PRESS RELEASE Released on Monday November 21, 2017 at 1:00 pm OCTOBER 2017 MONTHLY INFLATION RATE INCREASES SLIGHTLY The national monthly CPI (2008=100) increased
CONSUMER PRICE INDEX (CPI) October, 2017: PRESS RELEASE Released on Monday November 21, 2017 at 1:00 pm OCTOBER 2017 MONTHLY INFLATION RATE INCREASES SLIGHTLY The national monthly CPI (2008=100) increased
INFLATION AND CONSUMER PRICE INDICES IN OCTOBER 2012
 Consumer price index (CPI) INFLATION AND CONSUMER PRICE INDICES IN OCTOBER 2012 The consumer price index in October 2012 compared to September 2012 was 100.3%, i.e. the monthly inflation was 0.3%. The
INFLATION AND CONSUMER PRICE INDICES IN SEPTEMBER 2016
 INFLATION AND CONSUMER PRICE INDICES IN SEPTEMBER 2016 Consumer price index (CPI) The consumer price index in September 2016 compared to August 2016 was 99.5%, i.e. the monthly inflation was -0.5%. The
INFLATION AND CONSUMER PRICE INDICES IN APRIL 2017
 INFLATION AND CONSUMER PRICE INDICES IN APRIL 2017 Consumer price index (CPI) The consumer price index in April 2017 compared to March 2017 was 100.7%, i.e. the monthly inflation was 0.7%. The inflation
INFLATION AND CONSUMER PRICE INDICES IN JULY 2016
 INFLATION AND CONSUMER PRICE INDICES IN JULY 2016 Consumer price index (CPI) The consumer price index in July 2016 compared to June 2016 was 101.0%, i.e. the monthly inflation was 1.0%. The inflation rate
INFLATION AND CONSUMER PRICE INDICES IN MARCH 2017
 INFLATION AND CONSUMER PRICE INDICES IN MARCH 2017 Consumer price index (CPI) The consumer price index in March 2017 compared to February 2017 was 99.5%, i.e. the monthly inflation was -0.5%. The inflation
INFLATION AND CONSUMER PRICE INDICES IN AUGUST 2018
 INFLATION AND CONSUMER PRICE INDICES IN AUGUST 2018 Consumer price index (CPI) The consumer price index in August 2018 compared to July 2018 was 100.1%, i.e. the monthly inflation was 0.1%. The inflation
INFLATION AND CONSUMER PRICE INDICES IN MARCH 2018
 INFLATION AND CONSUMER PRICE INDICES IN MARCH 2018 Consumer price index (CPI) The consumer price index in March 2018 compared to February 2018 was 99.7%, i.e. the monthly inflation was -0.3%. The inflation
INFLATION AND CONSUMER PRICE INDICES IN JULY 2018
 INFLATION AND CONSUMER PRICE INDICES IN JULY 2018 Consumer price index (CPI) The consumer price index in July 2018 compared to June 2018 was 100.7%, i.e. the monthly inflation was 0.7%. The inflation rate
INFLATION AND CONSUMER PRICE INDICES IN AUGUST 2016
 INFLATION AND CONSUMER PRICE INDICES IN AUGUST 2016 Consumer price index (CPI) The consumer price index in August 2016 compared to July 2016 was 100.0%, i.e. the monthly inflation was 0.0%. The inflation
Namibia Consumer Price Index
 Namibia Consumer Price Index June, 2016 Namibia Statistics Namibia Consumer Price Index:June, 2016 Agency 1 OUR MISSION In a coordinated manner produce and disseminate relevant, quality and timely statistics
INFLATION AND CONSUMER PRICE INDICES IN FEBRUARY 2018
 INFLATION AND CONSUMER PRICE INDICES IN FEBRUARY 2018 Consumer price index (CPI) The consumer price index in February 2018 compared to January 2018 was 100.3%, i.e. the monthly inflation was 0.3%. The
MINISTRY OF NATIONAL PLANNING AND DEVELOPMENT REPUBLIC OF SOMALILAND Central Statistics Department OFFICIAL RELEASE
 MINISTRY OF NATIONAL PLANNING AND DEVELOPMENT REPUBLIC OF SOMALILAND Central Statistics Department OFFICIAL RELEASE Monthly Consumer Price Index September 20 Methodology This publication provides the monthly
INFLATION AND CONSUMER PRICE INDICES IN SEPTEMBER 2017
 INFLATION AND CONSUMER PRICE INDICES IN SEPTEMBER 2017 Consumer price index (CPI) The consumer price index in September 2017 compared to August 2017 was 100.2%, i.e. the monthly inflation was 0.2%. The
CONSUMER PRICE INDEX JULY 2018 PRESS RELEASE
 CONSUMER PRICE INDEX JULY 2018 PRESS RELEASE Released: 21 st August, 2018 @ 12: 00 noon Contact Persons: Abu Bakarr Turay Director, Economic Statistics Division Statistics Sierra Leone Mobile: +23276690948
CONTENTS COMMENTARY CHARTS TABLES GLOSSARY. Section 1: Headline Inflation Section 2: Core Inflation
 COMMENTARY CONTENTS Section 1: Headline Inflation Section 2: Core Inflation CHARTS 1. National Rates of Inflation, January 2010 April 2013 2. Monthly Changes in the Cost-of-Living Index, January 2010 April
INFLATION AND CONSUMER PRICE INDICES IN APRIL 2016
 INFLATION AND CONSUMER PRICE INDICES IN APRIL 2016 Consumer price index (CPI) The consumer price index in April 2016 compared to March 2016 was 100.0%, i.e. the monthly inflation was 0.0%. The inflation
Consumer Price Index, November, (Base year 2007) Detailed by: Expenditure groups Household welfare levels Household type.
 Detailed by: Expenditure groups Household welfare levels Household type.") Consumer Price Index, November, 2013 (Base year 2007) Detailed by: Expenditure groups Household welfare levels Household type December 10, 2013 Issue No. 11 SCAD. Consumer Price Index 2013 1 Table of Contents
Consumer Price Index, November, 2013 (Base year 2007) Detailed by: Expenditure groups Household welfare levels Household type December 10, 2013 Issue No. 11 SCAD. Consumer Price Index 2013 1 Table of Contents
CPI annual rate of change decreased to 0.4%
 Consumer Prices Index April 2018 11 May 2018 CPI annual rate of change decreased to 0.4% The CPI annual rate moved from 0.7% in March to 0.4% in April 2018. The annual core inflation rate, which excludes
INFLATION AND CONSUMER PRICE INDICES IN FEBRUARY 2016
 INFLATION AND CONSUMER PRICE INDICES IN FEBRUARY 2016 Consumer price index (CPI) The consumer price index in February 2016 compared to January 2016 was 99.7%, i.e. the monthly inflation was -0.3%. The
REPUBLIC OF SOMALILAND
 REPUBLIC OF SOMALILAND Ministry of National Planning & Development Central Statistics Department OFFICIAL RELEASE Monthly Consumer Price Index October 2016 2016 Page 1 of 9 Consumer Price Index (CPI) October,
Mean Monthly Household Income and Expenditure, 2014 (RM)
") Be Prepared for Subsidy-Free System Zafri Zulkeffeli Research Officer Malaysian Institute of Economic Research (MIER) 1 According to the Department of Statistics Malaysia, low income group in Malaysia
Be Prepared for Subsidy-Free System Zafri Zulkeffeli Research Officer Malaysian Institute of Economic Research (MIER) 1 According to the Department of Statistics Malaysia, low income group in Malaysia
INFLATION AND CONSUMER PRICE INDICES IN MARCH
 INFLATION AND CONSUMER PRICE INDICES IN MARCH 2014 Consumer price index (CPI) The consumer price index in March 2014 compared to February 2014 was 99.8%, i.e. the monthly inflation was -0.2%. The inflation
INFLATION AND CONSUMER PRICE INDICES IN APRIL 2014
 Consumer price index (CPI) INFLATION AND CONSUMER PRICE INDICES IN APRIL 2014 The consumer price index in April 2014 compared to March 2014 was 100.3%, i.e. the monthly inflation was 0.3%. The inflation
Federal Republic of Somalia Ministry of Planning, Investment and Economic Development Directorate of National Statistics CONSUMER PRICE INDEX
 Federal Republic of Somalia Ministry of Planning, Investment and Economic Development Directorate of National Statistics CONSUMER PRICE INDEX October 2018 Executive Summary The All Groups CPI was 111.62
INFLATION AND CONSUMER PRICE INDICES IN JULY 2015
 Consumer price index (CPI) INFLATION AND CONSUMER PRICE INDICES IN JULY 2015 The consumer price index in July 2015 compared to June 2015 was 99.8%, i.e. the monthly inflation was -0.2%. The inflation rate
Figure 1. Inflation measured by CPI by months
 INFLATION AND CONSUMER PRICE INDICES IN FEBRUARY 2015 Consumer price index (CPI) The consumer price index in February 2015 compared to January 2015 was 100.2%, i.e. the monthly inflation was 0.2%. The
SACU INFLATION REPORT. January 2017
 SACU INFLATION REPORT January 2017 The content of this publication is intended for general information only. While precaution is taken to ensure the accuracy of information, the SACU Secretariat shall
NOVEMBER 22, : MONTHLY INFLATION RATE INCREASES SIGNIFICANTLY
 CONSUMER PRICE INDEX (CPI) November, 2016: PRESS RELEASE Released on Thursday December 22, 2016 at 1:00 pm NOVEMBER 2016 MONTHLY INFLATION RATE INCREASES SIGNIFICANTLY The national monthly CPI (2008=100)
INFLATION AND CONSUMER PRICE INDICES IN NOVEMBER 2011
 INFLATION AND CONSUMER PRICE INDICES IN NOVEMBER 2011 The consumer price index (CPI) in November 2011 compared to October 2011 was 100.3%, i.e. the monthly inflation was 0.3%. The inflation rate since
Namibia Consumer Price Index
 Namibia Consumer Price Index March, 2016 Namibia Statistics Namibia Consumer Price Index: March, 2016 Agency 1 OUR MISSION In a coordinated manner produce and disseminate relevant, quality and timely statistics
INFLATION AND CONSUMER PRICE INDICES IN APRIL 2018
 IV.2017 V.2017 VI.2017 VII.2017 VIII.2017 IX.2017 X.2017 XI.2017 XII.2017 I.2018 II.2018 III.2018 IV.2018 INFLATION AND CONSUMER PRICE INDICES IN APRIL 2018 Consumer price index (CPI) The consumer price
INFLATION AND CONSUMER PRICE INDICES IN MAY 2017
 INFLATION AND CONSUMER PRICE INDICES IN MAY 2017 Consumer price index (CPI) The consumer price index in May 2017 compared to April 2017 was 99.7%, i.e. the monthly inflation was -0.3%. The inflation rate
INFLATION AND CONSUMER PRICE INDICES IN AUGUST 2017
 INFLATION AND CONSUMER PRICE INDICES IN AUGUST 2017 Consumer price index (CPI) The consumer price index in August 2017 compared to July 2017 was 100.1%, i.e. the monthly inflation was 0.1%. The inflation
INFLATION AND CONSUMER PRICE INDICES IN JULY 2017
 INFLATION AND CONSUMER PRICE INDICES IN JULY 2017 Consumer price index (CPI) The consumer price index in July 2017 compared to June 2017 was 100.3%, i.e. the monthly inflation was 0.3%. The inflation rate
INFLATION AND CONSUMER PRICE INDICES IN DECEMBER 2017
 INFLATION AND CONSUMER PRICE INDICES IN DECEMBER 2017 Consumer price index (CPI) The consumer price index in December 2017 compared to November 2017 was 100.4%, i.e. the monthly inflation was 0.4%. The
SACU INFLATION REPORT. February 2017
 SACU INFLATION REPORT February 2017 The content of this publication is intended for general information only. While precaution is taken to ensure the accuracy of information, the SACU Secretariat shall
Consumer Price Index (Base year 2014) Consumer Price Index
 Consumer Price Index") Consumer Price Index ember 2018 (Base year 2014) Consumer Price Index 1 Release Date: December 2018 Detailed by: Expenditure groups Household welfare levels Household type Regions Briefing This publication
Consumer Price Index ember 2018 (Base year 2014) Consumer Price Index 1 Release Date: December 2018 Detailed by: Expenditure groups Household welfare levels Household type Regions Briefing This publication
SACU INFLATION REPORT. February 2018
 SACU INFLATION REPORT February 2018 The content of this publication is intended for general information only. While precaution is taken to ensure the accuracy of information, the SACU Secretariat shall
REPUBLIC OF SOMALILAND MINISTRY OF PLANNING AND NATIONAL DEVELOPMENT Central Statistics Department OFFICIAL RELEASE
 REPUBLIC OF SOMALILAND MINISTRY OF PLANNING AND NATIONAL DEVELOPMENT Central Statistics Department OFFICIAL RELEASE Monthly Consumer Price Index April 2018 Methodology This publication provides the monthly
CPI annual rate of change was 2.0% in April
 Consumer Prices Index April 2017 11 May 2017 CPI annual rate of change was 2.0% in April The CPI annual rate moved from 1.4% in March to 2.0% in April 2017. The annual core inflation rate, which excludes
SACU INFLATION REPORT. April 2018
 SACU INFLATION REPORT April 2018 The content of this publication is intended for general information only. While precaution is taken to ensure the accuracy of information, the SACU Secretariat shall not
SACU INFLATION REPORT. January 2018
 SACU INFLATION REPORT January 2018 The content of this publication is intended for general information only. While precaution is taken to ensure the accuracy of information, the SACU Secretariat shall
SOMALILAND CONSUMER PRICE INDEX
 Methodology This publication provides monthly Consumer Price Indices Composite of Somaliland which is based on two main market baskets of Hargeisa urban households. The current Consumer Price Index was
Headline and Core Inflation December 2017
 Dec-15 Jan-16 Mar-16 May-16 Jul-16 Sep-16 Nov-16 Jan-17 Mar-17 May-17 Jul-17 Sep-17 Nov-17 Dec-12 Mar-13 Jun-13 Sep-13 Dec-13 Mar-1 Jun-1 Sep-1 Dec-1 Mar-15 Jun-15 Sep-15 Dec-15 Mar-16 Sep-16 Mar-17 Sep-17
MINISTRY OF NATIONAL PLANNING AND DEVELOPMENT REPUBLIC OF SOMALILAND Central Statistics Department OFFICIAL RELEASE
 MINISTRY OF NATIONAL PLANNING AND DEVELOPMENT REPUBLIC OF SOMALILAND Central Statistics Department OFFICIAL RELEASE Monthly Consumer Price Index January 2017 Page 1 of 8 SOMALILAND CONSUMER PRICE INDEX
The national monthly CPI (2008=100) increased from per cent in November, 2017 to per cent
 increased from per cent in November, 2017 to per cent") CONSUMER PRICE INDEX (CPI) December, 2017: PRESS RELEASE Released on Monday January 17, 2017 at 1:00 pm DECEMBER 2017 MONTHLY INFLATION RATE INCREASES SIGHTLY The national monthly CPI (2008=100) increased
CONSUMER PRICE INDEX (CPI) December, 2017: PRESS RELEASE Released on Monday January 17, 2017 at 1:00 pm DECEMBER 2017 MONTHLY INFLATION RATE INCREASES SIGHTLY The national monthly CPI (2008=100) increased
INFLATION AND CONSUMER PRICE INDICES IN JUNE 2011
 INFLATION AND CONSUMER PRICE INDICES IN JUNE 2011 The consumer price index (CPI) in June 2011 compared to May 2011 was 99.1%, i.e. the monthly inflation was -0.9%. The inflation rate since the beginning
SACU INFLATION REPORT. December 2017
 SACU INFLATION REPORT December 20 The content of this publication is intended for general information only. While precaution is taken to ensure the accuracy of information, the SACU Secretariat shall not
CPI annual rate of change was 0.7% in August
 CONSUMER PRICES INDEX August 2015 10 September, 2015 CPI annual rate of change was 0.7% in August The CPI annual rate was 0.7% in August 2015, 0.1 percentage points (p.p.) lower than in the previous month.
SACU INFLATION REPORT. February 2016
 SACU INFLATION REPORT February 2016 The content of this publication is intended for general information only. While precaution is taken to ensure the accuracy of information, the SACU Secretariat shall
INFLATION AND CONSUMER PRICE INDICES IN OCTOBER 2010
 INFLATION AND CONSUMER PRICE INDICES IN OCTOBER 2010 The consumer price index (CPI) in October 2010 compared to September 2010 was 100.6%, i.e. the monthly inflation was 0.6%. The inflation rate since
MINISTRY OF PLANNING, INVESTMENT AND ECONOMIC DEVELOPMENT (MOPIED)
") MINISTRY OF PLANNING, INVESTMENT AND ECONOMIC DEVELOPMENT (MOPIED) Directorate of National Statistics STATISTICAL RELEASE MONTHLY REPORT CONSUMER PRICE INDEX February 2018 Executive Summary The All Groups
MINISTRY OF PLANNING, INVESTMENT AND ECONOMIC DEVELOPMENT (MOPIED) Directorate of National Statistics STATISTICAL RELEASE MONTHLY REPORT CONSUMER PRICE INDEX February 2018 Executive Summary The All Groups
OFFICIAL RELEASE. Monthly Consumer Price Index September 2018
 REPUBLIC OF SOMALILAND MINISTRY OFPLANNING AND NATIONALDEVELOPMENT Central Statistics Department OFFICIAL RELEASE Monthly Consumer Price Index September 2018 Methodology This publication provides the monthly
SACU INFLATION REPORT. October 2018
 SACU INFLATION REPORT October 2018 The content of this publication is intended for general information only. While precaution is taken to ensure the accuracy of information, the SACU Secretariat shall
Inflation rate rises modestly in November
 Dr. Mohd Afzanizam Abdul Rashid Chief Economist 03-2088 8075 afzanizam@bankislam.com.my Shafiz Jamaluddin Economic Analyst 03-2088 8075 shafiz@bankislam.com.my Nor Jannah Abdullah Economic Analyst 03-2088
The CPI annual average rate of change was 0.3% in 2013 and the rate of change on a year earlier was 0.2% in December
 CONSUMER PRICES INDEX December 2013 13 January, 2014 The CPI annual average rate of change was 0.3% in 2013 and the rate of change on a year earlier was 0.2% in December The average rate of change of the
Consumer Price Index
 Consumer Price Index (CPI) 4 th Quarter (Oct-Dec) 2016 Report Key facts: Quarterly change Highlights December 2104= 100 base month Overall index: Overall index during Oct- Dec 2016 stood 4.5% compare 0.3%
Deflation seen in January at -0.7%
 Dr. Mohd Afzanizam Abdul Rashid Chief Economist 03-2088 8075 afzanizam@bankislam.com.my Shafiz Jamaluddin Economic Analyst 03-2088 8075 shafiz@bankislam.com.my Nor Jannah Abdullah Economic Analyst 03-2088
REPUBLIC OF SOMALILAND
 REPUBLIC OF SOMALILAND Ministry Of National Planning &Development Central Statistics Department OFFICIAL RELEASE Monthly Consumer Price Index September 2016 2016 Page 1 of 9 Consumer Price Index (CPI)
State of Palestine Ministry of Finance. Fiscal Developments & Macroeconomic Performance: Fourth Quarter and Full year 2013 Report
 State of Palestine Ministry of Finance Fiscal Developments & Macroeconomic Performance: Fourth Quarter and Full year 2013 Report Macro Macro Fiscal Fiscal Unit Unit Oct February,, 2013 2014 Section 1:
The CPI annual average rate of change was 0.5% in 2015 and the rate of change on a year earlier was 0.4% in December
 Dec-11 Mar-12 Jun-12 Sep-12 Dec-12 Mar-13 Jun-13 Sep-13 Dec-13 Mar-14 Jun-14 Sep-14 Dec-14 Mar-15 Jun-15 Sep-15 Dec-15 Consumer Prices Index December 2015 January 13, 2016 The CPI annual average rate of
The CPI annual average rate of change was -0.3% in 2014 and the rate of change on a year earlier was -0.4% in December
 CONSUMER PRICES INDEX December 2014 13 January, 2015 The CPI annual average rate of change was -0.3% in 2014 and the rate of change on a year earlier was -0.4% in December The average rate of change of
REPUBLIC OF SOMALILAND MINISTRY OF PLANNING AND NATIONAL DEVELOPMENT Central Statistics Department OFFICIAL RELEASE
 REPUBLIC OF SOMALILAND MINISTRY OF PLANNING AND NATIONAL DEVELOPMENT Central Statistics Department OFFICIAL RELEASE Monthly Consumer Price Index October 2018 Methodology This publication provides the monthly
REPUBLIC OF SOMALILAND MINISTRY OFPLANNING AND NATIONALDEVELOPMENT Central Statistics Department OFFICIAL RELEASE
 REPUBLIC OF SOMALILAND MINISTRY OFPLANNING AND NATIONALDEVELOPMENT Central Statistics Department OFFICIAL RELEASE Monthly Consumer Price Index November 2018 Methodology This publication provides the monthly
Consumer Price Index
 Consumer Price Index July 2015 1 Released Date: 4 August 2015 (Base year 2007) Detailed by: Expenditure groups Household welfare levels Household type Regions Introduction The (CPI) is an important statistical
The annual CPI increased in Juba by 107.9% and in Wau by 115% from December 2014 to December 2015.
 THE REPUBLIC OF SOUTH SUDAN NATIONAL BUREAU OF STATISTICS (NBS) Press release 8 th Jan 16 Consumer Price Index for South Sudan ember The South Sudan annual Consumer Price Index (CPI) increased by 19.9%
REPUBLIC OF SOMALILAND MINISTRY OF NATIONAL PLANNING &DEVELOPMENT Central Statistics Department OFFICIAL RELEASE
 REPUBLIC OF SOMALILAND MINISTRY OF NATIONAL PLANNING &DEVELOPMENT Central Statistics Department OFFICIAL RELEASE Monthly Consumer Price Index November 2016 2016 Page 1 of 13 Consumer Price Index (CPI)
Headline and Core Inflation March 2018
 Mar-16 Mar-13 May-13 Jul-13 Sep-13 Nov-13 Jan-1 Mar-1 May-1 Jul-1 Sep-1 Nov-1 Jan-15 Mar-15 May-15 Jul-15 Sep-15 Nov-15 Jan-16 Mar-16 Central Bank of Egypt Headline and Core Inflation March 218 Annual
Interim HCPI COMESA. Macroeconomic Indicators. News Release - Interim HCPI-COMESA in June 2012 I N S I D E T H I S I S S U E
 Interim HCPI Issue No. 15 June 2012 Common Market for Eastern and Southern Africa () Macroeconomic Indicators News Release - Interim HCPI- in June 2012 region year - on - year inflation stood at 12.1%
Headline and Core Inflation December 2009
 Headline and Core Inflation December 2009 Headline CPI published by the Central Agency for Public Mobilization and Statistics (CAPMAS) on January 10, 2010, declined by 1.3 percent (m/m) in December 2009,
Major Highlights. Recent Economic Developments. September/October,2016. Central Bank of Swaziland 1
 September/October,20 Major Highlights The country s headline inflation increased to 8.3 per cent in Septmber 20 from 8.0 per cent in August 20. Inflation rate (% y/y) 8.3 (Sep) Discount and prime rates