Budget and Finance Subcommittee
|
|
|
- Cori Ward
- 5 years ago
- Views:
Transcription

1 MEETING OF THE Budget and Finance Subcommittee MEETING DATE May 15, 2014 TIME LOCATION 12:00 p.m. Valley Metro 101 N. 1 st Ave. 10 th Floor Board Room Phoenix, AZ VALLEY METRO 101 N 1ST AVE STE 1300 PHOENIX AZ
2
3 May 9, 2014 Budget and Finance Subcommittee Agenda Thursday, May 15, th Floor Board Room 101 N. 1 st Avenue, 10 th Floor 12:00 p.m. For those participating by telephone, please mute your phone when not speaking. Members please make sure your microphone is turned on when speaking and turned off when you are not speaking. Action Recommended 1. Public Comment For information An opportunity for general public comment on issues related to Valley Metro. Up to three (3) minutes will be provided for each speaker. 2. Minutes For action Minutes from the April 10, 2014 BFS meeting are presented for approval. 3. Valley Metro Fiscal Year 2015 (FY15) Preliminary Operating and Capital Budget For action John McCormack will present the FY15 Budget and Five Year Plan (FY15 thru FY19), for the subcommittee to review and recommend approval to forward to the RPTA Board of Directors for approval Transit Life Cycle Program For information Paul Hodgins will present the 2014 update to the Transit Life Cycle Program. The presentation will include forecasts of bus and rail operating and capital costs thru the end of the Prop 400 funding period (FY 2026) VALLEY METRO 101 N 1ST AVE STE 1300 PHOENIX AZ
4 5. Future BFS Agenda Items For information Chair McDonald will request future BFS agenda items from members. 6. Next Meeting For information The next meeting of the BFS is scheduled for Thursday, October 9, 2014 at 12:00 p.m. Draft Agenda Items FY14 Financial Results FY15 Q1 Financial Results Budget process improvements o Benchmarks for salary staffing levels Qualified sign language interpreters are available with 72 hours notice. Materials in alternative formats (large print, audiocassette, or computer diskette) are available upon request. For further information, please call Rosalia Castro, Valley Metro at or TTY at To attend this meeting via teleconference, contact the receptionist at for the dialin-information. The supporting information for this agenda can be found on our web site at 2
5 DATE AGENDA ITEM 1 May 9, 2014 SUBJECT Public Comment PURPOSE For information BACKGROUND/DISCUSSION/CONSIDERATION An opportunity for general public comment on issues related to Valley Metro. Up to three (3) minutes will be provided to each speaker. COST AND BUDGET None COMMITTEE PROCESS None RECOMMENDATION For information only CONTACT John P. McCormack Chief Financial Officer jmccormack@valleymetro.org ATTACHMENTS None VALLEY METRO 101 N 1ST AVE STE 1300 PHOENIX AZ
6 DATE AGENDA ITEM 2 May 8, 2014 Summary Minutes of the Budget and Finance Subcommittee April 10, 2014 Lake Powell Board Room Phoenix, AZ 12:00 p.m. Meeting Participants Councilmember, Jim McDonald, City of Avondale Councilmember, Jenn Daniels, Town of Gilbert (via phone) Vice Mayor, Joe Pizzillo, City of Goodyear Councilmember, Thelda Williams, City of Phoenix Chair McDonald called the meeting to order at 12:04 p.m. 1. Public Comment None 2. Summary Minutes IT WAS MOVED BY COUNCILMEMBER MCDONALD TO APPROVE THE SUMMARY MINUTES FROM THE FEBRUARY 13, 2014 MEETING OF THE BUDGET AND FINANCE SUBCOMMITTEE (BFS). THERE WERE NO QUESTIONS OR CONCERNS FROM ANY OF THE SUBCOMMITTEE MEMBERS. VALLEY METRO 101 N 1ST AVE STE 1300 PHOENIX AZ

7 3. Fiscal year 2014 (FY14) Third Quarter Reports Finance Division FY14 Third Quarter Report Budget and Finance Subcommittee April 10, 2014 John McCormack presented the FY14 Third Quarter Report. The third quarter covers the period January thru March
 Bus 4,207,162 4,899,541 4,981,172 5,474,987 4,775,728 4,610,803 5,045,421 4,819,853 4,937,000 Light Rail 1,004,230 1,147,032 1,265,726 1,319,291 1,209,039 1,123,197 1,273,993 1,214,041 1,283,000")
8 7,000,000 6,000,000 5,000,000 4,000,000 3,000,000 2,000,000 1,000,000 Regional Ridership 0 July Aug Sept Oct Nov Dec Jan Feb Mar (est.) Bus 4,207,162 4,899,541 4,981,172 5,474,987 4,775,728 4,610,803 5,045,421 4,819,853 4,937,000 Light Rail 1,004,230 1,147,032 1,265,726 1,319,291 1,209,039 1,123,197 1,273,993 1,214,041 1,283,000 FY14 Q2 FY14 Q3 (est.) FY13 Q3 Bus 14,861,518 14,802,274 15,003,821 Light Rail 3,651,527 3,771,034 3,665,627 2 Our ridership depicted by month, with bus ridership shown in the lighter purple and rail ridership shown in the darker purple. Bus ridership was 14.8 million passenger boardings, that is down 1.3% from last year (15.0 million). Councilmember Daniels, Town of Gilbert has joined the meeting. The light rail ridership was 3.8 million versus 3.7 million last year (an increase of 2.8% for the quarter). Overall total regional ridership was 18.6 million for the quarter versus 18.7 million in the prior year. Questions and Answers Vice Mayor Pizzillo asked what is causing these trends. Mr. McCormack said there are many factors; changing economic conditions, and we have seen a national drop in bus ridership. Most recently we have seen an upturn in ridership, this March bus ridership increased by 1.4% and rail ridership increased by 5.2%. 3
9 Valley Metro RPTA Operating Results RPTA Budget vs. Actual Report $ Millions For the quarter ending March 31, rd Quarter Year to Date Operations Expenditures Budget Actual Variance (Unfav.) Budget Actual Variance (Unfav.) Fixed Route Bus Paratransit Vanpool Regional Services Planning Administration (0.1) (0.0) METRO Rail (Salary, Fringe, OH) Total Operations Expenditures Agency FTE's Budget vs. Actual For the quarter ending March 31, rd Quarter Valley Metro Integrated Budget Actual Variance (Unfav.) Staff (Full Time Equivalents) Operations results for the third quarter are shown on the left side of the table, with the year to date shown on the right side. Operations expenditures totaled $31.8 million, $2.3 million favorable versus the $34.1 million budget. Fixed route bus expended $100,000 higher than plan this quarter; however, the year to date expenditures are projected to be $2.0 million favorable to plan. Paratransit expenses were $200,000 less than planned for the third quarter and for the year to date we are $800,000 favorable to plan. Administration expenditures are $100,000 more than planned for the third quarter; however, year to date spending is right on plan. All of the remaining expenses are tracking favorable to plan. Full time equivalents (FTE s) as of March are 265 versus budget FTE s of 288, with 23 open positions. Of the unfilled positions, 15 are Operations, 1 Planning, 0 in Design and Construction and 8 are in other administrative. Questions and Answers Councilmember Williams, City of Phoenix, asked what the difference in Administration was. Mr. McCormack said the timing of the contractor billings. There is often lag in getting the billings submitted. 4

10 Open Positions Status Valley Metro Integrated Agency FY 2014 Adopted Positions - Status Update Division Q2 December Open Q3 March Open Operations and Maintenance Administrative & Organizational Development 4 4 Planning & Development 3 1 Safety & Security 0 1 Communication & Marketing 2 1 Design & Construction 3 0 Finance 1 1 Total Open Positions % 8% Total Authorized Positions Here is a snapshot of the open positions by Division. On December 31 we had 34 open positions and as of March we have 23 positions open. The majority of open positions are in Operations and Maintenance, there are 15 open positions. In the Administration and Organizational Development Division we are currently restructuring our IT resources which we anticipate will be completed in next 2-3 months. Of the 23 open positions, 5 were newly authorized positions at the beginning of this fiscal year and the timing of the new hires is predicated on status of new capital projects, notably the Tempe Streetcar, Gilbert Road and OMC Solar projects which have ramping up slower than anticipated this time last year when the budget was developed. 5
11 Valley Metro RPTA Capital Results RPTA Budget vs. Actual Report For the quarter ending March 31, rd Quarter Capital Expenditures Budget Actual Year to Date Variance (Unfav.) Budget Actual $ Millions Variance (Unfav.) Bus Purchases Valley Metro Lead Agency Paratransit Vehicles Lead Agency Vanpool Vehicles Other Capital METRO Rail Total Capital Expenditures Capital Expenditures for the quarter were $47.8 million versus $45.4 million in the budget. Third quarter purchases for Valley Metro and lead agency buses were both greater than planned ($9.5 million and $1.2 million). On the year-to-date side we are at $22.6 million and have completed all bus purchases for this year. We will end up right on plan. All paratransit vehicles have been paid for. The large variance for Valley Metro capital is due to the timing of expenditures for Tempe Streetcar, OMC Solar, and Central Mesa Extension running slower than anticipated. 6

12 4. Valley Metro Fiscal Year 2015 (FY15) Preliminary Operating and Capital Budget Fiscal Year 2015 Valley Metro RPTA Preliminary Operating and Capital Budget Five Year Operating Forecast and Capital Plan Budget and Finance Subcommittee April 10, 2014 Mr. McCormack presented the Preliminary Operating and Capital Budget and Five Year Operating Forecast and Capital Plan. The budget is prepared in a collaborative effort with member city input from the Financial Working Group and Regional Transit Authority Group members. 7
13 Budget Process October 2013 Operations budget assumptions developed November - December 2013 Member city input regarding Rail Operations February 18, 2014 Draft Operating and Capital budgets delivered to RTAG and Financial Working Group for review and incorporation into Member City Budgets February 28, 2014 Executive Summary posted to Website March 14, 2014 Comments due from member city staff March 28, 2014 Proposed budget submitted to RMC, and TMC April 2014 Presentations of proposed budget to TMC, RMC, BFS and Boards for information May 2014 Presentations of final budget to TMC, RMC, BFS and Boards for adoption 2 Our goal is to achieve effective coordination with the schedule and development of member city budgets. We began in October with preliminary operating budget assumptions. In February 2014, we delivered the comprehensive draft budget to the Financial Working Group and RTAG working groups, and posted the Executive Summary to the website: FY15_Budget_-_RPTA.pdf During the month of March we have received comments and answered questions from Member City staff. After today s presentation, we will address follow up questions. We plan to request the Board to adopt the budget in the May meeting cycle. 8
 Sales Tax, Regional Funds, carryforwards from FY14 total 67% of the total revenue, Federal Funds are 11%, and local")
14 FY15 Funding Sources $339.8 Million 3 Total funding sources for Valley Metro for FY15 total $340 million. Public Transportation Funds (PTF) Sales Tax, Regional Funds, carryforwards from FY14 total 67% of the total revenue, Federal Funds are 11%, and local funds total 9% of the overall budget revenue. 9

15 FY15 Uses of Funds 4 Uses of Funds are shown above and total $340 million. The top five categories of expense are: Lead Agency Disbursements 27% Transit Service Contracts and Fuel 25% Personnel 7% Capital Expenditures 9% PTF Bond Disbursements for LRT Construction 17% 10
16 FY15 Baseline Budget Fixed Route Bus Services No significant change FY14 service levels 11.7 million vehicle revenue miles 18.5 million passenger trips Fleet 347 units Dial a Ride and Paratransit Services East and West Valley taxi cab based operations Service demand estimate 530,000 passenger trips Lead Agency funding to Phoenix and West Valley cities $16.4M Vanpool Services Over 400 vehicles providing 1.2 million trips 5 The FY15 Budget is based on a baseline of services. 11
17 FY15 Baseline Budget Regional Services Customer Service Call Center Mobility Center Capital Budget 52 Standard Bus Replacements (Lead Agency) 6 Service Expansion Buses 29 Paratransit Fleet Replacements (Lead Agency) 119 Vanpool Units 73 Replacements & 46 Expansion $1.9M Regional Communications Upgrade $14.1M Scottsdale/Rural Road LINK 6 The Regional Customer call center is staffed to handle 1.8 million calls in the coming year. In the mobility center persons with disabilities are certified for ADA transit services and training is provided to utilize the bus and rail systems to complement our dial a ride services. We anticipate continuing at our current levels of 4,800 certification reviews in the coming year. 12
18 FY15 Initiatives Year 2 East Valley Bus Services Unification $65.9M FY15 cost; versus $71.4M old model Year 3 East Valley Dial a Ride 330,000 trips $8.7M FY15 vs. 203,000 trips $8.8M in FY12 Marketing Enhanced wayfinding program Website renovation Phase I Value of Transit Campaign Super Bowl 2015 Planning Origins & Destinations Study Transit Standards & Performance Measures Information System Improvements Continuation of network equipment upgrades and life cycle updates Staff development to meet increasing technology demands Applications: SharePoint & unified ERP development 7 Mr. McCormack reviewed FY15 Initiatives. 13
19 FY15 Funding Sources $ in thousands Funding Sources FY15 FY14 Change $ Change % Public Transportation Funds $ 127,672 $ 120,246 $ 7,426 6% Transit Service Agreements 29,357 30,573 (1,216) -4% Federal Grants 38,377 28,396 9,981 35% METRO Rail Reimbursement 15,270 15,389 (119) -1% Fixed Route Fare Revenues 16,139 14,167 1,972 14% AZ Lottery Proceeds 11,475 11, % Regional Area Road Funds 4,711 4, % Other Revenues 1,643 3,104 (1,461) -47% Bond Proceeds - 114,150 (114,150) -100% Carry forwards and Reserves 95,170 21,810 73, % Total $ 339,814 $ 363,619 $ (23,805) -7% 8 Mr. McCormack reviewed the FY15 Funding Sources versus FY14. Questions and Answers Vice Mayor Pizzillo asked what comprises the Other Revenues category. Mr. McCormack said he will get an answer to Vice Mayor Pizzillo. Councilmember Williams asked if the Federal Grants are already secured. Mr. McCormack said the Federal Grants are already secured. Chair McDonald asked for more detail regarding funding in the West Valley causing a reduction in transit service agreements. Mr. McCormack said with the Avondale UZA, the way the federal funds are divided, there are more federal funds available in the West Valley than in prior years. Those funds are replacing member city contributions. It is a positive effect. Chair McDonald asked about the FY15 Initiatives Year 2 East Valley Bus Services Unification, are the reduced costs related to the fuel savings. 14
20 Mr. McCormack said he will get an answer to Chair McDonald on the fuel savings. The major reduction in costs are due to consolidating services with more effective route scheduling and fewer deadhead miles due to moving buses to Tempe. Mr. Banta commented that we have one of each of the following: dispatch center, general manager, maintenance manager, and field supervising team. The overall oversight of East Valley bus service is more efficient. The deadhead miles are reduced because we can optimize the use of two facilities. Mr. McCormack reported that Other Revenues included $1.4 million in IRS Fuel Tax credits. Mr. McCormack will provide a more detailed listing of what the revenues consist of. 15
21 FY15 Uses of Funds $ in thousands Uses of Funds FY15 FY14 Change $ Change % Lead agency disbursements $ 92,319 $ 81,914 $ 10,405 13% Transit service contracts & fuel 84,257 80,416 3,841 5% Capital 30,476 23,457 7,019 30% RPTA & METRO Personnel Costs 24,930 24, % Bond Principal & Interest 24,240 13,042 11,198 86% Contractual Agreements 5,631 4,280 1,351 32% AZ Lottery Disbursements 11,200 11,200-0% Lead Agency Bond Disbursements 55,900 42,585 13,315 31% Other Costs 10,749 10,766 (17) 0% Sub Total 339, ,131 47,571 16% Carry forwards to Reserves ,488 (71,376) -100% Total $ 339,814 $ 363,619 $ (23,805) -7% 9 Total Uses of funds are $340 million; $24 million lower than last year. Lead Agency Disbursements are up by $10 million, due to increased capital activity for light rail projects. Transit service contracts & fuel are up by $3.8 million due to combination of factors: Scheduled contracted rates for East Valley Bus Services are up by 4.7% $1.7 million of the increase is due to the accounting change for bus service purchased from Phoenix, which is now stated at full value in the budget. RPTA & METRO Personnel costs are up 2% Debt service is up as a result of the recent 2014 Bond Issue Bond Disbursements are up to fund the Northwest and Central Mesa Extension Construction activities. The subtotal for change of uses is up $48 million. The primary reason for the overall funding decrease is the bond funds are anticipated to be fully spent next year and the carry forwards will move from $71 million to $1.12 million. 16
22 AZ Lottery Funding & Distribution Cities Amount Tempe $ 474,508 Surprise 344,813 Scottsdale 637,841 Phoenix 4,241,703 Peoria 452,030 Mesa 1,288,213 Maricopa County 834,483 Goodyear 191,527 Glendale 665,234 Gilbert 611,633 Chandler 692,821 Buckeye 149,278 Avondale 223,694 Other 392,222 FY15 Base Revenue & Distribution $ 11,200,000 Prior Year Reserves (Wickenburg & Queen Creek) 275,000 Total FY15 Revenue $ 11,475,000 $ Other Jurisdictions: El Mirage, Queen Creek, Fountain Hills, Paradise Valley, Tolleson, Wickenburg, Youngtown, Guadalupe, Litchfield Park, Cave Creek, Carefree, Gila Bend, Apache Junction Prior Year Reserves Programmed in FY15: Grand Ave BRT Feasibility Study Buckeye Planning Studies Transit Standards and Performance Measures Base revenue is shown on the left side of the table anticipated $11.2 million for FY15. The direct distribution to member cities is shown on the right side of the table. The Other category includes: El Mirage, Queen Creek, Fountain Hills, Paradise Valley, Tolleson, Wickenburg, Youngtown, Guadalupe, Litchfield Park, Cave Creek, Carefree, Gila Bend, and Apache Junction. An additional $275,000 of prior year Arizona Lottery funding reserves will be used for: Grand Ave BRT Feasibility Study Buckeye Planning Studies Transit Standards and Performance Measures 17
23 FY15 Staff Cost Overview Staffing cost analysis FY 15 FY 14 change pct change $ million FTE % Salaries $ 17.8 $ 17.4 $ 0.3 2% Fringe Benefits $ 7.1 $ 7.1 $ 0.0 1% Total Salary and Fringe Benefits $ 24.9 $ 24.5 $ 0.4 2% Analysis of changes Salary Fringe Total Base Compensation FY14 $ 17.4 $ 7.1 $ 24.5 Less Allowance for Unfilled $ (0.6) $ (0.1) $ (0.7) Base increase $ 0.5 $ 0.2 $ 0.7 Fringe Benefit Adjustment $ (0.3) $ (0.3) New Positions $ 0.5 $ 0.2 $ 0.7 New Base Compensation FY15 $ 17.8 $ 7.1 $ Staff costs for FY15 are $24.9 million. This is up by 2.0% This year we have budgeted an allowance for unfilled positions, reducing the salary budget by $600,000. We have a base increase for salary and fringe costs not to exceed 3% of FY14 cost levels. Salary increases are awarded based on merit increases. In FY14 our actual health care costs came in lower than plan, and we have reduced the fringe benefits to true up FY15 to actual costs. We have identified 8 new positions required to meet agency needs. Bottom line is a $400,000 increase over last year s budget, which is one tenth of one percent of our annual budget of $340 million. 18
24 FY15 New Positions FY15 New Positions Title Division Scope of Work Service Analyst II Planning and Development Bus Service Planning and Performance Improvements Administrative Assistant Planning and Development Reduced outsourced services for cost reduction Network Administrator Administration Information Technology - growing network security requirements LRV Maintenance Technician I LRV Maintenance Technician I LRV Maintenance Technician II Operations - Rail Operations - Rail Operations - Rail Vehicle Preventative Maintenance - LRVs are now over five years old State of good repair schedule increases number of rebuilds of major components Transit Program Coordinator-Bus Operations - Bus Replace Tempe bus facility staff resource, formerly provided by City of Tempe Manager, Field Safety & Security Safety and Security Improve passenger security and interface with Public Safety resources 12 New positions include: A Service Analyst who will work in support of the Service Planning working group tasked with optimizing regional service with more productive routes to build ridership. An Administrative Assistant to replace contracted staff for a cost savings. A Network Administrator to address growing IT security requirements. Three LRV Maintenance Technicians to meet increased preventative maintenance requirements on the fleet that has now reached over five years old. A Transit Program Coordinator for our East Valley Bus Operation replacing staff formerly provided by the City of Tempe. A Field Safety and Security Manager who will work closely with police staff to optimize resource deployments in response to incidents and create a more secure environment for our passengers. 19
25 Questions and Answers: Councilmember Williams asked since we have continuous unfilled positions is there a way to reduce new positions and reclassify current empty positions. Mr. McCormack said we will be looking at that on an annual basis going forward. This is the first year we have established an allowance for unfilled positions. We have reduced the budget in anticipation that we will have positions that will not be filled throughout the year. An analysis will be done at the beginning of every year to determine if any of the existing allocated positions could be reallocated to fulfill new work requirements as the agency s needs for positions changes. Councilmember Williams asked about the validity of the Administrative Assistant position since we also have an administrative position that has been open for several months. Mr. McCormack said we have reviewed the current staff and can take another look at that position. The Administrative Assistant position in the FY15 budget has been contracted out for a number of years. This position has been identified as a long term need. In terms of the four open positions that are administrative, two are in IT, one is in Human Resources, and one is in Procurement. Councilmember Williams asked if we need both IT positions. Mr. McCormack said yes due to the increasing IT security needs. Our fare collection systems take credit card payments which have to pass data security standards. We have to constantly upgrade and maintain the firmware in order to prevent a security breach. Vice Mayor Pizzillo asked what is being budgeted for the merit increase. Mr. McCormack said 3%. Vice Mayor Pizzillo asked if we have any early indication of the pricing for healthcare. Mr. McCormack said we are limiting the company cost to 3% over last year. We are tailoring the program to change employee versus employer contributions to hold healthcare cost to a net 3% increase over the current levels. Vice Mayor Pizzillo asked if we would be shifting some of the costs from the employer to the employee. Mr. McCormack said yes, in terms of program design and the premiums that they pay every month. Chair McDonald asked if the open positions in Operations and Maintenance will ever be filled. What is the number if we had all positions filled? 20
26 Mr. Banta, Chief Executive Officer said the $600,000 came from the Operations and Maintenance positions. Each year Mr. McCormack will look at where we are from a staffing perspective and adjust the $600,000 accordingly. The administrative and management positions we want to fill and have the ability to. It takes a long time to go through the hiring process. Councilmember Daniels suggested that we should approach this in a policy fashion. We could set a policy for a specific number of employees per miles served with a specific number that we would not exceed. This would allow Valley Metro to operate within that number versus justifying a specific position. Mr. Banta said he has seen other agencies utilize employees per mile of fixed route service, but not for administrative or technical positions. We could look at that to see what challenges or opportunities that might present. Chair McDonald agreed with Mr. Banta. It would be worth looking into for the Operations and Maintenance positions as the system grows. Vice Mayor Pizzillo expressed the allowance for unfilled positions methodology may cause issues in future years. Chair McDonald suggested we study this issue more and bring it back for recommendation. 21
27 Five Year Operating Forecast Valley Metro RPTA Five-Year Operating Forecast FY15-FY19 FY15 FY16 FY17 FY18 FY19 5 Years Revenues Public Transportation Fund (ADOT) $127.7 $134.9 $142.1 $149.2 $156.3 $710.2 PTF Bond Proceeds Less: Debt Service Bus & Rail Less: Rail Capital Funding Net PTF for Operations $67.6 $71.7 $75.8 $79.8 $83.8 $378.7 Regional Area Road Fund (RARF) $3.8 $3.9 $3.9 $4.0 $4.0 $19.7 Federal Funds -- Preventive Maintenance Other Federal Funds State grants MAG planning grants Transit service reimbursements: TSR - RPTA Fixed Route $24.0 $24.9 $25.0 $25.1 $26.0 $125.1 TSR - VTI - Fixed Route Paratransit - EVDAR TSR - Other Paratransit Fixed Route Fare Revenue $16.1 $16.5 $18.1 $19.9 $20.3 $90.9 Vanpool farebox revenue Interest and other revenue Total revenues $127.0 $130.0 $136.4 $143.2 $149.4 $ The total operating revenues for the five year forecast are $686 million. The Five Year revenue operating forecast contains increasing sales tax revenues from $128 million up to $156 million. Growth is about 5-6% this year and tapers off to 4.6%. A bond issue is planned in FY16, currently forecasted at $112 million. Debt service requirements will proceed with $24-26 million with an increase in FY17 to $40 million. Rail capital funding will total $270 million over the next five years. RARF funds are flat with a 2% increase. Federal Preventative Maintenance levels are forecasted at $3.8 million, based on MAG forecast. TSR revenues will increase slightly from $24 million to $26 million. Fixed Route Fare revenues are forecasted to increase in FY17, on July There will be a fare increase.25 cents on base fare. 22
28 Five Year Operating Forecast Valley Metro RPTA Five-Year Operating Forecast FY15-FY19 FY15 FY16 FY17 FY18 FY19 5 Years Expenditures Operations Fixed Route $79.7 $85.2 $87.8 $90.4 $92.9 $436.0 Paratransit - EVDAR Alternative Trans. Ridechoice, NWDAR, MS Vanpool Service ADA Subtotal operations expenditures $109.8 $116.4 $120.4 $124.3 $128.4 $599.2 Transportation Demand Management $1.6 $1.6 $1.6 $1.6 $1.6 $7.8 Planning & Administration Regional Services Safety & Security Operations Contingency Total expenditures $126.6 $132.4 $136.7 $140.9 $145.3 $682.0 Excess/(deficiency) of revenues over expenditures - operations $0.4 -$2.4 -$0.3 $2.3 $4.1 $4.1 *** VMR Staffing and AZ Lottery disbursements not included in the amounts listed above. 14 The total forecast is $682 million with a $4 million dollar surplus. Fixed route operating expense is the majority of the forecast at $436 million (3% increase). East Valley Dial-A-Ride is $49.6 million (5% with a 3% increase in contractor rates). ADA service payments are relatively flat. The Transportation Demand is forecasted to grow at 2% per year. 23
29 Five Year Capital Program Revenues 5-Year Revenues $ Millions FY15 FY16 FY17 FY18 FY19 Total Regional area road funds $0.4 $0.6 $0.6 $0.1 $0.2 $2.0 Public transportation funds FTA - Section FTA - Section 5307 ARRA FTA - Section FHWA - CMAQ FHWA - STP Vehicle/parts proceeds Undesig. Fund Balance Applied (PTF) Total Revenues $37.6 $21.3 $17.4 $34.7 $30.4 $ Capital revenues are $141.4 million. Public Transportation Funds grew from $3.2 million in FY15 and average out at $7-8 million dollars per year. The 5307 Federal monies are used to pay for bus replacements. Federal CMAQ funds are $12.4 million for FY15 and are used for the Scottsdale Rural Road Link project. FWHA-STP funds are used for vanpool fleet requirements. We will consume $12.4 million of PTF fund balance over the five year period. 24
30 Five Year Capital Program Expenditures 5-Year Expenditures $ Millions FY15 FY16 FY17 FY18 FY19 Total IT Infrastructure $0.4 $0.6 $0.6 $0.1 $0.2 $2.0 Standard Bus - Replacement Standard Bus - Expansion Express/BRT - Replacement Express/BRT - Expansion Rural Fleet - Replacement Paratransit Fleet - Replacement Vanpool Fleet - Replacement Vanpool Fleet - Expansion Fleet - Other Bus/Paratransit O/M Facilities Transit Centers (4-Bay) Vehicle Mgmt./Communications Sys Scottsdale Rural Rd LINK Total Expenditures $37.6 $21.3 $17.4 $34.7 $30.4 $141.4 *** VMR Capital and Debt Service not included in the amounts listed above 16 This slide is a breakdown of the Capital expenditures. 25

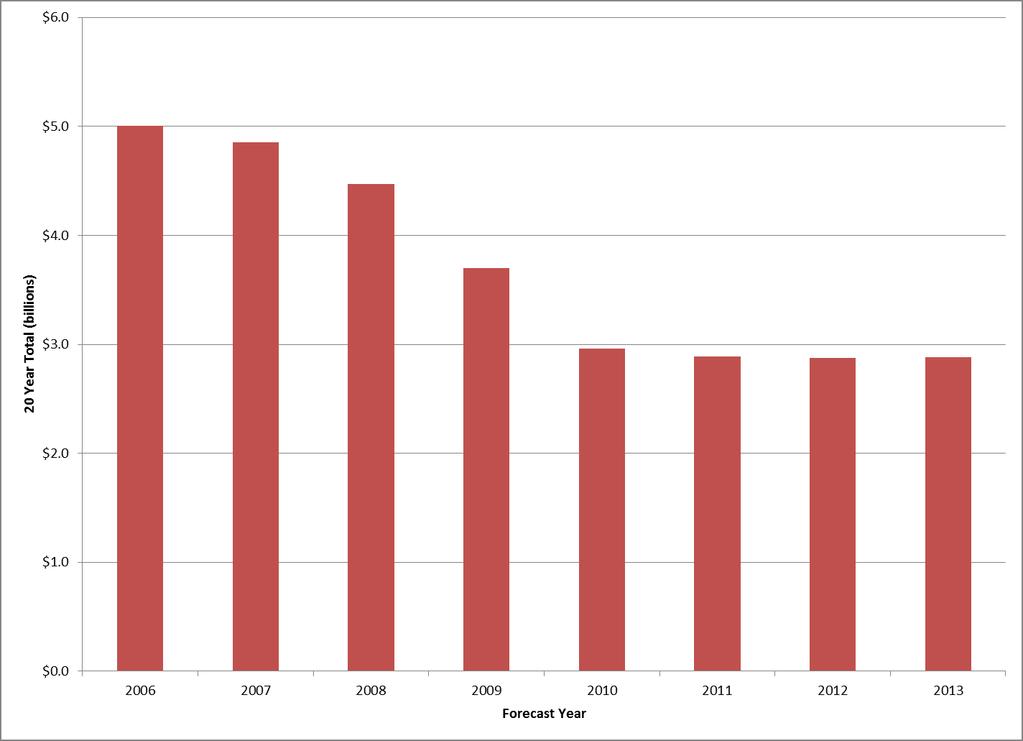
31 17 This slide shows a forecast of the Public Transportation Fund (PTF) balance by year. The fund balance increased in 2013 and will decrease with the coming capital expenditures. In 2016 and 2017 it bottoms out and will begin to build more balance as revenues generated will be greater than planned services. The purple bars are the Rail Program. The large increases indicate when bonds are issued. The red line is the Minimum Cash Reserve. 26
32 18 This slide displays the bus program divided into two levels. The yellow bars are the Bus Operating Program fund balance at year end. The green bars are the Bus Capital Program at year end. The Bus Capital rises and drops down as procurements (bus purchases) are made. In the future years we have a reserve in place for changes in federal funding or capital needs. The yellow bars are the Bus Operating Program. It tracks evenly just under $20 million and increases at the end of the program. This indicates we will be able to add service if we can continue the revenues forecasted by ADOT and able to hold costs at the current forecasted level. 27
33 Budget Next Steps April 2014 Presentations of Preliminary Budget - Information Transit Management Committee April 2 Budget and Finance Subcommittee April 10 Valley Metro RPTA Board April 17 May 2014 Adoption of Budget Transit Management Committee May 7 Budget and Finance Subcommittee May 15 Valley Metro RPTA Board May Future BFS Agenda Items Chair McDonald called for any future agenda items. There were none. 6. Next Meeting The next meeting is scheduled for Thursday, May, 15, 2014 at 12:00 p.m. CHAIR MCDONALD ADJOURNED THE MEETING. The meeting concluded at 1:02 p.m. 28
34 DATE AGENDA ITEM 3 May 9, 2014 SUBJECT Valley Metro Fiscal Year 2015 (FY15) Operating and Capital Budget and Five-Year Operating Forecast and Capital Program (FY15 thru FY19) PURPOSE To seek the Committee s recommendation to move for approval the FY15 Budget and Five-Year Operating Forecast and Capital Program (FY15 thru FY19). Approval of the budget provides funding for Board-approved TLCP projects and allows RPTA to implement capital and operating projects approved by voters in Proposition 400. Arizona State statutes require annual Board adoption of the budget. BACKGROUND/DISCUSSION/CONSIDERATION The Valley Metro Regional Public Transportation Authority (RPTA) FY15 combined operating and capital budget (the budget) is $324.6 million (M) and includes $127.7M in projects funded with Proposition 400 Public Transportation Fund (PTF) revenues. Of the $127.7M PTF revenues, $72.5M is for bus operating and bus capital and $55.2M is for light rail/high capacity transit capital. The preliminary FY15 operating and capital budget has been prepared with the goal of delivering a fiscally prudent, balanced budget using carry forwards, reserves and bond proceeds. The budget was developed in compliance with Board of Directors adopted budget, financial and Transit Life Cycle Program (TLCP) policies. The total operating budget of $153.6M represents a $7.6M (5%) increase from the previous year s operating budget of $146.0M. The total capital budget of $171.1M represents a $46.5M (21%) decrease from the previous year s capital budget of $217.6M. The major factors for the decrease in the capital budget are that no bonds are planned for issuance in FY15, ($114 M reduction) offset by $67.6 M in usage of carryforward balance to fund rail construction and other PTF funded activities. With the agency integration, the RPTA and Valley Metro Rail (VMR) budgets are developed with a unified staff plan, with department managers planning the level of effort required to meet the bus and rail activities. Salary and overhead charges to bus and rail projects are based on actual time worked on each project. For FY15 there are 296 employees budgeted in the integrated agency, with 131 FTE s budgeted to RPTA activities and 165 budgeted to VMR activities. Details and explanations of the major budget changes are discussed in the attached Budget Analysis and Overview document. VALLEY METRO 101 N 1ST AVE STE 1300 PHOENIX AZ
35 COMMITTEE PROCESS Preliminary Budget Review: Financial Working Group: February 24, 2014 for information RTAG: March 18, 2014 for information TMC: April 2, 2014 for information Budget and Finance Subcommittee: April 10, 2014 for information Board of Directors: April 17, 2014 for information Proposed Budget Adoption: TMC: May 7, 2014 approved Budget and Finance Subcommittee: May 15, 2014 for action Board of Directors: May 22, 2014 for action RECOMMENDATION It is recommended that the Budget and Finance Subcommittee move forward to the Board of Directors: Approval of the Valley Metro RPTA Fiscal Year 2015 Operating and Capital Budget (July 1, 2014 thru June 30, 2015) and Acceptance of the Five-Year Operating Forecast and Capital Program (FY 2015 thru 2019). CONTACT John P. McCormack Chief Financial Officer ATTACHMENTS Valley Metro Regional Public Transportation Authority (RPTA) 2015 Preliminary Operating & Capital Budget Overview 2
 FY 15 combined operating and capital budget (the budget) is $324.6 million (M) and includes $127.7 M in projects funded with Proposition 400 Public Transportation Fund (PTF) revenues.")
36 Valley Metro Regional Public Transportation Authority (RPTA) FY 2015 Preliminary Operating & Capital Budget Overview FY 2015 Total Financial Program The Valley Metro Regional Public Transportation Authority (RPTA) FY 15 combined operating and capital budget (the budget) is $324.6 million (M) and includes $127.7 M in projects funded with Proposition 400 Public Transportation Fund (PTF) revenues. Of the $127.7 M PTF revenues, $72.5 M is for bus operating and bus capital and $55.2 M is for light rail/high capacity transit capital. Valley Metro Regional Public Transportation Authority FY 2015 Preliminary Operating & Capital Budget Sources of Funds: (in thousand) Regional Funds $ 132,383 41% Carryforwards and reserves 79,993 25% Federal Funds 38,377 12% Local Funds State Lottery Funds 11,475 4% 9% Local Funds 29,358 9% Fare Revenues 5% Other revenues 5% Regional Funds 41% Fare Revenues 16,139 State Lottery Other revenues 16,917 Funds 5% Total $ 324,642 3% Federal Funds 12% Carryforwards and reserves 25% Uses of Funds: (in thousands) Lead agency disbursements (PTF and RARF) $ 77,031 Transit service contracts & fuel 84,257 Capital 30,476 Personnel costs (METRO Rail & RPTA) 24,873 Bond Principal & Interest 24,239 Contractual agreements 5,631 AZ Lottery disbursements 11,200 Lead agency bond disbursement 56,016 Other costs 10,807 Subtotal $ 324,530 Carryforwards and reserves (CF and Res.) 112 Total $ 324,642 Bond P & I 8% Bond Disbursements 17% Capital Expenditures 9% AZ Lottery 3% Other 3% Personnel 8% Contracts 2% Carry Forward & Reserves 0% Lead Agency Disbursements 24% Transit Service Contracts & Fuel 26% 1
37 Valley Metro Regional Public Transportation Authority (RPTA) FY 2015 Preliminary Operating & Capital Budget Overview Sources of Funds Funding Sources FY15 FY14 Change $ Change % Public Transportation Funds $ 127,672 $ 120,246 $ 7,426 6% Transit Service Agreements 29,358 30,573 (1,215) -4% Federal Grants 38,377 28,396 9,981 35% METRO Rail Reimbursement 15,274 15,389 (115) -1% Fixed Route Fare Revenues 16,139 14,167 1,972 14% AZ Lottery Proceeds 11,475 11, % Regional Area Road Funds 4,711 4, % Other Revenues 1,643 3,104 (1,461) -47% Bond Proceeds - 114,150 (114,150) -100% Carry forwards and Reserves 79,993 21,810 58, % Total $ 324,642 $ 363,619 $ (38,977) -11% Uses of Funds Uses of Funds FY15 FY14 Change $ Change % Lead agency disbursements $ 77,031 $ 81,914 $ (4,883) -6% Transit service contracts & fuel 84,257 80,416 3,841 5% Capital 30,476 23,457 7,019 30% RPTA & METRO Personnel Costs 24,873 24, % Bond Principal & Interest 24,239 13,042 11,197 86% Contractual Agreements 5,631 4,280 1,351 32% AZ Lottery Disbursements 11,200 11,200-0% Lead Agency Bond Disbursements 56,016 42,585 13,431 32% Other Costs 10,807 10, % Sub Total 324, ,131 32,399 11% Carry forwards to Reserves ,488 (71,376) -100% Total $ 324,642 $ 363,619 $ (38,977) -11% 2
38 Valley Metro Regional Public Transportation Authority (RPTA) FY 2015 Preliminary Operating & Capital Budget Overview FY15 FY14 FY14 Amount Percent*** Preliminary Adopted Revised Increase/ Increase/ ** Budget Budget Budget Decrease (Decrease) Note Sources of funds Revenues: Public transportation funds (PTF) $ 127,672 $ 120,246 $ 120,546 $ 7,426 6% (1) Transit service agreements 29,358 30,573 30,773 (1,215) -4% (2) Federal grants 38,377 28,396 30,404 9,981 35% (3) VMR staff & administration reimbursement 15,274 15,389 15,389 (115) -1% (4) Regional area road funds (RARF) 4,711 4,584 4, % Interest & other revenues 852 2,356 2,356 (1,504) -64% (5) Local participation (8) -3% State & local grants % Fixed Route Fare Revenues 16,139 14,167 14,167 1,972 14% (6) AZ Lottery Proceeds 11,475 11,200 11, % Total revenues 244, , ,289 16,990 7% Bond proceeds - 114, ,150 (114,150) -100% (7) Carryforwards & reserves 79,993 21,810 23,210 58, % Total revenues & other sources of funds $ 324,642 $ 363,619 $ 367,649 $ (38,977) -11% Uses of funds by category Expenses: Lead agency PTF disbursements $ 77,031 $ 81,914 $ 84,457 $ (4,883) -6% (8) Transit service contracts 84,257 80,416 81,877 3,841 5% (9) Capital outlay 30,476 23,457 26,870 7,019 30% (10) Salary & fringe benefits 24,873 24,471 24, % (11) Bond principal & interest expense 24,239 13,042 13,042 11,197 86% (12) Consultants & Maintenance contracts 5,631 4,280 4,298 1,351 32% (13) Contingency 1,601 4,163 1,365 (2,562) -62% (14) Rent & facility costs 4,854 2,714 2,714 2,140 79% (15) Advertising % (16) Transit book, outreach mat. & online serv % Insurance & risk management (34) -12% Safety & security (257) -93% (17) Lead agency RARF disbursements % Other administrative costs 2,088 1,822 1, % AZ lottery Disbursements 11,200 11,200 11,200-0% Lead agency bond disbursement 56,016 42,585 87,789 13,431 32% (18) Total expenses 324, , ,947 32,399 11% Carryforwards & contributions to reserves ,488 25,702 (71,376) -100% Total expenses & other uses of funds $ 324,642 $ 363,619 $ 367,649 $ (38,977) -11% Uses of funds by department Operating: Operations $ 115,623 $ 109,957 $ 111,417 $ 5,665 5% (19) Communications & Marketing 4,831 4,351 4, % (20) Finance, Administration & Org. Dev. 1,366 1,421 1,588 (55) -4% Planning & Development 3,654 2,206 2,206 1,448 66% (21) Chief Executive Officer's Department 1, % Non-Departmental 26,974 27,089 27,089 (115) 0% Total Operating Budget 153, , ,633 7,562 5% Capital: Design & Construction 101 1, (1,849) -95% (22) Valley Metro Rail 109,206 89, ,428 19,991 22% (23) Bus and other transit 61, ,448 78,801 (64,681) -51% (24) Total Capital Budget 171, , ,016 (46,539) -21% Total Operating & Capital Budget $ 324,642 $ 363,619 $ 367,649 $ (38,977) -11% *** Percentage change is compared to the FY14 Adopted Budget 3
39 Valley Metro Regional Public Transportation Authority (RPTA) FY 2015 Preliminary Operating & Capital Budget Overview Budget Analysis The following is an analysis of the major changes in the FY 15 Preliminary Budget versus the FY 14 Adopted Budget. The number in the Note column corresponds to the Note column of the FY 15 Preliminary Operating & Capital Budget (page 3). Sources of Funds: Note 1 Explanation Public Transportation Funds from the Maricopa County Transportation Excise Tax are forecasted to grow by 6%. Forecast is provided by ADOT. Adequate reserves are in place should collections fall short of ADOT forecast projections Service levels operated by Valley Metro have remained stable since the unification of fixed route bus services in the east valley commencing operation July 1, Transit service agreements are down, mainly due to additional 5307 Operations Funding applied to West Valley (ValuTrans) bus operations ($639K ) and the discontinuation of the mileage reimbursement program in Mesa (appx $700K). Federal Grants overall are up by $10.0M from $28.4M to $38.4M. Primary cause for change is CMAQ capital funding for LINK development along Scottsdale/Rural Road $8.8M, adding $8.3M over FY14. Contributions from Valley Metro Rail for staff are higher in FY 14 due to new positions to support increased safety, security and preventative maintenance activities. Base salary and fringe costs include a 3% increase for merit increases which are evaluated based on employee performance. Other revenues are down due to IRS Fuel Tax Credits program, which has not yet notified renewal levels in In FY 14 and going forward, VM collects and deposits fares collected with the City of Phoenix regional fare depository, which is credited back to members as well as to the PTF. The increase in FY15 is the addition of City of Phoenix collected fares which pertain to the services purchased by Valley Metro. (See Project 2010 ) The PTF Revenue Bond program in FY 14 issued $115M for the light rail capital program. The bonds generated $134M in proceeds at a true interest cost of 2.4%. No new bond issues are anticipated until Decrease in PTF Lead Agency Disbursements is primarily due to increased CMAQ funding applied to the Central Mesa Extension, which reduces PTF funding levels vs. FY14. PTF Lead Agency Disbursements also fund the Northwest Extension in Phoenix and the Tempe Streetcar Project. Transit service contracts are up $3.8M, or 5% primarily due scheduled rate increases in the Unified East Valley Fixed Route Bus contract. Capital Outlays are up in FY 15 primarily due to increasing expenditures programmed for the Scottsdale/Rural Road LINK. See Project
40 Valley Metro Regional Public Transportation Authority (RPTA) FY 2015 Preliminary Operating & Capital Budget Overview Uses of Funds by Category: Note Explanation Overall Salary and Fringe increase $0.4M, broken down as follows: Allowance for unfilled positions (-$0.7M), base salary and fringe increase $0.7M, fringe benefit adjustment (-$0.3M), new positions $0.7M. Bond principal and interest expense is up $11.2M, due to new debt service requirements of FY 14 Bond issue to fund LRT Capital construction. Overall consulting contracts and maintenance expense are up $1.3M, primarily due to increased service planning activities including the Regional Origins and Destinations Survey program ($0.8M). Contingency expense is down due to reduced number of bus replacement purchases in FY15 versus FY14. Contingency covers unanticipated changes to the cost of bus fleet versus TLCP programmed expenses. Rent and Facility costs are up primarily due to adjustments to Tempe Bus Facility costs. FY14 Budget understated the facility and utility costs. See Project 2015 for more details, overall FY15 Unified East Valley Fixed Route Bus program costs are up by 3.5% versus FY14. One-time investment for Super Bowl 2015 ($205K) to create a positive experience for residents and visitors attending the special events associated with Super Bowl. Vanpool marketing campaign ($25K) to occur as part of Rideshare Month (October) to increase ridership. Accounting change for FY15. Allied Barton security costs for the Greenfield Operations Facility moved to project 2015 RPTA Fixed Route Bus Service from project 2006 Regional Safety & Security. 18 Lead Agency Bond Disbursements are up by $13.4M to $56.0M due to increased LRT capital construction activity on the Northwest Extension in Phoenix and Central Mesa Extension. Uses of Funds by Department: Note Explanation Operations Dept up $5.7M primarily due to programmed contractual increases for the East Valley Fixed Route bus service $2.2M ( see project 2015), plus increases in contract payments to City of Phoenix ($2.8M) which are now funded by $1.8M in fare revenues. In prior years, fares were deducted from the billed charges for services. ( See Project 2010 ) Communication & Marketing initiatives to take place in FY15 include renovation of the Valley Metro website ($290K) and advertising for Super Bowl 2015 ($205K) to create a positive experience for residents and visitors attending the special events associated with Super Bowl. Planning and Development Department increases are due to cyclical requirement to perform regional Origins and Destinations Survey, $0.8M as well as continuing development of service standards and performance measures. The service standards and measures enable full compliance with MAP 21 and Prop 400 funding requirements as well as serve as basis for route service re-configuration for optimization of passenger services. A Grand Ave. corridor study added $0.2M this year. Design and Construction department costs are down due to the reclassification of Scottsdale/Rural Rd. LINK preconstruction and real estate activities to the Bus and Other Transit Capital line. (see Note 24 below and Project 9420) Valley Metro Rail activities up $20.0M due to increased level of LRT capital project construction. Bus and Other Transit Capital down $64.7M primarily due to reduction of Bus Capital purchases and decrease of Bond Cash Carryforwards. With increasing level of LRT construction in FY15, the remaining bond funds at the close of the Fiscal year will be significantly reduced. 5
41 Valley Metro Regional Public Transportation Authority (RPTA) FY 2015 Preliminary Operating & Capital Budget Overview Budget Development The preliminary FY 15 operating and capital budget has been prepared with the goal of delivering a fiscally prudent, balanced budget using carry forwards, reserves and bond proceeds. The budget was developed in compliance with Board of Directors adopted budget, financial and Transit Life Cycle Program (TLCP) policies. The total operating budget of $153.6 M represents a $7.6 M (5%) increase from the previous year s operating budget of $146.0 M. The total capital budget of $171.1 M represents a $46.5 M (21%) decrease over the previous year s capital budget of $217.6 M. The major factors for the decrease in the capital budget are that no bonds are planned for issuance in FY15, ($114 M reduction) offset by $67.6 M in useage of carryforward balance to fund rail construction and other PTF funded activities. Organizational Staffing With the agency integration, the RPTA and VMR budgets are developed with a unified staff plan, with department managers planning the level of effort required to meet the bus and rail activities. Salary and overhead charges to bus and rail projects are based on actual time worked on each project. For FY 15 there are 296 employees budgeted in the integrated agency, with 131 FTE s budgeted to RPTA activities and 165 budgeted to VMR activities. Compensation and fringe benefit assumptions for FY 15 include: Compensation budget based on 3% increase. For staff salary changes, merit increases are evaluated based on employee performance; departmental level control to manage total costs within budget. The Arizona State Retirement System (ASRS) contribution will increase 0.06 percent on July 1, Agency health care costs will increase. Program design is anticipated to hold total agency fringe benefit cost increases to within 3% of FY 14 levels. All VMR staff related costs are reimbursed in full by Valley METRO Rail, Inc. Staffing cost analysis FY 15 FY 14 change pct change $ million FTE % Salaries $ 17.8 $ 17.4 $ 0.4 2% Fringe Benefits $ 7.1 $ 7.1 $ 0.0 1% Total Salary and Fringe Benefits $ 24.9 $ 24.5 $ 0.4 2% Analysis of changes Salary Fringe Total Base Compensation FY14 $ 17.4 $ 7.1 $ 24.5 Less Allowance for Unfilled $ (0.6) $ (0.1) $ (0.7) Base increase $ 0.5 $ 0.2 $ 0.7 Fringe Benefit Adjustment $ (0.3) $ (0.3) New Positions $ 0.5 $ 0.2 $ 0.7 New Base Compensation FY15 $ 17.8 $ 7.1 $ 24.9 FY15 Preliminary Budget vs. FY14 Adopted Budget $ 0.4 6
42 Valley Metro Regional Public Transportation Authority (RPTA) FY 2015 Preliminary Operating & Capital Budget Overview The FTE Count by Pay Grades and Ranges can be found on page 121 of the preliminary budget document. Pay Ranges are currently under review for adjustment. Valley Metro is conducting a comprehensive survey of positions and pay grades with regional governmental agencies as well as transit peer cities located in the Western US. It is anticipated that pay grades may increase in response to inflation trends which have occurred since last changes to agency-wide pay grades made effective in July of Transit Life Cycle Program (TLCP) In 2005, the RPTA initiated the development of the 20-year TLCP to provide management and oversight for the implementation of the transit component of the Regional Transportation Plan, including bus operating and bus capital projects, and rail capital projects. The Board of Directors adopted the TLCP financial model and TLCP guiding principles in June 2005 and adopted the TLCP policies in October The TLCP guiding principles and policies were revised in This budget includes all the projects that are in the adopted TLCP for FY 15. Major TLCP projects included in the preliminary FY 15 budget include the following: TLCP Rail Capital Program The FY 15 TLCP Rail Capital Program includes utility relocation reimbursements and construction for the Central Mesa Extension and Northwest Extension, phase 1. The program also includes planning funds for the Tempe Streetcar, Phoenix West Extension and Glendale. PTF and bond proceeds are passed through as a lead agency disbursements to Valley METRO Rail, Inc., the designated lead agency on the rail project, to carry out the FY 15 TLCP rail capital program. Major Projects and Studies RPTA will undertake a number of key projects during FY 15, as the agency continues the implementation of the TLCP operating and capital projects. Funding for these projects and studies comes from a combination of sales tax revenues (PTF and Regional Area Road Funds [RARF]) and federal grants. The major projects and studies included in the FY 15 budget include the following: Corridor and Facility Development The Corridor and Facility Development Section is responsible for transit corridor planning, facility development, environmental studies and monitoring, sustainability planning, Environmental Justice/Title VI compliance, Transit Oriented Development facilitation and support of member agencies. The regional origins and destinations survey will be conducted to gather passenger data critical to regional system planning. Examples of projects for FY15 include development of regional transit facility standards, Scottsdale/Rural Rd LINK project development, Peoria transit facility project development, Grand Ave BRT feasibility study, and continued development of a regional bus stop data base in coordination with the City of Phoenix. [RARF $525,000, PTF $509,851, MAG-Planning Program $100,000, AZ Lottery Proceeds $100,000]. System and Services Development The System and Service Development Section is responsible for transit system planning in support of MAG, transit planning studies, service planning, fleet planning, grant applications, GIS administration, preparation of programming documents such as the Short Range Transit Plan, transit surveys and research. Examples of projects for FY15 include continued development of service standards and performance measures, establishment of process for transit service changes, planning studies for Buckeye, partnership with MAG on a Southeast 7
43 Valley Metro Regional Public Transportation Authority (RPTA) FY 2015 Preliminary Operating & Capital Budget Overview Valley Transit Study, an update of the Regional Para-Transit Study, and the Origin & Destination Survey. Beginning in FY14, planning projects were consolidated and budgeted to projects 3306 Corridor & Facility Development and 3307 System & Services Development. [RARF $401791, PTF $650,078, MAG-Planning Program $400,000, 5307 Funding $600,000, AZ Lottery Proceeds $175,000]. Valley METRO Rail RTP Planning Funds RPTA is providing Valley METRO Rail, Inc. with $500,000 to be used for rail specific Regional Transportation Plan (RTP) planning needs. This money is restricted for the planning and administration of projects in the RTP and cannot be used for any other purpose. [RARF $500,000]. Regional Marketing Program Transit Book Development and Printing: The Transit Book is the primary route and schedule communications vehicle in conjunction with online information for Valley Metro transit riders. It is developed and distributed twice a year. Associated with the Transit Book are schedule kiosk posters, guide-a-ride bus stop signage and system maps. Evolution of the Transit Book is being considered in FY15 as mobile and online tools improve. [PTF $298,000] Wayfinding Signage (Portion of Project 7200 Consultants): The wayfinding signage program is an effort to provide improved, more custom passenger information at the point(s) of boarding and multi-modal connections. Phase I includes enhanced signage at light rail station platforms. In FY15, Valley Metro plans to update/maintain the light rail station signage and build improved signage at regional transit centers. Future phases will include enhanced signage at park-andrides and guide-a-ride bus stops. [PTF $153,000] Printed Communications: Various forms of printed materials continue to be essential for providing transit related information to transit users, non-users, key stakeholders, and partners. This budget includes the printing of brochures, passenger notices, car cards, newsletters, ride guides and additional kiosk signage. Printed materials support all regional services, including paratransit options, rural route(s) and fixed route operations. [PTF $102,500] Website Design and Navigation: The mission of valleymetro.org is to provide up-to-date information needed to use Valley Metro services, educate the public about the services and their benefits and promote alternative modes of transportation. This budget supports ongoing website maintenance and upgrades. It also includes significant improvements to the online trip planner function and support for the new trip-planning mobile application in FY15. Improvements and new technology are essential to creating effective online communications, particularly important as Valley Metro considers transition of the Transit Book. [PTF $465,988]. Advertising Campaigns: Valley Metro and its ad agency, Moses, plan to implement programs in FY15 that promote safety, discretionary ridership and build awareness for the value of regional transit. The campaigns will include creative concepting, print and social media executions and media buys. In addition, and also included in this budget, are efforts to support and capitalize on Super Bowl 2015 and limited ridership appreciation efforts. [PTF $486,800] Regional Transportation Demand Management (TDM) Program The Regional TDM Program, administered by Valley Metro Commute Solutions, provides commute options to the general public and Valley employers. Services include a computerized matching system for carpooling, vanpooling, transit and bicycle partner opportunities; marketing of alternative transportation modes and schedules; and technical assistance and training to participants in the Maricopa County Trip Reduction Program. Commute Solutions also oversees 8
44 Valley Metro Regional Public Transportation Authority (RPTA) FY 2015 Preliminary Operating & Capital Budget Overview and manages regional vanpool services and the Clean Air Campaign. This Clean Air Campaign is a private/public partnership that aspires to increase awareness of air quality and transportation issues and to increase the use of alternative modes of transportation and work schedule options. A Clean Air Campaign Awards and Luncheon is held annually. Regional bicycle and pedestrian safety and education programs are also part of the Commute Solutions group. [Federal and State $1.5 million, Other $832,104] 9
45 Valley Metro Regional Public Transportation Authority (RPTA) Five-Year Operating Forecast and Capital Program FY 2015 FY 2019 The Regional Public Transportation Authority (RPTA) has the primary responsibility of implementing the operating and capital components of the transit element identified in the 20- year Regional Transportation Plan (RTP). The operating component includes the expansion of regional fixed route services, high-capacity transit alternatives, vanpools and paratransit services throughout the region. The capital component of the transit element of the RTP includes fleet replacement and expansion as well as the development of new park-and-rides, transit centers, passenger facilities, and maintenance and operations facilities over the life of the plan. Construction of the light rail RTP components has been designated to METRO Rail by the RPTA. The primary funding component of the operating and capital programs identified in the transit element is made possible by a dedicated funding source approved by voters with the passage of Proposition 400 in November This funding source is referred to as the Public Transportation Fund (PTF). In addition to the public transportation fund, local and federal resources contribute to financing the 20-year plan. For the Five-Year Operating Forecast, the Operations revenues and expenditures are based on current costs, as used for the development of the adopted FY2014/15 Operating budget, with an annual inflation escalation of three percent (3%) for the remaining four years. Other assumptions in the Five-Year Operating Forecast are as follows: The Regional Area road Fund has been inflated by 1.2% annually Fares are inflated by 2% annually with a ten-percent (10%) increase assumed in FY17 Federal grant funds were reduced in FY16 due to the lapsing of the one-time CMAQ close-out infusion. Planning, Administration, and Regional Services costs has been inflated two percent (2%) for the last four (4) years of the forecast The proposed service changes within the five-year time period that have been incorporated into the plan as proposed by the Transit Life Cycle Program are as follows: For FY 2015: Extension of Route 138 in Peoria For FY 2016: Addition of the Scottsdale/Rural Rd LINK Reduced service on the Main Street LINK due to the LRT extension For FY 2017: No service changes For FY 2018: Begin Route 104 Saturday service in Chandler 10
46 Valley Metro Regional Public Transportation Authority (RPTA) Five-Year Operating Forecast and Capital Program FY 2015 FY 2019 For FY 2019: Begin PTF funding of Route 50 in Scottsdale 11
47 Valley Metro RPTA Five-Year Operating Forecast FY15-FY19 Preliminary (thousands) Budget Projected Projected Projected Projected Total FY15 FY16 FY17 FY18 FY19 5 Years Revenues Public Transportation Fund (ADOT) $ 127,672 $ 134,901 $ 142,087 $ 149,234 $ 156,267 $ 710,161 PTF Bond Proceeds - 112, ,000 Less: Debt Service Bus & Rail (24,239) (26,735) (40,793) (40,964) (41,094) (173,825) Less: Rail Capital Funding (35,844) (148,471) (25,520) (28,440) (31,352) (269,627) Net PTF for Operations $ 67,589 $ 71,695 $ 75,774 $ 79,830 $ 83,821 $ 378,709 Regional Area Road Fund (RARF) $ 3,847 $ 3,893 $ 3,940 $ 3,987 $ 4,035 $ 19,702 Federal Funds -- Preventive Maintenance 7,020 3,751 3,751 3,751 3,751 22,023 Other Federal Funds 1,166 1,201 1,225 1,250 1,275 6,117 State grants ,845 MAG planning grants ,630 Transit service reimbursements: TSR - RPTA Fixed Route $ 24,015 $ 24,864 $ 25,017 $ 25,142 $ 26,039 $ 125,077 TSR - VTI - Fixed Route 1,825 2,606 2,660 2,746 2,834 12,671 Paratransit - EVDAR 1,528 1,580 1,890 2,409 3,045 10,451 TSR - Alt. Trans. Ridechoice, NWDAR, M 1,954 2,013 2,073 2,135 2,199 10,374 Subtotal $ 29,322 $ 31,063 $ 31,640 $ 32,432 $ 34,117 $ 158,573 Fixed Route Fare Revenue $ 16,139 $ 16,462 $ 18,108 $ 19,919 $ 20,317 $ 90,945 Vanpool farebox revenue ,417 Interest and other revenue Total revenues $ 127,040 $ 130,047 $ 136,448 $ 143,206 $ 149,381 $ 686,122 Expenditures Operations Fixed Route $ 79,680 $ 85,195 $ 87,813 $ 90,396 $ 92,944 $ 436,028 Paratransit - EVDAR 8,735 9,145 9,886 10,497 11,355 49,618 Alternative Trans. Ridechoice, NWDAR, MS 2,395 2,467 2,541 2,617 2,696 12,716 Vanpool Service ,417 ADA 18,166 18,711 19,272 19,850 20,446 96,445 Total operations expenditures $ 109,808 $ 116,375 $ 120,396 $ 124,268 $ 128,377 $ 599,224 Transportation Demand Management $ 1,552 $ 1,552 $ 1,552 $ 1,552 $ 1,552 $ 7,760 Planning & Administration 6,141 6,264 6,389 6,517 6,647 31,958 Regional Services 7,731 7,886 8,044 8,205 8,369 40,235 Safety & Security ,730 Operations Contingency 1, ,030 Total expenditures $ 126,594 $ 132,416 $ 136,727 $ 140,895 $ 145,305 $ 681,937 Excess/(deficiency) of revenues over expenditures - operations $ 446 $ (2,369) $ (278) $ 2,310 $ 4,076 $ 4,185 Less: Bus Capital Funding $ (9,831) $ (13,453) $ (6,871) $ (8,812) $ (7,899) $ (46,866) Undesignated fund balance, July 1 $ 104,803 $ 95,418 $ 79,596 $ 72,447 $ 65,945 $ 104,803 Excess/(deficiency) (9,385) (15,822) (7,149) (6,502) (3,823) (42,681) Undesignated fund balance, June 30 $ 95,418 $ 79,596 $ 72,447 $ 65,945 $ 62,122 $ 62,122 Reconciliation to Annual Operating Budget: Operations Expenditures (Above) $ 126,594 $ 132,416 $ 136,727 $ 140,895 $ 145,305 $ 681,937 VMR Staffing 15,274 16,169 17,088 17,430 17,779 83,740 VMR RARF Distribution ,500 AZ Lottery Disbursements 11,200 11,200 11,200 11,200 11,200 56,000 Total Operating Expenditures $ 153,568 $ 160,286 $ 165,515 $ 170,025 $ 174,783 $ 824,177 12
48 Five-Year Capital Program/All Projects FY 2015 through FY 2019 (thousands) 5-Year FY15 FY16 FY17 FY18 FY19 Total Revenues 4000 Regional area road funds $365 $647 $638 $142 $213 $2, Public transportation funds $3,195 $7,687 $6,871 $8,812 $7,899 $34, FTA - Section 5307 $6,881 $4,451 $7,097 $18,464 $13,777 $50, FTA - Section 5307 ARRA $3, $3, FTA - Section $237 $ $ FHWA - CMAQ $12, $12, FHWA - STP $4,339 $2,525 $2,608 $7,126 $8,416 $25, Vehicle/parts proceeds - $20 - $155 $70 $ Undesig. Fund Balance Applied (PTF) $6,636 $5, $12,402 $37,629 $21,333 $17,352 $34,699 $30,374 $141,387 Expenditures 5000 Salaries, Fringe & Overhead $ $ Fleet inspections $48 $51 $55 $99 $90 $ Consultants (direct) $ $ Consultant-D&C Support $ $ Real Estate/ROW Acq $1, $1, Printing $ $ Postage & delivery $ $ Other direct expenditures $ $ Preparation costs for sales of vehicle/parts - $20 - $155 $70 $ Local meetings & mileage $ $ Lead agency PTF disbursements $5,603 $5,253 $5,139 $4,070 $3,835 $23, Regional fleet $16,346 $14,914 $11,076 $29,539 $25,541 $97, Equipment $ $ Computers & Software $365 $647 $638 $142 $213 $2, Site Improvements $11,772 $250 $250 $150 $100 $12, Capital contingency (PTF) $171 $199 $195 $545 $525 $1,635 $37,629 $21,333 $17,352 $34,699 $30,374 $141,387 Expenditures by Department and Project IT Infrastructure $365 $647 $638 $142 $213 $2,003 Standard Bus - Replacement $8,705 $10,171 $9,929 $27,775 $26,792 $83,372 Standard Bus - Expansion $1, $1,813 Express/BRT - Replacement - $6,906 $3,184 $3,315 - $13,404 Express/BRT - Expansion $5, $5,121 Rural Fleet - Replacement - $297 $ $469 Paratransit Fleet - Replacement $280 $330 $259 $505 $490 $1,864 Vanpool Fleet - Replacement $2,639 $1,575 $1,630 $1,650 $1,672 $9,166 Vanpool Fleet - Expansion $1,700 $950 $978 $1,008 $1,038 $5,674 Fleet - Other - $20 - $155 $70 $245 Bus/Paratransit O/M Facilities $435 $250 $250 $150 $100 $1,185 Transit Centers (4-Bay) $10 $188 $ $510 Vehicle Management/Communications Systems $2, $2,485 Dedicated LINK Right-of-Way and Improvements $14, $14,076 $37,629 $21,333 $17,352 $34,699 $30,374 $141,387 Other Capital Expenditures Debt Service Bus & Rail $24,239 $26,735 $40,793 $40,964 $41,094 $173,824 Rail Capital Funding $109,206 $58,628 $110,489 $27,744 $17,062 $323,130 Total Capital Expenditures $171,074 $106,696 $168,634 $103,407 $88,530 $638,341 13
49 Fiscal Year 2015 Valley Metro RPTA Preliminary Operating and Capital Budget Five Year Operating Forecast and Capital Plan Budget and Finance Subcommittee May 15, 2014
50 Budget Process October Preliminary Operating Assumptions Budget developed using zero-based budgeting techniques February 18, 2014 Draft Operating and Capital budgets delivered to RTAG and Financial Working Group for review and incorporation into Member City Budgets February 28, 2014 Executive Summary posted to Website Member City Reviews Financial Working Group and RTAG April 2014 Presentations of proposed budget to TMC, BFS and Boards for information May 2014 Presentations of final budget to TMC, BFS and Boards for adoption 2

51 FY15 Uses of Funds $324.6 Million 3

52 FY15 Funding Sources $324.6 Million 4
53 Changes to Budget vs. April Preliminary Budget $15M Reduction in Overall Budget to $325M Operating Budget remains same $154M Capital Budget reduced to $171M (down from $186M) Capital Budget Changes due to Rail Capital funding reduction Lead Agency Disbursements to fund Rail Capital reduced Consumption of Carryforwards and Reserves reduced No impact to overall Five Year Operating and Capital Program 5
54 FY15 Uses of Funds $ in thousands Uses of Funds FY15 FY14 Change $ Lead agency disbursements $ 77,031 $ 81,914 $ (4,883) Transit service contracts & fuel 84,257 80,416 3,841 Capital 30,476 23,457 7,019 RPTA & METRO Personnel Costs 24,873 24, Bond Principal & Interest 24,239 13,042 11,197 Contractual Agreements 5,631 4,280 1,351 AZ Lottery Disbursements 11,200 11,200 - Lead Agency Bond Disbursements 56,016 42,585 13,431 Other Costs 10,807 10, Sub Total 324, ,131 32,399 Carry forwards to Reserves ,488 (71,376) Total $ 324,642 $ 363,619 $ (38,977) 6
55 FY15 Funding Sources $ in thousands Funding Sources FY15 FY14 Change $ Public Transportation Funds $ 127,672 $ 120,246 $ 7,426 Transit Service Agreements 29,358 30,573 (1,215) Federal Grants 38,377 28,396 9,981 METRO Rail Reimbursement 15,274 15,389 (115) Fixed Route Fare Revenues 16,139 14,167 1,972 AZ Lottery Proceeds 11,475 11, Regional Area Road Funds 4,711 4, Other Revenues 1,643 3,104 (1,461) Bond Proceeds - 114,150 (114,150) Carry forwards and Reserves 79,993 21,810 58,183 Total $ 324,642 $ 363,619 $ (38,977) 7
56 FY15-19 Operating Forecast Uses of Funds : $682M Fixed Route Bus 436 VM Operated Paratransit 62 ADA Lead Agency Disbursements 96 Regional Services 40 All Other Services 48 Sources of Funds $686M Public Transportation Funds 379 Member Transit Service Agreements 159 Fare Revenue 91 All Other 57 8
57 FY15-19 Capital Program Uses of Funds: Bus Fleet $103 Vanpool Fleet 15 Bus Facilities 16 Rail Capital 323 Debt Service 174 All Other 7 Total Uses $638M Sources of Funds: PTF $432 PTF Bonds 112 Federal 92 All Other 2 Total Sources $638M 9
58 Action RECOMMENDATION It is recommended that the Budget and Finance Subcommittee move forward to the Board of Directors: Approval of the Valley Metro RPTA Fiscal Year 2015 Operating and Capital Budget (July 1, 2014 thru June 30, 2015) and Acceptance of the Five-Year Operating Forecast and Capital Program (FY 2015 thru 2019). 10
59 End of Presentation 11
60 DATE AGENDA ITEM 4 May 9, 2014 SUBJECT Transit Life Cycle Program (TLCP) Update PURPOSE To provide information to member cities concerning the draft 2014 TLCP Update. The item will cover both the bus and rail programs within the TLCP. BACKGROUND/DISCUSSION/CONSIDERATION The TLCP was developed in 2005 to provide guidance for the implementation of the transit component of the Regional Transportation Plan. The TLCP includes Guiding Principles, policies, procedures and financial forecasts to ensure that the program can be balanced. The most recent update to the TLCP was in June Since that time, the official forecast has projected a slight increase in revenues for the Transportation Excise Tax. MAP-21 continues to be implemented and MAG has recently approved a new Transportation Improvement Program (TIP) through FY2019 using MAP-21 programs and rules. Bus Program Capital Program The new TIP resulted in some changes to the bus capital program. The key change was a direct result of MAP-21 program changes, which now allows for all fleet vehicles to be purchased with 85 percent federal funds. The vehicles must meet low emission and/or ADA compliance requirements. Previously, alternatively fueled vehicles could be purchased with 83 percent federal participation and all other vehicles were purchased with 80 percent federal participation. The VM Fleet Management Plan specifies low emission vehicles in compliance with this requirement. This change has resulted in greater federal aid and less PTF being required for local match for fleet, which is a major segment of the bus capital program. Since the 2013 TLCP update, there have been only minor adjustments to the fleet and facilities programs, all related to timing. The transit center at Main Street and Mesa Drive in Mesa has been scaled back and the remaining funds shifted to a second site at Main Street and Gilbert Road. The transit center at Mesa Drive was originally larger in scope, as that was the end of line for the light rail. With the adoption of the Gilbert Road Extension into the RTP, Gilbert Road is the new end of line. VALLEY METRO 101 N 1ST AVE STE 1300 PHOENIX AZ
61 Operating Program Since the 2013 TLCP update, costs for operations, including ADA reimbursements are up just over one percent and are offset by some increases in fare and preventive maintenance revenues. The fund balance at the end of the program is anticipated to be about $81 million, up from $49.1 million in the 2013 update. (Primarily the result of changes to the capital fleet plan and higher federal participation rate) The resulting increase in fund balance provides availability to increase service levels in future years. The TLCP Policies require that jurisdictional equity be maintained for the bus program. The policy allows that each sub-region can be within 2.5 percent above or below their policy allocation. In the current model, one of three sub-regions is outside this allowance. The East Valley is currently below its policy JE by 6.9 percent. Additionally, the policy allows that regardless of percentages, no jurisdiction can be under-allocated by $7.5 million or more. In the current model, four jurisdictions meet that condition. Jurisdiction Equity Summary Blended Rate beginning in 2017 (millions of dollars) April 23, 2014 Jurisdiction Total Calculated PTF Total Policy PTF Allocation JE Under (JE Over) Percent of JE Calculated Central $435.6 $446.6 $ % East $742.2 $797.2 $ % West $160.9 $162.9 $ % $1,338.8 $1,406.5 $ % 2
62 Jurisdiction Equity Summary Blended Rate beginning in 2017 (millions of dollars) April 23, 2014 Jurisdiction Total Calculated PTF Total Policy PTF Allocation JE Under (JE Over) JE Calculated Percent JE Policy Percent Avondale $20.7 $21.6 $ % 1.54% Buckeye $4.6 $1.0 ($3.6) 0.35% 0.07% Chandler $127.2 $133.1 $ % 9.46% County $16.4 $9.2 ($7.2) 1.22% 0.65% El Mirage $1.4 $3.2 $ % 0.23% Fountain $0.7 $1.2 $ % 0.09% Hills Gila Bend $0.0 $1.9 $ % 0.14% Gilbert $79.8 $86.0 $ % 6.12% Glendale $76.8 $79.9 $ % 5.68% Goodyear $3.6 $3.6 $ % 0.26% Guadalupe $3.7 $0.1 ($3.6) 0.28% 0.01% Litchfield $0.0 $3.2 $ % 0.23% Park Mesa $256.4 $273.4 $ % 19.44% Paradise $4.7 $7.5 $ % 0.54% Valley Peoria $26.2 $31.2 $ % 2.22% Phoenix $435.6 $446.4 $ % 31.74% Queen Creek $0.0 $0.9 $ % 0.06% Salt River $2.7 $0.0 ($2.7) 0.20% 0.00% Res. Scottsdale $131.2 $146.4 $ % 10.41% Surprise $5.1 $3.3 ($1.8) 0.38% 0.23% Tempe $135.9 $148.6 $ % 10.56% Tolleson $5.1 $4.3 ($1.2) 0.41% 0.31% Wickenburg $0.0 $0.3 $ % 0.02% Youngtown $0.6 $0.2 ($0.4) 0.05% 0.02% $1,341.9 $1,406.5 $ % % At this time, no immediate service changes to the bus program are programmed. One of the agency goals is to expand services through effective planning, design, and construction of rail and bus projects through the Regional Transportation Plan. To that end, Valley Metro is working through Phase II of the Service Standards and Measures, 3
63 which when adopted will allow for services to be added back into the TLCP in a manner that meets this goal while adhering to JE policies. Concurrent with Phase II of the Service Standards and Measures, Valley Metro staff have begun discussions with member cities about potential priorities for utilizing the funds to meet adopted service standards. That discussion will continue to take place through the Service Planning Working Group and final recommendations may be made in conjunction with the 2015 TLCP Update next spring. Rail/High Capacity Transit Program The baseline rail model has only minor changes from the adopted 2013 TLCP Update. Two changes to completion dates are included: Central Mesa Extension completion is advanced to 2015 from 2016; and Tempe Streetcar is delayed from 2017 to TLCP Open Year 2013 TLCP Open Year Northwest Phase I Central Mesa Tempe Streetcar Gilbert Road Capitol/I-10 West West Phoenix/Central Glendale Northwest Phase II Northeast Phoenix The base costs per mile for future extensions have been refined with little change to the overall cost per mile. The assumed costs for vehicles have been identified separately within each project to provide input to the rail fleet management plan under development. Alternatively, fleet costs could be removed from the extensions and included as a separate LRV Acquisition project if that were to be desired. Inflation rates assumed in the ADOT Forecast are in the range of 2.2% to 2.4% for the remainder of the program. Year of expenditure costs calculated in the rail model assume a slightly higher rate of 2.7% to 2.9% over the long term. Currently, the rail program baseline financial model is balanced, with a small surplus of $31 million remaining. However, additional work needs to be completed which may impact that final surplus and cash flow needs during the program. 4
64 Planning work on Tempe Streetcar reconfiguration continues on the project. Reconfiguration of the route could impact timing of expenses and the overall cost which could impact cash flow needs Planning work to develop a fleet acquisition plan to meet the expanded fleet needs for the future extensions could result in earlier cash needs, putting greater pressure on PTF and bond proceeds Planning work to redefine the expansion needs at the Operations and Maintenance Center to meet the requirements of the expanded fleet assumed in the current TLCP The rail program currently anticipates additional financings. In January 2014, taxexempt serial bonds were issued and generated approximately $135 million. An additional issue in late FY16 was anticipated and expected to generate up to $125 million. As a result of the successful 2014 issuance, the 2016 issue may be delayed until 2017 and likely will be smaller than anticipated; and in FY21 and FY23 short term financing is needed to cover cash flow. The final financing is driven by the construction of three projects simultaneously. Valley Metro will work cooperatively with the METRO member cities to finalize alternative scenarios and develop a new baseline scenario for adoption in the next fiscal year. COST AND BUDGET There is no impact to the budget. COMMITTEE PROCESS RTAG: April 22, 2014 for information TMC: May 7, 2014 for information and discussion Budget and Finance Subcommittee: May 15, 2014 for information Board of Directors: May 22, 2014 for information and discussion RECOMMENDATION This item is for information and discussion only. CONTACT Paul Hodgins Manager, Revenue Generation and Financial Planning phodgins@valleymetro.org ATTACHMENTS None 5
65 Transit Life Cycle Program 2014 Model Update Budget and Finance Subcommittee May 15, 2014
66 Overview Financial models are balanced Bus surplus $81.1 million Rail surplus $40.9 million No significant program changes 2
67 Revenues PTF up $7.8 million (+0.3%) $4.4 million bus, $3.4 million rail Federal MAP-21 share of fleet increased to 85% All fleet that meets ADA and/or CAA Fare increase Assumed in FY2017 then every 3 years 3
68 Transportation Excise tax 4
69 Bus Program Summary 5
70 Program Changes Updated operating plan to current HASTUS numbers No additions to service plan Scottsdale/Rural LINK moved to FY 2016 Refined fleet plan Reduced expenditures Higher federal participation beginning FY 2016 Mesa transit center Project split into 2 sites Centennial Way, smaller bus facility Gilbert Road, end of line bus/rail interface No change in total costs 6
71 Expenditures 2014 Update 2013 Update Change % Change Operations Expenditure Fixed Route Operations $972.9 $960.3 $ % ADA & Alternatives $482.8 $484.2 ($1.4) -0.3% Regional Expenditures $240.0 $254.3 ($14.3) -5.6% Sub-Total Operations Expenditures $1,695.7 $1,698.8 ($3.1) -0.2% Capital Expenditure Debt Service $72.1 $72.1 $ % Fleet $938.9 $961.7 ($22.8) -2.4% Facilities $274.4 $267.3 $ % Sub-Total Capital Expenditures $1,285.4 $1,301.1 ($15.7) -1.2% Total Expenditures $2,981.1 $2,999.9 ($18.8) -0.6% 7
72 Revenues 2014 Update 2013 Update Change % Change Revenue Operations PTF $1,635.4 $1,631.0 $ % RARF $86.5 $88.3 ($1.8) -1.99% Fares $233.8 $233.1 $ % Federal $67.4 $59.6 $ % Other revenues $20.3 $20.4 ($0.2) -0.75% Sub-Total Operations Revenue $2,043.4 $2,032.4 $ % Revenue Capital Federal - ARRA $35.8 $35.8 $ % Federal - Capital $902.0 $901.6 $ % Financed Revenue $58.3 $58.3 $ % Other revenues $22.7 $20.9 $ % Sub-Total Capital Revenue $1,018.8 $1,016.6 $ % Total Revenue $3,062.2 $3,049.0 $ % Net Revenues less Expenditures $81.1 $49.1 $ % 8
73 Cash Flow Summary Bus Program TLCP Totals Funding Surplus / Shortfall Total Program Revenues $3,012.2 Total Operating Costs ($1,695.7) Funding surplus before capital and financing $1,316.6 Total Capital Costs ($1,212.4) Financing Needs anticipated: Proceeds Debt Service Series 2009 $50.0 ($73.0) Total Financing $50.0 ($73.0) ($23.0) Total Program Cost 2026 ($2,931.1) Net Fund Balance $81.1 9
74 JE Summary Calculated Policy Percent Sub-region Allocation Allocation Difference Difference Central $435.6 $446.4 $ % East $742.2 $797.2 $ % West $160.9 $162.9 $ % $1,338.8 $1,406.5 $ % 10
75 Rail Program Summary 11

76 High Capacity Transit 2013 TLCP 12
Budget and Finance Subcommittee
 MEETING OF THE Budget and Finance Subcommittee MEETING DATE October 15, 2015 TIME LOCATION 12:00 p.m. Valley Metro 101 N. 1st Ave., 10th Floor Lake Mead Conference Room Phoenix, AZ 85003 VALLEY METRO 101
FY17 FY16 Valley Metro RPTA Sources of Funds FY17 vs FY16
 FY17 ADOPTED ANNUAL OPERATING AND CAPITAL BUDGET Valley Metro Regional Public Transportation Authority (RPTA) provides public transportation services for Maricopa County located in the metro Phoenix, Arizona.
VALLEY METRO RPTA FY18 Budget EXECUTIVE SUMMARY
 VALLEY METRO RPTA FY18 Budget EXECUTIVE SUMMARY FY18 ADOPTED ANNUAL OPERATING AND CAPITAL BUDGET Valley Metro Regional Public Transportation Authority (RPTA) provides public transportation services for
Audit and Finance Subcommittee
 MEETING OF THE Audit and Finance Subcommittee MEETING DATE January 12, 2017 TIME LOCATION 12:00 p.m. Valley Metro 101 N. 1st Ave., 10th Floor Lake Mead Conference Room (10B) Phoenix, AZ 85003 VALLEY METRO
Budget and Finance Subcommittee
 MEETING OF THE Budget and Finance Subcommittee MEETING DATE May 14, 2015 TIME LOCATION 12:00 p.m. Valley Metro 101 N. 1st Ave., 10th Floor Lake Mead Conference Room Phoenix, AZ 85003 VALLEY METRO 101 N
Date: January 11, Starting Time 12:00 p.m. Location: Valley Metro Lake Mead Conference Room (10B) 101 N. 1 st Avenue, 10 th Floor Phoenix
 101 N. 1 st Avenue, 10 th Floor Phoenix") MEETING OF THE Audit and Finance Subcommitee Date: January 11, 2018 Starting Time 12:00 p.m. Location: Valley Metro Lake Mead Conference Room (10B) 101 N. 1 st Avenue, 10 th Floor Phoenix If you require
MEETING OF THE Audit and Finance Subcommitee Date: January 11, 2018 Starting Time 12:00 p.m. Location: Valley Metro Lake Mead Conference Room (10B) 101 N. 1 st Avenue, 10 th Floor Phoenix If you require
TRANSIT LIFE CYCLE POLICIES
 TRANSIT LIFE CYCLE POLICIES DRAFT January 6, 2011 Table of Contents GUIDING PRINCIPLE 1: A defined and consistent process will be established for allocating funding for projects in the Regional Transportation
Total Operating Activities for FY17 are $56.9 million, an increase of $5.1M or 9.8% from FY16.
 FY17 ADOPTED ANNUAL OPERATING AND CAPITAL BUDGET Valley Metro Rail, Inc. (VMR) is a public non-profit corporation whose members are the cities of Chandler, Glendale, Mesa, Phoenix, and Tempe. VMR plans,
Executive Summary - Fiscal Year 2016 Valley Metro Rail Preliminary Annual Operating and Capital Budget
 Executive Summary - Fiscal Year 2016 Valley Metro Rail Preliminary Annual Operating and Capital Budget Valley Metro Rail, Inc. (VMR) is a public non-profit corporation whose members are the cities of Chandler,
VALLEY METRO RAIL FY18 Budget EXECUTIVE SUMMARY
 VALLEY METRO RAIL FY18 Budget EXECUTIVE SUMMARY FY18 ADOPTED ANNUAL OPERATING AND CAPITAL BUDGET Valley Metro Rail, Inc. (VMR) is a public non-profit corporation whose members are the cities of Chandler,
Audit and Finance Subcommittee
 MEETING OF THE Audit and Finance Subcommittee MEETING DATE February 9, 2017 TIME LOCATION 11:00 a.m. Valley Metro 101 N. 1st Ave., 10th Floor Lake Mead Conference Room (10B) Phoenix, AZ 85003 VALLEY METRO
TMC/RMC Joint Meeting
 MEETINGS OF THE Management Committees Transit Management Committee (TMC) MEETING DATE Wednesday, May 4, 2016 TMC/RMC Joint Meeting MEETING DATE Wednesday, May 4, 2016 Rail Management Committee (RMC) MEETING
Adopted Five Year Operating Forecast and Capital Program
 Valley Metro Rail, Inc. Adopted Operating and Capital Budget fy 2014 Adopted Five Year Operating Forecast and Capital Program fy 2014-2018 va l l e y m e t r o. o r g Valley Metro Rail, Inc. Phoenix, Arizona
Transit Life Cycle Program 2013 Update
 V a l l e y M e t r o Transit Life Cycle Program 2013 Update DRAFT June 5, 2013 valleymetro.org Table of Contents Background... 1 Revenues... 5 Project Descriptions... 13 Jurisdictional Equity... 25 Conclusion...
Adopted Five Year Operating Forecast and Capital Program
 Valley Metro Regional Public Transportation Authority Adopted Operating and Capital Budget FY 2015 Adopted Five Year Operating Forecast and Capital Program FY 2015-2019 VA L L E Y M E T R O. O R G Valley
Budget and Finance Subcommittee
 MEETING OF THE Budget and Finance Subcommittee MEETING DATE March 5, 2015 TIME LOCATION 12:00 p.m. Valley Metro 101 N. 1st Ave., 10th Floor Lake Mead Conference Room Phoenix, AZ 85003 VALLEY METRO 101
Preliminary Five Year Operating Forecast and Capital Program
 Valley Metro Regional Public Transportation Authority Preliminary Operating and Capital Budget VA L L E Y M E T R O. O R G FY 2016 Preliminary Five Year Operating Forecast and Capital Program FY 2016-2020
Valley Metro Regional Public Transportation Authority
 April 23, 2013 Valley Metro Regional Public Transportation Authority Phoenix, Arizona Proposed Operating and Capital Budget Fiscal Year 2014 Five Year Operating Forecast and Capital Program FY 2014 thru
Valley Metro Rail Preliminary Annual Operating & Capital Budget Fiscal Year 2018
 Valley Metro Rail Preliminary Annual Operating & Capital Budget Fiscal Year 2018 FY 2008-09 0 May 2008 Operating and Capital Budget METRO Valley Metro Rail, Inc. Phoenix, Arizona Preliminary Operating
Valley Metro Rail FY18 Preliminary Budget Overview
 Valley Metro Rail FY18 Preliminary Budget Overview April 2017 1 FY18 Preliminary Annual Budget 2 1 Baseline: Light Rail Operations FY17 FY18 Change Passenger Boardings 16,807,000 16,824,000 0% Vehicle
Comprehensive Annual Financial Report. Fiscal Year Ended June 30, 2010
 Comprehensive Annual Financial Report Fiscal Year Ended June 30, 2010 Phoenix, Arizona Board of Directors Chair, Councilmember Michael Johnson, City of Phoenix Vice Chair, Councilmember Shana Ellis, City
Valley Metro Fiscal Year 2014 Financial Results. Budget and Finance Subcommittee October 9, 2014
 Valley Metro Fiscal Year 2014 Financial Results Budget and Finance Subcommittee October 9, 2014 Regional Fixed Route Bus Ridership 3-Year Comparison Regional Fixed Route Bus Average Daily Ridership Light
Valley Metro RPTA. Lake Powell Conference Room 101 N. 1 st Avenue, 10 th Floor Phoenix
 MEETINGS OF THE Management Committees Valley Metro RPTA METRO Light Rail MEETING DATE November 1, 2012 TIME 11:00 a.m. MEETING DATE November 1, 2012 TIME 1:30 p.m. LOCATION Valley Metro RPTA Lake Powell
FIVE-YEAR OPERATING FORECAST AND CAPITAL PROGRAM
 FIVE-YEAR OPERATING FORECAST AND CAPITAL PROGRAM FY 2011 - FY 2015 Five-Year Operating Forecast and Capital 0 May 2010 Valley Metro Rail, Inc. Phoenix, Arizona Five-Year Operating Forecast and Capital
ADOPTED FY 2013 OPERATING AND CAPITAL BUDGET FIVE-YEAR OPERATING FORECAST AND CAPITAL PROGRAM FY 2013 FY May 17, 2012
 ADOPTED FY 2013 OPERATING AND CAPITAL BUDGET FIVE-YEAR OPERATING FORECAST AND CAPITAL PROGRAM FY 2013 FY 2017 May 17, 2012 Adopted FY 2008-09 0 May 2008 Operating and Capital Budget Valley Metro Rail,
Comprehensive Annual Financial Report. Fiscal Year Ended June 30, 2012
 Comprehensive Annual Financial Report Fiscal Year Ended June 30, 2012 Phoenix, Arizona Board of Directors Chair, Vice Mayor Ron Aames, Peoria Vice Chair, Vice Mayor Scott Somers, Mesa Treasurer, Councilmember
Adopted Five Year Operating Forecast and Capital Program
 Valley Metro Rail, Inc. Adopted Operating and Capital Budget FY 2016 Adopted Five Year Operating Forecast and Capital Program FY 2016-2020 VA L L E Y M E T R O. O R G Valley Metro Rail, Inc. Phoenix, Arizona
MEETING OF THE Valley Metro Operations and Capital Committee. 10:00 a.m.
 VMOCC Meeting Packet MEETING OF THE Valley Metro Operations and Capital Committee MEETING DATE August 18, 2009 TIME LOCATION 10:00 a.m. METRO Rail Office 13 th Floor Conference Room 101 N. 1 st Avenue,
PRELIMINARY FY 2015 OPERATING AND CAPITAL BUDGET FIVE-YEAR OPERATING FORECAST AND CAPITAL PROGRAM FY 2015 FY April 15, 2014
 PRELIMINARY FY 2015 OPERATING AND CAPITAL BUDGET FIVE-YEAR OPERATING FORECAST AND CAPITAL PROGRAM FY 2015 FY 2019 April 15, 2014 Adopted FY 2008-09 0 May 2008 Operating and Capital Budget METRO Valley
FIVE-YEAR CAPITAL PROGRAM AND OPERATING FORECAST
 FIVE-YEAR CAPITAL PROGRAM AND OPERATING FORECAST FY 2010 FY 2014 Adopted June 17, 2009 Five-Year Capital Program and Operating June 2009 Valley Metro Rail, Inc. Phoenix, Arizona Five-Year Capital Program
Valley Metro. Comprehensive Annual Financial Report. Fiscal Year Ended June 30, Regional Public Transportation Authority Phoenix, Arizona
 Comprehensive Annual Financial Report Fiscal Year Ended June 30, 2013 Phoenix, Arizona Phoenix, Arizona Board of Directors Chair, Councilmember Ron Aames, Peoria Vice Chair, Councilmember Scott Somers,
Transit Management Committee
 MEETING OF THE Transit Management Committee MEETING DATE March 7, 2012 TIME LOCATION 11:00 a.m. Valley Metro RPTA Lake Powell Conference Room 101 N. 1 st Avenue, 10 th Floor Phoenix February 29, 2012
Transit Management Committee
 NEXT MEETING OF THE Transit Management Committee MEETING DATE June 3, 2009 TIME LOCATION 11:00 a.m. MAG Saguaro Room 302 N. 1 st Avenue Suite 200 Phoenix May 27, 2009 TO: FROM: RE: Members of the Valley
ADOPTED FY 2012 OPERATING AND CAPITAL BUDGET FIVE-YEAR OPERATING FORECAST AND CAPITAL PROGRAM FY FY 2016
 ADOPTED FY 2012 OPERATING AND CAPITAL BUDGET FIVE-YEAR OPERATING FORECAST AND CAPITAL PROGRAM FY 2012 - FY 2016 Adopted FY 2008-09 0 May 2008 Operating and Capital Budget Valley Metro Rail, Inc. Phoenix,
Chairman Simplot and Members of the METRO Board of Directors
 9:45 am I April 21, 2010 April 14, 2010 To: From: Chairman Simplot and Members of the METRO Board of Directors Stephen R. Banta, Chief Executive Officer Date: April 21, 2010 Time: 9:45 a.m. Location: METRO
City of Goodyear. FY 2010/11 Final Budget. City Council Meeting June 14, 2010
 City of Goodyear FY 2010/11 Final Budget City Council Meeting June 14, 2010 1 Agenda Summary of FY 11 Budget Employee Compensation & Benefits Property Taxes & City Sales Taxes FY 11 Revenues & Expenditures
Valley Metro Regional Public Transportation Authority Phoenix, AZ 2017 Comprehensive Annual Financial Report FISCAL YEAR ENDED JUNE 30
 Valley Metro Phoenix, AZ 2017 Comprehensive Annual Financial Report FISCAL YEAR ENDED JUNE 30 Phoenix, Arizona For the Fiscal Year Ended June 30, 2017 Board of Directors Chair, Councilmember Thelda Williams,
Transit Management Committee
 MEETING OF THE Transit Management Committee MEETING DATE September 2, 2009 TIME LOCATION 11:00 a.m. MAG Saguaro Room 302 N. 1 st Avenue, Suite 200 August 24, 2009 TO: FROM: RE: Members of the Valley Metro
Transit Management Committee (TMC) Date: February 7, Starting Time 11:00 a.m. Meetings to occur sequentially
 Date: February 7, Starting Time 11:00 a.m. Meetings to occur sequentially") MEETINGS OF THE Management Committees TMC/RMC Joint Meeting Transit Management Committee (TMC) Rail Management Committee (RMC) Date: February 7, 2018 Starting Time 11:00 a.m. Meetings to occur sequentially
MEETINGS OF THE Management Committees TMC/RMC Joint Meeting Transit Management Committee (TMC) Rail Management Committee (RMC) Date: February 7, 2018 Starting Time 11:00 a.m. Meetings to occur sequentially
12:00 p.m. Valley Metro RPTA. Lake Powell Conference Room 101 N. 1 st Avenue, 10 th Floor Phoenix
 MEETINGS OF THE Management Committees Valley Metro RPTA METRO Light Rail MEETING DATE Wednesday, November 5, 2014 TIME 11:00 a.m. MEETING DATE Wednesday, November 5, 2014 TIME 12:00 p.m. LOCATION Valley
Highway User Revenue Fund
 Highway User Revenue Fund 2002 Year- End Report ARIZONA DEPARTMENT OF TRANSPORTATION FINANCIAL MANAGEMENT SERVICES OFFICE OF FINANCIAL PLANNING AUGUST 2002 Highway User Revenue Fund Executive Summary The
August 31, 2016 Financial Report
 August 31, 2016 Financial Report Capital Metropolitan Transportation Authority 10/14/2016 Table of Contents SUMMARY REPORTS Budgetary Performance - Revenue 2 - Sales Tax Revenue 6 - Operating Expenses
Valley Metro RPTA. Lake Powell Conference Room 101 N. 1 st Avenue, 10 th Floor Phoenix
 MEETINGS OF THE Board of Directors Valley Metro RPTA METRO Light Rail MEETING DATE Thursday, May 22, 2014 TIME 12:15 p.m. MEETING DATE Thursday, May 22, 2014 TIME 1:30 p.m. LOCATION Valley Metro RPTA Lake
METRO. Fiscal Year 2012 Monthly Board Report. December 2011 (First Quarter Fiscal Year-to-Date)
") METRO Fiscal Year 2012 Monthly Board Report Revenue Expense Ridership Performance (First Quarter Fiscal Year-to-Date) 1/27/2012 Table of Contents Section A Section B Section C Section D Section E Section
METRO Fiscal Year 2012 Monthly Board Report Revenue Expense Ridership Performance (First Quarter Fiscal Year-to-Date) 1/27/2012 Table of Contents Section A Section B Section C Section D Section E Section
Methodology The use of repeat sales is the most reliable way to estimate price changes in the housing market because the repeat sales approach
 May 2009 Methodology The use of repeat sales is the most reliable way to estimate price changes in the housing market because the repeat sales approach eliminates the need to deal with the many issues
METRO. Fiscal Year 2013 Monthly Board Report. December 2012 (First Quarter Fiscal Year-to-Date)
") METRO Fiscal Year 2013 Monthly Board Report Revenue Expense Ridership Performance (First Quarter Fiscal Year-to-Date) 1/14/2013 Table of Contents Section A Section B Section C Section D Section E Section
METRO Fiscal Year 2013 Monthly Board Report Revenue Expense Ridership Performance (First Quarter Fiscal Year-to-Date) 1/14/2013 Table of Contents Section A Section B Section C Section D Section E Section
METRO. Fiscal Year 2012 Monthly Board Report. September 2012 (Fourth Quarter Fiscal Year-to-Date)
") METRO Fiscal Year 2012 Monthly Board Report Revenue Expense Ridership Performance (Fourth Quarter Fiscal Year-to-Date) This report is based on a preliminary closing of the year-end financials for FY2012
METRO Fiscal Year 2012 Monthly Board Report Revenue Expense Ridership Performance (Fourth Quarter Fiscal Year-to-Date) This report is based on a preliminary closing of the year-end financials for FY2012
METRO. Fiscal Year 2013 Monthly Board Report. January 2013
 METRO Fiscal Year 2013 Monthly Board Report Revenue Expense Ridership Performance 2/14/2013 Table of Contents Section A Section B Section C Section D Section E Section F Section G Section H Section I Section
METRO. Fiscal Year 2017 Monthly Performance Report. Revenue Expense Ridership Performance. October 2016
 METRO Fiscal Year 2017 Monthly Performance Report Revenue Expense Ridership Performance 11/18/2016 Table of Contents Section A Section B Section C Section D Section E Section F Section G Section H Section
Residential March 2009
 Residential March 2009 Karl L. Guntermann Fred E. Taylor Professor of Real Estate Adam Nowak Research Associate Methodology The use of repeat sales is the most reliable way to estimate price changes in
METRO. Fiscal Year 2014 Monthly Board Report. May 2014
 METRO Fiscal Year 2014 Monthly Board Report Revenue Expense Ridership Performance 7/11/2014 Table of Contents Section A Section B Section C Section D Section E Section F Section G Section H Section I Section
METRO. Fiscal Year Monthly Performance Report. Revenue Expense Ridership Performance. November 2018 (Third Quarter Fiscal Year-to Date)
") METRO Fiscal Year 2019 Monthly Performance Report Revenue Expense Ridership Performance (Third Quarter Fiscal Year-to Date) 12/12/2018 Table of Contents Section A Section B Section C Section D Section
METRO Fiscal Year 2019 Monthly Performance Report Revenue Expense Ridership Performance (Third Quarter Fiscal Year-to Date) 12/12/2018 Table of Contents Section A Section B Section C Section D Section
BOARD OF DIRECTORS MEETING MARCH 3, :45 A.M. 101 NORTH FIRST AVENUE 13TH FLOOR BOARD ROOM PHOENIX, AZ 85003
 BOARD OF DIRECTORS MEETING MARCH 3, 2010 9:45 A.M. 101 NORTH FIRST AVENUE 13TH FLOOR BOARD ROOM PHOENIX, AZ 85003 March 2, 2010 REVISED To: From: Chairman Simplot and Members of the METRO Board of Directors
8. FINANCIAL ANALYSIS
 8. FINANCIAL ANALYSIS This chapter presents the financial analysis conducted for the Locally Preferred Alternative (LPA) selected by the Metropolitan Transit Authority of Harris County (METRO) for the.
METRO. Fiscal Year Monthly Performance Report. Revenue Expense Ridership Performance. February 2018 (First Quarter Fiscal Year-to Date)
") METRO Fiscal Year 2018 Monthly Performance Report Revenue Expense Ridership Performance (First Quarter Fiscal Year-to Date) 3/12/2018 Table of Contents Section A Section B Section C Section D Section E
METRO Fiscal Year 2018 Monthly Performance Report Revenue Expense Ridership Performance (First Quarter Fiscal Year-to Date) 3/12/2018 Table of Contents Section A Section B Section C Section D Section E
November 10, Chairman Simplot and Members of the METRO Board of Directors
 9:45 am I November 17, 2010 November 10, 2010 To: From: Chairman Simplot and Members of the METRO Board of Directors Stephen R. Banta, Chief Executive Officer Date: November 17, 2010 Time: Location: 9:45
Residential November 2008
 Residential November 2008 Karl L. Guntermann Fred E. Taylor Professor of Real Estate Adam Nowak Research Associate Methodology The use of repeat sales is the most reliable way to estimate price changes
Valley Metro Rail, Inc. Phoenix, Arizona Comprehensive Annual Financial Report. Fiscal Year Ended June 30, 2012
 Valley Metro Rail, Inc. Phoenix, Arizona Comprehensive Annual Financial Report Fiscal Year Ended June 30, 2012 VALLEY METRO RAIL, INC. Phoenix, Arizona Comprehensive Annual Financial Report For the fiscal
Federal Assistance 13% Charges for Services 5% Appropriated Fund Balance.5% Other 3% Administration 6% Building Maintenance 3% Other 2%
 TRANSIT FUND The Transit Fund is used to account for the operations of the Town s public transit system. Federal Assistance 13% Transit Revenues State Assistance 12% Charges for Services 5% Appropriated
METRO. Fiscal Year 2013 Monthly Board Report. November 2012
 METRO Fiscal Year 2013 Monthly Board Report Revenue Expense Ridership Performance 12/13/2012 Table of Contents Section A Section B Section C Section D Section E Section F Section G Section H Section I
RAIL MANAGEMENT COMMITTEE MEETING OCTOBER 1, :30 P.M. 101 NORTH FIRST AVENUE 13TH FLOOR BOARD ROOM PHOENIX, AZ 85003
 RAIL MANAGEMENT COMMITTEE MEETING OCTOBER 1, 2008 1:30 P.M. 101 NORTH FIRST AVENUE 13TH FLOOR BOARD ROOM PHOENIX, AZ 85003 September 24, 2008 To: From: Chairman Fairbanks and Members of the Rail Management
12:45 p.m. Valley Metro RPTA Lake Powell Conference Room 101 N. 1 st Avenue, 10 th Floor Phoenix. MEETING OF THE Board of Directors
 MEETING OF THE Board of Directors MEETING DATE March 22, 2012 TIME LOCATION 12:45 p.m. Valley Metro RPTA Lake Powell Conference Room 101 N. 1 st Avenue, 10 th Floor Phoenix March 14, 2012 TO: FROM: RE:
METRO MONTHLY BOARD REPORT
 METRO Revenue Expenses Service Performance Fiscal Year FY2011 Table of Contents Section A Section B Section C Section D Section E Section F Section G Section H Summary Sales Tax Revenue Fare Revenue Operating
May 31, 2016 Financial Report
 2016 May 31, 2016 Financial Report Capital Metropolitan Transportation Authority 7/13/2016 Table of Contents SUMMARY REPORTS Budgetary Performance - Revenue 2 - Sales Tax Revenue 6 - Operating Expenses
April 30, 2016 Financial Report
 2016 April 30, 2016 Financial Report Capital Metropolitan Transportation Authority 6/15/2016 Table of Contents SUMMARY REPORT Budgetary Performance - Revenue 2 - Sales Tax Revenue 6 - Operating Expenses
METRO. Fiscal Year 2015 Monthly Board Report. February 2015
 METRO Fiscal Year 2015 Monthly Board Report Revenue Expense Ridership Performance 4/2/2015 Table of Contents Section A Section B Section C Section D Section E Section F Section G Section H Section I Section
Financial Management Report... 3
 November 13, 2013 Table of Contents Financial Management Report... 3 OPERATING FUNDS STATEMENT OF REVENUES & EXPENSES... 3 METROPOLITAN COUNCIL INVESTMENT PERFORMANCE SHORT-TERM PORTFOLIO... 4 METROPOLITAN
ARIZONA DEPARTMENT OF REVENUE
 ARIZONA DEPARTMENT OF REVENUE MEMORANDUM DATE: December 29, 2010 FROM: THE OFFICE OF ECONOMIC RESEARCH & ANALYSIS JULY 2010 TAX FACTS SUMMARY OF GENERAL FUND REVENUES July 2010 Individual Income Tax Net
Capital Metropolitan Transportation Authority
 Capital Metropolitan Transportation Authority Monthly Performance Report (Covering Performance Data Through March and April 2010) Capital Metropolitan Transportation Authority 1 Performance Report Contents
ARIZONA DEPARTMENT OF REVENUE
 ARIZONA DEPARTMENT OF REVENUE MEMORANDUM DATE: January 19, 2011 FROM: THE OFFICE OF ECONOMIC RESEARCH & ANALYSIS OCTOBER 2010 TAX FACTS SUMMARY OF GENERAL FUND REVENUES October 2010 Fiscal Year Total Individual
Valley Metro RPTA. Lake Powell Conference Room 101 N. 1 st Avenue, 10 th Floor Phoenix
 MEETINGS OF THE Board of Directors Valley Metro RPTA METRO Light Rail MEETING DATE February 21, 2013 TIME 12:45 p.m. MEETING DATE February 21, 2013 TIME 2:00 p.m. LOCATION Valley Metro RPTA Lake Powell
METRO. Monthly Board Report. June 2006
 METRO Monthly Board Report Operating Capital Service Performance June 26 7/17/26 June 26 MONTHLY BOARD REPORT INDEX Section A Section B Section C Section D Section E Section F Section G Operating Budget
Approval of Proposed FY 2019 Annual Budget and 20-Year Financial Plan
 Approval of Proposed FY 2019 Annual Budget and 20-Year Financial Plan Committee of the Whole September 11, 2018 Joseph G. Costello Senior Vice President, Finance 0 Board Calendar Date Subject July 10 Draft
METRO. Fiscal Year Monthly Performance Report. Revenue Expense Ridership Performance. May 2018 (Second Quarter Fiscal Year-to Date)
") METRO Fiscal Year 2018 Monthly Performance Report Revenue Expense Ridership Performance (Second Quarter Fiscal Year-to Date) 6/12/2018 Table of Contents Section A Section B Section C Section D Section
METRO Fiscal Year 2018 Monthly Performance Report Revenue Expense Ridership Performance (Second Quarter Fiscal Year-to Date) 6/12/2018 Table of Contents Section A Section B Section C Section D Section
Item #4 FEBRUARY 10, 2015 MEETING MINUTES PG. 2 Approve the February 10, 2015 meeting minutes.
 AGENDA HERITAGE VALLEY TECHNICAL ADVISORY COMMITTEE (HVTAC) Thursday, March 19, 2015, 1:30 p.m. Santa Paula City Hall, Council Chambers 970 Ventura Street, Santa Paula, CA 93060 Item #1 Item #2 Item #3
Public Transportation Department Anchorage: Performance. Value. Results.
 Anchorage: Performance. Value. Results. Mission Serve Anchorage residents and visitors by providing public transportation that emphasizes quality, safety, cost effectiveness, and economic vitality. Core
February 2016 Financial Report
 2016 February 2016 Financial Report Capital Metropolitan Transportation Authority 4/13/2016 Table of Contents SUMMARY REPORT Budgetary Performance - Revenue 2 - Sales Tax Revenue 5 - Operating Expenses
Chapel Hill Transit Strategic and Financial Sustainability Plan Update
 Chapel Hill Transit Strategic and Financial Sustainability Plan Update ACT January 21, 2015 Today s Agenda Overview of Chapel Hill Transit Performance Overview Funding Overview Key Challenges Overview
METRO. Fiscal Year 2015 Monthly Board Report. September 2015 (Fourth Quarter Fiscal Year-to-Date)
") METRO Fiscal Year 2015 Monthly Board Report Revenue Expense Ridership Performance (Fourth Quarter Fiscal Year-to-Date) This report is based on a preliminary closing of the year-end financials for FY2015
METRO Fiscal Year 2015 Monthly Board Report Revenue Expense Ridership Performance (Fourth Quarter Fiscal Year-to-Date) This report is based on a preliminary closing of the year-end financials for FY2015
Arizona Smarter Greener Better Solar Water Heating Program Qualified Contractor Application
 Arizona Smarter Greener Better Solar Water Heating Program Important: The Southwest Gas Arizona Smarter Greener Better Solar Water Heating Program (the Program ) provides valuable marketing resources,
Chairman Cavazos and Members of the Rail Management Committee
 1:30 pm I February 1, 2012 January 25, 2012 To: From: Chairman Cavazos and Members of the Rail Management Committee Stephen R. Banta, Chief Executive Officer Date: February 1, 2012 Time: Location: 1:30
Financial Report - FY 2017 Year to Date May 31, 2017
 Financial Report - FY 2017 Year to Date July 19, 2017 1 Major Highlights Revenue Sales tax remittances received through YTD April 2017 are 4.2% higher than YTD April 2016 Plaza Saltillo lease income budgeted
Public Transportation
 Municipal Manager Marketing & Customer Service Program Planning Transit Planning Para Transit Services Transit Operations & Maintenance Transit Operations Vehicle Maintenance Non-Vehicle Maintenance PT
Approval of Proposed FY 2019 Annual Budget and 20-Year Financial Plan
 Approval of Proposed FY 2019 Annual Budget and 20-Year Financial Plan Committee of the Whole September 18, 2018 Joseph G. Costello Senior Vice President, Finance 0 Board Calendar Date Subject July 10 Draft
MEETINGS OF THE Boards of Directors
 MEETINGS OF THE Boards of Directors Joint Meeting of Valley Metro RPTA and Valley Metro Rail Valley Metro RPTA Valley Metro Rail Date Thursday, January 19, 2017 Starting time 11:15 a.m. Meetings to occur
SFMTA 2013 Revenue Bond Board of Directors
 SFMTA Municipal Transportation Agency Image: Market and Geary Streets, circa 1920s, Muni Centennial logo SFMTA 2013 Revenue Bond Board of Directors 09 03 2013 SAN FRANCISCO, CALIFORNIA Background In 2007,
Operations & Finance Committee Meeting Agenda
 Operations & Finance Committee Meeting Agenda Nashville MTA Committee Meetings Music City Central Meeting Room 400 Charlotte Ave., Nashville, TN 37219 Thursday, November 16, 2017 The Operations & Finance
Solano County Transit
 AGENDA ITEM 13 - REVISED BOARD MEETING DATE: APRIL 18, 2013 Solano County Transit TO: BOARD OF DIRECTORS PRESENTER: KRISTINA BOTSFORD, BUDGET & ACCOUNTING MANAGER MONA BABAUTA, EXECUTIVE DIRECTOR SUBJECT:
SUPPORT DOCUMENTATION
 SUPPORT DOCUMENTATION 89 UTILITY PROVIDER RATES AND CHARGES 90 Utility Providers Residential Rates and Charges As of November 2017 ELECTRICITY Source: Arizona Public Service (APS) 800-253-9405 www.aps.com*
QUALITY TRANSPORTATION SUMMARY
 QUALITY TRANSPORTATION SUMMARY Quality Transportation Overview... 126 Department of Transportation... 127 Traffic Field Operations... 129 Winston-Salem Transit Authority... 131 Quality Transportation Non-Departmental...
Public Transportation
 Municipal Manager Marketing & Customer Service Program Planning Transit Operations & Maintenance Transit Planning Transit Operations Para Transit Services Vehicle Maintenance Non-Vehicle Maintenance PT
GREATER PHOENIX ECONOMIC COUNCIL MITCHEL ALLEN VP, BUSINESS DEVELOPMENT, INDUSTRIAL
 GREATER PHOENIX ECONOMIC COUNCIL MITCHEL ALLEN VP, BUSINESS DEVELOPMENT, INDUSTRIAL GREATER PHOENIX ECONOMIC COUNCIL OUR MISSION Attract and grow quality businesses and advocate for Greater Phoenix s competitiveness.
Whatcom Transportation Authority
 Whatcom Transportation Authority Annual Budget 12/14/2017 This Page Intentionally Left Blank Whatcom Transportation Authority (WTA) Annual Budget Table of Contents General Manager s Budget Message... 2
SALEM-KEIZER TRANSIT 555 Court St. NE Suite 5230 Salem, OR
 SALEM-KEIZER TRANSIT 555 Court St. NE Suite 5230 Salem, OR 97301-3980 503-588-2424 Fax 503-566-3933 www.cherriots.org May 15, 2014 To: From: Subject: Salem Area Mass Transit District Budget Committee Allan
VALLEY METRO RAIL, INC. Phoenix, AZ COMPREHENSIVE ANNUAL FINANCIAL REPORT
 VALLEY METRO RAIL, INC. Phoenix, AZ COMPREHENSIVE ANNUAL FINANCIAL REPORT Period Ended June 30, 2009 VALLEY METRO RAIL, INC. Phoenix, Arizona Comprehensive Annual Financial Report For the fiscal year
January 2015 Monthly Financial Report PREPARED BY
 January 2015 Monthly Financial Report PREPARED BY Financial Accounting & Reporting Division City of Phoenix Monthly Financial Report January 2015 Table of Contents by Programs Page Performance Status
Management Committee Meeting date: March 8, 2017 For the Metropolitan Council meeting of March 22, 2017
 Business Item No. 2017-42 JT Management Committee Meeting date: March 8, 2017 For the Metropolitan Council meeting of March 22, 2017 Subject: 2017 Unified Budget Amendment Carryforward Amendment District(s),
Highway User Revenue Fund
 Highway User Revenue Fund 2011 Year-End Report Arizona Department of Transportation Financial Management Services Office of Financial Planning July 2011 Highway User Revenue Fund Executive Summary The
MARTA 2009 Budget Summary Review
 MARTA 2009 Budget Summary Review 1 Transit Budgeting Strategies Internal Productivity & Cost Containment Fare Changes New Revenue Sources Transit Service Levels 2 The Budget Context Eliminate Legacy MARTA
2019 MANAGEMENT & FINANCIAL PLAN
 INDIANAPOLIS PUBLIC TRANSPORTATION CORPORATION 2019 MANAGEMENT & FINANCIAL PLAN FISCAL YEAR JANUARY 1, 2019 THROUGH DECEMBER 31, 2019 INTRODUCED TO INDYGO BOARD: JULY 30, 2018 IndyGo Year 2019 INDIANAPOLIS