PCAR 2011 Review - Analysis of PCAR banks up to end-june 2012 compared to PCAR 2011
|
|
|
- Marjory Davis
- 5 years ago
- Views:
Transcription


1 Analysis of PCAR banks up to end-june 2012 compared to PCAR 2011
2 2 Contents 1. Introduction 3 2. Executive Summary 5 3. Capital Position June Economic outturn compared to PCAR 2011 assumptions Profitability Pre-provision and pre-deleveraging operating profit Loan loss provisions Loan Loss analysis Losses on disposals and NAMA Deleveraging and balance sheet movements Total loan book movements Deposit progression and LDRs Overall progress on funding composition Evolution of capital requirements Summary of capital versus PCAR expectations Overview Evolution of capital and CT1 ratios 42 Appendix 1 - PCAR economic assumptions, actual outturn and current expectations 51 Appendix 2 - Glossary 55
3 3 1. Introduction This report outlines the findings of a review conducted by the Central Bank of Ireland ( Central Bank ) into the financial performance and capital out-turn of Allied Irish Banks plc (AIB), Bank of Ireland (BOI) and Permanent TSB (PTSB) over the period end-december 2010 to end-june 2012 compared to the financial projections utilised in the FMP and PCAR The basis for this analysis is the March 2011 FMP report 1. Note the report largely does not make reference to post-june 2012 developments or does not provide a forward looking assessment. Financial Measures Programme ( FMP ) 2011 The FMP was carried out in 2011 with the aim of placing the Irish banking system on a more stable financial footing. The FMP comprised: The Prudential Capital Assessment Review ( PCAR ) 2011, which was a stress test of the capital resources of AIB, EBS, BOI and PTSB in order to calculate the cost of recapitalisation required to meet Central Bank imposed requirements. An independent loan loss assessment exercise performed by BlackRock Solutions ( BlackRock ), which fed into the PCAR. The Prudential Liquidity Assessment Review ( PLAR ) 2011, which established funding and de-leveraging targets for the banks participating in PCAR in order to: reduce the leverage of the banking system; reduce the banks reliance on shortterm, largely central bank, funding; and, ensure a more stable path to convergence with Basel III liquidity standards over time. PCAR Capital Requirements PCAR 2011 assessed the capital resilience of the banks versus an assumed base case scenario with a risk tolerance of 10.5% core tier 1 (CT1) and an extreme but plausible adverse (or stress) case with a risk tolerance of 6% CT1. The required re-capitalisation was therefore determined on the basis of the projected capital shortfall using both of these scenarios and thresholds. Note these thresholds resulted in additional capital requirements of 18.7bn. The authorities also required an additional equity capital buffer of 2.3bn (i.e. in excess of the 6% CT1 stress target) and a contingent capital buffer of 3bn. Finally, and as agreed in the Programme of Financial Assistance with the External Authorities, the banks subject to PCAR are required to maintain 10.5% CT1 on an on-going basis. 1 The Financial Measures Programme Report, March 2011
4 4 Box 1 - Key points to note about PCAR and post-pcar events The bullet points below highlight a number of key aspects of the PCAR or recorded figures that are of significant note and, where necessary, how we addressed these in compiling this report. The acquisition of EBS Building Society (EBS) by AIB: We have consolidated the PCAR 2011 submissions and capital requirements assuming there would have been limited intergroup exposures at the time of the acquisition. Application of BlackRock loan loss forecasts to PCAR income statement: The Blackrock loan losses were provided in total as three year losses rather than on an annualised basis. Therefore, the Central Bank applied incremental loan losses over the 2010 stock of provisions equally one third per year in PCAR. In actuality the timing of the banks losses would not be expected to materialise on such a basis. Some differences to other published figures from the banks: The stress test results were finalised prior to the completion of audited 2010 year end accounts for all of the banks which leads to some differences in the December 2010 starting position versus PCAR In addition, we have used regulatory submissions in compiling our analysis which may differ from published year-end and interim figures from the banks due to the earlier timing for the submission or classification differences in regulatory information. Transfer of land and development loans of less than 20m to NAMA (NAMA II): The PCAR loan losses and deleveraging plans were prepared on the assumption that NAMA II was going to take place. Given the decision not to transfer land and development loans of less than 20m to NAMA and retain them on the bank s balance sheets some adjustments have been made to deleveraging plans since and this is reflected in the way in which we compare realised loan losses to PCAR projections. PCAR was completed on an annualised basis, while this report compares to June 2012: We have in some instances assumed that half of a banks PCAR 2011 base or stress profit or loss is comparable to the six months to end-june Notwithstanding this, we have adjusted or estimated exceptional income or cost items, where possible, either in reported figures or in PCAR 2011 estimates based on the documentation provided by the banks at the time of the stress test. This is also the case with respect to other items where end-year figures were utilised (for example, balance sheets and capital requirements/ RWA).

5 5 2. Executive Summary Post-PCAR Required Re-Capitalisation PCAR 2011 stress tested the capital of the banks under assumed base and stress scenarios and from this calculated the amount necessary to recapitalise the Irish banking system. For each of the banks the PCAR 2011 stress scenario resulted in the greatest capital deficit. In total the participating banks were required to raise 24bn in capital; 21bn of equity capital (of which 18.7bn was to meet the 6% CT1 threshold and 2.3bn was an additional equity buffer) and 3.0bn of contingent capital to safeguard against loan losses beyond This 21bn was fully raised by the institutions by end-june 2012 and the 3bn total contingent capital was raised by the banks issuing contingent capital notes to the Minister for Finance in July In January 2013, the State sold its holding of BOI s contingent capital notes to private investors at 101% of their par value plus accrued interest.
6 6 Drivers of Capital Change In our review of the outturn of the first 18 months of the PCAR time horizon, we examined the factors driving capital movements. We considered drivers of Profitability; including an analysis of loan losses; Deleveraging and balance sheet movements; and Movements in regulatory capital requirements (or as they are commonly referred to, risk weighted assets (RWA)). The combination of available capital (measured in terms of CT1) and regulatory capital requirements (measured in terms of RWAs) gives the core tier 1 ratio. Using Tier 1 or Total Capital gives the Tier 1 and Total Capital 3 ratios respectively. Summary of Results In summary, the results of this review show that in aggregate the three PCAR banks were, in terms of capital position, and with all other things being equal, inside the stress case scenario but outside the base at end-june This is unsurprising given that the macroeconomic outturn to end-june 2012 approximately follows a similar path. Notwithstanding this, some macroeconomic factors and actual outturns are near or exceed the stress case. In aggregate, the banks: Performed ahead of base and stress expectations for pre-provision operating profit in 2011, but pre-provision operating profit is less than projected under both scenarios for 2012 to end-june Have recognised 112% of the flow of expected base case loan losses (excluding NAMA II) and 63% of the flow of stress case loan losses that were included in PCAR. Have performed better than expected in terms of deleveraging losses taken to date (c 3.4bn) compared to the 10.8bn and 13.2bn assumed in the PCAR base and stress cases respectively leaving 9.8bn positive difference versus PCAR stress assumptions as at end-june Note, some additional asset sales are still forecast post-june 2012 and in PTSB s case, little of the originally planned asset sales have taken place due to amendments to the bank s strategy. Have higher risk weighted assets (RWA) than PCAR, due to changes in their deleveraging plans (e.g. NAMA II assets staying on-balance sheet) and higher than forecast credit risk RWAs due to increases in Probability of Default (PD) and Loss Given Default (LGD) in some instances. The latter is largely consistent with higher than expected loan defaults. 3 Minimum capital requirements under the Capital Requirements Directive (CRD) is expressed in terms of Total Solvency and the minimum ratio is currently 8%.
7 7 Box 2 - Key considerations when reading this report The bullets below outline key considerations which should be taken into account when reading this report. Interpretation: Within this report we compare the outturn of these scenarios to the banks actual financial results from end-december 2010 to end-june This report is not intended to provide findings or conclusions on the future capital needs of the banks; rather it is intended to illustrate the financial performance of the PCAR banks in the time period referenced and to compare it to the scenarios (and associated projections) that were used by the Central Bank in PCAR PCAR Methodology: The stress tests were an integrated financial projection based on macro-economic scenarios provided by the Central Bank. As part of this process, earnings, balance sheets, loan loss and capital estimates were provided by the banks under hypothetical future scenarios. These results were challenged by the Central Bank and in some cases adjusted to come to a Central Bank view including in the case of loan loss forecasts provided by BlackRock which were deemed to be the determinative estimates and as such were utilised and fully integrated into the stress test results. Loan Losses: There were large loan loss provisions recognised in 2011 (including as a result of Central Bank s new Impairment and Provisioning Guidelines and Disclosures Requirements (the new Guidelines )) and as a result it is expected that loan losses will be front-loaded versus PCAR and all things being equal, we would therefore expect lower loan loss recognition for Notwithstanding this, the analysis in Section 4 indicates that loan defaults have been greater than expected at this stage. Over the last 18 months to June 2012 a number other of factors would also have impacted loan losses both positively and negatively compared to the loan loss forecasts assumed within the PCAR scenarios. These factors include: o Lower than PCAR assumed interest rate environment. o Deviation from foreclosure strategy implied in loan loss forecasts. o The Central Banks new Guidelines, which would have driven a more conservative recognition of losses. 4 Impairment Provisioning and Disclosure Guidelines, December 2011
.")
8 8 3. Capital Position June 2012 Consolidated Summary In aggregate, the banks had 9.2bn 5 capital, in excess of the on-going minimum capital ratio of 10.5% CT1 at end-june 2012 available to absorb additional losses due to, for example, loan impairment and losses on sale of assets (net of pre-provision operating profits or losses). However, for comparative purposes and as can be seen in the chart over the page, if the capital raised following PCAR was excluded from their actual capital bases at end- June 2012, they would be roughly halfway between the capital position forecast under the base and stress scenarios bearing in mind the related points highlighted on page 4. This is due both to the points above and the other factors elaborated upon within this report. In addition, there is detailed information provided on a bank-by-bank basis showing each of the capital drivers. The actual pre-recap figure in the chart below is the aggregate actual CT1 capital position of the banks less any CT1 capital raised over and above that assumed within PCAR 2011 projections to allow for a like-for-like comparison to PCAR base and stress projections. The difference amounts to 15bn ( 21bn actual capital raised less 6bn taken into account within PCAR projections). 5 PTSB published a CT1 ratio of 18.1% in its June-2012 interim results, however, this analysis is based off regulatory returns which were submitted prior to the interim results and showed a higher figure of 20.5%.

9 9 While there is no single driver of capital change and no single explanatory variable for deviation away from the base or stress case; loan losses and losses on deleveraging are the most significant variables given the size of their impact relative to overall profits and other drivers of capital change.

10 10 4. Economic outturn compared to PCAR 2011 assumptions Introduction The base and stress scenario macroeconomic parameters, which were agreed with the External Partners, are outlined below alongside the actual outturn. The FMP report noted that the scenarios were intended as plausible but reasonable bases to conduct a stress test. Stress testing and scenario analysis for capital estimation purposes usually seeks to test the capital resilience of a bank by measuring its capital requirements against a severe but plausible event. By capitalising to that stress scenario, or event and timetable (even with a 6% threshold), the exercise sought to ensure, to a high degree of confidence, that it is extremely unlikely that the capital position of the bank will deteriorate beyond this. Summary In the following section, we examine the actual performance of these indicators relative to both the base and the stress scenarios. In general, the macroeconomic variables have broadly performed between the PCAR base and stress scenario inputs, however, with several variable close to the stress case. For information, Appendix 1 includes the current outturn and expectations for 2012 and 2013, respectively. Ireland s GDP growth in 2011 exceeded what was assumed in the PCAR base case. Current forecasts for 2012 and 2013 show GDP growth below base case assumptions, but above what was assumed in the stress case. Similarly, Ireland s GNP contraction in 2011 was greater than was assumed in the PCAR base case, coming close to that assumed under the stress scenario. Current forecasts for 2012 show GNP growth below base case assumptions but above what was assumed in the stress case. Current forecasts for GNP growth for 2013 are below both base and stress scenarios.
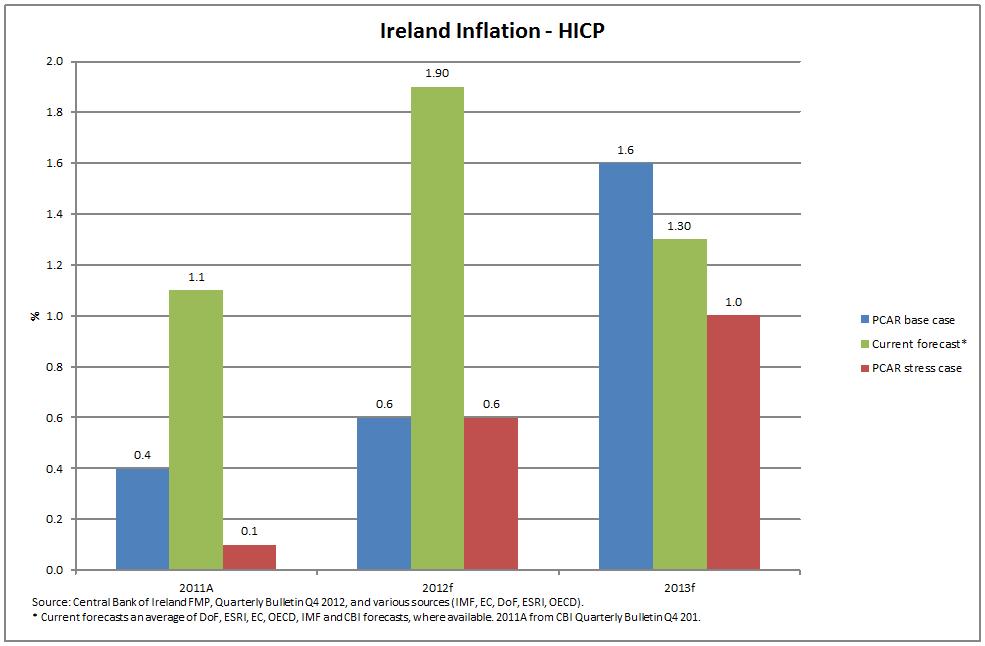
 exceeded base and stress case assumptions in 2011 and current forecasts suggest the same will be the case for 2012.")
11 11 The unemployment rate was above the base case assumptions for 2011 but below the stress case assumptions. Current forecasts predict the same relationship for 2012 and Inflation (represented by HICP) exceeded base and stress case assumptions in 2011 and current forecasts suggest the same will be the case for Current forecasts suggest that it will be below base case assumptions for 2013 but will exceed stress case assumptions. In terms of components of GDP and GNP, Ireland s export growth exceeded both base and stress case assumptions for Current forecasts position export growth for 2012 and 2013 between base and stress case assumptions. The contraction of investment in Ireland in 2011 exceeded the assumptions under both the base and stress case scenarios. Current forecasts suggest that this is likely to be replicated in 2012, with a return to investment growth in Irish house prices declined by 16.7% in 2011, exceeding PCAR base case assumptions, but declining by less than what was assumed under the stress case. The decline in prices this year (to June 2012) is less than both base and stress case assumptions. Peak-to-trough, house prices are down 49% by end-june 2012 compared to 54% assumed in PCAR base and 58% in PCAR stress. The banks are now using peak to trough house price declines of 55% in determining provisioning levels for Irish mortgages. Irish commercial property prices declined by 11.4% in 2011 (between base and stress), according to the IPD property indices, and by 3.5% in H (behind both base and stress case scenarios).
12 12 Within the PCAR, the operating assumption was that foreign exchange rates would remain at end-december 2010 levels. In other words, end-december 2010 spot exchange rates were used as the best estimate of future exchange rates in PCAR. Exchange rates since then have been continued to be quite volatile, with the euro weakening relative to end 2010, particularly since late This increases the value of sterling and US dollar denominated assets and liabilities held on the banks balance sheets.
13 13 The PCAR assumptions included end-december 2010 swap curves to arrive at estimates of future policy and market rates. At the time interest rates were expected to increase from end-2010 levels over the three years to end However, we have seen market and policy rates fall to lower levels.
14 14 5. Profitability Introduction The analysis in this section compares primarily to the PCAR stress case as it was the stress case information that was largely published in the FMP 2011 report and it was also this scenario which set the additional capital requirements for each bank. Note in relation to loan loss forecasts; both base and stress figures were provided in the FMP 2011 report. 5.1 Pre-provision and pre-deleveraging operating profit Overview The analysis below looks at the actual performance for the 18 months from end-december 2010 to end-june 2012 against the PCAR 2011 stress outputs for the same time period. Pre-provision operating profit (before deleveraging, sale of assets, or Liability Management Exercises (LME)) for the banks, in aggregate in 2011, was ahead of stress case. However, the outturn for the first half of 2012 has underperformed versus PCAR projections 6. In addition, the continuing low interest rate environment and the continued high cost of deposits have impacted the banks gross revenue generation. Low interest rates put pressure on deposit margins, while it also negatively impacts the benefit of non-interest bearing current account balances on earnings, and the return that banks earn on those free funds (including current account balances and equity capital). Notwithstanding this, it is also likely to be beneficial in terms of lower loan defaults. Across all the banks, there has been a positive benefit to net interest income versus what was projected in PCAR from lower than expected usage of monetary authority funding, continued usage of own use bonds (OUBs) and broader ECB measures that have helped reduce the cost of funding. 6 We are using interim bank reported data and in some instances, particularly for expenses, it was not possible to adjust for seasonality or restructuring costs.

15 15 Box 3 Key points to note about PCAR operating profit analysis PCAR Assumptions: Within the PCAR, there were a number of assumptions around benchmark interest rates and funding costs. These included that deposit margins remained at or worse than end-december 2010 levels and that policy and market interest rate expectations would be derived from the closing swap curves as of the end-december Also, additional funding spreads were to be added in the stress scenario to reflect more difficult or expensive funding conditions. PCAR Adjustments: Within the PCAR process adjustments were made to almost all elements of the income statements of the banks to get to a Central Bank view. As a result, the comparisons below are the actual out-turns versus the Central Bank adjusted PCAR financials. Operating Profit Analysis: Pre-provision operating profit analysed is before LME, deleveraging losses and other gains on sale of companies. The exception for AIB is the gain on sale of their subsidiary BZWBK and pre-march 2011 LME, which had been realised at the time of the PCAR and are included in the pre-provision operating profit numbers 7. PCAR Forecast Timing: The PCAR projections were provided on an annual basis rather than semi-annual basis. Therefore, we have divided the 2012 full year PCAR figures to get a semi-annualised approximation for the half year commentary below. Where possible, any timing issues between H1/H were taken into account and based on information provided by the banks at the time of PCAR Extrapolation: Caution should be taken against extrapolating these figures forward to December 2013 as drivers for both income and costs have changed over the last 18 months and can be expected to continue to change for the next 18 months. 7 The table above excludes these items in 2011 for comparative purposes.
16 16 BOI Recorded net interest income (excluding Eligible Liability Guarantee Scheme ( ELG ) fees) for the 18 months to end-june 2012 of 2.8bn was 0.2bn lower than the pro-forma 18 month PCAR stress case. BOI highlighted in its interim report to end-june 2012 that net interest income had been behind expectations due to the higher cost of customer deposits and the low interest rate environment. The lower than PCAR net interest income fed through to lower than PCAR pre-provision operating profit (before exceptional items and deleveraging) for the 18 months to end-june 2012, of 0.5bn lower than the stress case. This shortfall came primarily from expenses and other income, including the ELG cost.
17 17 AIB Recorded net interest income for the 18 months to end-june 2012 of 2.7bn was 0.3bn higher than stress case projections. ELG costs were lower than assumed, which was offset by operating expenses being higher than expected. While 2011 operating expenses were in line expectations, H was higher than expected, largely due to the recognition of 0.2bn in termination expenses. This led pre-provision operating profit (before the sale of BZWBK and the pre-march 2011 LME) to be circa 0.3bn higher than in the PCAR stress projections.
18 18 PTSB Recorded net interest income (pre-elg) for the 18 months to end-june 2012 was 0.6bn, in line with stress case projections from PCAR Interest rates have remained lower than expected and deposit rates remained higher. This fed through to pre-provision operating profit, before any exceptional items, which was 0.03bn for the 18 months to June 2012, 0.16bn lower than stress case. Expenses were higher than expected over the period, however, included in the 18 months to end-june 2012 were expenses of 0.09bn for restructuring costs and a third of these had yet to be incurred. Other operating income was lower than forecast, as dividend income from Irish Life was less than assumed.
.")
19 Loan loss provisions Overview Banks recognise loan losses by way of an impairment charge in the income statement with write-off of the actual loans usually taking place at some other point (e.g. loan settlement or collateral repossession and liquidation). Halfway through the PCAR time horizon to end- June 2012, the PCAR banks have, in aggregate and in total for all loan portfolios, recognised loan loss provisions that are higher than the base case, but still lower than the loan losses assumed in the adverse case. In terms of percentage of losses recognised, the analysis compares the provisions recognised by end-june 2012 to the PCAR base and stress projections for the full period to end-december In the FMP, the Central Bank calculated three-year stress case losses of 27.7bn, based on the BlackRock loan-lifetime loss assessment. These loan losses can be disaggregated into: (i) the December 2010 stock of provisions of 9.9bn; and, (ii) the loan impairment charges to be taken through the income statement over the three years to end-2013 of 17.8bn. In this section, the banks performance against the BlackRock base and stress loan estimates is examined by mainly looking at the cumulative impairment charge provisions taken through the income statement, less the 2010 stock of provisions (i.e. against the 17.8bn). In terms of the cumulative flow of loan impairment charges over 2011 and the first six months of 2012, the banks have taken 11.3bn of impairment losses on loans, exceeding the expected base case flow of provisions by 12% and amounting to 63% of the expected flow of stress case provisions of 17.8bn over the three years.

20 20
21 21 Box 4 Key points to note about loan loss provisions in PCAR Loan Loss Timing: Due to the nature by which the BlackRock losses were applied to the income statement (with losses applied equally, one third per annum over the PCAR horizon), there are differences in timing over the three year period as to when the banks actually realise losses versus those expected in PCAR. It is important to note that it would not be meaningful to extrapolate the losses taken by the banks in the 18 months since end-december 2010 to the rest of the period. The timing of loss realisation will also vary by bank depending on their portfolio mix and provisioning approach. Impact of new Guidelines: As part of the PCAR process, loan loss forecasts were converted into future provision estimates. Post-PCAR, the Central Bank published new guidelines for the banks which will result in a variation in how provisions ultimately emerge relative to the assumptions applied within PCAR. In other words, the more conservative recognition of loan loss provisions provided for within the new Guidelines has likely resulted in the earlier recognition of losses relative to that assumed in PCAR. Impact of NAMA II Loans: The comparison of reported impairment provisioning to PCAR base and stress is provided net of NAMA II loans that were expected to transfer at the time of PCAR. This means that losses on land and development loans are excluded from our main loan loss comparison. However, we have analysed the losses on land and development loans separately by comparing provisions taken on these loans to the PCAR expected losses on transfer to NAMA in the section above. Adjustments for Deleveraged Assets: The lifetime loan losses were adjusted for loans identified for disposal under the banks deleveraging plans. Thus, loan losses associated with these portfolios for the period up to disposal as well as the loss on disposal were accounted for in the PCAR process.
22 22 Bank-by-Bank Review Examining performance on a bank-by-bank basis (in terms of the cumulative flow of impairment charges taken through the income statement (i.e. comparable to the 17.8bn total aggregate stress case amount discussed above)), it shows that AIB has exceeded the base case by 2.1bn on an expected flow basis, while PTSB was 0.6bn higher. BOI was 1.5bn below the base case as at end-june By end-june 2012, AIB had taken 82% of the expected three-year flow of stress loan loss provisions; PTSB had taken 74%; while BOI had recorded 36%.
 projected under the base and stress cases in")
23 23 The charts below compare the loan impairment provisions taken by each bank over the 18 months to end-june 2012 with the three-year impairment provisions (net of the 2010 stock of provisions) projected under the base and stress cases in PCAR.

24 24
25 Loan Loss analysis Overview This section seeks to provide further granularity on the loan loss provisions taken to end- June Impairment provisions are a function of the level of loans deemed to be in default, as well as the assessment of the amount which can be recovered on these loans. As such, the analysis below attempts to compare the level of defaults forecast within the PCAR stress scenario and compare this with actual loan defaults to end-june As part of PCAR 2011, BlackRock provided a wide range of outputs in their calculation of loan losses. The Central Bank translated this lifetime loan loss information into provision forecasts, which were in turn utilised in the three year PCAR capital estimation. We have analysed the mortgage portfolio on the basis of the projected level of default stock up to end-december 2013 assumed in PCAR. However, in order to analyse the level of default associated with provision forecasts for the Corporate, Small to Medium Enterprises (SME), Commercial Real Estate (CRE) and Consumer asset classes; loss severities have been assumed by the Central Bank for this analysis. The assumed loss severities for these asset classes have been estimated on the basis of discussions with BlackRock and the range of outputs provided as part of their input to PCAR In addition, BlackRock agree with the appropriateness of this methodology in terms of ex-post analysis.
26 26 Box 5 - Overview of Methodology to estimate PCAR Projected Defaults Mortgages: The projected default stock and the level of exposures assumed to be written off (see below for reference to write-offs) was available from the loan loss exercise. Therefore, by adding back assumed write-offs to the BlackRock loan loss forecast for the period to end-december 2013, the full projected levels of default can be calculated and as such compared with actual defaults (gross of write-offs) for the mortgage portfolio to date. Other Asset Classes: For SME, Corporate, CRE and Consumer asset classes, PCAR 2011 losses were estimated based on the amount of loans assumed to default and liquidate therefore projected defaults were not explicitly produced. As such, projected defaults are estimated in our analysis by dividing projected losses by an assumed loss severity (i.e. the percentage loss on a loan in the event of repossession and liquidation of the underlying collateral, where applicable). Assumed Losses: The assumed losses utilised in this analysis are expert judgement based, but are informed by details provided by BlackRock as part of PCAR 2011 as well as of the views of Central Bank analysts. Sensitivity to Assumptions: As a result of the assumptions in relation to loss severity, the analysis is clearly sensitive to this. That is, the higher the assumed loss severity, the lower the amount of implied defaults. Likewise, when comparing loss severity to provision cover 8, the higher the assumed loss severity, the less conservative banks actual provision cover may appear and vice versa. Treatment of Cures: For loans in default, a certain proportion is normally expected to cure (i.e. return to performance with no associated loss). For the non-mortgage asset classes we have, conservatively, taken no account of cures in our analysis. That is, if you were to assume that a certain percentage of loans default and a certain percentage of these defaulted loans will cure; then the projected default amounts in the analysis below should be scaled up to reflect this assumed percentage. Write-Offs: The current levels of default stock will not include accounts which have been written off to end-june While the exact level of default balances assumed to be written off was not available, it has been estimated by dividing provision write-offs in the 18 months to June 2012 by an assumed loss severity, as set out in the table below. This amount is added back to current default stock to aid comparison between defaults to date versus the forecast. Loan Categorisation: The BlackRock loan loss categories will differ somewhat from the loan categorisation of the banks, on which the actual figures are based and the comparison is made. In aggregate these figures reconcile and overall the analysis provides an indication of the asset classes that are performing better or worse compared to PCAR stress loan loss forecasts. 8 Provision cover here broadly refers to the ratio of loan loss provisions to non-performing loans.
27 27 Projected Defaults Stress Case The tables and graphs below summarise how defaults to end-june 2012 compare against default levels assumed within the PCAR stress scenario to end-december This is shown by bank for mortgages and in aggregate for the other asset classes. Table: Actual and Estimated Default Stock 9 - Mortgages Mortgages PCAR Total Stress Loss Estimate to Dec 2013 ( bn) Total Implied Defaults in PCAR Stress to Dec 2013 ( bn) Dec 2010 Default Stock ( bn) June 2012 Default Stock ( bn) June 2012 Default Stock Gross of Write-Offs ( bn) AIB BOI PTSB Table: Actual and Estimated Default Stock - Other Asset Classes Other Dec 2010 Asset Default Classes Stock ( bn) PCAR Total Stress Loss Estimate to Dec 2013 ( bn) Total Implied Defaults in PCAR Stress to Dec 2013 ( bn) June 2012 Default Stock ( bn) June 2012 Default Stock Gross of Write- Offs ( bn) Total Source: BlackRock Solutions PCAR Loan Loss Forecasting Outputs & Presentations, Central Banks of Ireland estimates, Regulatory Returns, and Bank Submissions 9 Defaults above are defined as CRD Default i.e. greater than 90 days past due, or otherwise classified as unlikely to pay
28 bn 28 For mortgages, all banks defaults to end-june 2012 are lower than the adverse forecast out to For the non-mortgage asset graph 10, the red bar estimates the level of defaults to end-december 2013 implied by our analysis. Note the treatment of cures in the nonmortgage portfolio as the estimated defaults shown by the red bar is therefore estimated net of any cures which might occur in these asset classes. Comparison of Defaults to Date Vs. PCAR Stress Estimate For Mortgages AIB & EBS BOI PTSB Dec 2010 Default Stock ( bn) June 2012 Defaults Gross of Write-Offs Total Defaults in PCAR Stress to Dec 2013 ( bn) Source: BlackRock, bank submissions and Central Bank of Ireland estimates and calculations 16,000mn Comparison of Defaults to Date Vs. PCAR Stress Estimate Other Asset Classes 14,000mn 12,000mn 10,000mn 8,000mn 6,000mn 4,000mn 2,000mn 0mn Corp / SME CRE Consumer Dec 2010 Default Stock ( bn) June 2012 Defaults Gross of Write-Offs Total Defaults in PCAR Stress to Dec 2013 ( bn) Source: BlackRock, bank submissions and Central Bank of Ireland estimates and calculations 10 It would be incorrect to simply directly compare the red and green bars. A more direct comparison could be made by either scaling down the green bar by an assumed cure rate for CRE, Corp / SME and Consumer, or alternatively scaling the red bar upwards in a similar fashion. In addition, the Banks asset type classification may differ slightly from the segmentation assumed under PCAR.
29 29 Projected Provision Cover Stress Case The other component of impairment provisioning is the estimate of what can be recovered on loans in default. The table below compares the level of provision cover assumed within the analysis conducted by BlackRock as part of PCAR 2011 with the actual provision cover at end-june The assumed provision coverage in PCAR reflected the methodological approach taken which resulted in an assumed level of default, by bank, as well as the assumed losses with such defaults, namely the loss severity. BlackRock defined losses as the principal loss amount crystallised at the time of property liquidation following repossession. Consequently, provision cover will differ by bank due to the make-up of the various portfolios from a credit quality and geographic perspective, as well as the asset class breakdown. Table: Provision cover / loss severity - Mortgages Assumed PCAR Provision Cover Mortgages June 2012 Mortgage Cover AIB 52% 37% BOI 37% 37% PTSB 42% 38% Source: BlackRock Solutions PCAR Loan Loss Forecasting Outputs & Presentations, Central Banks of Ireland estimates, Regulatory Returns and Bank Submissions Table: Assumed level of Defaults Written-Off Amount of balance written-off ( bn) Assumed Loss Severity (%) Total Default Loan Balance Excluded ( bn) Mortgage % 0.4 Other Asset Classes % 2.3 Total % 2.7 Source: Regulatory returns, bank submissions to the Central Bank of Ireland, and Central Bank of Ireland estimates
30 30 For mortgages, in aggregate, actual provision cover is broadly in line with PCAR estimates. The provision cover assumed under PCAR reflected the forecast defaults and associated projected losses at end-december Provision cover reflects the level of defaults in the mortgage portfolio and the levels of provisions taken against these defaulted assets at end- June Where the forecast provision cover under PCAR is higher than current this reflects the actual level of default as well as the inherent portfolio mix (e.g. AIB and EBS s mortgage portfolio is largely concentrated in Ireland and NI). For the non-mortgage asset classes the assumed provision cover required within PCAR is again net of cures. 60% Mortgage Provision Cover Comparison 50% 40% 30% 20% 10% 0% AIB BOI PTSB Assumed PCAR Provision Cover Mortgage June 2012 Mortgage Cover Source: BlackRock, bank submissions and Central Bank of Ireland estimates and calculations 100% Other Asset Classes Provision Cover Comparison 90% 80% 70% 60% 50% 40% 30% 20% 10% 0% Corp / SME CRE Consumer Assumed PCAR Provision Cover, Other Asset Classes June 2012 Provision Cover, Other Asset Classes Source: BlackRock, bank submissions and Central Bank of Ireland estimates and calculations

31 Losses on disposals and NAMA Overview Whilst deleveraging and balance sheet change will be covered in further detail in Section 6, losses on deleveraging are a significant driver of capital change, through the impact on profitability in the recorded year, and were a significant input into the capital required to be raised post-pcar. For example, PCAR assumed that the banks, under the stress case, would realise deleveraging losses of 13.2bn made up of losses on the disposal of assets of 9.3bn and losses on the transfer of loans to NAMA of 3.9bn. Subsequently, it was decided that the transfer of land and development loans of less than 20m (NAMA II) would not go ahead and that those loans would be retained on the banks balance sheets. As a result, the deleveraging plans of the banks were revised. On this basis, the analysis shows the loss on disposal 11 of non-core assets realised to end-june 2012 as well as the loss on transfer of residual NAMA I loans (> 20m) to NAMA, and impairment provisions taken through the income statement on land and development loans (as a proxy for NAMA II 12 ). In aggregate, banks have taken losses/provisions on NAMA I and proxy NAMA II loans of 2.2bn and losses on disposal of assets of 1.2bn. Losses on NAMA of 2.2bn are less than the forecast 3.9bn in PCAR due to the differences in timing between a loss crystallised on disposal (PCAR) and incremental provisions (actuality). 11 In certain circumstances, pre-maturity repayments have been classified as disposals. 12 NAMA II loans were excluded from the BlackRock loan loss forecasting process, so impairment provisions on these are not included in our previous analysis of loan losses.
32 32 In general, the banks have performed better than expected in terms of deleveraging losses taken to date (c 3.4bn) compared to the 10.8bn and 13.2bn assumed in the PCAR base and stress cases respectively leaving 9.8bn positive difference versus PCAR stress assumptions as at end-june BOI BOI losses on asset disposals and NAMA of 1.3bn are significantly lower than PCAR stress case projections of 3.9bn and are also below PCAR base case. In terms of timing of disposals and losses most were assumed to happen in The positive difference came from disposal proceeds verus the haircuts assumed in PCAR on the disposal of these assets. BOI had (as of June 2012) largely completed its asset disposal programme; however, some items had not yet settled by end-june 2012 but will be reflected in the full year accounts. AIB Losses on non-core disposals and NAMA for AIB were 2.1bn to end-june 2012, also much lower than the total three year stress assumptions in PCAR of 7.1bn. AIB s losses on disposal of assets are currently significantly less than the base and stress case total projections. As of end-june 2012, AIB still has approximately 4.5bn of non-core assets left to de-leverage. PTSB PTSB did not participate in NAMA so its losses on deleveraging were confined to the sale of non-land and development loan portfolios. While PTSB has sold some assets, its strategic plan is being revised as part of an EU restructuring plan, which is still under assessment and thus deleveraging has not been initiated in a significant way. Therefore, PTSB s losses on deleverage of 5.7m to June 2012 is insignificant relative to PCAR base or stress expectations.
33 33 6. Deleveraging and balance sheet movements Overview The PLAR process was used to identify the amounts of assets required to be disposed of by the banks to aid the return to stable funding levels, reduce monetary authority borrowing and help put the banks balance sheets on a sustainable path to Basel III liquidity metric compliance (namely the proposed Liquidity Coverage and Net Stable Funding Ratios (LCR and NSFR)). Where deleveraging was assumed, the capital gain or loss on disposal of assets, balance run-off, the income foregone, the costs retained, and the reduction in RWAs were all fully integrated at the appropriate time horizon into PCAR in terms of forecasts of income, profit and loss, loan balances and RWAs. Box 6 Key points to note about PLAR and Deleveraging PCAR zero balance sheet growth assumption: Zero balance sheet growth was a central operating assumption behind PCAR, and assumed that the balance sheet only reduced when impairments were forecast and that any exposures that matured were assumed to be replaced with assets of a similar risk. Assets that were designated as non-core or for run-off under deleveraging plans were excluded from this central assumption. Revisions to deleveraging plans: Deleveraging plans for the banks were revised in June 2011 following the decision not to transfer land and development loans of less than 20m to NAMA (NAMA II). Due to this and other bank specific developments, deleveraging targets have changed over the course of the 18 months. We consider the original deleveraging plan as published in the FMP ( FMP 2011 Plan ), and assess the banks current position versus the amended deleveraging targets. Removal of LDR targets: The August 2012 Memorandum of Understanding, under Ireland s EU-IMF Programme of Financial Support, introduced an advanced monitoring framework for banks funding and liquidity, which also substituted the Loan to Deposit Ratio (LDR) targets with nominal deleveraging requirements and a Basel III/CRD IV NSFR benchmark. Banks deleveraging would be assessed based on the existing nominal targets for disposal, run-off and loan loss provisions in line with the 2011 Financial Measures Programme and an advanced monitoring framework would be established in relation to funding and liquidity monitoring, covering in detail all factors affecting banks NSFR.

34 Total loan book movements Overview The analysis considers movements in total net loans, across the core and non-core (deleverage) books. The zero balance sheet growth assumption means that within the stress test most of this movement is in the non-core book, apart from increased impairment provisions in the core book. The FMP report assumed total deleveraging, including disposals, loan book run-off and increased impairment provisions, of 72.6bn. The banks progress on deleveraging can be seen in the table below. Note; given the revision of the banks deleveraging plans, we compare the banks out-turns to end-june 2012 versus the up-to-date nominal deleveraging targets in the table below The table above is from the FMP report. Figures in the table may differ slightly to previously published figures due to amendments to banks deleveraging plans, finalisation of bank s annual reports (for 2010) post-fmp 2011 publication, and rounding and timing differences as of December 2010 and June 2012.

35 35 The chart shows the achieved total aggregate balance sheet deleveraging of 44.7bn during the period from end-december 2010 to end-june 2012.
36 36 Box 7 Key points to note about deleveraging and PLAR Revisions to De-leveraging Plans: Since the March 2011 FMP Report there have been revisions made to the banks deleveraging plans. Other impacts on de-leveraging: While our focus is on non-core deleveraging, it is worth noting that credit supply, demand and customer deleveraging of their own debt levels have driven declines in core loans over and above what was assumed under the conservative zero balance sheet growth model in PCAR/PLAR and subsequent plans. Removal of LDR Target: The focus of deleveraging has moved from the requirement to meet target loan to deposit ratios to nominal targets relating to non-core deleveraging. AIB In terms of de-leveraging AIB has reduced net loans by 23.1bn, with 14.5bn of its non-core deleveraging complete at end-june AIB s loss on disposal to end-june 2012 of 0.5bn is significantly less than had been expected 14. As at end-june 2012, AIB had 6bn of non-core deleveraging to achieve by end-2013, of which 4.2bn was expected to be disposals and 1.8bn amortisation. The non-core deleveraging to date combined with the reduction in net core loans and an increase in deposits since 2010 has led to a total balance sheet LDR of 125% and a core LDR of 105% at end-june BOI In terms of de-leveraging BOI has reduced net loans by 17.7bn, with 12.6bn of its target net loan reduction achieved at end-june Within this, BOI s deleveraging via loan disposal was effectively complete at end-june 2012 and the loss on disposal has come in below both base and stress expectations at 0.8bn (excluding NAMA). The other deleveraging achieved was primarily comprised of run-off of designated loan books. This deleveraging, alongside deposit growth, has led to a 136% total loan to deposit ratio and 99% core LDR. As at end-june 2012, BOI had a further 13.8bn of deleveraging to achieve by end PTSB In terms of de-leveraging PTSB has achieved only 0.8bn of its non-core deleverage plan. With increased deposits and a reduction in net core loans since 2010, its loan to deposit ratio has fallen to 193% on total loans and 137% on core. (PTSB s H LDR is 190% in its interim report and includes intra-group loans and deposits from nonbanking operations). 14 AIB has taken provisions over and above what had been initially expected on non-core loans and there is some interaction between these provisions, the deleverage loss on disposal anticipated and the level of loan loss provisions being taken.
37 Deposit progression and LDRs Overview Under PLAR 2011, the banks were originally required to achieve loan to deposit ratios (LDRs) of 122.5% by December Note the PLAR deleveraging plans were originally linked to base case PCAR projections; however there was limited or no deposit growth assumed in the PCAR and PLAR funding projections. BOI Deposit growth levelled off in H1 2012, however deposit growth overall for BOI has been well ahead of PCAR base and stress assumptions, in particular due to strong growth in its UK 15 deposit book. In addition BOI began to reduce the rates paid on its deposits (including in the UK), in line with its strategy. BOI s LDR has been decreasing in-line with the original PLAR trajectory and the bank met its target of 144% LDR at end-december 2011 and was at 136% at end-june AIB AIB saw a rebound and growth in deposits in H across its business lines. At end-june 2012 AIB s deposits were above stress case PCAR projections and close to, but below the end-2012 base case scenario. AIB also acquired the deposit business of the former Anglo Irish Bank (Anglo) ( 8.3bn) in February 2011 (which was included in the PCAR assumptions), however excluding the impact of the EBS and Anglo transactions, organic AIB deposits actually decreased by 5.5bn in 2011, with strong outflows from non-bank financial institutions and international corporates during quarter 1, AIB also met its original mandated interim target ratio at end 2011 with an LDR of 138%, down from 165% at December By June 2012, the LDR had further improved to 125%. PTSB PTSB deposit projections in PCAR included the acquisition of the 3.6bn deposit portfolio from Irish Nationwide Building Society (INBS) in February However, this was offset by a reduction in deposits during the year, with corporate deposits falling 38% to 2.3bn in The H deposit balance was also boosted by the acquisition of the Northern Rock Irish deposit book of 0.5bn in January 2012 and by the return of some of the corporate deposits; increasing by 1.3bn to 3.6bn. As of June 2012, PTSB s deposits were slightly below PCAR base and stress projections. PTSB s LDR was 227% at end 2011 and 190% at end June The total LDR was higher than the PLAR target due to changes in the strategic plan for the bank, as a result of the on-going review of the plan by the European Commission. 15 BOI s UK deposit book is held within its UK subsidiary and largely comprises of deposits sourced through the UK Post Office. There has been a noticeable positive foreign exchange impact on the stock of deposits for both BOI (in particular) and (to an extent) AIB, given their UK exposures.
38 Overall progress on funding composition Overview 16 In accordance with the Advanced Monitoring Framework introduced in the August 2012 MOU, banks deleveraging will be assessed based on the existing nominal targets for disposal and run-off of non-core assets. Funding and liquidity will be assessed under the framework, including through monitoring of all factors affecting banks Net Stable Funding Ratio ( NSFR ). AIB AIB s funding balance has reduced due to its deleveraging programme, but also due to the recapitalisation, where it received 11.1bn in additional equity. This cash capital injection has significantly decreased funding needs relative to those projected in the PCAR. The main reduction in funding has been in relation to Central Bank borrowing which is lower than the end-2012 stress PCAR estimates. BOI Deposits have performed better than projected, as discussed in the previous section. Central Bank funding reduced by 8bn in the 18 months to end-june 2012, notwithstanding the additional funding of 2.8 billion related to the Irish Government guaranteed repo transaction with Irish Bank Resolution Corporation, and 1.5bn incremental funding availed of via the ECB s LTRO. Short term unsecured wholesale funding decreased to 1.8bn at end-june 2012; this was below what was forecast in PCAR base and stress, but is offset by higher levels of repos and 4.2bn of secured funding. PTSB The funding balance for PTSB is higher than would otherwise have been the case due to the suspension of the PCAR assumed deleveraging plan. The issuance of 2.7bn of unguaranteed funds secured on its UK mortgage book has increased long term funding ahead of PCAR base and stress, as these assets had been earmarked for sale. In addition, the recapitalisation of PTSB with equity of 2.3bn and cash consideration of 1.3bn for the life company reduced funding requirements over the period, with Central Bank funding lower than had been expected by end-2012 under both base and stress. Overall, deposits are marginally behind PCAR base and stress expectations with lower corporate deposits, although this has partially recovered in 2012 and has been further offset by higher levels of retail deposits. 16 The commentary here does not take account of developments in funding markets post-june 2012.

39 39 7. Evolution of capital requirements 17 Overview In general, the banks capital requirements are higher than under the PCAR scenarios at this stage of the deleveraging process. Credit risk capital requirements form the bulk of the PCAR banks total capital requirements with market and operational risk a much smaller fraction. Changes in capital requirements for each of the banks are thus largely due to changes in credit risk capital requirements. Also, changes in credit risk capital requirements are largely driven by balance sheet size and composition (and in particular will be affected where assets are being disposed or run-off). All of the PCAR banks (AIB, BOI and PTSB) use the Foundation Internal Ratings Based Approach 18 ( FIRB ) to calculate regulatory credit risk capital requirements for varying portions of their portfolios. The balance not covered by FIRB is calculated under the standardised approach. Therefore, the mix, geography and approach to the calculation of capital requirements makes comparability across the banks difficult. 17 This relates to the amount of capital banks are required to hold to cover credit, market and operational risks identified under the Basel II/CRD III rules and are a key input into solvency ratios. These are often provided as risk weighted assets, which are capital requirements times Under FIRB banks must use own estimates of PD, LGD, CCF and EAD for retail exposures (e.g. mortgages), however for non-retail exposures (e.g. SME) own estimates of LGD are not utilised, rather a floor of 45% LGD is applied.

40 40 Bank-by-Bank Analysis As the PCAR was not completed using half-year figures, we compare end-june 2012 actual figures to end-december 2012 PCAR projections. AIB s credit risk capital requirements at end-june 2012 are in line with the stress case, albeit this is largely a result of NAMA II loans being been retained on balance sheet, without which they would be below the projections. BOI, which has completed much of its deleveraging, has a credit capital requirement circa 0.2bn (4%) above the 2012 stress case. However, Exposure at Default (EAD) is also higher as a result of the retention of NAMA II loans. In addition, BOI has a significant portion of assets in GBP Sterling (which has strengthened against the Euro) and finally, BOI s loan impairment realisation has been less than assumed in PCAR. Credit capital requirements for PTSB are in large part higher due to a change in deleveraging plans. 2.9bn of the Irish book and 7.5bn of the UK book had been earmarked for sale but this was postponed, as discussed earlier.

41 41 8. Summary of capital versus PCAR expectations 8.1. Overview PCAR 2011 required the participating banks to collectively raise 24bn in capital: 18.7bn of equity capital in order to remain above a 6% CT1 in the stress scenario plus an additional buffer of 5.3bn. This additional capital buffer included 2.3bn of equity capital for conservatism and 3.0bn of contingent capital to safeguard against loan losses beyond The 24bn was fully raised by the institutions by end-june bn was raised by AIB (including EBS), 5.2bn by BOI, and 4bn by PTSB. Of the 21bn CT1 capital required, 65% was raised from the Government and the National Pension Reserve Fund ( NPRF ), 23% was raised from LME, 11% from private issuance and the remainder from the sale of Irish Life Group to the Government by PTSB. The 3bn total contingent capital was raised by the banks issuing contingent capital notes to the Minister for Finance in July These were subordinated tier 2 capital instruments issued at par with five year maturities, an annual coupon of 10% and a potential step-up to a maximum of 18% on the sale to a third party, which convert to equity if a banks CT1 ratio falls below 8.25%. 19 In January this year, the State sold its holding of BOI s contingent capital notes to private investors at 101% of their par value plus accrued interest.
42 Evolution of capital and CT1 ratios Overview Aggregate CT1 capital for the three banks has moved from 13bn as at end-december 2010 to 26bn as at end-june Net losses (stripping out the income benefit of LME during 2011/2012) were a significant drag on capital, but have been offset by the 21bn of equity capital raising (including LME). Post-PCAR the sale of Irish Life by PTSB and the acquisition of the Anglo deposit book by AIB also contributed positively to capital over the period. In the graph on page 43, the total equity capital raising of 21bn can be seen in capital raising assumed in PCAR 20 of 6bn, post March 2011 LME of 5bn and Additional capital raising of 10bn. PCAR assumed 6bn of CT1 capital-raising in 2011 in its projections. Actual capital raised was 21bn. To compare the actual evolution of capital to that in the PCAR projections in the chart below, we strip out the post PCAR capital-raising ( 10.2bn + 5.0bn) above what was assumed in PCAR ( 5.6bn), thus we strip out 15bn from actual capital (the majority of this capital was raised in 2011 and can be seen in the two larger green bars to the right of the second chart below). Other changes to capital, which were included in PCAR forecasts, relate to the integration of the Anglo deposit book into AIB and capital benefits from the sale of BZWBK by AIB. In aggregate the 10bn in losses includes pre-provision operating profit net of deleveraging losses and LME gains of 0.4bn, provisions on non-nama loans of 11.3bn, deleveraging losses of 3.4bn, tax credits from losses of 1.9bn, pre-march 2011 LME of 1.5bn and business disposals of 1.7bn. 20 This relates to the remaining the capital the banks had been required to raise following the PCAR 2010 stress test, which was assumed to be raised in 2011 within PCAR projections. The final capital raising amounts announced following PCAR 2011 incorporates these amounts.
43 43 On this basis, the CT1 capital position before recapitalisation (the 15bn above that which was assumed in PCAR) was below base case but in line with stress case for the three banks at end-december The timing of the sale of Irish Life by PTSB (see section on PTSB for more detail) distorts the graph above somewhat. PCAR had assumed the sale in 2013, but the write-down to the value of the life company happened in 2011 with the pick-up to capital due to the removal of the related life company deduction occurring in H when the sale completed.
44 44 As at end-june 2012, post the capital-raising, BOI had a CT1 ratio of 14%, AIB of 17.3% and PTSB of 20.5% 21, with surplus capital to 10.5% CT1 minimum. This equates to, in aggregate, surplus capital of 9.2bn available to, for example, absorb additional losses due to loan impairment and losses on sale of assets (net of pre-provision operating profits or losses). 21 PTSB published a CT1 ratio of 18.1% in its June-2012 interim results, however, our analysis is based of regulatory returns which were submitted prior to the interim results and showed a higher figure of 20.5%
45 45 BOI BOI as at end-june 2012 had CT1 capital of 8.6bn, giving a CT1 ratio of 14%, after the additional capital raising. Stripping out the recapitalisation and LME of 2011 (net of the 1.7bn which was assumed within PCAR, so 2.6bn), CT1 capital is ahead of both PCAR base and stress case projections in terms of the forecast capital position at end-june The movement in BOI s CT1 capital from the capital position as of 2010 to H level is shown below. In PCAR, capital was projected to move from 7.1bn at end-december 2010 to 1.3bn in 2013 in the stress case and 4.6bn in the base case. The main negative driver of this was loan losses and deleveraging, offset somewhat by the assumption of 1.7bn capital-raising in In actual fact, capital of 2.4bn was raised, along with 1.8bn of gains on LME (totalling the 4.2bn published in FMP with fees and taxes allocated differently between the two items), leading to CT1 capital at end-june 2012 of 8.6bn. Net losses of 2.9bn (after impairment provisions but before LME) for the 18 months compares to 8.1bn assumed for the three years in PCAR stress. This is better than PCAR if compared to 2011 and H numbers, due to lower than projected losses on disposals and loan losses ( 0.8bn for the 18 months). The loss of 1.5bn (stress case) on transfers to NAMA did not occur but impairment charges/income statement movements of 0.5bn were recognised on these loans. Loan impairment provisions recognised in the income statement to end-june 2012 of 2.4bn compare to three-year PCAR base projections of 3.9bn and 6.6bn in the base and stress cases respectively.
46 46
47 47 AIB AIB as at end-june 2012 had CT1 capital of 14bn, giving a CT1 ratio of 17.3%, after the capital injection of 11bn during Stripping out the recapitalisation and LME, that was included within PCAR (leaving in the 4.2bn recap, 1.5bn pre-march 2011 LME and 1.5bn sale of BZWBK assumed in PCAR, therfore excluding 9bn in total), CT1 capital would be slightly above the stress case but would still be below the base case in terms of the capital position at end-june Note the starting positions on the chart below are 3.7bn on actual which excludes EBS and 4.4bn for PCAR, which incorporates EBS. For every other point on the chart we are comparing like with like AIB including EBS consolidated and AIB and EBS PCAR submissions combined. The movement in AIB s CT1 capital from the capital position as of 2010 to the H level is shown above. The PCAR 2011 capital projections for 2011 to 2013 saw capital move from 4.4bn at end-december 2010 to 2.1bn in base and - 2.8bn in stress by end This forecast included 1.5bn of LME that is included in the net profit line in the base, stress and actual lines in the graphs on profitability, which was completed in January 2011 and 1.5bn profit through the income statement from the sale of BZWBK which was completed in April Also included in the PCAR scenario was 4.2bn of capital raising that was expected to be completed following the 2010 PCAR exercise. When we look at what has actually happened, capital was boosted by the injection of 11.1bn from the government and 2.1bn of additional LME ( 1.8bn through the income statement and 0.3bn directly through equity; meeting the 13.2bn required equity capital published in the FMP Report). While the acquisition of EBS from the government for 1 contributed 0.8bn to capital for AIB, our starting position in the graph below is the end- December 2010 capital position of AIB and EBS, so this nets out between the two entities
48 48 on a consolidated basis (capital gain to AIB and capital loss to EBS). Net losses after provisions/deleveraging losses and before the additional LME (but after the 1.5bn included in PCAR) of 5.3bn for the 18 months to end-june 2012 compares to the three-year forecast of 13.4bn in the stress scenario. This includes a 1.3bn benefit from deferred tax assets. (AIB did not recognise any incremental deferred tax assets in the PCAR 2011 process but have recognised them in their accounts since then.) The loss on disposal of assets that was recognised through the income statement was also less than had been forecast to this point in PCAR 2011 ( 0.5bn recognised to date). Three year losses on NAMA I and II of 2.4bn did not occur, but provisions/other income statement items of 1.6bn have been taken on these. To date, provisions of 7bn (excluding land and development loans) have been recognised, compared to 3 year projections 5.0bn in base case and of 8.6bn in stress.
49 49 PTSB PTSB as of end June 2012 had CT1 capital of 3.1bn, giving a CT1 ratio of 20.5% 22 after the capital injection of 2.3bn during Stripping out the recapitalisation and LME amounts of 3.3bn, CT1 capital was below PCAR base and stress case projections in 2011 and at end-june 2012 in terms of the capital position. The movement in PTSB s CT1 capital from the capital position as of 2010 to H is shown above. The PCAR 2011 capital forecasts for 2011 to 2013 saw capital move from 1.7bn at December 2010 to - 1.1bn in the base case and - 2.6bn under stress by end No capital-raising was assumed in the PCAR for PTSB. Looking at the 18 months to date, capital of 2.3bn was injected by the government and PTSB also raised 1bn through LME. Considering the movements in capital due to the sale of the life company on the same basis as how they were included within the PCAR numbers, the net change in capital is 0.1bn. Net losses (after provisions and before LME) of 1.8bn compares to the three-year forecast of 4bn. The planned deleveraging has for the most part not occurred, so losses on deleveraging of 2.2bn have not been realised. PTSB s CT1 pre-recapitalisation was significantly lower than forecast in 2011, due to the timing of the sale of the Irish Life. PCAR had assumed the sale of Irish Life in 2013, with both the loss on sale and the benefit to regulatory capital from the removal of the deduction for life company holdings occurring in 2013 (in both the base and stress scenarios). However, a write-down on the value of the life company was actually reflected in The deduction due to the life company was also reduced that year as a result; but the removal of % in PTSBs June 2012 interim results.
50 50 1.1bn in Tier 2 capital due to LME offset some of this. The removal of the rest of the life company deduction happened by H1 2012, when the life company was sold to the State for 1.3bn, hence the uplift to capital in In the post-recap capital numbers, this is masked by the government injection of 2.3bn in 2011.
51 51 Appendix 1 PCAR economic assumptions, actual outturn and current expectations

52 52

53 53

54 54
55 55 Appendix 2 Glossary Basel III Capital Core Tier 1 capital (CT1) Capital basis Capital buffer Capital requirement A global regulatory framework for banks and banking systems, developed by the Basel Committee on Banking Supervision of the Bank of International Settlements (BIS). In banking, capital comprises mainly share capital, capital contributions, reserves, alternative capital instruments or hybrid instruments. Capital acts as a cushion against losses and a protection for depositors money, and it can be viewed as a measure of financial strength. This is Tier 1 capital excluding certain hybrid or alternative capital instruments. Hybrid or alternative capital instruments are types of instruments with both debt and equity features, for example convertible bonds. Capital basis refers to the set of rules or regulations by which capital adequacy is assessed. In the EU the current set of rules is laid out in the Capital Requirements Directive. The amount of capital a financial institution needs to hold above minimum requirements, calculated through an assessment of risks which fall outside the risks evaluated in the capital ratio. In the case of the Financial Measures Programme, the capital buffer provides additional capitalisation against potential capital absorbing events outside the parameters of the PCAR stress test. This includes defaults outside the PCAR period (without taking account of post-2013 operating income) and other risks which would affect capital adequacy. The capital requirement determines the amount of current and future risk an institution must hold within a given regulatory framework. (An example would be 6% Core Tier 1 requirement under stress scenario.) Risk is measured by an institution s capital adequacy ratio. Institutions which cannot meet the prescribed capital requirement must find a way to increase their capitalisation or to reduce their risk weighted assets.
56 56 Capital Requirements Directive (CRD) Core loan portfolios Exposure at default (EAD) Deleveraging Haircut Liability management exercise (LME) Liquidity Liquidity Coverage Ratio (LCR) The European law which governs minimum capital requirements for all Credit Institutions in EU Members States. Its provisions reflect, to a large extent, the rules laid down by the Basel Committee on Banking Supervision. The loan portfolios identified by the banks as important in the context of supporting the Irish economy and/or important to ensure their on-going financial viability. The value on which a banks is exposed to should a loan or other obligation to the bank fall into default. The process of reduction of non-core assets over time through asset run-offs and disposals. A haircut on a loan is the difference between the nominal value of a loan and the purchase price paid by an investor or acquirer. The discount applied is based on the quality of the loan, ability to repay and underlying collateral. A transaction whereby a bank makes a profit through the repurchase of liabilities for an amount less than their carrying value on the banks balance sheet. For example, the repurchase of subordinated debt for 50% of its face value would generate a profit before tax of 50% of the nominal value outstanding of the debt instrument in question where a holder elects to engage in the transaction with the bank. The degree to which an asset can be easily converted into cash without any price discount. The LCR is a measure of short-term contingent liquidity risk. Its objective is to ensure that a bank has sufficient liquidity to meet potential net outflows from both onand off-balance sheet exposures in a stressed environment. It is defined as the ratio of a bank s stock of high quality liquid assets to its expected net cash outflows in the first 30 days of a specified stress scenario, in line with the parameters set out by the BCBS in December 2010 and subsequently updated in January 2013.
57 57 Loan to Deposit Ratio (LDR) Loan Loss Forecasting Loan-To-Value ratio (LTV) Loss Given Default (LGD) National Asset Management Agency (NAMA) The Loan to Deposit Ratio measures a bank's liquidity by expressing customer loans net of impairment provisions as a percentage of customer deposits. An exercise to determine the extent to which loans will be re-paid over a certain time horizon, based upon the probability of each loan defaulting, the extent to which each loan is currently exposed, and the amount that would likely default at a given point in time. Measures the risk associated with a loan by dividing the amount of a loan provided by a bank by the actual value of the asset. Typically, higher a LTV ratio means a higher risk loan. The credit loss incurred on a loan if a creditor defaults. NAMA is a State agency created in 2009 to improve the creditworthiness of Irish banking system. Its primary function is to take over distressed commercial loans from Irish banks, providing banks with bonds in return. Assets acquired by NAMA will be resolved through sale or wind down. NAMA II refers to land and development loans of less than 20m which were expected to be transferred to NAMA at the time of PCAR 2011, but subsequently were not transferred.
58 58 National Pension Reserve Fund (NPRF) Net Stable Funding Ratio (NSFR) Non-Core Loan Portfolios Probability of Default (PD) PCAR The National Pensions Reserve Fund was established in April 2001 to meet as much as possible of the costs of Ireland's social welfare and public service pensions from 2025 onwards, when these costs are projected to increase dramatically due to the ageing of the population. The Fund is controlled and managed by the National Pensions Reserve Fund Commission. The Commission's functions include the determination and implementation of the Fund's investment strategy in accordance with its statutory investment policy. This policy requires that the Fund be invested so as to secure the optimal total financial return provided the level of risk is acceptable to the Commission. Since 2009 the Commission is also required to make investments in credit institutions, as directed by the Minister for Finance where, having consulted the Governor of the Central Bank and the Financial Regulator, he decides such direction as is required, in the public interest. (Source nprf.ie) The NSFR is a measure of banks structural liquidity mismatch. Its objective is to ensure that a bank s longterm assets (on- and off balance sheet) are funded by stable funding sources, measured by either behavioural or contractual term. It is defined as the ratio of a bank s available stable funding to its required amount of stable funding. The businesses that the banks have identified as not specifically supporting the Irish economy or not important in the context of their on-going viability. Probability of Default measures the likelihood that a loan will not be repaid and will fall into default. There are many techniques for estimating the probability of default for a given loan type, including logistic regression, proprietary models or a ratings based approach. Prudential Capital Assessment Review. An exercise that estimates the capital requirements of credit institutions under a given set of macroeconomic variables and/or risk sensitivities.
59 59 PLAR Risk-Weighted Assets (RWA) Solvency Prudential Liquidity Assessment Review. An exercise to monitor and enforce sound quantitative and qualitative liquidity standards. A measure of the amount of a bank s assets, adjusted for risk. This sort of asset calculation is used in determining the capital requirement or Capital Adequacy Ratio, with risk weightings regulated by the local Central Banks or other financial regulators. The ability to meet short and long term liabilities and other claims on an institution.
60 60

61 T pressoffice@centralbank.ie
PRUDENTIAL CAPITAL ASSESSMENT REVIEW
 PRUDENTIAL CAPITAL ASSESSMENT REVIEW The Central Bank and Financial Regulator has carried out an exercise to determine the forward-looking prudential capital requirements of certain of the Irish credit
ESA95 accounting treatment of July 2011 capital injections into Irish banks
 ESA95 accounting treatment of July 2011 capital injections into Irish banks 27 March 2012 [2] Commercially sensitive data used in compiling this methodological paper have been redacted from this published
Bank of Ireland Presentation October As at 1 Oct 2014
 Bank of Ireland Presentation October 2014 As at 1 Oct 2014 1 Forward-Looking statement This document contains certain forward-looking statements within the meaning of Section 21E of the US Securities Exchange
(formerly Irish Life & Permanent plc) 2012 Half Year Report
 2012 Half Year Report") (formerly Irish Life & Permanent plc) 2012 Half Year Report Six months ended 30 June 2012 Forward Looking Statements This document contains forward looking statements with respect to certain of the Group
(formerly Irish Life & Permanent plc) 2012 Half Year Report Six months ended 30 June 2012 Forward Looking Statements This document contains forward looking statements with respect to certain of the Group
Bank of Ireland Presentation November As at 3 Nov 2014
 Bank of Ireland Presentation November 2014 As at 3 Nov 2014 Forward-Looking statement This document contains certain forward-looking statements within the meaning of Section 21E of the US Securities Exchange
PILLAR 3 Disclosures For the year ended 31 December 2011
 PILLAR 3 Disclosures For the year ended 31 December 2011 1 Forward-Looking Statement This document contains certain forward looking statements within the meaning of Section 21E of the US Securities Exchange
I will do a short presentation following which John O Donovan will do a more detailed run through of the numbers and we will then move to Q & A.
 Interim results 6 months ended 30 June 2011 Presentation 10 August 2011 Speeches Slide 1: Slide 2: Slide 3: Slide 4: Title slide Forward looking statement Title slide Richie Boucher Presentation of interim
Reorganising the Irish Banking System
 Reorganising the Irish Banking System 31 March 2011 John A. Moran Banking Policy Division Objectives Irish Government objectives for the Banking System The Irish Government recognises it is at a critical
Bank of Ireland Presentation. November 2011
 Bank of Ireland Presentation November 2011 As at 21 November 2011 Forward-looking statement This document contains certain forward-looking statements within the meaning of Section 21E of the US Securities
The Governor and Company of the Bank of Ireland Interim Report. For the six months ended 30 June 2018
 The Governor and Company of the Bank of Ireland Interim Report For the six months ended 30 June 2018 The Governor and Company of the Bank of Ireland Interim Report for the six months ended 30 June 2018
INTERIM FINANCIAL REPORT. For the 6 months ended 30 June plc
 INTERIM FINANCIAL REPORT For the 6 months ended 30 June 2015 plc Forward Looking Statements This document contains forward looking statements with respect to certain of the Group s plans and its current
Allied Irish Banks, p.l.c. Half-Yearly Financial Results For the 6 months ended 30 June 2014
 Allied Irish Banks, p.l.c. Half-Yearly Financial Results For the 6 months ended 30 June 2014 Important information and forward looking statement Capital Ratios In compliance with Article 26(2) of the CRR,
Allied Irish Banks, p.l.c.
 Allied Irish Banks, p.l.c. Forward looking statements Slide 2 A number of statements we will be making in our presentation and in the accompanying slides will not be based on historical fact, but will
AIB Group preliminary interim results announcement June 2012
 AIB Group preliminary interim results announcement June 2012 Embargo 9.45am Friday 27 July 2012, Allied Irish Banks, p.l.c. Headlines - The reported loss of 1.2 billion compares to a profit of 2.2 billion
Pre-close trading statement together with comment on National Asset Management Agency (NAMA) and Government Guarantee announcement
 and Government Guarantee announcement") Pre-close trading statement together with comment on National Asset Management Agency (NAMA) and Government Guarantee announcement 17 September 2009 Background Bank of Ireland is issuing the following
Pre-close trading statement together with comment on National Asset Management Agency (NAMA) and Government Guarantee announcement 17 September 2009 Background Bank of Ireland is issuing the following
Forward Looking Statements
 Forward Looking Statements A number of statements we make in our presentation, and in the accompanying slides, will not be based on historical fact but will be forward-looking statements within the meaning
Bank of Ireland Presentation
 Bank of Ireland Presentation October 2013 (as at 1 Oct 2013) 1 Forward looking statement 2 Irish Economy Overview 3 Government finances ahead of target Public finances continue towards sustainability The
Allied Irish Banks, p.l.c. January 2015
 Allied Irish Banks, p.l.c. January 2015 Important information and forward looking statement Capital Ratios In compliance with Article 26(2) of the CRR, AIB is reporting capital ratios without the benefit
EBS Building Society Pillar III Disclosures December 2010
 EBS Building Society Pillar III Disclosures December 2010 Contents 1. Overview... 3 1.1. Background... 3 1.2. EBS Business Model... 3 1.3. Economic Environment... 3 1.4. Basis and Frequency of Disclosures...
Nationwide Building Society Report on Transition to IFRS 9
 Report on Transition to IFRS 9: Financial Instruments As at 5 April 2018 1 Contents Page Summary 3 Introduction 6 Balance sheet and reserves adjustments 8 Loans and advances to customers and provisions
Allied Irish Banks, p.l.c. ("AIB") [NYSE:AIB] is issuing the following update on its trading performance and financial position.
![Allied Irish Banks, p.l.c. (AIB) [NYSE:AIB] is issuing the following update on its trading performance and financial position.](/thumbs/96/127070337.jpg "Allied Irish Banks, p.l.c. (AIB) [NYSE:AIB] is issuing the following update on its trading performance and financial position.") Allied Irish Banks, p.l.c. - Interim Management Statement 19th November 2010 Allied Irish Banks, p.l.c. ("AIB") [NYSE:AIB] is issuing the following update on its trading performance and financial position.
Allied Irish Banks, p.l.c. - Interim Management Statement 19th November 2010 Allied Irish Banks, p.l.c. ("AIB") [NYSE:AIB] is issuing the following update on its trading performance and financial position.
Interim financial statements (unaudited)
") Interim financial statements (unaudited) as at 30 September 2017 These financial statements for the six months ended 30 September 2017 were presented to the Board of Directors on 13 November 2017. Jaime
Interim financial statements (unaudited) as at 30 September 2017 These financial statements for the six months ended 30 September 2017 were presented to the Board of Directors on 13 November 2017. Jaime
Results of the 2011 EBA EU-wide stress test: Summary (1-3)
") Results of the 2011 EBA EU-wide stress test: Summary (1-3) Actual results at 31 December 2010 million EUR, % Operating profit before impairments 3.526 Impairment losses on financial and non-financial assets
Results of the 2011 EBA EU-wide stress test: Summary (1-3) Actual results at 31 December 2010 million EUR, % Operating profit before impairments 3.526 Impairment losses on financial and non-financial assets
Colm Doherty, Group Managing Director
 1 Colm Doherty, Group Managing Director Forward looking statements A number of statements we will be making in our presentation and in the accompanying slides will not be based on historical fact, but
H Pillar 3 Supplement
 H1 2018 Pillar 3 Supplement rbs.com H1 2018 Pillar 3 Supplement Contents Forward-looking statements 2 Presentation of information 2 Capital, liquidity and funding KM1: BCBS 2 & EBA IFRS9: Key metrics RBS
INTERIM REPORT FOR THE SIX MONTHS ENDED 30 JUNE Group Holdings plc. Group Holdings plc
 INTERIM REPORT FOR THE SIX MONTHS ENDED 30 JUNE 2018 Group Holdings plc Group Holdings plc Forward Looking Statements This document contains certain forward-looking statements with respect to certain of
BERMUDA MONETARY AUTHORITY GUIDELINES ON STRESS TESTING FOR THE BERMUDA BANKING SECTOR
 GUIDELINES ON STRESS TESTING FOR THE BERMUDA BANKING SECTOR TABLE OF CONTENTS 1. EXECUTIVE SUMMARY...2 2. GUIDANCE ON STRESS TESTING AND SCENARIO ANALYSIS...3 3. RISK APPETITE...6 4. MANAGEMENT ACTION...6
IRELAND ON RECOVERY PATH
 IRELAND ON RECOVERY PATH Ireland doing everything asked of it that is within its control; but turmoil in euro area makes recovery more challenging Presentation for institutional investors, January 2012
Pillar 3 Disclosures. For the year ended 31 December 2012
 Pillar 3 Disclosures For the year ended 31 December 2012 THIS PAGE HAS INTENTIONALLY BEEN LEFT BLANK Pillar 3 Disclosures for the year ended 31 December 2012 THIS PAGE HAS INTENTIONALLY BEEN LEFT BLANK
Independent Auditors Report
 Independent Auditors Report Independent Auditors Report to the members of Allied Irish Banks, p.l.c. Opinion on the financial statements of Allied Irish Banks, p.l.c. In our opinion: the financial statements
Forward Looking Statements
 Forward Looking Statements This document contains certain forward-looking statements with respect to certain of the Permanent TSB Group Holdings plc s Group s (the Group ) intentions, beliefs, current
Ireland: Significant progress on macro, banking and fiscal adjustment. National Treasury Management Agency, November 2010
 Ireland: Significant progress on macro, banking and fiscal adjustment National Treasury Management Agency, November 2010 Four-year fiscal plan and Budget 2011 in next month Four-year plan: The government
IFRS 9 financial instruments transition report as at 1 July
 18 IFRS 9 financial instruments transition report as at 1 July contents about this report This report covers the audited transition impact of the adoption of IFRS 9 on 1 July 2018. All references to date
Investec plc silo IFRS 9 Financial Instruments Transition Report
 Investec plc silo IFRS 9 Financial Instruments Transition Report 2018 Contents Introduction and objective of these disclosures 4 Overview of the group s IFRS 9 transition impact 5 Credit and counterparty
Pillar 3 Disclosures. For the year ended 31 December 2013
 Pillar 3 Disclosures For the year ended 31 December 2013 Forward-Looking Statement This document contains certain forward-looking statements within the meaning of Section 21E of the US Securities Exchange
I will do a short presentation following which Andrew Keating will do a more detailed run through of the numbers and we will then move to Q & A.
 YEAR END RESULTS PRESENTATION 4 th MARCH 2013 Slide 1: Forward Looking Statement Slide 2: Blank Slide 3: Contents Slide 4: Blank Group Chief Executive s Review: Richie Boucher Group CEO Slide 5: Introduction
Rating Action: Moody's: NAMA triggers mostly positive actions on Irish Banks' BFSR's
 Rating Action: Moody's: NAMA triggers mostly positive actions on Irish Banks' BFSR's Global Credit Research - 31 Mar 2010 Actions follow Government, NAMA and Financial Regulator announcements London, 31
Forward Looking Statements
 Forward Looking Statements This document contains forward looking statements with respect to certain of the Group s plans and its current goals and expectations relating to its future financial condition,
PILLAR 3 Disclosures For the nine months ended 31 December 2009
 PILLAR 3 Disclosures For the nine months ended 31 December 2009 Forward-Looking Statement This document contains certain forward looking statements within the meaning of Section 21E of the US Securities
Preliminary Statement. for the year ended 31 December 2011
 Preliminary Statement for the year ended 31 December 2011 THIS PAGE HAS INTENTIONALLY BEEN LEFT BLANK Preliminary Statement for the year ended 31 December 2011 THIS PAGE HAS INTENTIONALLY BEEN LEFT BLANK
PILLAR 3 DISCLOSURES 2013
 PILLAR 3 DISCLOSURES 2013 AIB Group 31 December 2013 Forwardlooking statements This document contains certain forwardlooking statements within the meaning of Section 27A of the US Securities Act of 1933,
Interim Financial Report 2017
 Interim Financial Report 2017 ABN AMRO Bank N.V. II Notes to the reader Executive Board Report Introduction This is the Interim Financial Report for the year 2017 of ABN AMRO Bank N.V. (ABN AMRO Bank).
Irish Government Debt and Implied Debt Dynamics:
 Research Article Irish Government Debt and Implied Debt Dynamics: 2011 2015 1 John FitzGerald and Ide Kearney 1 The authors of this paper have received helpful comments from colleagues in the ESRI and
Announcement. Group Financial Results for the six months ended 30 June Nicosia, 28 August 2018
 Announcement Group Financial Results for the six months ended 30 June 2018 Nicosia, 28 August 2018 This announcement contains inside information for the purposes of Article 7 of the Market Abuse Regulation
Basel Committee on Banking Supervision. TLAC Quantitative Impact Study Report
 Basel Committee on Banking Supervision TLAC Quantitative Impact Study Report November 2015 Queries regarding this document should be addressed to the Secretariat of the Basel Committee on Banking Supervision
Results of the 2011 EBA EU-wide stress test: Summary (1-3)
") Results of the 2011 EBA EU-wide stress test: Summary (1-3) Name of the bank: Irish Life & Permanent plc Actual results at 31 December 2010 million EUR, % Operating profit before impairments 76 Impairment
Results of the 2011 EBA EU-wide stress test: Summary (1-3) Name of the bank: Irish Life & Permanent plc Actual results at 31 December 2010 million EUR, % Operating profit before impairments 76 Impairment
2015 BOK Financial Corporation and BOKF, NA DFAST Public Disclosure
 2015 BOK Financial Corporation and BOKF, NA DFAST Public Disclosure BOK Financial Corporation and BOKF, NA are required to perform annual company-run capital stress testing pursuant to the Dodd-Frank Wall
Ireland Memorandum of Understanding on. SPECIFIC ECONOMIC POLICY CONDITIONALITY 3 December, 2010
 Ireland Memorandum of Understanding on SPECIFIC ECONOMIC POLICY CONDITIONALITY 3 December, 2010 The quarterly disbursement of financial assistance from the European Financial Stabilisation Mechanism (EFSM),
Export Development Canada Quarterly Financial Report September 30, 2018 Unaudited TRADE UNLIMITED
 Export Development Canada Quarterly Financial Report September 30, 2018 Unaudited TRADE UNLIMITED MANAGEMENT S DISCUSSION AND ANALYSIS TABLE OF CONTENTS MANAGEMENT S DISCUSSION AND ANALYSIS Overview...
Allied Irish Banks, p.l.c. Half-Yearly Financial Report 2013
 Allied Irish Banks, p.l.c. Half-Yearly Financial Report 2013 For the Half-Year ended 30 June 2013 Allied Irish Banks, p.l.c. For further information please contact: Paul Stanley Enda Johnson Niamh Hennessy
Unaudited Quarterly Accounts of the National Asset Management Agency and its Group Entities. For the quarter ended 31 December 2012
 Unaudited Quarterly Accounts of the Management Agency and its Group Entities For the quarter ended 31 December 2012 Management Agency Contents Board and other information 2 General information 3-5 Management
The Royal Bank of Scotland Group
 The Royal Bank of Scotland Group Q311 Fixed Income Investor Call 4 th November 2011 John Cummins Group Treasurer Liam Coleman Deputy Group Treasurer Emete Hassan Head of Debt Investor Relations Important
Transition to IFRS 9
 The financial information in this document has been prepared in accordance with International Financial Reporting Standards (IFRS) as endorsed by the EU (see section 2 of this document regarding the narrow-scope
Bank of Ireland presentation February 2015
 Bank of Ireland presentation February 2015 Forward-looking statement This document contains certain forward-looking statements within the meaning of Section 21E of the US Securities Exchange Act of 1934
Investec Limited group IFRS 9 Financial Instruments Transition Report
 Investec Limited group IFRS 9 Financial Instruments Transition Report 2018 Introduction and objective of these disclosures The objective of these transition disclosures is to provide an understanding
TSB Banking Group plc. Significant Subsidiary Disclosures. 31 December 2015
 Significant Subsidiary Disclosures 31 December Pillar 3 Disclosures Contents CONTENTS... 2 INDEX OF TABLES... 3 1. INTRODUCTION... 4 2. EXECUTIVE SUMMARY... 4 3. OWN FUNDS... 5 3.1. CAPITAL RISK... 5 3.2.
Half-Yearly Financial Results 2018
 Half-Yearly Financial Results 2018 For the six months ended 30 June 2018 AIB Group plc Important information and forward looking statement This presentation should be considered with AIB s Annual Financial
Export Development Canada Quarterly Financial Report June 30, 2018 Unaudited TRADE UNLIMITED
 Export Development Canada Quarterly Financial Report June 30, 2018 Unaudited TRADE UNLIMITED TABLE OF CONTENTS MANAGEMENT S DISCUSSION AND ANALYSIS Overview... 2 Summary of Financial Results... 3 Second
Assessing Capital Markets Union
 6 Assessing Capital Markets Union Quarterly Assessment by Paul Richards Summary It is too early to make an assessment of Capital Markets Union, but not too early to give a market view of the tests by which
Investec plc and Investec Limited IFRS 9 Financial Instruments Combined Transition Report
 Investec plc and Investec Limited IFRS 9 Financial Instruments Combined Transition Report 2018 Contents Introduction and objective of these disclosures 4 Overview of the group s IFRS 9 transition impact
EBS LIMITED DIRECTORS REPORT AND ANNUAL FINANCIAL STATEMENTS. For the year ended 31 December 2012 EBS LIMITED
 DIRECTORS REPORT AND ANNUAL FINANCIAL STATEMENTS For the year ended 31 December 2012 Directors Report and Annual Financial Statements For The Year Ended 31 December 2012 CONTENTS Company Information...
Unaudited Quarterly Accounts of the National Asset Management Agency and its Group Entities. For the quarter ended 30 June 2011
 Unaudited Quarterly Accounts of the Management Agency and its Group Entities For the quarter ended 30 June 2011 Management Agency Contents Board and other information 2 General information 3-5 Management
Results of the 2017 low-interest-rate survey Press conference on 30 August 2017
 Results of the 2017 low-interest-rate survey Press conference on 2017 low-interest-rate survey Bundesbank and BaFin surveyed 1,555 German credit institutions between April and June this year on their profitability
Results of the Basel III monitoring exercise based on data as of 31 December Table of contents
 September 2012 Results of the Basel III monitoring exercise based on data as of 31 December 2011 Table of contents Executive summary... 2 1 General remarks... 7 1.1 Sample of participating banks... 8 1.2
NOTE ON THE COMPREHENSIVE ASSESSMENT
 NOTE ON THE COMPREHENSIVE ASSESSMENT April 2014 1 INTRODUCTION Further progress in carrying out the comprehensive assessment of banks in the euro area has been made by the ECB, the European Banking Authority
Dodd-Frank Act Company-Run Stress Test Disclosures
 Dodd-Frank Act Company-Run Stress Test Disclosures June 21, 2018 Table of Contents The PNC Financial Services Group, Inc. Table of Contents INTRODUCTION... 3 BACKGROUND... 3 2018 SUPERVISORY SEVERELY ADVERSE
Samba Financial Group Basel III - Pillar 3 Disclosure Report. June 2018 PUBLIC
 Basel III - Pillar 3 Disclosure Report June 2018 Basel III - Pillar 3 Disclosure Report as at June 30, 2018 Page 1 of 19 Table of Contents Capital Structure Page Statement of financial position - Step
Interim Report For the six months ended 30 June 2015
 Interim Report For the six months ended 30 June 2015 Interim Report for the six months ended 30 June 2015 Forward-Looking statement This document contains certain forward-looking statements within the
Comparative analysis of the Regulatory Capital calculation across major European jurisdictions. April 2013
 Comparative analysis of the Regulatory Capital calculation across major European jurisdictions April 2013 CONFIDENTIALITY Our clients industries are extremely competitive, and the maintenance of confidentiality
TVL FINANCE PLC PERIOD ENDED 28 MARCH 2018 REPORT TO NOTEHOLDERS 232,000, % SENIOR SECURED NOTES DUE 2023
 TVL FINANCE PLC PERIOD ENDED 28 MARCH 2018 REPORT TO NOTEHOLDERS 232,000,000 8.5% SENIOR SECURED NOTES DUE 2023 195,000,000 SENIOR SECURED FLOATING RATE NOTES DUE 2023 (the Notes ) CONTENTS Highlights
Irish Economic Update AIB Treasury Economic Research Unit
 Irish Economic Update AIB Treasury Economic Research Unit 9th October 2018 Budget 2019 Public Finances in Balance The Irish economy has performed strongly in recent years, boosting tax revenues. Corporation
African Bank Holdings Limited and African Bank Limited
 African Bank Holdings Limited and African Bank Limited Public Pillar III Disclosures in terms of the Banks Act, Regulation 43 CONTENTS 1. Executive summary... 3 2. Basis of compilation... 7 3. Supplementary
Operationalizing the Selection and Application of Macroprudential Instruments
 Operationalizing the Selection and Application of Macroprudential Instruments Presented by Tobias Adrian, Federal Reserve Bank of New York Based on Committee for Global Financial Stability Report 48 The
Banco Comercial Português, SA Capital Update - EU Wide Stress Test Results.
 Banco Comercial Português, SA Capital Update - EU Wide Stress Test Results. Banco Comercial Português was subject to the 2011 EU-wide stress test conducted by the European Banking Authority (EBA), in cooperation
BASEL III PILLAR 3 DISCLOSURES. Building your future. Where home matters principality.co.uk
 BASEL III PILLAR 3 DISCLOSURES 2016 Building your future Where home matters principality.co.uk Contents 1. Key Regulatory Metrics... 1 2. Overview... 2 2.1 Introduction... 2 2.2 Overview of Basel III...
Consultation on Potential Changes to the Lending Framework for Credit Unions CP125
 Consultation on Potential Changes to the Lending Framework for Credit Unions CP125 October 2018 Page 2 Consultation on Potential Changes to the Lending Framework for Credit Unions Central Bank of Ireland
permanent tsb Group Holdings plc announces major corporate developments and its financial results for 2014.
 This notice does not constitute, or form part of and should not be construed as, any offer or invitation to sell or issue, or any solicitation of any offer to purchase or subscribe for, any securities
Citizens Financial Group, Inc. Dodd-Frank Act Mid-Cycle Company-Run Stress Test Disclosure. July 6, 2015
 Citizens Financial Group, Inc. Dodd-Frank Act Mid-Cycle Company-Run Stress Test Disclosure July 6, 2015 The information classification of this document is Public. Page 1 Table of Contents 1. Introduction...
A6 Starting point CET1% - bank provided starting point for any adjustments following the Comprehensive Assessment
 Introduction to the Comprehensive Assessment disclosure templates This document contains final disclosure of the results of the Comprehensive Assessment for Allied Irish Banks plc Specifically, the template
IRELAND: REGAINING CREDITWORTHINESS
 IRELAND: REGAINING CREDITWORTHINESS Ireland returns to bond market in phased way in 2012, as fiscal targets are met and economy continues slow recovery November 30 th, 2012 Index Page 3: Summary Page 7:
COPYRIGHTED MATERIAL. Bank executives are in a difficult position. On the one hand their shareholders require an attractive
 chapter 1 Bank executives are in a difficult position. On the one hand their shareholders require an attractive return on their investment. On the other hand, banking supervisors require these entities
Unaudited Quarterly Accounts of the National Asset Management Agency and its Group Entities. For the period ended 31 December 2010
 Unaudited Quarterly Accounts of the Agency and its Group Entities For the period ended 31 December 2010 Agency Contents Page Board and other information 3 Introduction and general information 4-6 Agency
Annual Results Announcement. For the twelve month period ended 31 December 2010
 Annual Results Announcement For the twelve month period ended 31 December 2010 Forward-looking statement This document contains certain forward looking statements within the meaning of Section 21E of the
March Stress testing the UK banking system: key elements of the 2018 stress test
 March 218 Stress testing the UK banking system: key elements of the 218 stress test Executive summary 2 Background 4 218 annual cyclical scenario 4 218 baseline macroeconomic scenario 8 Further details
Pillar 3 Report. For the year ended 31 December Allied Irish Banks, p.l.c
 Pillar 3 Report For the year ended 31 December 2016 Allied Irish Banks, p.l.c Important Information and Forward-Looking Statements Forward-looking statements This document contains certain forward-looking
Forward Looking Statements
 0 0. Forward Looking Statements A number of statements we make in our presentation, and in the accompanying slides, will not be based on historical fact but will be forwardlooking statements within the
APRA BASEL III PILLAR 3 DISCLOSURES
 APRA BASEL III PILLAR 3 DISCLOSURES Quarter ended 31 August 2018 4 October 2018 This report has been prepared by Bank of Queensland Limited (Bank or BOQ) to meet its disclosure requirements under the Australian
African Bank Holdings Limited and African Bank Limited
 African Bank Holdings Limited and African Bank Limited Public Pillar III Disclosures in terms of the Banks Act, Regulation 43 CONTENTS 1. Executive summary... 3 2. Basis of compilation... 5 3. Supplementary
Bank of Ireland. Interim Results Announcement. For the six months ended 30 June 2011
 Bank of Ireland Interim Results Announcement For the six months ended 30 June 2011 Forward-looking statement This document contains certain forward looking statements within the meaning of Section 21E
12. LIQUIDITY RISK LIQUIDITY RISK MANAGEMENT AND ASSESSMENT MANAGEMENT MODEL
 12. LIQUIDITY RISK 12.1. LIQUIDITY RISK MANAGEMENT AND ASSESSMENT LIQUIDITY MANAGEMENT The BCP Group liquidity management is globally accompanied and the supervision is coordinated at a consolidated level
TABLE 2: CAPITAL STRUCTURE - December 31, 2015
 Frequency : Quarterly Location : Quarterly Financial Statement TABLE 2: CAPITAL STRUCTURE - December 31, 2015 Balance sheet - Step 1 (Table 2(b)) All figures are in SAR '000 Assets Balance sheet in Published
First Quarter 2018 Profit after Tax at Euro 65.2 million
 First Quarter 2018 Profit after Tax at Euro 65.2 million Main Highlights - Strong capital position with Common Equity Tier 1 ratio (CET 1) at 18.3%; Tangible Book Value the highest among Greek banks at
African Bank Holdings Limited and African Bank Limited
 African Bank Holdings Limited and African Bank Limited Public Pillar III Disclosures in terms of the Banks Act, Regulation 43 CONTENTS 1. Executive summary... 3 2. Basis of compilation... 9 3. Supplementary
Basel Committee on Banking Supervision
 Basel Committee on Banking Supervision Basel III Monitoring Report December 2017 Results of the cumulative quantitative impact study Queries regarding this document should be addressed to the Secretariat
March Stress testing the UK banking system: 2018 guidance for participating banks and building societies
 March 2018 Stress testing the UK banking system: 2018 guidance for participating banks and building societies 1 Background 2 2 Objectives of this guidance 2 3 Banks participating in the 2018 stress test
Credit Risk Sydbank Group
 Credit Risk 2017 Sydbank Group 1 2 SYDBANK / Credit Risk 2017 Contents Introduction... 4 Credit and client policy... 5 Rating... 6 Industry breakdown... 12 Focus on agriculture... 15 Focus on retail clients...
3. CAPITAL ADEQUACY 3.1. REGULATORY FRAMEWORK 3.2. OWN FUNDS AND CAPITAL ADEQUACY ON 31 DECEMBER 2017 AND 2016
 3. CAPITAL ADEQUACY 3.1. REGULATORY FRAMEWORK On 26 June 2013, the European Parliament and the Council approved the Directive 2013/36/EU and the Regulation (EU) no. 575/2013 (Capital Requirements Directive
Alpha Bank ECB Comprehensive Assessment Overview. October 26, 2014
 Alpha Bank 2014 ECB Comprehensive Assessment Overview October 26, 2014 Successful Completion of the Comprehensive Assessment under the Static Assumptions with Strong Capital Buffers Alpha Bank Comprehensive
Stress testing the UK banking system: 2017 results
 Management Solutions 2017. All rights reserved. Stress testing the UK banking system: 2017 results Bank of England (BoE) www.managementsolutions.com Research and Development Management Solutions 2017.
interim report 1 quarter unaudited
 interim report 1 quarter unaudited 18 Interim report from the Board of Directors About the Company Møre Boligkreditt AS is a wholly owned subsidiary of Sparebanken Møre. The company is licensed to operate