Sberbank Group s IFRS Results for March 2010
|
|
|
- Marianna Gallagher
- 5 years ago
- Views:
Transcription
1 Sberbank Group s IFRS Results for 2010 March 2010

2 Highlights of 2010 (1) The Group s net profit reached RUB bn versus RUB 24.4 bn for 2009 Total comprehensive income reached RUB bn versus RUB 38.9 bn for 2009 Strong performance in 2010: ROE 20.6%, cost to income ratio 42.4% Fee and commission income grew by 23.8% compared to 2009 Loan impairment charge decreased by 60.5% vis-a-vis 2009 Strong capital adequacy: Basel I total capital adequacy is 16.8%, CBR N1 capital adequacy ratio %


3 Highlights of 2010 (2) Net profit, RUB bn Operating income before provision charge for loan impairment, RUB bn ROE, % 7.4 times +2.9% p.p. YE YE YE % YE YE YE09 3.2% Cost to income ratio, % Provision charge for loan impairment, RUB bn Interest margin, % +7.0 p.p % -1.2 p.p. YE % YE YE10 6.6% YE % YE YE09 7.8% 3
4 Highlights 2010 (3) ITEM 2010 (RUB bn) 2009 (RUB bn) Change Operating income before provision charge for loan impairment % Operating expenses % Provision charge for loan impairment % Net profit times Total comprehensive income times Earnings per ordinary share, RUB times ITEM 4Q10 (RUB bn) 4Q09 (RUB bn) Change Operating income before provision charge for loan impairment % Operating expenses % Provision charge for loan impairment % Net profit times Total comprehensive income times Earnings per ordinary share, RUB times 4
5 Highlights 2010 (4) ITEM Change Assets, RUB bn 8, , % Loans to customers (net), RUB bn 5, , % Due to customers, RUB bn 6, , % Equity, RUB bn % Tier I capital adequacy ratio (Basel I) 11.9% 11.5% 0.4 pp Total capital adequacy ratio (Basel I) 16.8% 18.1% -1.3 pp PLI rate (Provision for loan impairment to Total gross loans) 11.3% 10.7% 0.6 pp ITEM Change Return on equity 20.6% 3.2% 17.4 pp Return on assets 2.3% 0.4% 1.9 pp Cost to income ratio 42.4% 35.4% 7.0 pp Interest margin* 6.6% 7.8% -1.2 pp * Net interest income to average earning assets. 5
6 Key Financial Indicators (1) Net Profit, RUB bn 7.4 times 5.1 times Earnings per Ordinary Share, RUB 7.7 times 5.2 times Reduction of the provision charge for loan impairment by RUB bn (or by 60.5%) as compared to 2009 is a major driver of net profit growth in 2010 Lower net profit in 2Q10 is explained by a loss from marking to market the securities portfolio and increased operating expenses 6
7 Key Financial Indicators (2) Return on Assets (ROA), % +1.9 pp +2.7 pp 2.3% 3.5% 0.4% 0.8% 2.4% 1.1% 2.3% Return on Equity (ROE), % pp pp 3.2% 20.6% 7.3% 21.3% 9.7% 20.3% 30.3% The Group demonstrated strong performance in 2010 with ROE 20.6% ROA and ROE increased in 4Q10 as a result of higher net profit for the quarter 7
8 Operating Income Before Provision Charge for Loan Impairment Operating Income Before Provision Charge for Loan Impairment, RUB bn +2.9% Other income / (expense) Net fee and commission income Net interest income Net gains/(losses) from trading operations and revaluation of securities +6.9% Net operating income before provision charge for loan impairment increased by 2.9% in 2010 compared to 2009, with fee and commission income being the major driver of this growth. Net interest income remains the main component of operating income Growth of net operating income before provision charge for loan impairment in 4Q10 was driven primarily by growth of net interest income and net fee and commission income 8
9 Net Interest Income Net Interest Income, RUB bn -1.4% +6.4% Net Interest Spread and Interest Margin, % Yield on earning assets 12.1% 11.8% 10.5% 9.9% 10.2% Interest margin Net interest spread Cost of funds 7.5% 7.3% 7.0% 6.8% 6.3% 6.1% 6.7% 5.7% 5.6% 6.3% 5.1% 5.0% 4.8% 4.3% 3.9% Net interest income in 2010 decreased by 1.4% reflecting the general decline of interest rates in the market and competition for good borrowers The main drivers of the net interest margin growth were an overall decrease in cost of funds in Q by 0.4 percentage points (p.p.) and a 0.3 p.p. growth of yields on corporate loans 9

10 Interest Income Interest Income, RUB bn % Other Loans to individuals Corporate loans % Average Loan Yields, % Loans to individuals Total loans Corporate loans 15.1% 14.7% 14.9% 15.2% 14.8% 13.4% 13.4% 13.0% 13.0% 11.9% 11.6% 11.7% 11.0% 10.6% 10.9% Interest income decreased in 2010 by 2.4% Yield on corporate loans increased in Q410 by 30 bp as a result of the Group successful efforts to collect overdue interest on a number of corporate loans Other interest income for 2010 includes RUB bn of interest income on debt securities (2009: RUB 54.2 bn) 10
11 Interest Expense Interest Expense, RUB bn -4.0% Other Corporate accounts/term deposits Individual accounts/term deposits % Average Customer Deposit Costs, % Corporate term deposits Individuals term deposits Current/settlement accounts 6.5% 6.4% 6.2% 5.9% 5.3% 6.1% 5.5% 5.4% 4.7% 0.9% 0.8% 4.2% 0.7% 0.7% 0.6% Interest expense decreased in 2010 by 4.0% The main component of the Group s interest expense is the cost of retail deposits. Their cost was decreasing steadily in 2010 following Group s pricing policy Other interest expense for 2010 includes RUB 28.2 bn of interest expense on subordinated debt (2009: RUB 41.3 bn) 11
12 Fee and Commission Income Fee and Commission Income, RUB bn +23.8% Other fee and commission income Plastic cards operations Cash and settlement transactions with individuals Cash and settlement transactions with legal entities % Fee and commission income increased in 2010 by 23.8% Cash and settlement transactions with customers remain the major source of Group s fee and commission income. Commission income from operations with individuals grows faster than the income from operations with legal entities Included in other fee and commission income for 2010 are RUB 9.4 bn of agent commissions on selling insurance contracts (2009: RUB 0.6 bn) and RUB 5.9 bn of commissions on operations with foreign currencies (2009: RUB 7.9 bn) 12

13 Operations with Securities Interest Income on Securities, RUB bn +94.8% +55.9% Net Gains from Trading Operations and Revaluation of Securities, RUB bn -32.8% -89.5% A substantial increase in interest income on debt securities in 2010 came as a result of growing portfolio of investments in bonds of the Bank of Russia, Russian federal government bonds and corporate bonds Net gains on trading operations and revaluation of securities decreased in 2010 by 32.8% Unrealized gains on revaluation of investment securities available for sale posted in other comprehensive income amounted to RUB 31.3 bn in 2010 (2009: RUB 40.7 bn) 13
14 Foreign Exchange Operations and Operations with Precious Metals Net Gains from Foreign Exchange Operations, RUB bn -13.0% % Net Gains from Operations with Precious Metals, RUB bn -64.7% -87.5% Net gains from foreign exchange operations for 2010 include gains from trading in foreign currencies of RUB 8.1 bn (2009:RUB 13.0 bn), translation gains of RUB 15.2 bn (2009: RUB 15.3 bn) and losses from operations with foreign currency derivatives amounting to RUB 9.2 bn (2009: RUB 12.1 bn). Losses on foreign exchange derivatives are mainly due to hedging operations that are related to the translation gains 14
15 Operating Expenses Operating Expenses, RUB bn +23.2% Other operating expenses Staff costs +30.7% Actual Headcount (Sberbank standalone, in thousands) -3.6% Total operating expenses for 2010 grew by 23.2% Staff costs grew in 2010 as a result of a planned increase of staff remuneration to bring it in line with the current market level. Other operating expenses increased on the back of the Group s strategy implementation, including new infrastructure projects, marketing and advertising expenses 15
16 Provision Charge for Loan Impairment Provision Charge for Loan Impairment, RUB bn -60.5% -95.7% Write-offs against Provision for Loan Impairment, RUB bn % 10.3 times In 2010 provision charge for loan impairment decreased by 60.5% as a result of stabilization of the quality of the loan portfolio Sale of some non-performing loans was a key driver for increase of write offs in 4Q
17 Asset Dynamics and Structure Assets, RUB bn Asset Structure +28.1% +21.4% 7,105 6, ,064 8, ,824 Other assets Cash and cash equivalents 5% 6% 7% 12% 10% 8% 7% 15% 21% Securities 5,078 4,864 5,489 Loans and advances to customers 76% 69% 64% The Group s assets grew in 2010 by 21.4% This growth was driven primary by the expansion of the securities portfolio and increased volume of loans and advances to customers As of 2010 year end, interest-earning assets comprised 87.6% of the Group s total assets 17
18 Loan Portfolio (1) Loan Portfolio before Provision for Loan Impairment, RUB bn +17.3% Corporate Loan Portfolio Structure, RUB bn Commercial loans Specialised loans +13.7% 4, % 4,872 5,280 5,444 6,192 2,060 48% 2,164 44% 2,206 52% 2,708 56% The Group s gross loan portfolio grew in 2010 by 13.7% due to increase in loans to both corporate and retail customers on the back of higher demand Corporate loans grew by RUB 606 bn or 14.2% in 2010 Loans to individuals grew by RUB 142 bn or 12.1% in Retail Loan Portfolio Structure, RUB bn 1, Consumer and other loans Mortgage loans Car loans +12.1% 48% 1, % % % % 6% 18

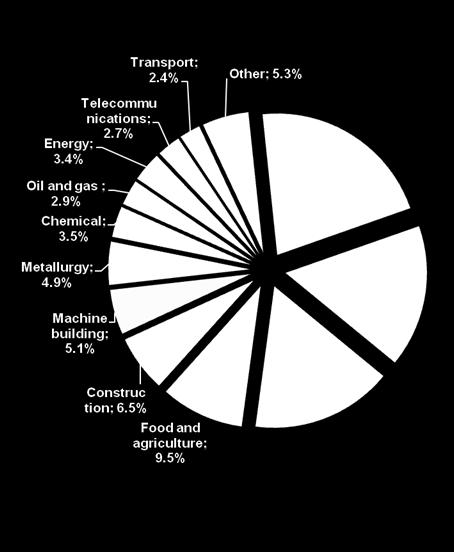
19 Loan Portfolio (2) Industry Breakdown, as of 31 December 2010 Currency Breakdown Rubles US dollars Other currencies 3.0% 3.9% 14.3% 17.4% 82.7% 78.7% Maturity Breakdown Less than 6 months 6 to 12 months 1 to 3 years More than 3 years 29.1% 29.1% 31.7% 35.7% 19.9% 18.2% 19.3% 17.0% The Group s loan portfolio is well diversified, with the largest industry comprising 16.3% of the total loan portfolio The proportion of ruble-denominated loans decreased in 2010 by 3.9 p.p. The maturity structure of the loan portfolio changed towards increased proportion of medium term loans (1-3 years) 19
20 Loan Portfolio Quality Non-Performing Loans* and Provision for Loan Impairment, RUB bn Provision for loan impairment Non-performing loans Non-Performing Loans in Loan Portfolio, % 8.4% 8.9% 9.1% 8.6% 7.3% Provision for Loan Impairment (PLI) to Total Loans, % NPL Coverage Ratio (PLI to Non-Performing Loans) 10.7% 11.7% 12.5% 12.2% 11.3% * Overall exposure, should there be any payments (principal and/or interest) overdue more than 90 days as of the reporting date. In 4Q10, the proportion of non-performing loans in the loan portfolio decreased by 1.3 pp explained by a sale of some nonperforming loans In 4Q10, the NPL coverage ratio increased by 0.2 and reached 1.6 Renegotiated loans before provision for loan impairment amounted to RUB RUB bn as at YE2010, or 12.1% of the loan portfolio (as at YE2009: RUB bn or 11.9%) 20
21 Securities Portfolio Securities by Portfolio, RUB bn Securities by Type, RUB bn 3.7 times +71.4% 1, ,823.6 Investment securities available for sale Other securities 1, , Securities designated at fair value through profit or loss Trading securities Investment securities held to maturity 1, Corporate bonds Municipal bonds Eurobonds RF Bonds of the Bank of Russia OFZ bonds In 2010, investments in OFZ bonds doubled and reached RUB bn. Investments in bonds of the Bank of Russia and corporate bonds also grew at a high pace In 2010, the Group created a portfolio of investment securities held to maturity which totaled RUB bn at YE 2010 In 2010, the Group expanded its investments in equities; they totaled RUB bn at YE
22 Liabilities Dynamics and Structure Liabilities, RUB bn Liabilities Structure +27.6% 5, ,683 3, , ,652 3, % 54 7, ,817 4, Other Due to other banks Subordinated debt Due to legal entities Due to individuals 6% 5% 7% 1% 5% 8% 4% 9% 28% ####### ####### Менее 6 м 32.3% 31.2% От 6 до % 10.0% От 1 года 20.0% 18.7% Более 3 л 37.4% 40.1% 52% 26% 24% 60% 63% 2% Retail deposits dominate the Group s sources of funding, comprising 63% of total liabilities as of 2010 year end Subordinated debt decreased in 2010 due to repayment of RUB 200 bn before maturity Borrowings from the international capital markets amounted to RUB bn as of YE2010 or 3.3% of total liabilities. In September October 2010, the Group issued USD 1.25 bn worth of loan participation notes (LPN) at 5,4% p.a. In December 2010, the Group obtained a syndicated loan of USD 2 bn from a consortium of foreign banks at 6 months LIBOR + 1.5% p.a. 22

23 Amounts Due to Customers Industry Breakdown, as of 31 December 2010 Currency Breakdown Rubles US dollars Euro Other currencies 8.4% 5.4% 10.8% 10.1% 78.9% 82.4% Maturity Breakdown Less than 6 months 6 to 12 months 1 to 3 years More than 3 years 5.8% 5.3% 44.0% 43.6% 13.2% 9.0% 37.0% 42.1% Retail deposits are traditionally the core of the Group s customer deposits Maturity breakdown demonstrates a stable and balanced funding structure 23
24 Shareholders Equity and Capital Adequacy Group s Equity, RUB bn Capital Adequacy Ratio, Basel Основной 12.10% 11.70% 11.70% Дополнит 6.80% 6.70% 6.30% 13% 18.90% 18.00% % 18.90% 18.40% Tier 1 Tier % 16.8% 6.6% 4.9% 11.5% 11.9% Regulatory Capital, Basel 1, RUB bn Risk-Weighted Assets, RUB bn +10.8% +19.2% 1, ,263.9 Tier 2 Tier , , The Group s capital adequacy ratio is well above the Basel committee requirements. In May 2010, the Group paid back RUB 200 bn of the RUB 500 bn subordinated loan obtained from the CBR in 4Q08. The Group s Tier 2 capital decreased as a result. The total capital adequacy ratio according to the Basel 1 Accord as of YE2010 was 16.8% 24
25 Forward-Looking Statements This presentation has been prepared by the Group of Sberbank (Sberbank of Russia (the Group )). This presentation does not constitute or form part or all of, and should not be construed as, any offer of, or any invitation to sell or issue, or any solicitation of any offer to purchase, subscribe for, underwrite of otherwise acquire, or a recommendation regarding, any shares or other securities representing shares in, or any other securities of the Bank, or any member of the Bank s group, nor shall it or any part of it nor the fact of its presentation or distribution form the basis of, or be relied on in connection with, any contract or any commitment whatsoever or any investment decision. The information in this presentation or in oral statements of the management of the Group may include forward-looking statements. Forward-looking statements include all matters that are not historical facts, statements regarding the Group's intentions, beliefs or current expectations concerning, among other things, the Group's results of operations, financial condition, liquidity, prospects, growth, strategies, and the industry in which the Group operates. By their nature, forward-looking statements involve risks and uncertainties, because they relate to events and depend on circumstances that may or may not occur in the future. The Group cautions you that forward-looking statements are not guarantees of future performance and that its actual results of operations, financial condition and liquidity and the development of the industry in which the Group operates may differ materially from those made in or suggested by the forward-looking statements contained in this presentation or in oral statements of the management of the Group. In addition, even if the Group's results of operations, financial condition and liquidity and the development of the industry in which the Group operates are consistent with forwardlooking statements contained in this presentation or made in oral statements, those results or developments may not be indicative of results or developments in future periods. The information and opinions contained in this presentation or in oral statements of the management of the Group are provided as at the date of this presentation and are subject to change without notice IFRS
9M 2018 Results. November 8, Dmitry Pyanov Senior Vice President, Head of Finance Department. Leonid Vakeyev Head of Investor Relations
 9M 2018 Results November 8, 2018 Dmitry Pyanov Senior Vice President, Head of Finance Department Leonid Vakeyev Head of Investor Relations MACRO & MARKET ENVIRONMENT Current indicators Forecast 2018 Market
HCFB 3M 2018 financial results
 HCFB 3M 2018 financial results 30 May 2018 1 Disclaimer "IMPORTANT: You must read the following before continuing. The following applies to this document, the oral presentation of the information in this
Alfa-Bank Ukraine. First half 2009 results. 23 November, 2009 Kiev
 Alfa-Bank Ukraine First half 2009 results 23 November, 2009 Kiev Market Share Market Share and Ranking 9M 2009 2008 2007 Share Place Share Place Share Place Assets 3.8% 7 3.5% 8 2.5% 10 Corporate Loans
FY 2018 IFRS Results
 FY 2018 IFRS Results Highlights for FY 2018 Net Income increased by 21% y-o-y and reached RUB 9.0 bn for FY 2018, the all-time best result Cost-of-Risk 194 bp for FY 2018, ahead of guidance Core business
CREDIT BANK OF MOSCOW (public joint-stock company)
") CREDIT BANK OF MOSCOW (public joint-stock company) Consolidated Interim Condensed Financial Statements for the three-month period ended Contents Independent Auditors Report on Review of Consolidated Interim
CREDIT BANK OF MOSCOW (public joint-stock company) Consolidated Interim Condensed Financial Statements for the three-month period ended Contents Independent Auditors Report on Review of Consolidated Interim
Consolidated Condensed Interim Financial Statements and Report on Review
 Consolidated Condensed Interim Financial Statements and Report on Review CONTENTS Report on Review Consolidated Condensed Interim Financial Statements Consolidated Condensed Interim Statement of Financial
Mashreq Bank. YE 2016 Results
 Mashreq Bank YE 2016 Results 2 Disclaimer The material in this presentation is general background information about MashreqBank s activities current at the date of the presentation. It does not constitute
CREDIT BANK OF MOSCOW (public joint-stock company)
") CREDIT BANK OF MOSCOW (public joint-stock company) Consolidated Interim Condensed Financial Statements for the three-month period ended Contents Auditors Report on Review of Consolidated Interim Condensed
CREDIT BANK OF MOSCOW (public joint-stock company) Consolidated Interim Condensed Financial Statements for the three-month period ended Contents Auditors Report on Review of Consolidated Interim Condensed
April 2, FY 2012 Earnings Presentation
 April 2, 2013 FY 2012 Earnings Presentation Disclaimer NOT FOR RELEASE OR DISTRIBUTION OR PUBLICATION IN WHOLE OR IN PART IN OR INTO THE UNITED STATES, AUSTRALIA, CANADA OR JAPAN. This presentation has
Investor Presentation. August 2013
 Investor Presentation August 013 1 Some of the information in this presentation may contain projections or other forward-looking statements regarding future events or the future financial performance of
Otkritie Holding JSC. Interim condensed consolidated financial statements. 30 June 2014
 Otkritie Holding JSC Interim Otkritie Holding JSC Interim condensed consolidated financial statements Contents Report on review of the interim Interim condensed consolidated statement of financial position...
4 August Q 2016 Earnings Presentation
 4 August 2016 2Q 2016 Earnings Presentation Key developments in April July 2016 Main corporate events The Supervisory Board called EGM on Sept 2 nd. The EGM will vote on a corporate restructuring proposal
AEROFLOT ANNOUNCES 1H 2016 IFRS FINANCIAL RESULTS
 AEROFLOT ANNOUNCES 1H 2016 IFRS FINANCIAL RESULTS Moscow, 29 August 2016 Aeroflot Group ( the Group, Moscow Exchange ticker: AFLT) today publishes its condensed consolidated interim financial statements
OTP Group 2008 Results and 2009 Guidance
 OTP Group Conference call presentation 13 February, 29 Presented by: Dr. László Urbán, CFO HUF 219 billion adjusted after tax profit in 28, in line with modified profit plans Financial highlights of OTP
Information about the activity of Bank Millennium Capital Group during 1st quarter of 2014
 PRESS RELEASE page: 1 Warszawa, 28 April 2014 Information about the activity of Bank Millennium Capital Group during 1st quarter of 2014 (Warszawa, 28 April 2014) Bank Millennium Group (the Group ) consolidated
2016 IFRS RESULTS APRIL 27, IFRS RESULTS
 26 IFRS RESULTS APRIL 27, 27 26 IFRS RESULTS Alexander Ivannikov Head of Department 26 IFRS RESULTS 2 DISCLAIMERS This presentation has been prepared by PJSC Gazprom (the Company ) and comprises the slides
Moscow Exchange Securities Market
 October 22, 2014 London Anna Kuznetsova MD, Securities Market Moscow Exchange Securities Market India Brazil HK US Europe China World UK Japan EMEA Russia Mexico USA India South Africa UK Japan Turkey
Open Joint-Stock Company NOMOS-BANK
 Open Joint-Stock Company NOMOS-BANK Condensed Interim Consolidated Financial Statements (Unaudited) For the Nine and Three Months Ended OPEN JOINT-STOCK COMPANY «NOMOS-BANK» CONDENSED INTERIM CONSOLIDATED
Idea Bank S.A. Group Results Q r.
 Idea Bank S.A. Group Results Q1 2017 r. Presentation of the Management Board for Investors 24 April 2017 Q1 2017 Fact Sheet PLN 60,2 m adjusted net profit in Q1 2017 The net result adjusted by resolution
AEROFLOT ANNOUNCES 6M 2017 IFRS FINANCIAL RESULTS
 AEROFLOT ANNOUNCES 6M 207 IFRS FINANCIAL RESULTS Мoscow, 29 August 207 Aeroflot Group ( the Group, Moscow Exchange ticker: AFLT) today publishes its condensed consolidated interim financial statements
Financial Results for the 1st Quarter of FY2016
 Financial Results for the of FY2016 Aug, 2016 Ashikaga Holdings Co., Ltd. (code : 7167) The Ashikaga Bank, Ltd. Contents 1 Income Status 2 Top-line 3 Loans and deposits (average balance / average yield)
AEROFLOT ANNOUNCES 9M 2017 IFRS FINANCIAL RESULTS
 AEROFLOT ANNOUNCES 9M 207 IFRS FINANCIAL RESULTS Мoscow, 30 November 207 Aeroflot Group ( the Group, Moscow Exchange ticker: AFLT) today publishes its condensed consolidated interim financial statements
TABLE OF CONTENTS 1. INTRODUCTION 1. INTRODUCTION
 Russia Industry Research Banks 6 September 217 Authors: Vladimir Gorchakov Rating Associate Hector Alvarez Rating Associate For further information contact: Rating-Agentur Expert RA GmbH Walter-Kolb-Strasse
Yapı Kredi 1Q18 Earnings Presentation
 Yapı Kredi 1Q18 Earnings Presentation 3 May 2018 Boost in Profitability... 1.2 bln TL Net Income +24% y/y All time high net profit 17.1% ROATE 1 +126 bps y/y Further improvement in ROATE 36% Cost/Income
B&N BANK (JOINT-STOCK COMPANY) Condensed Interim Consolidated (Unaudited) Financial Information for 6 months ended June 30, 2010
 Condensed Interim Consolidated (Unaudited) Financial Information for 6 months ended June 30, 2010") B&N BANK (JOINT-STOCK COMPANY) Condensed Interim Consolidated (Unaudited) Financial Information for 6 months ended B&N BANK (JOINT-STOCK COMPANY) TABLE OF CONTENTS Page STATEMENT OF MANAGEMENT S RESPONSIBILITIES
B&N BANK (JOINT-STOCK COMPANY) Condensed Interim Consolidated (Unaudited) Financial Information for 6 months ended B&N BANK (JOINT-STOCK COMPANY) TABLE OF CONTENTS Page STATEMENT OF MANAGEMENT S RESPONSIBILITIES
Acquisition of Troika Dialog
 Acquisition of Troika Dialog Building the Russian based Corporate & Investment Banking Powerhouse 14 March 2011 Investor Relations, SBERBANK Legal Disclaimer This presentation has been prepared by Sberbank
VAB Bank. Interim Condensed Consolidated Financial Statements. for the six months ended 30 June 2012
 CONTENTS REPORT ON REVIEW OF INTERIM CONDENSED CONSOLIDATED FINANCIAL STATEMENTS... 3 INTERIM CONSOLIDATED STATEMENT OF FINANCIAL POSITION... 4 INTERIM CONSOLIDATED INCOME STATEMENT... 5 INTERIM CONSOLIDATED
Report on Review of Interim Financial Information of Sovcombank PJSC and its subsidiaries for the six months ended 30 June 2018.
 Report on Review of Interim Financial Information of Sovcombank PJSC and its subsidiaries for the six months ended 30 June 2018 August 2018 Report on Review of Interim Financial Information of Sovcombank
AO UniCredit Bank. Consolidated Interim Condensed Financial Statements Six-Month Period Ended 30 June 2016 (unaudited)
") Consolidated Interim Condensed Financial Statements Six-Month Period Ended () Contents STATEMENT OF MANAGEMENT S RESPONSIBILITIES FOR THE PREPARATION AND APPROVAL OF THE CONSOLIDATED INTERIM CONDENSED
Consolidated Interim Condensed Financial Statements Six-Month Period Ended () Contents STATEMENT OF MANAGEMENT S RESPONSIBILITIES FOR THE PREPARATION AND APPROVAL OF THE CONSOLIDATED INTERIM CONDENSED
UNITED OVERSEAS BANK LIMITED Incorporated in the Republic of Singapore Company Registration Number: Z
 UNITED OVERSEAS BANK LIMITED Incorporated in the Republic of Singapore Company Registration Number: 193500026Z To : All Shareholders The Board of Directors of United Overseas Bank Limited wishes to make
Subject: Preliminary consolidated financial statements of the Capital Group of Bank Handlowy w Warszawie S.A. for 2016
 Warsaw, February 14, 2017 Subject: Preliminary consolidated financial statements of the Capital Group of Bank Handlowy w Warszawie S.A. for 2016 Legal basis: Art.17 (1) of the Regulation (EU) No 596/2014
Joint Stock Company THE STATE EXPORT-IMPORT BANK OF UKRAINE. Investor presentation. Kyiv, December 2018
 Joint Stock Company THE STATE EXPORT-IMPORT BANK OF UKRAINE Investor presentation Kyiv, December 2018 Agenda Overview 1 Operating results 9 Recent developments since end-2017 12 Balance sheet & Income
AEROFLOT ANNOUNCES FY 2016 IFRS FINANCIAL RESULTS
 AEROFLOT ANNOUNCES FY 2016 IFRS FINANCIAL RESULTS Moscow, 2 March 2017 Aeroflot Group ( the Group, Moscow Exchange ticker: AFLT) today published audited financial results in accordance with International
HMS Group 3 months 2018 IFRS Results Webcast presentation. 8 June 2018
 HMS Group 3 months 2018 IFRS Results Webcast presentation 8 June 2018 Financial results Business & Outlook 2 FINANCIAL HIGHLIGHTS HIGHLIGHTS Rub bn 2018 3m 2017 3m chg, yoy Revenue 8,726 9,760-11% EBITDA
PROMSVYAZBANK. Interim Consolidated Condensed Financial Statements for the nine-month period ended 30 September 2008 Unaudited
 PROMSVYAZBANK Interim Consolidated Condensed Financial Statements for the nine-month period ended Unaudited Interim Consolidated Condensed Financial Statements and Independent auditors report nine-month
November Russian equity market key trends
 November 2017 Russian equity market key trends US France UK India Japan China Germany Russia Brazil Indonesia Russian equity market on a GDP scale Global comparison Trends in Russia MCap / GDP, % Dynamics
Joint Stock Company THE STATE EXPORT-IMPORT BANK OF UKRAINE. Investor presentation. Kyiv, September 2018
 Joint Stock Company THE STATE EXPORT-IMPORT BANK OF UKRAINE Investor presentation Kyiv, September 2018 Agenda Overview 1 Operating results 9 Recent developments since end-2017 12 Balance sheet & Income
ING Bank Śląski S.A. Financial and Business Results for Q Warsaw, 9 March 2018
 ING Bank Śląski S.A. Financial and Business Results for Q4 2017 Warsaw, 9 March 2018 Table of contents 1. Introduction to financial results and the Bank s market position 2. Perspectives for 2018 3. Business
BCC BC C Gr G oup 1H2 H 014 Presentation n September 2014
 FNbNbfmnBf. BCC Group Presentation September 2014 A Strong 1H14 Result A strong and balanced performance All divisions performing well Executing well against strategic priorities Managing for the environment
Idea Bank S.A. Group Results Q3 2017
 Idea Bank S.A. Group Results Q3 2017 Presentation of the Management Board for Investors 27 October 2017 Summary of significant achievements in 2017 PLN 130.4m net profit In Q3 2017 The net profit for Q3
QNB Finansbank Q4 16 Earnings Presentation. February 2016
 QNB Finansbank Earnings Presentation February 2016 Banking sector growth continued in despite adverse global and local developments Macro Dynamics Banking Sector Dynamics 11 10 9 8 7 6 CBRT Rates O/N lending
Credit Bank of Moscow. Financial statements for the six months ended June 30, 2005
 Financial statements for the six months ended Contents Independent Accountants Review Report 3 Balance sheets 4 Statements of income and other comprehensive income 5 Statements of stockholder equity and
Bank Millennium Group
 Bank Millennium Group Bank Millennium Strategy, Summary of L series share issue and Presentation for 2009 results Bank Millennium s General Shareholders Meeting 22 April 2010 Disclaimer This presentation
Interim condensed financial statements Joint-Stock Commercial Bank "NOVIKOMBANK" for the period from 1 January to 30 June with review report
 Interim condensed financial statements Joint-Stock Commercial Bank "NOVIKOMBANK" for the period from 1 January to with review report Interim condensed financial statements Joint-Stock Commercial Bank "NOVIKOMBANK"
SELECTED FINANCIAL INFORMATION ON BANK ZACHODNI WBK GROUP FOR 2017
 SELECTED FINANCIAL INFORMATION ON BANK ZACHODNI WBK GROUP FOR 2017 2017 3 TABLE OF CONTENTS Consolidated Income Statement... 4 Consolidated Statement of Comprehensive Income... 4 Consolidated Statement
Itaú CorpBanca 2Q16. Management Discussion & Analysis
 Itaú CorpBanca 2Q16 Management Discussion & Analysis CONTENTS 03 Management Discussion & Analysis 05 Executive Summary 14 Income Statement and Balance Sheet Analysis 15 Net Interest Income 16 Credit Portfolio
Earnings Presentation
 Earnings Presentation BRSA Bank-Only 1Q 2017 May 10, 2017 VakıfBank IR App. Available at Jan-16 Feb-16 Mar-16 Apr-16 May-16 Jun-16 Jul-16 Aug-16 Sep-16 Oct-16 Nov-16 Dec-16 Jan-17 Feb-17 Mar-17 Apr-17
GROUP EBITDA UP 256% IN 1H 2009 VERSUS 1H 2008
 PRESS-RELEASE FOR IMMEDIATE DISTRIBUTION OJSC PHARMACY CHAIN 36.6 REPORTS Q2 AND 1H 2009 UNAUDITED IFRS RESULTS GROUP EBITDA UP 256% IN 1H 2009 VERSUS 1H 2008 September 24, 2009, MOSCOW OJSC Pharmacy Chain
MEDIA RELEASE, Belgrade, March 15, Eurobank EFG Group financial results in 2009
 MEDIA RELEASE, Belgrade, March 15, 2010 Eurobank EFG Group financial results in 2009 Group net income at 362m 1 in 2009 4Q09 net income at 82m or 25m after the one-off tax charge of 57m Resilient pre provision
3Q Itaú CorpBanca
 Executive Summary 3Q 2016 CONTENTS 03 Management Discussion & Analysis 05 Executive Summary 14 Income Statement and Balance Sheet Analysis 15 Managerial results. Breakdown by country 17 Managerial results
Yapı Kredi 9M18 Earnings Presentation
 Yapı Kredi 9M18 Earnings Presentation 31 October 2018 A solid top-line within conservative asset quality and liquidity approach Net Profit (TL mln) RoTE Profitability Quarterly +33% 1,227-9% Quarterly
Financial Results. Fiscal Year 3/ Supplementary Information - Sumitomo Mitsui Financial Group, Inc. Sumitomo Mitsui Banking Corporation
 Financial Results Fiscal Year 3/2015 - Supplementary Information - Sumitomo Mitsui Financial Group, Inc. Sumitomo Mitsui Banking Corporation Table of contents Page 1. Income analysis Consolidated Non-consolidated
Investor Presentation FY 2017 financial results. 15 March 2018
 Investor Presentation FY 2017 financial results 15 March 2018 Disclaimer The below applies to the presentation (the Presentation ) following this important notice, and you are therefore advised to read
2017 EARNINGS PRESENTATION. Based on IFRS Consolidated Financials
 2017 EARNINGS PRESENTATION Based on IFRS Consolidated Financials ROBUST & HIGH QUALITY EARNINGS PERFORMANCE NET INCOME (TL million) 860 Free Prov. 15.6% ROAE vs. 14.8% in 2016 5,052 6,094 1.8% ROAA vs.
Summary of Financial Results for Fiscal 2017 <Under Japanese GAAP> May 15, 2018
 Summary of Financial Results for Fiscal 07 May 5, 08 Contents Overview of Income Statement Overview of Balance Sheet Overview of Loans Non-interest Income P. P.3 P.4 P.5 Financial
Research and production corporation «United Wagon Company» Financial Results for 2016
 Research and production corporation «United Wagon Company» Financial Results for 2016 25 April 2017 UWC's financial results: Revenue 1 2 Revenue The revenue growth in 2016 was due to: +32% YOY Higher volumes
INDEPENDENT AUDITORS REPORT ON REVIEW OF INTERIM CONDENSED CONSOLIDATED FINANCIAL STATEMENTS
 VTB BANK Interim Condensed Consolidated Financial Statements with Independent Auditors Report on Review of Interim Condensed Consolidated Financial Statements Interim Condensed Consolidated Financial Statements
Summary of the Bank and its Subsidiaries Operating Results For the Quarter and the Nine Months Ended September 30, 2014
 1 Summary of the Bank and its Subsidiaries Operating Results For the Quarter and the Nine Months Ended September 30, Bangkok Bank and its subsidiaries have reported a consolidated net profit of Baht 9.6
EAST ASIA SECURITIES COMPANY LIMITED 9/F, 10 Des Voeux Road Central, Hong Kong. Dealing: Research: Facsimile:
 9/F, 10 Des Voeux Road Central, Hong Kong. Dealing: 3608 8000 Research: 3608 8097 Facsimile: 3608 6132 HONG KONG RESEARCH Analyst: Paul Sham 28 th August 2009. BOC HONG KONG (HOLDINGS) LIMITED ( 中銀香港 )
Consolidated Financial Summary (Japanese GAAP) for the Fiscal Year Ended March 31, 2018
 for the Fiscal Year Ended March 31, 2018") Consolidated Financial Summary (Japanese GAAP) for the Fiscal Year Ended March 31, 218 May 14, 218 Company name: Sony Financial Holdings Inc. (URL: https://www.sonyfh.co.jp/web/index_en.html) Stock exchange
Consolidated Financial Summary (Japanese GAAP) for the Fiscal Year Ended March 31, 218 May 14, 218 Company name: Sony Financial Holdings Inc. (URL: https://www.sonyfh.co.jp/web/index_en.html) Stock exchange
MANAGEMENT S DISCUSSION AND ANALYSIS OF FINANCIAL CONDITION AND RESULTS OF OPERATIONS
 MANAGEMENT S DISCUSSION AND ANALYSIS OF FINANCIAL CONDITION AND RESULTS OF OPERATIONS The following discussion and analysis of financial condition and results of operations should be read in conjunction
CAIXA ECONÓMICA MONTEPIO GERAL
 CAIXA ECONÓMICA MONTEPIO GERAL 2017 CONSOLIDATED RESULTS Lisbon, 8 February 2018 (Year-on-year changes, unless when stated otherwise) Unaudited financial information This document is a free translation
Annual Report of Sberbank of Russia
 Annex to Resolution of the Executive Board No. dated Annual Report of Sberbank of Russia for the year 2014 to be approved by the Audit Commission of Sberbank of Russia RAS, non-consolidated data April
Consolidated Financial Summary (Japanese GAAP) for the Six Months Ended September 30, 2017
 for the Six Months Ended September 30, 2017") Consolidated Financial Summary (Japanese GAAP) for the Six Months Ended September 3, 217 November 13, 217 Company name: Sony Financial Holdings Inc. (URL: http://www.sonyfh.co.jp/index_en.html) Stock exchange
Consolidated Financial Summary (Japanese GAAP) for the Six Months Ended September 3, 217 November 13, 217 Company name: Sony Financial Holdings Inc. (URL: http://www.sonyfh.co.jp/index_en.html) Stock exchange
VTB Bank. 30 September 2014
 Interim Condensed Consolidated Financial Statements with Independent Auditors Report on Review of Interim Condensed Consolidated Financial Statements 30 September 2014 Interim Condensed Consolidated Financial
(millions of Canadian dollars) Quarter ended October 31 Year ended October % Change % Change
 Quarter ended October 31 Year ended October % Change % Change") PRESS RELEASE FOURTH QUARTER 2015 National Bank reports its results for the fourth quarter and year-end of 2015 and raises its quarterly dividend by 4% to 54 cents per share The financial information reported
PRESS RELEASE FOURTH QUARTER 2015 National Bank reports its results for the fourth quarter and year-end of 2015 and raises its quarterly dividend by 4% to 54 cents per share The financial information reported
2018 Combined Financial Results. Air Bank, Home Credit Czech Republic and Home Credit Slovak Republic. 6 February 2019
 2018 Combined Financial Results Air Bank, Home Credit Czech Republic and Home Credit Slovak Republic 6 February 2019 Note: Unaudited combined IFRS figures DISCLAIMER GENERAL THIS PRESENTATION DOES NOT
AK BARS Bank: Key Investment Highlights
 AK BARS Bank: Key Investment Highlights September, 2017 1 Content AK BARS Bank At Glance 3 Macroeconomic Overview of Russia and Tatarstan 6 Bank`s Activity 10 Key Highlights 15 Business Lines 21 Innovations
The Board of Directors of United Overseas Bank Limited wishes to make the following announcement:
 To: All Shareholders The Board of Directors of United Overseas Bank Limited wishes to make the following announcement: Financial Results The unaudited financial results of the Group for the nine months
Aldermore Group PLC. Investor presentation. Full Year Results 2015
 Aldermore Group PLC Investor presentation Full Year Results 2015 A year on from IPO. 1 Delivered another excellent set of financial results 2 Generating attractive and sustainable returns 3 Strong balance
Contents. 3. Annual Accounting (Financial) Statements of Sberbank of Russia for 2014
 Statements of Sberbank of Russia for 2014") Contents 1. Notice of the Meeting Page 2. Annual Report of Sberbank of Russia for 2014 3. Annual Accounting (Financial) Statements of Sberbank of Russia for 2014 4. Assessment of the Auditor s Report Prepared
Contents 1. Notice of the Meeting Page 2. Annual Report of Sberbank of Russia for 2014 3. Annual Accounting (Financial) Statements of Sberbank of Russia for 2014 4. Assessment of the Auditor s Report Prepared
No. 32. Banking sector liquidity and financial markets. October Facts, assessments and comments. Moscow
 No. 32 October 218 Banking sector liquidity and financial markets Facts, assessments and comments Moscow Cut-off date: Banking sector liquidity and money market * section 6 November 218; Foreign exchange
Earnings Presentation
 Earnings Presentation BRSA Bank-Only 1H 2017 August 9, 2017 VakıfBank IR App. Available at 1H17 Macro Highlights GDP Growth 10.0 8.0 6.0 4.0 2.0 0.0-2.0 14.00 13.00 12.00 11.00 10.00 9.00 8.00 7.00 Monetary
The Board of Directors of United Overseas Bank Limited wishes to make the following announcement:
 To: All Shareholders The Board of Directors of United Overseas Bank Limited wishes to make the following announcement: Unaudited Financial Results for the First Quarter Ended 31 March 2015 Details of the
Nomura Securities Co., Ltd. Non-consolidated Balance Sheets
 Non-consolidated Balance Sheets Nomura Securities Co., Ltd. (Millions of yen) March 31, 2013 March 31, 2012 Increase/(Decrease) ASSETS Current Assets 10,161,427 10,348,321 (186,894) Cash and time deposits
Earnings Summary 4Q18
 Earnings Summary Adjusted Net Income of R$13.5 billion in 2018 Banco do Brasil delivered R$13.5 billion in 2018, an increase of 22.2% over 2017. This performance was primarily due to the decrease in ALLL,
ING Bank Śląski S.A. 3Q 2011 Financial Results ING BANK ŚLĄSKI. Warsaw 3 November
 ING Bank Śląski S.A. Warsaw 3 November 2011 www.ingbank.pl ING BANK ŚLĄSKI Disclaimer ING Bank Śląski S.A. Annual Accounts are prepared in accordance with International Financial Reporting Standards as
ROSBANK Group. Interim Condensed Consolidated Financial Statements 3 Months Ended 31 March 2016 (Unaudited)
") ROSBANK Group Interim Condensed Consolidated Financial Statements 3 Months Ended (Unaudited) TABLE OF CONTENTS Page STATEMENT OF MANAGEMENT S RESPONSIBILITIES FOR THE PREPARATION AND APPROVAL OF THE INTERIM
ROSBANK Group Interim Condensed Consolidated Financial Statements 3 Months Ended (Unaudited) TABLE OF CONTENTS Page STATEMENT OF MANAGEMENT S RESPONSIBILITIES FOR THE PREPARATION AND APPROVAL OF THE INTERIM
December 2008 Moscow. Financial Corporation URALSIB IH2008 Financial Results under IFRS
 December 2008 Moscow Financial Corporation URALSIB IH2008 Financial Results under IFRS Disclaimer The statements and financial information of OJSC BANK URALSIB (including, for avoidance of doubt, OJSC
Information about the activity of Bank Millennium Capital Group during 1 half of 2015
 PRESS RELEASE page: 1 Warszawa, 27 July 2015 Information about the activity of Bank Millennium Capital Group during 1 half of 2015 (Warszawa, 27.07.2015 r.) Consolidated net profit of Bank Millennium Group
AK BARS Bank: Key Investment Highlights
 AK BARS Bank: Key Investment Highlights September, 2016 1 Content AK BARS Bank At Glance 3 Macroeconomic Overview of Russia and Tatarstan 6 Bank`s Activity 10 Key Highlights 16 Business Lines 22 Innovations
1Q2017 IFRS RESULTS MAY 31, Q2017 IFRS RESULTS
 Q27 IFRS RESULTS MAY 3, 27 Q27 IFRS RESULTS Alexander Ivannikov Head of Department Q27 IFRS RESULTS 2 DISCLAIMERS This presentation has been prepared by PJSC Gazprom (the Company ), and comprises the slides
9M17. IFRS Financials 30 September IFRS Earnings Presentation 9M17
 9M17 Earnings Presentation IFRS Financials 30 September 2017 ROBUST & HIGH QUALITY EARNINGS PERFORMANCE Net Income (TL million) Cumulative 37% Quarterly ROAE 18.3% 14.8% @2016YE ROAA 2.2% 1.8% @2016YE
Economic outlook. Bangkok Bank position. Strategic priorities and targets
 20110721 1 Topics 1 2 3 Economic outlook Bangkok Bank position Strategic priorities and targets 2 GDP growth outlook remains strong 6 Baht trn 4 +2.5% 2.3% +7.8% +4 5% +3.2% +2.6% 2 0 2008 2009 2010 2011f
Full-year results 2013
 Full-year results 03 03.03.4 Page Cautionary statement regarding forwardlooking statements This presentation by AG ( the Bank ) includes forward-looking statements that reflect the Bank s intentions, beliefs
VakıfBank IR App. Available at. Earnings Presentation BRSA Bank-Only 3Q18 November 9, 2018
 VakıfBank IR App. Available at Earnings Presentation BRSA Bank-Only November 9, 2018 Earnings and Ratios Net Income (TL million) ROAE (%) 2,822.1 10.2% 3,110.1 1.96 ppt better than sector 16.60 1.74 ppt
Agenda. Main Highlights. Group. Liquidity. Capital. Profitability. Portugal. International operations. Conclusions
 DISCLAIMER This document is not an offer of securities for sale in the United States, Canada, Australia, Japan or any other jurisdiction, Securities may not be offered or sold in the United States unless
BBVA earns 2.65 billion in first half of the year (+15 percent YoY)
") Press release 07.27.2018 January-June 2018 BBVA earns 2.65 billion in first half of the year (+15 percent YoY) Transformation: At the end of June, BBVA s digital customer base stood at 25.1 million (+26
Press release 07.27.2018 January-June 2018 BBVA earns 2.65 billion in first half of the year (+15 percent YoY) Transformation: At the end of June, BBVA s digital customer base stood at 25.1 million (+26
Open Joint-Stock Company NOMOS-BANK. Condensed Interim Consolidated Financial Statements (Unaudited) For the Nine Months Ended 30 September 2011
 For the Nine Months Ended 30 September 2011") Open Joint-Stock Company NOMOS-BANK Condensed Interim Consolidated Financial Statements (Unaudited) For the Nine Months Ended OPEN JOINT-STOCK COMPANY «NOMOS-BANK» CONDENSED INTERIM CONSOLIDATED FINANCIAL
Open Joint-Stock Company NOMOS-BANK Condensed Interim Consolidated Financial Statements (Unaudited) For the Nine Months Ended OPEN JOINT-STOCK COMPANY «NOMOS-BANK» CONDENSED INTERIM CONSOLIDATED FINANCIAL
ABH FINANCIAL LIMITED
 ABH FINANCIAL LIMITED International Financial Reporting Standards Condensed Consolidated Interim Financial Information (Unaudited) 30 June 2017 CONTENTS REPORT ON REVIEW OF CONDENSED CONSOLIDATED INTERIM
Dah Sing Bank, Limited
 ANNOUNCEMENT OF 2007 INTERIM RESULTS The Directors of Dah Sing Bank, Limited (the Bank ) are pleased to present the unaudited consolidated results of the Bank and its subsidiaries (collectively the Group
QNB Finansbank Q3 17 Earnings Presentation. October 2017
 QNB Finansbank Earnings Presentation October 2017 Banking sector growth continued in thanks to accommodative policy measures Macro Dynamics Banking Sector Dynamics 13 12 11 CBRT Rates Late liquidity O/N
Financial Results for the Six Months ended September 30, Supplementary Information - Sumitomo Mitsui Financial Group, Inc.
 Financial Results for the Six Months ended September 30, 2017 - Supplementary Information - Sumitomo Mitsui Financial Group, Inc. Table of contents Page 1. Income analysis Consolidated Non-consolidated
2 March Q and FY 2017 Earnings Presentation
 2 March 2018 4Q and FY Earnings Presentation Key events and highlights of Corporate events The company switched to semi-annual dividend payments. The first ever interim dividend in the amount of RUB 2.49
Results: BBVA comparable profit rises 20% in 2017 to 4.64 billion
 Press release 02.01.2018 January December 2017 Results: BBVA comparable profit rises 20% in 2017 to 4.64 billion Transformation: More than half of BBVA customers in Turkey, Spain, USA, Argentina, Chile
BBVA earns 4.32 billion in the first nine months
 Press release 10.30.2018 January-September 2018 BBVA earns 4.32 billion in the first nine months Transformation: Digital and mobile customers as well as digital sales continued to grow across all geographies,
Financial Results. Fiscal Year 3/ Supplementary Information - Sumitomo Mitsui Financial Group, Inc.
 Financial Results Fiscal Year 3/2018 - Supplementary Information - Sumitomo Mitsui Financial Group, Inc. Table of contents Page 1. Income analysis Consolidated Non-consolidated 1 2. Interest spread (domestic)
BZWBK Group. Results 1H12. July 26 th, 2012
 1 BZWBK Group Results 1H12 July 26 th, 2012 2 This presentation as regards the forward looking statements is exclusively informational in nature and cannot be treated as an offering or recommendation to
ABU DHABI COMMERCIAL BANK PJSC REPORTS FIRST QUARTER 2013 NET PROFIT OF AED 903 MN, AN INCREASE OF 5% YEAR ON YEAR* AND 44% QUARTER ON QUARTER*
 Abu Dhabi Commercial Bank PJSC Salam Street P. O. Box: 939, Abu Dhabi http://www.adcb.com Press Release: Immediate Release ABU DHABI COMMERCIAL BANK PJSC REPORTS FIRST QUARTER 2013 NET PROFIT OF AED 903
4 th Quarter Quarterly Report
 4 th Quarter 2016 Quarterly Report Index 1. Banco Popular Group 2. Business 2.1 Main business 2.2 Real estate and related business 1. Banco Popular Group Main business ratio Business volume 31.12.15 31.12.16