of Greater Memphis 2004 LENDING STUDY
|
|
|
- Sydney Green
- 6 years ago
- Views:
Transcription


1 of Greater Memphis 2004 LENDING STUDY

2 Phyllis G. Betts Tk Buchanan John D Smith The University of Memphis Center for Community Building and Neighborhood Action 600 Jefferson Av, Suite 410 (901) pbetts@memphis.edu 2
3 Table of Contents Section I: Executive Summary and Analysis Chapter I: Introduction. 4 Outline of the Report.. 8 Glossary of Terms... 9 Chapter II: Overview of Lending in Shelby County. 10 Table II.1. Types of Loans and Percent Change, Table II.2. Shelby County Loan Applications 2004: Loan Characteristics 11 Table II.3. Lender Reported Reasons for Denial 12 Table II.4. Shelby County Loan Applications 2004: Applicant Characteristics. 13 Chapter III: Local Retail Banks and Out-of-Town Lenders in the Dual Mortgage Market. 15 Table III.1. Bank Deposits in Shelby County, Table III.2. Local Retail Banks and Other Lenders. 16 Table III.3. Local Banks and Non-Local Lenders, 2004: Loan Characteristics. 17 Table III.4. Local Banks and Non-Local Lenders, 2004: Applicant Profile Chapter IV: Home Buying and Refinancing. 19 Table IV.1. Comparison of Loan Applications for Home Purchase and Refinance Loans. 19 Table IV.2. Comparison of Applicant Characteristics for Home Purchase and Refinance Loans.. 20 Chapter V: Race, Neighborhoods and Lending Disparity: Subprime Lending and the Dual Mortgage Market 21 Table V.1. Comparison of Application Characteristics and Lending Disparity for African American and White Applicants.. 21 Table V.2. Comparison of Applicant Characteristics and Lending Disparity for African American and White Applicants Table V.3. Comparison of Subprime Loans and Borrowers with All Originated Loans and Borrowers. 23 Map V.1. Shelby County Planning District by Zones 24 Table V.4. Application Characteristics by Geographic Zone, Table V.5. Applicant Characteristics by Geographic Zone, Table V.6. New Purchase Originations, Income and Foreclosures in Shelby County by Zip Code Table V.7. All Loan Originations, Income and Foreclosures in Shelby County by Zip Code 28 Map V.2. Percent of Subprime Originations by Zip Code, Map V.3. Percent of High Loan-to-Income Ratios, Map V.4. Percent of Borrowers with Income Below 80% AMI, Map V.5. Shelby County Zip Codes by Percent Increase in Foreclosure Notices, Map V.6. Shelby County Zip Codes by Number of Foreclosure Notices, Map V.7. Completed Foreclosures in Shelby County, Conclusion. 32 Section II: Appendices.. 33 Appendix A.1. Table: Deposits and Market Shares of Shelby County Banks, Sorted by Market Share Appendix A.2. Table: Deposits and Market Shares of Shelby County Banks, Sorted Alphabetically Appendix B: Shelby County Branch Locations by Bank Share and Total Market Share Sorted Alphabetically by Parent Bank. 40 Appendix B.2. Map: Local Retail Banks in Shelby County by Zip Code.. 47 Appendix C.1. High Volume Subprime Lending in Shelby County, 2004: Non-Local Lenders with at Least 100 Loans 49 Appendix C.2. Subprime Lending in Shelby County, 2004: Local Retail Banks with Subprime Loans 50 Appendix D.1. Home Purchase Loan Originations by Zip Code 52 Appendix D.2. Home Purchase Loan Originations by Planning District 52 3
4 Section III: Detailed Lending Tables 53 Section III.1: Countywide and Zone Totals 54 Data Definitions for Terms Used in Tables 55 Table: Shelby County Planning Districts by Census Tracts. 56 Table: Shelby County Census Information by Planning District and Zone.. 60 Table: 2004 Mortgage Related Loan Applications and Approvals by Race. 62 Table: 2004 Mortgage Related Loan Applications and Approvals in Dollars by Race 62 Table: Comparison of Lending Activity Among Local Retail Banks (2004 HMDA Data). 64 Table: Zone 1: 2004 Application Profile For Local Retail Banks 66 Table: Zone 1: 2004 Origination Profile For Local Retail Banks 67 Table: Zone 1: 2004 Application Profile For Non-Local Lenders.. 68 Table: Zone 1: 2004 Origination Profile for Non-Local Lenders 69 Table: Zone 2: 2004 Application Profile For Local Retail Banks 70 Table: Zone 2: 2004 Origination Profile For Local Retail Banks 71 Table: Zone 2: 2004 Application Profile For Non-Local Lenders 72 Table: Zone 2: 2004 Origination Profile for Non-Local Lenders 73 Table: Zone 3: 2004 Application Profile For Local Retail Banks 74 Table: Zone 3: 2004 Origination Profile For Local Retail Banks 75 Table: Zone 3: 2004 Application Profile For Non-Local Lenders 76 Table: Zone 3: 2004 Origination Profile for Non-Local Lenders 77 Table: Accredited Home Lenders: Lending Profile by Zone 79 Table: Ameriquest: Lending Profile by Zone 80 Table: AmSouth Bank: Lending Profile by Zone.. 81 Table: Argent Mortgage: Lending Profile by Zone 82 Table: BancorpSouth Bank: Lending Profile by Zone 83 Table: Bank of America, NA: Lending Profile by Zone 84 Table: BankTennessee: Lending Profile by Zone 85 Table: Brighton Bank: Lending Profile by Zone 86 Table: Centex Home Equity Co LLC: Lending Profile by Zone 87 Table: Chase Manhattan Mortgage Corp: Lending Profile by Zone 88 Table: Citifinancial: Lending Profile by Zone 89 Table: Countrywide: Lending Profile by Zone 90 Table: Decision One Mortgage: Lending Profile by Zone 91 Table: Enterprise National Bank: Lending Profile by Zone 92 Table: Fieldstone Mortgage: Lending Profile by Zone 93 Table: Financial FSB: Lending Profile by Zone 94 Table: First Alliance Bank: Lending Profile by Zone 95 Table: First Bank: Lending Profile by Zone 96 Table: First TN/First Horizon: Lending Profile by Zone 97 Table: 1st Trust Bank for Savings: Lending Profile by Zone 99 Table: GMAC Mortgage (PA): Lending Profile by Zone 99 Table: HFC: Lending Profile by Zone 100 Table: Homecomings Financial: Lending Profile by Zone 101 Table: Independent Bank: Lending Profile by Zone 102 Table: InSouth Bank: Lending Profile by Zone 103 Table: Long Beach Mortgage: Lending Profile by Zone 104 Table: MILA Inc (WA): Lending Profile by Zone. 105 Table: National Bank of Commerce: Lending Profile by Zone 106 Table: National City Bank (IN): Lending Profile by Zone. 107 Table: New Century Mortgage: Lending Profile by Zone. 108 Table: Novastar Mortgage: Lending Profile by Zone. 109 Table: Oakland Deposit Bank: Lending Profile by Zone 110 Table: Patriot Bank: Lending Profile by Zone 111 Table: Peoples State Bank: Lending Profile by Zone 112 4
5 Table: Pulaski Mortgage: Lending Profile by Zone 113 Table: Regions Bank: Lending Profile by Zone 114 Table: Renasant Bank: Lending Profile by Zone 115 Table: Sebring Capital Partners: Lending Profile by Zone 116 Table: South Star Funding LLC: Lending Profile by Zone 117 Table: SunTrust Bank: Lending Profile by Zone. 118 Table: Tri-State Bank of Memphis: Lending Profile by Zone 119 Table: Trust One Bank: Lending Profile by Zone 120 Table: Trustmark National Bank: Lending Profile by Zone Table: Union Planters: Lending Profile by Zone. 122 Table: Washington Mutual Bank: Lending Profile by Zone Table: Wells Fargo: Lending Profile by Zone Table: Wells Fargo Financial TN: Lending Profile by Zone Section III.2: Planning Districts 127 Data Definitions for Terms Used in Tables Map: Shelby County Planning Districts by Zones Map: District 23. Airport Land Use 130 Table: Airport Land Use 2004 Application Profile by Local Retail Banks. 131 Table: Airport Land Use 2004 Application Profile by Non-Local Lenders 132 Map: District 3. Arlington 133 Table: Arlington 2004 Application Profile by Local Retail Banks. 134 Table: Arlington 2004 Application Profile by Non-Local Lenders 135 Map: District 21. Collierville Table: Collierville 2004 Application Profile by Local Retail Banks Table: Collierville 2004 Application Profile by Non-Local Lenders. 138 Map: District 18. Depot Table: Depot 2004 Application Profile by Local Retail Banks Table: Depot 2004 Application Profile by Non-Local Lenders. 141 Map: District 10. Downtown / Med Center 142 Table: Downtown / Med Center 2004 Application Profile by Local Retail Banks 143 Table: Downtown / Med Center 2004 Application Profile by Non-Local Lenders 144 Map: District 9. East Central Shelby Co. 145 Table: East Central Shelby Co Application Profile by Local Retail Banks Table: East Central Shelby Co Application Profile by Non-Local Lenders. 147 Map: District 4. Frayser Table: Frayser 2004 Application Profile by Local Retail Banks 149 Table: Frayser 2004 Application Profile by Non-Local Lenders 150 Map: District 16. Germantown 151 Table: Germantown 2004 Application Profile by Local Retail Banks 152 Table: Germantown 2004 Application Profile by Non-Local Lenders 153 Map: District 8. Germantown Parkway 154 Table: Germantown Parkway 2004 Application Profile by Local Retail Banks Table: Germantown Parkway 2004 Application Profile by Non-Local Lenders. 156 Map: District 7. Jackson 157 Table: Jackson 2004 Application Profile by Local Retail Banks Table: Jackson 2004 Application Profile by Non-Local Lenders. 159 Map: District 22. McKellar / Whitehaven. 160 Table: McKellar / Whitehaven 2004 Application Profile by Local Retail Banks. 161 Table: McKellar / Whitehaven 2004 Application Profile by Non-Local Lenders 162 Map: District 11. Midtown 163 Table: Midtown 2004 Application Profile by Local Retail Banks 164 Table: Midtown 2004 Application Profile by Non-Local Lenders 165 Map: District 2. Millington 166 Table: Millington 2004 Application Profile by Local Retail Banks
6 Table: Millington 2004 Application Profile by Non-Local Lenders. 168 Map: District 24. Nonconnah Parkway. 169 Table: Nonconnah Parkway 2004 Application Profile by Local Retail Banks. 170 Table: Nonconnah Parkway 2004 Application Profile by Non-Local Lenders. 171 Map: District 6. North Memphis 172 Table: North Memphis 2004 Application Profile by Local Retail Banks Table: North Memphis 2004 Application Profile by Non-Local Lenders. 174 Map: District 1. Northwest. 175 Table: Northwest 2004 Application Profile by Local Retail Banks 176 Table: Northwest 2004 Application Profile by Non-Local Lenders Map: District 15. Poplar Corridor Table: Poplar Corridor 2004 Application Profile by Local Retail Banks Table: Poplar Corridor 2004 Application Profile by Non-Local Lenders Map: District 19. Quince. 181 Table: Quince 2004 Application Profile by Local Retail Banks 182 Table: Quince 2004 Application Profile by Non-Local Lenders 183 Map: District 5. Raleigh Table: Raleigh 2004 Application Profile by Local Retail Banks Table: Raleigh 2004 Application Profile by Non-Local Lenders Map: District 17. South Memphis Table: South Memphis 2004 Application Profile by Local Retail Banks Table: South Memphis 2004 Application Profile by Non-Local Lenders Map: District 12. University Table: University 2004 Application Profile by Local Retail Banks Table: University 2004 Application Profile by Non-Local Lenders Map: District 13. Walnut Grove. 193 Table: Walnut Grove 2004 Application Profile by Local Retail Banks. 194 Section III.3: Local Bank Deposit & Market Share Data Table: Walnut Grove 2004 Application Profile by Non-Local Lenders. 196 Map: Distribution of Local Retail Banks In Shelby County By Zip Codes 197 Table: Deposits and Market Shares of Shelby County Banks from 2000 to 2005 in Alpha Order. 198 Table: Deposits and Market Shares of Shelby County Banks from 2000 to 2005 in Rank Order. 200 Table: Shelby County Branch Locations by Banks Share & Total Market Share: Parent Alpha Order Section III.4: Local Bank Application Profiles by Planning District & Zone 209 Table: Local Retail Bank Application Totals (2004 HMDA Data). 210 Table: Other Local Credit Union and Mortgage Company Application Totals (2004 HMDA Data) Table: Comparison of 2004 Lending Activity Among Local Retail Banks by Loan Purpose 214 Table: AmSouth Bank: 2004 Application Profile by Planning District Table: BancorpSouth Bank: 2004 Application Profile by Planning District Table: Bank of America, NA: 2004 Application Profile by Planning District Table: Bank of Bartlett: 2004 Application Profile by Planning District. 219 Table: BankTennessee: 2004 Application Profile by Planning District. 220 Table: Brighton Bank: 2004 Application Profile by Planning District Table: Enterprise National Bank: 2004 Application Profile by Planning District Table: Financial FSB: 2004 Application Profile by Planning District Table: First Alliance Bank: 2004 Application Profile by Planning District Table: First Bank: 2004 Application Profile by Planning District. 225 Table: First Tennessee/First Horizon: 2004 Application Profile by Planning District Table: 1 st Trust Bank for Savings: 2004 Application Profile by Planning District 227 6
7 Table: Independent Bank: 2004 Application Profile by Planning District. 228 Table: InSouth Bank: 2004 Application Profile by Planning District 229 Table: National Bank of Commerce: 2004 Application Profile by Planning District 230 Table: Oakland Deposit Bank: 2004 Application Profile by Planning District Table: Patriot Bank: 2004 Application Profile by Planning District Table: Regions Bank: 2004 Application Profile by Planning District 233 Table: Renasant Bank: 2004 Application Profile by Planning District Table: SunTrust Bank: 2004 Application Profile by Planning District Table: Tri-State Bank of Memphis: 2004 Application Profile by Planning District Table: Trust One Bank: 2004 Application Profile by Planning District 237 Table: Trustmark National Bank: 2004 Application Profile by Planning District. 238 Table: Union Planters: 2004 Application Profile by Planning District Table: AmSouth Bank: 2004 Comparison of Lending Activity Among Local Retail Banks by Loan Purpose and Zone. 241 Table: BancorpSouth Bank: 2004 Comparison of Lending Activity Among Local Retail Banks by Loan Purpose and Zone. 242 Table: Bank of America, NA: 2004 Comparison of Lending Activity Among Local Retail Banks by Loan Purpose and Zone. 243 Table: Bank of Bartlett Bartlett Mortgage: 2004 Comparison of Lending Activity Among Local Retail Banks by Loan Purpose and Zone 244 Table: Brighton Bank: 2004 Comparison of Lending Activity Among Local Retail Banks by Loan Purpose and Zone. 245 Table: Enterprise National Bank: 2004 Comparison of Lending Activity Among Local Retail Banks by Loan Purpose and Zone. 246 Table: Financial FSB: 2004 Comparison of Lending Activity Among Local Retail Banks by Loan Purpose and Zone. 247 Table: First Alliance Bank: 2004 Comparison of Lending Activity Among Local Retail Banks by Loan Purpose and Zone. 248 Table: First TN-First Horizon: 2004 Comparison of Lending Activity Among Local Retail Banks by Loan Purpose and Zone. 249 Table: First Bank: 2004 Comparison of Lending Activity Among Local Retail Banks by Loan Purpose and Zone. 250 Table: First Trust Bank for Savings: 2004 Comparison of Lending Activity Among Local Retail Banks by Loan Purpose and Zone Table: Independent Bank: 2004 Comparison of Lending Activity Among Local Retail Banks by Loan Purpose and Zone 252 Table: InSouth Bank: 2004 Comparison of Lending Activity Among Local Retail Banks by Loan Purpose and Zone. 253 Table: National Bank of Commerce: 2004 Comparison of Lending Activity Among Local Retail Banks by Loan Purpose and Zone Table: Oakland Deposit Bank: 2004 Comparison of Lending Activity Among Local Retail Banks by Loan Purpose and Zone. 255 Table: Patriot Bank: 2004 Comparison of Lending Activity Among Local Retail Banks by Loan Purpose and Zone. 256 Table: Regions Bank: 2004 Comparison of Lending Activity Among Local Retail Banks by Loan Purpose and Zone. 257 Table: Renasant Bank: 2004 Comparison of Lending Activity Among Local Retail Banks by Loan Purpose and Zone. 258 Table: SunTrust Bank: 2004 Comparison of Lending Activity Among Local Retail Banks by Loan Purpose and Zone. 259 Table: Tri-State Bank of Memphis: 2004 Comparison of Lending Activity Among Local Retail Banks by Loan Purpose and Zone
8 Table: Trust One Bank: 2004 Comparison of Lending Activity Among Local Retail Banks by Loan Purpose and Zone 261 Table: Trustmark National Bank: 2004 Comparison of Lending Activity Among Local Retail Banks by Loan Purpose and Zone Table: Union Planters: 2004 Comparison of Lending Activity Among Local Retail Banks by Loan Purpose and Zone. 263 Section III.5: Non-Local Lenders Application Profiles By Planning District 264 Data Definitions for Terms Used in Tables Table: Comparison of 2004 Lending Activity Among Non-Local Retail Banks by Loan Purpose Table: MILA Inc (WA): 2004 Application Profile by Planning District 268 Table: Long Beach Mortgage: 2004 Application Profile by Planning District Table: Homecomings Financial: 2004 Application Profile by Planning District 270 Table: HFC: 2004 Application Profile by Planning District Table: GMAC Mortgage (PA) : 2004 Application Profile by Planning District 272 Table: Fieldstone Mortgage: 2004 Application Profile by Planning District. 273 Table: Decision One Mortgage: 2004 Application Profile by Planning District 274 Table: Countrywide: 2004 Application Profile by Planning District. 275 Table: Citifinancial: 2004 Application Profile by Planning District Table: Chase Manhattan Mortgage Corp: 2004 Application Profile by Planning District Table: Centex Home Equity Co LLC: 2004 Application Profile by Planning District Table: Argent Mortgage: 2004 Application Profile by Planning District Table: Ameriquest: 2004 Application Profile by Planning District 280 Table: Accredited Home Lenders: 2004 Application Profile by Planning District. 281 Table: Wells Fargo: 2004 Application Profile by Planning District Table: Wells Fargo Financial TN: 2004 Application Profile by Planning District. 283 Table: Washington Mutual Bank: 2004 Application Profile by Planning District Table: South Star Funding LLC: 2004 Application Profile by Planning District Table: Sebring Capital Partners: 2004 Application Profile by Planning District 286 Table: Pulaski Mortgage: 2004 Application Profile by Planning District Table: Peoples State Bank: 2004 Application Profile by Planning District 288 Table: Novastar Mortgage: 2004 Application Profile by Planning District 289 Table: New Century Mortgage: 2004 Application Profile by Planning District. 290 Table: National City Bank (IN) : 2004 Application Profile by Planning District
9 I Introduction to the : New Data and Key Issues New HMDA data includes loan level indicators of subprime lending. Other variables analyzed for the first time in 2004 include reasons for denial, applications collected and loans originated by independent mortgage companies, and consumer-driven attrition during the application process. Replacing the center city/non-center city comparison, Shelby County planning districts and zip codes are assigned to newly defined Zones 1, 2, and 3. Data analysis suggests the emergence of a dual mortgage market with highly disparate outcomes based on type of lender and the demographics of applicants. I. 1. Analysis of HMDA data has traditionally been driven by questions about redlining reluctance on the part of lenders to invest in minority and changing neighborhoods and equitable access to home mortgage-related credit by minority borrowers ( lending disparity ). Lending studies through 2003 reveal persistent racial and geographic disparity: Geographic level analysis in Memphis and Shelby County based on Center City versus Non- Center City groupings, and by twenty-four planning districts, documents greater volume and more favorable outcomes for neighborhoods outside the central city. Absent more detailed and cross-tabular data that takes into account neighborhood characteristics, however, aggregate data cannot explain why there are geographic disparities. The 2004 lending study begins to grapple with cross-tabular data on neighborhood characteristics, introducing data that is available from other sources at the zip-code or census tract level. Racial disparity analysis in Memphis and Shelby County has focused on gaps in approval and denial rates that persistently favor white borrowers even when high income (above Area Median Income) and low income (below AMI) minority borrowers are compared with similarly situated white borrowers. As with geographic analysis, it is difficult to explain these differences without more detailed information on borrower qualifications. The high income and low income distinction may obscure income differences; nor does this high-low distinction take into account income to loan ratio. The 2004 study introduces a more detailed income analysis, including codes for borrowers at 80%, 50%, and 30% of Area Median Income (low income), as well as codes for moderate income (between 80% and 120% of AMI) and high income (over 120% of AMI) applicants and borrowers. Since the effects of borrower qualifications have been difficult to estimate, lenders have argued that due diligence not racial and ethnic discrimination and redlining is responsible for apparent disparities. HMDA data alone cannot address this issue. The 2004 study introduces comparative information on foreclosure rates by zip code to begin to shed light on due diligence issues. Disparity analyses has begun to examine how differences in loan terms over and above approval rates by race/ethnicity and neighborhood can disadvantage minority borrowers and neighborhoods. Loans have in the past been classified as subprime if they originate from lenders identified by HUD as primarily subprime, with at least half of loans with B and C credit and interest rates. The 2004 study takes advantage of HMDA s new loan-level data on APR terms that exceed a three point threshold for first lien loans (usually purchase or re-financing loans) and a five point threshold for subordinate liens (usually home equity.) 9
10 I. 2. Changes in regulatory conditions that favor new products and services and the entry of new players in the mortgage market since the 1990 s are producing more complex geographic and disparity outcomes. The rapid expansion of third party mortgage brokering in Memphis and Shelby County, along with technology-driven access to national lenders many of whom are non-depository mortgage companies poses new questions about neighborhood impact and equitable access. The 2004 study introduces new analysis on outcomes for different types of lenders, with a special comparison between local retail banks and national independent mortgage brokerages. The ability to combine HMDA data with foreclosure data for Shelby County suggests that traditional redlining and disparity analyses fails to capture the strengths and weaknesses of the evolving mortgage market and with historically low interest rates the entry into the market of new borrowers with lower incomes. I. 3. The 2004 lending study takes advantage of new HMDA reporting requirements to analyze newly available data on subprime lending; includes other data from the Loan Application Register that has not been analyzed in previous years; re-organizes the geographic analyses to make more detailed distinctions; and introduces new ways of looking at racial and ethnic disparity. Data is presented in new ways to better address the issues introduced above. The 2004 study reframes the issues to better serve two groups of inter-related stakeholders. We proceed on the premise that community development advocates and neighborhood constituents on the one hand, and local retail lenders on the other, have inter-related interests that frame the 2004 study. Framing the Issues Community Development advocates and neighborhood residents favor access to credit that expands and sustains opportunities for sound home ownership, while minimizing risks to neighborhoods that result from foreclosure. Memphis has a persistently high foreclosure rate that accelerated with changes in mortgage markets since the mid 1990 s. What can we learn from HMDA data and related sources to better pursue these policy outcomes? Local retail bankers are interested in growing their market share and profitability by reaching new qualified borrowers. Lenders are presumably motivated by due diligence, wish to avoid foreclosures, and are interested in meeting CRA requirements. New brokering arrangements continue to favor nonlocal lenders, whose share of local lending is growing. What can we learn from HMDA data and related sources to enable local banks to reach new borrowers and deliver better results for neighborhoods in Memphis and Shelby County? I. 4. New HMDA requirements for 2004 include reporting of rate spreads of 3.00 and higher for first liens and 5.00 and higher for subordinate liens, improving our ability to gauge the reach and impact of subprime lending in Shelby County. The 2004 lending study uses the rate spread indicator for the first time, replacing the subprime lenders classification from previous studies. The 2004 study also includes lender-coded reasons for denial to complement the traditional analysis of approval and denial rates. Reporting is optional; about 80% of denials include this information. I. 5. Available HMDA data not analyzed in previous studies includes not only reasons for denial, but also lien status (first or subordinate), owner-occupancy, distinctions between release-related refinancing 10
11 and home equity lending, and types of lenders (based on the reported regulatory agency to whom HMDA data is submitted). I. 6. In addition to analysis by planning districts, more detailed data for some indicators is reported by zip code. Planning district data is aggregated into three zones that replace the previous center city vs. non-center city scheme. Zone 1 is the Inner City zone where housing (with the notable exceptions of Mud Island and other Riverfront development, downtown conversions, HOPE VI redevelopment, and other infill) was built before Apart from exceptions and their environs noted above, Zone 1 has the lowest rate of home ownership, lowest income, and highest minority population. Zone 1 has relatively little lending activity. Lending is oriented toward the exceptional development noted above, and higher income white borrowers are disproportionately represented. Zone 2 is the Mid-City zone where housing typically was built from 1950 through the 1980 s. Zone 2 includes transitional neighborhoods, where home ownership and income have been declining and minority population increasing. Middle class African American families are being joined by lower income black and Hispanic households. Poverty rates have increased while housing values have been relatively stagnant. Zone 2 includes a great deal of lending activity revolving around rate spreads and non-local lenders. Clearly, Zone 2 has not been redlined by subprime lenders. High volume lending in Zone 2, however, is highly correlated with foreclosure. Zone 3 is the Outer Ring/Suburban zone, which includes some housing stock in the Poplar Corridor and suburban areas of the same vintage as Zone 2. But housing is traditionally more valuable and appreciation is high. Zone 3 includes a high growth area for new construction and has the highest income and home ownership and lowest minority population. High volume lending would be expected because of new construction. Some neighborhoods in Zone 3, however, are beginning to experience Zone 2 lending patterns. I. 7. Racial and ethnic disparity the reasons for which remain unfortunately speculative is about much more than approval and denial rates. The 2004 lending study begins to identify a dual mortgage market in Memphis and Shelby County that is skewed toward African American or white buyers. For African Americans, the dual market is associated with income and gender disparities (female applicants without co-applicants), but controls for income suggest that the dual market exists over and above income differences. Application patterns are different. A different stable of lenders is involved. Risk factors that can be measured with HMDA data low income, high ratios of loan amount compared to income, and rate-spread subprime loans are concentrated among African American buyers, but even when these disadvantages are absent, black buyers are more likely to have subprime loans that are concentrated in particular neighborhoods in particular zip codes. Non-local mortgage brokers dominate the African American market in Zone 2, where high risk patterns are most evident. The dual market can best be understood by comparing local retail banks with national lenders. I. 8. The 2004 lending study introduces a new concept that is related to the dual mortgage market. Consumer-driven attrition includes loan applications that are initiated but not completed; those that are completed but withdrawn by the potential borrower; and those that the lender approves, but are not accepted by the borrower. African American borrowers in the dual mortgage market have attrition rates significantly higher than whites. The evidence points to concurrent multiple applications (which, other qualitative evidence suggests, are likely coordinated by mortgage brokers). Denial rates reflect applications denied not borrowers who ultimately end up without a loan. It is important to remember with disparity analysis that concurrent multiple applications can reflect forum shopping where a broker is looking for a deal that suits him or her as well as the borrower. 11
12 Unfortunately, there is no way to factor out multiple applications for the same property from the HMDA database. I. 9. The role of subordinate liens for purchase where two loans taken together often cover 100% or more of the purchase price is another indicator of disparity in the dual mortgage market. It is not possible using HMDA data to individually pair first and subordinate liens on the same property, but we can estimate that 25% of home purchase loans are accompanied by a subordinate mortgage. The pattern is more common among black buyers. The inclusion of smaller subordinate purchase liens in aggregate data for home purchase loans distorts analysis of loan-to-income ratios over the dataset as a whole. Buyers appear to be better qualified on this indicator than they actually are. As the lending study evolves, more and better distinctions within the data will be possible. For example, we anticipate running separate analysis on first liens only. I. 10. It remains important to bear in mind that about 18% of HMDA records do not include race and ethnicity data. These records are excluded from racial/ethnic disparity analysis. When unknown is run separately, patterns fall mid-way between white and black patterns, suggesting a mix of applicants who refuse to confirm race and ethnicity in telephone applications. References to minority applicants and borrowers in the 2004 lending study include less than 10% Hispanic and other race records. In other words, 90% of minority data is based on the experience of black applicants and buyers in Memphis and Shelby County. Separate analysis of Hispanic patterns is omitted from the 2004 study. As numbers increase, we will consider ways to strengthen the analysis of the Hispanic market. Other races in Memphis and Shelby County are likely to be Asian and Indian; the little analysis that is possible on the small number of cases suggests that these minority applicants have experiences similar to white buyers. I. 11. Keeping the dual mortgage market perspective in mind, data from the 2004 HMDA records and other sources are summarized from several perspectives in the following sections of the Executive Summary. More detailed tabular data for individual local banks, high volume national lenders, and by planning district and zip code is available separately from the Community Development Council. A Glossary of Terms and Concepts follows the outline of this report for use throughout the Summary. 12
13 Executive Summary and Analysis Outline I. Introduction New HMDA data includes loan level indicators of subprime lending. Other variables analyzed for the first time in 2004 include reasons for denial, applications collected and loans originated by independent mortgage companies, and consumer-driven attrition during the application process. Replacing the center city/non-center city comparison, Shelby County planning districts and zip codes are assigned to newly defined Zones 1, 2, and 3. Data analysis suggests the emergence of a dual mortgage market with highly disparate outcomes based on type of lender and the demographics of applicants. II. An Overview Subprime lending is well-established in Shelby County, accounting for 25% of originations. Subprime lending is likely to involve independent mortgage companies, high volume applications and originations concentrated in Zone 2, African Americans, and female-headed households. Approval rates for all types of loans from all types of lenders increased from 54% in 2003 to 64% in III. Local Retail Banks Applications to local retail banks decreased by 44% from 2003 to The share of applications collected by local banks also decreased from 31% to 19% in Both local banks and non-local lenders improved their approval rates; local banks from 75% to 79% and non-local lenders from 45% to62%. IV. Home Buying and Refinancing Applications for refinancing have higher denial and attrition rates than purchase loans, but like purchase loans are predominantly first lien loans. Refinancing is not exclusively driven by favorable interest rates -- purchase and refinancing loans are about equally likely to be subprime. Nearly one of four purchase loans is paired at closing with a concurrent subordinate lien, another indicator of the dual mortgage market. V. Race, Neighborhoods, and Lending Disparity: Subprime Lending and the Dual Mortgage Market African Americans continue to experience a twenty point gap in approval rates compared to white loan applicants in Shelby County. They are more likely to have subprime loans. Even when loans are not subprime, loans for black borrowers are more likely to come from national lenders and independent mortgage companies. High volume applications and lending for African Americans is concentrated in Zone 2 in Memphis, where indicators such a high foreclosure rates are also concentrated. 13
14 Glossary of Terms and Concepts AMI: Area Median Income as determined annually by HUD for housing assistance purposes, the AMI parallels median family income estimates provided each year by the Census Bureau. The AMI for Shelby County in 2004 was $52, % and under is considered low income ($42,000). Incomes from 50% to 31% are very low income and those with incomes at 30% and below of AMI are poor or near poor (depending on household size.) Approval Rate: The percentage of all completed applications that were approved by the lender, including those that were approved but not accepted by the potential borrower. Attrition Rate: The percentage of all initiated applications that did not result in origination because the applicant did not complete the application, withdrew the application, or chose not to accept an approved application. Co-Applicant Types: Male with female co-applicant typically means a married couple family. Female with no co-applicant typically means a female-headed family. Denial Rate: The percentage of all completed loan applications that were declined by the lender. Dual Mortgage Market: The gravitation of two sets of buyers differentiated in terms of race/ethnicity, gender/family status, income, and neighborhood to mortgage markets with different primary lenders and different dynamics. The dual market analysis is an updated alternative to the classic concepts of redlining and racial/ethnic disparity. Subprime Loans: Includes all first liens with a rate spread of 3.00 or greater and all subordinate liens with a rate spread of 5.00 or greater. High Loan to Income Ratio: Loan amount equals or exceeds three times annual income. Independent Mortgage Companies (herein mortgage companies ): Mortgage lenders not affiliated with a regulated bank, whose only federal reporting requirements are to HUD for HMDA data. They are not bound by CRA requirements, and are subject to very little regulation. They typically work with independent or semiindependent mortgage brokers who apply for loans on behalf of customers. Minority applicants: African American, Hispanic, and all other non-white racial groups combined. In Shelby County, 90% of minority applicants are African American. High Risk Borrowing Loans with two or more risk factors, including subprime interest rate, high loan-toincome ratio, or borrower income below 80% of AMI. 14
15 II An Overview of Lending in Shelby County Subprime lending is well-established in Shelby County, accounting for 25% of originations. Subprime lending is likely to involve independent mortgage companies, high volume applications and originations concentrated in Zone 2, African Americans, and female-headed households. Approval rates for all types of loans from all types of lenders increased from 54% in 2003 to 64% in Diversity in the overall applicant pool in Shelby County is characterized by differences between local and non-local lenders, home purchase and refinancing/home equity loans, and applications vs. approvals. The dual mortgage market also means geographic and racial/ethnic differences. Our overview here introduces the issues that will be summarized in more detail in the next sections. Indicators that are not analyzed in the 2004 lending study include the role of FHA lending (about 12% on purchase) vs. conventional loans; how loans sold to government-sponsored enterprises on the secondary mortgage market (Fannie, Ginnie, and Freddie; about 30% ) might differ from other securitized loans (about 40%); and how investor applications and loans might differ from owner occupants. Interestingly, only about 10% of applications are attributed to investors; based on the high proportion of single-family rental housing in Zone 1 and transition from ownership to rental in Zone 2, this figure may be understated (and is worth looking into more closely in the future.) II. 1. The number of loan applications for all purposes in Shelby County decreased by 8% from 2003 to The decrease was based on a sharp reduction in applications for refinancing, driven by favorable interest rates in 2003 compared to Nevertheless, applications for new purchase mortgages were up 25%, paralleling an increase in home sales from of 10% (from 26,109 to 28,767.) The trend in applications from 2000 through 2004 is detailed in Table II.1 below. Table II.1: Types of Loans and Percent Change, Type of Loan Change from 2003 # % Home Purchase 31,937 25,405 30,719 31,403 34,493 +6, % Home Improvement 3,843 2,711 2,793 4,313 6,927 +1, % Refinancing 48,165 63,405 56,070 48,045 28,047-15, % Total Applications 83,945 91,521 89,582 83,761 69,467-7, % Source: HMDA data, 2004 and previous years reports II.2 Approval/denial and origination rates as a percentage of all applications initiated or as a percentage of all applications completed can convey two different perspectives. Differences reflect the high attrition rate for Shelby County loan applicants: 26% of applications are not completed, are withdrawn by the consumer, or result in approvals that are not accepted by the consumer. The consumer-driven attrition rate, along with origination, approval, and denial rates for the 2004 application pool are shown in Table II.2 below. 15
16 Table II.2: Shelby County Loan Applications 2004: Application Profile Application Characteristics Count Percent or Summary Statistics Total Applications 83, Home Purchase* 31,937 38% Refinancing/Home Equity* 48,165 57% Home Improvement* 3,843 5% Originated* 34,427 41% Approved but Not-Accepted by Consumer* 7,749 9% Denied* 23,779 28% Withdrawn* 10,289 12% Incomplete* 3,701 4% Approval Rate 1 ** 42,176 64% Denial Rate** 23,779 36% Attrition Rate 2 * 21,739 26% Median Loan Amount Applied For* -- $85,000 High Loan-to-Income Ratio* 13,878 17% Loans with Rate Spread 3 9,511 25% Local Banks/Depository Institutions Share* 15,865 19% Independent Mortgage Companies Share* 41,927 50% Source: FFIEC HMDA 2004 data * Reported as a percentage of all initiated applications. ** Reported as a percentage of all completed applications. Shelby County Loan Applications 2004: Outcomes Withdraw n, 12% Denied, 28% Incomplete, 4% Originated, 41% Approved but Not-Accepted by Consumer, 9% 1 Includes both originated and approved-not accepted. 2 Includes approved-not accepted by consumer, incomplete applications, and applications withdrawn by consumer for first liens and 5.00 for subordinate liens; data available only for originations, and reported as a percentage of all originated loans. 16
17 II.3 The high attrition rate if Memphis and Shelby County replicate national trends is associated with expanded comparison shopping on the part of potential borrowers. Comparison shopping that expands borrower options is one interpretation. An alternative interpretation is more ambiguous and is associated with the dual market. Brokers may forum shop to make sure they find a lender for a high risk loan or may be seeking the most favorable commission for themselves such as a high yield spread premium which is the difference between an APR that a buyer would qualify for based on FICO and other indicators, and the APR that the broker persuades a borrower to accept. Lenders split the difference with brokers who deliver the customers. ( Yields spread premiums are legal in Tennessee, but not in a growing number of states that no longer simply let the buyer beware. ) II.4 Inexperienced or unsophisticated borrowers may acquire subprime loans when they could qualify for better terms. 25% of originations in Shelby County for 2004 include a rate spread flag for subprime lending, but national research by Fannie Mae suggests that on the order of 30% of borrowers could have qualified for lower rates based on sound underwriting. Table II. 3 : Lender Reported Reasons for Loan Denial Reason for Denial Total Number Percent Loan-to-Income Ratio % Employment History % Credit History % Collateral % Insufficient Cash (down payment) 217 1% Unverifiable Information 414 2% Credit Application Incomplete % Mortgage Insurance Denied 7.03% Other % Total % Source: HMDA 2004 data Loan-to-Income Ratio Employment History Credit History Collateral Insufficient Cash (down payment) Unverifiable Information Credit Application Incomplete Mortgage Insurance Denied Other Total Lender Reported Reasons for Denial 50% 5% 16% 1% 0% 18% 5% 4% 1% 0% Local lenders familiar with the Memphis market suggest that local borrowers have special problems with credit worthiness. It is difficult to know based on HMDA analysis alone the extent to which 25% subprime lending is justified. Reasons for denial of applications are reported in Table II.3, where creditworthiness is the number one reason for denial. HMDA does not include details on the other category. II.5 Table II.3 above also reveals that 17% of applications include loan-to-income ratios of at least 3.00 (applicants wishing to borrow, for example, $100,000 on an annual income of $33,000 well over the industry standard where the total purchase price and projected taxes and insurance should not exceed three times annual income). 17
18 Combined with data on borrower characteristics from Table II.4 below where we learn that 38% of applicants have incomes at or below 80% of the AMI (the federal standard for housing assistance), it is evident that successful lending and successful home ownership in Shelby County may call for special support systems. Table II.4 Shelby County Loan Applications 2004: Applicant Characteristics Applicant Characteristics Count Percent or Summary Statistics Total Applications 83, Minority 1 37,503 50% Low Income: = < 80% AMI 18,018 38% Very Low Income: = < 50% AMI 14,811 19% Poor/Near Poor: = < 30% AMI 1,873 2% Moderate Income: % AMI 18,886 25% High Income: over 120 AMI 28,636 37% Median Borrower Income -- $50,000 Zone One Inner City 11,032 13% Zone Two Mid-City 44,352 53% Zone Three Outer Ring/Suburban/Suburban 28,561 34% Source: HMDA 2004 data Shelby County Loan Applications 2004: Applicant Characteristics Low Income: 80% AMI Very Low Income: 50% AMI Poor/Near Poor: 30% AMI Moderate Income: % AMI High Income: Over 120% AMI 37, 31% 38, 30% 25, 21% 2, 2% 19, 16% 1 Includes African American, Hispanic (2%), and Other (2%); percentage excludes applicants with missing data. II.6 Minority applicants account for 50% of the applicant pool; 90% of minority applicants are black. Although approval/denial rates as we shall see in Section V favor white borrowers, multiple applications on the part of African Americans may yield results, but on less favorable terms. In other words, disparities exist and are not exclusively defined by loan denial. The geographic confluence of minority borrowers, high-risk borrowing (two or more risk factors including subprime loan, high loan-to-income ratio, and income at or below 80% AMI); high applicant attrition rates; and high volume lending by non-local independent mortgage companies (almost all on HUD s list of subprime lenders), suggests targeted marketing using the mortgage broker/mortgage lender business model. II.7. Using the three zone analysis (instead of the traditional center city, non-center city) for Shelby County lending, Table II.4 shows how Zone 2 Mid-City is the apparent 18
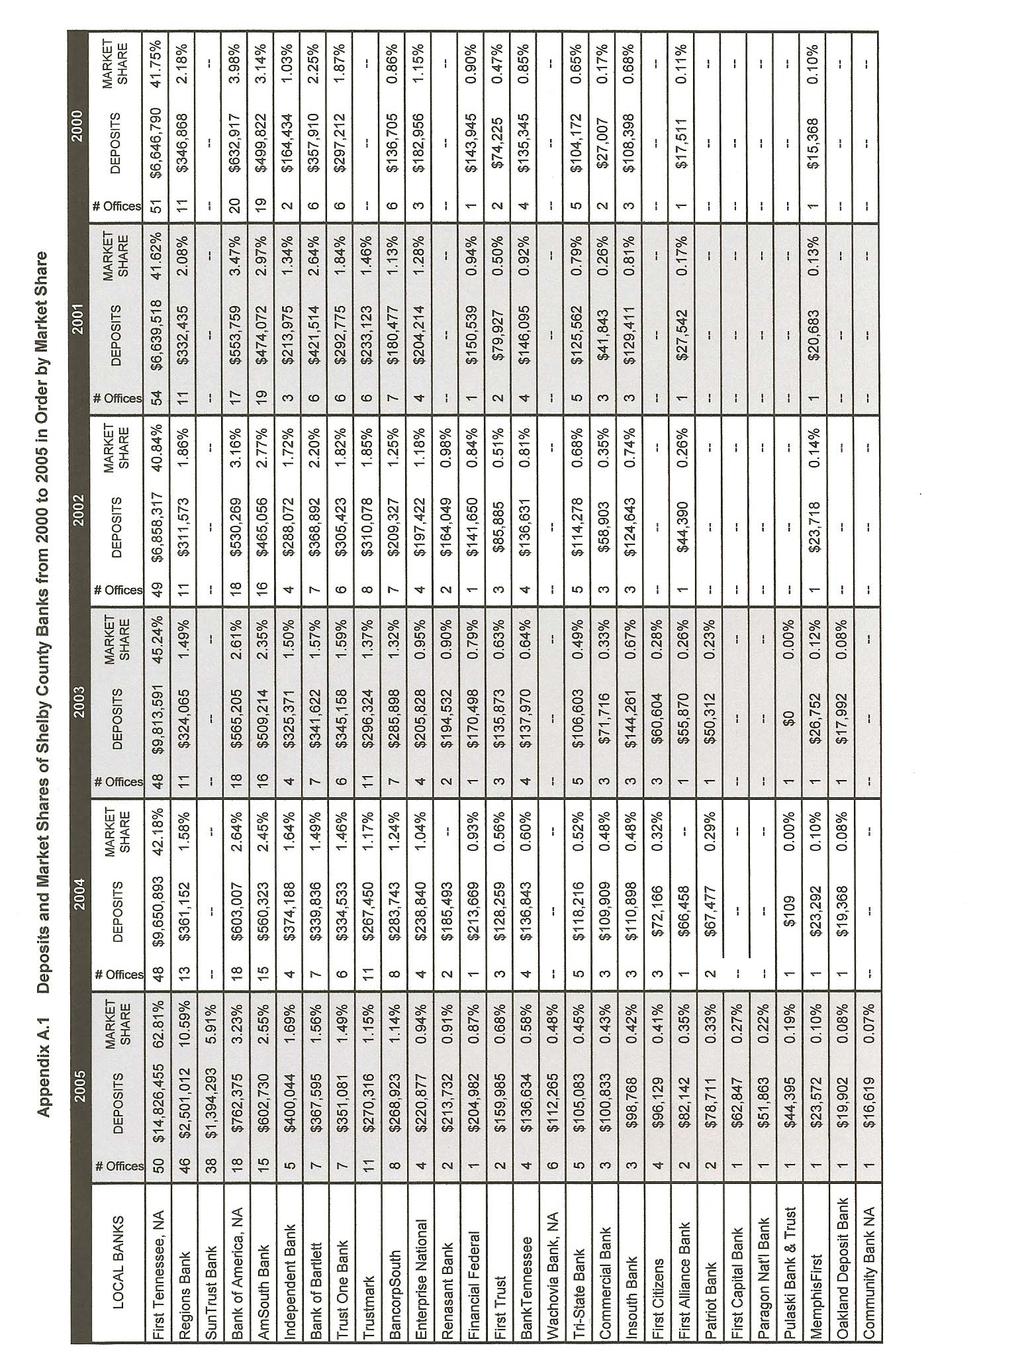
19 III hotspot for applications. This is a somewhat different and more complicated picture than that suggested by the traditional center city, non-center city concept. Local Retail Banks and Out-of-Town Lenders in the Dual Mortgage Market Loan applications to local retail banks decreased by 44% from 2003 to The share of applications collected by local banks also decreased from 31% to 19% in Both local banks and non-local lenders improved their approval rates; local banks from 75% to 79% and non-local lenders from 45% to 62%. Local retail banks maintain a shrinking share of the mortgage market in Shelby County. Section III updates financial data on local retail banks and compares lending patterns of local banks with the nonlocal segment, which is increasingly dominated by independent mortgage companies working with independent or semi-affiliated mortgage brokers. The comparison between lending by local retail banks and non-local financial institutions is the foundation of the dual market analysis. Racial/ethnic and geographic disparity and patterns attributable to the subprime market all follow from this foundation. III. 1. In 2004, overall bank deposits in Shelby County for FDIC-insured institutions ( local retail banks ) rose 5.5%, from $21,692,000,000 to $22,878,000,000. While local banking appears healthy on this measure, local retail banks are becoming less central to the local mortgage market; it is unclear if this is by design or default. Deposits and market share for local retail banks are included in Appendix A. The Appendix A list reflects the acquisition of NBC by SunTrust and Union Planters by Regions lending data for NBC and Union Planters has been Table III.1 Bank Deposits in Shelby County, Deposits Deposit Dollars Change in Dollars % of Change (M) (year over year) (year over year) , ,878 +1, ,692 +4, , , , : Data as of June 30 of each year. merged with SunTrust and Regions. (Not included in Appendix A are ten credit unions and four mortgage companies that at least in 2004 had identifiable local retail operations.) III. 2. Local depository banks and credit unions collected 15,865 mortgage-related applications in (Local credit unions collected only 313 applications) applications collected by local banks represent only 19% of all applications out of a total of 83,945. Applications decreased by 44% from 2003 (28,449) to 2004 (15,865). This decrease is due in part to a decline in low interest-rate driven refinancing, but the disproportionate decrease for local financial institutions compared to the smaller decrease in the overall applicant pool is also attributable to an accelerated shift by local borrowers to non-local lenders. III. 3. The top five local banks (reconfigured to reflect mergers) listed in Table III.2. collected 73% (11,290) of all applications for local institutions. 19
20 Table III. 2: Local Retail Banks and Other Lenders Institution Applications Collected Change from 2003 % of Total Shelby Co. Apps Applications Collected % of Total Shelby Co. Apps # % First Tennessee/First Horizon 4, % 8, % 3,606-44% Regions (Union Planters) 2, % 3, % % Bank of America 1, % 2, % % SunTrust (NBC) 1, % 1, % % AmSouth 1, % % 33 3% Top 5 Banks Total 11, % 16, % 5,003-31% All Other Local Institutions 4, % 12, % 7,581 62% All Out-of-Town Institutions 68, % 63, % 5,008 8% Shelby County Total 83, % 91, % 9,596-10% Source: HMDA 2004 data III. 4. The shift away from local lenders is accompanied by changes in overall lending patterns. Local lenders approved, for example, 79% of purchase loans, compared to an approval rate of 62% for non-local lenders (up from 45% in 2003.) This discrepancy continues a long tradition of higher approval for local lending, but the discrepancy is becoming smaller. It appears that local borrowers are becoming more adept at choosing the right out of town lender or are working with mortgage brokers who have themselves become more adept. The distinction between local and non-local lenders is evident in Tables III.3. and III.4. below and elsewhere in this study. Evidence comparing local and non-local institutions underscores the emergence of a dual mortgage market in Shelby County, where higher income, white, and Zone 3 borrowers are most likely to patronize local banks and low-to-moderate income, African American, and Zones 1 and 2 borrowers more likely to seek loans elsewhere. 20
21 Table III.3 Local Banks and Non-Local Lenders 2004: Loan Characteristics Loan Characteristics Local Banks Local Bank Non-Local Lenders Count Percent/ Summary Statistic Percent Share Count Percent/ Summary Statistic Total Applications* 15, % 68, Home Purchase* 7,491 47% 23% 24,446 36% Refinancing/Home Equity* 7,485 47% 15% 40,680 60% Home Improvement* 889 6% 23% 2,954 4% Approved and Originated* 10,771 68% 28% 27,656 40% Approved but Not-Accepted by 925 6% 12% 6,824 10% Consumer* Denied* 3,075 19% 13% 20,704 30% Withdrawn* 905 6% 8% 9,384 14% Incomplete* 189 1% 5% 3,512 5% Approval Rate 1** 11,696 79% 29% 34,480 62% Attrition Rate 2 ** 2,019 13% 9% 19,720 38% High Loan-to-Income Ratio* 2,230 14% 16% 11,648 17% Subprime Loans % 7% 8,853 30% Source: HMDA 2004 data * Reported as a percentage of initiated applications collected within each lender type. ** Reported as a percentage of completed applications within lender type. 1 Includes both originated and approved-not excepted applications. 2 Includes approved-not accepted by consumer, incomplete applications, and applications withdrawn by consumer for first liens and 5.00 for subordinate liens, reported as a percentage of all originated loans. Local Banks and Non-Local Lenders: Loan Purpose by Market Share Home Purchase* Refinancing/Home Equity* Home Improvement* Non-Local Lenders Local Banks 21
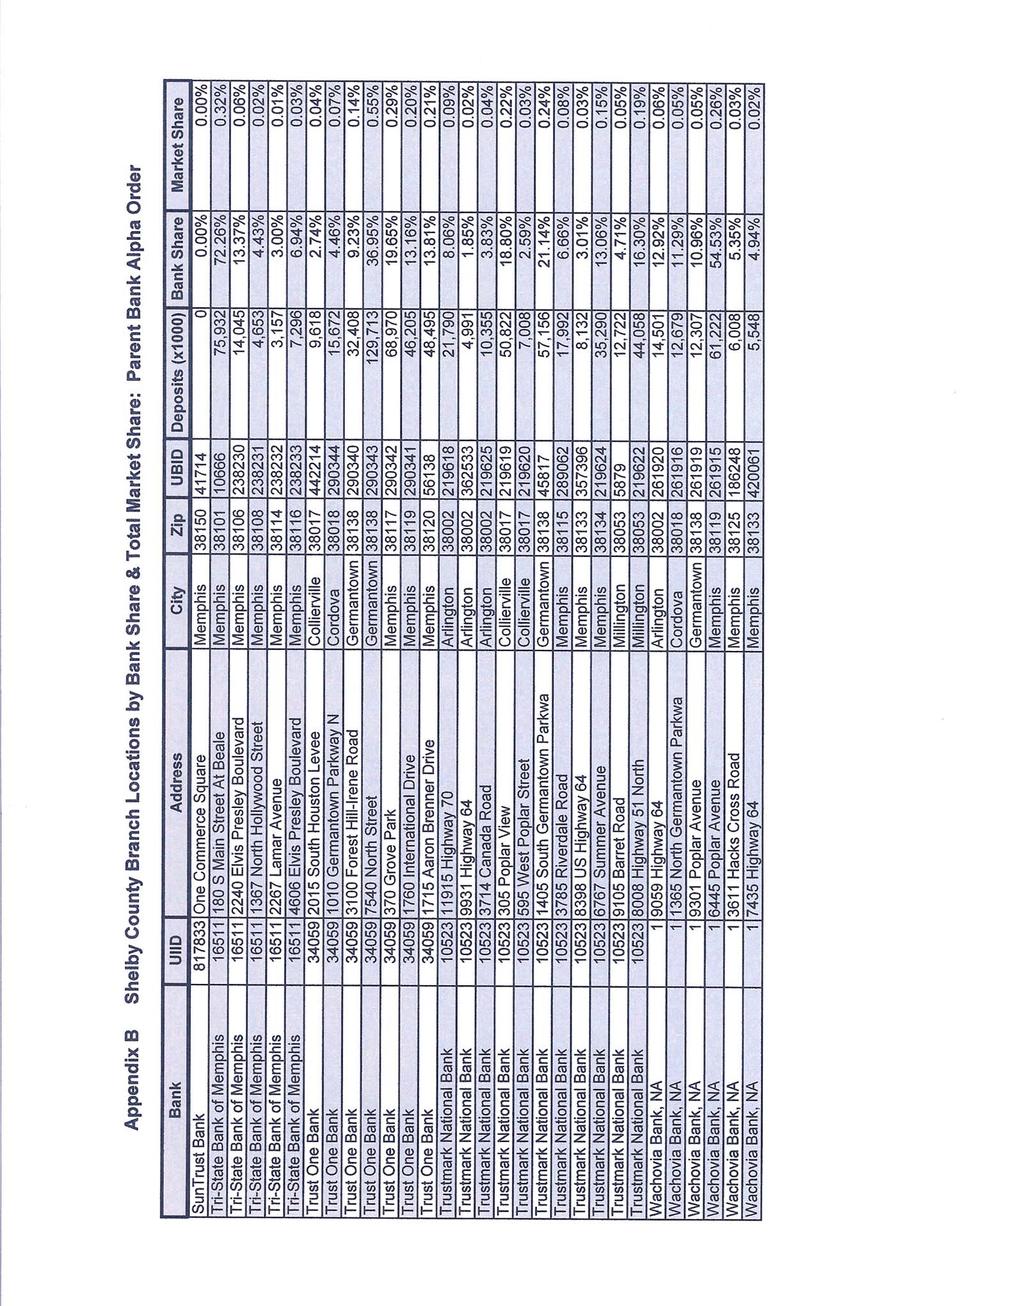
22 Table III.4 Local Banks and Non-Local Lenders 2004: Applicant Profile Applicant Characteristics Local Banks Local Banks Share Count Percent/ Summary Statistic Non-Local Lenders Percent Count Percent/ Summary Statistics Total Applications 15, % 68, Minority 1 6,346 40% 16% 32,287 52% Low Income: = < 80% AMI 1,910 12% 16% 10,374 40% Very Low Income: = < 50% 1,895 13% 13% 12,966 21% AMI Poor/Near Poor: = < 30% 294 2% 16% 1,579 3% AMI Moderate Income: % 3,172 22% 17% 15,714 25% AMI High Income: over 120 AMI 7,040 44% 25% 21,596 35% Zone One Inner City 2,067 13% 19% 8,965 13% Zone Two Mid-City 6,488 41% 15% 37,864 56% Zone Three Outer Ring/Suburban Source: HMDA 2004 data 7,310 46% 26% 21,251 31% 1 Includes African American, Hispanic (5%), and Other (5%); percentage excludes applicants with missing data. III. 5 Local lenders do not have the market penetration represented by non-local lenders with lower and moderate income or African American borrowers. The non-local borrower profile suggests higher risk loans, but it is also clear that most borrowers have reasonable loan-to-income ratios and have not been offered subprime loans by non-local lenders. The shift away from local retail banks or, put somewhat differently, the gravitation toward nonlocal lenders for new borrowers entering the housing market -- appears to be both a challenge and opportunity for local banking. III. 6. National research suggests that both the lack of presence in lower to moderate income neighborhoods and the attractiveness of customer service offered by mortgage brokers in the national mortgage lending industry (some of which has been associated with predatory lending) are factors disadvantaging local banks. Appendix B includes a table and a map showing the location of all Shelby County retail banks and branches. It is important to bear in mind that HMDA data includes property location, not borrower neighborhood. Mid-City buyers in Memphis are in many cases moving out of neighborhoods that have a poorly established banking tradition and presence. National experience suggests that local retail banks increase their share of the emerging borrower market only when they change their marketing strategies. (The Fannie Mae Foundation s expert chat archives features several sessions on new market strategies that could be useful in Memphis. ) 22
23 IV Home Buying and Refinancing Applications for refinancing have higher denial and attrition rates than purchase loans, but like purchase loans, are predominantly first lien loans. Refinancing is not exclusively driven by favorable interest rates -- purchase and refinancing loans are about equally likely to be subprime. Nearly one of four purchase loans is paired at closing with a concurrent subordinate lien, another indicator of the dual mortgage market. Home purchase lending is not as distinguished from refinance lending as might be anticipated. First lien refinance loans are typically as large as purchase loans, for example. In the wake of the refinancing boon, refinancing is driven by more diverse factors which are very much related to the dual mortgage market. Tables IV.1 and IV.2 compare application and applicant characteristics for purchase and refinance applications. Table IV. 1. Comparison of Loan Applications for Home Purchase and Refinancing Loans Loan Characteristics Home Purchase Refinancing/ Home Equity Count Percent/ Summary Statistic Count Percent/ Summary Statistic Total Applications+ 31, , Subordinate Purchase Liens 3,779 12% Subordinate Home Equity Liens ,505 8% Originated* 20,355 64% 17,014 35% Denied* 5,343 17% 16,250 34% Approved but Not Accepted by Consumer* 2,903 9% 4,601 10% Withdrawn* 2,514 8% 7,482 16% Incomplete* 822 3% 2,818 6% Approval Rate 1** 23,258 73% 21,615 45% Attrition Rate 2* 6,239 20% 14,901 31% Median Loan Amount Applied For -- $99, $83,000 High Loan-to-Income Ratio 6,250 20% 7,415 15% Subprime Loans 4,336 21% 4,818 28% Local Banks/Depository Institutions Share 7,491 24% 7,485 16% Independent Mortgage Companies Share 14,143 44% 26,199 54% Source: HMDA 2004 data + Excludes home improvement applications. * Reported as a percent of all applications collected by loan purpose. ** Reported as a percentage of completed applications within loan purpose. 1 Includes both originated and approved-not accepted applications. 2 Includes approved-not accepted by consumer, incomplete applications, and applications withdrawn by consumer. 23
24 Table IV. 2. Comparison of Applicant Characteristics for Home Purchase and Refinancing Loans Borrower Characteristics Home Purchase Refinancing/ Home Equity Count Percent/ Summary Statistics Count Percent/ Summary Statistics Total Applications 31, , Minority 1 14,705 52% 20,847 55% Low Income: = < 80% AMI 10, % 16, % Very Low Income: = < 50% AMI 5, % 8, % Poor/Near Poor: = < 30% AMI % 1, % Moderate Income: % AMI 7, % 10, % High Income: over 120 AMI 12, % 15,396 32% Median Borrower Income -- $53, $50,000 Owner-Occupant 28, % 43, % Zone One Inner City 3, % 6,740 14% Zone Two Mid-City 14, % 27, % Zone Three Outer Ring/Suburban/Suburban 13, % 14, % Source: HMDA 2004 data *Reported as a percent of all applications collected. 1 Includes African American, Hispanic (5%), and Other (5%); percentage excludes applicants with missing data. IV. 1 Refinancing is no longer driven exclusively by the desire and ability to get a better interest rate; in the dual mortgage market, 28% of first lien refinancing loans are in the form of subprime (and perhaps cash out ) releases. (Home equity loans tend to be subordinate liens.) Black borrowers are especially likely to be strapped by subprime refinancing, which is usually a sign of mortgage distress and a predictor of foreclosure. IV. 2 Home equity subordinate liens appear to be giving way to release refinancing. In 2004 only 750 subordinate lien refinance loans could be identified, along with 426 similar arrangements classified as home improvement loans. Home equity loans were about as likely as first lien refinancing to be subprime (31%); home improvement loans were even more likely to be subprime (41%). While there are not many subprime home improvement loans (just 177 in 2004), these are the loans that are targeted toward low income, African American, and often elderly homeowners in poor Inner City neighborhoods of Zone 1. More of these loans can no doubt be identified using sources other than HMDA; many of these lenders do not meet HMDA reporting criteria. IV.3 The one place where refinance applications differ significantly from home purchase applications is that attrition rates are higher and approval rates lower. There is, in other words, a great deal of forum shopping going on with out-of town lenders. IV.4 Both home purchase and refinancing applications are a fairly accurate reflection of the demographic make-up of Shelby County. Minority applicants are 52% of the home purchase applicant pool and 55% of the refinancing pool, while loan applications for each type of loan are similarly distributed among income groups. The profile of the successful home mortgage seeker, however, begins to diverge from the applicant pool; this is where questions about racial/ethnic disparity in lending persist. 24
25 V Race, Neighborhoods, and Lending Disparity: Subprime Lending and the Dual Mortgage Market African Americans continue to experience a twenty point gap in approval rates compared to white loan applicants in Shelby County. They are more likely to have subprime loans. Even when loans are not subprime, black borrowers are more likely to patronize national lenders and independent mortgage companies. High volume applications and lending for African Americans is concentrated in Zone 2 in Memphis, where indicators such as high foreclosure rates are also concentrated. The African American population in Shelby County is clearly more economically disadvantaged than the white population. If one goal is to expand successful home ownership among African Americans in Shelby County and elsewhere, economic realities demand creative approaches. Forty-five percent of black loan applicants are low income; 60% of low-income applicants are very low income at 50% or less than the AMI for Shelby County. The non-local mortgage market has become creative during the past ten years and home ownership has expanded; the fact that lower income African Americans are more likely to be home owners than ever before, does not, however, translate into successful home ownership. Application and applicant characteristics for black and white applicants in Shelby County are compared in Tables V. 1 and V.2 Table V.1. Comparison of Application Characteristics and Lending Disparity for African American and White Applicants Application Characteristics African American Applicants White Applicants Count Percent/ Summary Statistic Count Percent/ Summary Statistic Total Applications 34, , Home Purchase 12,946 38% 13,375 42% Refinancing/Home Equity 19,341 57% 17,098 54% Home Improvement 1,846 5% 1,186 4% Subordinate Purchase Liens*** 1,159 33% % Subordinate Home Equity Liens*** 266 5% 308 4% Originated* 13,223 39% 19,273 61% Approved but Not-Accepted by Consumer* 3,553 10% 2,179 7% Denied** 11,876 35% 5,828 18% Withdrawn* 4,010 12% 3,187 10% Incomplete* 1,471 4% 1,192 4% Approval Rate 1** 16,776 49% 21,452 68% Attrition Rate 2 * 9,034 26% 6,558 21% Median Loan Amount Applied For -- $71, $110,000 High Loan-to-Income Ratio 5,774 17% 4,765 15% Subprime 3 5,532 42% 2,326 12% Banks/Depository Institutions Share 4,250 13% 9,383 30% Independent Mortgage Companies Share 19,632 58% 11,406 36% Source: HMDA 2004 data * Reported as a percentage of all initiated applications. ** Reported as a percentage of all completed applications. *** Originated loans only; percentage on subordinate purchase liens is percentage of all buyers that have both a first and second purchase lien. 1 Includes both originated and approved-not accepted. 2 Includes approved-not accepted by consumer, incomplete applications, and applications withdrawn by consumer for first liens and 5.00 for subordinate liens, reported as a percentage of all originated loans. 25
26 Table V. 2. Comparison of Applicant Characteristics for African American and White Applicants Applicant Characteristics African American White Count Percent/ Summary Statistic Count Percent/ Summary Statistics Total Applications 34,133 52% 31,659 49% Low Income: = < 80% AMI 15,468 45% 6,843 22% Very Low Income: = < 50% AMI 8,286 26% 3,008 11% Poor/Near Poor: = < 30% AMI 1,030 3% 337 1% Moderate Income: % AMI 8,123 26% 6,823 24% High Income: over 120 AMI 7,896 25% 15,087 53% Median Borrower Income $42,000 $65,000 Male w/ Female Co-Applicant 5,135 15% 11,358 36% Female w/ no Co-Applicant 14,636 43% 7,201 23% Owner-Occupant 31,007 91% 28,200 89% Zone One Inner City 5,781 17% 3,016 9% Zone Two Mid-City 23,017 67% 11,232 35% Zone Three Outer Ring/Suburban 5,335 16% 17,410 55% Source: HMDA 2004 data Loan Denials by Race and Income Group 70% 60% 50% 40% 30% 20% 10% 0% Poor/Near Poor Very Low Income Low Income Moderate Income High Income African American Applicants White Applicants V. 1 Disparity in approval rates continues to be evident when black and white loan-seekers in Shelby County are compared. For all types of loans, African Americans have an approval rate of 49% in 2004, compared to nearly 68% for whites; for home purchase mortgages approval rates are 55% and 76%. Taking income and family composition (two adult co-applicants verses single, female applicant) into account, overall disparity rates are partially, but not fully explained. Ttable V.2.compares denial rates for black and white applicants in five income categories, where at all income levels blacks are more likely to be denied. 26
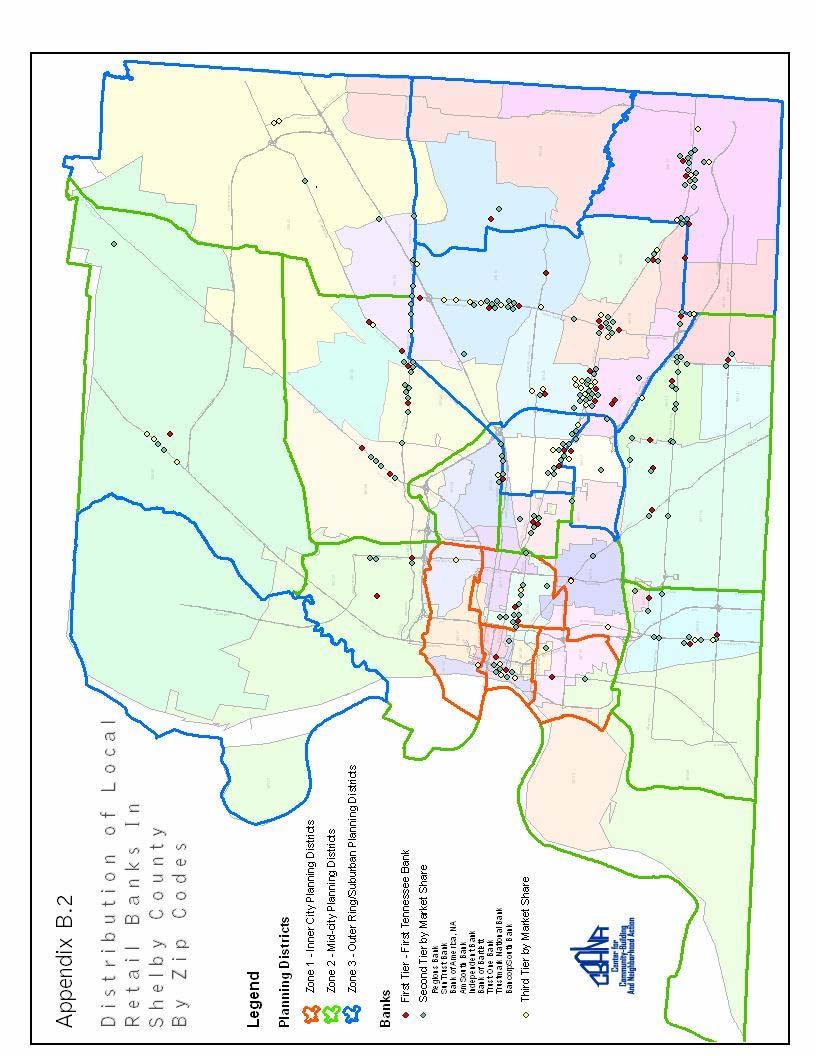
27 V. 2 Higher approval rates for whites can be offset, however, by the comparatively high volume of applications among blacks: the higher the number of attempts, the more likely an approval. This appears to be standard practice in the dual mortgage market. It is important to note that some out of town lenders have very high approval rates. This is especially true of subprime lenders, who also tend to have high foreclosure rates. Table V.3. compares subprime borrowers with non-subprime borrowers. Table V. 3. Comparison of Subprime Originations with Non-Subprime Originations Loan & Borrower Non-Subprime Borrowers Subprime Borrowers Characteristics Local Lenders Share 27% 7% Independent Mortgage Companies 36% 63% Share African American Borrowers 27% 58% Income At or Below 80% AMI 22% 41% High Income >120% AMI 52% 30% High Loan-to-Income Ratio 15% 17% Source: HMDA data 2004 V. 3 African American borrowers are more likely to receive subprime offers and subprime lending is heavily focused in Zone 2 neighborhoods in Memphis. This is where racial disparity becomes geographic disparity. Instead of classical redlining where too little credit is being extended, we find the dual mortgage market thriving on subprime lending. Paralleling classic redlining, however, local retail bank lending is heavily skewed toward Zone 3. Zones and planning districts are shown in Map V.1. Tables V.4 and V.5 compare application and applicant characteristics by zone. 27
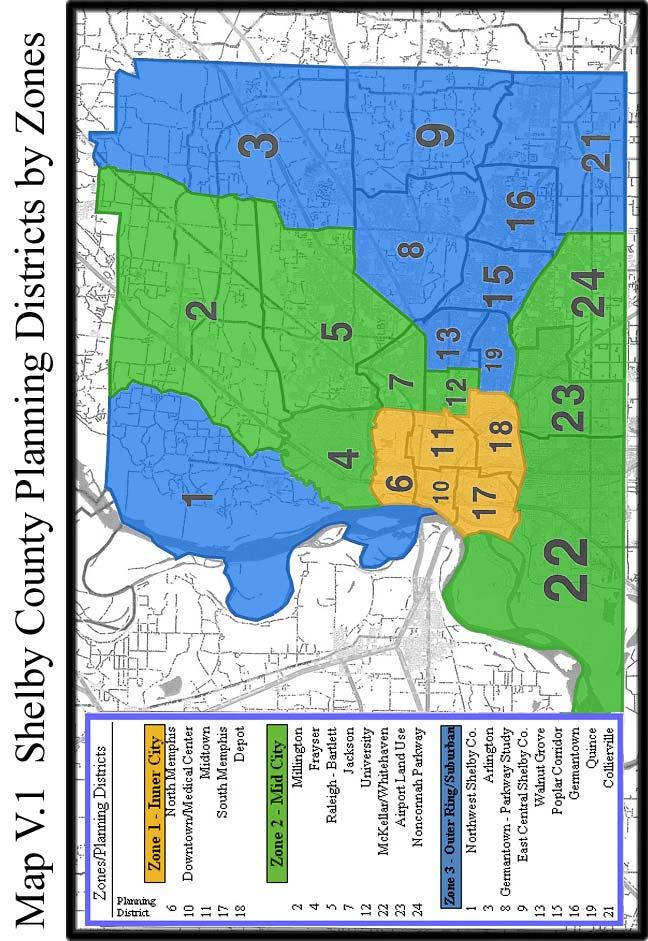
28 28
29 Table V. 4. Application Characteristics by Geographic Zone 2004 Application Characteristics Zone One Inner City Zone Two Mid-City Zone Three Outer Ring/Suburban Count Percent Count Percent Count Percent Total Applications 11,031 44,349 28,561 Home Purchase 3,671 33% 14,776 33% 13,489 47% Refinancing/Home Equity 6,739 61% 27,376 62% 14,047 49% Home Improvement 621 6% 2,197 5% 1,025 4% Originated* 4,432 40% 17,276 39% 16,718 58% Approved but Not-Accepted by Consumer* 1,155 10% 4,411 10% 2,182 8% Denied* 3,730 34% 14,496 33% 5,552 19% Withdrawn* 1,130 12% 5,993 13% % Incomplete* 404 4% 2,173 5% 1,124 4% Approval Rate** 1 5,587 51% 21,687 49% 18,900 66% Attrition Rate* 2 2,869 26% 12,577 28% 6,291 22% Median Loan Amount Applied For $57,000 $77,000 $131,000 High Loan-to-Income Ratio 1,617 38% 5,756 33% 2,078 12% Subprime* 3 1,617 38% 5,756 33% 2,078 12% Local Banks/Depository Institutions Share 2,067 19% 6,488 15% 7,310 26% Independent Mortgage Companies Share 5,745 52% 25,096 57% 11,082 39% Source: HMDA 2004 data * Reported as a percentage of all initiated applications collected within each zone. ** Reported as a percentage of all completed applications within zone. 1 Includes both originated and approved-not excepted applications. 2 Includes approved-not accepted by consumer, incomplete applications, and applications withdrawn by consumer for first liens and 5.00 for subordinate liens, reported as a percentage of all originated loans. Table V. 5. Applicant Characteristics by Geographic Zone 2004 Applicant Characteristics Zone One Inner City Zone Two Mid-City Zone Three Outer Ring/Suburban Count % Count % Count % Total Applications 11,031 44,349 28,561 Minority 1 6,046 55% 24,579 55% 6,878 24% Low Income: = < 80% AMI 5,132 47% 18,499 42% 5,386 19% Very Low Income: = < 50% AMI 2,895 26% 9,652 22% 2,313 8% Poor/Near Poor: = < 30% AMI 672 6% 983 2% 218.8% Moderate Income: % AMI 2,047 19% 10,786 24% 6,052 21% High Income: over 120 AMI 2,994 27% 10,941 25% 14,699 51% Owner-Occupant 8,855 80% 39,925 90% 26,801 94% Source: HMDA 2004 data *Reported as a percent of all applications collected. 1 Includes African American, Hispanic (2%), and Other (2%); percentage excludes applicants with missing data. 29
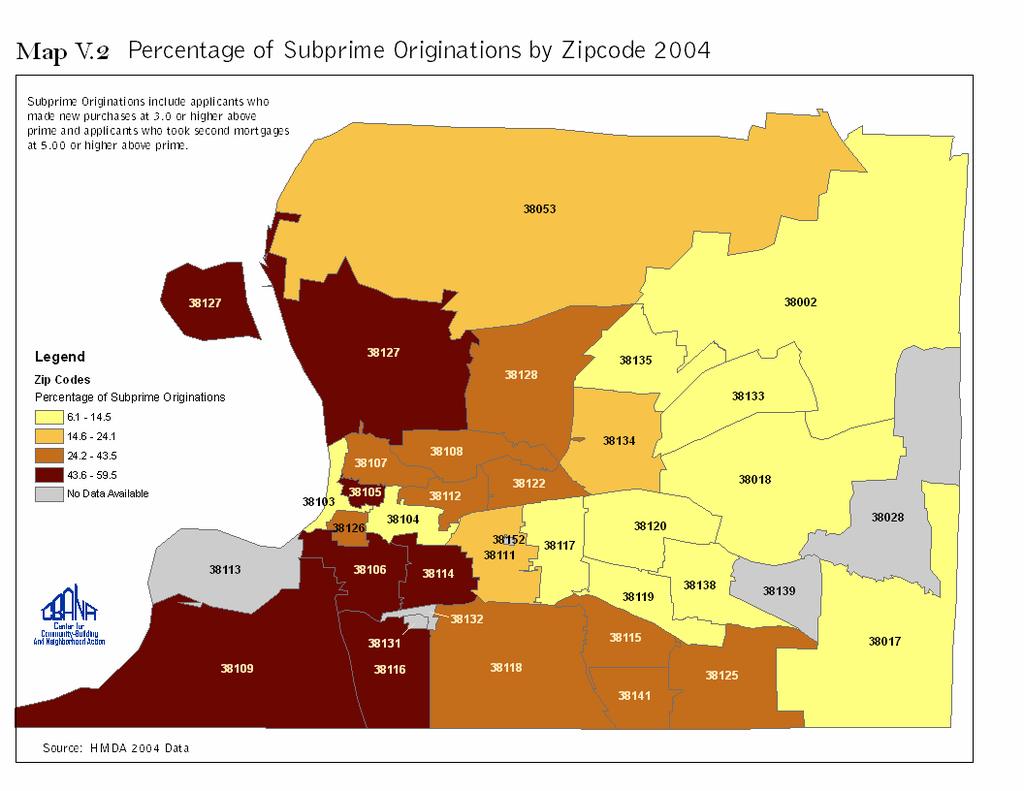
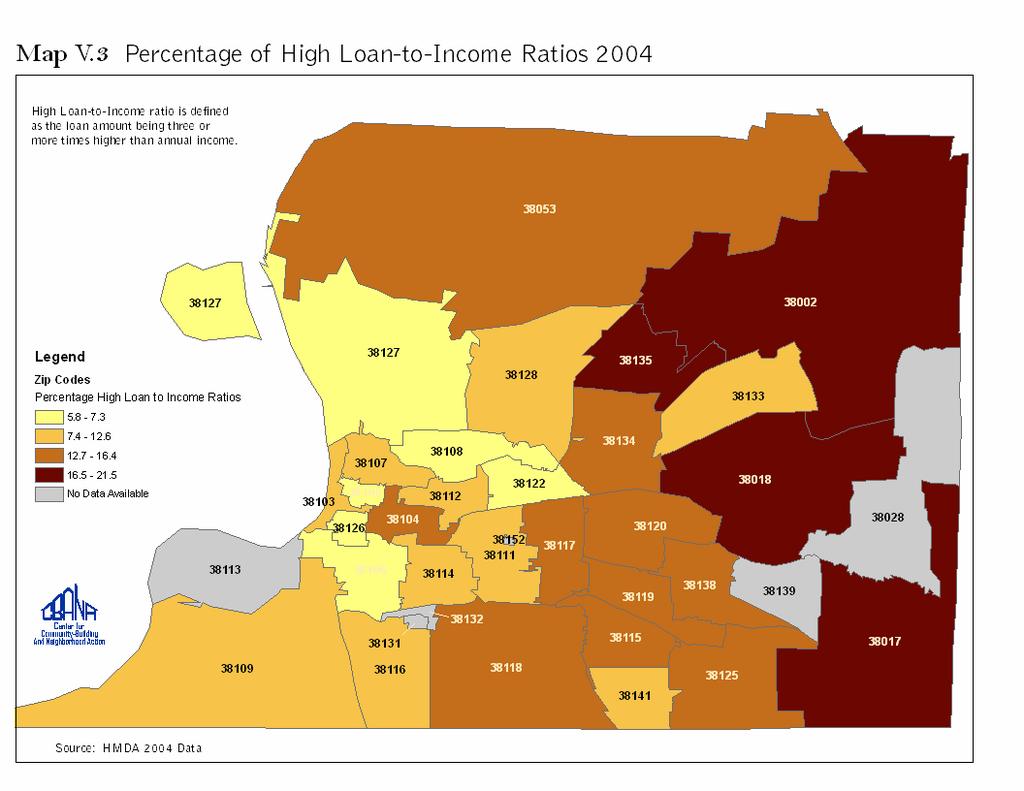
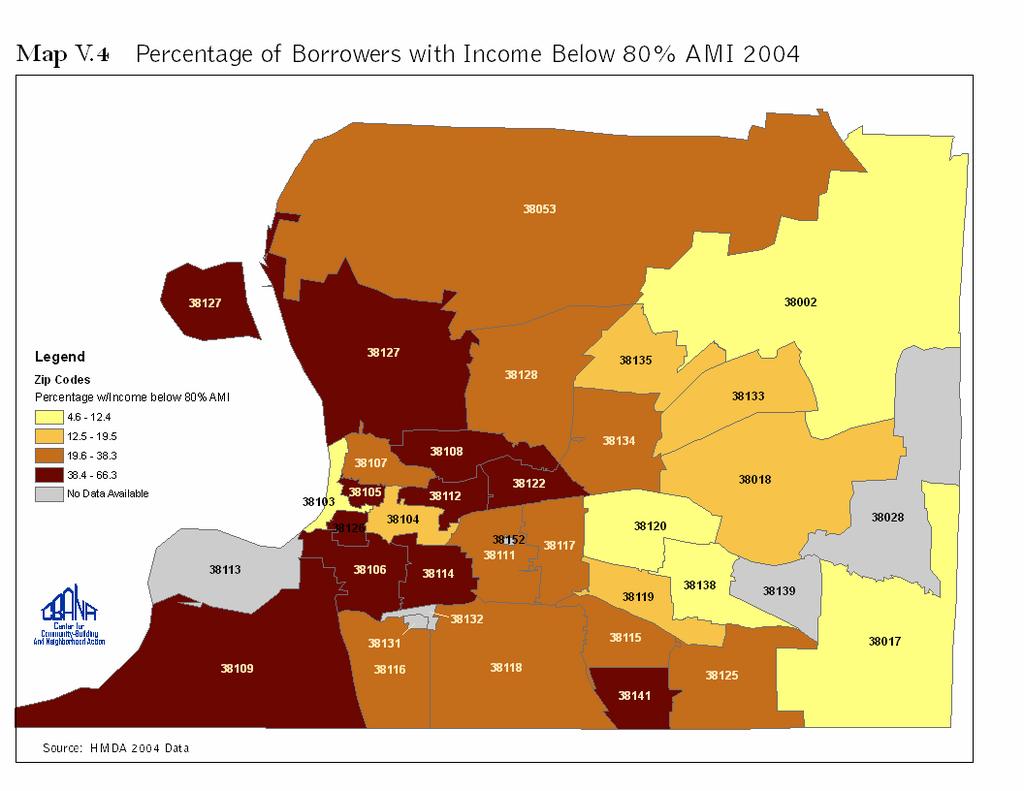
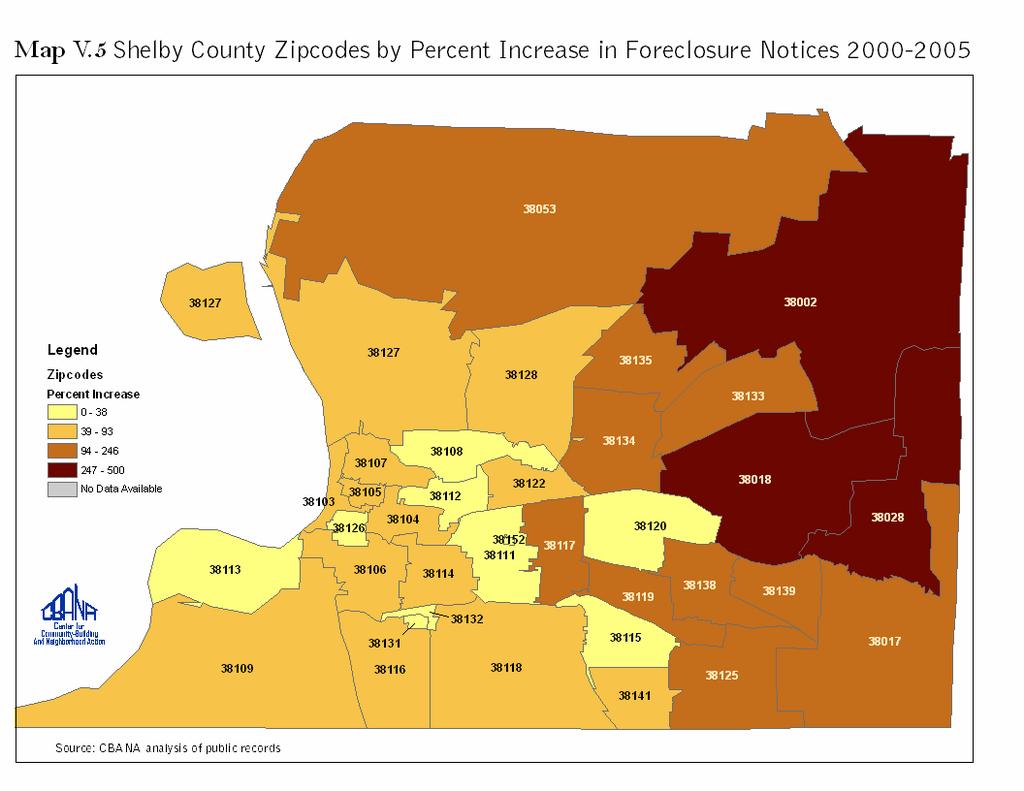
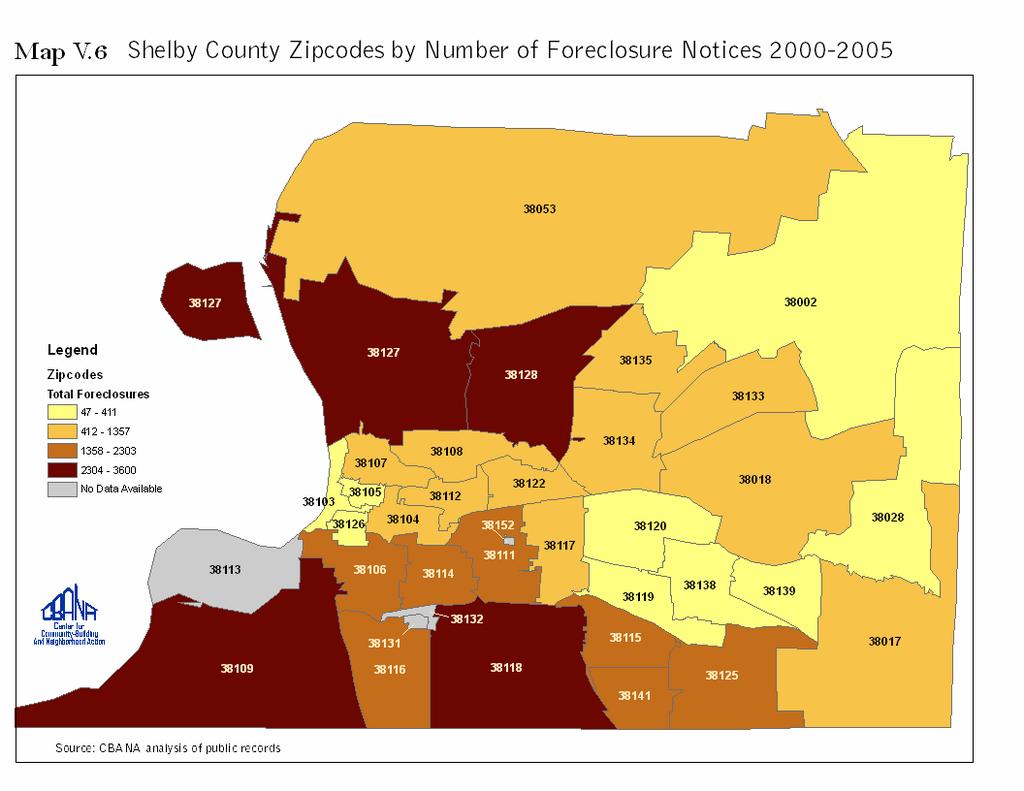
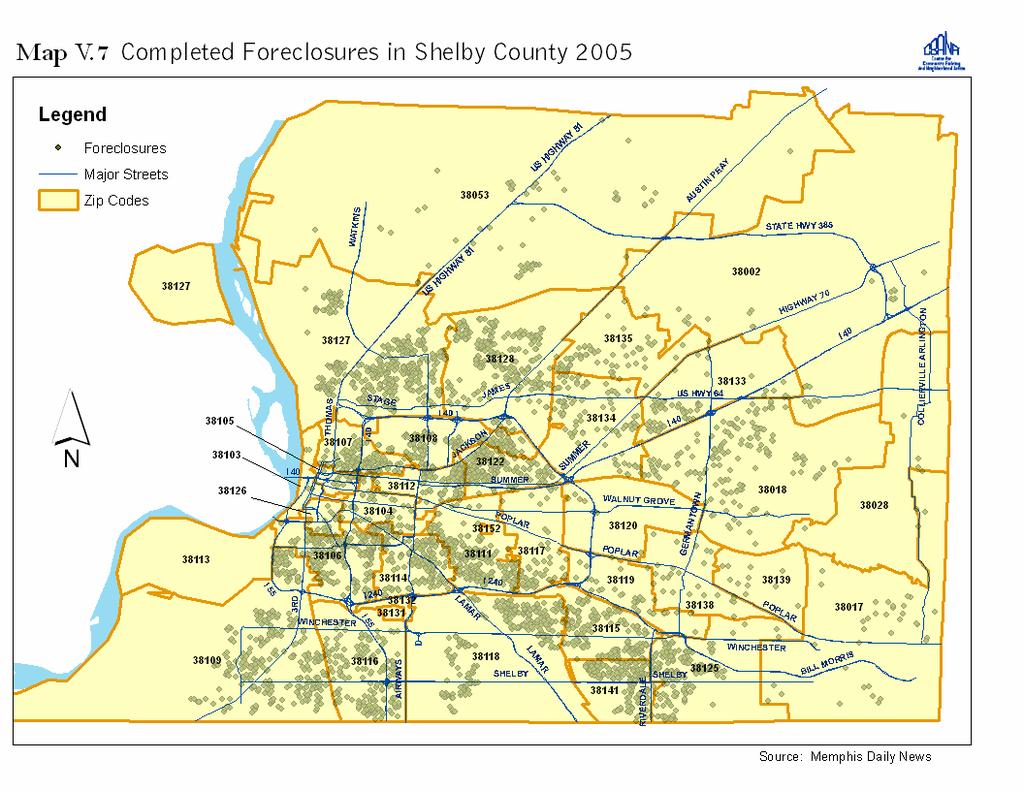
30 V. 4 The geographic convergence of subprime lending, economic marginality, and foreclosure undermines neighborhood stability in Zone 2. Zone 1 suffers from the same combination of indicators, but the volume of lending and foreclosures is significantly lower than in Zone 2; the housing market in Zone 1 has already bottomed out. Patterns in Zone 2 make it increasingly difficult for homeowners to build and sustain equity or neighborhoods to thrive. Zone 2 neighborhoods such as Fox Meadows, Hickory Hill, Whitehaven, Raleigh and Frayser suffer the perfect storm of geographic indicators. Tables V.6 and V.7 illustrate how Zone 2 planning districts and zip codes, namely; Airport/Nonconnah (38115, 38118, 38141); Whitehaven (38116); Raleigh (38128) and Frayser (38127) experience high rates of subprime lending and high loan-toincome ratios, economic risk factors, and high volume foreclosures. High risk Zone 2 zip codes are highlighted. Maps V.2 through V.7 illustrate these same threats to neighborhood stability even more graphically. 30
31 Table V.6. New Purchase Originations, Income and Foreclosures in Shelby County by Zip Code Zip Code Percentage of Subprime Originations* Percentage of High Loan-to- Income Ratios** Percent w/ Income Below 80% AMI Percent w/ Income Below 50% AMI Foreclosures Foreclosure % Increase % 22.4% 10.6% 2.5% % % 21.4% 20.7% 7.4% % % 21.6% 8.4% 2.5% % % 23% 21.5% 7.3% % % 17.6% 35.4% 18.5% % % 14.1% 7.1% 1.1% % % 14.6% 16.7% 6.2% % % 5% 65% 20% % % 6.1% 50.2% 35.1% % % 13.7% 23.2% 8.6% % % 8.8% 51.6% 35.8% % % 12.5% 47% 32.7% % % 15.1% 31.3% 17.8% % % 12.2% 26.6% 15% % % 12.1% 44.8% 24.1% % % 17.9% 56.5% 31.1% % % 15.3% 44.6% 26.2% % % 17% 29.5% 15.5% % % 20.4% 44.7% 25.6% % % 16.5% 18.8% 6.2% % % 15.9% 14.6% 6.3% % % 9.1% 48.6% 32.7% % % 21.5% 37.3% 13.8% % % 5.7% 79.2% 52.9% % % 9.5% 52.5% 35.6% % % 15.3% 49.6% 28.9% % % 16.6% 23.6% 8.6% % % 21.5% 42.4% 18.1% % % 22.4% 22.6% 8.3% % % 17% 4.7% 1.2% % % 16.3% 62.6% 35.9% % Countywide 21.3% 18.3% 28.8% 14.3% Total = Percentages Source: HMDA 2004 data and CBANA analysis of public records. * Originations include applicants who made new purchases at 3.0 or higher above prime and applicants who took second mortgages at 5.00 or higher above prime. ** High Loan-to-Income ratio is defined as the loan amount being three or more times higher than annual income. Percent Difference = 79% 31
32 Table V. 7. All Loan Originations, Income and Foreclosures in Shelby County by Zip Code Zip Code Percentage of Subprime Originations* Percentage of High Loan-to-Income Ratios** Percent w/ Income Below 80% AMI Percent w/ Income Below 50% AMI Foreclosures Foreclosure % Increase % 21.5% 10.9% 3.3% % % 16.8% 16.8% 6.5% % % 19.6% 8.3% 3.3% % % 20% 17.8% 6.5% % % 14% 27.9% 15% % % 12.1% 6.4% 1.6% % % 13.1% 18.1% 7.6% % % 7% 45.6% 16.7% % % 7.3% 53.2% 34.6% % % 11.4% 28.5% 14.6% % % 6.8% 47.7% 30.4% % % 10.1% 47.8% 31% % % 11.5% 30.3% 18.6% % % 10.4% 46.4% 16.8% % % 10.3% 43.2% 24.5% % % 13.9% 36.4% 23% % % 12.2% 26.3% 19.5% % % 14.7% 26.3% 13.7% % % 15.2% 38.1% 22.9% % % 14.4% 17.3% 5.3% % % 13.1% 12.4% 5% % % 7% 45.8% 29.5% % % 16.4% 28% 10.5% % % 5.8% 66.3% 42.5% % % 7% 44.9% 29.9% % % 10.3% 38.3% 21.9% % % 12.6% 19.5% 8.4% % % 14.6%% 31.9% 14.8% % % 18.6% 18.6% 7.4% % % 15.3% 4.6% 1.4% % % 11.8% 47.1% 26.7% % Countywide 24.7% 14.5% 26.7% 14% Total = Percentages 2005: Data as of June 30 of each year. Percent Difference = 79% * Originations include applicants who made new purchases at 3.0 or higher above prime and applicants who took second mortgages at 5.00 or higher above prime. ** High Loan-to-Income ratio is defined as the loan amount being three or more times higher than annual income. 32
33 33
34 34
35 35
36 Conclusion It is the neighborhoods with high concentrations of upwardly mobile African Americans that are most likely to suffer from the dual mortgage market; the market extends both opportunity and predatory practices to traditionally underbanked populations. It is also clear that local retail banks have not played a significant part in the expansion of homeownership for black Memphians. It is more of an open question as to whether these banks could do a better job than the non-local lenders who have created the dual mortgage market. It is easier to describe what is happening than to prescribe how community developers could more effectively work with local banks to bring a different kind of mortgage market to Memphis neighborhoods. It is important to conclude, however, by noting that even though the dual market has reinforced geographic disparities that accompany subprime lending and foreclosures, most low to moderate income buyers are not defaulting on their mortgages. The continued integration of HMDA data with other housing market-related data sources will enable us to better distinguish ways in which the dual mortgage market is offering positive benefits, and identify ways in which local lenders might grow a more effective relationship with neighborhoods where the dual market is most evident. 36
37 Appendices 37
38 Appendix A 38
39 39
40 40
41 41
42 42
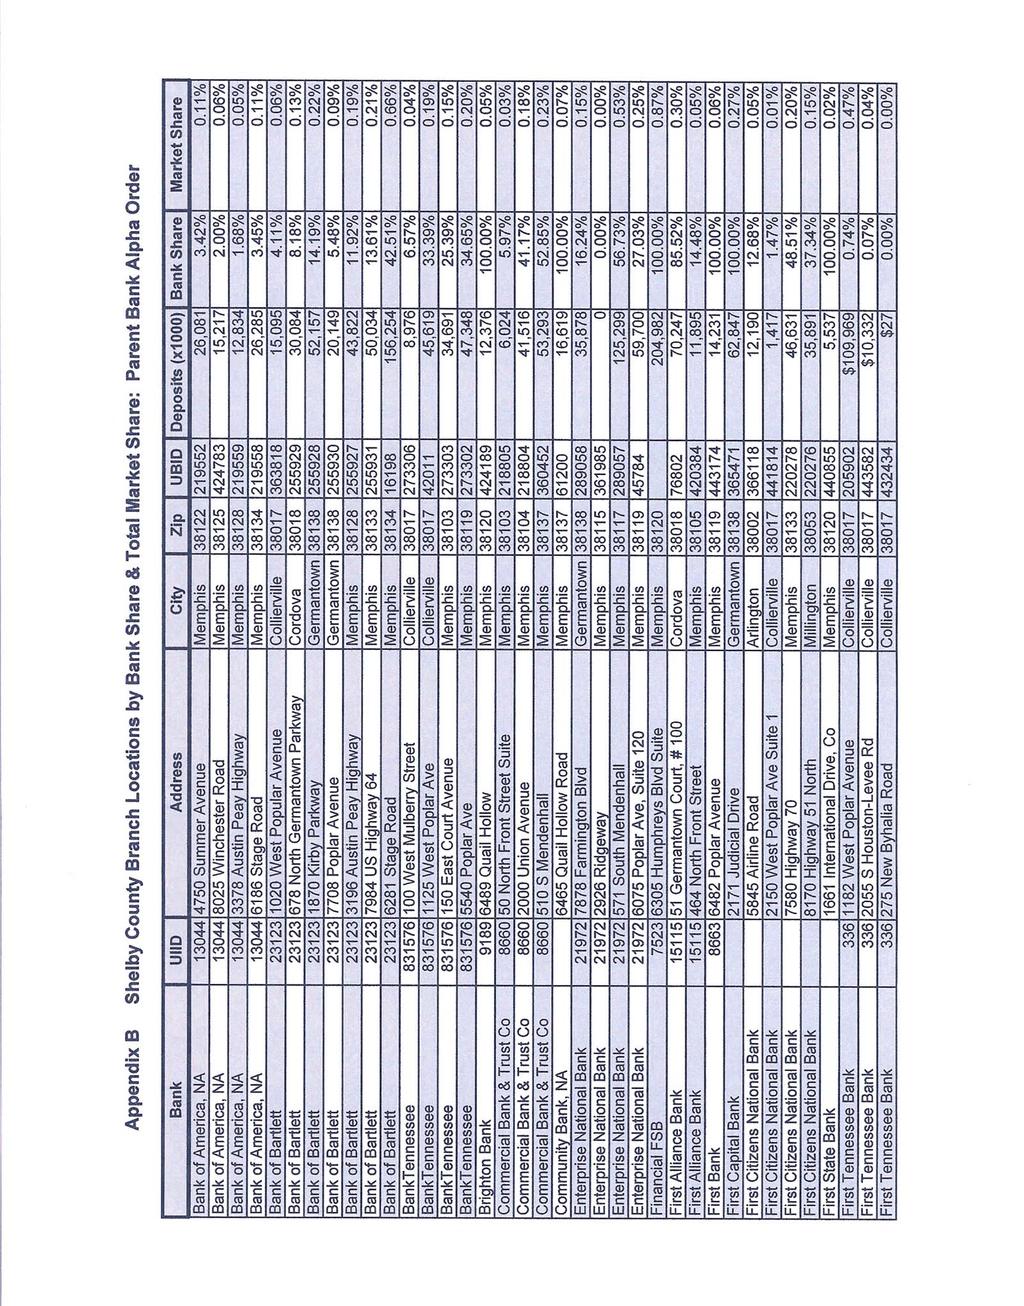
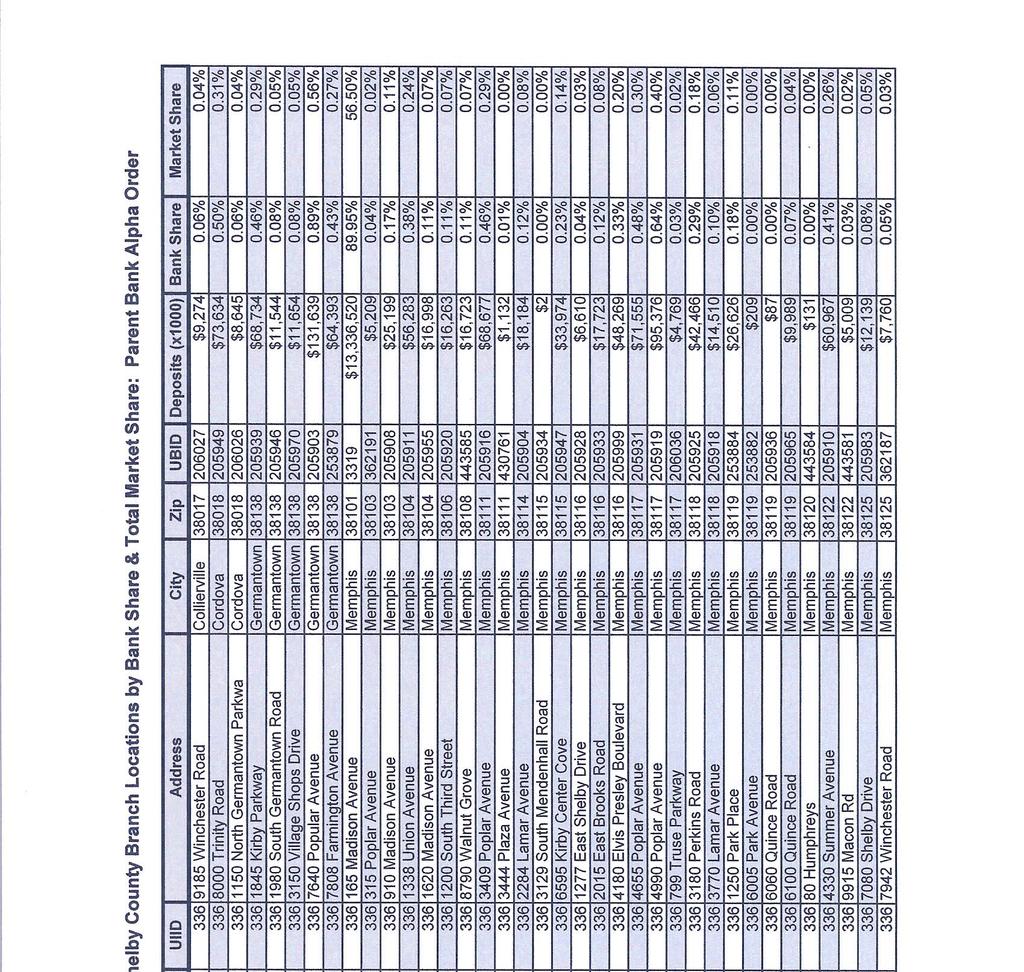
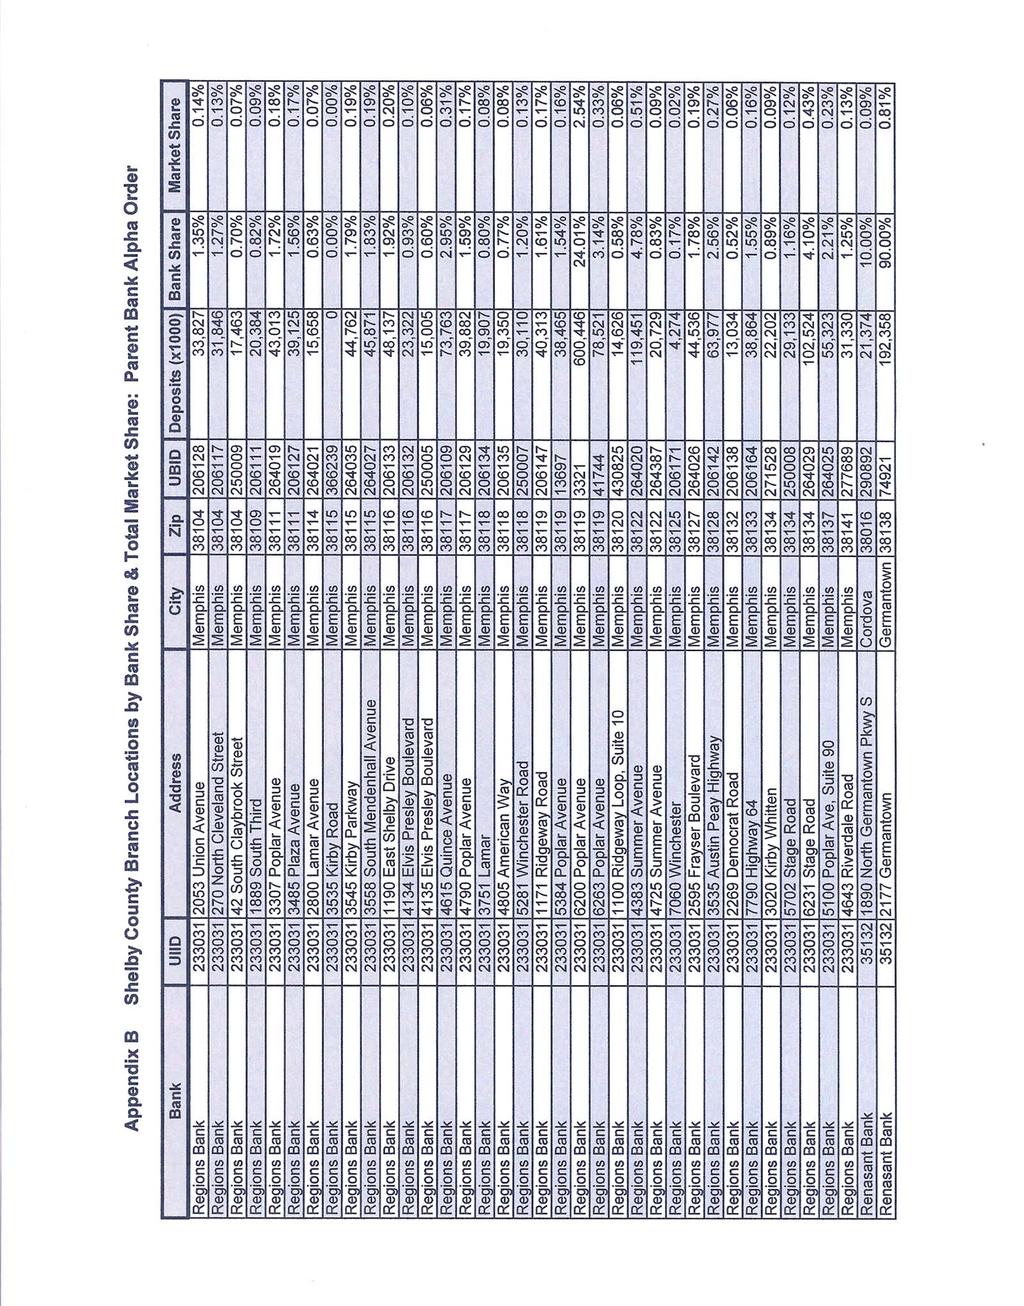
43 Appendix B 43
44 44
45 45
46 46
47 47
48 48
49 49
50 50
51 51
A Look at Tennessee Mortgage Activity: A one-state analysis of the Home Mortgage Disclosure Act (HMDA) Data
 Data") September, 2015 A Look at Tennessee Mortgage Activity: A one-state analysis of the Home Mortgage Disclosure Act (HMDA) Data 2004-2013 Hulya Arik, Ph.D. Tennessee Housing Development Agency TABLE OF CONTENTS
September, 2015 A Look at Tennessee Mortgage Activity: A one-state analysis of the Home Mortgage Disclosure Act (HMDA) Data 2004-2013 Hulya Arik, Ph.D. Tennessee Housing Development Agency TABLE OF CONTENTS
Credit Research Center Seminar
 Credit Research Center Seminar Ensuring Fair Lending: What Do We Know about Pricing in Mortgage Markets and What Will the New HMDA Data Fields Tell US? www.msb.edu/prog/crc March 14, 2005 Introduction
The Economic Crisis. A Report on Memphis Real Estate, the Mortgage Meltdown and the Impact on the Local Economy
 The Economic Crisis A Report on Memphis Real Estate, the Mortgage Meltdown and the Impact on the Local Economy December 2, 2008 The FedEx Institute of Technology at The University of Memphis Chandler Reports
The High Cost of Segregation: Exploring the Relationship Between Racial Segregation and Subprime Lending
 F u r m a n C e n t e r f o r r e a l e s t a t e & u r b a n p o l i c y N e w Y o r k U n i v e r s i t y s c h o o l o f l aw wa g n e r s c h o o l o f p u b l i c s e r v i c e n o v e m b e r 2 0
Who is Lending and Who is Getting Loans?
 Trends in 1-4 Family Lending in New York City An ANHD White Paper February 2016 As much as New York City is a city of renters, nearly a third of New Yorkers own their own homes. Responsible, affordable
Home Mortgage Disclosure Act Report ( ) Submitted by Jonathan M. Cabral, AICP
 Submitted by Jonathan M. Cabral, AICP") Home Mortgage Disclosure Act Report (2008-2015) Submitted by Jonathan M. Cabral, AICP Introduction This report provides a review of the single family (1-to-4 units) mortgage lending activity in Connecticut
Home Mortgage Disclosure Act Report (2008-2015) Submitted by Jonathan M. Cabral, AICP Introduction This report provides a review of the single family (1-to-4 units) mortgage lending activity in Connecticut
Identifying, Assessing and Mitigating Potential Redlining Risk
 Identifying, Assessing and Mitigating Potential Redlining Risk Objectives Understanding Potential Redlining Risk Understanding the Reasonable Expected Market Area (REMA) vs CRA Assessment Area Understanding
BROWARD HOUSING COUNCIL CRA PERFORMANCE BY BROWARD BANKS IN MEETING HOUSING CREDIT NEEDS
 BROWARD HOUSING COUNCIL CRA PERFORMANCE BY BROWARD BANKS IN MEETING HOUSING CREDIT NEEDS CRA IMPLEMENTATION WORKSHOP January 23, 2015 2 South Florida Context Areas of Opportunity Overview of HMDA Data
Lake County Community Lending Factbook
 Lake County Community Lending Factbook SAMANTHA HOOVER CARRIE PLEASANTS July 2009 HOUSING RESEARCH & ADVOCACY CENTER 3631 PERKINS AVENUE, #3A-2 CLEVELAND, OHIO 44114 (216) 361-9240 (PHONE) (216) 426-1290
Opportunities and Issues in Using HMDA Data
 Opportunities and Issues in Using HMDA Data Authors Robert B. Avery, Kenneth P. Brevoort, and Glenn B. Canner Abstract Since 1975, the Home Mortgage Disclosure Act (HMDA) has required most mortgage lending
ONLINE APPENDIX. The Vulnerability of Minority Homeowners in the Housing Boom and Bust. Patrick Bayer Fernando Ferreira Stephen L Ross
 ONLINE APPENDIX The Vulnerability of Minority Homeowners in the Housing Boom and Bust Patrick Bayer Fernando Ferreira Stephen L Ross Appendix A: Supplementary Tables for The Vulnerability of Minority Homeowners
FEDERAL RESERVE SYSTEM. 12 CFR Part 203. [Regulation C; Docket No. R-1186] HOME MORTGAGE DISCLOSURE
![FEDERAL RESERVE SYSTEM. 12 CFR Part 203. [Regulation C; Docket No. R-1186] HOME MORTGAGE DISCLOSURE](/thumbs/89/97922501.jpg "FEDERAL RESERVE SYSTEM. 12 CFR Part 203. [Regulation C; Docket No. R-1186] HOME MORTGAGE DISCLOSURE") FEDERAL RESERVE SYSTEM 12 CFR Part 203 [Regulation C; Docket No. R-1186] HOME MORTGAGE DISCLOSURE AGENCY: Board of Governors of the Federal Reserve System. ACTION: Request for comment on revised formats
FEDERAL RESERVE SYSTEM 12 CFR Part 203 [Regulation C; Docket No. R-1186] HOME MORTGAGE DISCLOSURE AGENCY: Board of Governors of the Federal Reserve System. ACTION: Request for comment on revised formats
FREQUENTLY ASKED QUESTIONS ABOUT THE NEW HMDA DATA. General Background
 Federal Reserve Bank of New York Statistics Function March 31, 2005 FREQUENTLY ASKED QUESTIONS ABOUT THE NEW HMDA DATA General Background 1. What is the Home Mortgage Disclosure Act (HMDA)? HMDA, enacted
Credit history Bad credit history can discourage an individual s chances of being approved for a loan.
 history Bad credit history can discourage an individual s chances of being approved for a loan. Collateral This is any asset that can be converted to a cash value that can be used to secure a loan. Collateral
PUBLIC DISCLOSURE COMMUNITY REINVESTMENT ACT PERFORMANCE EVALUATION
 PUBLIC DISCLOSURE February 25, 2008 COMMUNITY REINVESTMENT ACT PERFORMANCE EVALUATION Patriot Bank RSSD# 3120646 8376 Highway 51 North Millington, Tennessee 38053 Federal Reserve Bank of St. Louis P.O.
Fair Lending Examination Procedures Summary and Risk Factors Table
 Federal Reserve Bank of Dallas Fair Lending Examination Procedures Summary and Risk Factors Table This publication is intended as a summary of the Fair Lending Examination Procedures. Also included is
Increasing homeownership among
 Subprime Lending and Foreclosure in Hennepin and Ramsey Counties: An Empirical Analysis by Jeff Crump Increasing homeownership among low-income and minority communities is a major goal of housing policy
Executive DataBook 2014 ORIGINATION TRENDS
 ONE VOICE. ONE VISION. ONE RESOURCE. Executive DataBook 2014 ORIGINATION TRENDS Prepared by MBA Research & Economics mba.org/research 15531 Executive DataBook 2014 ORIGINATION TRENDS Prepared by MBA Research
HMDA Workshop Part IV: Fair Lending & HMDA
 HMDA Workshop Part IV: Fair Lending & HMDA Sunday, Sept. 18, 2016, 4:45 pm Moderator: Richard H. Harvey, Jr., Chief Compliance Officer, Colonial Savings, F.A. Panelists: Melanie Brody, Partner, Mayer Brown
APPENDICES Fair Housing and Equity Assessment
 APPENDICES 77 APPENDIX A: DATA TABLES Data is provided for Racially Concentrated Areas of Poverty (RCAPs) and Opportunity Areas (OAs). The RCAPs, as defined in Chapter 3, include: RCAP 1: West Kansas City,
Major Changes Looming for HMDA Reporting
 Major Changes Looming for HMDA Reporting CLIENT ALERT September 25, 2017 Scott D. Samlin samlins@pepperlaw.com Mark T. Dabertin dabertinm@pepperlaw.com In this article, we review the requirements of the
PUBLIC DISCLOSURE COMMUNITY REINVESTMENT ACT PERFORMANCE EVALUATION
 PUBLIC DISCLOSURE April 5, 2010 COMMUNITY REINVESTMENT ACT PERFORMANCE EVALUATION The Callaway Bank RSSD #719656 5 East Fifth Street Fulton, Missouri 65251 Federal Reserve Bank of St. Louis P.O. Box 442
Why is Non-Bank Lending Highest in Communities of Color?
 Why is Non-Bank Lending Highest in Communities of Color? An ANHD White Paper October 2017 New York is a city of renters, but nearly a third of New Yorkers own their own homes. The stock of 2-4 family homes
Despite Growing Market, African Americans and Latinos Remain Underserved
 Despite Growing Market, African Americans and Latinos Remain Underserved Issue Brief September 2017 Introduction Enacted by Congress in 1975, the Home Mortgage Disclosure Act (HMDA) requires an annual
COMMUNITY REINVESTMENT ACT PERFORMANCE EVALUATION
 PUBLIC DISCLOSURE Date of Evaluation: MARCH 09, 2015 COMMUNITY REINVESTMENT ACT PERFORMANCE EVALUATION Name of Depository Institution: UNIVEST BANK AND TRUST Co. Institution s Identification Number: 354310
May 17, Housing Sector Overview
 May 17, 2017 Housing Sector Overview Housing Finance Policy Center May 17, 2017 AFFORDABLE HOUSING: In general, housing for which the occupant(s) is/are paying no more than 30 percent of his or her income
S (a) Impact Data. Unchanged Value 01 Record Identifier x 01 Legal Entity Identifier (LEI) 02 Legal Entity Identifier (LEI) x
 Impact Data. Unchanged Value 01 Record Identifier x 01 Legal Entity Identifier (LEI) 02 Legal Entity Identifier (LEI) x") Eempt 01 Record Identifier 01 Legal Entity Identifier (LEI) 02 Legal Entity Identifier (LEI) 02 Universal Loan Identifier (ULI) / Non Universal Loan Identifier (NULI) 03 Universal Loan Identifier (ULI)
Eempt 01 Record Identifier 01 Legal Entity Identifier (LEI) 02 Legal Entity Identifier (LEI) 02 Universal Loan Identifier (ULI) / Non Universal Loan Identifier (NULI) 03 Universal Loan Identifier (ULI)
COMMUNITY REINVESTMENT ACT PERFORMANCE EVALUATION
 PUBLIC DISCLOSURE June 2, 2008 COMMUNITY REINVESTMENT ACT PERFORMANCE EVALUATION Legacy Bank & Trust Company RSSD # 397755 10603 Highway 32 P.O. Box D Plato, Missouri 65552 Federal Reserve Bank of St.
Foreclosures on Non-Owner-Occupied Properties in Ohio s Cuyahoga County: Evidence from Mortgages Originated in
 FEDERAL RESERVE BANK OF MINNEAPOLIS COMMUNITY AFFAIRS REPORT Report No. 2010-2 Foreclosures on Non-Owner-Occupied Properties in Ohio s Cuyahoga County: Evidence from Mortgages Originated in 2005 2006 Richard
New Jersey Bankers Association 2017 Compliance University Fair Lending Redlining Risks
 New Jersey Bankers Association 2017 Compliance University Fair Lending Redlining Risks June 14, 2017 Presented by Rose N. Egbuiwe, Fair Lending Examination Specialist 1 Objectives Provide Insight on Fair
HOW HAS STATE LEGISLATION AFFECTED THE NORTH CAROLINA MORTGAGE MARKET?
 HOW HAS STATE LEGISLATION AFFECTED THE NORTH CAROLINA MORTGAGE MARKET? PRESENTED TO THE CONSUMER / REAL ESTATE LENDING LAW FORUM MECKLENBURG COUNTY BAR ASSOCIATION Joseph A. Smith, Jr. North Carolina Commissioner
LISC Building Sustainable Communities Initiative Neighborhood Quality Monitoring Report
 LISC Building Sustainable Communities Initiative Neighborhood Quality Monitoring Report Neighborhood:, Kansas City, MO The LISC Building Sustainable Communities (BSC) Initiative supports community efforts
Fewer Applications, Falling Denial Rates
 August 2016 Fewer Applications, Falling Denial Rates Identifying Home Loan Trends in Tennessee from Home Mortgage Disclosure Act (HMDA) Data Hulya Arik, Ph.D. Tennessee Housing Development Agency TABLE
Compliance Policy 2003-ALL
 Overview The following policy describes how CMG Mortgage, Inc., dba CMG Financial, NMLS #1820, ( CMG ) complies with the Home Mortgage Disclosure Act (HMDA) and its implementing regulation, Regulation
PUBLIC DISCLOSURE COMMUNITY REINVESTMENT ACT PERFORMANCE EVALUATION
 PUBLIC DISCLOSURE July 15, 2013 COMMUNITY REINVESTMENT ACT PERFORMANCE EVALUATION Meridian Bank Texas Certificate Number: 11895 100 Lexington Street, Suite 100 Fort Worth, Texas 76102 Federal Deposit Insurance
PUBLIC DISCLOSURE COMMUNITY REINVESTMENT ACT PERFORMANCE EVALUATION
 PUBLIC DISCLOSURE January 19, 2016 COMMUNITY REINVESTMENT ACT PERFORMANCE EVALUATION RSSD# 856748 200 South Third Street Batesville, Arkansas 72501 Federal Reserve Bank of St. Louis P.O. Box 442 St. Louis,
RURAL RESEARCH NOTE HOUSING ASSISTANCE COUNCIL RURAL MORTGAGE ACTIVITY DECLINES. HOME PURCHASES ARE UP, BUT SO ARE HIGH COST LOANS.
 RURAL RESEARCH NOTE HOUSING ASSISTANCE COUNCIL The Housing Assistance Council (HAC) is a national nonprofit organization that supports affordable housing efforts in rural areas of the United States. HAC
PUBLIC DISCLOSURE COMMUNITY REINVESTMENT ACT PERFORMANCE EVALUATION
 PUBLIC DISCLOSURE August 1, 2011 COMMUNITY REINVESTMENT ACT PERFORMANCE EVALUATION Empire State Bank RSSD No. 3277241 68 North Plank Road Newburgh, New York 12550 FEDERAL RESERVE BANK OF NEW YORK 33 LIBERTY
Remarks by Governor Edward M. Gramlich At the Financial Services Roundtable Annual Housing Policy Meeting, Chicago, Illinois May 21, 2004
 Remarks by Governor Edward M. Gramlich At the Financial Services Roundtable Annual Housing Policy Meeting, Chicago, Illinois May 21, 2004 Subprime Mortgage Lending: Benefits, Costs, and Challenges One
A Look Behind the Numbers: Foreclosures in Allegheny County, PA
 Page1 Introduction This is the second report in a series that looks at the geographic distribution of foreclosures in counties located within the Federal Reserve s Fourth District. In this report we focus
Filing instructions guide for HMDA data collected in 2018
 August 2017 Filing instructions guide for HMDA data collected in 2018 OMB Control #3170-0008 Version log The following is a version log that tracks the history of this document and its updates: Date Version
COMMUNITY REINVESTMENT ACT PERFORMANCE EVALUATION
 PUBLIC DISCLOSURE August 24, 2009 COMMUNITY REINVESTMENT ACT PERFORMANCE EVALUATION First State Bank of Red Bud RSSD # 356949 115 West Market Street Red Bud, Illinois 62278 Federal Reserve Bank of St.
A Guide to Data File Extracts
 A Guide to Data File Extracts MARQUIS 5160 Tennyson Parkway Suite 1000E Plano, TX 75024 Technical Support: (800) 627-5388 Sales/Training/Consulting: (800) 365-4274 www.gomarquis.com 1 Copyright 1996-2014.
HMDA LAR Fields Effective 1/1/2018 Comparison with Current HMDA Fields - Updated 7/17/2016 Current Field New/Revised Field
 Current New/Revised Record Identifier Record Identifier 2 2 software may enter this value or bank will enter on every line of LAR this entry is on every line No change Respondent ID Value depends upon
THE EFFECTS OF THE COMMUNITY REINVESTMENT ACT (CRA) ON MORTGAGE LENDING IN THE PHILADELPHIA MARKET
 ON MORTGAGE LENDING IN THE PHILADELPHIA MARKET") A PRACTITIONER S SUMMARY THE EFFECTS OF THE COMMUNITY REINVESTMENT ACT (CRA) ON MORTGAGE LENDING IN THE PHILADELPHIA MARKET Lei Ding and Kyle DeMaria* June 217 * Community Development Studies & Education
A PRACTITIONER S SUMMARY THE EFFECTS OF THE COMMUNITY REINVESTMENT ACT (CRA) ON MORTGAGE LENDING IN THE PHILADELPHIA MARKET Lei Ding and Kyle DeMaria* June 217 * Community Development Studies & Education
REINVESTMENT ALERT. Woodstock Institute November, 1997 Number 11
 REINVESTMENT ALERT Woodstock Institute November, 1997 Number 11 New Small Business Data Show Loans Going To Higher-Income Neighborhoods in Chicago Area In October, federal banking regulators released new
PUBLIC DISCLOSURE. June 4, 2012 COMMUNITY REINVESTMENT ACT PERFORMANCE EVALUATION. Utah Independent Bank RSSD #
 PUBLIC DISCLOSURE June 4, 2012 COMMUNITY REINVESTMENT ACT PERFORMANCE EVALUATION Utah Independent RSSD # 256179 55 South State Street Salina, Utah 84654 Federal Reserve of San Francisco 101 Market Street
A Nation of Renters? Promoting Homeownership Post-Crisis. Roberto G. Quercia Kevin A. Park
 A Nation of Renters? Promoting Homeownership Post-Crisis Roberto G. Quercia Kevin A. Park 2 Outline of Presentation Why homeownership? The scale of the foreclosure crisis today (20112Q) Mississippi and
A LOOK BEHIND THE NUMBERS
 KEY FINDINGS A LOOK BEHIND THE NUMBERS Home Lending in Cuyahoga County Neighborhoods Lisa Nelson Community Development Advisor Federal Reserve Bank of Cleveland Prior to the Great Recession, home mortgage
The Untold Costs of Subprime Lending: Communities of Color in California. Carolina Reid. Federal Reserve Bank of San Francisco.
 The Untold Costs of Subprime Lending: The Impacts of Foreclosure on Communities of Color in California Carolina Reid Federal Reserve Bank of San Francisco April 10, 2009 The views expressed herein are
Implications and Risks of New HMDA Data Disclosure
 Implications and Risks of New HMDA Data Disclosure By David Skanderson, Ph.D. January 2018 A version of this paper appeared in ABA Bank Compliance, January/February 2018 The conclusions set forth herein
UNITED STATES DISTRICT COURT FOR THE WESTERN DISTRICT OF TENNESSEE WESTERN DIVISION
 Case 2:09-cv-02857-dkv Document 1 Filed 12/30/09 Page 1 of 56 UNITED STATES DISTRICT COURT FOR THE WESTERN DISTRICT OF TENNESSEE WESTERN DIVISION ) CITY OF MEMPHIS ) 125 N. Main Street, Room 336 ) Memphis,
PUBLIC DISCLOSURE COMMUNITY REINVESTMENT ACT PERFORMANCE EVALUATION
 PUBLIC DISCLOSURE September 17, 2007 COMMUNITY REINVESTMENT ACT PERFORMANCE EVALUATION Belgrade State Bank RSSD #761244 410 Main Street Belgrade, Missouri 63622 Federal Reserve Bank of St. Louis P.O. Box
2015 Mortgage Lending Trends in New England
 Federal Reserve Bank of Boston Community Development Issue Brief No. 2017-3 May 2017 2015 Mortgage Lending Trends in New England Amy Higgins Abstract In 2014 the mortgage and housing market underwent important
UNITED STATES DISTRICT COURT FOR THE WESTERN DISTRICT OF TENNESSEE WESTERN DIVISION
 Case 2:09-cv-02857-STA-dkv Document 29 Filed 04/07/10 Page 1 of 83 UNITED STATES DISTRICT COURT FOR THE WESTERN DISTRICT OF TENNESSEE WESTERN DIVISION ) CITY OF MEMPHIS ) 125 N. Main Street, Room 336 )
during the Financial Crisis
 Minority borrowers, Subprime lending and Foreclosures during the Financial Crisis Stephen L Ross University of Connecticut The work presented is joint with Patrick Bayer, Fernando Ferreira and/or Yuan
The Effect of GSEs, CRA, and Institutional. Characteristics on Home Mortgage Lending to. Underserved Markets
 The Effect of GSEs, CRA, and Institutional Characteristics on Home Mortgage Lending to Underserved Markets HUD Final Report Richard Williams, University of Notre Dame December 1999 Direct all inquiries
PUBLIC DISCLOSURE COMMUNITY REINVESTMENT ACT PERFORMANCE EVALUATION
 PUBLIC DISCLOSURE March 2, 2015 COMMUNITY REINVESTMENT ACT PERFORMANCE EVALUATION Stifel Bank and Trust RSSD# 3076248 501 North Broadway St. Louis, Missouri 63102 Federal Reserve Bank of St. Louis P.O.
Race and Housing in Pennsylvania
 w w w. t r f u n d. c o m About this Paper TRF created a data warehouse and mapping tool for the Pennsylvania Housing Finance Agency (PHFA). In follow-up to this work, PHFA commissioned TRF to analyze
Subprime Lending in Washington State
 sound research. Bold Solutions.. Policy BrieF. March 9, 2009 The High Cost of Subprime Lending in Washington State By Jeff Chapman Executive Summary In Washington State in 2006, African- American and Hispanic
Econ 321 Group Project EVIDENCE OF DISCRIMINATION IN MORTGAGE LENDING B Y H E L E N F. L A D D
 Econ 321 Group Project EVIDENCE OF DISCRIMINATION IN MORTGAGE LENDING B Y H E L E N F. L A D D Goals of Paper Show that discrimination models can prove that there is discrimination in mortgage lending
PUBLIC DISCLOSURE COMMUNITY REINVESTMENT ACT PERFORMANCE EVALUATION
 PUBLIC DISCLOSURE August 25, 2003 COMMUNITY REINVESTMENT ACT PERFORMANCE EVALUATION ORANGE COUNTY TRUST COMPANY RSSD 176101 212 Dolson Avenue Middletown, New York 10940 FEDERAL RESERVE BANK OF NEW YORK
Comment Call (14-15) CFPB Home Mortgage Disclosure Act (HMDA)
 CFPB Home Mortgage Disclosure Act (HMDA)") Comment Call (14-15) CFPB Home Mortgage Disclosure Act (HMDA) Impact: Federal and State Chartered Credit Unions Relevant Department: CEO / Lending Priority Level: High Background / Credit Union Summary
Comment Call (14-15) CFPB Home Mortgage Disclosure Act (HMDA) Impact: Federal and State Chartered Credit Unions Relevant Department: CEO / Lending Priority Level: High Background / Credit Union Summary
City of Cleveland Community Lending Factbook
 City of Cleveland Community Lending Factbook KRISSIE WELLS CARRIE PLEASANTS September 2010 HOUSING RESEARCH & ADVOCACY CENTER 3631 PERKINS AVENUE, #3A-2 CLEVELAND, OHIO 44114 (216) 361-9240 (PHONE) (216)
Subprime Originations and Foreclosures in New York State: A Case Study of Nassau, Suffolk, and Westchester Counties.
 Subprime Originations and Foreclosures in New York State: A Case Study of Nassau, Suffolk, and Westchester Counties Cambridge, MA Lexington, MA Hadley, MA Bethesda, MD Washington, DC Chicago, IL Cairo,
Challenges and Opportunities for Low Downpayment Lending
 Challenges and Opportunities for Low Downpayment Lending Roberto G. Quercia UNC Center for Community Capital University of North Carolina at Chapel Hill Chapel Hill NC, May 17, 2013 Research Funded by
Home Mortgage Disclosure Act (HMDA) 2014 FIS and/or its subsidiaries. All Rights Reserved.
 2014 FIS and/or its subsidiaries. All Rights Reserved.") Home Mortgage Disclosure Act (HMDA) 2014 FIS and/or its subsidiaries. All Rights Reserved. 1 Home Mortgage Disclosure Act (HMDA) 12 CFR 1003 Purpose: Detect illegal discrimination Detect predatory lending
Home Mortgage Disclosure Act (HMDA) 2014 FIS and/or its subsidiaries. All Rights Reserved. 1 Home Mortgage Disclosure Act (HMDA) 12 CFR 1003 Purpose: Detect illegal discrimination Detect predatory lending
Consumer Financial Protection Bureau. March 15, Draft, Sensitive and Pre-Decisional Not for External Distribution
 Consumer Financial Protection Bureau March 15, 2016 Draft, Sensitive and Pre-Decisional Not for External Distribution Outline Home Mortgage Disclosure Act 1) Background 2) Rule Making 3) Changes Coming
PUBLIC DISCLOSURE. September 27, 2004 COMMUNITY REINVESTMENT ACT PERFORMANCE EVALUATION. BPD Bank RSSD No
 PUBLIC DISCLOSURE September 27, 2004 COMMUNITY REINVESTMENT ACT PERFORMANCE EVALUATION RSSD No. 66015 90 BROAD STREET NEW YORK, NEW YORK 10045 Federal Reserve Bank of New York 33 Liberty Street New York,
When comparing this study s results with the HMDA data to the results found in the previous 2001 report, small changes have been found.
 172 173 174 175 Comparisons to Previous Findings When comparing this study s results with the HMDA data to the results found in the previous 2001 report, small changes have been found. Race/Ethnicity When
PUBLIC DISCLOSURE COMMUNITY REINVESTMENT ACT PERFORMANCE EVALUATION
 PUBLIC DISCLOSURE November 5, 2003 COMMUNITY REINVESTMENT ACT PERFORMANCE EVALUATION RSSD No. 236706 158 U.S. Highway 206 North Gladstone, New Jersey 07934 Federal Reserve of New York 33 Liberty Street
PUBLIC DISCLOSURE COMMUNITY REINVESTMENT ACT PERFORMANCE EVALUATION
 PUBLIC DISCLOSURE October 31, 2005 COMMUNITY REINVESTMENT ACT PERFORMANCE EVALUATION RSSD No. 236706 158 U.S. Highway 206 North Gladstone, New Jersey 07934 Federal Reserve of New York 33 Liberty Street
COMMUNITY REINVESTMENT ACT PERFORMANCE EVALUATION
 PUBLIC DISCLOSURE December 6, 2010 COMMUNITY REINVESTMENT ACT PERFORMANCE EVALUATION Alden State Bank RSSD No. 414102 13216 Broadway Alden, New York 14004 FEDERAL RESERVE BANK OF NEW YORK 33 LIBERTY STREET
PUBLIC DISCLOSURE. October 10, 2006 COMMUNITY REINVESTMENT ACT PERFORMANCE EVALUATION. BPD BANK RSSD No
 PUBLIC DISCLOSURE October 10, 2006 COMMUNITY REINVESTMENT ACT PERFORMANCE EVALUATION BPD BANK RSSD No. 66015 90 BROAD STREET NEW YORK, NEW YORK 10004 Federal Reserve Bank of New York 33 Liberty Street
CFPB Consumer Laws and Regulations
 Consumer Laws and Regulations Home Mortgage Disclosure Act 1 The Home Mortgage Disclosure Act () was enacted by the Congress in 1975 and is implemented by Regulation C (12 CFR Part 1003). 2 The period
To learn about navigation and other features of this e-learning course, click Help. Click Next to continue to the next page.
 Welcome to Fair Lending Practices Extending credit is a cornerstone of banking. Because of the need society has for lending and credit, Congress has passed a number of acts ensuring that banks distribute
Expanding Homeownership Responsibly with Freddie Mac Home Possible. Nadja Vital MBA Central FL, Nov.8, 2017
 Expanding Homeownership Responsibly with Freddie Mac Home Possible Nadja Vital MBA Central FL, Nov.8, 2017 A Better Freddie Mac and a better housing finance system For families...innovating to improve
Compliance Challenges in a Changing Economic Environment
 Compliance Challenges in a Changing Economic Environment Call the Fed Audio Conference December 10, 2008 The following presentation contains the views and opinions of the speakers and his or her interpretation
PUBLIC DISCLOSURE COMMUNITY REINVESTMENT ACT PERFORMANCE EVALUATION
 CapitalMark Bank & Trust CRA PUBLIC EVALUATION PUBLIC DISCLOSURE May 7, 2012 COMMUNITY REINVESTMENT ACT PERFORMANCE EVALUATION CapitalMark Bank &Trust 801 Broad Street Chattanooga, Tennessee 37402 RSSD
PUBLIC DISCLOSURE COMMUNITY REINVESTMENT ACT PERFORMANCE EVALUATION
 PUBLIC DISCLOSURE November 26, 2012 COMMUNITY REINVESTMENT ACT PERFORMANCE EVALUATION Southern Bancorp Bank RSSD# 852544 601 Main Street Arkadelphia, Arkansas 71923 Federal Reserve Bank of St. Louis P.O.
Update On Mortgage Originations, Delinquency and Foreclosures In Maryland
 Update On Mortgage Originations, Delinquency and Foreclosures In Maryland The Reinvestment Fund builds wealth and opportunity for low-wealth people and places through the promotion of socially and environmentally
HMDA Regulations and New 1003 Application - Part 2
 HMDA Regulations and New 1003 Application - Part 2 Broker / Correspondent Training May 10 & 12, 2017 1Nations Direct Mortgage Agenda Overview of New Regulations New and Modified HMDA Data Fields Detail
The Foreclosure Crisis in NYC: Patterns, Origins, and Solutions. Ingrid Gould Ellen
 The Foreclosure Crisis in NYC: Patterns, Origins, and Solutions Ingrid Gould Ellen Reasons for Rise in Foreclosures Risky underwriting Over-leveraged borrowers High debt to income ratios Economic downturn
Fair Lending Risk Management: Lessons from Recent Settlements
 November 2012 Fair Lending Risk Management: Lessons from Recent Settlements Introduction Fair lending continues to be a major enforcement priority of federal agencies, and the financial implications have
Analyzing Trends in Subprime Originations and Foreclosures: A Case Study of the Boston Metro Area
 Analyzing Trends in Originations and : A Case Study of the Boston Metro Area Cambridge, MA Lexington, MA Hadley, MA Bethesda, MD Washington, DC Chicago, IL Cairo, Egypt Johannesburg, South Africa September
PUBLIC DISCLOSURE. March 5, 2012 COMMUNITY REINVESTMENT ACT PERFORMANCE EVALUATION. Bay Commercial Bank RSSD #
 PUBLIC DISCLOSURE March 5, 2012 COMMUNITY REINVESTMENT ACT PERFORMANCE EVALUATION Bay Commercial Bank RSSD # 3281510 1280 Civic Drive, Suite 100 Walnut Creek, California 94596 Federal Reserve Bank of San
Managing Fair and Responsible Lending Challenges and Risks
 Managing Fair and Responsible Lending Challenges and Risks NYBA Technology, Compliance and Risk Management Forum White Plains, NY May 13, 2015 Legal Counsel to the Financial Services Industry Presented
PUBLIC DISCLOSURE COMMUNITY REINVESTMENT ACT PERFORMANCE EVALUATION
 PUBLIC DISCLOSURE January 14, 2008 COMMUNITY REINVESTMENT ACT PERFORMANCE EVALUATION Orange County Trust Company RSSD No. 176101 212 Dolson Avenue Middletown, NY 10940 FEDERAL RESERVE BANK OF NEW YORK
HOUSING FINANCE REFORM DEBATE: HOW CAN THE FHA MEET THE FUTURE NEEDS OF US HOUSING? #LiveAtUrban
 HOUSING FINANCE REFORM DEBATE: HOW CAN THE FHA MEET THE FUTURE NEEDS OF US HOUSING? #LiveAtUrban Mission Critical: Retooling FHA to Meet America s Housing Needs Carol Galante January 9, 2018 FHA: An Important
OVERVIEW OF FORECASTING METHODOLOGY
 OVERVIEW OF FORECASTING METHODOLOGY 2650 106th Street, Suite 200, Urbandale, IA 50323 INTRODUCTION iemergent is a forecasting and advisory firm dedicated to the home lending industry. We provide forward-looking
PUBLIC DISCLOSURE. April 2, 2007 COMMUNITY REINVESTMENT ACT PERFORMANCE EVALUATION. Four Oaks Bank & Trust Company U.S.
 PUBLIC DISCLOSURE April 2, 2007 COMMUNITY REINVESTMENT ACT PERFORMANCE EVALUATION Four Oaks Bank & Trust Company 292524 6144 U.S. Highway 301 South Four Oaks, North Carolina 27524 Federal Reserve Bank
PUBLIC DISCLOSURE COMMUNITY REINVESTMENT ACT PERFORMANCE EVALUATION
 PUBLIC DISCLOSURE February 22, 2010 COMMUNITY REINVESTMENT ACT PERFORMANCE EVALUATION Orange County Trust Company RSSD No. 176101 212 Dolson Avenue Middletown, NY 10940 FEDERAL RESERVE BANK OF NEW YORK
Trend Analysis of Changes to Population and Income in Philadelphia, using American Community Survey (ACS) Data
 Data") OFFICE OF THE PRESIDENT FINANCE AND BUDGET TEAM City Council of Philadelphia 9.22.17 Trend Analysis of Changes to Population and Income in Philadelphia, using 2010-2016 American Community Survey (ACS)
OFFICE OF THE PRESIDENT FINANCE AND BUDGET TEAM City Council of Philadelphia 9.22.17 Trend Analysis of Changes to Population and Income in Philadelphia, using 2010-2016 American Community Survey (ACS)
Fair Lending Risk Management
 Presented by: Martin (Marty) Mitchell, CRCM Managing Director, ProBank Austin Robert J. (Bob) Mullenbach, CRCM Managing Director, Compliance Division Deputy, ProBank Austin Fair Lending Laws ECOA Prohibits
Executive Summary Chapter 1. Conceptual Overview and Study Design
 Executive Summary Chapter 1. Conceptual Overview and Study Design The benefits of homeownership to both individuals and society are well known. It is not surprising, then, that policymakers have adopted
PUBLIC DISCLOSURE COMMUNITY REINVESTMENT ACT PERFORMANCE EVALUATION
 PUBLIC DISCLOSURE December 4, 2006 COMMUNITY REINVESTMENT ACT PERFORMANCE EVALUATION ALDEN STATE BANK RSSD No. 414102 13216 Broadway Alden, New York 14004 FEDERAL RESERVE BANK OF NEW YORK 33 Liberty Street
THDA STIMULUS SECOND MORTGAGE PROGRAM REPORT
 January, 2011 STIMULUS SECOND MORTGE PROAM REPORT Hulya Arik, Ph.D., Research Coordinator DIVISION OF RESEARCH, PLANNING & TECHNICAL SERVICES Tennessee Housing Development Agency 404 James Robertson Parkway,
PUBLIC DISCLOSURE COMMUNITY REINVESTMENT ACT PERFORMANCE EVALUATION
 PUBLIC DISCLOSURE March 10, 2008 COMMUNITY REINVESTMENT ACT PERFORMANCE EVALUATION Tioga State Bank RSSD No. 910118 1 Main Street P.O. Box 386 Spencer, NY 14883 FEDERAL RESERVE BANK OF NEW YORK 33 LIBERTY
Technical Report Series
 Technical Report Series : Statistics from the National Survey of Mortgage Originations Updated March 21, 2017 This document was prepared by Robert B. Avery, Mary F. Bilinski, Brian K. Bucks, Christine
State of the Housing Market
 State of the Housing Market 2 Freddie Mac s Mission Freddie Mac makes homeownership and rental housing more accessible and affordable by providing liquidity, stability, and affordability to the U.S. housing