Feasibility study for the setting up of a Credit Loan Guarantee Scheme (CLGS) for Micro, Small and Medium Enterprises in Yemen
|
|
|
- Milo Booker
- 6 years ago
- Views:
Transcription

1 Feasibility study for the setting up of a Credit Loan Guarantee Scheme (CLGS) for Micro, Small and Medium Enterprises in Yemen Workshop December 4, 2013 Sana a, Yemen
2 OBJECTIVES To assess the needs for the setting up of a CLGS for MSMEs in Yemen, and to assess its feasibility under current legal, economic, and political circumstances. If the feasibility assessment is positive, to propose a viable structure(s) to set up a CLGS in Yemen.
3 PRELIMINARY FINDINGS Yemen remains one of the poorest of the world s low-income countries; more than 45 percent of the population lives in poverty Unemployment is very high Declining oil reserves and water shortages Chronic challenges from secessionists, unruly tribes and Islamist extremists Judicial system in Yemen not efficient Corruption is everywhere!! The banking sector, in particular, is underdeveloped The economy is cash based Banking sector is profitable despite high NPL ratio of 23.5% (78.2% of NPLs covered by provisions) Strong microfinance network
4 IMPORTANCE OF THE FINANCIAL SECTOR The absence of a robust credit market is one of the most significant impediments to development in developing countries. Economic activity is severely limited by the difficulties of entrepreneurs, small businesses and individuals to access to loans under market conditions. Credit to the private sector plays a very important role in economic growth and developed countries show higher rates of growth, largely due to the fact that they have a much more developed financial sector. The result is an increase in per capita income.
5 Niger Madagascar Afghanistan Mali Bangladesh Kenya Senegal Djibouti Yemen Vietnam Sudan India Bolivia Egypt Syria Morocco Indonesia Iraq Albania Tunisia Iran Jordan Algeria China Colombia South Africa Lebanon Libya Mexico Turkey Venezuela Argentina Brazil Croatia Chile Bahrein Saudi Arabia Czech Republic Korea Portugal Oman Greece Cyprus Israel Spain Hong Kong Italy UK France Germany United Arab Emirates Japan Belgium Ireland USA Finland Austria Netherlands Canada Sweden Denmark San Marino Australia Kuwait Switzerland Qatar Luxembourg Percentage of GDP US Dollars 500,00 450,00 400,00 Credit to private sector as % of GDP & GDP per capita ,00 300, , ,00 150, , ,00 0,00 - Source: IMF, International Financial Statistics, Bankscope 2011 Credit as % of GDP GDP per capita, US Dollars Source: IMF, International Financial Statistics, Bankscope 2011
6 MICRO, SMALL AND MEDIUM SIZE ENTERPRISES
7 PROYECT DEFINITION OF MSMSs Micro enterprises: up to 5 employees Small-size enterprises (SEs): up to 10 employees Medium-size enterprises (MEs): up to 50 employees
8 CHARACTERISTICS OF MICRO, SMALL AND MEDIUM SIZE ENTERPRISES MSMEs constitute an important segment of the economy in all countries for their contribution to national productivity, employment generation and poverty reduction. MSMEs are much more flexible than large corporations, they adapt faster to economic and social changes and they are found in almost all activities. MSMEs require less capital to start up and they are usually the idea of a young entrepreneur, willing to risk his/her small savings.
9 ROLE OF SMEs in selected countries Country Share as a % of total enterprises Share in employment Argentina Bahrain Brazil Canada Chile Colombia El Salvador France Germany Greece Japan Jordan Korea Lebanon Mexico Peru Syria Taiwan Thailand USA Venezuela Yemen Source: Importance of SMEs and growth obstacles World Business Environment Survey, 2010, World Bank
10 MAIN CONSTRAINTS FOR THE DEVELOPMENT OF MSMEs MSMEs lack access to advanced technologies, world markets, financial capital and managerial skills. These are the main objectives of public policies all over the world, supported by multilateral organizations.


11 MICRO, SMALL AND MEDIUM SIZE ENTERPRISES Number of Enterprises Micro enterprises: Medium enterprises: Source: IFC-Report-2007 Small enterprises: Farmers: Source: IFC- Report 2007

12 MICRO, SMALL AND MEDIUM SIZE ENTERPRISES Economic Activities of SMEs 14,30 % Trade 66 % Services 20,70 % Production 14,30 % 20,70 % 66 % Source: IFC- Report 2007

13 Main Constraints to their Development in Yemen The World Bank, Enterprise Surveys: YEMEN -2010
14 RELATIONS WITH THE FINANCIAL SECTOR Most small entrepreneurs lack any information about financial products and services. Yemeni commercial banks do not actively market services to MSMEs and have a reputation of serving only the big companies and big families of the country. A significant number of micro and small business owners are unaware even of the existence of formal loans. An even greater number are unaware that they might qualify for a loan, whether with a bank, a microfinance institution (MFI), or the government s Small Enterprise Development Fund (SEDF). Source: IFC ASSESSMENT OF MSE FINANCIAL NEEDS IN YEMEN FINAL REPORT DECEMBER 2007
15 DIFFICULTIES TO FINANCE GROWTH The biggest obstacles to obtaining formal loans is lack of a guarantee (59.5 percent of the interviewed by IFC, 2007) high interest rates (46.4 percent) religious reasons (45.8 percent) 52.6 percent of the enterprises surveyed would like to obtain a loan in the future. Overall MSE loan demand in Yemen was estimated at USD 526 million.

16 SMEs FINANCE IFC- Yemen Country Profile 2010
17 SMEs FINANCE INDICATORS Finance Indicators INDICATOR Yemen Small Firms Medium Large Firms Middle East Low income Internal Finance for Investment (%) Bank Finance for Investment (%) Credit Financing for Investment (%) Equity, Sale of Stock For Investment (%) Other Financing for Investment (%) Working Capital External Financing (%) Value of Collateral Needed for a Loan (% of the Loan Amount) % of Firms With Bank Loans/line of Credit % of Firms With a Checking or Savings Account Enterprise Surveys: YEMEN The World Bank
18 FINANCIAL SECTOR IN YEMEN
19 14 commercial banks (10 private banks, 4 public sector banks) and 3 Islamic banks 12 MFIs under the umbrella of SMED + a number of NGOs No leasing companies in existence 4 pension funds serving different sectors of the economy Supervisory Body: Central Bank of Yemen
20 BALANCE SHEET OF BANKS The consolidated balance sheet of commercial and Islamic banks at the end of August 2013 amounted to 2,608.3 billion Rials Total credits and loans to the private sector amounted to billion Rials Treasury bills and Repos operations amounted to 1,059.6 billion Rials Total deposits amounted to 2,074.5 billion Rials at the end of August 2013 The consolidated equity was billion Rials
21 THE CREDIT MARKET IN YEMEN The credit market in Yemen has only a limited size: Loans to the private sector are less than 6% of GDP, compared to 13% to the Government. In addition, loans amount to less than 30% of deposits and deposits are only 20% - 25% of GDP. There is excess liquidity to attend the needs of MSMEs. With 210,400 MSMEs seeking to obtain a loan, of which, existing institutions served only 5.9% of the market at that time, overall MSME loan demand in Yemen was estimated at USD 526 million, using an average of USD 2,500 per loan (IFC- Report 2007).

22 Source: CBY
23 International Comparison Private Sector Credit, 2012 (Percent of total deposits) Libya Yemen Algeria Egypt Sudan Jordan Morocco Tunisia Source: Enterprise Surveys: YEMEN The World Bank
24 International Comparison Nonperforming loans to gross loans, 2012 (In percent %) Lebanon Morocco Kuwait Jordan Egypt Yemen Source: Enterprise Surveys: YEMEN The World Bank
25 Banks Performance Date Capital adequacy: Risk-weighted capital adequacy ratio 14,60% 20,20% 24,30% 24,40% Capital (net worth) to Assets 8,20% 9,30% 10,60% 9,50% Portfolio quality: Nonperforming loans to total assets 3,50% 4,20% 4,70% 4,50% Nonperforming loans to gross loans 13,90% 17,70% 21,20% 23,50% Nonperforming loans net of provisions to capital 11,80% 19,20% 12,90% 10,30% Provisions against problem loans / problem loans 70,30% 57,00% 70,60% 78,20% Total capital and reserves / problem loans 251,40% 223,70% 227,50% 211,50% Portfolio performance : Average return on assets 0,90% 1,30% 1,50% 0,90% Average return on equity 9,60% 14,10% 14,20% 9,50% Interest margin to gross income 33,40% 30,50% 33,40% 29,50% Noninterest expenses to gross income 26,40% 21,90% 23,60% 21,50% Trading and fee income to gross income 7,70% 14,10% 12,00% 8,90% Source: Central Bank of Yemen
26 POSSIBLE EXPLANATIONS Poor risk evaluation techniques at banks? (Technical Assistance in capacity building for financial institutions in the areas of credit evaluation and risk management could help) Better investment opportunities (Treasury bills?) Difficulties to recover collateral (legal procedures?) Corruption? Banks are Family businesses?
27 HOW CAN CREDIT GUARANTEE SCHEMES HELP IMPROVE THIS SITUATION? By sharing the risk with banks, credit to SMEs becomes a profitable business Their guarantees complement the collateral offered by SMEs They help improve risk assessment of credits Improve collection of bad loans
28 EXAMPLES OF GUARANTEE SCHEMES Country Institution Year Leverage Established Japan CIC & NFCGC (1995) Germany Bürgschaftsbanken (1994) France SOFARIS (1995) Malaysia CGC Berhad (1995) Taiwan SMBCGF (1994) Korea KCGF (1995) Perú FOGAPI (2001) India DICCG (1994/95) Colombia FNG (2009) ACCION Bridge Fund (2001) RAFAD Asistencia Suiza (1994) Rumania RLGF (2000) Croatia HGA (2001) Brasil SEBRAE (2001) Argentina FOGABA (2001) México Nacional Financiera (2001) Source:The World Bank
29 MENA Partial Credit Guarantee Schemes Country Name Starting date Equity Million US$ Shareholders (%) Government Banks Other Egypt Credit Guarantee Company Jordan Jordanian Loan Guarantee Corp 1994 NA Iraq Iraqi Company For Bank Guarantees Lebanon Kafalat Morocco Caisse Centrale de Garantie Palestine European-Palestinian Credit Guarantee Saudi Saudi Industrial Development Fund Syria Loan Guarantee Institution of Syria Tunisia Sotugar UAE Khalifa Fund 2010 NA Source: A REVIEW OF CREDIT GUARANTEE SCHEMES IN THE MIDDLE EAST AND NORTH AFRICA REGION,The World Bank YOUSSEF SAADANI, ZSOFIA ARVAI AND ROBERTO ROCHA* OCTOBER 2010
30 TYPES OF GUARANTEE FACILITIES (I) Program Public guarantee schemes are established by public policy, nationally or internationally and usually involve state subsidies, especially during the initial periods, and are typically managed by an administrative unit of a government. An advantage of this system is that, in case of loan default, the guarantee is paid out directly from the government budget, although political influence can be an issue. These are often called unfunded guarantee facilities.
31 TYPES OF GUARANTEE FACILITIES (II) Corporate Corporate guarantee schemes are generally financed and operated by the private sector, e.g. banks, chambers of commerce, and can often be a public-private partnership. Corporate guarantee schemes have the advantage of being managed by experienced corporate leaders, and generally benefit from the direct participation of the banking sector. By accessing private funding, these schemes reduce the dependency on public funds, which can sometimes be unstable. These facilities are often referred to as funded guarantee facilities.
32 TYPES OF GUARANTEE FACILITIES (III) Mutual These schemes are also known as mutual guarantee associations, societies or funds. They are private and independent organizations formed and managed by borrowers, often within an industry segment with limited access to bank loans such as taxi drivers, eye glass manufacturers, etc. Although they are largely funded from membership fees, in many instances, they operate with some form of government support. Mutual guarantee schemes benefit from the active involvement and experience of their members.
33 PROPOSED STRUCTURE Description: Public-private corporation private sector (70%), GOY through Ministry of Trade and Industry (30%) It will be called National Guarantee Fund of Yemen, NGFY Non-bank financial institution supervised by the CBY Governance structure board of directors, risk, and audit committees Will provide guarantees to loans made by financial institutions to SMEs The guaranteed portion of the loan will not require provision Audited by independent auditor based on international best-practices By-laws will define shareholder rights and will isolate NGFY from undue influence from GOY and shareholders 12/15/
34 PROPOSED STRUCTURE Why a public-private corporation? Mixed model would show cooperation and a commitment to development and promote shared objectives Mixed model would reduce need for public sector funding and reduce pressure on Government of Yemen to provide services Public sector institution would be more susceptible to political and programmatic influence Private sector only institution would be seen more as an extension of the banks Yemeni market is too small for other models such as mutual credit societies 12/15/
35 OPERATING MECHANISM Financial institutions and National GFY sign a guarantee agreement, including SME eligibility and conditions Banks negotiate loans with eligible SMEs, send an application to the NGFY and if approved, banks disburse and then register loans and pay fees with NGFY NGFY will pay out guaranteed portion in one sum, 30 days after presentation of claim Loan is 90 days past due and bank has initiated legal proceedings NGFY will conduct audit of files to ensure that all conditions were fulfilled Bank will share any recovery with NGFY pari-passu 12/15/

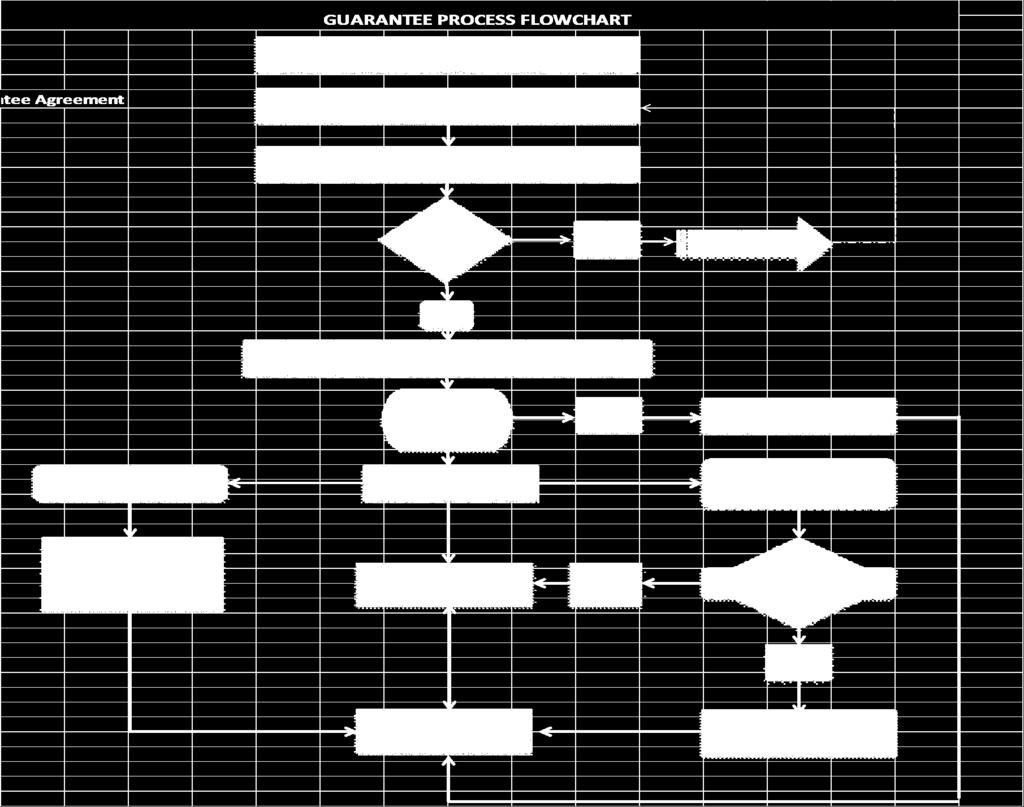
36
37 Mechanism cont d: 50% guarantee on loans up to US$ 100,000 So, Maximum Guarantee amount is US$50,000 Special cases can have up to 70% coverage All types of legal economic and productive activities undertaken by eligible SMEs Special products can be developed for special objectives, ie. Women, vulnerable groups Small staff General Manager, Risk Manager, Guarantee Analyst, IT Manager, Accountant, Executive Assistant, Statistician. 12/15/

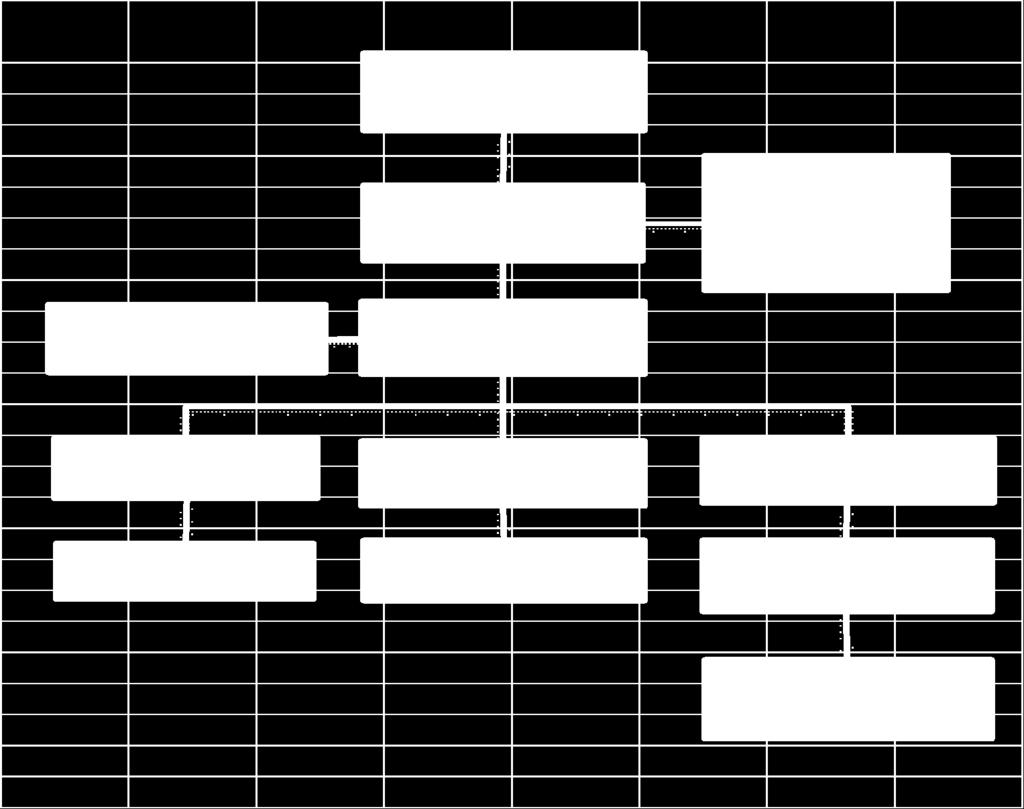
38 Organizational Chart
39 FINANCIAL ASSUMPTIONS (I) Initial Capital US$7.5 million $ 2 million Financial institutions $1 million Government of Yemen $0.5 million Non bank Private sector $4 million Grant Funding from donors (non equity) Technical assistance will require additional grants from donors 12/15/
40 FINANCIAL ASSUMPTIONS (II) Revenues: Interest revenue from Capital invested in T-bills and/or foreign accounts 5% the first two years, dropping to 3.5% per annum after the fourth year Fee revenues from guarantees 1.75% per annum on outstanding loan balance at the beginning of the period Expenses: Operating expenses employees, operations, etc. which will grow 2 percentage points above yearly inflation. Pay-out of loan losses : 5% per annum, starting in the second year of operation, dropping slowly to 4% after the 3rd year of operations Taxes: 16% per annum on profits
41 LEVEL OF ACTIVITY Leverage: 8 times the accumulated capital base and funding contributions from non-shareholders This is the generally accepted current practice for funded programs, with some more institutions moving as high as 10 times.
42 Guarantees issued Using the figures for 2012 as the base line, the following number and value of loans could be achieved in the first year of operations: Institutions Average amount No of loans in US Dollars total SEDF (20% of its total loans) Banks (New loans)20% increase Sub-total MFIs 10% increase Total Source: For microenterprises: SFD. For small enterprises: SEDF, Plan and Support Needs, For Medium size enterprises, CBY
43 GROWTH Bank loans: The guarantee fund will establish a loan range between US$5,000 and US$100,000 Loan size growth: The above amounts increase annually by the Gross Domestic Product (GDP) growth plus the inflation of the previous year. Number of loans: Demand for the guarantees grows quickly initially, at 30% per year, then 20% per year, reducing to 10% per year in the 4th year of operation. Term: 36 months on average.

44 Guaranteed loans will grow steadily
45 US 000,000 The NGFY will attain the maximum leverage (8 times capital and funding base) in the 6th year after start of operations, and will have supported a cumulative lending amount of US$1 billion and 33,136 cumulative loans Guarantee Capacity and Utilization Year Maximum Guarantee Capacity (leverage) = Outstanding Guarantees
46 US 000 Fees will cover claims Fees and Claims Year Total Fees Claims Paid
47 US 000 Claims will start around the third year of operations, which will allow the NGFY to capitalize Profit/(Losses) after Taxes: Year Profit/(Losses) after Taxes:
48 FINANCIAL PROJECTIONS Years INPUTS: NATIONAL GUARANTEE FUND OF YEMEN Inflation Rate* 8,73% 9,24% 8,03% 7,54% 7,27% 7,00% 7,00% 7,00% 7,00% 7,00% GDP Growth** 5,4% 6,6% 6,5% 6,3% 6,0% 6,0% 6,0% 6,0% 6,0% 6,0% 1 euro= USD 1,300 1,300 1,300 1,300 1,300 1,300 1,300 1,300 1,300 1,300 1$=YER 214,9 214,9 214,9 214,9 214,9 214,9 214,9 214,9 214,9 214,9 *Source: National Statistical Office. Central Bank of Yemen; also IMF staff **Source: IMF Staff Latest actual data: 2008 National accounts manual used Participating Banks Number of Qualified Loans Average Loan Size (US$) Total SEDF Number of Qualified Loans Average Loan Size (US$) Total Participating MFIs Number of Qualified Loans Average Loan Size (US$) Total Grand Total
49 FINANCIAL PROJECTIONS (CONT) Growth in use of guarantees 30% 20% 10% 10% 10% 10% 10% 10% 10% Average Loan Term (months) Guarantee percentage 50% 50% 50% 50% 50% 50% 50% 50% 50% 50% Guarantee Fee 1,75% 1,75% 1,75% 1,75% 1,75% 1,75% 1,75% 1,75% 1,75% 1,75% Net Payout Percentage 5,00% 5,00% 4,00% 4,00% 4,00% 4,00% 4,00% 4,00% 4,00% Leverage Factor 8,00 8,00 8,00 8,00 8,00 8,00 8,00 8,00 8,00 8,00 Interest Earned on Deposits 5,00% 5,00% 4,50% 4,00% 3,50% 3,50% 3,50% 3,50% 3,50% 3,50% Tax Rate on Profit 16,00% 16,00% 16,00% 16,00% 16,00% 16,00% 16,00% 16,00% 16,00% 16,00% CAPITAL ACTIVITY (US$): Paid-in Capital: Banks GOY Non-bank Private Sector 500 Guarantee Funds from donors: XXX YYY Total Capital Base: Start-up/Replacement Costs Retained Profits/(Losses): Total Available Funds:
50 FINANCIAL PROJECTIONS (CONT) GUARANTEE ACTIVITY (Thousand US$): Maximum Guarantee Capacity (leverage) New Financial Institutions Lending (+) Amount Repaid (-) (3.775) (13.176) (26.663) (40.699) (53.757) (68.434) (85.806) ( ) ( ) ( ) Bank Loans Outstanding year end (=) New Guarantees Issued (+) Claims Paid (-) = Outstanding Guarantees Remaining Guarantee Capacity (13.105) (31.949) (55.354) (84.400) Actual Leverage Attained 1,28 2,61 3,85 5,04 6,27 7,76 9,50 11,54 13,89 16,54 Cumulative Lending Amount: Cumulative number of loans:
51 FINANCIAL PROJECTIONS (CONT) INCOME STATEMENT: Revenues: Total Fees Fees on New Guarantees Fees on Old Loans Interest Earned Total Income: Expenses: Salaries Admin expenses Total Expenses: Claims Paid Total Expenses: Profit before Taxes: Taxes Paid: - (29) (56) (28) (42) (36) (42) (53) (68) (88) Profit/(Losses) after Taxes:
52 NEXT STEPS Implement comments, observations, suggestions received from stakeholders at this workshop Confirm the interest of Banks, private sector and Government in participating in the creation of the National Guarantee Fund of Yemen Invite donors to participate with grants and TA Elaborate the By-Laws and the Guarantee procedures and regulations Organize the first General Assembly Meeting to collect the initial capital and create the new Entity
53 FINALLY

54 Is this the Yemen we want???

55 Or this one???
56 Shukran!!! Thank you!!!
Argentina Bahamas Barbados Bermuda Bolivia Brazil British Virgin Islands Canada Cayman Islands Chile
 Americas Argentina (Banking and finance; Capital markets: Debt; Capital markets: Equity; M&A; Project Bahamas (Financial and corporate) Barbados (Financial and corporate) Bermuda (Financial and corporate)
Double Tax Treaties. Necessity of Declaration on Tax Beneficial Ownership In case of capital gains tax. DTA Country Withholding Tax Rates (%)
") Double Tax Treaties DTA Country Withholding Tax Rates (%) Albania 0 0 5/10 1 No No No Armenia 5/10 9 0 5/10 1 Yes 2 No Yes Australia 10 0 15 No No No Austria 0 0 10 No No No Azerbaijan 8 0 8 Yes No Yes
Double Tax Treaties DTA Country Withholding Tax Rates (%) Albania 0 0 5/10 1 No No No Armenia 5/10 9 0 5/10 1 Yes 2 No Yes Australia 10 0 15 No No No Austria 0 0 10 No No No Azerbaijan 8 0 8 Yes No Yes
Actuarial Supply & Demand. By i.e. muhanna. i.e. muhanna Page 1 of
 By i.e. muhanna i.e. muhanna Page 1 of 8 040506 Additional Perspectives Measuring actuarial supply and demand in terms of GDP is indeed a valid basis for setting the actuarial density of a country and
Guide to Treatment of Withholding Tax Rates. January 2018
 Guide to Treatment of Withholding Tax Rates Contents 1. Introduction 1 1.1. Aims of the Guide 1 1.2. Withholding Tax Definition 1 1.3. Double Taxation Treaties 1 1.4. Information Sources 1 1.5. Guide Upkeep
Bilateral agreements on investment promotion and protection
 Bilateral agreements on investment promotion and protection Country Date Signed Entry into force South Africa 26 April 2005 - Albania 30 October 1993 - Algeria 7 July 2006 - Germany 20 December 1963 6
EQUITY REPORTING & WITHHOLDING. Updated May 2016
 EQUITY REPORTING & WITHHOLDING Updated May 2016 When you exercise stock options or have RSUs lapse, there may be tax implications in any country in which you worked for P&G during the period from the
DOMESTIC CUSTODY & TRADING SERVICES
 Pricing Structure DOMESTIC CUSTODY & TRADING SERVICES A flat custody fee of 20bps per account type per year is applicable to all holdings and cash, the custody fee is collected each month but will be capped
CREDIT INSURANCE. To ensure peace, you must be prepared for war. CREDIT INSURANCE FUNDAMENTAL SOLUTION IN CREDIT RISK MANAGEMENT
 FUNDAMENTAL SOLUTION IN CREDIT RISK MANAGEMENT I would like to extend my relations with that customer... I would like to enter a new market... We have high exposure for that customer... We have delayed
ide: FRANCE Appendix A Countries with Double Taxation Agreement with France
 Fiscal operational guide: FRANCE ide: FRANCE Appendix A Countries with Double Taxation Agreement with France Albania Algeria Argentina Armenia 2006 2006 From 1 March 1981 2002 1 1 1 All persons 1 Legal
Total Imports by Volume (Gallons per Country)
") 6/6/2018 Imports by Volume (Gallons per Country) YTD YTD Country 04/2017 04/2018 % Change 2017 2018 % Change MEXICO 60,968,190 71,994,646 18.1 % 231,460,145 253,500,213 9.5 % NETHERLANDS 13,307,731 10,001,693
6/6/2018 Imports by Volume (Gallons per Country) YTD YTD Country 04/2017 04/2018 % Change 2017 2018 % Change MEXICO 60,968,190 71,994,646 18.1 % 231,460,145 253,500,213 9.5 % NETHERLANDS 13,307,731 10,001,693
TRENDS AND MARKERS Signatories to the United Nations Convention against Transnational Organised Crime
 A F R I C A WA T C H TRENDS AND MARKERS Signatories to the United Nations Convention against Transnational Organised Crime Afghanistan Albania Algeria Andorra Angola Antigua and Barbuda Argentina Armenia
Dutch tax treaty overview Q3, 2012
 Dutch tax treaty overview Q3, 2012 Hendrik van Duijn DTS Duijn's Tax Solutions Zuidplein 36 (WTC Tower H) 1077 XV Amsterdam The Netherlands T +31 888 387 669 T +31 888 DTS NOW F +31 88 8 387 601 duijn@duijntax.com
2017 EU-wide Transparency Exercise
 ound_3 5 TRA Bank Name LEI Code Country Code EV2XZWMLLXF2QRX0CD47 SE Ko 201612 201706 Capital (mln EUR, %) As of 31/12/2016 As of 30/06/2017 COREP CODE REGULATION A OWN FUNDS 668 715 C 01.00 (r010,c010)
2017 EU-wide Transparency Exercise
 ound_3 5 TRA Bank Name LEI Code Country Code 222100ZXZ9BRGDMKXL75 SI Bi 201612 201706 Capital (mln EUR, %) COREP CODE REGULATION A OWN FUNDS 370 393 C 01.00 (r010,c010) Articles 4(118) and 72 of CRR A.1
2017 EU-wide Transparency Exercise
 ound_3 5 TRA Bank Name LEI Code Country Code 549300271OUEJT4RYD30 SI Ab 201612 201706 Capital (mln EUR, %) COREP CODE REGULATION A OWN FUNDS 495 504 C 01.00 (r010,c010) Articles 4(118) and 72 of CRR A.1
2017 EU-wide Transparency Exercise
 ound_3 5 TRA Bank Name LEI Code Country Code 529900H2MBEC07BLTB26 PT Ca 201612 201706 Capital (mln EUR, %) COREP CODE REGULATION A OWN FUNDS 1,162 1,211 C 01.00 (r010,c010) Articles 4(118) and 72 of CRR
2017 EU-wide Transparency Exercise
 ound_3 5 TRA Bank Name LEI Code Country Code J48C8PCSJVUBR8KCW529 IT Ba 201612 201706 Capital (mln EUR, %) COREP CODE REGULATION A OWN FUNDS 3,151 3,141 C 01.00 (r010,c010) Articles 4(118) and 72 of CRR
2017 EU-wide Transparency Exercise
 ound_3 5 TRA Bank Name LEI Code Country Code 529900GGYMNGRQTDOO93 NL N. 201612 201706 Capital (mln EUR, %) COREP CODE REGULATION A OWN FUNDS 3,933 4,269 C 01.00 (r010,c010) Articles 4(118) and 72 of CRR
2017 EU-wide Transparency Exercise
 ound_3 5 TRA Bank Name LEI Code Country Code 5493001BABFV7P27OW30 SI NO 201612 201706 Capital (mln EUR, %) COREP CODE REGULATION A OWN FUNDS 1,336 1,323 C 01.00 (r010,c010) Articles 4(118) and 72 of CRR
2017 EU-wide Transparency Exercise
 ound_3 5 TRA Bank Name LEI Code Country Code 529900HEKOENJHPNN480 FI Ku 201612 201706 Capital (mln EUR, %) COREP CODE REGULATION A OWN FUNDS 1,124 1,218 C 01.00 (r010,c010) Articles 4(118) and 72 of CRR
Total Imports by Volume (Gallons per Country)
") 3/7/2018 Imports by Volume (Gallons per Country) YTD YTD Country 01/2017 01/2018 % Change 2017 2018 % Change MEXICO 54,235,419 58,937,856 8.7 % 54,235,419 58,937,856 8.7 % NETHERLANDS 12,265,935 10,356,183
3/7/2018 Imports by Volume (Gallons per Country) YTD YTD Country 01/2017 01/2018 % Change 2017 2018 % Change MEXICO 54,235,419 58,937,856 8.7 % 54,235,419 58,937,856 8.7 % NETHERLANDS 12,265,935 10,356,183
Total Imports by Volume (Gallons per Country)
") 7/6/2018 Imports by Volume (Gallons per Country) YTD YTD Country 05/2017 05/2018 % Change 2017 2018 % Change MEXICO 71,166,360 74,896,922 5.2 % 302,626,505 328,397,135 8.5 % NETHERLANDS 12,039,171 13,341,929
7/6/2018 Imports by Volume (Gallons per Country) YTD YTD Country 05/2017 05/2018 % Change 2017 2018 % Change MEXICO 71,166,360 74,896,922 5.2 % 302,626,505 328,397,135 8.5 % NETHERLANDS 12,039,171 13,341,929
2017 EU-wide Transparency Exercise
 ound_3 5 TRA Bank Name LEI Code Country Code 529900V3O1M5IHMOSF46 DE St 201612 201706 Capital (mln EUR, %) COREP CODE REGULATION A OWN FUNDS 2,043 2,011 C 01.00 (r010,c010) Articles 4(118) and 72 of CRR
2017 EU-wide Transparency Exercise
 ound_3 5 TRA Bank Name LEI Code Country Code MAES062Z21O4RZ2U7M96 DK Da 201612 201706 Capital (mln EUR, %) COREP CODE REGULATION A OWN FUNDS 23,948 22,137 C 01.00 (r010,c010) Articles 4(118) 72 of CRR
Scale of Assessment of Members' Contributions for 2008
 General Conference GC(51)/21 Date: 28 August 2007 General Distribution Original: English Fifty-first regular session Item 13 of the provisional agenda (GC(51)/1) Scale of Assessment of s' Contributions
2017 EU-wide Transparency Exercise
 ound_3 5 TRA Bank Name LEI Code Country Code PSNL19R2RXX5U3QWHI44 IT Me 201612 201706 Capital (mln EUR, %) COREP CODE REGULATION A OWN FUNDS 8,469 8,879 C 01.00 (r010,c010) Articles 4(118) and 72 of CRR
2017 EU-wide Transparency Exercise
 ound_3 5 TRA Bank Name LEI Code Country Code M6AD1Y1KW32H8THQ6F76 GR Pi 201612 201706 Capital (mln EUR, %) COREP CODE REGULATION A OWN FUNDS 9,003 8,829 C 01.00 (r010,c010) Articles 4(118) and 72 of CRR
Re-assessing the Arab-European Financial Relationship: Continuity in the Middle East, Change in Europe
 Re-assessing the Arab-European Financial Relationship: Continuity in the Middle East, Change in Europe Andrew Cunningham Founder Darien Middle East www.darienmiddleeast.com French-Arab Banking Dialogue
Request to accept inclusive insurance P6L or EASY Pauschal
 5002001020 page 1 of 7 Request to accept inclusive insurance P6L or EASY Pauschal APPLICANT (INSURANCE POLICY HOLDER) Full company name and address WE ARE APPLYING FOR COVER PRIOR TO DELIVERY (PRE-SHIPMENT
Total Imports by Volume (Gallons per Country)
") 4/5/2018 Imports by Volume (Gallons per Country) YTD YTD Country 02/2017 02/2018 % Change 2017 2018 % Change MEXICO 53,961,589 55,268,981 2.4 % 108,197,008 114,206,836 5.6 % NETHERLANDS 12,804,152 11,235,029
4/5/2018 Imports by Volume (Gallons per Country) YTD YTD Country 02/2017 02/2018 % Change 2017 2018 % Change MEXICO 53,961,589 55,268,981 2.4 % 108,197,008 114,206,836 5.6 % NETHERLANDS 12,804,152 11,235,029
2016 EU-wide Transparency Exercise
 ound_3 5 TRA Bank Name LEI Code Country Code MAES062Z21O4RZ2U7M96 DK Da 201512 201606 Capital (mln EUR, %) COREP CODE REGULATION A OWN FUNDS 23,469 22,751 C 01.00 (r010,c010) Articles 4(118) 72 of CRR
2017 EU-wide Transparency Exercise
 ound_3 5 TRA Bank Name LEI Code Country Code 529900W3MOO00A18X956 HU OT 201612 201706 Capital (mln EUR, %) COREP CODE REGULATION A OWN FUNDS 4,000 4,034 C 01.00 (r010,c010) Articles 4(118) and 72 of CRR
SHARE IN OUR FUTURE AN ADVENTURE IN EMPLOYEE STOCK OWNERSHIP DEBBI MARCUS, UNILEVER
 SHARE IN OUR FUTURE AN ADVENTURE IN EMPLOYEE STOCK OWNERSHIP DEBBI MARCUS, UNILEVER DEBBI.MARCUS@UNILEVER.COM RUTGERS SCHOOL OF MANAGEMENT AND LABOR RELATIONS NJ/NY CENTER FOR EMPLOYEE OWNERSHIP AGENDA
Total Imports by Volume (Gallons per Country)
") 1/5/2018 Imports by Volume (Gallons per Country) YTD YTD Country 11/2016 11/2017 % Change 2016 2017 % Change MEXICO 50,994,409 48,959,909 (4.0)% 631,442,105 657,851,150 4.2 % NETHERLANDS 9,378,351 11,903,919
1/5/2018 Imports by Volume (Gallons per Country) YTD YTD Country 11/2016 11/2017 % Change 2016 2017 % Change MEXICO 50,994,409 48,959,909 (4.0)% 631,442,105 657,851,150 4.2 % NETHERLANDS 9,378,351 11,903,919
2017 EU-wide Transparency Exercise
 ound_3 5 TRA Bank Name LEI Code Country Code DG3RU1DBUFHT4ZF9WN62 NL Co 201612 201706 Capital (mln EUR, %) COREP CODE REGULATION A OWN FUNDS 52,873 52,926 C 01.00 (r010,c010) Articles 4(118) 72 of CRR
Total Imports by Volume (Gallons per Country)
") 10/5/2018 Imports by Volume (Gallons per Country) YTD YTD Country 08/2017 08/2018 % Change 2017 2018 % Change MEXICO 67,180,788 71,483,563 6.4 % 503,129,061 544,043,847 8.1 % NETHERLANDS 12,954,789 12,582,508
10/5/2018 Imports by Volume (Gallons per Country) YTD YTD Country 08/2017 08/2018 % Change 2017 2018 % Change MEXICO 67,180,788 71,483,563 6.4 % 503,129,061 544,043,847 8.1 % NETHERLANDS 12,954,789 12,582,508
Total Imports by Volume (Gallons per Country)
") 11/2/2018 Imports by Volume (Gallons per Country) YTD YTD Country 09/2017 09/2018 % Change 2017 2018 % Change MEXICO 49,299,573 57,635,840 16.9 % 552,428,635 601,679,687 8.9 % NETHERLANDS 11,656,759 13,024,144
11/2/2018 Imports by Volume (Gallons per Country) YTD YTD Country 09/2017 09/2018 % Change 2017 2018 % Change MEXICO 49,299,573 57,635,840 16.9 % 552,428,635 601,679,687 8.9 % NETHERLANDS 11,656,759 13,024,144
Total Imports by Volume (Gallons per Country)
") 12/6/2018 Imports by Volume (Gallons per Country) YTD YTD Country 10/2017 10/2018 % Change 2017 2018 % Change MEXICO 56,462,606 60,951,402 8.0 % 608,891,240 662,631,088 8.8 % NETHERLANDS 11,381,432 10,220,226
12/6/2018 Imports by Volume (Gallons per Country) YTD YTD Country 10/2017 10/2018 % Change 2017 2018 % Change MEXICO 56,462,606 60,951,402 8.0 % 608,891,240 662,631,088 8.8 % NETHERLANDS 11,381,432 10,220,226
Total Imports by Volume (Gallons per Country)
") 2/6/2019 Imports by Volume (Gallons per Country) YTD YTD Country 11/2017 11/2018 % Change 2017 2018 % Change MEXICO 48,959,909 54,285,392 10.9 % 657,851,150 716,916,480 9.0 % NETHERLANDS 11,903,919 10,024,814
2/6/2019 Imports by Volume (Gallons per Country) YTD YTD Country 11/2017 11/2018 % Change 2017 2018 % Change MEXICO 48,959,909 54,285,392 10.9 % 657,851,150 716,916,480 9.0 % NETHERLANDS 11,903,919 10,024,814
Total Imports by Volume (Gallons per Country)
") 3/6/2019 Imports by Volume (Gallons per Country) YTD YTD Country 12/2017 12/2018 % Change 2017 2018 % Change MEXICO 54,169,734 56,505,154 4.3 % 712,020,884 773,421,634 8.6 % NETHERLANDS 11,037,475 8,403,018
3/6/2019 Imports by Volume (Gallons per Country) YTD YTD Country 12/2017 12/2018 % Change 2017 2018 % Change MEXICO 54,169,734 56,505,154 4.3 % 712,020,884 773,421,634 8.6 % NETHERLANDS 11,037,475 8,403,018
2017 EU-wide Transparency Exercise
 ound_3 5 TRA Bank Name LEI Code Country Code MLU0ZO3ML4LN2LL2TL39 UK HS 201612 201706 Capital (mln EUR, %) COREP CODE REGULATION A OWN FUNDS 163,512 161,140 C 01.00 (r010,c010) Articles 4(118) 72 of CRR
2017 EU-wide Transparency Exercise
 ound_3 5 TRA Bank Name LEI Code Country Code FR969500TJ5KRTCJQWXH FR Gr 201612 201706 Capital (mln EUR, %) COREP CODE REGULATION A OWN FUNDS 100,667 96,261 C 01.00 (r010,c010) Articles 4(118) 72 of CRR
2017 EU-wide Transparency Exercise
 ound_3 5 TRA Bank Name LEI Code Country Code 0W2PZJM8XOY22M4GG883 DE De 201612 201706 Capital (mln EUR, %) COREP CODE REGULATION A OWN FUNDS 5,366 5,553 C 01.00 (r010,c010) Articles 4(118) 72 of CRR A.1
Total Imports by Volume (Gallons per Country)
") 2/6/2018 Imports by Volume (Gallons per Country) YTD YTD Country 12/2016 12/2017 % Change 2016 2017 % Change MEXICO 50,839,282 54,169,734 6.6 % 682,281,387 712,020,884 4.4 % NETHERLANDS 10,630,799 11,037,475
2/6/2018 Imports by Volume (Gallons per Country) YTD YTD Country 12/2016 12/2017 % Change 2016 2017 % Change MEXICO 50,839,282 54,169,734 6.6 % 682,281,387 712,020,884 4.4 % NETHERLANDS 10,630,799 11,037,475
2017 EU-wide Transparency Exercise
 ound_3 5 TRA Bank Name LEI Code Country Code 6SCPQ280AIY8EP3XFW53 SE No 201612 201706 Capital (mln EUR, %) COREP CODE REGULATION A OWN FUNDS 32,904 31,844 C 01.00 (r010,c010) Articles 4(118) 72 of CRR
2017 EU-wide Transparency Exercise
 ound_3 5 TRA Bank Name LEI Code Country Code TO822O0VT80V06K0FH57 PT Ca 201612 201706 Capital (mln EUR, %) COREP CODE REGULATION A OWN FUNDS 4,437 7,859 C 01.00 (r010,c010) Articles 4(118) and 72 of CRR
Total Imports by Volume (Gallons per Country)
") 10/5/2017 Imports by Volume (Gallons per Country) YTD YTD Country 08/2016 08/2017 % Change 2016 2017 % Change MEXICO 51,349,849 67,180,788 30.8 % 475,806,632 503,129,061 5.7 % NETHERLANDS 12,756,776 12,954,789
10/5/2017 Imports by Volume (Gallons per Country) YTD YTD Country 08/2016 08/2017 % Change 2016 2017 % Change MEXICO 51,349,849 67,180,788 30.8 % 475,806,632 503,129,061 5.7 % NETHERLANDS 12,756,776 12,954,789
2016 EU-wide Transparency Exercise
 ound_3 5 TRA Bank Name LEI Code Country Code 7LTWFZYICNSX8D621K86 DE De 201512 201606 Capital (mln EUR, %) COREP CODE REGULATION A OWN FUNDS 64,522 63,071 C 01.00 (r010,c010) Articles 4(118) 72 of CRR
H S B C H O L D I N G S P L C HSBC HOLDINGS PLC THE CAPITAL REQUIREMENTS. (Country-by-Country Reporting) REGULATION 2013
 REGULATION 2013") HSBC HOLDINGS PLC THE CAPITAL REQUIREMENTS (Country-by-Country Reporting) REGULATION 2013 31 December 2015 This report has been prepared for HSBC Holdings plc and its subsidiaries (the HSBC Group ) to
HSBC HOLDINGS PLC THE CAPITAL REQUIREMENTS (Country-by-Country Reporting) REGULATION 2013 31 December 2015 This report has been prepared for HSBC Holdings plc and its subsidiaries (the HSBC Group ) to
2016 EU-wide Transparency Exercise
 ound_3 5 TRA Bank Name LEI Code Country Code 549300PPXHEU2JF0AM85 UK Ll 201512 201606 Capital (mln EUR, %) COREP CODE REGULATION A OWN FUNDS 65,395 58,887 C 01.00 (r010,c010) Articles 4(118) 72 of CRR
2016 EU-wide Transparency Exercise
 ound_3 5 TRA Bank Name LEI Code Country Code FR9695005MSX1OYEMGDF FR Gr 201512 201606 Capital (mln EUR, %) COREP CODE REGULATION A OWN FUNDS 65,802 69,114 C 01.00 (r010,c010) Articles 4(118) 72 of CRR
2017 EU-wide Transparency Exercise
 ound_3 5 TRA Bank Name LEI Code Country Code FR9695005MSX1OYEMGDF FR Gr 201612 201706 Capital (mln EUR, %) COREP CODE REGULATION A OWN FUNDS 72,142 72,919 C 01.00 (r010,c010) Articles 4(118) 72 of CRR
INTERNATIONAL CONVENTION ON STANDARDS OF TRAINING, CERTIFICATION AND WATCHKEEPING FOR SEAFARERS (STCW), 1978, AS AMENDED
, 1978, AS AMENDED") E 4 ALBERT EMBANKMENT LONDON SE1 7SR Telephone: +44 (0)20 7735 711 Fax: +44 (0)20 7587 3210 1 January 2019 INTERNATIONAL CONVENTION ON STANDARDS OF TRAINING, CERTIFICATION AND WATCHKEEPING FOR SEAFARERS
E 4 ALBERT EMBANKMENT LONDON SE1 7SR Telephone: +44 (0)20 7735 711 Fax: +44 (0)20 7587 3210 1 January 2019 INTERNATIONAL CONVENTION ON STANDARDS OF TRAINING, CERTIFICATION AND WATCHKEEPING FOR SEAFARERS
2017 EU-wide Transparency Exercise
 ound_3 5 TRA Bank Name LEI Code Country Code DIZES5CFO5K3I5R58746 DE La 201612 201706 Capital (mln EUR, %) COREP CODE REGULATION A OWN FUNDS 10,809 10,796 C 01.00 (r010,c010) Articles 4(118) 72 of CRR
2016 EU-wide Transparency Exercise
 ound_3 5 TRA Bank Name LEI Code Country Code NHBDILHZTYCNBV5UYZ31 SE Sv 201512 201606 Capital (mln EUR, %) COREP CODE REGULATION A OWN FUNDS 13,982 14,543 C 01.00 (r010,c010) Articles 4(118) 72 of CRR
Summary 715 SUMMARY. Minimum Legal Fee Schedule. Loser Pays Statute. Prohibition Against Legal Advertising / Soliciting of Pro bono
 Summary Country Fee Aid Angola No No No Argentina No, with No No No Armenia, with No No No No, however the foreign Attorneys need to be registered at the Chamber of Advocates to be able to practice attorney
World Consumer Income and Expenditure Patterns
 World Consumer Income and Expenditure Patterns 2011 www.euromonitor.com iii Summary of Contents Contents Summary of Contents Section 1 Introduction 1 Section 2 Socio-economic parameters 21 Section 3 Annual
2016 EU-wide Transparency Exercise
 ound_3 5 TRA Bank Name LEI Code Country Code 6SCPQ280AIY8EP3XFW53 SE No 201512 201606 Capital (mln EUR, %) COREP CODE REGULATION A OWN FUNDS 30,900 31,530 C 01.00 (r010,c010) Articles 4(118) 72 of CRR
2017 EU-wide Transparency Exercise
 ound_3 5 TRA Bank Name The Royal Bank of Scotl Group Public Limited Company LEI Code Country Code 2138005O9XJIJN4JPN90 UK Th 201612 201706 Capital The Royal Bank of Scotl Group Public Limited Company (mln
2017 EU-wide Transparency Exercise
 ound_3 5 TRA Bank Name LEI Code Country Code K8MS7FD7N5Z2WQ51AZ71 ES Ba 201612 201706 Capital (mln EUR, %) COREP CODE REGULATION A OWN FUNDS 58,893 57,835 C 01.00 (r010,c010) Articles 4(118) 72 of CRR
2017 EU-wide Transparency Exercise
 ound_3 5 TRA Bank Name LEI Code Country Code 549300NYKK9MWM7GGW15 NL IN 201612 201706 Capital (mln EUR, %) COREP CODE REGULATION A OWN FUNDS 60,765 60,899 C 01.00 (r010,c010) Articles 4(118) 72 of CRR
SANGAM GLOBAL PHARMACEUTICAL & REGULATORY CONSULTANCY
 SANGAM GLOBAL PHARMACEUTICAL & REGULATORY CONSULTANCY Regulatory Affairs Worldwide An ISO 9001:2015 Certified Company Welcome to Sangam Global Pharmaceutical & Regulatory Consultancy (SGPRC) established
2016 EU-wide Transparency Exercise
 ound_3 5 TRA Bank Name Bank of Irel LEI Code Country Code Q2GQA2KF6XJ24W42G291 IE Ba 201512 201606 Capital Bank of Irel (mln EUR, %) COREP CODE REGULATION A OWN FUNDS 9,576 8,943 C 01.00 (r010,c010) Articles
Global Overview of 2012 Pooled Funding
 Global Overview of 2012 Pooled Funding CERF, CHFs and ERFs 15 February 2013 Page 0 1. Introduction This overview provides key funding information on the Central Emergency Response fund (CERF), Common Humanitarian
2016 EU-wide Transparency Exercise
 ound_3 5 TRA Bank Name LEI Code Country Code 9695000CG7B84NLR5984 FR Cr 201512 201606 Capital (mln EUR, %) COREP CODE REGULATION A OWN FUNDS 43,097 47,297 C 01.00 (r010,c010) Articles 4(118) 72 of CRR
WORLD HEALTH ORGANISATION MONDIALE. NINTH WORLD HEALTH ASSEMBLY Jg? \ A9/P&B/19 ^! fr t 15 May 1956 Agenda item 6.5 îj. L,, л
 WORLD HEALTH ORGANISATION MONDIALE ORGANIZATION DE LA SANTÉ NINTH WORLD HEALTH ASSEMBLY Jg? \ A9/P&B/19 ^! fr t 15 May 1956 Agenda item 6.5 îj. L,, л Q-u L. * ORIGINAL: ENÓLISH REVIEW AND APPROVAL OF THE
Total Imports by Volume (Gallons per Country)
") 5/4/2016 Imports by Volume (Gallons per Country) YTD YTD Country 03/2015 03/2016 % Change 2015 2016 % Change MEXICO 53,821,885 60,813,992 13.0 % 143,313,133 167,568,280 16.9 % NETHERLANDS 11,031,990 12,362,256
5/4/2016 Imports by Volume (Gallons per Country) YTD YTD Country 03/2015 03/2016 % Change 2015 2016 % Change MEXICO 53,821,885 60,813,992 13.0 % 143,313,133 167,568,280 16.9 % NETHERLANDS 11,031,990 12,362,256
2017 EU-wide Transparency Exercise
 ound_3 5 TRA Bank Name LEI Code Country Code SI5RG2M0WQQLZCXKRM20 ES Ba 201612 201706 Capital (mln EUR, %) COREP CODE REGULATION A OWN FUNDS 11,820 12,466 C 01.00 (r010,c010) Articles 4(118) 72 of CRR
2009 Half Year Results. August 25, 2009
 1 2009 Half Year Results August 25, 2009 2 Caution statement This presentation may contain forward looking statements, which are subject to risk and uncertainty. A variety of factors could cause our actual
2017 EU-wide Transparency Exercise
 ound_3 5 TRA Bank Name LEI Code Country Code 549300PPXHEU2JF0AM85 UK Ll 201612 201706 Capital (mln EUR, %) COREP CODE REGULATION A OWN FUNDS 53,869 51,407 C 01.00 (r010,c010) Articles 4(118) 72 of CRR
2016 EU-wide Transparency Exercise
 ound_3 5 TRA Bank Name LEI Code Country Code Raiffeisen-Holding Niederösterreich-Wien Registrierte Genossenschaft Mit Beschränkter Haftung 529900SXEWPJ1MRRX537 AT Ra 201512 201606 Capital (mln EUR, %)
2017 EU-wide Transparency Exercise
 ound_3 5 TRA Bank Name LEI Code Country Code JU1U6S0DG9YLT7N8ZV32 PT Ba 201612 201706 Capital (mln EUR, %) COREP CODE REGULATION A OWN FUNDS 5,257 5,353 C 01.00 (r010,c010) Articles 4(118) 72 of CRR A.1
2017 EU-wide Transparency Exercise
 ound_3 5 TRA Bank Name Svenska Helsbanken - group LEI Code Country Code NHBDILHZTYCNBV5UYZ31 SE Sv 201612 201706 Capital Svenska Helsbanken - group (mln EUR, %) COREP CODE REGULATION A OWN FUNDS 15,099
ANNEX 2: Methodology and data of the Starting a Foreign Investment indicators
 ANNEX 2: Methodology and data of the Starting a Foreign Investment indicators Methodology The Starting a Foreign Investment indicators quantify several aspects of business establishment regimes important
INTERNATIONAL CONVENTION ON STANDARDS OF TRAINING, CERTIFICATION AND WATCHKEEPING FOR SEAFARERS (STCW), 1978, AS AMENDED
, 1978, AS AMENDED") E 4 ALBERT EMBANKMENT LONDON SE 7SR Telephone: +44 (0)20 7735 76 Fax: +44 (0)20 7587 320 MSC./Circ.64/Rev.5 7 June 205 INTERNATIONAL CONVENTION ON STANDARDS OF TRAINING, CERTIFICATION AND WATCHKEEPING
E 4 ALBERT EMBANKMENT LONDON SE 7SR Telephone: +44 (0)20 7735 76 Fax: +44 (0)20 7587 320 MSC./Circ.64/Rev.5 7 June 205 INTERNATIONAL CONVENTION ON STANDARDS OF TRAINING, CERTIFICATION AND WATCHKEEPING
YUM! Brands, Inc. Historical Financial Summary. Second Quarter, 2017
 YUM! Brands, Inc. Historical Financial Summary Second Quarter, 2017 YUM! Brands, Inc. Consolidated Statements of Income (in millions, except per share amounts) 2017 2016 2015 YTD Q3 Q4 FY FY Revenues Company
2016 EU-wide Transparency Exercise
 ound_3 5 TRA Bank Name Bayerische Lesbank LEI Code Country Code VDYMYTQGZZ6DU0912C88 DE Ba 201512 201606 Capital Bayerische Lesbank (mln EUR, %) COREP CODE REGULATION A OWN FUNDS 11,194 10,589 C 01.00
Reporting practices for domestic and total debt securities
 Last updated: 27 November 2017 Reporting practices for domestic and total debt securities While the BIS debt securities statistics are in principle harmonised with the recommendations in the Handbook on
2017 EU-wide Transparency Exercise
 ound_3 5 TRA Bank Name Lesbank Baden-Württemberg LEI Code Country Code B81CK4ESI35472RHJ606 DE La 201612 201706 Capital Lesbank Baden-Württemberg (mln EUR, %) COREP CODE REGULATION A OWN FUNDS 16,814 17,304
2016 EU-wide Transparency Exercise
 ound_3 5 TRA Bank Name LEI Code Country Code 5UMCZOEYKCVFAW8ZLO05 GR Na 201512 201606 Capital (mln EUR, %) COREP CODE REGULATION A OWN FUNDS 9,010 8,863 C 01.00 (r010,c010) Articles 4(118) 72 of CRR A.1
Dutch tax treaty overview Q4, 2013
 Dutch tax treaty overview Q4, 2013 Hendrik van Duijn DTS Duijn's Tax Solutions Zuidplein 36 (WTC Tower H) 1077 XV Amsterdam The Netherlands T +31 888 387 669 T +31 888 DTS NOW F +31 88 8 387 601 duijn@duijntax.com
2017 EU-wide Transparency Exercise
 ound_3 5 TRA Bank Name Skinaviska Enskilda Banken - group LEI Code Country Code F3JS33DEI6XQ4ZBPTN86 SE Sk 201612 201706 Capital Skinaviska Enskilda Banken - group (mln EUR, %) COREP CODE REGULATION A
The Capital Requirements (Country-by-Country Reporting) Regulations December 2017
 Regulations December 2017") HSBC Holdings plc The Capital Requirements (Country-by-Country Reporting) Regulations 2013 31 December 2017 This report has been prepared for HSBC Holdings plc and its subsidiaries (the HSBC Group ) to
HSBC Holdings plc The Capital Requirements (Country-by-Country Reporting) Regulations 2013 31 December 2017 This report has been prepared for HSBC Holdings plc and its subsidiaries (the HSBC Group ) to
2017 EU-wide Transparency Exercise
 ound_3 5 TRA Bank Name LEI Code Country Code 5UMCZOEYKCVFAW8ZLO05 GR Na 201612 201706 Capital (mln EUR, %) COREP CODE REGULATION A OWN FUNDS 6,706 6,469 C 01.00 (r010,c010) Articles 4(118) 72 of CRR A.1
Today's CPI data: what you need to know
 Trend Macrolytics, LLC Donald Luskin, Chief Investment Officer Thomas Demas, Managing Director Michael Warren, Energy Strategist Data Insights: Consumer Price Index, Producer Price Index Friday, July 14,
Comperative DTTs of Pakistan
 Comperative DTTs of Pakistan 1 2 3 4 5 6 7 8 9 10 11 12 13 14 15 S. No. COUNTRY CONTINENT Republic/Dem ocratic/kingdo m/sultanate P.E. BUSINESS PROFIT SHIPPING AIR TRANSPORT DIVIDEND INTEREST ROYALITIES
CNH and China QFII market: Opportunities and Challenges A Fund Custodian and Administrator's Perspective"
 CNH and China QFII market: Opportunities and Challenges A Fund Custodian and Administrator's Perspective" Eric Chow HSBC Securities Services June 2011 2 Agenda About HSBC Securities Services (HSS) Introducing
Does One Law Fit All? Cross-Country Evidence on Okun s Law
 Does One Law Fit All? Cross-Country Evidence on Okun s Law Laurence Ball Johns Hopkins University Global Labor Markets Workshop Paris, September 1-2, 2016 1 What the paper does and why Provides estimates
Clinical Trials Insurance
 Allianz Global Corporate & Specialty Clinical Trials Insurance Global solutions for clinical trials liability Specialist cover for clinical research The challenges of international clinical research are
HEALTH WEALTH CAREER 2017 WORLDWIDE BENEFIT & EMPLOYMENT GUIDELINES
 HEALTH WEALTH CAREER 2017 WORLDWIDE BENEFIT & EMPLOYMENT GUIDELINES WORLDWIDE BENEFIT & EMPLOYMENT GUIDELINES AT A GLANCE GEOGRAPHY 77 COUNTRIES COVERED 5 REGIONS Americas Asia Pacific Central & Eastern
FY2016 RESULTS. 1 February 2016 to 31 January Inditex continues to roll out its global, fully integrated store and online model.
 FY2016 RESULTS 1 February 2016 to 31 January 2017 Inditex continues to roll out its global, fully integrated store and online model. Strong operating performance: Net sales for FY2016 reached 23.3 billion,
2017 EU-wide Transparency Exercise
 ound_3 5 TRA Bank Name LEI Code Country Code JEUVK5RWVJEN8W0C9M24 GR Eu 201612 201706 Capital (mln EUR, %) COREP CODE REGULATION A OWN FUNDS 6,894 6,877 C 01.00 (r010,c010) Articles 4(118) 72 of CRR A.1
Employer Social Charges 13/10/2017 EURO/USD USD 1.20 JPY/USD 0.01 AUD/USD USD 0.73 GBP/USD Charges patronales obligatoires %
 Charges 13/10/2017 Salaire Brut Mensuel Charges patronales obligatoires % Charges patronales totales Pays Albania $4,500.00 16.70% $218 Algeria $4,500.00 28.00% $1,260 Angola $4,500.00 20.7500% $933.75
STOXX EMERGING MARKETS INDICES. UNDERSTANDA RULES-BA EMERGING MARK TRANSPARENT SIMPLE
 STOXX Limited STOXX EMERGING MARKETS INDICES. EMERGING MARK RULES-BA TRANSPARENT UNDERSTANDA SIMPLE MARKET CLASSIF INTRODUCTION. Many investors are seeking to embrace emerging market investments, because
Marine. Global Programmes. cunninghamlindsey.com. A Cunningham Lindsey service
 Marine Global Programmes A Cunningham Lindsey service Marine global presence Marine Global Programmes Cunningham Lindsey approach Managing your needs With 160 marine surveyors and claims managers in 36
Announcement. EU-wide Transparency Exercise Nicosia, 3 December Group Profile
 Announcement EU-wide Transparency Exercise 2016 Nicosia, 3 December 2016 Group Profile Founded in 1899, Bank of Cyprus Group is the leading banking and financial services group in Cyprus. The Group provides
Instruction Deadline. *Settlement Cycle
 Argentina Equity & Fixed Income T+0-T+2 SD+1 2:30 SD+1 2:30 Fixed Income (MAECLEAR) T+0-T+2 SD 23:00 SD 23:00 Physical T+0-T+2 SD 23:00 SD 23:00 Australia Equity T+2 SD 5:30 SD 10:30 Fixed Income T+2 SD
a closer look GLOBAL TAX WEEKLY ISSUE 249 AUGUST 17, 2017
 GLOBAL TAX WEEKLY a closer look ISSUE 249 AUGUST 17, 2017 SUBJECTS TRANSFER PRICING INTELLECTUAL PROPERTY VAT, GST AND SALES TAX CORPORATE TAXATION INDIVIDUAL TAXATION REAL ESTATE AND PROPERTY TAXES INTERNATIONAL
Other Tax Rates. Non-Resident Withholding Tax Rates for Treaty Countries 1
 Other Tax Rates Non-Resident Withholding Tax Rates for Treaty Countries 1 Country 2 Interest 3 Dividends 4 Royalties 5 Annuities 6 Pensions/ Algeria 15% 15% 0/15% 15/25% Argentina 7 12.5 10/15 3/5/10/15
SINGAPORE - FINAL LIST OF MFN EXEMPTIONS (For the Second Package of Commitments) Countries to which the measure applies
 Countries to which the measure applies") All Sectors: Presence of: - unskilled and semi-skilled natural persons - skilled persons (include craftsmen skilled in a particular trade, but exclude specialists/professio nal personnel at management
All Sectors: Presence of: - unskilled and semi-skilled natural persons - skilled persons (include craftsmen skilled in a particular trade, but exclude specialists/professio nal personnel at management