MATCO FOODS LIMITED Unconsolidated Statements Of Financial Position As At June 30, 2018 MATCO FOODS LIMITED Unconsolidated Statements Of Financial Pos
|
|
|
- Annabelle Jordan
- 5 years ago
- Views:
Transcription
1

2

3
4

5
6

7

8

9
10

11

12

13
14

15
16

17

18

19

20

21

22

23

24
25

26
27
28
29
30

31
32
33
34

35
36

37

38

39

40
41

42
43
44
45
46
47

48
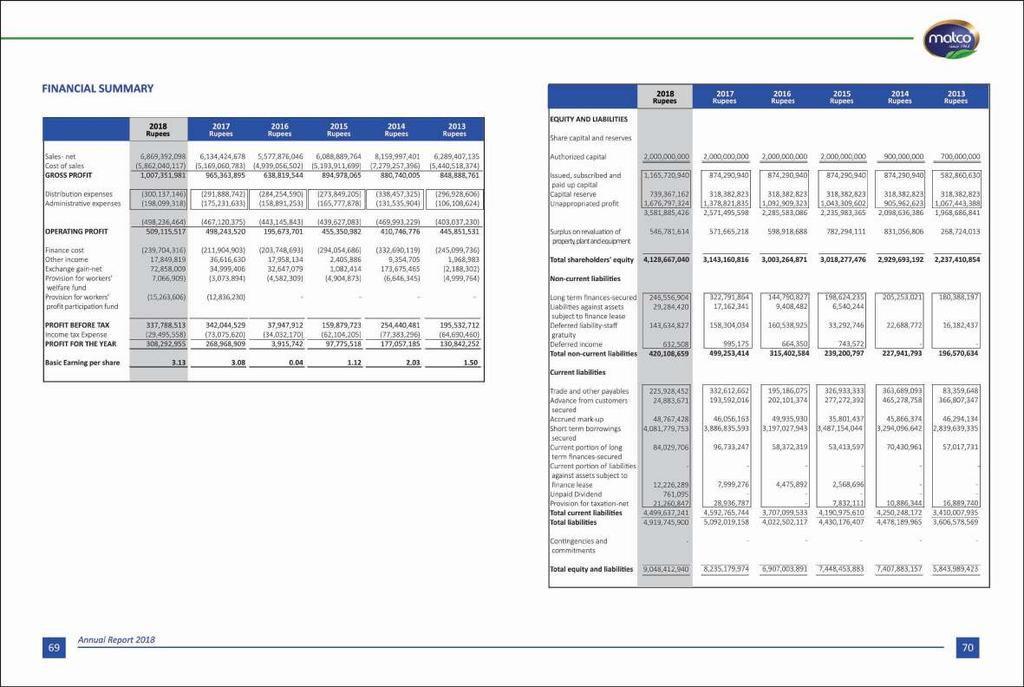
49 Unconsolidated Statements Of Financial Position As At June 30, 2018 Unconsolidated Statements Of Financial Position As At June 30, 2018 EQUITY AND LIABILITIES Share capital and reserves Note 2016 Rupees Rupees Rupees Restated Restated Authorized share capital 7.1 2,000,000,000 2,000,000,000 2,000,000,000 Issued, subscribed and paid up share capital 7.2 1,165,720, ,290, ,290,940 Capital reserve 8 739,367, ,382, ,382,823 Unappropriated profit 1,676,797,324 1,378,821,835 1,092,909,323 Surplus on revaluation of property, plant and equipment - net of tax 9 546,781, ,665, ,918,688 Total shareholders' equity 4,128,667,040 3,143,160,816 2,884,501,774 Non-current liabilities Long term finances-secured ,556, ,791, ,790,827 Liabilities against assets subject to finance leases 11 29,284,420 17,162,341 9,408,482 Deferred liabilities ,634, ,304, ,538,925 Deferred income 632, , ,350 Total non-current liabilities 420,108, ,253, ,402,584 Current liabilities Trade and other payables ,928, ,612, ,186,075 Advance from customers - secured 24,883, ,592, ,101,374 Accrued mark-up 14 48,767,428 46,056,163 49,935,930 Short term borrowings-secured 15 4,081,779,753 3,886,835,593 3,197,027,943 Current portion of long term finances-secured 10 84,029,706 96,733,247 58,372,319 Current portion of liabilities against assets subject to finance leases 11 12,226,289 7,999,276 4,475,892 Unpaid dividend , Provision for taxation-net 21,260,847 28,936,787 - Total current liabilities 4,499,637,241 4,592,765,744 3,707,099,533 Total liabilities 4,919,745,900 5,092,019,158 4,022,502,117 Contingencies and commitments 17 Total equity and liabilities 9,048,412,940 8,235,179,974 6,907,003,891 ASSETS Non-current assets 2016 Rupees Rupees Rupees Note Restated Restated Property, plant and equipment 18 2,168,585,255 2,141,308,121 1,790,412,727 Intangible assets ,903,588 Long term deposits - net 13,048,793 10,990,923 11,421,331 Long term investment 20 31,082,707 23,582,747 23,582,747 Total non-current assets 2,212,716,755 2,175,881,791 1,830,320,393 Current assets Stores, spares and loose tools 21 18,727,268 13,829,554 15,183,208 Stock in trade 22 5,138,980,796 5,240,490,964 4,505,685,485 Trade debts ,463, ,532, ,215,522 Short term loans and advances 24 83,732,051 58,171,589 12,655,050 Trade deposits and short term prepayments 25 10,843,438 8,973,160 14,179,556 Short term investment 500, ,000 - Other receivables 26 85,369,946 84,745,163 51,264,224 Advance tax - net - - 4,287,321 Cash and bank balances ,079, ,054,980 89,213,132 Total current assets 6,835,696,185 6,059,298,183 5,076,683,498 Total assets 9,048,412,940 8,235,179,974 6,907,003,891 The annexed notes from 1 to 46 form an integral part of these unconsolidated financial statements. The annexed notes from 1 to 46 form an integral part of these unconsolidated financial statements. Chief Executive Officer Chief Financial Officer Director Chief Executive Officer Chief Financial Officer Director Annual Report
50 Unconsolidated Statements Of Profit Or Loss Unconsolidated Statements Of Comprehensive Income Note Rupees Rupees Sales - net 28 6,869,392,098 6,134,424,678 Cost of sales 29 (5,862,040,117) (5,169,060,783) GROSS PROFIT 1,007,351, ,363,895 Note Rupees Rupees PROFIT FOR THE YEAR 308,292, ,968,909 OTHER COMPREHENSIVE LOSS Distribution expenses 30 (300,137,146) (291,888,742) Administrative expenses 31 (198,099,318) (175,231,633) (498,236,464) (467,120,375) 509,115, ,243,520 Finance cost 32 (239,704,316) (211,904,903) Items that may be reclassified subsequently to the unconsolidated statement of profit or loss Items that will not to be reclassified subsequently to the unconsolidated statement of profit or loss - - Other income 33 17,849,819 36,616,630 Remeasurement of defined benefits obligation (229,441) (3,109,867) Exchange gain - net 34 72,858,009 34,999,406 Provision for workers welfare fund 13.3 (7,066,909) (3,073,894) TOTAL COMPREHENSIVE INCOME FOR THE YEAR 308,063, ,859,042 Provision for workers profit participation fund 13.4 (15,263,606) (12,836,230) The annexed notes from 1 to 46 form an integral part of these unconsolidated financial statements. PROFIT BEFORE TAX 337,788, ,044,529 Income tax expense 35 (29,495,558) (73,075,620) PROFIT FOR THE YEAR 308,292, ,968,909 EARNINGS PER SHARE - BASIC AND DILUTED The annexed notes from 1 to 46 form an integral part of these unconsolidated financial statements. Chief Executive Officer Chief Financial Officer Director Chief Executive Officer Chief Financial Officer Director Annual Report
51 Unconsolidated Statements Of Cash Flow Unconsolidated Statements Of Cash Flow Note Rupees Rupees CASH FLOWS FROM OPERATING ACTIVITIES Profit before taxation 337,788, ,044,529 Adjustments for: Depreciation ,253, ,584,703 Amortization of intangible assets 19-4,903,588 Exchange gain - net 34 (72,858,009) (34,999,406) Unrealized profit on forward foreign exchange contracts 33 - (1,781,640) Provision of doubtful debts 7,464,595 - Provision for slow moving stock 10,618,995 - Finance cost ,704, ,904,903 Provision for staff gratuity ,859,134 15,098,528 Amortization of deferred income 33 (362,667) (321,377) Gain on disposal of property, plant and equipment 33 (5,220,075) (3,552,612) 357,460, ,836, ,248, ,881,217 Changes in working capital (Increase) / decrease in current assets Stores, spares and loose tools (4,897,714) 1,353,654 Stock in trade 101,510,168 (734,805,479) Trade debts - considered good (60,072,841) (122,374,195) Loans and advances (25,560,462) (45,516,539) Trade deposits and prepayments (1,870,278) 5,206,396 Other receivables (624,783) (31,699,299) 8,484,091 (927,835,462) Increase / (decrease) in current liabilities Trade and other payables (106,684,210) 137,426,587 Advances from customers (168,708,345) (8,509,358) (275,392,555) 128,917,229 Cash generated from / (used in) operations 428,340,290 (128,037,016) Finance cost paid (236,993,051) (215,784,670) Income taxes paid (59,478,799) (56,967,706) Gratuity paid 12.1 (8,450,481) (8,198,973) Net cash generated from / (used in) operating activities 123,417,960 (408,988,365) CASH FLOWS FROM INVESTING ACTIVITIES Fixed capital expenditure including capital work in progress (182,760,348) (473,548,833) Proceeds from disposal of property, plant and equipment 8,150,500 13,841,612 Investment in subsidiary (7,499,960) - Short term investment - (500,000) Long term deposits (2,057,870) 430,408 Net cash used in investing activities (184,167,679) (459,776,813) Balance carried forward (60,749,719) (868,765,178) Note Rupees Rupees Balance brought forward (60,749,719) (868,765,178) CASH FLOWS FROM FINANCING ACTIVITIES Long term finances - received during the year 252,898, ,490,604 - repayments during the year (341,270,050) (60,128,639) Proceeds from issuance of shares ,430,000 - Proceeds from share premium received 8 420,984,339 - Finance lease obligation paid during the year (12,579,609) (8,418,938) Dividend paid (34,210,534) (7,200,000) Short term borrowings obtained - net of repayment 194,944, ,807,650 Net change in cash and cash equivalents during the year 711,446,888 21,785,499 Cash and cash equivalents as at the beginning of year 111,054,980 89,213,132 Effects of exchange rate changes on cash and cash equivalents 577,195 56,349 Cash and cash equivalents as at the end of year ,079, ,054,980 The annexed notes from 1 to 46 form an integral part of these unconsolidated financial statements. Chief Executive Officer Chief Financial Officer Director Annual Report
52 Unconsolidated Statements Of Change In Equity Balance as on July 01, 2016 as previously 874,290, ,382,823 1,092,909,323-2,285,583,086 stated Effect of re-statement (Note 6) ,918, ,918,688 Balance as on July 01, restated 874,290, ,382,823 1,092,909, ,918,688 2,884,501,774 Total comprehensive income for the year Profit for the year ,968, ,968,909 Other comprehensive loss - - (3,109,867) - (3,109,867) Total comprehensive Income ,859, ,859,042 Transferred from surplus on revaluation of fixed assets on account of incremental depreciation net of tax - (note 9) ,253,470 (27,253,470) - Transactions with owners Dividend Re per share (2016: Rs per share) Issue of Rs. 10 per share 291,430, ,430, ,984, ,984,339 - (7,200,000) - (7,200,000) Balance as on June 30, restated 874,290, ,382,823 1,378,821, ,665,218 3,143,160,816 Total comprehensive income for the year Profit for the year Other comprehensive loss Total comprehensive Income Transferred from surplus on revaluation of fixed assets on account of incremental depreciation net of tax - (note 9) Transactions with owners Share Rs. 16 per share - net of expenses Dividend Re. 0.3 per share (2017: Rs per share) Issued, subscribed and paid up share capital Capital reserve Unappropriated profit 24,883,604 (24,883,604) - (34,971,629) - (34,971,629) Balance as on June 30, ,165,720, ,367,162 1,676,797, ,781,614 4,128,667,040 The annexed notes from 1 to 46 form an integral part of these unconsolidated financial statements. Surplus on revaluation of property, plant and equipment Total Rupees ,292, ,968, (229,441) - (3,109,867) ,063, ,063,514 Note To The Unconsolidated Financial Statements 1 STATUS AND NATURE OF BUSINESS Matco Foods Limited, ('the Company') was incorporated on April 14, 1990 in Karachi as a private limited company under the repealed Companies Ordinance, 1984 (Now: Companies Act, 2017). The Company was converted into public company from private company on July 25, The Company is listed on Pakistan Stock Exchange on February 13, Principal activity of the Company is to carry on the business of processing, export of rice, rice glucose, rice protein and trade of biscuits, pink salt, bran oil, masala and kheer. Registered office of the Company is situated at L-24/1, Block-21, Federal 'B' Industrial Area, Karachi; whereas the factories of the Company are situated at (i) M-II, A-15 & 16, SITE-II, Super highway Karachi; (ii) Riviana, A-21, SITE-II, Super highway Karachi; (iii) Rice Glucose Plant, G-205, SITE-II, Super highway Karachi and (iv) M-III, Sadhoke, Tehsil Kamoke, District Gujranwala. The Company has 100% ownership in JKT General Trading FZE (subsidiary) a Dubai based company is situated at P.O.Box , Sharjah - U.A.E, and registered with government of Sharjah. The business of the company is purchasing and selling of processed rice. The Company has incorporated another subsidiary Matco Marketing (Private) Limited through 100% ownership. The subsidiary is situated at L-24/1, Block-21, Federal 'B' Industrial Area, Karachi. Matco Marketing (Private) Limited was incorporated on June 16, 2016 with authorized and paid-up capital of PKR 10 million and PKR 7.5 million respectively. However, no business carried out by the Company since its incorporation. 2 SIGNIFICANT TRANSACTIONS AND EVENTS AFFECTING THE COMPANY'S FINANCIAL POSITION AND PERFORMANCE a) The Company has been listed at Pakistan Stock Exchange (PSX) during the year by offering shares to the general public which resulted in IPO proceeds of Rs million; b) The Company has started the construction of rice glucose plant for 20,000 MT of rice glucose and 2,000 MT of rice protein at G-205, SITE-II, Super highway Karachi; c) The exchange rate of USD to PKR has increased from PKR as at June 30, 2017 to PKR as at June 30, 2018 which resulted in exchange gain of Rs million; d) Due to applicability of the Companies Act, 2017 to the financial statements of the Company, amounts reported for the previous period have been restated. For detailed information, please refer to note and note 6; e) During the year, the Company has subscribed 749,996 shares of Matco Marketing (Private) Limited. However, Matco Marketing (Private) Limited has not commenced its operations; f) On July 25, 2017, the Company has converted into public company from private company; and g) For a detailed discussion about the Company's performance, please refer to the Directors' report. Chief Executive Officer Chief Financial Officer Director Annual Report
53 Note To The Unconsolidated Financial Statements 3 BASIS OF PREPARATION 3.1 Statement of compliance These financial statements have been prepared in accordance with the accounting and reporting standards as applicable in Pakistan. Accounting and reporting standards comprise of such International Financial Reporting Standards (IFRS Standards) issued by the International Accounting Standards Board (IASB) and Islamic Financial Accounting Standards (IFAS) issued by the Institute of Chartered Accountants of Pakistan (ICAP) as are notified under the Companies Act, 2017 (the Act), and provisions of and directives issued under the Companies Act, Where provisions of and directives issued under the Companies Act, 2017 differ from the IFRS Standards, the provisions of and directives issued under the Companies Act, 2017 have been followed. 3.2 Basis of measurement These unconsolidated financial statements have been prepared under the historical cost convention except as otherwise disclosed in the respective accounting policies' note and cash flow information. 3.3 Functional and presentation currency These unconsolidated financial statements are presented in Pakistani Rupees which is the Company's functional currency and presentation currency. 3.4 Standards, Amendments and Interpretations to Approved Accounting Standards Promulgation of Companies Act, 2017 The third and fourth schedule to the Companies Act, 2017 became applicable to the Company for the first time for the preparation of these financial statements. The Companies Act, 2017 (including its third and fourth schedule) forms an integral part of the statutory financial reporting framework applicable to the Company and amongst others, prescribes the nature and content of disclosures in relation to various elements of the financial statements. Additional disclosures include but are not limited to, particulars of immovable assets of the Company (refer note ), management assessment of sufficiency of tax provision in the financial statements (refer note 35.2), change in threshold for identification of executives (refer note 38), additional disclosure requirements for related parties (refer note 37), utilization of IPO proceeds (refer note 45) Standards, amendments and interpretations to the published standards that are relevant to the company and adopted in the current year The Company has adopted the following new standards, amendments to published standards and interpretations of IFRSs which became effective during the current year. Standard or Interpretation IAS 12- Recognition of Deferred Tax Assets for Unrealized Losses (Amendments to IAS 12) Effective Date (Annual periods beginning on or after) IAS 7 - Disclosure Initiative (Amendments toias 7) January 1, 2017 January 1, 2017 IFRS 12 - Annual Improvements to IFRS January 1, 2017 Adoption of the above revisions, amendments and interpretations of the standards have no significant effect on the amounts for the year ended June 30, 2017 and Note To The Unconsolidated Financial Statements Standards, amendments to published standards and interpretations that are effective but not relevant The other new standards, amendments to published standards and interpretations that are mandatory for the financial year beginning on July 01, 2017 are considered not to be relevant or to have any significant effect on the Company's financial reporting and operations and are therefore not presented here Standards, amendments and interpretations to the published standards that are relevant but not yet effective and not early adopted by the Company The following new standards, amendments to published standards and interpretations would be effective from the dates mentioned below against the respective standard or interpretation. Standard or Interpretation IFRS 10 andias 28 - Saleor Contribution of Assets between an Investorand its Associate or Joint Venture (Amendments to IFRS 10 and IAS IFRS 2 - Classification and Measurement of Share-based Payment Transaction (Amendments IFRS 1 and IAS 28 - Annual Improvements to IFRSs IFRIC 22 - Foreign Currency Transactions and Advance Consideration IAS 28 - Long-term Interests in Associates and Joint Ventures (Amendments to IAS 28) IFRS 9 - Prepayment Features with Negative Compensation (Amendments to IFRS 9) IAS 19 - Plan Amendment, Curtail or Settlement (Amendments to IAS 19) Effective Date (Annual periods beginning on or after) Postponed January 1, 2018 January 1, 2018 January 1, 2018 IAS 40 - Transfersof Investment Property (Amendments to IAS 40) January 1, 2018 IFRS 15 - Revenue from Contracts with July 1, 2018 IFRS 9 - Financial Instruments July 1, 2018 IFRS 16 - Leases January 1, 2019 IFRIC 23 - Uncertainty over Income Tax January 1, 2019 Annual Improvements to IFRSs January 1, 2019 January 1, 2019 January 1, 2019 January 1, 2019 The Company is in the process of assessing the impact of these Standards, amendments and interpretations to the published standards on the financial statements of the Company. Annual Report
54 Note To The Unconsolidated Financial Statements Standards, amendments and interpretations to the published standards that are not yet notified by the Securities and Exchange Commission of Pakistan (SECP) Following new standards have been issued by the International Accounting Standards Board (IASB) which are yet to be notified by the SECP for the purpose of applicability in Pakistan. 4 CRITICAL ASSUMPTIONS AND ESTIMATES IFRS 14 - Regulatory Deferral Accounts IFRS 17 - Insurance Contracts Standard or Interpretation IASB effective date (Annual periods beginning on or after) January 1, 2016 January 1, 2021 The preparation of unconsolidated financial statements in conformity with approved accounting standards requires the use of certain critical accounting estimates. It also requires management to exercise its judgment in the process of applying the Company's accounting policies. Estimates and judgments are continually evaluated and are based on historical experience, including expectations of future events that are believed to be reasonable under the circumstances, the result of which form the basis of making the judgments about carrying values of assets and liabilities that are not readily apparent from other sources. Actual results may differ from these estimates. The estimates and underlying assumptions are reviewed on an ongoing basis. Revisions to accounting estimates are recognized in the period in which the estimates are revised, if the revision affects only that period, or in the period of the revision and future periods if the revision affects both current and future periods. The areas involving a higher degree of judgments or complexity or areas where assumptions and estimates are significant to the unconsolidated financial statements are as follows: Note (a) useful lives of property, plant and equipment 5.1 (b) impairment of financial assets 5.8 (c) provision for gratuity 5.13 (d) income taxes 5.16 (e) trade and other payables 5.18 (f) contingencies 5.19 (g) provisions 5.23 (h) impairment SUMMARY OF SIGNIFICANT ACCOUNTING POLICIES The principal accounting policies have been applied on consistent basis except as disclosed elsewhere. These policies have been adopted in the preparation of these unconsolidated financial statements are as follows: 5.1 Property, plant and equipment Owned assets Property, plant and equipment are stated at cost or revalued amount less accumulated depreciation and impairment losses, if any. Note To The Unconsolidated Financial Statements The cost of replacing part of an item of property, plant and equipment is recognized in the carrying amount of the item when it is probable that the future economic benefits associated with the item flow to the entity and its cost can be reliably measured. Normal repair and maintenance are charged to the profit and loss account during the period in which they are incurred. Depreciation is calculated so as to write-off the assets over their expected economic lives under the diminishing balance method at rates given in note 18.1 of the unconsolidated financial statements. Depreciation on addition is charged from the day an asset is available for use upto the day prior to its disposal. Gains and losses on disposal of assets are taken to the profit and loss account, and related surplus on revaluation of property and plant is transferred directly to retained earnings / unappropriated profits. 5.2 Leased assets Leased assets in terms of which the Company assumes substantially all the risks and rewards incidental to ownership are capitalized at the inception of the lease at the fair value of leased assets or, if lower, at the present value of the minimum lease payments. The outstanding obligations under the lease excluding finance charges allocated to future periods are shown as liability. Financial charges are allocated to the accounting periods in a manner so as to provide a constant rate of charge on the outstanding obligation. 5.3 Intangible assets An intangible asset is an identifiable non-monetary asset without physical substance. Intangible assets are recognized when it is probable that the expected future economic benefits will flow to the entity and the cost of the asset can be measured reliably. Cost of the intangible asset (i.e. computer software) includes purchase cost and directly attributable expenses incidental to bring the asset for its intended use. Costs associated with maintaining computer software are recognized as an expense as and when incurred. Intangible assets are stated at cost less accumulated amortization and accumulated impairment losses, if any. Amortization is charged over the estimated useful life of the asset on a systematic basis applying the straight line method. Useful lives of intangible operating assets are reviewed, at each balance sheet date and adjusted if the impact of amortization is significant. 5.4 Capital work-in-progress Capital work-in-progress is stated at cost less accumulated impairment losses, if any. All expenditures connected to the specific assets incurred during installation and construction period are carried under capital work-in-progress. Cost also includes applicable borrowing cost. These are transferred to specific assets as and when assets are available for use. Annual Report
55 Note To The Unconsolidated Financial Statements 5.5 Ijara contracts Leases, where a significant portion of the risks and rewards of ownership are retained by the lessor, are classified as Ijara contract. Payments made under Ijara contract (net of any incentives received from the lessor) are charged to the profit and loss account on a straight line basis over the lease term. 5.6 Investments 5.7 Investment in subsidiary companies Investment in subsidiary companies is initially recognized and carried at cost. At subsequent reporting dates, the recoverable amounts are estimated to determine the extent of impairment losses, if any, and carrying amounts of investments are adjusted accordingly. Impairment losses are recognized as expense. Where impairment losses subsequently reverse, the carrying amounts of the investments are increased to the revised recoverable amounts but limited to the extent of initial cost of investments. A reversal of impairment loss is recognized in income. 5.8 Financial assets For the purpose of subsequent measurement, financial assets are classified into the following categories upon initial recognition: (a) loans and receivables; (b) financial assets at fair value through profit or loss; (c) held to maturity; and (d) available-for-sale financial assets. (a) Loans and receivables Loans and receivables are non-derivative financial assets with fixed or determinable payments that are not quoted in an active market. Following financial assets fall into this category of financial instruments: - Trade debts - Deposits - Loans and advances - Other receivables These are stated at amortized cost using effective interest method. (b) Financial assets at fair value through profit or loss Investments which are acquired principally for the purpose of generating profit from short term fluctuations in prices are also classified as 'at fair value through profit or loss' or held for trading. Financial assets in this category are measured at fair value with gains or losses recognized in profit and loss account. These investments are marked to market and are carried on the balance sheet at fair value. Net gains and losses arising on changes in fair value of these investments are taken to the profit and loss account for the year. Note To The Unconsolidated Financial Statements (c) Available for sale Investments intended to be held for indefinite period of time, which may be sold in response to needs for liquidity or changes in equity prices, are classified as 'available for sale'. Available for sale financial instruments are those non-derivative financial assets that are designated as available for sale or are not classified as (a) loans and receivables (b) held to maturity investments (c) financial assets at fair value through profit or loss. Subsequent to initial recognition these investments are marked to market using the closing market rate and are carried on the balance sheet at fair value. Net gains and losses arising on changes in fair value of these investments are taken to statement of comprehensive income. (d) Impairment of financial assets A financial asset is assessed at each reporting date to determine whether there is any objective evidence that it is impaired. A financial asset is considered to be impaired if objective evidence indicates that one or more events have had a negative effect on the estimated future cash flows of that asset. An impairment loss is reversed if there has been a change in the estimates used to determine the recoverable amount. An impairment loss is reversed only to the extent that the asset's carrying amount does not exceed the carrying amount that would have been determined, net of depreciation or amortization, if no impairment loss had been recognized. 5.9 Financial liabilities The Company's financial liabilities include long term finances, trade and other payables, accrued mark up and short term borrowings. Derecognition These are derecognized when they are extinguished, discharged, cancelled or expired Derivative financial instruments Derivative financial instruments are initially recognized at fair value on the dates on which the derivative contracts are entered into and are subsequently re-measured at fair value using appropriate valuation techniques. All derivative financial instruments are carried as assets when fair value is positive and liabilities when fair value is negative. Any change in the fair value of derivative instruments is taken to the profit and loss account Stores, spares and loose tools These are valued at the cost less allowance for obsolete and slow moving items. Items in transit are valued at invoice value plus other charges incurred thereon, up to the balance sheet date Stock-in-trade These are valued at lower of cost and net realizable value less impairment loss, if any. Raw material is valued at moving weighted average cost, packing material is valued at cost, work in process is valued at manufacturing cost and finished goods is valued at cost allocated on sales value of finish and by-product for each job completion or net realizable value (NRV) whichever is lower. Net realizable value signifies the estimated selling price in the ordinary course of business less the estimated cost of completion and the estimated cost necessary to make the sale. Annual Report
56 Note To The Unconsolidated Financial Statements 5.13 Staff retirement benefits Defined benefit plan The Company operates an unapproved gratuity scheme for its employees completing the eligibility period of service as defined under the plan. This year provision is made in the financial statements based on the actuarial valuation using the Projected Unit Credit Method. Actuarial gains and losses for the defined benefit plan are recognized in full in the period in which they occur in other comprehensive income Trade debts These are measured at original invoice amount less an estimate made for doubtful receivable balances based on the review of all outstanding amounts at year end. Bad debts are written off when identified Cash and cash equivalents Cash and cash equivalents are carried in the balance sheet at cost. For the purpose of cash flow statement, cash and cash equivalents consist of cash in hand, balances with banks, highly liquid short-term investments that are convertible to known amounts of cash and are subject to insignificant risk of change in value Taxation Current The charge for current tax is based on taxable income at current rates of taxation after taking into account tax credits, rebates and exemptions available, if any, or in accordance with the final tax regime, where applicable, of the Income Tax Ordinance, 2001 (the Ordinance) or the minimum tax under section 113 of the Ordinance or Alternate Corporate Tax (ACT) under section 113C of the Ordinance, whichever is higher. Deferred Deferred tax is recognized using the balance sheet liability method on all temporary differences between the carrying amount of the assets and liabilities and their tax bases. Note To The Unconsolidated Financial Statements 5.17 Borrowings and their costs All borrowings are recorded at the proceeds received net of transaction cost. Borrowing costs directly attributable to the acquisition, construction or production of qualifying assets, which are assets that necessarily take a substantial period of time to get ready for their intended use are added to the cost of those assets, until such time as the assets are substantially ready for their intended use. All other borrowing costs are charged to income in the period in which these are incurred Trade and other payables Liabilities for trade and other payables are measured at cost which is the fair value of the consideration to be paid in future for goods and services Contingencies The assessment of the contingencies inherently involves the exercise of significant judgment as the outcome of the future events cannot be predicted with certainty. The Company, based on the availability of the latest information, estimates the value of contingent assets and liabilities which may differ on the occurrence/nonoccurrence of the uncertain future event(s). 5.2 Revenue recognition Revenue is measured at the fair value of the consideration received or receivable and represents amounts receivable for goods and services provided in the normal course of business. Local sales are recognized as revenue when invoiced with the transfer of significant risks and rewards of ownership, which coincides with delivery. Export sales are recognized as revenue when invoiced with the transfer of significant risks and rewards of ownership, which coincides with date of shipping bill. Export rebate is recognized on accrual basis at the time of export sale. Interest income is recognized on a time proportion basis that takes into account the effective yield. Deferred tax liabilities are recognized for all major taxable temporary differences. Deferred tax assets are recognized for all major deductible temporary differences to the extent that it is probable that taxable profit will be available against which the deductible temporary differences can be utilized. The carrying amount of the deferred tax asset is reviewed at each balance sheet date and is recognized only to the extent that it is probable that future taxable profits will be available against which the assets may be utilized. Deferred tax assets are reduced to the extent that it is no longer probable that the related tax benefit will be realized. Unrecognized deferred income tax assets are reassessed at each balance sheet date and are recognized to the extent that it becomes probable that future taxable profit will allow deferred tax asset to be recovered. Deferred tax assets and liabilities are measured at the tax rate that are expected to apply to the year when the asset is utilized or the liability is settled, based on the tax rates that have been enacted or substantially enacted at the balance sheet date Foreign currency translation Transactions in foreign currencies are accounted for in rupee at the rate of exchange prevailing on the date of transaction. Monetary assets and monetary liabilities in foreign currencies as at the balance sheet date are expressed in rupee at rates of exchange prevailing on that date. Non-monetary items that are measured in terms of historical cost in a foreign currency are translated using the exchange rate at the date of the transaction. Exchange differences are taken to the profit and loss account Off-settng of financial assets and financial liabilities Financial assets and financial liabilities are off-set and the net amount is reported in the financial statements only when the Company has a legally enforceable right to off-set the recognized amounts and the Company intends either to settle on a net basis or to realize the asset and settle the liability simultaneously Provisions A provision is recognized in the balance sheet when the Company has a legal or constructive obligation as a result of a past event, and it is probable that an outflow of economic benefits will be required to settle the obligation. Annual Report
57 Note To The Unconsolidated Financial Statements 5.24 Operating segments A business segment is a group of assets and operations engaged in providing products or services that are subject to risks and returns that are different from those of other business segments. As the operations of the Company are predominantly carried out in Pakistan, information relating to geographical segment is not considered relevant. The Company accounts for segment reporting using the business segments as the primary reporting format based on the Company's practice of reporting to the management on the same basis Impairment The carrying amount of the Company's assets are reviewed at each balance sheet date to determine whether there is any indication of impairment. If such an indication exists, the asset's recoverable amount is estimated and accordingly an impairment loss is recognized in the profit and loss account for the carrying amount of the asset that exceeds its recoverable amount Related party transactions All related party transactions are carried out by the Company on commercial terms Dividend Dividend distribution to the Company's shareholders is recognized as a liability in the Company's unconsolidated financial statements in the period in which such dividends are approved. 6 CHANGE IN ACCOUNTING POLICY The specific provision / section in the repealed Companies Ordinance, 1984 relating to the surplus on revaluation of fixed assets has not been carried forward in the Companies Act, Previously, section 235 of the repealed Companies Ordinance, 1984 specified the accounting treatment and presentation of the surplus on revaluation of fixed assets, which was not in accordance with the IFRS requirements. Accordingly, in accordance with the requirements of International Accounting Standard (IAS) 16, Property, Plant and Equipment, surplus on revaluation of fixed assets would now be presented under equity. Following the application of IAS 16, the Company s policy for surplus on revaluation of land and building stands amended as follows: - Increases in the carrying amounts arising on revaluation of land and buildings are recognized, net of tax, in other comprehensive income and accumulated in reserves in shareholders equity. To the extent that the increase reverses a decrease previously recognized in statement of profit or loss, the increase is first recognized in profit or loss. Decreases that reverse previous increases of the same asset are first recognized in other comprehensive income to the extent of the remaining surplus attributable to the asset; all other decreases are charged to profit or loss. Each year, the difference between depreciation based on the revalued carrying amount of the asset charged to profit or loss and depreciation based on the asset s original cost, net of tax, is reclassified from the Revaluation surplus on land and building to retained earnings. Note To The Unconsolidated Financial Statements The change in accounting policy has been accounted for retrospectively in accordance with the requirements of IAS 8 Accounting Policies, Changes in Accounting Estimates and Errors and comparative figures have been restated. The effect of change in accounting policy is summarized below: As at June 30, 2017 As at June 30, 2016 Previously Previously As-restated Re-statement reported reported As-restated Re-statement Effect on statement of Rupees financial position Surplus on revaluation of property, plant and equipment 571,665,218 - (571,665,218) 598,918,688 - (598,918,688) Share capital and reserves 571,665, ,665, ,918, ,918,688 Effect on statement of changes in equity Revaluation surplus of property, plant and equipment - 571,665, ,665, ,918, ,918,688 Effect on statement of comprehensive income Gain on revaluation of land and buildings - net of deferred tax - As June 30, 2017 Previously As-restated Re-statement reported Rupees There was no cash flow impact as a result of the retrospective application of change in accounting policy. Annual Report
58 Note To The Unconsolidated Financial Statements Note To The Unconsolidated Financial Statements 7 SHARE CAPITAL 7.1 Authorized Share Capital Number of shares Rupees Rupees Ordinary shares of Rs. 10 (2017: 200,000, ,000,000 Rs. 10) 2,000,000,000 2,000,000, Issued, Subscribed And Paid Up Share Capital Ordinary shares of Rs. 10 (2017: 50,340,213 21,197,213 Rs. 10) each fully paid in cash 503,402, ,972,130 Ordinary shares of Rs. 10 (2017: Rs. 10) each issued as fully paid 6,002,950 6,002,950 for consideration other than cash 60,029,500 60,029,500 Ordinary shares of Rs. 10 (2017: Rs. 10) each issued as fully paid 60,228,931 60,228,931 bonus shares 602,289, ,289, ,572,094 87,429,094 1,165,720, ,290, Shares held by the related parties of the Company Name of the shareholders Mr. Jawed Ali Ghori 22,661,925 22,661,925 Mr. Khalid Sarfaraz Ghori 22,886,925 22,886,925 Mr. Tariq Ghori 22,909,425 22,909,425 Mr. Faizan Ali Ghori 245, ,997 Ms. Naheed Jawed 427, ,500 Ms. Nuzhat Khalid Ghori 427, ,500 Ms. Sadaf Tariq 405, ,000 International Finance Corporation 17,485,819 17,485,819 Mr. Naeem-ur-Rehman Akhoond 1 1 Mr. Syed Kamran Rasheed 1 1 Mr. Iftikhar Soomro - 1 Mr. Abdul Samad Khan Reconciliation of number of shares outstanding is as under: Note --Number of Shares-- Shares at the beginning of the year 87,429,094 87,429,094 Shares issued during the year in cash ,143,000 - Bonus shares issued during the year - - Shares at the end of the year 116,572,094 87,429,094 8 CAPITAL RESERVE The Company has issued 15% shares to International Finance Corporation (IFC) (registered with world bank) under an agreement with the Company. During the year 2012, the Company offered shares as fully paid right shares which were declined by the existing members and the directors issued those shares to the IFC. These shares have been issued at a price of Rs per share resulting in overall premium on issue of shares amounting to Rs million. During the year, the Company has offered these shares to general public through Initial Public Offering (IPO). These shares have been issued at a price of Rs. 26 per share resulting in overall premium on issue of shares amounting to Rs million. Share premium 8.1 & ,367, ,382,823 This represents premium received over and above face value of the shares issued to International Finance Corporation amounting to Rs. 341 million out of which Rs million had been utilized under section 83 of the repealed Companies Ordinance, 1984 during the year ended June 30, This represents premium received over and above face value of the shares issued to general public through IPO amounting to Rs million out of which Rs million had been utilized under section 81 of the Companies Act, 2017 during the year ended June 30, SURPLUS ON REVALUATION OF PROPERTY, PLANT AND EQUIPMENT - NET OF TAX This represents surplus arising on revaluation of land, building and plant and machinery. The revaluation was carried by MYK Associates (Private) Limited and KG Traders (Private) Limited on March 31, (refer note 15.5). Balance at beginning of the year 571,665, ,918,688 Surplus arising on revaluation during the year - - Transferred to un-appropriated profits on account of - incremental depreciation (35,548,005) (39,497,783) - tax impact on incremental depreciation 10,664,401 12,244,313 Balance at end of the year 546,781, ,665,218 Annual Report
59 Note To The Unconsolidated Financial Statements 10 LONG TERM FINANCES - SECURED From banking companies and financial institution: Note Rupees Rupees - MCB Bank Limited 10.1 & ,357, ,930,722 - Pak Oman Investment Company Limited 10.3 & ,783,084 88,482,518 - United Bank Limited ,445,584 51,111, ,586, ,525,111 Current portion of long term finances (84,029,706) (96,733,247) 246,556, ,791,864 Note To The Unconsolidated Financial Statements 10.5 This include financing facility of LTFF Rs. 2.7 million and NIDF of Rs million (2017: LTFF Rs. 4.5 million and NIDF Rs million) for BMR expenses of the Company. The facility is secured by exclusive charge of Rs million (2017: Rs million) over land and building located at G-205 super highway Karachi., out of which Rs. 50 million (2017: Rs. 50 million) is tagged to this facility. Margin of Rs. 17 million (2017: Rs. 17 million) is secured against ranking charge over all present and future fixed assets of the Company. LTFF carries mark up at SBP rate plus 2.5% per annum and NIDF carries mark up at 6 months KIBOR plus 2.0% per annum (2017: LTFF SBP rate plus 2.5% per annum and NIDF 6 months KIBOR plus 2.0% per annum). These loans are repayable in semi-annual installments and shall be repaid by January Under the Musharika agreements, lease rentals are payable in 60 equal monthly installments. The financings carry mark-up at rates ranging from 6 months KIBOR plus 1.75% to 2.25% (2017: 6 months KIBOR plus 1.75% to 2.25%) per annum approximately which have been used as a discounting factor. The Company has the option to purchase the asset upon completion of the lease period This also includes LTFF financing facility of Rs. 250 million (2017: Rs 250 million) for rice protein/rice glucose plant. It is secured by 1st pari passu hypothecation charge of Rs million (2017: Rs million ) over all present and future fixed assets (excluding land and building). Further secured by 1st pari passu mortgage charge of Rs million over land and building (2017: Rs million). It carries mark-up at SBP rate plus 1.0% per annum (2017: SBP rate plus 1%). The Loan is repayable in quarterly installments starting from 15th month from first disbursement i.e. September This include LTFF/DF financing facility of Rs million (2017: Rs million) for plant & machinery expansion. It is secured by 1st hypothecation charge of Rs million (2017: Rs million) over all present and future fixed assets (excluding land and building). Further secured by 1st mortgage charge of Rs million (2017: Rs million) over land and building. It carries mark-up at 3 months KIBOR plus 1.0% per annum (2017: KIBOR plus 1.0% per annum). The Loan is repayable in semi annual installments and shall be repaid by April This include LTFF financing facility of Rs. 100 million (2017: Rs. 100 million) for import of various machineries and equipment required for expansion in grain storage silos in Sadhoki Punjab. It is secured by 1st pari passu charge of Rs. 133 million (2017: Rs. 133 million) over present and future fixed assets including land, building, plant & machinery of the project located at Sadhoki Punjab. This facility swap to Term Finance Facility and carries mark up at 3 months KIBOR plus 2.0% per annum (2017: 3 months KIBOR plus 2.0% per annum). The Loan is repayable in quarterly installments and shall be repaid by June The minimum lease payments for which the Company has committed to pay in future under the lease agreements are due as follows: Minimum Financial Present value of Minimum Financial Present value of lease charges minimum lease lease charges minimum lease payments payments Rupees Rupees Up to one year 16,397,852 4,171,563 12,226,289 9,788,105 1,788,829 7,999,276 Later than one year but not later than five years 38,144,067 8,859,647 29,284,420 18,179,284 2,046,438 16,132,846 Later than five years ,671, ,357 1,029,495 54,541,919 13,031,210 41,510,709 29,639,241 4,477,624 25,161, This also include LTFF financing facility of Rs. 60 million (2017: 60 million) for financing the import of paddy processing machinery at the Company's auto rice mill in Sadhoki Punjab. It is secured by 1st pari passu charge of Rs. 133 million (2017: Rs. 133 million) over fixed assets of the Company. This facility swap to Term Finance Facility and carries mark up at SBP Rate plus 1% per annum.(2017: SBP Rate plus 1% per annum). The loan is repayable in quarterly installments and shall be repaid by June Annual Report
60 Note To The Unconsolidated Financial Statements Note To The Unconsolidated Financial Statements 12 DEFERRED LIABILITIES Note Rupees Rupees Staff gratuity scheme - unfunded ,423,344 51,785,250 Deferred tax liability ,211, ,518, ,634, ,304, Staff gratuity scheme - unfunded Balance at beginning of the year 51,785,250 41,775,828 Charge for the year 29 & 31 15,859,134 15,098,528 Actuarial losses 229,441 3,109,867 Payments made during the year (8,450,481) (8,198,973) Balance at end of the year ,423,344 51,785, In accordance with the requirements of IAS-19 Employee Benefits, actuarial valuation was carried out as at June 30, 2018, using the Projected Unit Credit Method. Provision has been made in these unconsolidated financial statements to cover obligations in accordance with the actuarial recommendations. Details of significant assumptions used for the valuation in respect of above-mentioned schemes are as follows: Discount rate - per annum 9.00% 7.50% Expected rate of increase in salaries - per annum 8.00% 6.50% The amounts recognized in the balance sheet are as follows: Present value of defined benefit obligation 59,193,903 48,675,383 Actuarial losses 229,441 3,109, ,423,344 51,785, Movements in the net liability recognized in the balance sheet are as follows: The expense for the staff retirement benefit scheme has been allocated as follows: Note Rupees Rupees Opening liability 51,785,250 41,775,828 Charge for the year ,859,134 15,098,528 Actuarial losses 229,441 3,109,867 Benefits paid (8,450,481) (8,198,973) Balance at end of the year 59,423,344 51,785,250 The amounts recognized in the profit and loss account against defined benefit scheme are as Current service cost 12,292,133 11,707,657 Interest cost 3,567,001 3,390,871 Charge for the year 15,859,134 15,098,528 The amounts recognized in the other comprehensive against defined benefit scheme are as follows: Remeasurement of defined benefits obligation (229,441) (3,109,867) Expense chargeable to profit and loss account for the next year Current service cost 15,577,487 12,069,285 Interest cost 5,348,101 3,883,894 Charge for the year 20,925,588 15,953,179 Cost of sales ,246,750 7,862,500 Administrative expenses ,612,384 7,236,028 15,859,134 15,098, This represent deferred tax on surplus on revaluation of property, plant and equipment. Further, the Company has deferred tax asset amounting to Rs million (Rs. 2017: 10.5 million). However, the Company has not recorded deferred tax asset in the books of the Company. Annual Report
61 Note To The Unconsolidated Financial Statements Note To The Unconsolidated Financial Statements 13 TRADE AND OTHER PAYABLES Note Rupees Rupees 15 SHORT TERM BORROWINGS - SECURED Note Rupees Rupees Creditors 158,895, ,672,947 Accrued liabilities 32,810,654 21,571,823 Security deposit from customer ,000 - Payable to a related party - unsecured ,121,816 - Tax deducted at source and payable to statutory authorities 1,079,529 1,454,300 Sales tax payable 591,311 3,469 Workers welfare fund ,140,803 3,073,894 Workers profit participation fund ,263,606 12,836, ,928, ,612,662 This represents amount received from the customer of the Company, which is utilized for the purpose of the business in accordance with the related agreements. This represents amount received from the Matco Marketing (Private) Limited for the purpose of expenses to be incurred by the Company on behalf of Matco Marketing (Private) Limited Workers welfare fund Opening balance 3,073,894 27,619,736 Allocation of the year 7,066,909 3,073,894 Reversal of WWF - (27,619,736) Closing balance 10,140,803 3,073, Workers profit participation fund Opening balance 12,836,230 - Allocation of the year 15,263,606 12,836,230 Amount paid to the fund (12,836,230) - Closing balance 15,263,606 12,836, ACCRUED MARK-UP Mark-up on long term finances 4,436,488 12,469,173 Mark-up on short term borrowings 44,042,236 33,586,990 Mark-up on finance lease 288,704-48,767,428 46,056,163 MCB Bank Limited (MCB) Export refinance (secured) 15.1 & ,352, ,852,000 Foreign bills purchased/negotiated ,136,007 United Bank Limited (UBL) FAPC I (secured) ,397, ,397,000 Foreign bills purchased/negotiated ,888,652 Askari Bank Limited (AKBL) Export refinance (secured) ,200, ,061,934 National Bank of Pakistan (NBP) Export refinance (secured) ,000, ,000,000 Habib Metropolitan Bank Limited Export refinance (secured) ,900, ,000,000 Foreign bills purchased/negotiated ,230,753 - Allied Bank Limited (ABL) Export refinance ,000, ,000,000 Habib Bank Limited (HBL) Export refinance ,200, ,000,000 Standard Chartered Bank Export refinance ,500, ,500,000 Faysal Bank Limited Export refinance ,500, ,000,000 Bank Al Falah Limited Export refinance ,500, ,000,000 Pak Oman Investment Export refinance ,000, ,000,000 4,081,779,753 3,886,835,593 Annual Report
62 Note To The Unconsolidated Financial Statements 15.1 This facility has been obtained under State Bank of Pakistan (SBP) Export Refinance Scheme. The sanctioned limit is Rs. 330 million (2017: Rs. 330 million). It carries mark-up at SBP rate plus 1.0% per annum (2017: SBP rate plus 1.0% per annum). This facility is secured by 1st registered joint pari passu hypothecation charge of Rs. 600 million over all present and future current assets, 1st registered joint pari passu hypothecation charge of Rs. 135 million over all present and future fixed assets excluding land & building, 1st registered joint mortgage charge of Rs. 135 million over land and building and properties. (2017: 1st registered joint pari passu hypothecation charge of Rs. 600 million over all present and future current assets, 1st registered joint pari passu hypothecation charge of Rs. 135 million over all present and future fixed assets excluding land & building, 1st registered joint mortgage charge of Rs. 135 million over land and building and selected properties) and personal guarantees of nominee directors. The facility expiry date is 31 March This facility has been obtained under SBP Export Refinance Scheme. The sanctioned limit is Rs. 250 million (2017: Rs. 250 million). Formerly, it belonged to NIB Bank. It carries mark-up at SBP rate plus 0.75% (2017: SBP rate plus 0.75% per annum). This facility is secured by joint pari passu charge of Rs. 334 million over all present and future current assets, joint pari passu charge of Rs. 75 million over all present and future movable fixed assets and immovable properties.(2017: Joint pari passu charge of Rs. 334 million over all present and future current assets, joint pari passu charge of Rs. 75 million over all present and future movable fixed assets and immovable properties.) and personal guarantees of sponsoring directors. The facility expiry date is 30 November The sanctioned limit is Rs. 100 million (2017: Rs. 100 million). It carries mark-up at LIBOR plus spread per annum to be negotiated at the time of execution of transaction. This facility is secured by lien over clean export bills drawn under LCs of "A" rated banks and further secured through securities as mentioned in note The facility expiry date is 31 March This facility has been obtained under SBP Export Refinance Scheme. The sanctioned limit is Rs. 500 million (2017: Rs. 500 million). It carries mark-up at SBP rate plus 1.0% per annum (2017: SBP rate plus 1.0% per annum). This facility is secured by 1st joint pari passu hypothecation charge of Rs. 800 million over all present and future current assets with 25% margin, 1st joint pari passu hypothecation charge of Rs million over all present and future fixed assets (excluding land & building), 1st joint mortgage charge of Rs million over land and building of selected properties.{2017: 1st joint pari passu hypothecation charge of Rs. 800 million over all present and future current assets, 1st joint pari passu hypothecation charge of Rs. 75 million over all present and future fixed assets (excluding land & building), 1st joint mortgage charge of Rs. 75 million over land and building of selected properties} and personal guarantees of sponsoring directors. The facility expiry date is 30 November, This sanctioned limit is Rs. 100 million (2017 : Rs. 100 million). It carries mark-up rate negotiated at the time of execution of transaction (2017: mark-up rate negotiated at the time of execution of transaction). This facility is secured through securities as mentioned in note The facility expiry date is 30 November, This facility has been obtained under SBP Export Refinance Scheme. The sanctioned limit is Rs. 488 million (2017: Rs. 488 million). It carries mark-up at SBP rate plus 0.75% per annum/ 3 Month KIBOR plus 1% per annum (2017: SBP rate plus 0.75% per annum/ 3 Month KIBOR plus 1 per annum). This facility is secured by 1st joint pari passu hypothecation charge of Rs million over all current assets with 25% margin, 100% secured against Cash collateral in the shape of TDR in the name of company/ Director having value Rs. 1.2 Note To The Unconsolidated Financial Statements million, 1st joint pari passu mortgage charge of Rs. 150 million over fixed assets (2017: 1st joint pari passu hypothecation charge of Rs million over all current assets with 25.0% margin, 1st joint pari passu mortgage charge of Rs. 150 million over fixed assets). The facility expiry date is 31 March, This facility has been obtained under SBP Export Refinance Scheme. The sanctioned limit is Rs. 400 million (2017: Rs. 400 million). It carries mark-up at KIBOR plus 2% per annum (2017: KIBOR plus 2% per annum). This facility is secured by 1st pari passu hypothecation charge of Rs million over all present and future current assets,1st pari passu hypothecation charge of Rs. 120 million over all present and future fixed assets (excluding land and building), 1st pari passu equitable mortgage charge of Rs. 120 million over all immovable properties (including land and building). {2017: 1st pari passu hypothecation charge of Rs 534 million over all present and future current assets,1st pari passu hypothecation charge of Rs. 120 million over all present and future fixed assets (excluding land and building), 1st pari passu equitable mortgage charge of Rs. 120 million over all immovable properties (including land and building} and personal guarantees of sponsoring directors. The facility expiry date is 31 March This facility has been obtained under SBP Export Refinance Scheme. The sanctioned limit is Rs. 300 million (2017: Rs. 300 million). It carries mark-up at SBP rate plus 1.0% per annum/ 3 Months KIBOR plus 1% (2017: SBP rate plus 1.0% per annum/ 3 Months KIBOR plus 1%). This facility is secured by joint pari passu hypothecation charge of Rs. 400 million over all present and future current assets, joint pari passu hypothecation charge of Rs. 90 million over all present and future fixed assets(excluding land and building), joint pari passu equitable mortgage charge of Rs. 90 million over land and building of selected properties.{2017: Joint pari passu hypothecation charge of Rs. 400 million over all present and future current assets, joint pari passu hypothecation charge of Rs. 90 million over all present and future fixed assets(excluding land and building), joint pari passu equitable mortgage charge of Rs. 90 million over land and building of selected properties} and personal guarantees of sponsoring directors. The facility expiry date is 31 March The sanctioned limit is Rs. 250 million (2017: Rs. 100 million). It carries mark-up that is to be negotiated on case to case basis. (2017: to be negotiated on case to case basis). This facility is secured by ranking hypothecation charge of Rs. 133 million over stocks and receivables duly insured in bank's favor covering all risks with premium payment receipt. (2017: ranking hypothecation charge of Rs. 133 million over stocks and receivables duly insured in bank's favor covering all risks with premium payment receipt.) and lien over clean/ accepted documents under export LCs. The facility expiry date is 31 March This facility has been obtained under SBP Export Refinance Scheme. The sanctioned limit is Rs. 250 million (2017 : 250 million). It carries mark-up at SBP rate plus 0.75% per annum (2017 : SBP rate plus 0.75% per annum). This facility is secured by 1st joint pari passu hypothecation charge of Rs million over all present and future current assets, 1st joint pari passu charge of Rs. 84 million over all present and future fixed assets including land, building, plant & machinery (2017: 1st joint pari passu hypothecation charge of Rs million over all present and future current assets, 1st joint pari passu charge of Rs. 84 million over all present and future fixed assets including land, building, plant & machinery) and personal guarantees of sponsoring directors. The facility expiry date is 29 March This facility has been obtained under SBP Export Refinance Scheme. The sanctioned limit is Rs. 370 million (2017: Rs. 320 million). It carries mark-up at SBP rate plus 1.00% per annum/ 3 Months KIBOR plus 0.75% (2017: SBP rate plus 1.00% per annum/ / 3 Months KIBOR plus 0.75%). This facility is secured by joint pari passu Annual Report
63 Note To The Unconsolidated Financial Statements hypothecation charge of Rs million over all current assets with 25% margin, joint pari passu hypothecation charge over all present and future fixed assets plus joint pari passu mortgage over all immovable properties collectively of Rs. 111 million. (2017: Joint pari passu hypothecation charge of Rs million over all current assets, joint pari passu hypothecation charge over all present and future fixed assets plus joint pari passu mortgage over all immovable properties collectively of Rs. 111 million.)and personal guarantees of sponsoring directors The facility expiry date is 28 February The sanctioned limit of said facility is Rs. 250 million (2017: Rs. 250 million). It carries mark-up that to be negotiated at the time of utilization. This facility is secured by first joint pari passu hypothecation charge amounting to Rs million over all present and future stocks and receivables, first joint pari passu hypothecation charge amounting to Rs. 75 million over all present and future fixed assets including land, building, plant and machinery (2017: first joint pari passu hypothecation charge amounting to Rs million over all present and future stocks and receivables, first joint pari passu hypothecation charge amounting to Rs. 75 million over all present and future fixed assets) and personal guarantees of sponsoring directors for Rs. 250 million jointly and severally. The facility expiry date is June 30, This facility has been obtained under SBP Export Refinance Scheme. The sanctioned limit is Rs. 550 million (2017: Rs. 550 million). It carries mark-up at SBP rate plus 0.75% per annum/ 3 Months KIBOR plus 0.75% per annum (2017: SBP rate plus 0.75% per annum/ 3 Months KIBOR plus 0.75% per annum). This facility is secured by 1st pari passu hypothecation charge of Rs million over stock and book debts, 1st pai passu hypothecation and mortgage charge of Rs. 165 million over fixed assets (2017: 1st pari passu hypothecation charge of Rs. 734 million over stock and book debts, 1st pai passu hypothecation and mortgage charge of Rs. 165 million over fixed assets.), lien over export documents and personal guarantees of executive directors. The facility expiry date is 31 December This facility has been obtained under SBP Export Refinance Scheme. The sanctioned limit is Rs. 300 million (2017: Rs. 300 million). It carries mark-up at SBP rate plus 0.75% per annum/ 3 Months KIBOR plus 0.75% per annum (2017: SBP rate plus 0.75% per annum/ 3 Months KIBOR plus 0.75% per annum).this facility is secured by 1st pari passu hypothecation charge of Rs. 400 million over current assets (Stock/Receivables), 1st pari passu equitable mortgage charge of Rs. 90 million over land, building, plant & machinery. {2017: Rs.1st pari passu hypothecation charge of Rs. 400 million over current assets (Stock/Receivables), 1st pari passu equitable mortgage charge of Rs. 90 million over land, building, plant & machinery} and personal guarantees of sponsoring directors. The facility expiry date is 31 December The sanctioned limit is Rs. 250 million (2017: Rs. 250 million ). It carries mark-up rate at KIBOR plus 2% per annum (2017: KIBOR plus 2.% per annum). This facility is secured by ranking charge over current assets of the company with 25% margin, post dated cheque of principle amount and two markup payments and personal guarantees of sponsor directors. The facility expiry date is 13 October This represents part of interim dividend for the half yearly ended December 31, 2017 which remained unpaid to the shareholders who have not provided their valid CDS Account no. and IBAN no. The Company has already sent letters to those shareholders for the purpose of above stated information. Note To The Unconsolidated Financial Statements 17 CONTINGENCIES AND COMMITMENTS 17.1 Contingencies This civil suit No of 2009 for possession and injunction has been filed by the Company in the Honorable High Court of Sindh against province of Sindh and other parties. The suit was filled for the possession of land, it was dispossessed by the defendants, to restore it and a permanent injunction to restrain the defendants from alienating or transferring the land. This suit was instituted on November 18, The next hearing is expected on September 11, In 2015 the plaintiff Mr. Syed Alay Sadqain Naqvi filed the suit no in the court of senior civil judge against the Company and four others claiming to be the lawful owner of a piece of property, which is also the subject matter in suite No of 2009 above. This suit has been dismissed by the senior civil judge on August 29, 2017 with a view that suit is hopelessly barred by law. However, Mr. Syed Alay Sadqain Naqvi has again filed appeal no. 311 of 2017 against the Company in the court of district session judge on the same subject matter. The subject matter of this suit has already been dismissed by the lower courts twice thus barred under the principle of res judicata. The Petition No. 3358/2011 and 1823/2013 was instituted on December 13, 2011 and April 29, 2013 by the Company against Federal Board of Revenue (FBR) and Others in Honorable High Court of Islamabad. Whereby, the chargeability of the customs duty against import of storage silos has been challenged. It is pertinent to point out that the said import was exempt from duties and taxes vide SRO No. 575(I) Now through SRO dated October 23, 2012, the said silos have been added as clarificatory being exempt. The said chargeability of Customs Duty has been challenged of the intervening period through these petitions. Company has filed intra court appeal ICA no. 84/2015 and 85/2015 on February 26, Both the appeals are pending in Houranable High Court of Islamabad, notices are issued. The hearing is expected on October 10, In the meanwhile the Company has also filled suit no. 392 of 2015 against the Federal Board of Revenue and Model Customs Collectorate due to suspension of Company's Customs ID and the threatened suspension of NTN of Company. An interim restraining order against such suspension was granted in favour of Company by the Honorable High Court of Sindh, which is operative till date. The case is still pending adjudication. The Counsel hopes these cases will be decided in favor of the Company. The management of the Company on the basis of the Counsel s opinion is confident that the Company is not likely to suffer any losses on account of the said petition. In prior years Sindh Government imposed infrastructure 0.85% of import value on all imports into Pakistan. A large number of importers including the Company filed the Constitution Petition No of 2013 in the Honorable High Court of Sindh against Province of Sindh. This petition was instituted on May 20, The honorable High Court of Sindh has issued an interim order allowing release of imported goods on 50% payment and 50% bank guarantee. The litigation is pending adjudication. The management of the Company on the basis of the Counsel s opinion is confident that the Company is not likely to suffer any losses on account of the said petition. Annual Report
64 Note To The Unconsolidated Financial Statements 17.2 Commitments 18 PROPERTY PLANT AND EQUIPMENT Note Rupees Rupees Capital expenditures 345,991,757 - Forward exchange contracts to sell - 755,280,000 Letter of credit 300,482,000 3,568,347 Letter of guarantees - 18,246,460 Ijara contracts ,784 3,276, ,548, ,371, Commitments for rentals under cancellable Ijara contracts in respect of vehicles are as follows: Not later than one year 74,784 3,201,816 Later than one year but not later than five years - 74,784 74,784 3,276,600 Operating fixed assets ,163,162,877 1,781,931,114 Capital work in progress ,422, ,377,007 2,168,585,255 2,141,308,121 Note To The Unconsolidated Financial Statements 18.1 Operating fixed assets Particulars Owned Assets Cost at July 01, 2018 Leasehold land 90,000, ,000, ,000,000 - Factory land 452,921,021 78,973, ,894, ,894,744 - Factory building 715,359, ,746, ,105, ,418,521 52,306, ,725, ,380, Plant and machinery 1,056,260, ,036, ,304,296, ,563,989 81,032, ,596, ,700, Electric cables and fittng 39,553,820 22, ,576,420 17,706,633 2,185,251-19,891,884 19,684, Furniture and fixture 9,489, , ,945,997 5,089, ,748-5,555,169 4,390, Motor vehicles 69,018,242 15,378,291-7,332,887 77,063,646 54,447,066 8,806,462 5,029,667 58,223,861 18,839, Office equipment 19,294,764 1,111, ,406,020 10,402, ,071-11,350,739 9,055, Factory equipment 13,164,270 3,459, ,624,025 6,220, ,473-7,083,754 9,540, Computers 16,192, , ,941,349 10,702,301 1,951,597-12,653,898 4,287, Camera 3,468, ,468,608 3,111, ,898-3,229, , Godown & Shops 25,997,428 38, ,153,871 23,881,972 8,305,214 1,771,853 1,526,666 8,550,401 15,331, Sewing machine 1,244,205 35, ,279, ,537 53, , , Mobile phone 2,658, , ,799,027 1,543, ,359-1,948, , Generator 70,038, ,038,367 30,740,751 3,929,762-34,670,513 35,367, Sub-total 2,584,661, ,146, ,486,758 3,106,321, ,968, ,838,434 6,556,333 1,002,250,235 2,104,071,641 Leased Assets under diminishing musharika Additions Cost / Revaluation Transfers in / (out) Revaluation surplus (Disposals) Cost at June 30, 2018 Motor Vehicle 59,449,260 15,269, ,718,435 8,211,681 7,415,518-15,627,199 59,091, Total 2,644,110, ,416, ,486,758 3,181,040, ,179, ,253,952 6,556,333 1,017,877,434 2,163,162, Accumulated depreciation at July 01, 2018 Depreciation Depreciation for the year (Depreciation on disposals) Accumulated depreciation at June 30, 2018 Book value at June 30, 2018 Rate per annum % Particulars Cost at July 01, 2017 Additions Cost / Revaluation Transfers in / (out) Revaluation surplus (Disposals) Cost at June 30, Accumulated depreciation at July 01, 2017 Depreciation Depreciation for the year (Depreciation on disposals) Accumulated depreciation at June 30, 2017 Book value at June 30, 2017 Rate per annum % Owned Assets Leasehold land 90,000, ,000, ,000,000 - Factory land 442,863,012 10,058, ,921, ,921,021 - Factory building 715,149, , ,359, ,107,186 46,311, ,418, ,940, Plant and machinery 959,703,390 96,557, ,056,260, ,086,518 65,477, ,563, ,696, Electric cables and fittng 39,553, ,553,820 15,279,168 2,427,465-17,706,633 21,847, Furniture and fixture 9,436,987 52, ,489,967 4,603, ,530-5,089,421 4,400, Motor vehicles 98,699,792 2,085,700 (21,478,250) - 10,289,000 69,018,242 50,370,627 11,290,253 7,213,814 54,447,066 14,571, Office equipment 18,777, , ,294,764 9,463, ,784-10,402,668 8,892, Factory equipment 12,534, , ,164,270 5,475, ,266-6,220,281 6,943, Computers 13,336,429 2,856, ,192,668 9,103,771 1,598,530-10,702,301 5,490, Camera 3,468, ,468,608 2,935, ,968-3,111, , Godown & Shops 10,190,807 15,806, ,997,428 7,653, ,192-8,305,214 17,692, Sewing machine 1,244, ,244, ,907 58, , , Mobile phone 1,853, , ,658,437 1,223, ,328-1,543,411 1,115, Generator 70,038, ,038,367 26,374,349 4,366,402-30,740,751 39,297, Sub-total 2,486,850, ,578,064 (21,478,250) - 10,289,000 2,584,661, ,333, ,848,154 7,213, ,968,134 1,730,693,535 Leased Assets under diminishing musharika Motor Vehicle 19,964,560 18,006,450 21,478, ,449,260 5,475,132 2,736,549-8,211,681 51,237, Total 2,506,815, ,584, ,289,000 2,644,110, ,808, ,584,703 7,213, ,179,815 1,781,931,114 Annual Report
65 Note To The Unconsolidated Financial Statements The depreciation charge for the year has been allocated as follows: Note To The Unconsolidated Financial Statements Particulars of immovable property (i.e. land and building) in the name of Company are as follows: Note Rupees Rupees Locations Total Area in Acres Covered Area in Square Feet Cost of sales ,803, ,067,763 Distribution expenses 30 8,112,698 6,879,235 Administrative expenses 31 24,338,093 20,637, ,253, ,584, Factory land includes a plot in which a law suit has been filed by the plaintiff who is claiming the possession and injunction of the property. The case is in process under the Honorable High Court Sindh Karachi (refer note ) Operating fixed assets include assets that are subject to mortgage with various banks against long term finances and short term borrowings (refer note 10 and 15) Details of forced sale value of revalued property, plant and equipment Description of Assets Forced sale value Rupees Land 393,075,000 Building 466,544,600 Plant and machinery 564,560,000 The above forced sale value has been taken from revaluation report of K.G Traders (Private) Limited as on 7 Apr Following items of property, plant and equipment having book value above Rs. 500,000 were disposed off during the year: Vehicles Toyota Vigo Building Cost / Revaluation Accumulated depreciation Net book amount Sale proceeds Gain / (Loss) Rupees Mode of disposal 2,848,291 1,613,324 1,234,967 2,450,000 1,215,033 Negotiation Particulars of buyer Ghulam Muhammad Chaang L-24/1, Block-21, Federal 'B' Industrial Area, Karachi Plot A-15 & 16, SITE-II, Super highway Karachi A-21, SITE-II, Super highway, Karachi G-205, SITE-II, Super highway, Karachi 50 KM G.T Road, Sadhoke District, Gujranwala Plot G-06, Port Qasim Authority, Karachi B1-A, SITE-II, Super highway, Karachi Plot H-162, SITE-II, Super highway, Karachi Plot F-193, SITE-II, Super highway, Karachi 50 KM G.T Road, Sadhoke District, Gujranwala CAPITAL WORK IN PROGRESS Note Rupees Rupees Safora Shop 2,153,871 1,526, ,205 2,335,000 1,707,795 Through agent Zeeshan Total 5,002,162 3,139,990 1,862,172 4,785,000 2,922,828 The buyers do not have any relationship with the Company and its directors. Annual Report Tang ibles Plant and machinery Civil and electric work - 359,064, ,422, ,726 5,422, ,377,007
66 Note To The Unconsolidated Financial Statements Note To The Unconsolidated Financial Statements The amount belongs to the construction of rice glucose plant installing at G-205, SITE II, super highway, Karachi from the IPO proceeds Movement in capital work in progress is as under: 18.3 Cost Additions / 2018 As at July (adjustment) (Transferred) As at June 01, 2017 during the to fixed assets 30, 2018 year Rupees Plant and machinery 359,064,281 12,343,339 (371,407,620) - Civil works 312,726 42,707,652 (37,598,000) 5,422, ,377,007 55,050,991 (409,005,620) 5,422, year Rupees Plant and machinery 15,196, ,341,808 (73,473,817) 359,064,281 Civil works 209,948 30,600,584 (30,497,806) 312,726 15,406, ,942,392 (103,971,623) 359,377,007 Net book value As at July 01, 2016 Additions / (adjustment) during the Rupees Rupees Leasehold land 21,317,504 21,317,504 Factory land 161,484, ,484,005 Factory building 320,534, ,149,028 Plant and machinery 394,565, ,405,629 Cost (Transferred) to fixed assets As at June 30, 2017 Had there been no revaluation, the net book value of specific classes of operating property, plant and machinery would have been amounted to: 897,900, ,356, INTANGIBLE ASSETS Cost 20 Subsidiary Note Rupees Rupees JKT General Trading FZE ,582,747 23,582,747 Matco Marketing (Private) Limited ,499, STORES, SPARES AND LOOSE TOOLS 21.1 Opening - 14,710,766 Addition during the year - - Closing - 14,710,766 Am ortization Opening - (9,807,178) Charge for the year - (4,903,588) Closing - (14,710,766) Balance as at June LONG TERM INVESTMENTS - IN RELATED PARTY 31,082,707 23,582, On October 8, 2013, the Company incorporated a new wholly owned subsidiary, JKT General Trading FZE in Dubai. The principal activities are manufacturing, general trading, export / import and other related activities. The Company has made an equity investment of USD 255,000 out of which share of USD 40,872 have been issued. Shares for the remaining amount would be issued after completion of necessary regulatory formalities On November 13, 2017, the Company has subscribed 749,996 shares of Matco Marketing (Private) Limited. However, Matco Marketing (Private) Limited has not commenced its operations since incorporation Further, no such terms and conditions has been made at the time of investment. No return on investment has been made since incorporation. No litigation has been made against the subsidiaries. Stores and spares ,271,197 15,373,483 Provision for slow moving / obsolete items 21.1 (1,543,929) (1,543,929) Movement in provision for slow moving / obsolete items 18,727,268 13,829,554 Balance at beginning of the year 1,543,929 1,345,492 Charge for the year - 198,437 Balance at end of the year 1,543,929 1,543,929 Annual Report
67 Note To The Unconsolidated Financial Statements Note To The Unconsolidated Financial Statements 22 STOCK IN TRADE Note Rupees Rupees Raw materials ,180,456,923 4,581,456,782 Packing materials ,650,372 57,209,207 Finished goods ,118, ,451,055 5,159,225,871 5,250,117,044 Provision for slow moving / obsolete items 22.1 (20,245,075) (9,626,080) Movement in provision for slow moving / obsolete items 5,138,980,796 5,240,490,964 Opening balance 9,626,080 1,662,515 Charge for the year ,618,995 7,963,565 Closing balance 20,245,075 9,626,080 This includes pledged stock of raw material with various banks under long term and short term borrowing arrangements (refer note 10 and 15). This includes by product amounting to Rs million (2017: Rs million). 23 TRADE DEBTS Considered good Export - secured ,158, ,644,632 Local - unsecured 174,304, ,888,141 Considered doubtful Local - unsecured 7,464,595 Less: Provision for doubtful debts 23.5 (7,464,595) - 674,463, ,532, Export trade debts are outstanding against total export sales made to the following countries under documents against acceptance basis: Name of Country Rupees Rupees Australia 1,126,726,619 1,159,075,256 Bangladesh 50,288, ,179,799 Canada 47,440,416 52,320,993 Djibouti 71,603,603 45,332,395 France 240,067, ,867,840 Iraq 49,913,386 10,407,112 Maldives 15,309,277 43,083 Netherland 510,493,815 23,551,040 Poland 13,330,836 - Portugal 236,838,750 52,808,499 Qatar 34,734,109 30,809,007 Russia 222,562,432 93,515,611 South Africa 38,503,715 20,631,637 Spain 45,832, ,292,687 Sweden 35,053,105 30,688,190 Thailand 56,888,338 13,976,693 UAE 333,876, ,674,496 UK 411,646, ,359,450 USA 230,569, ,398,521 Total 3,771,678,279 3,050,932, As of June 30, 2018, the age analysis of trade debts is as follows: Borrowings are secured by way of charge over book debts of the Company (refer notes 10 and 15). It includes the amount of Rs million (2017: Rs. Nil ) due from JKT General Trading FZE (related party). The maximum aggregate amount due from related party at the end of any month during the year was Rs million (2017: Rs million). Not yet due - - Past due: - Up to 3 months 626,615, ,760,074-3 to 6 months 14,754,861 12,772,699-6 to 12 months 3,234, More than 12 months 37,322, ,928, ,532, ,928, ,532,773 Annual Report
68 Note To The Unconsolidated Financial Statements Note To The Unconsolidated Financial Statements 23.5 Provision against doubtful trade debts Note Rupees Rupees Opening balance - - Provision made during the year 7,464,595 - Reversals made during the year - - Closing balance 7,464, SHORT-TERM LOANS AND ADVANCES Loans Staff - unsecured, considered good ,494,263 4,295,915 Advances against services and others 1,032,798 1,417,957 against purchases 19,242,652 52,457,717 to contractors ,962,338 83,732,051 58,171, These represent interest free loans to various staff in accordance with the Company's policy The maximum aggregate amount due from executives at the end of any month during the year was Rs. 117,500 (2017: Nil) It represents the amount provided to contractors for construction purpose. It is adjustable against the services and no collateral security has been obtained against these amount. Name of Party A. A. Associates M. Shahid Engineering Works Iqbal Engineering House Huzefa Engineering Rupees 2,723,138 7,042,310 2,533,550 11,092,943 Amreli Steels Ltd. 9,581,346 Izhar Steel Pvt Ltd 9,262,503 Suria Engineering 6,096,133 Rafiq Cement Supplier 7,500,000 Anhui Yongcheng Electronic & Mechanical Technology Co.,Ltd 1,130,415 56,962, TRADE DEPOSITS AND SHORT TERM PREPAYMENTS Deposits Note Rupees Rupees - Capital management account 681, ,549 - Guarantee margin 1,514,650 1,514,650 Prepayments 2,196,199 2,196,199 - Prepaid expense ,609,414 3,040,617 - Prepaid insurance 4,037,825 3,736,344 10,843,438 8,973, This include prepaid expense relating to godown rent and system maintenance charges. 26 OTHER RECEIVABLES Sales tax refundable ,564,331 81,549,201 Receivable from related parties ,615 1,414,322 Unrealized gain on forward foreign exchange contracts - 1,781, Movement in sales tax refundable is as under: 85,369,946 84,745,163 Balance at beginning of the year 81,549,201 36,987,289 Refunds claim for the year 43,009,774 62,078,618 Received during the year (38,303,049) (16,008,411) Adjusted during the year (1,691,595) (1,508,295) Balance at end of the year 84,564,331 81,549, It includes the amount due from JKT General Trading FZE, Matco Engineering (Private) Limited and Ghori Trust amounting to Rs. 295,831, Rs. 489,584 and Rs. 20,200 respectively against expenses incurred on behalf of them. Annual Report
69 Note To The Unconsolidated Financial Statements Note To The Unconsolidated Financial Statements 27 CASH AND BANK BALANCES 27.1 Note Rupees Rupees Cash in hand 4,507,418 2,225,894 Cash at bank - current accounts 147,138,260 94,423,510 - deposit accounts 373,233,385 13,205,576 - term deposit certificates ,200,000 1,200, ,571, ,829, ,079, ,054,980 These represent term deposit certificates of Habib Bank Limited and Askari Bank Limited amounting to Rs. 297 million and Rs. 1.2 million respectively. The rate of profit on these certificates is between 4.75% to 5.6% per annum (2017: 4.74%). These term deposit certificates will mature within a year. 28 SALES - NET Export sales 4,952,359,418 4,034,161,714 Local sales Rice 675,703, ,131,571 By-products 1,302,458,886 1,397,999,621 1,978,162,680 2,129,131,192 6,930,522,098 6,163,292,906 Sales discount / return (56,434,263) (27,251,297) Sales tax (4,695,737) (1,616,931) 6,869,392,098 6,134,424, COST OF SALES Note Rupees Rupees Rice consumed ,272,963, ,519,662,817 - Packing materials consumed ,363, ,895,564 Stores and spares consumed ,778,514 25,566,817 Processing expenses Salaries, wages and benefits ,343, ,651,720 Electricity and power 61,509,485 45,621,805 Telephone and mobile 756, ,087 Gas charges 18,777,760 20,900,719 Insurance 10,265,138 10,620,942 Repairs and maintenance 15,821,505 10,272,638 Other purchases 13,847,903 13,328,151 Provision for slow moving stock 10,618,995 7,963,565 Fumigation charges 12,112,924 9,152,139 Water charges 10,796,107 2,035,510 Canteen 5,579,026 6,632,848 Diesel and oil 3,756,116 1,858,919 Staff welfare 2,606,470 4,491,161 Security expenses 12,796,353 12,934,718 Godown expenses 11,119,094 10,498,098 Rent, rates and taxes 427, ,031 Vehicle running expenses 4,698,601 4,525,431 Medical 881, ,448 Depreciation ,803, ,067,763 Inspection charges 17,084,611 9,620,180 Cost of g oods manufactured 6,133,707,638 5,240,909,071 Work in process Opening stock - 8,531,578 Closing stock ,531,578 Cost of goods available for sale 6,133,707,638 5,249,440,649 Finished goods Opening stock 611,451, ,071,189 Closing stock 22 (883,118,576) (611,451,055) (271,667,521) (80,379,866) 5,862,040,117 5,169,060,783 Annual Report
70 Note To The Unconsolidated Financial Statements Note To The Unconsolidated Financial Statements Note Rupees Rupees 29.1 Rice consumed Opening stock of raw material 4,581,456,782 3,905,595,668 Purchases 4,755,958,817 5,074,285,336 Cartage inwards 116,005, ,238,595 Closing stock of raw material 22 (4,180,456,923) (4,581,456,782) 5,272,963,980 4,519,662, Packing material consumed Opening stock 47,583,127 60,487,050 Purchases 257,185, ,991, ,768, ,478,691 Closing stock-gross 22 (95,650,372) (57,209,207) Provision for slow moving stock 20,245,075 9,626,080 (75,405,297) (47,583,127) 229,363, ,895, Stores and spares consumed Opening stock 13,829,554 15,183,208 Purchases 62,676,228 24,213,163 76,505,782 39,396,371 Closing stock-gross 21 (20,271,197) (15,373,483) Provision for slow moving stock ,543,929 1,543,929 Closing stock-net (18,727,268) (13,829,554) 57,778,514 25,566, It includes provision for gratuity amounting to Rs million (2017: Rs million). 30 DISTRIBUTION EXPENSES Salaries and benefits 45,451,283 50,098,408 Freight 104,744,582 82,599,998 Clearing and forwarding 41,916,228 65,149,018 Travelling 21,758,699 16,706,915 Sales promotion 33,197,399 43,913,968 Provision of doubtful debts 7,464,595 - Insurance 973, ,727 Export charges 29,631,942 20,309,203 Export commission 2,215, ,842 Depreciation ,112,698 6,879,235 Shop rent 1,704,000 1,844,150 General 2,966,982 2,745, ,137, ,888, ADMINISTRATIVE EXPENSES Note Rupees Rupees Salaries and benefits ,232, ,262,883 Vehicle running 2,282,846 2,713,064 Entertainment 873, ,275 Printing and stationery 1,078,422 1,548,000 Fee and subscription 8,346,091 7,527,392 Legal and professional 1,349, ,070 Auditor remuneration ,954,210 2,058,792 Postage and telegrams 1,456,067 1,178,266 General expenses 1,011,055 2,105,198 Newspaper and periodicals 34,985 43,903 Balance c/f 153,619, ,840,843 Balance b/f 153,619, ,840,843 Electricity and gas charges 433,870 2,115,208 Taxes, duty and fee 692, ,313 Medical 1,423,357 1,160,716 Insurance 3,631,057 3,529,374 Software maintenance 2,136,036 2,074,335 Computer expenses 2,733,585 4,382,239 Depreciation ,338,093 20,637,705 Amortization - 4,903,588 Lease ijarah rentals 3,386,577 5,000,972 Donations , ,530 Advertisement 122, ,838 Others 5,038, , ,099, ,231, It includes directors' remuneration amounting to Rs million (2017: Rs million) and provision for gratuity amounting to Rs million (2017: Rs million). Annual Report
71 Note To The Unconsolidated Financial Statements Note To The Unconsolidated Financial Statements 31.2 Auditor's remuneration This represents services relating to taxation. Note Rupees Rupees Audit fee of unconsolidated accounts 1,900,000 1,500,000 Audit fee of consolidated accounts 100, ,000 Certifications 175,000 88,000 Out of pocket expenses 125, ,500 Other services , ,292 2,954,210 2,058, INCOME TAX EXPENSE 35.1 Rupees Rupees Current ,802,859 85,319,933 Deferred (22,307,301) (12,244,313) Note 29,495,558 73,075,620 Current year taxation has been charged on the basis of provisions in Income Tax Ordinance, 2001 and accounted for after taking effect of admissible expenses in normal taxation with proportion of local sales and on final tax regime applicable to the company based on tax withheld from export proceeds which is deemed as full and final discharge of the tax liability Donation to a single party does not exceed Rs. 500,000. No director is interested in such donation It includes the benefits arising from tax credit of BMR and enlistment. 32 FINANCE COST 35.3 Reconciliation of tax expense Mark up Long term finances 14,419,881 12,755,821 Short term borrowings 218,994, ,910,079 Finance lease 2,612,597 2,058,076 Bank charges and commission 3,677,717 2,180, OTHER INCOME 239,704, ,904,903 From financial assets and liabilities Profit on bank/short term deposits 9,387, ,341 Unrealized profit / (loss) on forward foreign exchange contracts - 1,781,640 From non-financial assets Amortization of deferred income 362, ,377 Gain or (loss) on sale of fixed assets 5,220,075 3,552,612 Scrap sales 2,879,421 - Gain on sale of shares - 2,480,924 Reversal of WWF - 27,619,736 Dividend income - 253,000 17,849,819 36,616, EXCHANGE GAIN - NET This represents exchange gain/(loss) incurred on foreign currency denominated trade debts, advances from customers, creditors and bank accounts Profit before income tax 337,788, ,044,529 Enacted tax rate 30% 31% Tax on accounting profit at applicable tax rate 101,336, ,033,804 Tax effect of: permanent differences - 21,123,439 temporary differences 16,887,972 (2,372,833) applicability of fixed tax rate on certain income (49,523,594) (40,341,617) applicability of lower tax rate on certain income (1,877,531) (701,666) change of statutory tax rate 1,013,366 - tax credit (37,754,327) (9,655,706) demand provided and raised during the year - (716,079) others (586,881) (293,722) Tax expense charged on income 29,495,558 73,075,620 The Company computes tax based on the generally accepted interpretations of the tax laws to ensure that the sufficient provision for the purpose of taxation is available which can be analyzed as follows: 2017 Rupees Rupees Rupees - Provisions 85,319,933 47,636,962 62,104,205 - Assessment 55,386,043 46,920,883 60,901,253 Annual Report
72 Note To The Unconsolidated Financial Statements 35.5 Return of is filed on December , is an assessment order u/s 120 unless amended under section 122 of the Income Tax Ordinance, The case was selected for audit under section 214C of the Income Tax Ordinance, After completion of the audit proceedings, Assistant Commissioner issued the notice u/s 122(5)/(9) of the Ordinance for the amendment of assessment. Response submitted by the representative of the Company. After completion of audit proceeding, the learned DCIR amended the assessment proceeding and passed the order without adjustment of sales tax refund of Rs. 10,843,699 and charged the WWF of Rs. 6,646,345 and created the demand of Rs. 17,490,045. Against the treatment of learned ADCIR, appeal was filed on , hearing order is pending. Based on merits of the appeals management is confident that these appeals shall be decided in favor of the Company and therefore no provision has been made against the assessment Return of filed on January , is an assessment order u/s 120 unless amended under section 122 of the Income Tax Ordinance, The Additional Commissioner Inland Revenue initiated the proceeding u/s 122(5A) of the Income Tax Ordinance, 2001 vide notice dated for amendment of deemed assessment. Response submitted by the representative of the Company. Proceeding initiated u/s 122(5A) for amendment by ACIR and issued the notice u/s 122(9). In response thereof, all the requisite information/documents were submitted. However, the ADCIR passed the order and disallowed the Finance Cost. Against the treatment of learned ADCIR, appeal was filed on , hearing heared order is pending. Based on merits of the appeals management is confident that these appeals shall be decided in favor of the Company and therefore no provision has been made against the assessment Return of filed on January 17, 2018, is an assessment order u/s 120 unless amended under section 122 of the Income Tax Ordinance, The Additional Commissioner Inland Revenue initiated the proceeding u/s 122(5A) of the Income Tax Ordinance, 2001 vide notice dated for amendment of deemed assessment. 36 NUMBER OF EMPLOYEES Number of employees as at June Note To The Unconsolidated Financial Statements 37 TRANSACTION WITH RELATED PARTIES 37.1 Related parties include subsidiary company, entities under common directorship, directors, major shareholders, key management personnel and retirement benefit funds. Transactions with related parties essentially entail rent expense and transactions with key management personnel. Details of transactions with related parties and the balances with them as at year end other than those which have been disclosed else where are as follows: Nature of relationship Percentage of Holding Transactions / Balance Outstanding Note Rupees Rupees Directors Godown rent paid to director 11,119,094 10,498,098 Subsidiary JKT General Trading FZE 100% Sales 69,832,924 88,685,748 Advance received on account of sales - 2,205,000 Receivable against expenses , ,831 Receivable against sales ,980,905 - Matco Marketing (Private) Limited Common Directors Matco Engineering (Private) Limited 100% Paid expense on behalf 78,184 84,435 Advance received against expenses 7,121,816 - Advance outstanding 7,121,816 - Receivable against expenses ,845 0% Paid against service for Rice Glucose Project - 2,637,026 Paid expenses on behalf 489,584 - Receivable against expenses ,584 - Trust operated by the company Ghori Trust 0% Donation of funds - 97,850 Expenses incurred on behalf 496,580 - Following are the related parties with whom the Company had entered into transactions or have arrangement / agreement in place: Number of factory employees as at June Average number of employees during the year Average number of factory employees during the year S. No. Company Name Registered Address Country of Incorporation Basis of Association Name of Chief Executive / Principal Officer / Authorized Agent Aggregate % of shareholding Operational Status Auditor's Opinion 1 JKT General Trading FZE P.O.Box , Sharjah UAE Subsidiary Company Jawed Ali Ghori 100% Active Clean 37.2 Consideration for services is determined with mutual agreement considering the level of services provided. Expenses charged by / to the Company are determined on actual cost basis. Particulars of remuneration of Chief Executive, Directors and Executives are disclosed in note 38 to these financial statements. Annual Report
73 Note To The Unconsolidated Financial Statements 37.3 Key management personnel are those persons having authority and responsibility for planning, directing and controlling the activities of the entity. The Company considers all members of its management team, including the Chief Executive Officer and the Directors to be key management personnel. 38 REMUNERATION OF THE CHIEF EXECUTIVE OFFICER, DIRECTORS AND EXECUTIVES For the purpose of disclosure those employees are considered as executives whose basic salary exceed twelve hundred thousands rupees in financial year. Chief Executive Officer Directors Executives Total * * Rupees Short-term employee benefits Managerial remuneration 3,080,000 2,940,000 8,440,000 7,960,000 18,258,400 1,381,245 29,778,400 12,281,245 House rent allowances 1,386,000 1,323,000 3,798,000 3,582,000 8,216, ,560 13,400,280 5,526,560 Utilities 776, ,406 2,756,385 2,715, ,920 69,062 4,445,525 3,715,527 Bonus 385, ,500 1,055, ,000 2,282, ,655 3,722,300 1,535,155 Fuel expense 590, ,488 1,676,968 2,199,146 2,163,500 1,344,600 4,431,024 4,288,234 Medical expense 51,843 65, , , , , , ,728 Vehicle expense 198, , , , , , ,495 1,177,381 Other expense 301, ,664 1,474,968 1,121, ,776,132 1,501,156 6,769,537 7,001,974 19,741,680 19,505,884 32,414,613 3,880,127 58,925,830 30,387,986 Value of motor vehicles 10,508,500 10,508,500 41,553,500 44,401,791 17,394,500 13,518,500 69,456,500 68,428,791 Number of Persons * Comparative figures have been restated to reflect changes in the definition of executive as per Companies Act, In addition to the above, chief executive officer and directors are provided with the use of the Company's vehicles. Certain executives are also provided with Company maintained cars. Note To The Unconsolidated Financial Statements 40 EARNINGS PER SHARE - BASIC AND DILUTED Rupees Rupees Profit for the year 308,292, ,968,909 Number of ordinary shares 116,572,094 87,429,094 Weighted average number of ordinary shares 98,447,543 98,447,543 Earning per share - basic and diluted There is no dilutive effect on earnings per share as the Company does not have any convertible instruments as at June 30, 2018 and June 30, FINANCIAL RISK MANAGEMENT OBJECTIVES AND POLICIES The Company's activities expose it to a variety of financial risks: market risk (including foreign exchange risk, interest rate risk and price risk), credit risk and liquidity risk. Overall, risks arising from the Company s financial assets and liabilities are limited. The Company manages its exposure to financial risk in following manner: 41.1 Market risk Market risk refers to fluctuation in value of financial instruments as a result of changes in market prices. The Company manages market risk as follows: Foreign currency risk Foreign exchange risk represents the risk that the fair value of future cash flows of a financial instrument will fluctuate because of changes in foreign exchange rates. It arises mainly where receivables, bank balances, borrowings and payables exist due to transactions entered into foreign currencies. Exposure to Foreign currency risk The Company is exposed to foreign exchange risk arising from currency value fluctuations due to the following: 38.2 The Company considers its Chief Executive and the Executive Director as its key management personnel i.e. the personnel having authority and responsibility for planning, directing and controlling the activities of the Company. 39 PLANT CAPACITY AND PRODUCTION (Tons) (Tons) Annual Plant Capacity Rice processing 134, ,700 Rice Glucose 10,000 - Actual Production Rice processing 47,084 59,223 Rice Glucose 2,828 - Trade debts 4,531,524 3,378,211 Cash and bank balances 19,049 34,031 Borrowings from financial institutions - (327,667) Advance from customer (172,733) (1,844,085) Off balance sheet exposures 4,377,840 1,240,490 Forward rate agreements - (7,200,000) Net Exposure 4,377,840 (5,959,510) The following significant exchange rates were applied during the year Amount in USD Annual Report
74 Note To The Unconsolidated Financial Statements Note To The Unconsolidated Financial Statements Average rate Reporting date rate Foreign currency sensitivity analysis A 10 percentage strengthening of the PKR against the USD at June 30, 2017 would have effect on the equity and profit and loss of the company as shown below. This analysis assumes that all other variables, in particular interest rates, remain constant. The analysis is performed on the same basis for June 30, Rupees Rupees Strengthening of PKR against respective currencies (53,190,757) 62,485,462 Weakening of PKR against respective currencies 53,190,757 (62,485,462) A 10 percentage weakening of the PKR against the USD at June 30, 2018 would have had the equal but opposite effect on USD to the amounts shown above, on the basis that all other variables remain constant Price risk Price risk represents the risk that the fair value of future cash flows of a financial instrument will fluctuate because of changes in market prices (other than those arising from interest or currency rate risk), whether those changes are caused by factors specified to the individual financial instrument or its issuer, or factors affecting all similar financial instruments traded in the market. The Company is not exposed to equity price risk since there are no investments in equity securities Interest/Mark-up rate risk Rupee per USD Interest rate risk is the risk that the fair value or future cash flows of the financial instruments will fluctuate because of changes in market interest rates. The Company has long term and short term Rupee at variable rates. The Company is exposed to interest/mark-up rate risk on long and short term financing and these are covered by holding "Prepayment Option" and "Rollover Option". Interest rate risk on short term borrowings is covered by holding "Prepayment Option" which can be exercised upon any adverse movement in the underlying interest rates. The local and foreign currency loans carry mark up at the prevailing rate of SBP plus 0.75% to 2%, KIBOR plus 1% to 2% and LIBOR plus 1.25% respectively. Applicable interest rates for financial assets and liabilities are given in respective notes. Financial assets Note 2018 Mark-up / profit bearing Non mark-up / Less than One year to profit bearing Over five years one year Five years Rupees Loans and receivables Trade debts - considered goods ,463, ,463,623 Short term Loans and advances ,494,263 6,494,263 Deposits ,196,199 2,196,199 Short term investment , ,000 Other receivables ,369,946 85,369,946 Cash and bank balances ,433, ,138, ,571, ,433, ,162,291 1,587,595,675 Financial liabilities At amortized cost Long term finances - secured 10 84,029, ,556, ,586,610 Trade and other payables ,853, ,853,203 Accrued mark-up ,767,428 48,767,428 Short term borrowings - secured 15 4,081,779, ,081,779,753 Liabilities against assets subject to finance 11 12,226,289 29,284, ,510,709 4,178,035, ,841, ,620,632 4,701,497,703 On balance sheet gap (3,506,602,363) (275,841,324) - 668,541,659 (3,113,902,028) Off balance sheet items Guarantees Commitments ,548, ,548,541 Financial assets 2017 Mark-up / profit bearing Non mark-up / Less than One year to profit bearing Over five years one year Five years Rupees Loans and receivables Trade debts - considered goods ,532, ,532,773 Short term Loans and advances ,295,915 4,295,915 Deposits ,196,199 2,196,199 Short-term investment , ,000 Other receivables ,963,523 82,963,523 Cash and bank balances 27 14,405, ,423, ,829,086 14,405, ,911, ,317,496 Financial liabilities At amortized cost Long term finances - secured 10 96,733, ,791, ,525,111 Trade and other payables ,244, ,244,770 Accrued mark-up ,056,163 46,056,163 Short term borrowings 15 3,886,835, ,886,835,593 Liabilities against assets subject to finance 11 7,999,276 16,132,846 1,029,495-25,161,617 3,991,568, ,924,710 1,029, ,300,933 4,692,823,254 On balance sheet gap Off balance sheet items Total Total (3,977,162,540) (338,924,710) (1,029,495) 364,610,988 (3,952,505,758) Guarantees Commitments ,246,460 18,246, ,124, ,124,947 Annual Report
75 Note To The Unconsolidated Financial Statements Note To The Unconsolidated Financial Statements (a) On balance sheet gap represents the net amounts of balance sheet items. Bank balances (b) Effective rates of return/mark-up on financial liabilities are as follows: Financial liabilities Long term finances - secured Short term borrowings Fair value sensitivity analysis for fixed rate instruments The Company does not account for any fixed rate financial assets and liabilities at fair value through profit or loss. Therefore, a change in interest rate at the balance sheet would not affect profit or loss of the Company. Cash flow sensitivity analysis for variable rate instruments At June 30, 2018, if interest rates on long term financing had been 1% higher / lower with all other variables held constant, pre tax profit for the year would have been Rs million (2017: Rs million) higher / lower, mainly as a result of higher / lower interest expense on floating rate borrowings. At June 30, 2018, if interest rates on short term borrowings had been 1% higher / lower with all other variables held constant, pre tax profit for the year would have been Rs million (2017: Rs million) higher / lower, mainly as a result of higher / lower interest expense on floating rate borrowings Credit risk SBP rate + 1% to 2% and KIBOR + 1% to 2% SBP rate+ 0.75% to 2% & LIBOR % SBP rate + 1% to 2% and KIBOR + 1% to 2% SBP rate+ 0.75% to 2% & LIBOR % Credit risk represents the accounting loss that would be recognized at the reporting date if counter parties failed to perform as contracted. The Company manages credit risk interalia by settng out credit limits in relation to individual customers and/or by obtaining advance against sales and/or through letter of credits and/or by providing for doubtful debts. Also the Company does not have significant exposure in relation to individual customer. Consequently, the Company believes that it is not exposed to any major concentration of credit risk. The Company is exposed to credit risk from its operating and certain investing activities and the Company's credit risk exposures are categorized under the following headings: The Company limits its exposure to credit risk by investing in liquid securities and maintaining bank accounts only with counter-parties that have stable credit rating. Given these high credit ratings, management does not expect that any counter party will fail to meet their obligations. The bank balances along with the credit ratings are tabulated below: Short- term Ratings Rupees Rupees MCB Bank Limited A1+ 78,971,359 30,048,689 Meezan Bank Limited A1+ 4,188,053 3,966,002 National Bank of Pakistan A1+ 9,757,001 9,332,864 NIB Bank Limited A1+ 16, ,258 Standard Chartered Bank Limited A1+ 1,356,880 2,089,584 United Bank Limited A1+ - 3,804,324 Allied Bank Limited A1+ 3,434,051 14,701,788 Askari Bank Limited A1+ 47,979,695 1,630,073 Bank Alfalah Limited A1+ 6,967,395 7,115,062 Faysal Bank Limited A1+ 3,824,654 3,411,343 Habib Bank Limited A1+ 5,331,923 7,170,595 Habib Metropolitan Bank Limited A1+ 5,572,363 20,801,126 Soneri Bank Limited A1+ 229,534 1,988,909 Bank Islami Pakistan Limited A1-20,296 Dubai Islamic Bank Pakistan Limited A Bank Al Habib Limited A1+ 3,245,232 2,530,882 JS Bank A1+ 23,247 - MCB Islamic Bank A1 349,473, ,371, ,829,086 Trade debts Trade debts are essentially due from local and foreign companies and the Company does not expect that these companies will fail to meet their obligations. The Company establishes an allowance for the doubtful trade debts that represent its estimate of incurred losses in respect of trade debts. The allowance is based on the management assessment of a specific loss component that relates to individually significant exposures. Annual Report
76 Note To The Unconsolidated Financial Statements 41.4 Exposure to credit risk The carrying amount of financial assets represents the maximum credit exposure. The maximum exposure to credit risk at the reporting date was: 41.3 Liquidity risk Liquidity risk reflects the Company's inability in raising funds to meet commitments. Prudent liquidity risk management implies maintaining sufficient cash and marketable securities, the availability of funding to an adequate amount of committed credit facilities and the ability to close out market positions due to the dynamic nature of the business. At June 30, 2018, the Company has Rs. 4,745.8 million (2017: Rs. 4,932.5 million) available borrowing limit from financial institutions. Unutilized borrowing facilities of Rs million (2017: Rs million) being balances at banks. Based on the above, management believes the liquidity risk is insignificant. Fair value of financial instruments Note Rupees Rupees Trade debts ,463, ,532,773 Loans and advances 21 6,494,263 4,295,915 Bank balances ,571, ,829,086 1,499,529, ,657,774 Fair value is an amount for which an asset could be exchanged, or a liability settled, between knowledgeable willing par ties in an arm's length transaction. Consequently, differences may arise between the carrying values and the fair value estimates. The Company classifies fair value measurements using a fair value hierarchy that reflects the significance of the inputs used in making the measurements. The fair value hierarchy has the: a) Quoted prices (unadjusted) in active markets for identical assets or liabilities (level 1). b) Inputs other than quoted prices included within level 1 that are observable for the asset or liability, either directly (that is, as prices) or indirectly (that is, derived from prices) (level 2). c) Inputs for the asset or liability that are not based on observable market data (that is, unobservable inputs) (level 3). The Company recognizes transfers between levels of the fair value hierarchy at the end of the reporting period during which the transfer has occurred. The Company s policy for determining when transfers between levels in the hierarchy have occurred includes monitoring of the following factors: Note To The Unconsolidated Financial Statements There were no transfers between level 1, 2 or 3 of the fair value hierarchy during the year. The valuation techniques used are as follows: Level 1: Quoted prices (unadjusted) in active markets The fair value of financial instruments traded in active markets is based on market value of shares at the reporting date. A market is regarded as active when it is a market in which transactions for the asset or liability take place with sufficient frequency and volume to provide pricing information on an ongoing basis. The following table analysis within the fair value hierarchy of the Company s financial assets (by class) measured at fair value at June 30, 2018: Financial assets Level 1 Level 2 Level 3 Total Financial investments: Held for trading 500, ,000 Financial assets Level 1 Level 2 Level 3 Total Financial investments: Held for trading 42 CAPITAL MANAGEMENT OBJECTIVES, POLICIES AND PROCEDURES The objective of the Company when managing capital is to safeguard its ability to continue as a going concern so that it can continue to provide returns for shareholders and benefits for other stakeholders and to maintain a strong capital base to support the sustained development of its businesses. The Company manages its capital structure by monitoring return on net assets and makes adjustments to it in the light of changes in economic conditions. In order to maintain or adjust the capital structure, the Company may adjust the amount of dividend paid to the shareholders or issue shares or sell assets to reduce debt. The Company manages its capital risk by monitoring its debt levels and liquid assets and keeping in view future investments requirements and expectations of the shareholders. Debt is calculated as total borrowings (short term borrowings, long term finances and current portion of long term finances as shown in the balance sheet). Capital signifies equity as reported in balance sheet and includes share capital, share premium and accumulated profits / (losses) Rupees Rupees , ,000 changes in market and trading activity (e.g.. significant increases / decreases in activity) changes in inputs used in valuation techniques (e.g. inputs becoming / ceasing to be observable in the market) Annual Report
77 Note To The Unconsolidated Financial Statements During 2018, the Company's strategy was to maintain leveraged gearing. The gearing ratios as at June 30, 2018 and 2017 were as follows: Note Rupees Rupees (Restated) Total borrowings 4,453,877,072 4,331,522,321 Less: Cash and bank 27 (823,079,063) (111,054,980) Net debt 3,630,798,009 4,220,467,341 Total equity 4,128,667,040 3,143,160,816 Total equity and debt 7,759,465,049 7,363,628,157 Gearing ratio (%) 47% 57% The Company finances its operations through equity, borrowings and management of working capital with a view to maintain an appropriate mix amongst various sources of finance to minimize risk. Note To The Unconsolidated Financial Statements 44.1 The amount has given to contractor and engineers for the purpose of development of rice glucose plant. 45 DATE OF AUTHORISATION FOR ISSUE These financial statements have been approved by the Board of Directors of the Company and authorized for issue on September 6, Non-adjusting events after the statement of financial position date The Board of Directors in its meeting held on September 6, 2018 has proposed cash dividend of Rs. 0.4 per share i.e. 4% (2017: Nil per share) and 5 bonus shares on every 100 ordinary shares i.e. 5%. This is in addition to the interim cash dividend of Rs. 0.3 (2017: Nil) per share. The dividend and transfer are subject to the approval of members at the annual general meeting. The effect of such dividend and transfer shall be accounted for in the financial statements for the year ending June 30, GENERAL Figures have been rounded off to the nearest rupee. 43 OPERATING SEGMENTS These financial statements have been prepared on the basis of a single reportable segment Revenue from sale of rice represents 98.7% (2017: 99.6%) of the total revenue of the Company. All non-current assets of the Company as at June 30, 2018 are located in Pakistan. Further, debtors from rice represents 98% (2017: 100%) of the total debtors. 44 UTILIZATION OF PROCEEDS FROM INITIAL PUBLIC OFFERING During the year, the Company has issued its shares to general public through IPO to finance the project of expansion of its Rice Glucose / Syrup and Rice Protein plant from IPO proceeds as disclosed in note 7. Refer of the Prospectus issued for the Project detail. As at June 30, 2018, the utilization of proceeds from IPO is as follows: Note 2018 Rupees Proceeds from IPO 757,718,000 IPO related expenses (45,300,364) Deposited with HBL against LCs 27.1 (297,000,000) Expenses incurred to date 18.2 (5,422,378) Advances to contractors 44.1 (60,521,501) Cash at bank 349,473,757 Chief Executive Officer Chief Financial Officer Director Annual Report
78
79
80

81

82 Consolidated Statements Of Financial Position As At June 30, 2018 Consolidated Statements Of Financial Position As At June 30, 2018 EQUITY AND LIABILITIES Share capital and reserves Note 2016 Rupees Rupees Rupees Restated Restated Authorized share capital 7.1 2,000,000,000 2,000,000,000 2,000,000,000 Issued, subscribed and paid up share capital 7.2 1,165,720, ,290, ,290,940 Capital reserve 8 739,367, ,382, ,382,823 Exchange revaluation reserve 5,160,255 (354,112) (117,531) Unappropriated profit 1,688,073,372 1,390,324,788 1,096,228,398 Surplus on revaluation of property, plant and equipment - net of tax 9 546,781, ,665, ,918,688 Total shareholders' equity 4,145,103,343 3,154,309,657 2,887,703,318 Non-current liabilities Long term finances-secured ,556, ,791, ,790,827 Liabilities against assets subject to 11 29,284,420 17,162,341 9,408,482 finance leases Deferred liabilities ,803, ,452, ,538,925 Deferred income 632, , ,350 Total non-current liabilities 420,277, ,402, ,402,584 Current liabilities Trade and other payables ,982, ,009, ,112,491 Advance from customers - secured 24,883, ,592, ,896,374 Accrued mark-up 14 48,767,428 46,056,163 49,935,930 Short term borrowings-secured 15 4,081,779,753 3,908,367,977 3,197,027,943 Current portion of long term finances-secured Current portion of liabilities against assets 10 84,029,706 96,733,247 58,372,319 subject to finance leases 11 12,226,289 7,999,276 4,475,892 Unpaid dividend , Provision for taxation-net 21,287,637 28,936,787 - Total current liabilities 4,493,718,565 4,616,694,629 3,715,820,949 Total liabilities 4,913,996,376 5,116,096,688 4,031,223,533 Contingencies and commitments 17 Total equity and liabilities 9,059,099,719 8,270,406,345 6,918,926,851 ASSETS Non-current assets Note 2016 Rupees Rupees Rupees Restated Restated Property, plant and equipment 18 2,168,585,255 2,141,308,121 1,790,412,727 Intangible assets ,903,588 Long term deposits - net 13,048,793 10,990,923 11,421,331 Total non-current assets 2,181,634,048 2,152,299,044 1,806,737,646 Current assets Stores, spares and loose tools 20 18,727,268 13,829,554 15,183,208 Stock in trade 21 5,138,980,796 5,240,490,964 4,505,685,485 Trade debts ,705, ,336, ,554,505 Short term loans and advances 23 83,732,051 58,171,589 12,655,050 Trade deposits and short term prepayments 24 13,734,531 11,991,021 17,123,217 Short term investment 500, ,000 - Other receivables 25 85,074,116 84,745,163 51,264,224 Advance tax - net - - 4,287,321 Cash and bank balances ,011, ,042, ,436,195 Total current assets 6,877,465,671 6,118,107,301 5,112,189,205 Total assets 9,059,099,719 8,270,406,345 6,918,926,851 The annexed notes from 1 to 45 form an integral part of these consolidated financial statements. The annexed notes from 1 to 45 form an integral part of these consolidated financial statements. Chief Executive Officer Chief Financial Officer Director Chief Executive Officer Chief Financial Officer Director Annual Report
83 Consolidated Statements Of Profit Or Loss Consolidated Statements Of Comprehensive Income Note Rupees Rupees Sales - net 27 6,879,602,731 6,158,480,346 Cost of sales 28 (5,861,897,104) (5,178,778,848) GROSS PROFIT 1,017,705, ,701,498 Distribution expenses 29 (304,850,154) (291,888,742) Administrative expenses 30 (203,619,372) (181,165,750) (508,469,526) (473,054,492) 509,236, ,647,006 Finance cost 31 (240,005,015) (212,124,511) Other income 32 17,849,819 36,616,630 Exchange gain - net 33 72,858,009 34,999,406 Note Rupees Rupees PROFIT FOR THE YEAR 308,066, ,152,787 OTHER COMPREHENSIVE INCOME / (LOSS) Items that may be reclassified subsequently to the consolidated statement of profit or loss - Exchange difference on translation of 5,514,367 (236,581) foreign currency Items that will not to be reclassified subsequently to the consolidated statement of profit or loss - Remeasurement of defined benefits obligation (229,441) (3,109,867) Provision for workers welfare fund 13.2 (7,066,909) (3,073,894) Provision for workers profit participation fund 13.3 (15,283,606) (12,836,230) PROFIT BEFORE TAX 337,588, ,228,407 TOTAL COMPREHENSIVE INCOME FOR THE YEAR TOTAL COMPREHENSIVE INCOME FOR THE YEAR ATTRIBUTABLE TO: 313,350, ,806,339 Income tax expense 34 (29,522,349) (73,075,620) PROFIT FOR THE YEAR 308,066, ,152,787 EARNINGS PER SHARE - BASIC AND DILUTED Shareholders of the Holding Company 313,350, ,806,339 Non-controlling interest ,350, ,806,339 The annexed notes from 1 to 45 form an integral part of these consolidated financial statements. The annexed notes from 1 to 45 form an integral part of these consolidated financial statements. Chief Executive Officer Chief Financial Officer Director Chief Executive Officer Chief Financial Officer Director Annual Report
84 Consolidated Statements Of Cash Flow Consolidated Statements Of Cash Flow CASH FLOWS FROM OPERATING ACTIVITIES Note Rupees Rupees Profit before taxation 337,588, ,228,407 Adjustments for: Depreciation ,253, ,584,703 Amortization of intangible assets 19-4,903,588 Exchange gain - net 33 (72,858,009) (34,999,406) Unrealized profit on forward foreign exchange contracts 32 - (1,781,640) Provision of doubtful debts 7,464,595 - Provision for slow moving stock 10,618,995 - Finance cost ,005, ,124,511 Provision for staff gratuity ,859,134 15,247,173 Amortization of deferred income 32 (362,667) (321,377) Gain on disposal of property, plant and equipment 32 (5,220,075) (3,552,612) 357,760, ,204, ,349, ,433,347 Changes in working capital (Increase) / decrease in current assets Stores, spares and loose tools (4,897,714) 1,353,654 Stock in trade 101,510,168 (734,805,479) Trade debts - considered good (43,510,629) (158,839,119) Loans and advances (25,560,462) (45,516,539) Trade deposits and prepayments (1,743,510) 5,132,196 Other receivables (328,953) (31,699,299) 25,468,900 (964,374,586) Increase / (decrease) in current liabilities Trade and other payables (115,026,178) 128,896,672 Advances from customers (168,708,345) (6,304,358) (283,734,523) 122,592,314 Cash generated from / (used in) operations 437,083,716 (162,348,925) Finance cost paid (237,273,241) (216,004,278) Income taxes paid (59,478,800) (56,967,706) Gratuity paid 12.1 (8,450,481) (8,198,973) Net cash generated from / (used in) operating activities 131,881,195 (443,519,882) CASH FLOWS FROM INVESTING ACTIVITIES Fixed capital expenditure including capital work in progress (182,760,348) (473,548,833) Proceeds from disposal of property, plant and equipment 8,150,500 13,841,612 Short term investment - (500,000) Long term deposits (2,057,870) 430,408 Net cash used in investing activities (176,667,719) (459,776,813) Balance carried forward (44,786,524) (903,296,695) Note Rupees Rupees Balance brought forward (44,786,524) (903,296,695) CASH FLOWS FROM FINANCING ACTIVITIES Long term finances - received during the year 252,898, ,490,604 - repayments during the year (341,270,050) (60,128,639) Proceeds from issuance of shares ,430,000 - Proceeds from share premium received 8 420,984,339 - Finance lease obligation paid during the year (12,579,609) (8,418,938) Dividend paid (34,210,534) (7,200,000) Short term borrowings obtained - net of repayment 173,411, ,340,034 Net cash generated from financing activities 750,664, ,083,061 Effect of exchange rate changes on value of foreign operation 5,514,367 (236,581) Net change in cash and cash equivalents during the year 711,392,066 8,549,785 Cash and cash equivalents as at the beginning of year 115,042, ,436,195 Effects of exchange rate changes on cash and cash equivalents 577,195 56,349 Cash and cash equivalents as at the end of year ,011, ,042,329 The annexed notes from 1 to 45 form an integral part of these consolidated financial statements. Chief Executive Officer Chief Financial Officer Director Chief Executive Officer Chief Financial Officer Director Annual Report
85 Consolidated Statements Of Change In Equity Notes To The Consolidated Financial Statements Issued, subscribed and paid up share capital Capital reserve Exchange Revaluation Reserve Equity 2016 Unappropriated profit Surplus on revaluation of property, plant and equipment attributable to the Holding Company 's shareholders Rupees Total 1 LEGAL STATUS AND OPERATIONS The 'Group" consists of: Holding Company - Matco Foods Limited (the Holding Company) Balance as on July 01, 2016 as previously 874,290, ,382,823 (117,531) 1,096,228,398-2,288,784,630 2,288,784,630 stated Effect of re-statement (Note 6) ,918, ,918, ,918,688 Balance as on July 01, restated 874,290, ,382,823 (117,531) 1,096,228, ,918,688 2,887,703,318 2,887,703,318 Total comprehensive income for the year Profit for the year ,152, ,152, ,152,787 Other comprehensive loss - - (236,581) (3,109,867) - (3,346,448) (3,346,448) Total comprehensive Income - - (236,581) 274,042, ,806, ,806,339 Transferred from surplus on revaluation of fixed assets on account of incremental depreciation net of tax - (note 9) Transactions with owners Dividend Re per share (2016: Rs per share) ,253,470 (27,253,470) (7,200,000) - (7,200,000) (7,200,000) Balance as on June 30, restated 874,290, ,382,823 (354,112) 1,390,324, ,665,218 3,154,309,657 3,154,309,657 Total comprehensive income for the year Profit for the year ,066, ,066, ,066,050 Other comprehensive income - - 5,514,367 (229,441) - 5,284,926 5,284,926 Total comprehensive income - - 5,514, ,836, ,350, ,350,976 ` Transferred from surplus on revaluation of fixed assets on account of incremental depreciation net of tax - (note 9) ,883,604 (24,883,604) - - Transactions with owners Issue of Rs. 10 per share 291,430, ,430, ,430,000 Share Rs. 16 per share - net of expenses Dividend Re. 0.3 per share (2017: Rs per share) - 420,984, ,984, ,984, (34,971,629) - (34,971,629) (34,971,629) Balance as on June 30, ,165,720, ,367,162 5,160,255 1,688,073, ,781,614 4,145,103,343 4,145,103,343 The annexed notes from 1 to 45 form an integral part of these consolidated financial statements. Subsidiary Group - JKT General Trading FZE - Matco Marketing (Private) Limited The Group is engaged in the business of processing and export of rice, glucose, protein and flour, manufacturing, general trading, exports/imports and other related activities. Brief profile of the Holding Company and subsidiary is as under: a) Matco Foods Limited Matco Foods Limited, ('the Group') was incorporated on April 14, 1990 in Karachi as a private limited company under the repealed Companies Ordinance, 1984 (Now: Companies Act, 2017). The Group is listed on Pakistan Stock Exchange on February 13, Principal activity of the Group is to carry on the business of processing, export of rice, rice glucose, rice protein and trade of biscuits, pink salt, bran oil, masala and kheer. Registered office of the Group is situated at L-24/1, Block-21, Federal 'B' Industrial Area, Karachi; whereas the factories of the Group are situated at (i) M-II, A-15 & 16, SITE-II, Super highway Karachi; (ii) Riviana, A-21, SITE-II, Super highway Karachi; (iii) Rice Glucose Plant, G-205, SITE-II, Super highway Karachi and (iv) M-III, Sadhoke, Tehsil Kamoke, District Gujranwala. The Group has 100% and 99.99% ownership in JKT General Trading FZE (subsidiary) a Dubai based Group and Matco Marketing (Private) Limited based in Pakistan respectively. b) JKT General Trading FZE JKT General Trading FZE, ('the establishment') is a free zone establishment with limited liability registered in Saif-Zone, Sharjah, United Arab Emirates (UAE) under general trading license no The principal activities of the establishment as per the trade license are general trading. The registered office of the establishment is at PO Box , Sharjah, UAE. The subsidiary has been established on October 8, c) Matco Marketing (Private) Limited The Group has incorporated another subsidiary Matco Marketing (Private) Limited through 100% ownership. The subsidiary is situated at L-24/1, Block-21, Federal 'B' Industrial Area, Karachi. Matco Marketing (Private) Limited was incorporated on June 16, 2016 with authorized and paid-up capital of PKR 10 million and PKR 7.5 million respectively. However, no business carried out by the Group since its incorporation. Chief Executive Officer Chief Financial Officer Director Annual Report
86 Notes To The Consolidated Financial Statements 2 SIGNIFICANT TRANSACTIONS AND EVENTS AFFECTING THE GROUP'S FINANCIAL POSITION AND PERFORMANCE a) Matco Foods Limited has been listed at Pakistan Stock Exchange (PSX) during the year by offering shares to the general public which resulted in IPO proceeds of Rs ; b) The Matco Foods Limited has started the construction of rice glucose plant for 20,000 MT of rice glucose and 2,000 MT of rice protein at G-205, SITE-II, Super highway Karachi. c) The exchange rate of USD to PKR has increased from PKR as at June 30, 2017 to PKR as at June 30, 2018 which resulted in exchange gain of Rs million; d) Due to applicability of the Companies Act, 2017 to the financial statements of the Group, amounts reported for the previous period have been restated. For detailed information, please refer to note and note 6; e) During the year, the Matco Foods Limited has subscribed 749,996 shares of Matco Marketing (Private) Limited. However, Matco Marketing (Private) Limited has not commenced its operations; f) On July 25, 2017, the Matco Foods Limited was converted into public company from private company; g) For a detailed discussion about the Group's performance, please refer to the Directors' report. 3 BASIS OF CONSOLIDATION The consolidated financial statements include financial statements of the Holding Company and its subsidiary comprising together 'the group'. Subsidiaries JKT General Trading FZE Matco Marketing (Private) Limited The Holding Company can directly exercise control over JKT General Trading FZE and Matco Marketing (Private) Limited as this is 100% and 99.99% respectively owned by the Holding Company. The financial statements of the subsidiary is prepared for the same reporting year as the financial statements of the Holding Company, using consistent accounting policies. The consolidated financial statements comprise financial statements of the Group. The assets and liabilities of the subsidiary Group have been consolidated on a line by line basis and the carrying value of the investment held by the Holding Company have been eliminated against corresponding holding in subsidiary's shareholders' equity in the consolidated financial statements. All intra-group transactions, balances, income and expenses have been eliminated. The consolidated financial statements comprise financial statements of the Group. The assets and liabilities of the subsidiary Group have been consolidated on a line by line basis and the carrying value of the investment held by the Holding Company have been eliminated against corresponding holding in subsidiary's shareholders' equity in the consolidated financial statements. All intra-group transactions, balances, income and expenses have been eliminated. Notes To The Consolidated Financial Statements 3.1 Statement of compliance 3.2 Basis of measurement These consolidated financial statements have been prepared under the historical cost convention except as otherwise disclosed in the respective accounting policies' note and cash flow information. 3.3 Functional and presentation currency 3.4 These financial statements have been prepared in accordance with the accounting and reporting standards as applicable in Pakistan. Accounting and reporting standards comprise of such International Financial Reporting Standards (IFRS Standards) issued by the International Accounting Standards Board (IASB) and Islamic Financial Accounting Standards (IFAS) issued by the Institute of Chartered Accountants of Pakistan (ICAP) as are notified under the Companies Act, 2017 (the Act), and provisions of and directives issued under the Companies Act, Where provisions of and directives issued under the Companies Act, 2017 differ from the IFRS Standards, the provisions of and directives issued under the Companies Act, 2017 have been followed. These consolidated financial statements are presented in Pakistani Rupees which is the Group's functional currency and presentation currency. Standards, Amendments and Interpretations to Approved Accounting Standards Promulgation of Companies Act, 2017 The third and fourth schedule to the Companies Act, 2017 became applicable to the Group for the first time for the preparation of these financial statements. The Companies Act, 2017 (including its third and fourth schedule) forms an integral part of the statutory financial reporting framework applicable to the Group and amongst others, prescribes the nature and content of disclosures in relation to various elements of the financial statements. Additional disclosures include but are not limited to, particulars of immovable assets of the Group (refer note ), management assessment of sufficiency of tax provision in the financial statements (refer note 34.4), change in threshold for identification of executives (refer note 37), additional disclosure requirements for related parties (refer note 36), utilization of IPO proceeds (refer note 43) Standards, amendments and interpretations to the published standards that are relevant to the Group and adopted in the current year The Group has adopted the following new standards, amendments to published standards and interpretations of IFRSs which became effective during the current year. Standard or Interpretation IAS 7 - Disclosure Initiative (Amendments to IAS 7) IAS 12 - Recognition of Deferred Tax Assets for Unrealized Losses (Amendments to IAS 12) IFRS 12 - Annual Improvements to IFRS Effective Date (Annual periods beginning on or after) January 1,2017 January 1,2017 January 1,2017 Adoption of the above revisions, amendments and interpretations of the standards have no significant effect on the amounts for the year ended June 30, 2017 and Annual Report
87 Notes To The Consolidated Financial Statements Notes To The Consolidated Financial Statements Standards, amendments to published standards and interpretations that are effective but not relevant The other new standards, amendments to published standards and interpretations that are mandatory for the financial year beginning on July 01, 2017 are considered not to be relevant or to have any significant effect on the Group's financial reporting and operations and are therefore not presented here Standards, amendments and interpretations to the published standards that are relevant but not yet effective and not early adopted by the Group The following new standards, amendments to published standards and interpretations would be effective from the dates mentioned below against the respective standard or interpretation. Standard or Interpretation IFRS 10 and IAS 28 - Sale or Contribution of Assets between an Investor and its Associate or Joint Venture (Amendments to IFRS 10 and IAS 28) IFRS 2 - Classification and Measurement of Share-based Payment Transaction (Amendments to IFRS 2) IFRS 1 and IAS 28 - Annual Improvements to IFRSs IFRIC 22 - Foreign Currency Transactions and Advance Consideration IAS 40 - Transfers of Investment Property (Amendments to IAS 40) IFRS 15 - Revenue from Contracts with Customers IFRS 9 - Financial Instruments IFRS 16 - Leases IFRIC 23 - Uncertainty over Income Tax Treatments IAS 28 - Long-term Interests in Associates and Joint Ventures (Amendments to IAS 28) Annual Improvements to IFRSs Cycle IFRS 9 - Prepayment Features with Negative Compensation (Amendments to IFRS 9) IAS 19 - Plan Amendment, Curtail or Settlement (Amendments to IAS 19) Effective Date (Annual periods beginning on or after) Postponed January 1, 2018 January 1, 2018 January 1, 2018 January 1, 2018 July 1, 2018 July 1, 2018 January 1, 2019 January 1, 2019 January 1, 2019 January 1, 2019 January 1, 2019 January 1, 2019 The Group is in the process of assessing the impact of these Standards, amendments and interpretations to the published standards on the financial statements of the Group Standards, amendments and interpretations to the published standards that are not yet notified by the Securities and Exchange Commission of Pakistan (SECP) Following new standards have been issued by the International Accounting Standards Board (IASB) which are yet to be notified by the SECP for the purpose of applicability in Pakistan. Standard or Interpretation IFRS 14 - Regulatory Deferral Accounts IFRS 17 - Insurance Contracts (a) useful lives of property, plant and equipment (b) impairment of financial assets (c) provision for gratuity (d) income taxes (e) trade and other payables (f) contingencies (g) provisions (h) impairment Effective Date (Annual periods beginning on or after) January 1,2016 January 1,2021 The areas involving a higher degree of judgments or complexity or areas where assumptions and estimates are significant to the consolidated financial statements are as follows: Annual Report CRITICAL ASSUMPTIONS AND ESTIMATES The preparation of consolidated financial statements in conformity with approved accounting standards requires the use of certain critical accounting estimates. It also requires management to exercise its judgment in the process of applying the Group's accounting policies. Estimates and judgments are continually evaluated and are based on historical experience, including expectations of future events that are believed to be reasonable under the circumstances, the result of which form the basis of making the judgments about carrying values of assets and liabilities that are not readily apparent from other sources. Actual results may differ from these estimates. The estimates and underlying assumptions are reviewed on an ongoing basis. Revisions to accounting estimates are recognized in the period in which the estimates are revised, if the revision affects only that period, or in the period of the revision and future periods if the revision affects both current and future periods. SUMMARY OF SIGNIFICANT ACCOUNTING POLICIES Note The principal accounting policies have been applied on consistent basis except as disclosed elsewhere. These policies have been adopted in the preparation of these consolidated financial statements are as follows: Business combinations The Group applies the acquisition method in accounting for business combinations. The consideration transferred by the Group to obtain control of a subsidiary is calculated as the sum of the acquisition-date fair values of assets transferred, liabilities incurred and the equity interests issued by the Group, which includes the fair value of any asset or liability arising from a contingent consideration arrangement, if any. Acquisition costs are expensed as incurred.
88 Notes To The Consolidated Financial Statements The Group recognizes identifiable assets acquired and liabilities assumed in a business combination regardless of whether they have been previously recognized in the acquiree s financial statements prior to the acquisition. Assets acquired and liabilities assumed are generally measured at their acquisition-date fair values. Notes To The Consolidated Financial Statements Intangible assets are recognized when it is probable that the expected future economic benefits will flow to the entity and the cost of the asset can be measured reliably. Cost of the intangible asset (i.e. computer software) includes purchase cost and directly attributable expenses incidental to bring the asset for its intended use. 5.2 Goodwill is stated after separate recognition of identifiable intangible assets. It is calculated as the excess of the sum of (a) fair value of consideration transferred, (b) the recognized amount of any non-controlling interest in the acquiree and (c) acquisition-date fair value of any existing equity interest in the acquiree, over the acquisition-date fair values of identifiable net assets. If the fair values of identifiable net assets exceed the sum calculated above, the excess amount (i.e. gain on a bargain purchase) is recognized in profit or loss immediately. Property, plant and equipment Costs associated with maintaining computer software are recognized as an expense as and when incurred. Intangible assets are stated at cost less accumulated amortization and accumulated impairment losses, if any. Amortization is charged over the estimated useful life of the asset on a systematic basis applying the straight line method. Useful lives of intangible operating assets are reviewed, at each balance sheet date and adjusted if the impact of amortization is significant. Owned assets 5.5 Capital work-in-progress Property, plant and equipment are stated at cost or revalued amount less accumulated depreciation and impairment losses, if any. The cost of replacing part of an item of property, plant and equipment is recognized in the carrying amount of the item when it is probable that the future economic benefits associated with the item flow to the entity and its cost can be reliably measured. Normal repair and maintenance are charged to the profit and loss account during the period in which they are incurred. Depreciation is calculated so as to write-off the assets over their expected economic lives under the diminishing balance method at rates given in note 18.1 of the consolidated financial statements. Depreciation on addition is charged from the day an asset is available for use upto the day prior to its disposal. Gains and losses on disposal of assets are taken to the profit and loss account, and related surplus on revaluation of property and plant is transferred directly to retained earnings / unappropriated profits. Leased assets Leased assets in terms of which the Group assumes substantially all the risks and rewards incidental to ownership are capitalized at the inception of the lease at the fair value of leased assets or, if lower, at the present value of the minimum lease payments. The outstanding obligations under the lease excluding finance charges allocated to future periods are shown as liability. Financial charges are allocated to the accounting periods in a manner so as to provide a constant rate of charge on the outstanding obligation. Intangible assets An intangible asset is an identifiable non-monetary asset without physical substance. 5.6 Capital work-in-progress is stated at cost less accumulated impairment losses, if any. All expenditures connected to the specific assets incurred during installation and construction period are carried under capital work-in-progress. Cost also includes applicable borrowing cost. These are transferred to specific assets as and when assets are available for use. Ijara contracts Leases, where a significant portion of the risks and rewards of ownership are retained by the lessor, are classified as Ijara contract. Payments made under Ijara contract (net of any incentives received from the lessor) are charged to the profit and loss account on a straight line basis over the lease term. 5.7 Investments Investment in subsidiary companies Investment in subsidiary companies is initially recognized and carried at cost. At subsequent reporting dates, the recoverable amounts are estimated to determine the extent of impairment losses, if any, and carrying amounts of investments are adjusted accordingly. Impairment losses are recognized as expense. Where impairment losses subsequently reverse, the carrying amounts of the investments are increased to the revised recoverable amounts but limited to the extent of initial cost of investments. A reversal of impairment loss is recognized in income Other investments All regular way purchases / sales of investment are recognized on the trade date, i.e., the date the Group commits to purchase / sell the investments. Regular way purchases or sales of investment require delivery of securities within the time frame generally established by regulation or convention in the market place. 5.8 Financial instruments Financial assets and financial liabilities are recognized when the Group becomes a party to the contractual provisions of the financial instrument. Annual Report
89 Notes To The Consolidated Financial Statements Initial recognition Financial assets and financial liabilities are measured initially at fair value plus transaction costs, except for financial assets and financial liabilities carried at fair value through profit or loss, which are measured initially at fair value. Subsequent measurement Financial assets and financial liabilities are measured subsequently as described below. 5.9 Financial assets For the purpose of subsequent measurement, financial assets are classified into the following categories upon initial recognition: (a) loans and receivables; (b) financial assets at fair value through profit or loss; (c) held to maturity; and (d) available-for-sale financial assets. (a) Loans and receivables Loans and receivables are non-derivative financial assets with fixed or determinable payments that are not quoted in an active market. Following financial assets fall into this category of financial instruments: - Trade debts - Deposits - Loans and advances - Other receivables These are stated at amortized cost using effective interest method. (b) Financial assets at fair value through profit or loss Investments which are acquired principally for the purpose of generating profit from short term fluctuations in prices are also classified as 'at fair value through profit or loss' or held for trading. (c) Available for sale Investments intended to be held for indefinite period of time, which may be sold in response to needs for liquidity or changes in equity prices, are classified as 'available for sale'. Available for sale financial instruments are those non-derivative financial assets that are designated as available for sale or are not classified as (a) loans and receivables (b) held to maturity investments (c) financial assets at fair value through profit or loss. Subsequent to initial recognition these investments are marked to market using the closing market rate and are carried on the balance sheet at fair value. Net gains and losses arising on changes in fair value of these investments are taken to statement of comprehensive income. (d) Impairment of financial assets A financial asset is assessed at each reporting date to determine whether there is any objective evidence that it is impaired. A financial asset is considered to be impaired if objective evidence indicates that one or more events have had a negative effect on the estimated future cash flows of that asset. Notes To The Consolidated Financial Statements An impairment loss is reversed if there has been a change in the estimates used to determine the recoverable amount. An impairment loss is reversed only to the extent that the asset's carrying amount does not exceed the carrying amount that would have been determined, net of depreciation or amortization, if no impairment loss had been recognized Financial liabilities The Group's financial liabilities include long term finances, trade and other payables, accrued mark up and short term borrowings. Derecognition These are derecognized when they are extinguished, discharged, cancelled or expired Derivative financial instruments Derivative financial instruments are initially recognized at fair value on the dates on which the derivative contracts are entered into and are subsequently re-measured at fair value using appropriate valuation techniques. All derivative financial instruments are carried as assets when fair value is positive and liabilities when fair value is negative. Any change in the fair value of derivative instruments is taken to the profit and loss account Stores, spares and loose tools These are valued at the cost less allowance for obsolete and slow moving items. Items in transit are valued at invoice value plus other charges incurred thereon, up to the balance sheet date Stock in trade These are valued at lower of cost and net realizable value less impairment loss, if any. Raw material is valued at moving weighted average cost, packing material is valued at cost, work in process is valued at manufacturing cost and finished goods is valued at cost allocated on sales value of finish and by-product for each job completion or net realizable value (NRV) whichever is lower. Net realizable value signifies the estimated selling price in the ordinary course of business less the estimated cost of completion and the estimated cost necessary to make the sale Staff retirement benefits Defined benefit plan The Group operates following benefits: - For Holding Company : an unapproved gratuity scheme for its employees completing the eligibility period of service as defined under the plan. This year provision is made in the financial statements based on the actuarial valuation using the Projected Unit Credit Method. Actuarial gains and losses for the defined benefit plan are recognized in full in the period in which they occur in other comprehensive income. - For subsidiary Group: the entitlement to end of service benefits is based upon the employees' salary and length of service. The expected costs of these benefits are accrued over the period of employment. The provision for staff terminal benefit is based on the liability that would arise if the employment of all employees was terminated at the end of the reporting period. Annual Report
90 Notes To The Consolidated Financial Statements 5.15 Trade debts These are measured at original invoice amount less an estimate made for doubtful receivable balances based on the review of all outstanding amounts at year end. Bad debts are written off when identified Cash and cash equivalents Cash and cash equivalents are carried in the balance sheet at cost. For the purpose of cash flow statement, cash and cash equivalents consist of cash in hand, balances with banks, highly liquid short-term investments that are convertible to known amounts of cash and are subject to insignificant risk of change in value Taxation Current The charge for current tax is based on taxable income at current rates of taxation after taking into account tax credits, rebates and exemptions available, if any, or in accordance with the final tax regime, where applicable, of the Income Tax Ordinance, 2001 (the Ordinance) or the minimum tax under section 113 of the Ordinance or Alternate Corporate Tax (ACT) under section 113C of the Ordinance, whichever is higher. Deferred Deferred tax is recognized using the balance sheet liability method on all temporary differences between the carrying amount of the assets and liabilities and their tax bases. Deferred tax liabilities are recognized for all major taxable temporary differences. Deferred tax assets are recognized for all major deductible temporary differences to the extent that it is probable that taxable profit will be available against which the deductible temporary differences can be utilized. The carrying amount of the deferred tax asset is reviewed at each balance sheet date and is recognized only to the extent that it is probable that future taxable profits will be available against which the assets may be utilized. Deferred tax assets are reduced to the extent that it is no longer probable that the related tax benefit will be realized. Unrecognized deferred income tax assets are reassessed at each balance sheet date and are recognized to the extent that it becomes probable that future taxable profit will allow deferred tax asset to be recovered. Deferred tax assets and liabilities are measured at the tax rate that are expected to apply to the year when the asset is utilized or the liability is settled, based on the tax rates that have been enacted or substantially enacted at the balance sheet date Borrowings and their costs All borrowings are recorded at the proceeds received net of transaction cost. Borrowing costs directly attributable to the acquisition, construction or production of qualifying assets, which are assets that necessarily take a substantial period of time to get ready for their intended use are added to the cost of those assets, until such time as the assets are substantially ready for their intended use. All other borrowing costs are charged to income in the period in which these are incurred Trade and other payables Liabilities for trade and other payables are measured at cost which is the fair value of the consideration to be paid in future for goods and services. Notes To The Consolidated Financial Statements 5.20 Contingencies The assessment of the contingencies inherently involves the exercise of significant judgment as the outcome of the future events cannot be predicted with certainty. The Group, based on the availability of the latest information, estimates the value of contingent assets and liabilities which may differ on the occurrence/nonoccurrence of the uncertain future event(s) Revenue recognition Revenue is measured at the fair value of the consideration received or receivable and represents amounts receivable for goods and services provided in the normal course of business. Local sales are recognized as revenue when invoiced with the transfer of significant risks and rewards of ownership, which coincides with delivery. Export sales are recognized as revenue when invoiced with the transfer of significant risks and rewards of ownership, which coincides with date of shipping bill. Export rebate is recognized on accrual basis at the time of export sale. Interest income is recognized on a time proportion basis that takes into account the effective yield Foreign currency translation Transactions in foreign currencies are accounted for in rupee at the rate of exchange prevailing on the date of transaction. Monetary assets and monetary liabilities in foreign currencies as at the balance sheet date are expressed in rupee at rates of exchange prevailing on that date. Non-monetary items that are measured in terms of historical cost in a foreign currency are translated using the exchange rate at the date of the transaction. Exchange differences are taken to the profit and loss account Off-settng of financial assets and financial liabilities Financial assets and financial liabilities are off-set and the net amount is reported in the financial statements only when the Group has a legally enforceable right to off-set the recognized amounts and the Group intends either to settle on a net basis or to realize the asset and settle the liability simultaneously Provisions A provision is recognized in the balance sheet when the Group has a legal or constructive obligation as a result of a past event, and it is probable that an outflow of economic benefits will be required to settle the obligation Operating segments A business segment is a group of assets and operations engaged in providing products or services that are subject to risks and returns that are different from those of other business segments. As the operations of the Group are predominantly carried out in Pakistan, information relating to geographical segment is not considered relevant. The Group accounts for segment reporting using the business segments as the primary reporting format based on the Group's practice of reporting to the management on the same basis Impairment The carrying amount of the Group's assets are reviewed at each balance sheet date to determine whether there is any indication of impairment. If such an indication exists, the asset's recoverable amount is estimated and accordingly an impairment loss is recognized in the profit and loss account for the carrying amount of the asset that exceeds its recoverable amount. Annual Report
91 Notes To The Consolidated Financial Statements 5.27 Related party transactions All related party transactions are carried out by the Group on commercial terms. 5.2 Dividend Dividend distribution to the Group's shareholders is recognized as a liability in the Group's consolidated financial statements in the period in which such dividends are approved. 6 CHANGE IN ACCOUNTING POLICY The specific provision / section in the repealed Companies Ordinance, 1984 relating to the surplus on revaluation of fixed assets has not been carried forward in the Companies Act, Previously, section 235 of the repealed Companies Ordinance, 1984 specified the accounting treatment and presentation of the surplus on revaluation of fixed assets, which was not in accordance with the IFRS requirements. Accordingly, in accordance with the requirements of International Accounting Standard (IAS) 16, Property, Plant and Equipment, surplus on revaluation of fixed assets would now be presented under equity. Following the application of IAS 16, the Group s policy for surplus on revaluation of land and building stands amended as follows: - Increases in the carrying amounts arising on revaluation of land and buildings are recognized, net of tax, in other comprehensive income and accumulated in reserves in shareholders equity. To the extent that the increase reverses a decrease previously recognized in statement of profit or loss, the increase is first recognized in profit or loss. Decreases that reverse previous increases of the same asset are first recognized in other comprehensive income to the extent of the remaining surplus attributable to the asset; all other decreases are charged to profit or loss. Each year, the difference between depreciation based on the revalued carrying amount of the asset charged to profit or loss and depreciation based on the asset s original cost, net of tax, is reclassified from the Revaluation surplus on land and building to retained earnings. The change in accounting policy has been accounted for retrospectively in accordance with the requirements of IAS 8 Accounting Policies, Changes in Accounting Estimates and Errors and comparative figures have been restated. As at June 30, 2017 As at June 30, 2016 Previously Previously As-restated Re-statement As-restated Re-statement reported reported Rupees Effect on statement of financial position Surplus on revaluation of property, plant and equipment 571,665,218 - (571,665,218) 598,918,688 - (598,918,688) Share capital and reserves - 571,665, ,665, ,918, ,918,688 Effect on statement of changes in equity Revaluation surplus of property, plant and equipment - 571,665, ,665, ,918, ,918,688 As at June 30, 2017 Previously As-restated Re-statement reported Rupees Effect on statement of comprehensive income Gain on revaluation of land and buildings - net of deferred tax There was no cash flow impact as a result of the retrospective application of change in accounting policy. Notes To The Consolidated Financial Statements 7 SHARE CAPITAL 7.1 Authorized Share Capital Number of shares Rupees Rupees 200,000, ,000,000 Rs. 10) 2,000,000,000 2,000,000, Issued, Subscribed And Paid Up Share Capital 50,340,213 21,197,213 Rs. 10) each fully paid in cash 503,402, ,972,130 6,002,950 6,002,950 for consideration other than 60,029,500 60,029,500 60,228,931 60,228,931 bonus shares 602,289, ,289, ,572,094 87,429,094 1,165,720, ,290, Shares held by the related parties of the Group Name of the shareholders Ordinary shares of Rs. 10 (2017: Ordinary shares of Rs. 10 (2017: Ordinary shares of Rs. 10 (2017: Rs. 10) each issued as fully paid Ordinary shares of Rs. 10 (2017: Rs. 10) each issued as fully paid --Number of Shares-- Mr. Jawed Ali Ghori 22,661,925 22,661,925 Mr. Khalid Sarfaraz Ghori 22,886,925 22,886,925 Mr. Tariq Ghori 22,909,425 22,909,425 Mr. Faizan Ali Ghori 245, ,997 Ms. Naheed Jawed 427, ,500 Ms. Nuzhat Khalid Ghori 427, ,500 Ms. Sadaf Tariq 405, ,000 International Finance Corporation 17,485,819 17,485,819 Mr. Naeem-ur-Rehman Akhoond 1 1 Mr. Syed Kamran Rasheed 1 1 Mr. Iftikhar Soomro - 1 Mr. Abdul Samad Khan 1 - Annual Report
92 Notes To The Consolidated Financial Statements 7.4 Reconciliation of number of shares outstanding is as under: Note --Number of Shares-- Shares at the beginning of the year 87,429,094 87,429,094 Shares issued during the year in cash ,143,000 - Bonus shares issued during the year - - Shares at the end of the year 116,572,094 87,429,094 Notes To The Consolidated Financial Statements 9 SURPLUS ON REVALUATION OF PROPERTY, PLANT AND EQUIPMENT - NET OF TAX This represents surplus arising on revaluation of land, building and plant and machinery. The revaluation was carried by MYK Associates (Private) Limited and KG Traders (Private) Limited on March 31, (refer note 15.5). Note Rupees Rupees (Restated) Balance at beginning of the year 571,665, ,918,688 Surplus arising on revaluation during the year The Holding Company has issued 15% shares to International Finance Corporation (IFC) (registered with world bank) under an agreement with the Group. During the year 2012, the Holding Company offered shares as fully paid right shares which were declined by the existing members and the directors issued those shares to the IFC. These shares have been issued at a price of Rs per share resulting in overall premium on issue of shares amounting to Rs million. During the year, the Holding Company has offered these shares to general public through Initial Public Offering (IPO). These shares have been issued at a price of Rs. 26 per share resulting in overall premium on issue of shares amounting to Rs million. Transferred to un-appropriated profits on account of - incremental depreciation (35,548,005) (39,497,783) - tax impact on incremental depreciation 10,664,401 12,244,313 Balance at end of the year 546,781, ,665, LONG TERM FINANCES - SECURED From banking companies and financial institution: 8 CAPITAL RESERVE Note Rupees Rupees Share premium 8.1 & ,367, ,382,823 This represents premium received over and above face value of the shares issued to International Finance Corporation amounting to Rs. 341 million out of which Rs million had been utilized under section 83 of the repealed Companies Ordinance, 1984 during the year ended June 30, This represents premium received over and above face value of the shares issued to general public through IPO amounting to Rs million out of which Rs million had been utilized under section 81 of the Companies Act, 2017 during the year ended June 30, MCB Bank Limited 10.1 & ,357, ,930,722 - Pak Oman Investment Group Limited 10.3 & ,783,084 88,482,518 - United Bank Limited ,445,584 51,111, ,586, ,525,111 Current portion of long term finances (84,029,706) (96,733,247) 246,556, ,791,864 This also includes LTFF financing facility of Rs. 250 million (2017: Rs 250 million) for rice protein/rice glucose plant. It is secured by 1st pari passu hypothecation charge of Rs million (2017: Rs million ) over all present and future fixed assets (excluding land and building). Further secured by 1st pari passu mortgage charge of Rs million over land and building (2017: Rs million). It carries mark-up at SBP rate plus 1.0% per annum (2017: SBP rate plus 1%). The Loan is repayable in quarterly installments starting from 15th month from first disbursement i.e. September This include LTFF/DF financing facility of Rs million (2017: Rs million) for plant & machinery expansion. It is secured by 1st hypothecation charge of Rs million (2017: Rs million) over all present and future fixed assets (excluding land and building). Further secured by 1st mortgage charge of Rs million (2017: Rs million) over land and building. It carries mark-up at 3 months KIBOR plus 1.0% per annum (2017: KIBOR plus 1.0% per annum). The Loan is repayable in semi annual installments and shall be repaid by April Annual Report
93 Notes To The Consolidated Financial Statements 10.3 This include LTFF financing facility of Rs. 100 million (2017: Rs. 100 million) for import of various machineries and equipment required for expansion in grain storage silos in Sadhoki Punjab. It is secured by 1st pari passu charge of Rs. 133 million (2017: Rs. 133 million) over present and future fixed assets including land, building, plant & machinery of the project located at Sadhoki Punjab. This facility swap to Term Finance Facility and carries mark up at 3 months KIBOR plus 2.0% per annum (2017: 3 months KIBOR plus 2.0% per annum). The Loan is repayable in quarterly installments and shall be repaid by June This also include LTFF financing facility of Rs. 60 million (2017: 60 million) for financing the import of paddy processing machinery at the Group's auto rice mill in Sadhoki Punjab. It is secured by 1st pari passu charge of Rs. 133 million (2017: Rs. 133 million) over fixed assets of the Group. This facility swap to Term Finance Facility and carries mark up at SBP Rate plus 1% per annum.(2017: SBP Rate plus 1% per annum). The loan is repayable in quarterly installments and shall be repaid by June This include financing facility of LTFF Rs. 2.7 million and NIDF of Rs million (2017: LTFF Rs. 4.5 million and NIDF Rs million) for BMR expenses of the Group. The facility is secured by exclusive charge of Rs million (2017: Rs million) over land and building located at G-205 super highway Karachi., out of which Rs. 50 million (2017: Rs. 50 million) is tagged to this facility. Margin of Rs. 17 million (2017: Rs. 17 million) is secured against ranking charge over all present and future fixed assets of the Group. LTFF carries mark up at SBP rate plus 2.5% per annum and NIDF carries mark up at 6 months KIBOR plus 2.0% per annum (2017: LTFF SBP rate plus 2.5% per annum and NIDF 6 months KIBOR plus 2.0% per annum). These loans are repayable in semi-annual installments and shall be repaid by January LIABILITIES AGAINST ASSETS SUBJECT TO FINANCE LEASES Under the Musharika agreements, lease rentals are payable in 60 equal monthly installments. The financings carry mark-up at rates ranging from 6 months KIBOR plus 1.75% to 2.25% (2017: 6 months KIBOR plus 1.75% to 2.25%) per annum approximately which have been used as a discounting factor. The Group has the option to purchase the asset upon completion of the lease period. The minimum lease payments for which the Group has committed to pay in future under the lease agreements are due as follows: Minimum Financial Present value of Minimum Financial Present value of lease charges minimum lease lease charges minimum lease payments payments Rupees Rupees Up to one year 16,397,852 4,171,563 12,226,289 9,788,105 1,788,829 7,999,276 Notes To The Consolidated Financial Statements 12 DEFERRED LIABILITIES Note Rupees Rupees Staff gratuity scheme - unfunded ,423,344 51,785,250 Deferred tax liability ,211, ,518,784 Employees' end of service benefit 169, , Staff gratuity scheme - unfunded 143,803, ,452,679 Balance at beginning of the year 51,785,250 41,775,828 Charge for the year 28 & 30 15,859,134 15,098,528 Actuarial losses 229,441 3,109,867 Payments made during the year (8,450,481) (8,198,973) Balance at end of the year Staff retirement benefits - unfunded ,423,344 51,785,250 In accordance with the requirements of IAS-19 Employee Benefits, actuarial valuation was carried out as at June 30, 2018, using the Projected Unit Credit Method. Provision has been made in these consolidated financial statements to cover obligations in accordance with the actuarial recommendations. Details of significant assumptions used for the valuation in respect of above-mentioned schemes are as follows: Discount rate - per annum 9.00% 7.50% Expected rate of increase in salaries - per annum 8.00% 6.50% The amounts recognized in the balance sheet are as follows: Present value of defined benefit obligation 59,193,903 48,675,383 Actuarial losses 229,441 3,109, ,423,344 51,785,250 Later than one year but not later than five years 38,144,067 8,859,647 29,284,420 18,179,284 2,046,438 16,132,846 Later than five years ,671, ,357 1,029,495 54,541,919 13,031,210 41,510,709 29,639,241 4,477,624 25,161,617 Annual Report
94 Notes To The Consolidated Financial Statements Notes To The Consolidated Financial Statements Movements in the net liability recognized in the balance sheet are as follows: The amounts recognized in the profit and loss account against defined benefit scheme are as follows: The amounts recognized in the other comprehensive income against defined benefit scheme are as follows: Expense chargeable to profit and loss account for the next year Current service cost 15,577,487 12,069,285 Interest cost 5,348,101 3,883,894 Charge for the year 20,925,588 15,953,179 The expense for the staff retirement benefit scheme has been allocated as follows: Note Rupees Rupees Opening liability 51,785,250 41,775,828 Charge for the year ,859,134 15,098,528 Actuarial losses 229,441 3,109,867 Benefits paid (8,450,481) (8,198,973) Balance at end of the year 59,423,344 51,785,250 Current service cost 12,292,133 11,707,657 Interest cost 3,567,001 3,390,871 Charge for the year 15,859,134 15,098,528 Remeasurement of defined benefits obligation (229,441) (3,109,867) Cost of sales ,246,750 7,862,500 Administrative expenses ,612,384 7,236,028 15,859,134 15,098,528 This represent deferred tax on surplus on revaluation of property, plant and equipment. Further, the Group has deferred tax asset amounting to Rs million (Rs. 2017: 10.5 million). However, the Group has not recorded deferred tax asset in the books of the Group Employees' end of service benefits 14 ACCRUED MARK-UP Rupees Rupees Opening liability 148,645 - Charge for the year 20, ,645 Payment during the year - - Closing liability 169, , TRADE AND OTHER PAYABLES 13.1 Creditors 159,977, ,859,748 Accrued liabilities 32,885,654 21,781,522 Security deposit from customer ,000 - Tax deducted at source and payable to statutory authorities 1,079,529 1,454,300 Sales tax payable 591,311 3,469 Workers welfare fund ,140,803 3,073,894 Workers profit participation fund ,283,606 12,836, Workers welfare fund Mark-up on long term finances 4,436,488 12,469,173 Mark-up on short term borrowings 44,042,236 33,586,990 Mark-up on finance lease 288,704-48,767,428 46,056,163 Note 219,982, ,009,163 This represents amount received from the customer of the Group, which is utilized for the purpose of the business in accordance with the related agreements. Opening balance 3,073,894 27,619,736 Allocation of the year 7,066,909 3,073,894 Reversal of WWF - (27,619,736) Amount paid to the fund - - Closing balance 10,140,803 3,073, Workers profit participation fund Opening balance 12,836,230 - Allocation of the year 15,283,606 12,836,230 Amount paid to the fund (12,836,230) - Closing balance 15,283,606 12,836,230 Annual Report
95 Notes To The Consolidated Financial Statements Notes To The Consolidated Financial Statements 15 SHORT TERM BORROWINGS - SECURED Note Rupees Rupees MCB Bank Limited (MCB) Export refinance (secured) 15.1 & ,352, ,852,000 Foreign bills purchased/negotiated ,136,007 United Bank Limited (UBL) FAPC I (secured) ,397, ,397,000 Foreign bills purchased/negotiated ,888,652 Askari Bank Limited (AKBL) Export refinance (secured) ,200, ,061,934 National Bank of Pakistan (NBP) Export refinance (secured) ,000, ,000,000 Habib Metropolitan Bank Limited Export refinance (secured) ,900, ,000,000 Foreign bills purchased/negotiated ,230,753 Allied Bank Limited (ABL) Export refinance ,000, ,000,000 Habib Bank Limited (HBL) Export refinance ,200, ,000,000 Standard Chartered Bank Export refinance ,500, ,500,000 Faysal Bank Limited Export refinance ,500, ,000,000 Bank Al Falah Limited Export refinance ,500, ,000,000 Pak Oman Investment Export refinance ,000, ,000,000 TJ Foods Working capital loan ,532,384 4,081,779,753 3,908,367, This facility has been obtained under State Bank of Pakistan (SBP) Export Refinance Scheme. The sanctioned limit is Rs. 330 million (2017: Rs. 330 million). It carries mark-up at SBP rate plus 1.0% per annum (2017: SBP rate plus 1.0% per annum). This facility is secured by 1st registered joint pari passu hypothecation charge of Rs. 600 million over all present and future current assets, 1st registered joint pari passu hypothecation charge of Rs. 135 million over all present and future fixed assets excluding land & building, 1st registered joint mortgage charge of Rs. 135 million over land and building and properties. (2017: 1st registered joint pari passu hypothecation charge of Rs. 600 million over all present and future current assets, 1st registered joint pari passu hypothecation charge of Rs. 135 million over all present and future fixed assets excluding land & building, 1st registered joint mortgage charge of Rs. 135 million over land and building and selected properties) and personal guarantees of nominee directors. The facility expiry date is 31 March, This facility has been obtained under SBP Export Refinance Scheme. The sanctioned limit is Rs. 250 million (2017: Rs. 250 million). Formerly, it belonged to NIB Bank. It carries mark-up at SBP rate plus 0.75% (2017: SBP rate plus 0.75% per annum). This facility is secured by joint pari passu charge of Rs. 334 million over all present and future current assets, joint pari passu charge of Rs. 75 million over all present and future movable fixed assets and immovable properties.(2017: Joint pari passu charge of Rs. 334 million over all present and future current assets, joint pari passu charge of Rs. 75 million over all present and future movable fixed assets and immovable properties.) and personal guarantees of sponsoring directors. The facility expiry date is 30 November, The sanctioned limit is Rs. 100 million (2017: Rs. 100 million). It carries mark-up at LIBOR plus spread per annum to be negotiated at the time of execution of transaction. This facility is secured by lien over clean export bills drawn under LCs of "A" rated banks and further secured through securities as mentioned in note The facility expiry date is 31 March, This facility has been obtained under SBP Export Refinance Scheme. The sanctioned limit is Rs. 500 million (2017: Rs. 500 million). It carries mark-up at SBP rate plus 1.0% per annum (2017: SBP rate plus 1.0% per annum). This facility is secured by 1st joint pari passu hypothecation charge of Rs. 800 million over all present and future current assets with 25% margin, 1st joint pari passu hypothecation charge of Rs million over all present and future fixed assets (excluding land & building), 1st joint mortgage charge of Rs million over land and building of selected properties.{2017: 1st joint pari passu hypothecation charge of Rs. 800 million over all present and future current assets, 1st joint pari passu hypothecation charge of Rs. 75 million over all present and future fixed assets (excluding land & building), 1st joint mortgage charge of Rs. 75 million over land and building of selected properties} and personal guarantees of sponsoring directors. The facility expiry date is 30 November, This sanctioned limit is Rs. 100 million (2017 : Rs. 100 million). It carries mark-up rate negotiated at the time of execution of transaction (2017: mark-up rate negotiated at the time of execution of transaction). This facility is secured through securities as mentioned in note The facility expiry date is 30 November, This facility has been obtained under SBP Export Refinance Scheme. The sanctioned limit is Rs. 488 million (2017: Rs. 488 million). It carries mark-up at SBP rate plus 0.75% per annum/ 3 Month KIBOR plus 1% per annum (2017: SBP rate plus 0.75% per annum/ 3 Month KIBOR plus 1 per annum). This facility is secured by 1st joint pari passu hypothecation charge of Rs million over all current assets with 25% margin, 100% secured against Cash collateral in the shape of TDR in the name of Group/ Director having value Rs. 1.2 million, 1st joint pari passu mortgage charge of Rs. 150 million over fixed assets (2017: 1st joint pari passu hypothecation charge of Rs million over all current assets with 25.0% margin, 1st joint pari passu mortgage charge of Rs. 150 million over fixed assets). The facility expiry date is 31 March, Annual Report
96 Notes To The Consolidated Financial Statements Notes To The Consolidated Financial Statements This facility has been obtained under SBP Export Refinance Scheme. The sanctioned limit is Rs. 400 million (2017: Rs. 400 million). It carries mark-up at KIBOR plus 2% per annum (2017: KIBOR plus 2% per annum). This facility is secured by 1st pari passu hypothecation charge of Rs million over all present and future current assets,1st pari passu hypothecation charge of Rs. 120 million over all present and future fixed assets (excluding land and building), 1st pari passu equitable mortgage charge of Rs. 120 million over all immovable properties (including land and building). {2017: 1st pari passu hypothecation charge of Rs 534 million over all present and future current assets,1st pari passu hypothecation charge of Rs. 120 million over all present and future fixed assets (excluding land and building), 1st pari passu equitable mortgage charge of Rs. 120 million over all immovable properties (including land and building} and personal guarantees of sponsoring directors. The facility expiry date is 31 March, This facility has been obtained under SBP Export Refinance Scheme. The sanctioned limit is Rs. 300 million (2017: Rs. 300 million). It carries mark-up at SBP rate plus 1.0% per annum/ 3 Months KIBOR plus 1% (2017: SBP rate plus 1.0% per annum/ 3 Months KIBOR plus 1%). This facility is secured by joint pari passu hypothecation charge of Rs. 400 million over all present and future current assets, joint pari passu hypothecation charge of Rs. 90 million over all present and future fixed assets(excluding land and building), joint pari passu equitable mortgage charge of Rs. 90 million over land and building of selected properties.{2017: Joint pari passu hypothecation charge of Rs. 400 million over all present and future current assets, joint pari passu hypothecation charge of Rs. 90 million over all present and future fixed assets(excluding land and building), joint pari passu equitable mortgage charge of Rs. 90 million over land and building of selected properties} and personal guarantees of sponsoring directors. The facility expiry date is 31 March, The sanctioned limit is Rs. 250 million (2017: Rs. 100 million). It carries mark-up that is to be negotiated on case to case basis. (2017: to be negotiated on case to case basis). This facility is secured by ranking hypothecation charge of Rs. 133 million over stocks and receivables duly insured in bank's favor covering all risks with premium payment receipt. (2017: ranking hypothecation charge of Rs. 133 million over stocks and receivables duly insured in bank's favor covering all risks with premium payment receipt.) and lien over clean/ accepted documents under export LCs. The facility expiry date is 31 March, This facility has been obtained under SBP Export Refinance Scheme. The sanctioned limit is Rs. 250 million (2017 : 250 million). It carries mark-up at SBP rate plus 0.75% per annum (2017 : SBP rate plus 0.75% per annum). This facility is secured by 1st joint pari passu hypothecation charge of Rs million over all present and future current assets, 1st joint pari passu charge of Rs. 84 million over all present and future fixed assets including land, building, plant & machinery (2017: 1st joint pari passu hypothecation charge of Rs million over all present and future current assets, 1st joint pari passu charge of Rs. 84 million over all present and future fixed assets including land, building, plant & machinery) and personal guarantees of sponsoring directors. The facility expiry date is 29 March, This facility has been obtained under SBP Export Refinance Scheme. The sanctioned limit is Rs. 370 million (2017: Rs. 320 million). It carries mark-up at SBP rate plus 1.00% per annum/ 3 Months KIBOR plus 0.75% (2017: SBP rate plus 1.00% per annum/ / 3 Months KIBOR plus 0.75%). This facility is secured by joint pari passu hypothecation charge of Rs million over all current assets with 25% margin, joint pari passu hypothecation charge over all present and future fixed assets plus joint pari passu mortgage over all immovable properties collectively of Rs. 111 million. (2017: Joint pari passu hypothecation charge of Rs million over all current assets, joint pari passu hypothecation charge over all present and future fixed assets plus joint pari passu mortgage over all immovable properties collectively of Rs. 111 million.)and personal guarantees of sponsoring directors The facility expiry date is 28 February, The sanctioned limit of the said facility is Rs. 250 million (2017: Rs. 250 million). It carries mark-up that to be negotiated at the time of utilization. This facility is secured by first joint pari passu hypothecation charge amounting to Rs million over all present and future stocks and receivables, first joint pari passu hypothecation charge amounting to Rs. 75 million over all present and future fixed assets including land, building, plant and machinery (2017: first joint pari passu hypothecation charge amounting to Rs million over all present and future stocks and receivables, first joint pari passu hypothecation charge amounting to Rs. 75 million over all present and future fixed assets) and personal guarantees of sponsoring directors for Rs. 250 million jointly and severally. The facility expiry date is 30 June, This facility has been obtained under SBP Export Refinance Scheme. The sanctioned limit is Rs. 550 million (2017: Rs. 550 million). It carries mark-up at SBP rate plus 0.75% per annum/ 3 Months KIBOR plus 0.75% per annum (2017: SBP rate plus 0.75% per annum/ 3 Months KIBOR plus 0.75% per annum). This facility is secured by 1st pari passu hypothecation charge of Rs million over stock and book debts, 1st pai passu hypothecation and mortgage charge of Rs. 165 million over fixed assets (2017: 1st pari passu hypothecation charge of Rs. 734 million over stock and book debts, 1st pai passu hypothecation and mortgage charge of Rs. 165 million over fixed assets.), lien over export documents and personal guarantees of executive directors. The facility expiry date is 31 December, This facility has been obtained under SBP Export Refinance Scheme. The sanctioned limit is Rs. 300 million (2017: Rs. 300 million). It carries mark-up at SBP rate plus 0.75% per annum/ 3 Months KIBOR plus 0.75% per annum (2017: SBP rate plus 0.75% per annum/ 3 Months KIBOR plus 0.75% per annum).this facility is secured by 1st pari passu hypothecation charge of Rs. 400 million over current assets (Stock/Receivables), 1st pari passu equitable mortgage charge of Rs. 90 million over land, building, plant & machinery. {2017: Rs.1st pari passu hypothecation charge of Rs. 400 million over current assets (Stock/Receivables), 1st pari passu equitable mortgage charge of Rs. 90 million over land, building, plant & machinery} and personal guarantees of sponsoring directors. The facility expiry date is 31 December, The sanctioned limit is Rs. 250 million (2017: Rs. 250 million ). It carries mark-up rate at KIBOR plus 2% per annum (2017: KIBOR plus 2.% per annum). This facility is secured by ranking charge over current assets of the Group with 25% margin, post dated cheque of principle amount and two markup payments and personal guarantees of sponsor directors. The facility expiry date is 13 October, During the year, the JKT General Trading (FZE) obtained a working capital loan to fund its operations. This loan will be repaid within 6 months and is non-interest bearing. It has been repaid during the year. UNPAID DIVIDEND This represents part of interim dividend for the half yearly ended December 31, 2017 which remained unpaid to the shareholders who have not provided their valid CDS Account no. and IBAN no. The Group has already sent letters to those shareholders for the purpose of above stated information. Annual Report
97 Notes To The Consolidated Financial Statements CONTINGENCIES AND COMMITMENTS Contingencies This civil suit No of 2009 has been filed by the Holding Company against the Province of Sindh and others for possession and injunction before the Honourable High Court of Sindh. It is contended by the Holding Company that the Defendant No. 3 (Syed Alay Sadequain Naqvi) is unlawfully occupying 3 acres of Land belonging to the Company bearing no. G/205, SITE SHW, Phase-II, Survey Sheet no. 35P/1-35L/13 ("Property"), situated along the Super Highway, Karachi. In the instant suit, the Holding Company has prayed for possession of the Property and a permanent injunction to restrain the defendants from allienating or tranferring the property. The Holding Company also filed a stay application seeking to restrain the defendants from allienating, transferring, possessing or encumberring the land. An ad interim order was passed by the Honourable High Court of Sindh on November 19, 2009, whereby it was directed that no third party interest shall be created in respect of the property. The matter is currently at the stage of hearing of applications. This suit was instituted on November 18, The next hearing is expected on September 11, The instant Civil Appeal No. 311 of 2017 is filed by Mr. Syed Alay Sadqain Naqvi ("Appellant") against the Province of Sindh, Holding Company & others before the IVth Additional District and Sessions Judge at Karachi (West) assailing therein the order dated August 29, 2017 ("Order") passed in suit no of 2017 (Syed Alay Sadequain Naqvi versus Province of Sindh, Holding Company and others) by the VIIth Senior Civil Judge at Karachi (West). Pursuant the order, the plaint in the suit of the Appelant was rejected under Order VII Rule 11 of the Code of Civil Procedures, The dispute between the parties is in relation to piece of land meassuring 10 acres ("Subject Land"), which also includes the land that is subject matter of Suit no of It is the case of Appealant that he is the lawful owner of the subject land. The Holding Company, inter alia, contends that the instant Appeal is liable to be dismissed since the instant appeal is the third round of litigation instituted by the Appealant involving the same dispute pertaining to the subject land despite the dismisaal of Appealant previous suits and appeals. The matter is currently reserved for judgement. The Petition No. 3358/2011 and 1823/2013 was instituted on December 13, 2011 and April 29, 2013 by the Holding Company against Federal Board of Revenue (FBR) and Others in Honorable High Court of Islamabad. Whereby, the chargeability of the customs duty against import of storage silos has been challenged. It is pertinent to point out that the said import was exempt from duties and taxes vide SRO No. 575(I) Now through SRO dated October 23, 2012, the said silos have been added as clarificatory being exempt. The said chargeability of Customs Duty has been challenged of the intervening period through these petitions. The Holding Company has filed intra court appeal ICA no. 84/2015 and 85/2015 on February 26, Both the appeals are pending in Houranable High Court of Islamabad, notices are issued. The hearing is expected on October 10, In the meanwhile the Holding Company has also filled suit no. 392 of 2015 against the Federal Board of Revenue and Model Customs Collectorate due to suspension of Group's Customs ID and the threatened suspension of NTN of the Holding Company. An interim restraining order against such suspension was granted in favour of the Holding Company by the Honorable High Court of Sindh, which is operative till date. The case is still pending adjudication. The Counsel hopes these cases will be decided in favor of the Holding Company. Notes To The Consolidated Financial Statements In prior years Sindh Government imposed infrastructure 0.85% of import value on all imports into Pakistan. A large number of importers including the Holding Company filed the Constitution Petition No of 2013 in the Honorable High Court of Sindh against Province of Sindh. This petition was instituted on May 20, The Honorable High Court of Sindh has issued an interim order allowing release of imported goods on 50% payment and 50% bank guarantee. The litigation is pending adjudication. The management of the Holding Company on the basis of the Counsel s opinion is confident that the Holding Company is not likely to suffer any losses on account of the said petition Commitments Commitments for rentals under cancellable Ijara contracts in respect of vehicles are as follows: Not later than one year 74,784 3,201,816 Later than one year but not later than five years - 74, PROPERTY PLANT AND EQUIPMENT Note Rupees Rupees Capital expenditures 345,991,757 - Forward exchange contracts to sell - 755,280,000 Letter of credit 300,482,000 3,568,347 Letter of guarantees - 18,246,460 Ijara contracts ,784 3,276, ,548, ,371,407 74,784 3,276,600 Operating fixed assets ,163,162,877 1,781,931,114 Capital work in progress ,422, ,377, ,168,585,255 2,141,308,121 The management of the Holding Company on the basis of the Counsel s opinion is confident that the Holding Company is not likely to suffer any losses on account of the said petition. Annual Report
98 Notes To The Consolidated Financial Statements 18.1 Operating fixed assets Notes To The Consolidated Financial Statements The depreciation charge for the year has been allocated as follows: Particulars Cost at July 01, 2017 Additions Cost / Revaluation Transfers in / (out) Revaluation surplus (Disposals) Cost at June 30, Accumulated Depreciation depreciation at for the year July 01, 2017 Depreciation (Depreciation on disposals) Accumulated depreciation at June 30, 2018 Rate per Book value at annum June 30, 2018 % Note Rupees Rupees Owned Assets Leasehold land 90,000, ,000, ,000,000 - Factory land 452,921,021 78,973, ,894, ,894,744 - Factory building 715,359, ,746, ,105, ,418,521 52,306, ,725, ,380, Plant and machinery 1,056,260, ,036, ,304,296, ,563,989 81,032, ,596, ,700, Electric cables and fittng 39,553,820 22, ,576,420 17,706,633 2,185,251-19,891,884 19,684, Furniture and fixture 9,489, , ,945,997 5,089, ,748-5,555,169 4,390, Motor vehicles 69,018,242 15,378,291-7,332,887 77,063,646 54,447,066 8,806,462 5,029,667 58,223,861 18,839, Office equipment 19,294,764 1,111, ,406,020 10,402, ,071-11,350,739 9,055, Factory equipment 13,164,270 3,459, ,624,025 6,220, ,473-7,083,754 9,540, Computers 16,192, , ,941,349 10,702,301 1,951,597-12,653,898 4,287, Camera 3,468, ,468,608 3,111, ,898-3,229, , Godown & Shops 25,997,428 38, ,153,871 23,881,972 8,305,214 1,771,853 1,526,666 8,550,401 15,331, Sewing machine 1,244,205 35, ,279, ,537 53, , , Mobile phone 2,658, , ,799,027 1,543, ,359-1,948, , Generator 70,038, ,038,367 30,740,751 3,929,762-34,670,513 35,367, Sub-total 2,584,661, ,146, ,486,758 3,106,321, ,968, ,838,434 6,556,333 1,002,250,235 2,104,071,641 Leased Assets under diminishing musharika Motor Vehicle 59,449,260 15,269, ,718,435 8,211,681 7,415,518-15,627,199 59,091, Total 2,644,110, ,416, ,486,758 3,181,040, ,179, ,253,952 6,556,333 1,017,877,434 2,163,162,877 Particulars Owned Assets Cost at July 01, 2016 Leasehold land 90,000, ,000, ,000,000 - Factory land 442,863,012 10,058, ,921, ,921,021 - Factory building 715,149, , ,359, ,107,186 46,311, ,418, ,940, Plant and machinery 959,703,390 96,557, ,056,260, ,086,518 65,477, ,563, ,696, Electric cables and fittng 39,553, ,553,820 15,279,168 2,427,465-17,706,633 21,847, Furniture and fixture 9,436,987 52, ,489,967 4,603, ,530-5,089,421 4,400, Motor vehicles 98,699,792 2,085,700 (21,478,250) - 10,289,000 69,018,242 50,370,627 11,290,253 7,213,814 54,447,066 14,571, Office equipment 18,777, , ,294,764 9,463, ,784-10,402,668 8,892, Factory equipment 12,534, , ,164,270 5,475, ,266-6,220,281 6,943, Computers 13,336,429 2,856, ,192,668 9,103,771 1,598,530-10,702,301 5,490, Camera 3,468, ,468,608 2,935, ,968-3,111, , Godown & Shops 10,190,807 15,806, ,997,428 7,653, ,192-8,305,214 17,692, Sewing machine 1,244, ,244, ,907 58, , , Mobile phone 1,853, , ,658,437 1,223, ,328-1,543,411 1,115, Generator 70,038, ,038,367 26,374,349 4,366,402-30,740,751 39,297, Sub-total 2,486,850, ,578,064 (21,478,250) - 10,289,000 2,584,661, ,333, ,848,154 7,213, ,968,134 1,730,693,535 Leased Assets under diminishing musharika Additions Cost / Revaluation Transfers in / (out) Revaluation surplus (Disposals) Cost at June 30, 2017 Motor Vehicle 19,964,560 18,006,450 21,478, ,449,260 5,475,132 2,736,549-8,211,681 51,237, Total 2,506,815, ,584, ,289,000 2,644,110, ,808, ,584,703 7,213, ,179,815 1,781,931, Accumulated depreciation at July 01, 2016 Depreciation for the year Depreciation (Depreciation on disposals) Accumulated Book value at depreciation at June 30, 2017 June 30, 2017 Rate per annum % Cost of sales ,803, ,067,763 Distribution expenses 29 8,112,698 6,879,235 Administrative expenses 30 24,338,093 20,637, ,253, ,584,703 Factory land includes a plot in which a law suit has been filed by the plaintiff who is claiming the possession and injunction of the property. The case is in process under the Honorable High Court Sindh Karachi (refer note ). Operating fixed assets include assets that are subject to mortgage with various banks against long term finances and short term borrowings (refer note 10 and 15) Details of forced sale value of revalued property, plant and equipment Description of Assets Forced sale value Rupees Land 393,075,000 Building 466,544,600 Plant and machinery 564,560,000 The above forced sale value has been taken from revaluation report of K.G Traders (Private) Limited as on 7 Apr Following items of property, plant and equipment having book value above Rs. 500,000 were disposed off during the year: Cost / Accumulated Revaluation depreciation Net book amount Sale proceeds Gain / (Loss) Mode of disposal Particulars of buyer Rupees Toyota Vigo Ghulam Muhammad 2,848,291 1,613,324 1,234,967 2,450,000 1,215,033 Negotiation Chaang Building Safora Shop 2,153,871 1,526, ,205 2,335,000 1,707,795 Through agent Zeeshan Total 5,002,162 3,139,990 1,862,172 4,785,000 2,922,828 The buyers do not have any relationship with the Group and its directors. Annual Report
99 Notes To The Consolidated Financial Statements Particulars of immovable property (i.e. land and building) in the name of Group are as follows: Locations Total Area in Acres Covered Area in Square Feet Notes To The Consolidated Financial Statements The amount belongs to the construction of rice glucose plant installing at G-205, SITE II, super highway, Karachi from the IPO proceeds Movement in capital work in progress is as under: L-24/1, Block-21, Federal 'B' Industrial Area, Karachi Plot A-15 & 16, SITE-II, Super highway Karachi A-21, SITE-II, Super highway, Karachi As at July 01, 2017 Additions / (adjustment) during the year Rupees Plant and machinery 359,064,281 12,343,339 (371,407,620) - Civil works 312,726 42,707,652 (37,598,000) 5,422, ,377,007 55,050,991 (409,005,620) 5,422,378 Cost (Transferred) to fixed assets As at June 30, 2018 G-205, SITE-II, Super highway, Karachi 50 KM G.T Road, Sadhoke District, Gujranwala Plot G-06, Port Qasim Authority, Karachi B1-A, SITE-II, Super highway, Karachi Plot H-162, SITE-II, Super highway, Karachi As at July 01, 2016 Additions / (adjustment) during the year Rupees Plant and machinery 15,196, ,341,808 (73,473,817) 359,064,281 Civil works 209,948 30,600,584 (30,497,806) 312,726 15,406, ,942,392 (103,971,623) 359,377,007 Had there been no revaluation, the net book value of specific classes of operating property, plant and machinery would have been amounted to: Cost (Transferred) to fixed assets As at June 30, 2017 Plot F-193, SITE-II, Super highway, Karachi 50 KM G.T Road, Sadhoke District, Gujranwala 18.2 CAPITAL WORK IN PROGRESS Note Rupees Rupees Net book value Rupees Rupees Leasehold land 21,317,504 21,317,504 Factory land 161,484, ,484,005 Factory building 320,534, ,149,028 Plant and machinery 394,565, ,405, ,900, ,356,166 Tang ibles Plant and machinery - 359,064,281 Civil and electric work ,422, ,726 5,422, ,377,007 Annual Report
100 Notes To The Consolidated Financial Statements Notes To The Consolidated Financial Statements 19 INTANGIBLE ASSETS Note Rupees Rupees Cost Opening - 14,710,766 Addition during the year - - Closing - 14,710,766 Amortization Opening - (9,807,178) Charge for the year - (4,903,588) Closing - (14,710,766) Balance as at June Movement in provision for slow moving / obsolete items This includes by product amounting to Rs million (2017: Rs million). Note Rupees Rupees Opening balance 9,626,080 1,662,515 Charge for the year ,618,995 7,963,565 Closing balance 20,245,075 9,626,080 This includes pledged stock of raw material with various banks under long term and short term borrowing arrangements (refer note 10 and 15). 22 TRADE DEBTS 20 STORES, SPARES AND LOOSE TOOLS Stores and spares ,271,197 15,373,483 Provision for slow moving / obsolete items 20.1 (1,543,929) (1,543,929) 18,727,268 13,829, Movement in provision for slow moving / obsolete items Balance at beginning of the year 1,543,929 1,345,492 Charge for the year - 198,437 Write off during the year Balance at end of the year 1,543,929 1,543,929 Considered good Export - secured 535,400, ,448,540 Local - unsecured 174,304, ,888,141 Considered doubtful Local - unsecured 7,464,595 - Less: Provision for doubtful debts 22.4 (7,464,595) - 709,705, ,336, Borrowings are secured by way of charge over book debts of the Group (refer notes 10 and 15). 21 STOCK IN TRADE Raw materials ,180,456,923 4,581,456,782 Packing materials ,650,372 57,209,207 Finished goods ,118, ,451,055 5,159,225,871 5,250,117,044 Provision for slow moving / obsolete items 21.1 (20,245,075) (9,626,080) 5,138,980,796 5,240,490,964 Annual Report
101 Notes To The Consolidated Financial Statements Notes To The Consolidated Financial Statements 22.2 Export trade debts are outstanding against total export sales made to the following countries under documents against acceptance basis: Name of Country Rupees Rupees Australia 1,126,726,619 1,159,075,256 Bangladesh 50,288, ,179,799 Canada 47,440,416 52,320,993 Djibouti 71,603,603 45,332,395 France 240,067, ,867,840 Iraq 49,913,386 10,407,112 Maldives 15,309,277 43,083 Netherland 510,493,815 23,551,040 Poland 13,330,836 - Portugal 236,838,750 52,808,499 Qatar 34,734,109 30,809,007 Russia 222,562,432 93,515,611 South Africa 38,503,715 20,631,637 Spain 45,832, ,292,687 Sweden 35,053,105 30,688,190 Thailand 56,888,338 13,976,693 UAE 333,876, ,674,496 UK 411,646, ,359,450 USA 230,569, ,398,521 Total 3,771,678,279 3,050,932, Provision against doubtful trade debts Note Rupees Rupees Opening balance - - Provision made during the year 7,464,595 - Reversals made during the year - - Closing balance 7,464, SHORT-TERM LOANS AND ADVANCES Loans Staff - unsecured, considered good ,494,263 4,295,915 Advances - against services and others 1,032,798 1,417,957 - against purchases 19,242,652 52,457,717 - to contractors ,962,338-83,732,051 58,171,589 These represent interest free loans to various staff in accordance with the Group's policy. The maximum aggregate amount due from executives at the end of any month during the year was Rs. 117,500 (2017: Nil). It represents the amount provided to contractors for construction purpose. It is adjustable against the services and no collateral security has been obtained against these amount As of June 30, 2018, the age analysis of trade debts is as follows: Not yet due - - Past due: - Up to 3 months 641,195, ,088,959-3 to 6 months 35,416,805 31,247,722-6 to 12 months 3,234, More than 12 months 37,322, ,169, ,336, ,169, ,336, Name of Party A. A. Associates M. Shahid Engineering Works Iqbal Engineering House Huzefa Engineering Rupees 2,723,138 7,042,310 2,533,550 11,092,943 Amreli Steels Ltd. 9,581,346 Izhar Steel Pvt Ltd 9,262,503 Suria Engineering 6,096,133 Rafiq Cement Supplier 7,500,000 Anhui Yongcheng Electronic & Mechanical Technology Co.,Ltd 1,130,415 56,962,338 Annual Report
102 Notes To The Consolidated Financial Statements Notes To The Consolidated Financial Statements 24 Note Rupees Rupees TRADE DEPOSITS AND SHORT TERM PREPAYMENTS Deposits - Capital management account 969, ,766 - Guarantee margin 1,514,650 1,514,650 2,483,790 2,444,416 Prepayments - Prepaid expense ,212,916 3,156,228 - Prepaid insurance 4,037,825 6,390,377 13,734,531 11,991, CASH AND BANK BALANCES 26.1 Note Rupees Rupees Cash in hand 4,507,418 2,225,894 Cash at bank - current accounts 151,070,787 98,410,859 - deposit accounts 373,233,385 13,205,576 - term deposit certificates ,200,000 1,200, ,504, ,816, ,011, ,042,329 These represent term deposit certificates of Habib Bank Limited and Askari Bank Limited amounting to Rs. 297 million and Rs. 1.2 million respectively. The rate of profit on these certificates is between 4.75% to 5.6% per annum (2017: 4.74%). These term deposit certificates will mature within a year This include prepaid expense relating to godown rent and system maintenance charges. 25 OTHER RECEIVABLES Sales tax refundable ,564,331 81,549,201 Receivable from related parties ,784 1,414,322 Unrealized gain on forward foreign exchange contracts - 1,781,640 85,074,116 84,745, Movement in sales tax refundable is as under: Balance at beginning of the year 81,549,201 36,987,289 Refunds claim for the year 43,009,774 62,078,618 Received during the year (38,303,049) (16,008,411) Adjusted during the year (1,691,595) (1,508,295) Balance at end of the year 84,564,331 81,549, SALES - NET Export sales 4,962,570,051 4,058,217,382 Local sales Rice 675,703, ,131,571 By-products 1,302,458,886 1,397,999,621 1,978,162,680 2,129,131,192 6,940,732,731 6,187,348,574 Sales discount / return (56,434,263) (27,251,297) Sales tax (4,695,737) (1,616,931) 6,879,602,731 6,158,480, It includes the amount due from Matco Engineering (Private) Limited and Ghori Trust amounting to Rs. 489,584 and Rs. 20,200 respectively against expenses incurred on behalf of them. Annual Report
103 Notes To The Consolidated Financial Statements Notes To The Consolidated Financial Statements 28 COST OF SALES Rice consumed ,272,820,967 4,529,380,882 Packing materials consumed ,363, ,895,564 Stores and spares consumed ,778,514 25,566,817 Processing expenses Salaries, wages and benefits ,566, ,651,720 Electricity and power 80,287,245 45,621,805 Telephone and mobile 756, ,087 Gas charges 18,777,760 20,900,719 Insurance 10,265,138 10,620,942 Repairs and maintenance 15,821,505 10,272,638 Other purchases 13,847,903 13,328,151 Provision for slow moving stock 10,618,995 7,963,565 Fumigation charges 12,112,924 9,152,139 Water charges 10,796,107 2,035,510 Canteen 5,579,026 6,632,848 Diesel and oil 3,756,116 1,858,919 Staff welfare 2,606,470 4,491,161 Security expenses 12,796,353 12,934,718 Godown expenses 11,119,094 10,498,098 Rent, rates and taxes 427, ,031 Vehicle running expenses 4,698,601 4,525,431 Medical 881, ,448 Depreciation ,803, ,067,763 Inspection charges 17,084,611 9,620,180 Cost of goods manufactured 6,133,564,625 5,250,627,136 Work in process Note Rupees Rupees Opening stock - 8,531,578 Closing stock ,531,578 Cost of goods available for sale - 8,531,578 Note Rupees Rupees 28.1 Rice consumed Opening stock of raw material 4,581,456,782 3,905,595,668 Purchases 4,755,815,804 5,084,003,401 Cartage inwards 116,005, ,238,595 Closing stock of raw material 21 (4,180,456,923) (4,581,456,782) 5,272,820,967 4,529,380, Packing material consumed Opening stock 47,583,127 60,487,050 Purchases 257,185, ,991, ,768, ,478,691 Closing stock-gross 21 (95,650,372) (57,209,207) Provision for slow moving stock 20,245,075 9,626,080 (75,405,297) (47,583,127) 229,363, ,895, Stores and spares consumed Opening stock 13,829,554 15,183,208 Purchases 62,676,228 24,213,163 76,505,782 39,396,371 Closing stock-gross 20 (20,271,197) (15,373,483) Provision for slow moving stock ,543,929 1,543,929 Closing stock-net (18,727,268) (13,829,554) 57,778,514 25,566, It includes provision for gratuity amounting to Rs million (2017: Rs million). Finished goods Opening stock 611,451, ,071,189 Closing stock 21 (883,118,576) (611,451,055) (271,667,521) (80,379,866) 5,861,897,104 5,178,778,848 Annual Report
104 Notes To The Consolidated Financial Statements Notes To The Consolidated Financial Statements 29 DISTRIBUTION EXPENSES Salaries and benefits 45,451,283 50,098,408 Freight 104,744,582 82,599,998 Clearing and forwarding 41,916,228 65,149,018 Travelling 21,758,699 16,706,915 Sales promotion 37,910,407 43,913,968 Provision of doubtful debts 7,464,595 - Insurance 973, ,727 Export charges 29,631,942 20,309,203 Export commission 2,215, ,842 Depreciation ,112,698 6,879,235 Shop rent 1,704,000 1,844,150 General 2,966,982 2,745, ADMINISTRATIVE EXPENSES Note Rupees Rupees 304,850, ,888,742 Salaries and benefits ,604, ,746,508 Office rent 448, ,000 Vehicle running 2,374,769 2,954,223 Entertainment 873, ,275 Printing and stationery 1,078,422 1,553,415 Fee and subscription 8,882,858 8,137,861 Legal and professional 1,349, ,070 Auditor's remuneration ,538,301 2,439,392 Postage and telegrams 1,457,562 1,198,715 General expenses 1,011,055 2,105,198 Newspaper and periodicals 34,985 43,903 Electricity and gas charges 433,872 2,115,208 Taxes, duty and fee 692, ,313 Medical 1,423,357 1,160,716 Insurance 7,116,365 7,305,774 Software maintenance 2,136,036 2,074,335 Computer expenses 2,733,585 4,382,239 Depreciation ,338,093 20,637,705 Amortization - 4,903,588 Lease ijarah rentals 3,386,577 5,000,972 Donations , ,530 Advertisement 122, ,838 Others 5,038, , ,619, ,165, This represents services relating to taxation It includes directors' remuneration amounting to Rs million (2017: Rs million), provision for gratuity amounting to Rs million (2017: Rs million) and provision for employees' end of service benefits amounting to Rs million (2017: million) Auditor's remuneration Donation to a single party does not exceed Rs. 500,000. No director is interested in such donation. 31 FINANCE COST Mark up Note Rupees Rupees Audit fee of unconsolidated accounts 2,484,091 1,880,600 Audit fee of consolidated accounts 100, ,000 Certifications 175,000 88,000 Out of pocket expenses 125, ,500 Other services , ,292 3,538,301 2,439,392 - long term finances 14,419,881 12,755,821 - short term borrowings 218,994, ,910,079 - finance lease 2,612,597 2,058,076 Bank charges and commission 3,978,417 2,400, ,005, ,124,511 Annual Report
105 Notes To The Consolidated Financial Statements Notes To The Consolidated Financial Statements 32 OTHER INCOME From financial assets and liabilities - Profit on bank/short term deposits Note Rupees 9,387,656 Rupees 607,341 - Unrealized profit / (loss) on forward foreign exchange contracts - 1,781,640 From non-financial assets - Amortization of deferred income 362, ,377 - Gain or (loss) on sale of fixed assets 5,220,075 3,552,612 - Scrap sales 2,879, Gain on sale of shares - 2,480,924 - Reversal of WWF - 27,619,736 - Dividend income - 253,000 17,849,819 36,616, EXCHANGE GAIN - NET This represents exchange gain/(loss) incurred on foreign currency denominated trade debts, advances from customers, creditors and bank accounts. Rupees Rupees 34.3 Reconciliation of tax expense Profit before income tax 337,588, ,228,407 Enacted tax rate 30% 31% Tax on accounting profit at applicable tax rate 101,276, ,570,806 Tax effect of: - permanent differences - 21,123,439 - temporary differences 16,887,972 (2,372,833) - applicability of fixed tax rate on certain income (49,625,701) (40,341,617) - applicability of lower tax rate on certain income (1,971,408) (701,666) - change of statutory tax rate 1,012, tax credit (37,759,588) (9,655,706) - demand provided and raised during the year - (716,079) - exempt income - (2,537,002) - others (298,212) (293,722) Tax expense charged on income 29,522,349 73,075, INCOME TAX EXPENSE Current ,829,650 85,319,933 - Deferred (22,307,301) (12,244,313) 34.2 It includes the benefits arising from tax credit of BMR and enlistment. 29,522,349 73,075,620 Current year taxation has been charged on the basis of provisions in Income Tax Ordinance, 2001 and accounted for after taking effect of admissible expenses in normal taxation with proportion of local sales and on final tax regime applicable to the Group based on tax withheld from export proceeds which is deemed as full and final discharge of the tax liability The Group computes tax based on the generally accepted interpretations of the tax laws to ensure that the sufficient provision for the purpose of taxation is available which can be analyzed as follows: 2017 Rupees Rupees Rupees - Provisions 85,319,933 47,636,962 62,104,205 - Assessment 55,386,043 46,920,883 60,901,253 Return of is filed on December , is an assessment order u/s 120 unless amended under section 122 of the Income Tax Ordinance, The case was selected for audit under section 214C of the Income Tax Ordinance, After completion of the audit proceedings, Assistant Commissioner issued the notice u/s 122(5)/(9) of the Ordinance for the amendment of assessment. Response submitted by the representative of the Holding Company. Annual Report
106 Notes To The Consolidated Financial Statements Notes To The Consolidated Financial Statements After completion of audit proceeding, the learned DCIR amended the assessment proceeding and passed the order without adjustment of sales tax refund of Rs. 10,843,699 and charged the WWF of Rs. 6,646,345 and created the demand of Rs. 17,490,045. Against the treatment of learned ADCIR, appeal was filed on , hearing order is pending. Based on merits of the appeals management is confident that these appeals shall be decided in favor of the Holding Company and therefore no provision has been made against the assessment. Return of filed on January , is an assessment order u/s 120 unless amended under section 122 of the Income Tax Ordinance, The Additional Commissioner Inland Revenue initiated the proceeding u/s 122(5A) of the Income Tax Ordinance, 2001 vide notice dated for amendment of deemed assessment. Response submitted by the representative of the Holding Company. Proceeding initiated u/s 122(5A) for amendment by ACIR and issued the notice u/s 122(9). In response thereof, all the requisite information/documents were submitted. However, the ADCIR passed the order and disallowed the Finance Cost. Against the treatment of learned ADCIR, appeal was filed on , hearing heared order is pending. Based on merits of the appeals management is confident that these appeals shall be decided in favor of the Holding Company and therefore no provision has been made against the assessment. Return of filed on January 17, 2018, is an assessment order u/s 120 unless amended under section 122 of the Income Tax Ordinance, The Additional Commissioner Inland Revenue initiated the proceeding u/s 122(5A) of the Income Tax Ordinance, 2001 vide notice dated for amendment of deemed assessment. 35 NUMBER OF EMPLOYEES Number of employees as at June Number of factory employees as at June Related parties include entities under common directorship, directors, major shareholders, key management personnel and retirement benefit funds. Transactions with related parties essentially entail rent expense and transactions with key management personnel. Details of transactions with related parties and the balances with them as at year end other than those which have been disclosed else where are as follows: Nature of relationship Percentage of Holding Transactions / Balance Outstanding Note Rupees Rupees Directors Godown rent paid to director 11,119,094 10,498,098 Common Directors Matco Engineering (Private) Limited 0% Paid against service for Rice Glucose Project - 2,637,026 Paid expenses on behalf 489,584 - Receivable against expenses ,584 - Trust operated by the Group Ghori Trust 0% Donation of funds - 97,850 Expenses incurred on behalf 496,580 - Receivable against expenses 20,200 97,850 Consideration for services is determined with mutual agreement considering the level of services provided. Expenses charged by / to the Group are determined on actual cost basis. Particulars of remuneration of Chief Executive, Directors and Executives are disclosed in note 37 to these financial statements. Key management personnel are those persons having authority and responsibility for planning, directing and controlling the activities of the entity. The Group considers all members of its management team, including the Chief Executive Officer and the Directors to be key management personnel. Average number of employees during the year Average number of factory employees during the year Annual Report
107 Notes To The Consolidated Financial Statements 37 REMUNERATION OF THE CHIEF EXECUTIVE OFFICER, DIRECTORS AND EXECUTIVES For the purpose of disclosure those employees are considered as executives whose basic salary exceed twelve hundred thousands rupees in financial year. Chief Executive Officer Directors Executives Total * * Rupees Short-term employee benefits Managerial remuneration 3,080,000 2,940,000 8,440,000 7,960,000 18,258,400 1,381,245 29,778,400 12,281,245 House rent allowances 1,386,000 1,323,000 3,798,000 3,582,000 8,216, ,560 13,400,280 5,526,560 Utilities 776, ,406 2,756,385 2,715, ,920 69,062 4,445,525 3,715,527 Bonus 385, ,500 1,055, ,000 2,282, ,655 3,722,300 1,535,155 Fuel expense 590, ,488 1,676,968 2,199,146 2,163,500 1,344,600 4,431,024 4,288,234 Medical expense 51,843 65, , , , , , ,728 Vehicle expense 198, , , , , , ,495 1,177,381 Other expense 301, ,664 1,474,968 1,121, ,776,132 1,501,156 6,769,537 7,001,975 19,741,680 19,505,884 32,414,613 3,880,127 58,925,830 30,387,986 Value of motor vehicles 10,508,500 10,508,500 41,553,500 44,401,791 17,394,500 13,518,500 69,456,500 68,428,791 Number of Persons * Comparative figures have been restated to reflect changes in the definition of executive as per Companies Act, In addition to the above, chief executive officer and directors are provided with the use of the Group's vehicles. Certain executives are also provided with Group maintained cars.: The Group considers its Chief Executive and the Executive Director as its key management personnel i.e. the personnel having authority and responsibility for planning, directing and controlling the activities of the Group. 38 PLANT CAPACITY AND PRODUCTION (Tons) (Tons) Annual Plant Capacity - Rice processing 134, ,700 - Rice Glucose 10,000 - Actual Production - Rice processing 47,084 59,223 - Rice Glucose 2,828 - Notes To The Consolidated Financial Statements 39 EARNINGS PER SHARE - BASIC AND DILUTED Rupees Rupees Profit for the year 308,066, ,152,787 Number of ordinary shares 116,572,094 87,429,094 Weighted average number of ordinary shares 98,447,543 98,447,543 Earning per share - basic and diluted There is no dilutive effect on earnings per share as the Group does not have any convertible instruments as at June 30, 2018 and June 30, FINANCIAL RISK MANAGEMENT OBJECTIVES AND POLICIES The Group's activities expose it to a variety of financial risks: market risk (including foreign exchange risk, interest rate risk and price risk), credit risk and liquidity risk. Overall, risks arising from the Group s financial assets and liabilities are limited. The Group manages its exposure to financial risk in following manner: 40.1 Market risk Market risk refers to fluctuation in value of financial instruments as a result of changes in market prices. The Group manages market risk as follows: Foreign currency risk Foreign exchange risk represents the risk that the fair value of future cash flows of a financial instrument will fluctuate because of changes in foreign exchange rates. It arises mainly where receivables, bank balances, borrowings and payables exist due to transactions entered into foreign currencies. Exposure to Foreign currency risk The Group is exposed to foreign exchange risk arising from currency value fluctuations due to the following: Trade debts 4,531,524 3,378,211 Cash and bank balances 19,049 34,031 Borrowings from financial institutions - (327,667) Advance from customer (172,733) (1,844,085) Off balance sheet exposures Amount in USD ,377,840 1,240,490 Forward rate agreements - (7,200,000) Net Exposure 4,377,840 (5,959,510) Annual Report
108 Notes To The Consolidated Financial Statements Notes To The Consolidated Financial Statements The following significant exchange rates were applied during the year Price risk Price risk represents the risk that the fair value of future cash flows of a financial instrument will fluctuate because of changes in market prices (other than those arising from interest or currency rate risk), whether those changes are caused by factors specified to the individual financial instrument or its issuer, or factors affecting all similar financial instruments traded in the market. The Group is not exposed to equity price risk since there are no investments in equity securities Interest/Mark-up rate risk Average rate Reporting date rate Foreign currency sensitivity analysis Rupees Rupee per USD A 10 percentage strengthening of the PKR against the USD at June 30, 2017 would have effect on the equity and profit and loss of the Group as shown below. This analysis assumes that all other variables, in particular interest rates, remain constant. The analysis is performed on the same basis for June 30, Rupees Strengthening of PKR against respective currencies (53,190,757) 62,485,462 Weakening of PKR against respective currencies 53,190,757 (62,485,462) A 10 percentage weakening of the PKR against the USD at June 30, 2018 would have had the equal but opposite effect on USD to the amounts shown above, on the basis that all other variables remain constant. Interest rate risk is the risk that the fair value or future cash flows of the financial instruments will fluctuate because of changes in market interest rates. The Group has long term and short term Rupee at variable rates. The Group is exposed to interest/mark-up rate risk on long and short term financing and these are covered by holding "Prepayment Option" and "Rollover Option". Interest rate risk on short term borrowings is covered by holding "Prepayment Option" which can be exercised upon any adverse movement in the underlying interest rates. The local and foreign currency loans carry mark up at the prevailing rate of SBP plus 0.75% to 2%, KIBOR plus 1% to 2% and LIBOR plus 1.25% respectively. Applicable interest rates for financial assets and liabilities are given in respective notes Mark-up / profit bearing Non mark-up / Total Less than One year to profit bearing Over five years one year Five years Note Rupees Financial assets Loans and receivables Trade debts - considered goods ,705, ,705,319 Short term loans and advances ,494,263 6,494,263 Deposits ,483,790 2,483,790 Short term investment , ,000 Other receivables ,074,116 85,074,116 Cash and bank balances ,433, ,070, ,504, ,433, ,328,275 1,626,761,659 Financial liabilities At amortized cost Long term finances - secured 10 84,029, ,556, ,586,610 Trade and other payables ,887, ,887,737 Accrued mark-up ,767,428 48,767,428 Short term borrowings 15 4,081,779, ,081,779,753 Liabilities against assets subject to finance 11 12,226,289 29,284, ,510,709 4,178,035, ,841, ,655,165 4,695,532,237 On balance sheet gap (3,506,602,363) (275,841,324) - 713,673,110 (3,068,770,578) Off balance sheet items Guarantees Commitments ,548, ,548,541 Financial assets 2017 Mark-up / profit bearing Non mark-up / Total Less than One year to profit bearing Over five years one year Five years Rupees Loans and receivables Trade debts - considered goods ,336, ,336,681 Short term loans and advances ,295,915 4,295,915 Deposits ,444,416 2,444,416 Short term investment , ,000 Other receivables ,963,523 82,963,523 Cash and bank balances 26 14,405, ,410, ,816,435 14,405, ,951, ,356,970 Financial liabilities At amortized cost Long term finances - secured 10 96,733, ,791, ,525,111 Trade and other payables ,641, ,641,270 Accrued mark-up ,056,163 46,056,163 Short term borrowings 15 3,908,367, ,908,367,977 Liabilities against assets subject to finance 11 7,999,276 16,132,846 1,029,495-25,161,617 4,013,100, ,924,710 1,029, ,697,433 4,716,752,138 On balance sheet gap (3,998,694,924) (338,924,710) (1,029,495) 418,253,961 (3,920,395,168) Off balance sheet items Guarantees ,246,460 18,246,460 Commitments ,124, ,124,947 Annual Report
109 Notes To The Consolidated Financial Statements Notes To The Consolidated Financial Statements (a) (b) 40.2 On balance sheet gap represents the net amounts of balance sheet items. Effective rates of return/mark-up on financial liabilities are as follows: Financial liabilities Long term finances - secured Short term borrowings SBP rate + 1% to 2% and KIBOR + 1% to 2% SBP rate+ 0.75% to 2% & LIBOR % SBP rate + 1% to 2% and KIBOR + 1% to 2% SBP rate+ 0.75% to 2% & LIBOR % Fair value sensitivity analysis for fixed rate instruments The Group does not account for any fixed rate financial assets and liabilities at fair value through profit or loss. Therefore, a change in interest rate at the balance sheet would not affect profit or loss of the Group. Cash flow sensitivity analysis for variable rate instruments At June 30, 2018, if interest rates on long term financing had been 1% higher / lower with all other variables held constant, pre tax profit for the year would have been Rs million (2017: Rs million) higher / lower, mainly as a result of higher / lower interest expense on floating rate borrowings. At June 30, 2018, if interest rates on short term borrowings had been 1% higher / lower with all other variables held constant, pre tax profit for the year would have been Rs million (2017: Rs million) higher / lower, mainly as a result of higher / lower interest expense on floating rate borrowings. Credit risk Credit risk represents the accounting loss that would be recognized at the reporting date if counter parties failed to perform as contracted. The Group manages credit risk interalia by settng out credit limits in relation to individual customers and/or by obtaining advance against sales and/or through letter of credits and/or by providing for doubtful debts. Also the Group does not have significant exposure in relation to individual customer. Consequently, the Group believes that it is not exposed to any major concentration of credit risk. The Group is exposed to credit risk from its operating and certain investing activities and the Group's credit risk exposures are categorized under the following headings: Trade debts Trade debts are essentially due from local and foreign companies and the Group does not expect that these companies will fail to meet their obligations. The Group establishes an allowance for the doubtful trade debts that represent its estimate of incurred losses in respect of trade debts. The allowance is based on the management assessment of a specific loss component that relates to individually significant exposures. Bank balances The Group limits its exposure to credit risk by investing in liquid securities and maintaining bank accounts only with counter-parties that have stable credit rating. Given these high credit ratings, management does not expect that any counter party will fail to meet their obligations. The bank balances along with the credit ratings are tabulated below: Short- Rupees Rupees MCB Bank Limited A1+ 82,886,771 30,048,689 Meezan Bank Limited A1+ 4,188,053 3,966,002 National Bank of Pakistan A1+ 9,757,001 9,332,864 NIB Bank Limited A1+ 16, ,258 Standard Chartered Bank Limited A1+ 1,356,880 2,089,584 United Bank Limited A1+ 17,144 7,791,673 Allied Bank Limited A1+ 3,434,051 14,701,788 Askari Bank Limited A1+ 47,979,695 1,630,073 Bank Alfalah Limited A1+ 6,967,395 7,115,062 Faysal Bank Limited A1+ 3,824,654 3,411,343 Habib Bank Limited A1+ 5,331,923 7,170,595 Habib Metropolitan Bank Limited A1+ 5,572,363 20,801,126 Soneri Bank Limited A1+ 229,534 1,988,909 Bank Islami Pakistan Limited A1-20,296 Dubai Islamic Bank Pakistan Limited A Bank Al Habib Limited A1+ 3,245,232 2,530,882 JS Bank A1+ 23,247 - MCB Islamic Bank A1 349,473,757 - term Ratings 524,304, ,816,435 Annual Report
110 Notes To The Consolidated Financial Statements Exposure to credit risk The carrying amount of financial assets represents the maximum credit exposure. The maximum exposure to credit risk at the reporting date was: 40.3 Liquidity risk Liquidity risk reflects the Group's inability in raising funds to meet commitments. Prudent liquidity risk management implies maintaining sufficient cash and marketable securities, the availability of funding to an adequate amount of committed credit facilities and the ability to close out market positions due to the dynamic nature of the business. At June 30, 2018, the Group has Rs. 4,745.8 million (2017: Rs. 4,932.5 million) available borrowing limit from financial institutions. Unutilized borrowing facilities of Rs million (2017: Rs million) being balances at banks. Based on the above, management believes the liquidity risk is insignificant Fair value of financial instruments Note Rupees Rupees Trade debts ,705, ,336,681 Loans and advances 21 6,494,263 4,295,915 Bank balances ,504, ,816,435 1,538,703, ,449,031 Fair value is an amount for which an asset could be exchanged, or a liability settled, between knowledgeable willing par ties in an arm's length transaction. Consequently, differences may arise between the carrying values and the fair value estimates. The Group classifies fair value measurements using a fair value hierarchy that reflects the significance of the inputs used in making the measurements. The fair value hierarchy has the: a) Quoted prices (unadjusted) in active markets for identical assets or liabilities (level 1). b) Inputs other than quoted prices included within level 1 that are observable for the asset or liability, either directly (that is, as prices) or indirectly (that is, derived from prices) (level 2). c) Inputs for the asset or liability that are not based on observable market data (that is, unobservable inputs) (level 3). The Group recognizes transfers between levels of the fair value hierarchy at the end of the reporting period during which the transfer has occurred. The Group s policy for determining when transfers between levels in the hierarchy have occurred includes monitoring of the following factors: Notes To The Consolidated Financial Statements There were no transfers between level 1, 2 or 3 of the fair value hierarchy during the year. The valuation techniques used are as follows: Level 1: Quoted prices (unadjusted) in active markets The fair value of financial instruments traded in active markets is based on market value of shares at the reporting date. A market is regarded as active when it is a market in which transactions for the asset or liability take place with sufficient frequency and volume to provide pricing information on an ongoing basis. The following table analysis within the fair value hierarchy of the Group s financial assets (by class) measured at fair value at June 30, 2018: Financial assets Level 1 Level 2 Level 3 Total Financial investments: Held for trading 41 CAPITAL MANAGEMENT OBJECTIVES, POLICIES AND PROCEDURES 500, ,000 Financial assets Level 1 Level 2 Level 3 Total Financial investments: Held for trading Rupees , ,000 The objective of the Group when managing capital is to safeguard its ability to continue as a going concern so that it can continue to provide returns for shareholders and benefits for other stakeholders and to maintain a strong capital base to support the sustained development of its businesses. The Group manages its capital structure by monitoring return on net assets and makes adjustments to it in the light of changes in economic conditions. In order to maintain or adjust the capital structure, the Group may adjust the amount of dividend paid to the shareholders or issue shares or sell assets to reduce debt. The Group manages its capital risk by monitoring its debt levels and liquid assets and keeping in view future investments requirements and expectations of the shareholders. Debt is calculated as total borrowings (short term borrowings, long term finances and current portion of long term finances as shown in the balance sheet). Capital signifies equity as reported in balance sheet and includes share capital, share premium and accumulated profits / (losses) Rupees changes in market and trading activity (e.g.. significant increases / decreases in activity) - changes in inputs used in valuation techniques (e.g. inputs becoming / ceasing to be observable in the market) Annual Report
111 Notes To The Consolidated Financial Statements During 2018, the Group's strategy was to maintain leveraged gearing. The gearing ratios as at June 30, 2018 and 2017 were as follows: Note Rupees Rupees (Restated) Total borrowings 4,453,877,072 4,353,054,705 Less: Cash and bank 26 (827,011,590) (115,042,329) Net debt 3,626,865,482 4,238,012,376 Total equity 4,145,103,343 3,154,309,657 Total equity and debt 7,771,968,825 7,392,322,033 Gearing ratio (%) 47% 57% Notes To The Consolidated Financial Statements 43.1 The amount has given to contractor and engineers for the purpose of development of rice glucose plant. 44 DATE OF AUTHORISATION FOR ISSUE These financial statements have been approved by the Board of Directors of the Group and authorized for issue on September 6, Non-adjusting events after the statement of financial position date The Board of Directors in its meeting held on September 6, 2018 has proposed cash dividend of Rs. 0.4 per share i.e. 4% (2017: Nil per share) and 5 bonus shares on every 100 ordinary shares i.e. 5%. This is in addition to the interim cash dividend of Rs. 0.3 (2017: Nil) per share. The dividend and transfer are subject to the approval of members at the annual general meeting. The effect of such dividend and transfer shall be accounted for in the financial statements for the year ending June 30, GENERAL Figures have been rounded off to the nearest rupee. The Group finances its operations through equity, borrowings and management of working capital with a view to maintain an appropriate mix amongst various sources of finance to minimize risk. 42 OPERATING SEGMENTS These financial statements have been prepared on the basis of a single reportable segment Revenue from sale of rice represents 98.7% (2017: 99.6%) of the total revenue of the Group All non-current assets of the Group as at June 30, 2018 are located in Pakistan. Further, debtors from rice represents 98% (2017: 100%) of the total debtors. 43 UTILIZATION OF PROCEEDS FROM INITIAL PUBLIC OFFERING During the year, the Group has issued its shares to general public through IPO to finance the project of expansion of its Rice Glucose / Syrup and Rice Protein plant from IPO proceeds as disclosed in note 7. Refer of the Prospectus issued for the Project detail. As at June 30, 2018, the utilization of proceeds from IPO is as follows: Note 2018 Rupees Proceeds from IPO 757,718,000 IPO related expenses (45,300,364) Deposited with HBL against LCs 26.1 (297,000,000) Expenses incurred to date 18.2 (5,422,378) Advances to contractors 43.1 (60,521,501) Cash at bank 349,473,757 Chief Executive Officer Chief Financial Officer Director Annual Report

112
113

114
115
116

117
118
119
120
121

122

123
AUDITORS REPORT TO THE MEMBERS OF FEROZSONS LABORATORIES LIMITED
 AUDITORS REPORT TO THE MEMBERS OF FEROZSONS LABORATORIES LIMITED We have audited the annexed consolidated financial statements comprising consolidated balance sheet of Ferozsons Laboratories Limited (
MUGHAL IRON & STEEL INDUSTRIES LIMITED FINANCIAL STATEMENTS. for the year ended June 30, Annual Report for the year ended June 30, 2015 /
 MUGHAL IRON & STEEL INDUSTRIES LIMITED FINANCIAL STATEMENTS for the year ended June 30, 2015 Annual Report for the year ended June 30, 2015 / 69 GLOBAL PRESENCE LOCAL EXCELLENCE FAZAL MAHMOOD & COMPANY
Annual Report for the year ended June 30, 2014 FINANCIAL STATEMENTS
 Annual Report FINANCIAL STATEMENTS 33 34 Mughal Iron & Steel Industries Limited Annual Report 35 AUDITORS REPORT TO THE MEMBERS We have audited the annexed balance sheet of MUGHAL IRON & STEEL INDUSTRIES
ANJUM TEXTILE MILLS (PVT.) LTD. BALANCE SHEET AS AT JUNE 30, 2012
 LTD. BALANCE SHEET AS AT JUNE 30, 2012") ANJUM TEXTILE MILLS (PVT.) LTD. BALANCE SHEET AS AT JUNE 30, 2012 2012 2011 2012 2011 NOTE RUPEES RUPEES NOTE RUPEES RUPEES EQUITY & LIABILITIES SHARE CAPITAL AND RESERVES ASSETS NON CURRENT ASSETS SHARE
ANJUM TEXTILE MILLS (PVT.) LTD. BALANCE SHEET AS AT JUNE 30, 2012 2012 2011 2012 2011 NOTE RUPEES RUPEES NOTE RUPEES RUPEES EQUITY & LIABILITIES SHARE CAPITAL AND RESERVES ASSETS NON CURRENT ASSETS SHARE
ANJUM TEXTILE MILLS (PVT) LTD. BALANCE SHEET AS AT JUNE 30, 2014
 LTD. BALANCE SHEET AS AT JUNE 30, 2014") ANJUM TEXTILE MILLS (PVT) LTD. BALANCE SHEET JUNE 30, 2014 2014 2013 2014 2013 NOTE RUPEES RUPEES NOTE RUPEES RUPEES EQUITY & LIABILITIES SHARE CAPITAL AND RESERVES ASSETS NON CURRENT ASSETS SHARE CAPITAL
ANJUM TEXTILE MILLS (PVT) LTD. BALANCE SHEET JUNE 30, 2014 2014 2013 2014 2013 NOTE RUPEES RUPEES NOTE RUPEES RUPEES EQUITY & LIABILITIES SHARE CAPITAL AND RESERVES ASSETS NON CURRENT ASSETS SHARE CAPITAL
 Statement of Financial Position As at September 30, 2018 September 30 September 30 September 30 2018 2017 2016... Restated... ASSETS Notes... (Rupees in '000)... NON-CURRENT ASSETS Property, plant and
Financial Report 2016 EXCELLENCE THROUGH GROWTH
 Financial Report 2016 EXCELLENCE THROUGH GROWTH CONTENTS 01 02 04 Auditors Report to the Members Balance Sheet Profit and Loss Account 05 06 07 Statement of Comprehensive Income Cash Flow Statement Water
FINANCIAL STATEMENTS FOR THE YEAR ENDED DECEMBER 31, 2013 ANNUAL REPORT 13
 FINANCIAL STATEMENTS 41 ANNUAL REPORT 13 AUDITORS REPORT TO THE MEMBERS We have audited the annexed statement of financial position of Pakistan Telecommunication Company Limited (the Company) as at December
ROSHAN PACKAGES (PRIVATE) LIMITED
 LIMITED") ROSHAN PACKAGES (PRIVATE) LIMITED FINANCIAL STATEMENTS FOR THE YEAR ENDED JUNE 30, 2016 AUDITORS' REPORT TO THE MEMBERS We have audited the annexed balance sheet of Roshan Packages (Private) Limited ('the
ROSHAN PACKAGES (PRIVATE) LIMITED FINANCIAL STATEMENTS FOR THE YEAR ENDED JUNE 30, 2016 AUDITORS' REPORT TO THE MEMBERS We have audited the annexed balance sheet of Roshan Packages (Private) Limited ('the
MCB Bank Limited Financial Statements For the year ended December 31, 2012
 MCB Bank Limited Financial Statements For the year ended December 31, 2012 MCB BANK LIMITED STATEMENT OF FINANCIAL POSITION AS AT DECEMBER 31, 2012 ASSETS Note 2012 2011 Cash and balances with treasury
UNCONSOLIDATED FINANCIAL STATEMENTS FOR THE YEAR ENDED DECEMBER 31, 2016.
 UNCONSOLIDATED FINANCIAL STATEMENTS FOR THE YEAR ENDED DECEMBER 31, 2016. UNCONSOLIDATED STATEMENT OF FINANCIAL POSITION AS AT DECEMBER 31, 2016 ASSETS Note 2016 2015 Cash and balances with treasury banks
TO THE MEMBERS AUDITORS REPORT
 61 62 AUDITORS REPORT TO THE MEMBERS We have audited the annexed statement of financial position of Pakistan Telecommunication Company Limited (the Company) as at December 31, 2016 and the related statement
Reliance Weaving Mills Limited Balance Sheet As at 30 June 2010
 Reliance Weaving Mills Limited Balance Sheet As at 30 June 2010 EQUITY AND LIABILITIES Note 2010 2009 Note 2010 2009 ASSETS Share capital and reserves Non-current assets Authorized capital Property, plant
Gazipura Securities & Services (Private) Ltd Financial Statements For the year ended June 30, 2017
 Ltd Financial Statements For the year ended June 30, 2017") Gazipura Securities & Services (Private) Ltd Financial Statements For the year ended June 30, 2017 Financial Statements Contents Page No. Directors' Report 1 Auditor's Report 2-3 Balance Sheet 4 Profit
Gazipura Securities & Services (Private) Ltd Financial Statements For the year ended June 30, 2017 Financial Statements Contents Page No. Directors' Report 1 Auditor's Report 2-3 Balance Sheet 4 Profit
MCB Bank Limited Financial Statements For the year ended December 31, 2017
 MCB Bank Limited Financial Statements For the year ended December 31, 2017 MCB BANK LIMITED UNCONSOLIDATED STATEMENT OF FINANCIAL POSITION AS AT DECEMBER 31, 2017 Note 2017 2016 ASSETS Cash and balances
Consolidated Balance Sheet As at 30 June 2010
 Consolidated Balance Sheet As at 30 June 2010 Crescent Steel & Allied Products Ltd. Note EQUITY AND LIABILITIES Share capital and reserves Authorized capital 100,000,000 ordinary shares of Rs. 10 each
Bank AL Habib Limited
 Consolidated Financial Statements Bank AL Habib Limited and Subsidiary Companies 89 Bank AL Habib Limited and its Subsidiary Companies Directors Report on Audited Consolidated Financial Statements The
HIGHNOON LABORATORIES LIMITED. Q2 Report HIGHNOON FOR A HEALTHIER NATION
 HIGHNOON LABORATORIES LIMITED Q2 Report www.highnoonlabs.com HIGHNOON FOR A HEALTHIER NATION Contents Vision, Mission & Corporate Objectives Company Information Directors Report Condensed Interim Unconsolidated
Contents. Condensed Interim Unconsolidated Financial Information
 Nine Months Ended Contents Corporate 02 Company Information 03 Directors' Review 04 Condensed Interim Unconsolidated Financial Information 06 Condensed Interim Unconsolidated Statement of Financial Position
Auditors Report to the Members
 Auditors Report to the Members We have audited the annexed unconsolidated balance sheet of Habib Bank Limited as at December 31, 2008 and the related unconsolidated profit and loss account, unconsolidated
Crescent Steel and Allied Products Limited Unconsolidated Financial Statements For the year ended 30 June 2014
 Crescent Steel and Allied Products Limited Unconsolidated Financial Statements Financial Statements of this Annual Report are printed on 100% recycled paper. REVIEW REPORT TO THE MEMBERS on Statement of
Auditors Report to the Members
 Auditors Report to the Members We have audited the annexed consolidated financial statements comprising consolidated balance sheet of Azgard Nine Limited ("the Company") and its subsidiaries (hereinafter
AUDITORS REPORT TO THE MEMBERS
 CONSOLIDATED ACCOUNTS 113 AUDITORS REPORT TO THE MEMBERS FOR THE YEAR ENDED 31 DECEMBER 2012 We have audited the annexed consolidated financial statements comprising consolidated statement of financial
CONTINGENCIES AND COMMITMENTS 24. The annexed notes 1 to 48 and Annexures I to IV form an integral part of these financial statements.
 FAYSAL BANK LIMITED STATEMENT OF FINANCIAL POSITION AS AT DECEMBER 31, 2014 Note 2014 2013 -------------- Rupees '000 ------------- ASSETS Cash and balances with treasury banks 8 20,285,851 28,422,497
AUDITORS REPORT TO THE MEMBERS
 AUDITORS REPORT TO THE MEMBERS We have audited the annexed balance sheet of Clover Pakistan Limited (the Company) as at June 30, 2007 and the related profit and loss account, cash flow statement and statement
Chief Executive. March 7, Annual Report 2007 Azgard 9 21
 Statement of Compliance with Best Practices of Code of Corporate Governance for the Year Ended December 31, 2007 AZGARD-9 This statement is being presented to comply with the Code of Corporate Governance
AUDITORS REPORT TO THE MEMBERS OF FEROZSONS LABORATORIES LIMITED
 Consolidated Financial Statements for the Year Ended June 30, 2009 61 AUDITORS REPORT TO THE MEMBERS OF FEROZSONS LABORATORIES LIMITED We have audited the annexed consolidated financial statements comprising
Auditors Report to the Members
 Auditors Report to the Members We have audited the annexed consolidated financial statements comprising consolidated statement of financial position of Habib Bank Limited as at December 31, 2010 and the
NON - CURRENT LIABILITIES
 BALANCE SHEET AS AT DECEMBER 31, 2011 Note Note EQUITY AND LIABILITIES ASSETS EQUITY NON - CURRENT ASSETS Share capital 4 8,481,588 6,785,271 Property, plant and equipment 14 17,050,951 15,933,588 Capital
UNCONSOLIDATED FINANCIAL STATEMENTS
 Crescent Steel and Allied Products Limited UNCONSOLIDATED FINANCIAL STATEMENTS FOR THE YEAR ENDED 30 JUNE 2016 Financial Statements of this Annual Report are printed on 100% recycled paper. REVIEW REPORT
Presentation of Financial Statements
 Presentation of Financial Statements Disclosure Requirements as per The Companies Ordinance, 1984 TABANI'S SCHOOL OF ACCOUNTANCY Presented by : Mr. Sharif Tabani 2005 Balance Sheet Note 2005 2004 SHARE
Balance Sheet As at June 30, 2016
 Balance Sheet As at June 30, 2016 ASSETS NON CURRENT ASSETS Property, plant and equipment Long term investment Long term deposits CURRENT ASSETS 6 7 8 716,566 1,144,006 6,234 1,866,806 616,118 1,028,320
Auditors Report to the Members
 Auditors Report to the Members We have audited the annexed balance sheet of Shakarganj Mills Limited as at September 30, 2010 and the related profit and loss account, statement of comprehensive income,
CONDENSED INTERIM UNCONSOLIDATED FINANCIAL STATEMENTS. For the nine months ended September 30, 2018
 CONDENSED INTERIM UNCONSOLIDATED FINANCIAL STATEMENTS For the nine months ended September 30, 2018 HABIB BANK LIMITED CONDENSED INTERIM UNCONSOLIDATED STATEMENT OF FINANCIAL POSITION AS AT SEPTEMBER 30,
Note (Restated) ASSETS (Restated)
 ASSETS (Restated)") HABIB BANK LIMITED CONSOLIDATED STATEMENT OF FINANCIAL POSITION AS AT DECEMBER 31, 2013 2013 2012 Note 2013 2012 (US $ in '000) (Rupees in '000) (Restated) ASSETS (Restated) 1,286,278 1,492,809 Cash and
HABIB BANK LIMITED CONSOLIDATED STATEMENT OF FINANCIAL POSITION AS AT DECEMBER 31, 2013 2013 2012 Note 2013 2012 (US $ in '000) (Rupees in '000) (Restated) ASSETS (Restated) 1,286,278 1,492,809 Cash and
CONDENSED INTERIM CONSOLIDATED FINANCIAL STATEMENTS. For the nine months ended September 30, 2018
 CONDENSED INTERIM CONSOLIDATED FINANCIAL STATEMENTS For the nine months ended HABIB BANK LIMITED CONDENSED INTERIM CONSOLIDATED STATEMENT OF FINANCIAL POSITION AS AT SEPTEMBER 30, 2018 ASSETS (Unaudited)
OIL AND GAS DEVELOPMENT COMPANY LIMITED BALANCE SHEET AS AT 30 JUNE 2016
 BALANCE SHEET AS AT 30 JUNE 2016 Note------------(Rupees '000)----------- Note ------------(Rupees '000)----------- SHARE CAPITAL AND RESERVES NON CURRENT ASSETS Fixed assets Share capital 4 43,009,284
 Consolidated Condensed Interim Balance Sheet As At Note Unaudited Audited 30, June 30, 2018 2018 Rupees in '000 ASSETS Noncurrent assets Property, plant and equipment Long term deposits Total noncurrent
Financial Information. Shaukat Khanum Memorial Trust
 2010 ANNUAL REPORT Financial Information Shaukat Khanum Memorial Trust HONORARY AUDITORS REPORT TO THE BOARD OF GOVERNORS We have audited the annexed balance sheet of Shaukat Khanum Memorial Trust ( the
Notes to and Forming Part of the consolidated Financial Statements For the year ended June 30, 2017
 Notes to and Forming Part of the consolidated Financial Statements For the year ended June 30, 2017 1. LEGAL STATUS AND OPERATIONS Attock Refinery Limited (ARL) was incorporated in Pakistan on November
Bank AL Habib Limited
 Consolidated Financial Statements Bank AL Habib Limited and Subsidiary Companies 90 Bank AL Habib Limited and its Subsidiary Companies Directors Report on Audited Consolidated Financial Statements The
Consolidated Balance Sheet as at June 30, 2016
 Consolidated Balance Sheet as at June 30, 2016 Rupees 000 ASSETS NON CURRENT ASSETS Property, plant and equipment Long term deposits CURRENT ASSETS 7 8 1,524,134 13,018 1,537,152 1,315,911 13,018 1,328,929
Notes to the Financial Statements for the year ended March 31, Legal status and nature of business The company is a public limited company inc
 Notes to the Financial Statements for the year ended March 31, 2007 1. Legal status and nature of business The company is a public limited company incorporated in Pakistan on November 4, 1992 and is listed
OIL AND GAS DEVELOPMENT COMPANY LIMITED BALANCE SHEET AS AT 30 JUNE 2013
 BALANCE SHEET AS AT 30 JUNE 2013 Note Note SHARE CAPITAL AND RESERVES NON CURRENT ASSETS Fixed assets Share capital 4 43,009,284 43,009,284 Property, plant and equipment 12 52,605,226 40,966,441 Development
ALBARAKA BANK (PAKISTAN) LIMITED STATEMENT OF FINANCIAL POSITION AS AT 31 DECEMBER 2011
 LIMITED STATEMENT OF FINANCIAL POSITION AS AT 31 DECEMBER 2011") STATEMENT OF FINANCIAL POSITION AS AT 31 DECEMBER 2011 Note 2011 2010 ----------(Rupees '000)---------- 6 Restated ASSETS Cash and balances with treasury banks 7 3,945,481 4,460,257 Balances with other
STATEMENT OF FINANCIAL POSITION AS AT 31 DECEMBER 2011 Note 2011 2010 ----------(Rupees '000)---------- 6 Restated ASSETS Cash and balances with treasury banks 7 3,945,481 4,460,257 Balances with other
Home Remittances NBP. Home Remittance Services. NBP Foree Cash
 NBP Home Remittances Home Remittance Services Free of Charge remittance services NBP Foree Remittance services available in all over 1280 branches across Pakistan One of the largest overseas correspondent
 Unconsolidated Balance Sheet As at December 31, 2009 2009 2008 Note 2009 2008 (US $ in '000) ASSETS 944,037 669,021 Cash and balances with treasury banks 5 79,527,191 56,359,367 350,899 388,411 Balances
Notes to the Financial Statements for the year ended March 31, 2009
 s to the Financial Statements for the year ended March 31, 2009 1. Legal status and nature of business The company is a public limited company incorporated in Pakistan on November 4, 1992 and is listed
Financial Statements 2016
 Financial Statements 2016 TREET GROUP OF COMPANIES Treet Corporation Limited CONTENTS Consolidated Financial Statements Financial Statements Society for Cultural Education 02 Auditors Report to the Members
GCS HOLDINGS, INC. AND SUBSIDIARY
 GCS HOLDINGS, INC. AND SUBSIDIARY CONSOLIDATED FINANCIAL STATEMENTS AND REVIEW REPORT OF INDEPENDENT ACCOUNTANTS JUNE 30, 2013 AND REVIEW REPORT OF INDEPENDENT ACCOUNTANTS To the Board of Directors and
MCB Bank Limited Financial Statements For the year ended December 31, 2014
 MCB Bank Limited Financial Statements For the year ended December 31, 2014 MCB BANK LIMITED UNCONSOLIDATED STATEMENT OF FINANCIAL POSITION AS AT DECEMBER 31, 2014 Note 2014 2013 ASSETS (Rupees in thousand)
MCB Bank Limited Un-consolidated Condensed Interim Financial Information for the nine months period ended September 30, 2016
 MCB Bank Limited Un-consolidated Condensed Interim Financial Information for the nine months period 30, 2016 MCB Bank Limited Unconsolidated Condensed Interim Statement of Financial Position As at 30,
Habib Metropolitan Bank (Subsidiary of Habib Bank AG Zurich)
") Habib Metropolitan Bank (Subsidiary of Habib Bank AG Zurich) CONSOLIDATED ACCOUNTS 68 AUDITORS REPORT TO THE MEMBERS We have audited the annexed consolidated financial statements comprising consolidated
Habib Metropolitan Bank (Subsidiary of Habib Bank AG Zurich) CONSOLIDATED ACCOUNTS 68 AUDITORS REPORT TO THE MEMBERS We have audited the annexed consolidated financial statements comprising consolidated
Chairman s Review
 Chairman s Review Balance Sheet as at June 30, 2009 Note EQUITY AND LIABILITIES CAPITAL AND RESERVES Authorised capital 3,600,000,000 (2008: 3,600,000,000) ordinary shares of Rs 10 each 36,000,000
Balance Sheet. agriauto. As at June 30, Note. Fahim Kapadia Chief Executive. Yutaka Arae Chairman. Aqeel Loon Chief Financial Officer
 Balance Sheet As at June 30, 2017 ASSETS NON CURRENT ASSETS Rupees 000 Property, plant and equipment Long term investment Long term deposits CURRENT ASSETS 6 7 8 654,025 1,144,006 6,234 1,804,265 716,566
Consolidated Financial Statements and Independent Auditor s Report
 Consolidated Financial Statements and Independent Auditor s Report For the year ended 31 March, 2018 Daiichi Sankyo Company, Limited Contents Page 1) Consolidated Statement of Financial Position 1 2) Consolidated
Financial Statements for the Quarter ended March 31, 2018
 Financial Statements for the Quarter ended MERIT PACKAGING LIMITED MARCH Contents Corporate Information Directors' Review Condensed Interim Balance Sheet Condensed Interim Profit & Loss Account Condensed
Auditors Report to the Members
 Auditors Report to the Members We have audited the annexed unconsolidated statement of financial position of Habib Bank Limited as at December 31, 2010 and the related unconsolidated profit and loss account,
Consolidated Financial Statements and Independent Auditor s Report
 Consolidated Financial Statements and Independent Auditor s Report For the year ended 31 March, 2017 Daiichi Sankyo Company, Limited Contents Page 1) Consolidated Statement of Financial Position 1 2) Consolidated
ICI Pakistan Limited Condensed Interim Unconsolidated Balance Sheet As at December 31, 2016
 Condensed Interim Unconsolidated Balance Sheet As at Note June 30, (Audited) ASSETS Non-current assets Property, plant and equipment 4 17,201,095 17,040,334 Intangible assets 5 13,694 16,460 17,214,789
POYA INTERNATIONAL CO., LTD.
 POYA INTERNATIONAL CO., LTD. FINANCIAL STATEMENTS AND REVIEW REPORT OF INDEPENDENT ACCOUNTANTS JUNE 30, 2018 AND 2017 ------------------------------------------------------------------------------------------------------------------------------------
(Continued) ~3~ March 31, 2017 December 31, 2016 March 31, 2016 Assets Notes AMOUNT % AMOUNT % AMOUNT % Current assets
 ~3~ March 31, 2017 December 31, 2016 March 31, 2016 Assets Notes AMOUNT % AMOUNT % AMOUNT % Current assets") Current assets DAVICOM SEMICONDUCTOR, INC. AND SUBSIDIARIES CONSOLIDATED BALANCE SHEETS (Expressed in thousands of New Taiwan dollars) (The consolidated balance sheets as of March 31,2017 and 2016 are
Current assets DAVICOM SEMICONDUCTOR, INC. AND SUBSIDIARIES CONSOLIDATED BALANCE SHEETS (Expressed in thousands of New Taiwan dollars) (The consolidated balance sheets as of March 31,2017 and 2016 are
NOTES TO THE FINANCIAL STATEMENTS FOR THE YEAR ENDED JUNE 30, 2018
 NOTES TO THE FINANCIAL STATEMENTS FOR THE YEAR ENDED JUNE 30, 1 LEGAL STATUS AND NATURE OF BUSINESS Dost Steels Limited (the Company) was incorporated & domiciled in Pakistan on March 19, 2004 as a private
Financial Section Annual R eport 2018 Year ended March 31, 2018
 Financial Section Annual R eport 2018 Year ended March 31, 2018 Consolidated Financial Statements, Notes to the Consolidated Financial Statements and Independent Auditors' Report Consolidated Financial
 Auditors Report to the Members We have audited the annexed balance sheet of Lotte Chemical Pakistan Limited [formerly Lotte Pakistan PTA Limited] as at 31 December 2013 and the related profit and loss
 Auditors Report to the Members We have audited the annexed balance sheet of Lotte Chemical Pakistan Limited [formerly Lotte Pakistan PTA Limited] as at 31 December 2013 and the related profit and loss
Independent Auditor s report to the members of Standard Chartered PLC
 Financial statements and notes Independent Auditor s report to the members of Standard Chartered PLC For the year ended 31 December We have audited the financial statements of the Group (Standard Chartered
ZTBL UNCONSOLIDATED FINANCIAL STATEMENTS
 UNCONSOLIDATED FINANCIAL STATEMENTS BDO Ebrahim & Co. Chartered Accountants 3 rd Floor, Saeed Plaza 22-East Blue Area Islamabad -44000 Pakistan Riaz Ahmad & Company Chartered Accountants 2-A, ATS Centre,
 Industrial and Commercial Bank of China Limited - Pakistan Branches Notes to the Financial Statements For the year ended December 31, 2013 1. STATUS AND NATURE OF BUSINESS The Pakistan branches of Industrial
Notes to the Accounts
 Notes to the Accounts 1. Accounting Policies Statement of compliance The Group financial statements consolidate those of the Company and its subsidiaries (together referred to as the Group ), equity account
FINANCIAL INFORMATION
 Nine Months Report NOON PAKISTAN LIMITED FINANCIAL INFORMATION FOR THE NINE MONTHS AND QUARTER ENDED 31 MARCH, 215 Page # Corporate Information s Report Balance Sheet Profit & Loss Account Comprehensive
ChipMOS TECHNOLOGIES INC. AND SUBSIDIARIES
 ChipMOS TECHNOLOGIES INC. AND SUBSIDIARIES CONSOLIDATED FINANCIAL STATEMENTS AND REVIEW REPORT OF INDEPENDENT ACCOUNTANTS FOR THE THREE MONTHS ENDED MARCH 31, 2018 AND ------------------------------------------------------------------------------------------------------------------------------------
NET ASSETS 985,018, ,847,755
 BALANCE SHEET AS AT 31 DECEMBER 2012 Note 2012 2011 ASSETS Cash and balances with SBP and NBP 6 375,433,751 355,511,274 Balances with other banks/nbfis/mfbs 7 945,582,061 729,156,395 Lending to financial
ICI Pakistan Limited Condensed Interim Unconsolidated Statement of Financial Position As at September 30, 2018
 Condensed Interim Unconsolidated Statement of Financial Position ASSETS Note Non-current assets Property, plant and equipment 4 20,181,628 20,576,333 Intangible assets 5 923,124 924,294 21,104,752 21,500,627
TO THE MEMBERS AUDITORS REPORT
 AUDITORS REPORT TO THE MEMBERS We have audited the annexed consolidated financial statements comprising consolidated statement of financial position of Pakistan Telecommunication Company Limited ( the
NOTES TO CONSOLIDATED FINANCIAL STATEMENTS Fujitsu Limited and Consolidated Subsidiaries
 Fujitsu Limited and Consolidated Subsidiaries FUJITSU GROUP INTEGRATED REPORT 2018 19 1. Reporting Entity Fujitsu Limited (the Company ) is a company domiciled in Japan. The Company s consolidated financial
IGI Income Fund. Financial Statements for the year ended 30 June 2011
 IGI Income Fund Financial Statements for the year ended 30 June 2011 IGI Income Fund Statement of Assets and Liabilities As at 30 June 2011 Note 2011 2010 Assets Bank balances 4 69,355,569 385,846,626
Condensed Interim Financial Informaion Nine Month Accounts (Un-audited) 31 March 2015 BOOK POST. Jubilee Spinning & Weaving Mills Ltd.
 31 March 2015 BOOK POST. Jubilee Spinning & Weaving Mills Ltd.") BOOK POST If undelivered please return to: 45-A,Off Zafar Ali Road, Gulberg-V, Lahore-Pakistan. Condensed Interim Financial Informaion Nine Month Accounts (Un-audited) 31 March 2015 Company Information
BOOK POST If undelivered please return to: 45-A,Off Zafar Ali Road, Gulberg-V, Lahore-Pakistan. Condensed Interim Financial Informaion Nine Month Accounts (Un-audited) 31 March 2015 Company Information
AUDITORS REPORT TO THE MEMBERS
 A. F. FERGUSON & CO. Chartered Accountants State Life Building 1-C I. I. Chundrigar Road Karachi KPMG TASEER HADI & CO. Chartered Accountants Sheikh Sultan Trust Building No. 2 Beaumont Road Karachi AUDITORS
Financial review Refresco Financial review 2017
 Financial review 2017 Financial review 2017 Financial review 2017 1 69 Consolidated income statement For the year ended December 31, 2017 (x 1 million euro) Note December 31, 2017 December 31, 2016 Revenue
TECO IMAGE SYSTEMS CO., LTD. AND SUBSIDIARIES CONSOLIDATED FINANCIAL STATEMENTS AND REVIEW REPORT OF INDEPENDENT ACCOUNTANTS JUNE 30, 2016 AND 2015
 TECO IMAGE SYSTEMS CO., LTD. AND SUBSIDIARIES CONSOLIDATED FINANCIAL STATEMENTS AND REVIEW REPORT OF INDEPENDENT ACCOUNTANTS JUNE 30, 2016 AND 2015 -----------------------------------------------------------------------------------------------------------------------------
11 Financial Statements of SBP-BSC (Bank)
") 11 Financial Statements of SBPBSC (Bank) A. F. FERGUSON & CO. Chartered Accountants State Life Building No. 1C I. I. Chundrigar Road P.O. Box 4716 Karachi74000 EY FORD RHODES Chartered Accountants Progressive
11 Financial Statements of SBPBSC (Bank) A. F. FERGUSON & CO. Chartered Accountants State Life Building No. 1C I. I. Chundrigar Road P.O. Box 4716 Karachi74000 EY FORD RHODES Chartered Accountants Progressive
SENAO NETWORKS, INC. AND SUBSIDIARIES
 SENAO NETWORKS, INC. AND SUBSIDIARIES CONSOLIDATED FINANCIAL STATEMENTS AND REVIEW REPORT OF INDEPENDENT ACCOUNTANTS SEPTEMBER 30, 2015 AND 2014 ------------------------------------------------------------------------------------------------------------------------------------
Phihong Technology Co., Ltd. Financial Statements for the Years Ended December 31, 2015 and 2014 and Independent Auditors Report
 Phihong Technology Co., Ltd. Financial Statements for the Years Ended, 2015 and 2014 and Independent Auditors Report INDEPENDENT AUDITORS REPORT The Board of Directors and Stockholders Phihong Technology
FInAnCIAl StAteMentS
 Financial STATEMENTS The University of Newcastle ABN 157 365 767 35 Contents 106 Income statement 107 Statement of comprehensive income 108 Statement of financial position 109 Statement of changes in equity
C O N T E N T S. Company Information 2. Directors Review 3. Condensed Interim Balance Sheet 6. Condensed Interim Profit & Loss Account 8
 C O N T E N T S Company Information 2 Directors Review 3 Condensed Interim Balance Sheet 6 Condensed Interim Profit & Loss Account 8 Condensed Interim Statement of Comprehensive Income 9 Condensed Interim
Linamar Corporation December 31, 2012 and December 31, 2011 (in thousands of dollars)
") CONSOLIDATED FINANCIAL STATEMENTS Linamar Corporation, and, (in thousands of dollars) 1 MANAGEMENT S RESPONSIBILITY FOR THE CONSOLIDATED FINANCIAL STATEMENTS The management of Linamar Corporation is responsible
CONSOLIDATED FINANCIAL STATEMENTS Linamar Corporation, and, (in thousands of dollars) 1 MANAGEMENT S RESPONSIBILITY FOR THE CONSOLIDATED FINANCIAL STATEMENTS The management of Linamar Corporation is responsible
Condensed Interim Statement of Financial Position. Condensed Interim Statement of Profit or Loss. Condensed Interim Statement of Comprehensive Income
 Contents Corporate Information Directors Report Page No. 2 3 6 Condensed Interim Statement of Financial Position Condensed Interim Statement of Profit or Loss Condensed Interim Statement of Comprehensive
Balance Sheet as at June 30, Note (Rupees in thousands) ASSETS NON CURRENT ASSETS Property, plant and equipment 5 10,037,714 7,602,231
 ASSETS NON CURRENT ASSETS Property, plant and equipment 5 10,037,714 7,602,231") Balance Sheet as at June 30, 2016 2016 2015 Note (Rupees in thousands) ASSETS NON CURRENT ASSETS Property, plant and equipment 5 10,037,714 7,602,231 Capital work in progress 6 49,037 1,812,177 10,086,751
Balance Sheet as at June 30, 2016 2016 2015 Note (Rupees in thousands) ASSETS NON CURRENT ASSETS Property, plant and equipment 5 10,037,714 7,602,231 Capital work in progress 6 49,037 1,812,177 10,086,751
Media Times Limited Condensed Interim Statement of Profit or Loss (Un-audited) For the half year and quarter ended 31 December 2018
 For the half year and quarter ended 31 December 2018") Media Times Limited Condensed Interim Statement of Profit or Loss (Un-audited) For the half year and quarter ended 31 December 2018 31 December 2018 Half Year Ended 31 December 2017 31 December 2018 Quarter
Media Times Limited Condensed Interim Statement of Profit or Loss (Un-audited) For the half year and quarter ended 31 December 2018 31 December 2018 Half Year Ended 31 December 2017 31 December 2018 Quarter
(Un-Audited) For the Nine Months Ended March 31, 2016
 For the Nine Months Ended March 31, 2016") (Un-Audited) For the Nine Months March 31, 2016 02 03 05 07 08 09 10 11 15 17 18 19 20 21 DIRECTORS REVIEW Dear Shareholders, Assalam-o-Alaikum, Your s are pleased to present before you un -audited financial
(Un-Audited) For the Nine Months March 31, 2016 02 03 05 07 08 09 10 11 15 17 18 19 20 21 DIRECTORS REVIEW Dear Shareholders, Assalam-o-Alaikum, Your s are pleased to present before you un -audited financial
Half Yearly Financial Statements (Un-audited) For the period ended December 31, 2005
 For the period ended December 31, 2005") Half Yearly Financial Statements (Un-audited) For the period ended December 31, 2005 CORPORATE INFORMATION BOARD OF DIRECTORS Chairman Mr. Manzoor Hayat Noon Managing Director & CEO Mr. Javed Ali Khan
Half Yearly Financial Statements (Un-audited) For the period ended December 31, 2005 CORPORATE INFORMATION BOARD OF DIRECTORS Chairman Mr. Manzoor Hayat Noon Managing Director & CEO Mr. Javed Ali Khan
UNIVERZAL BANKA A.D. BEOGRAD
 UNIVERZAL BANKA A.D. BEOGRAD FINANCIAL STATEMENTS FOR THE YEAR ENDED 31 DECEMBER 2009 Univerzal banka a.d. Beograd TABLE OF CONTENTS Page Independent Auditors Report 1 Income statement 2 Balance sheet
UNIBEV LIMITED (Formerly known as M/s Uber Blenders & Distillers Limited)
") BALANCE SHEET AS AT 31 st, MARCH,2017 Notes March 31, 2017 March 31, 2016 (Rs.) (Rs.) I EQUITY AND LIABILITIES (1) Shareholders' funds Share Capital 2 12,786,950 500,000 Reserve and Surplus 3 (10,784,813)
BALANCE SHEET AS AT 31 st, MARCH,2017 Notes March 31, 2017 March 31, 2016 (Rs.) (Rs.) I EQUITY AND LIABILITIES (1) Shareholders' funds Share Capital 2 12,786,950 500,000 Reserve and Surplus 3 (10,784,813)
2017 CONSOLIDATED FINANCIAL STATEMENTS OF FIRSTONTARIO CREDIT UNION LIMITED
 2017 CONSOLIDATED FINANCIAL STATEMENTS OF FIRSTONTARIO CREDIT UNION LIMITED CONTENTS Report on Management Responsibility 1 Report of the Audit Committee 2 Consolidated Financial Statements: Independent
04 Condensed Interim Statement of Financial Position. 05 Condensed Interim Profit and Loss Account
 Contents 02 Company Information 03 Directors Review 04 Condensed Interim Statement of Financial Position 05 Condensed Interim Profit and Loss Account 06 Condensed Interim Statement of Comprehensive Income
May & Baker Nig Plc RC. UNAUDITED CONSOLIDATED FINANCIAL STATEMENTS 31 MARCH 2017
 ` May & Baker Nig Plc RC. 558 UNAUDITED CONSOLIDATED FINANCIAL STATEMENTS 31 MARCH 2017 UNAUDITED CONSOLIDATED STATEMENT OF PROFIT OR LOSS AND OTHER COMPREHENSIVE INCOME Note Continuing operations Revenue
Consolidated Financial Statements
 Consolidated Financial Statements Years ended March 31, 2018 and 2017 Consolidated Statement of Financial Position Sumitomo Chemical Company, Limited and Consolidated Subsidiaries March 31, 2018, 2017
BİM Birleşik Mağazalar Anonim Şirketi. Financial Statements March 31, 2008
 BİM Birleşik Mağazalar Anonim Şirketi Financial Statements BİM BİRLEŞİK MAĞAZALAR A.Ş. TABLE OF CONTENTS Page Balance Sheet 1 Statement of Income 2 Statement of Changes in Equity 3 Statement of Cash Flows
NOTES TO CONSOLIDATED FINANCIAL STATEMENTS Fujitsu Limited and Consolidated Subsidiaries
 Fujitsu Limited and Consolidated Subsidiaries FUJITSU GROUP INTEGRATED REPORT 2017 19 1. Reporting Entity Fujitsu Limited (the Company ) is a company domiciled in Japan. The Company s consolidated financial