|
|
|
- Clara Matthews
- 6 years ago
- Views:
Transcription
1
2

3
4
5
6

7
8
9
10
11
12
13
14

15
16
17


18


19


20


21
22
23

24

25
26
27
28
29
30
31
32
33
34
35
36
37
38

39
40
41

42
43
44

45

46
47


48

49
50
51
52
53
54
55
56
57
58
59
60
61
62
63
64
65
66
67
68

69
70
71
72
73
74
75
76
77
78
79
80
81
82
83
84
85
86
87
88
89
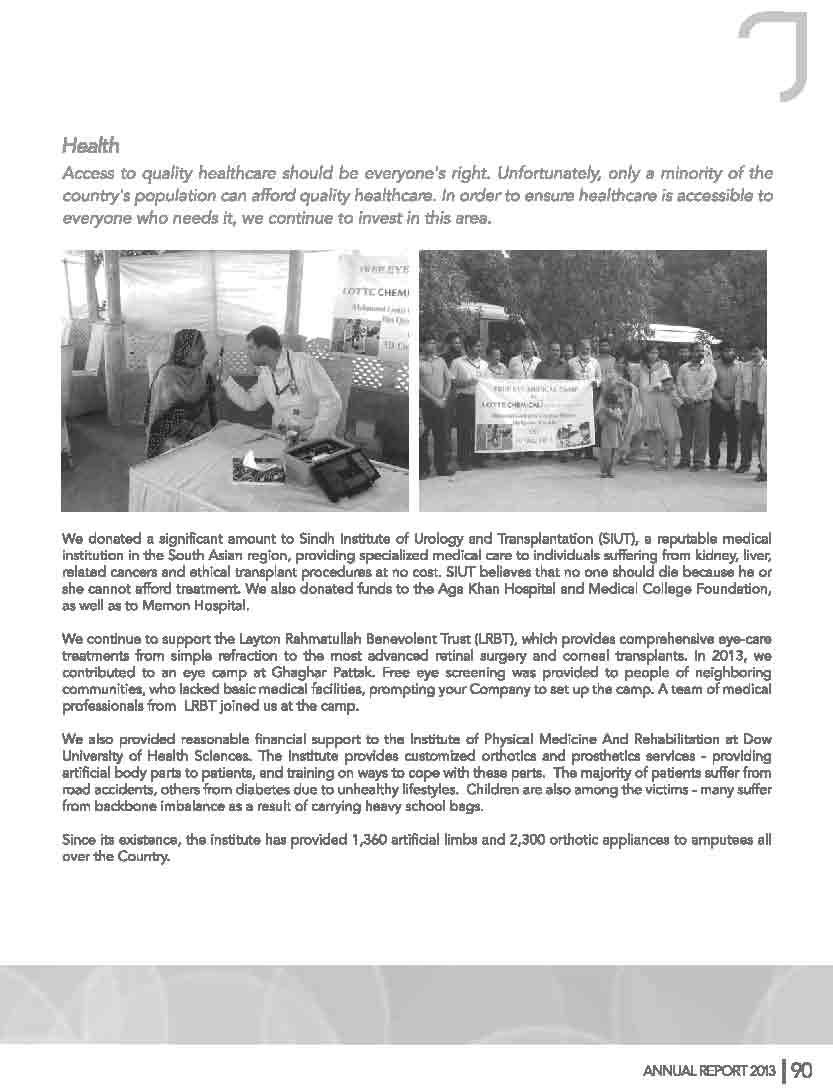
90
91
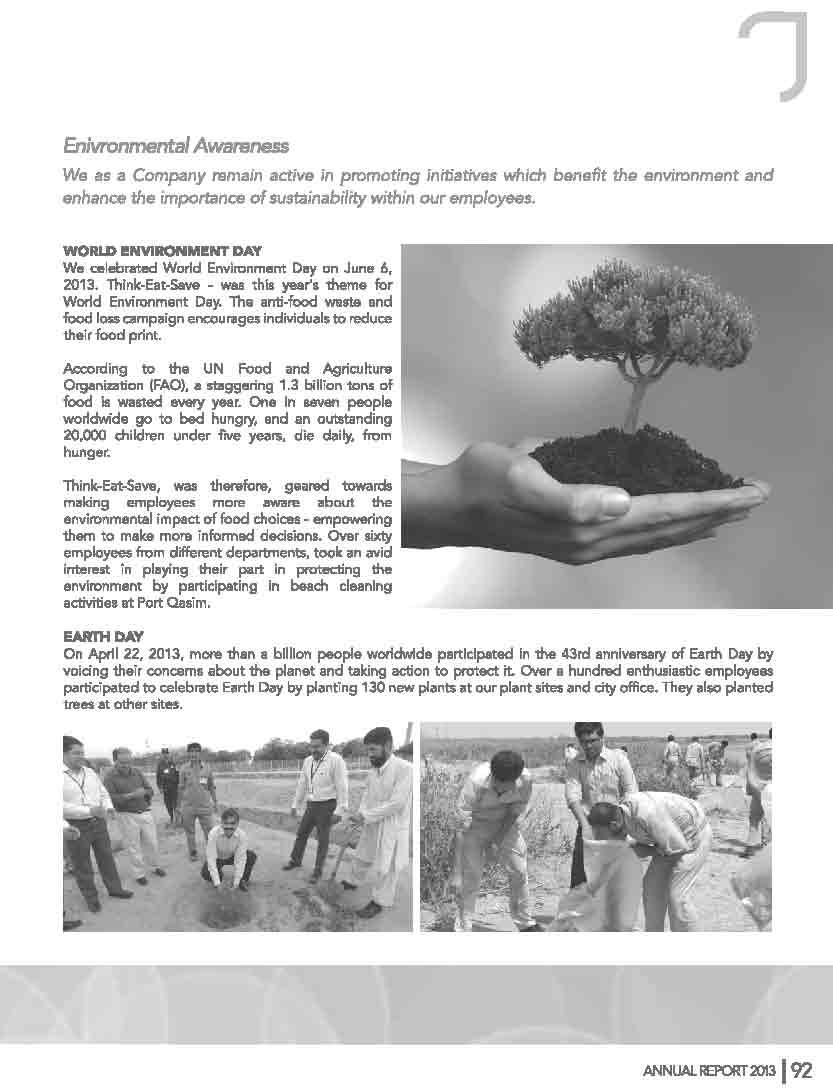
92
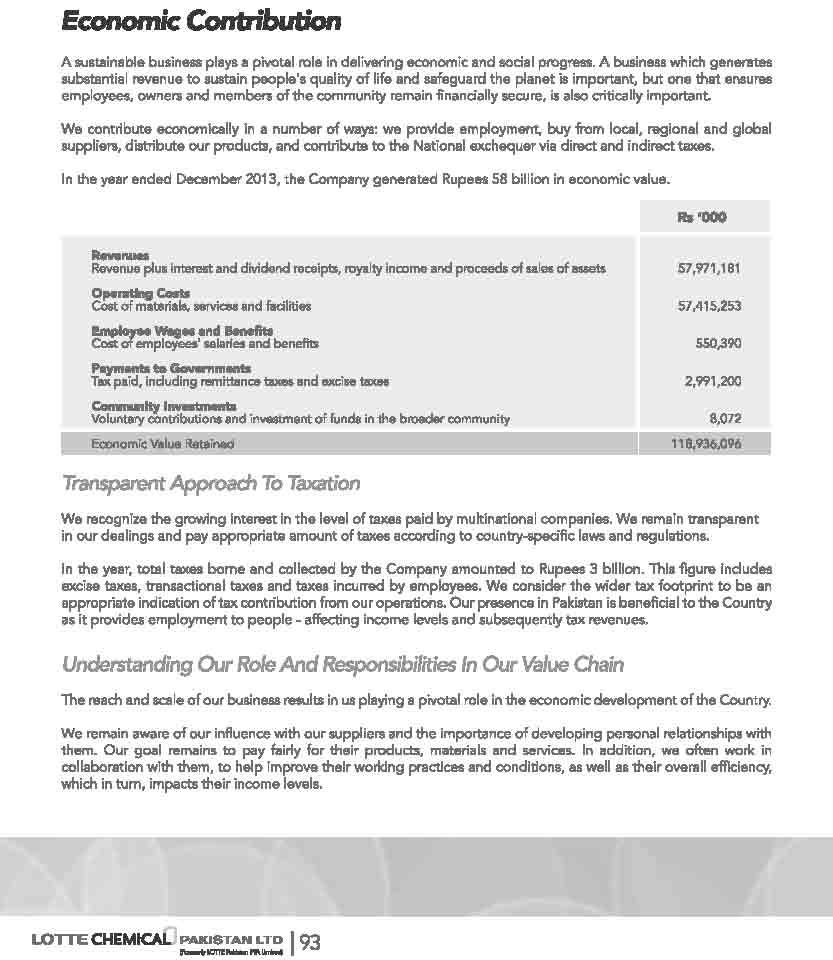
93
94
95
96

97
98

99
100

101
102
103
104

105

106

107
108

109
110
111


112

113
114
115
116 Auditors Report to the Members We have audited the annexed balance sheet of Lotte Chemical Pakistan Limited [formerly Lotte Pakistan PTA Limited] as at 31 December 2013 and the related profit and loss account, statement of comprehensive income, cash flow statement and statement of changes in equity together with the notes forming part thereof, for the year then ended and we state that we have obtained all the information and explanations which, to the best of our knowledge and belief, were necessary for the purposes of our audit. It is the responsibility of the Company s management to establish and maintain a system of internal control, and prepare and present the above said statements in conformity with the approved accounting standards and the requirements of the Companies Ordinance, Our responsibility is to express an opinion on these statements based on our audit. We conducted our audit in accordance with the auditing standards as applicable in Pakistan. These standards require that we plan and perform the audit to obtain reasonable assurance about whether the above said statements are free of any material misstatement. An audit includes examining, on a test basis, evidence supporting the amounts and disclosures in the above said statements. An audit also includes assessing the accounting policies and significant estimates made by management, as well as, evaluating the overall presentation of the above said statements. We believe that our audit provides a reasonable basis for our opinion and, after due verification, we report that: (a) (b) in our opinion, proper books of accounts have been kept by the Company as required by the Companies Ordinance, 1984; in our opinion: (i) (ii) (iii) the balance sheet and profit and loss account together with the notes thereon have been drawn up in conformity with the Companies Ordinance, 1984, and are in agreement with the books of accounts and are further in accordance with accounting policies consistently applied except for the change as stated in note 4 with which we concur; the expenditure incurred during the year was for the purpose of the Company s business; and the business conducted, investments made and the expenditure incurred during the year were in accordance with the objects of the Company; (c) in our opinion and to the best of our information and according to the explanations given to us, the balance sheet, profit and loss account, statement of comprehensive income, cash flow statement and statement of changes in equity together with the notes forming part thereof conform with approved accounting standards as applicable in Pakistan, and, give the information required by the Companies Ordinance, 1984, in the manner so required and respectively give a true and fair view of the state of the Company s affairs as at 31 December 2013 and of the loss, total comprehensive loss, its cash flows and changes in equity for the year then ended; and (d) in our opinion no Zakat was deductible at source under the Zakat and Ushr Ordinance, 1980 (XVIII of 1980). A. F. Ferguson & Co., Chartered Accountants Karachi Dated: 17 February 2014 Name of Engagement Partner: Farrukh Rehman 98
117 Balance Sheet As at 31 December 2013 Amount in Rs 000 (Re-stated) (Re-stated) Note ASSETS NON-CURRENT ASSETS Fixed assets 5 4,975,814 6,051,127 9,852,587 Long-term investment 6 4,500,000 4,500,000 - Long-term loans and advances 7 41,297 46,957 46,937 Long-term deposits and prepayments 8 64,011 79, ,212 9,581,122 10,677,331 9,999,736 CURRENT ASSETS Stores and spares 9 794, , ,745 Stock-in-trade 10 2,973,270 4,480,516 4,669,004 Trade debts 11 2,780,329 3,300,360 3,143,244 Loans and advances 12 24,644 32,796 40,603 Trade deposits and short-term prepayments 13 94,333 92, ,398 Mark-up accrued on bank deposits 4, ,831 Other receivables 14 87, , ,625 Tax refunds due from government - sales tax , , ,872 Taxation - payments less provision 858, , ,264 Cash and bank balances 16 2,426, ,134 4,505,251 10,462,034 10,294,653 13,886,837 TOTAL ASSETS 20,043,156 20,971,984 23,886,573 99
118 Amount in Rs 000 (Re-stated) (Re-stated) Note EQUITY SHARE CAPITAL AND RESERVES Share capital 17 15,142,072 15,142,072 15,142,072 Capital reserves 18 2,345 2,345 2,345 Accumulated losses (3,567,158) (3,023,864) (2,100,448) 11,577,259 12,120,553 13,043,969 LIABILITIES NON-CURRENT LIABILITIES Long-term loan from subsidiary , Liability against assets subject to finance lease ,039 Deferred tax , ,789 1,123,353 Retirement benefit obligation 21 45,002 43,668 65, , ,457 1,226,408 CURRENT LIABILITIES Trade and other payables 22 7,445,711 7,854,630 7,479,634 Current maturity of long-term loans - - 1,801,150 Interest accrued , , ,074 Short-term financing Current portion of liability against assets subject to finance lease 25-42, ,338 7,631,018 8,044,974 9,616,196 TOTAL LIABILITIES 8,465,897 8,851,431 10,842,604 Contingencies and commitments 26 TOTAL EQUITY AND LIABILITIES 20,043,156 20,971,984 23,886,573 The annexed notes 1 to 46 form an integral part of these financial statements. Changgyou Kim Chairman M Asif Saad Chief Executive 100
119 Profit and Loss Account For the year ended 31 December 2013 Amount in Rs 000 (Re-stated) Note Revenue 27 57,069,684 52,823,257 Cost of sales 28 (57,780,354) (53,035,075) Gross loss (710,670) (211,818) Distribution and selling expenses 29 (120,104) (132,191) Administrative expenses 30 (329,043) (303,595) Other expenses 31 (31,567) (22,346) Other income , ,985 Finance costs 33 (126,835) (146,054) Loss before taxation (348,166) (242,019) Taxation 34 (197,936) 61,095 Loss after taxation (546,102) (180,924) Earnings per share - basic and diluted (in Rupees) 36 (0.36) (0.12) The annexed notes 1 to 46 form an integral part of these financial statements. Changgyou Kim Chairman M Asif Saad Chief Executive 101
120 Statement of Comprehensive Income For the year ended 31 December 2013 Amount in Rs 000 (Re-stated) Note Loss after taxation (546,102) (180,924) Other comprehensive income: Items that will not be reclassified to Profit or Loss Remeasurements of post employment benefit obligations 21 4,148 21,891 Impact of deferred tax (1,340) (7,279) 2,808 14,612 Items that may be subsequently reclassified to Profit or Loss - - Total comprehensive loss for the year (543,294) (166,312) The annexed notes 1 to 46 form an integral part of these financial statements. Changgyou Kim Chairman M Asif Saad Chief Executive 102
121 Cash Flow Statement For the year ended 31 December 2013 Amount in Rs 000 (Re-stated) Note CASH FLOWS FROM OPERATING ACTIVITIES Cash generated from operations 35 2,681,756 1,231,377 Long-term loans and advances - net 5,660 (20) Long-term deposits and prepayments - net 15,236 20,965 Finance costs paid (57,767) (75,789) Payments to staff retirement benefit scheme (16,510) (23,623) Taxes paid (762,875) (797,661) Mark-up received from bank deposits 86, ,759 Net cash generated from operating activities 1,952, ,008 CASH FLOWS FROM INVESTING ACTIVITIES Payments for capital expenditure (150,371) (1,720,529) Long-term investment - payment for shares in subsidiary - (346,922) Net cash used in investing activities (150,371) (2,067,451) CASH FLOWS FROM FINANCING ACTIVITIES Payments for liability against assets subject to finance lease - (217,002) Repayment of long term loan - (1,878,950) Long-term loan from subsidiary 400,000 - Dividend paid (123) (754,722) Net cash from / (used in) financing activities 399,877 (2,850,674) Net increase / (decrease) in cash and cash equivalents 2,201,605 (4,280,117) Cash and cash equivalents at the beginning of the year 225,134 4,505,251 Cash and cash equivalents at the end of the year 2,426, ,134 The annexed notes 1 to 46 form an integral part of these financial statements. Changgyou Kim Chairman M Asif Saad Chief Executive 103
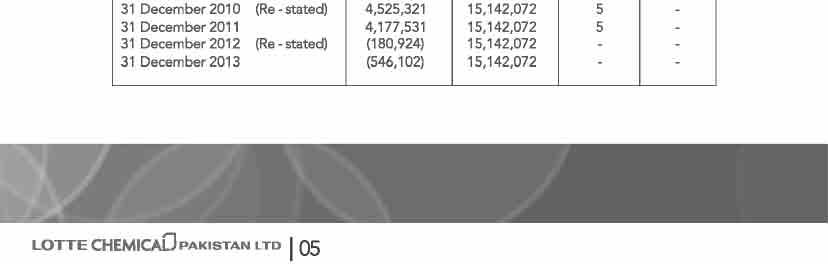
122 Statement of Changes in Equity For the year ended 31 December 2013 Amount in Rs 000 Issued, subscribed and paid-up capital Capital reserves Accumulated loss Total equity Balance as at 1 January 2012 as previously reported 15,142,072 2,345 (2,061,717) 13,082,700 Effect of change in accounting policy with respect to accounting for recognition of actuarial losses on defined benefit plan - net of tax - note (38,731) (38,731) Balance as at 1 January restated 15,142,072 2,345 (2,100,448) 13,043,969 Final cash dividend for the year ended 31 December Rs 0.5 per share - - (757,104) (757,104) Total comprehensive loss for the year ended 31 December Loss for the year ended 31 December (180,924) (180,924) - Other comprehensive income for the year ended 31 December ,612 14, (166,312) (166,312) Balance as at 1 January restated 15,142,072 2,345 (3,023,864) 12,120,553 Total comprehensive loss for the year ended 31 December Loss for the year ended 31 December (546,102) (546,102) - Other comprehensive income for the year ended 31 December ,808 2, (543,294) (543,294) Balance as at 31 December ,142,072 2,345 (3,567,158) 11,577,259 The annexed notes 1 to 46 form an integral part of these financial statements. Changgyou Kim Chairman M Asif Saad Chief Executive 104
123 Notes to and Forming Part of the Financial Statements For the year ended 31 December STATUS AND NATURE OF BUSINESS Lotte Chemical Pakistan Limited (formerly Lotte Pakistan PTA Limited) ( the Company ) is incorporated in Pakistan and is listed on the Karachi, Lahore and Islamabad Stock Exchanges, and is engaged in the manufacture and sale of Pure Terephthalic Acid (PTA). The Company s registered office is situated at EZ/1/P-4, Eastern Industrial Zone, Port Qasim, Karachi. The Company is a subsidiary of Lotte Chemical Corporation and the ultimate parent company is South Korean conglomerate Lotte. 2. SUMMARY OF SIGNIFICANT ACCOUNTING POLICIES The principal accounting policies applied in the preparation of these financial statements are set out below. These policies have been consistently applied to all the years presented, except as stated in note 4. These are separate financial statements of the Company. 2.1 Basis of preparation Statement of compliance These financial statements have been prepared in accordance with approved accounting standards as applicable in Pakistan. Approved accounting standards comprise such International Financial Reporting Standards (IFRS) issued by the International Accounting Standards Board and Islamic Financial Accounting Standards (IFAS) issued by the Institute of Chartered Accountants of Pakistan as are notified under the Companies Ordinance, 1984 and provisions of and directives issued under the Companies Ordinance, In case requirements differ, the provisions of or directives issued under the Companies Ordinance, 1984 (the Ordinance) have been followed Changes in accounting standards, interpretations and pronouncements a) Standards, interpretations and amendments to published approved accounting standards that are effective and relevant The amendments to following standards have been adopted by the Company for the first time for the financial year beginning on 1 January 2013: Amendment to IAS 1, Financial Statement Presentation regarding other comprehensive income. The main change resulting from these amendments is a requirement for entities to group items presented in other comprehensive income (OCI) on the basis of whether they are potentially reclassifiable to profit or loss subsequently (reclassification adjustments). The new amendment is not expected to materially affect the disclosures in the financial statements of the Company. IAS 19, Employee Benefits was revised in June The changes on the Company s accounting policies has been as follows: to immediately recognise all past service costs; and to replace interest cost and expected return on plan assets with a net interest amount that is calculated by applying the discount rate to the net defined benefit liability (asset). See note 4 for the impact on the financial statements. 105
124 Notes to and Forming Part of the Financial Statements For the year ended 31 December 2013 b) Standards, interpretations and amendments to published approved accounting standards that are effective but not relevant The other new standards, amendments and interpretations that are mandatory for accounting periods beginning on or after 1 January 2013 are considered not to be relevant for the Company s financial statements and hence have not been detailed here. c) Standards, interpretations and amendments to published approved accounting standards that are not yet effective but relevant There are no new standards, amendments to existing approved accounting standards and new interpretations that are not yet effective that would be expected to have a material impact on the financial statements of the Company. 2.2 Overall valuation policy These financial statements have been prepared under the historical cost convention, except that certain exchange elements have been incorporated in the cost of the relevant operating property, plant and equipment upto 4 July Fixed assets Property, plant and equipment and depreciation Operating property, plant and equipment are stated at cost less accumulated depreciation and impairment losses (if any). Cost of certain items of operating property, plant and equipment comprises historical cost, exchange differences referred to in note 2.2 and the cost of borrowings during the construction period in respect of loans taken for the PTA construction project. Renewals and improvements are included in an asset s carrying amount or are recognised as a separate asset, as appropriate, only when it is probable that future economic benefits associated with the item will flow to the Company and the cost of the item can be measured reliably. All other expenses are charged to income during the financial period in which they are incurred. Depreciation charge is based on the straight-line method whereby the cost of an asset is written off to profit and loss account over its estimated useful life, from the date the asset is available for use. The cost of leasehold land is amortised in equal installments over the lease period. When parts of an item of property, plant and equipment have different useful lives, they are accounted for as separate items (major components) of property, plant and equipment. The residual value, depreciation method and the useful lives of each part of property, plant and equipment that is significant in relation to the total cost of the asset are reviewed, and adjusted if appropriate, at each balance sheet date. Gains and losses on disposal of assets are taken to the profit and loss account. 106
125 Notes to and Forming Part of the Financial Statements For the year ended 31 December Intangible assets and amortisation Intangible assets are stated at cost less accumulated amortisation and impairment, if any. Major computer software licences are capitalised on the basis of cost incurred to acquire and bring to use the specific software. These costs are amortised over their estimated useful life of five years using the straight-line method. Full month s amortisation is charged in the month of acquisition and no amortisation is charged in the month of disposal. Costs associated with maintaining computer software programmes are recognised as an expense as and when incurred. 2.4 Long-term investment Investment in subsidiary is stated at cost. 2.5 Stores and spares Stores and spares are stated at the lower of weighted average cost and net realisable value. 2.6 Stock-in-trade Stock-in-trade is valued at the lower of cost and net realisable value. Cost is determined using the weighted average method, except for in transit which comprises invoice value and the direct charges in respect thereof. Manufactured finished goods include prime cost and an appropriate portion of production overheads. Net realisable value signifies the estimated selling price in the ordinary course of business less costs necessarily to be incurred to make the sale. 2.7 Trade debts and other receivables Trade debts are recognised initially at original invoice amount and subsequently measured at amortised cost less provision for impairment, if any. Other receivables are stated at amortised cost less provision for impairment. 2.8 Cash and cash equivalents Cash and cash equivalents comprise cash in hand, short term fixed deposits having maturity upto three months and current accounts held with commercial banks. Running finance and short term finance facilities availed by the Company, which are payable on demand and form an integral part of the Company s cash management are included as part of cash and cash equivalents for the purpose of statement of cash flows. 107
126 Notes to and Forming Part of the Financial Statements For the year ended 31 December Impairment Financial assets A financial asset is assessed at each reporting date to determine whether there is any objective evidence that it is impaired. A financial asset is considered to be impaired if objective evidence indicates that one or more events have had a negative effect on the estimated future cash flows of that asset. The Company considers evidence of impairment for receivables and other financial assets at specific asset levels. Losses are recognised as an expense in the profit and loss account. When a subsequent event causes the amount of impairment loss to decrease, this reduction is reversed through the profit and loss account Non-financial assets The carrying amounts of non-financial assets other than inventories and deferred tax asset, are assessed at each reporting date to ascertain whether there is any indication of impairment. If any such indication exists, then the asset s recoverable amount is estimated. An impairment loss is recognised as an expense in the profit and loss account for the amount by which the asset s carrying amount exceeds its recoverable amount. The recoverable amount is the higher of an asset s fair value less cost to sell and value in use. Value in use is ascertained through discounting of the estimated future cash flows using a discount rate that reflects current market assessment of the time value of money and the risk specific to the assets. For the purpose of assessing impairment, assets are grouped at the lowest levels for which there are separately identifiable cash flows (cash-generating units). An impairment loss is reversed if there has been a change in the estimates used to determine the recoverable amount. An impairment loss is reversed only to the extent that the asset s carrying amount does not exceed the carrying amount that would have been determined, net of depreciation or amortisation, if no impairment loss had been recognised. Prior impairments of non-financial assets (other than goodwill) are reviewed for possible reversal at each reporting date Trade and other payables Trade and other payables, excluding provisions are carried at the fair value of the consideration to be paid for goods and services Provisions A provision is recognised when the Company has a legal or constructive obligation as a result of a past event, and it is probable that an outflow of economic benefits will be required to settle the obligation and a reliable estimate of that can be made Offsetting Monetary assets and liabilities are offset and the net amount is reported in the financial statements only when there is a legally enforceable right to set-off the recognised amounts and the Company intends either to settle on a net basis, or to realise the assets and to settle the liabilities simultaneously. 108
127 Notes to and Forming Part of the Financial Statements For the year ended 31 December Lease payments Payments made under operating leases / Ijarah contracts are recognised in the profit and loss account on a straight-line basis over the term of the lease. Lease incentives received are recognised as an integral part of the total lease expense, over the term of the lease. Minimum lease payments made under finance leases are apportioned between the finance expense and the reduction of the outstanding liability. The finance expense is allocated to each period during the lease term so as to produce a constant periodic rate of interest on the remaining balance of the liability. Contingent lease payments are accounted for by revising the minimum lease payments over the remaining term of the lease when the lease adjustment is confirmed. At the inception of an arrangement, the Company determines whether such an arrangement is or contains a lease. A specific asset is the subject of a lease if fulfilment of the arrangement is dependent on the use of that specified asset. An arrangement conveys the right to use the asset if the arrangement conveys to the Company the right to control the use of the underlying asset. At inception or upon reassessment of the arrangement, the Company separates payments and other consideration required by such an arrangement into those for the lease and those for other elements on the basis of their relative fair values. If the Company concludes for a finance lease that it is impracticable to separate the payments reliably, an asset and a liability are recognised at an amount equal to the fair value of the underlying asset. Subsequently the liability is reduced as payments are made and an imputed finance charge on the liability is recognised using the Company s incremental borrowing rate Staff retirement benefits Defined benefit plans The Company operates an approved funded defined benefit gratuity scheme for all permanent employees. Minimum qualifying period for entitlement to gratuity is five years continuous service with the Company. The Company also has an approved funded defined benefit pension scheme for all management staff who joined the Company before 1 May The Company also has an unfunded medical scheme to provide post retirement medical benefits to members of its pension fund. Contributions to all schemes are made periodically on the basis of recommendations of the actuary and in line with the provisions of the Income Tax Ordinance, The liability recognised in the balance sheet in respect of defined benefit retirement plans is the present value of the defined benefit obligation at the end of the reporting period less the fair value of plan assets. The defined benefit obligation is calculated annually by an independent actuary using the projected unit credit method. The present value of the defined benefit obligation is determined by discounting the estimated future cash outflows using interest rates of high-quality corporate bonds 109
128 Notes to and Forming Part of the Financial Statements For the year ended 31 December 2013 that are denominated in the currency in which the benefits will be paid, and that have terms to maturity approximating to the terms of the related pension obligation. Actuarial gains and losses arising from experience adjustments and changes in actuarial assumptions are charged or credited to equity in other comprehensive income in the period in which they arise. Past-service costs are recognised immediately in income Defined contribution plans The Company operates a provident fund scheme for all its permanent employees. Equal monthly contributions are made to the fund, both by the Company and the employees at the rate of 10 percent of basic salary and cost of living allowance wherever applicable. The Company has no further payment obligations once the contributions have been paid. The contributions are recognised as employee benefit expense when they are due. Prepaid contributions are recognised as an asset to the extent that a cash refund or a reduction in the future payments is available. The Company also operates a defined contribution superannuation fund for its management staff who joined the Company on or after 1 May 2004 and for those who opted out of the defined benefit pension scheme. Contributions are made at the rate of 10.6 percent of basic salary of the members of the fund Dividend 2.16 Taxation Current Dividend distribution to the Company s shareholders is recognised as a liability in the period in which the dividend is approved. Income tax expense comprises current and deferred tax. Income tax expense is recognised in the profit and loss account, except to the extent that it relates to items recognised in other comprehensive income or directly in equity. In this case, the tax is also recognized in other comprehensive income or directly in equity. Provision for current taxation is based on taxable income / turnover at the enacted or substantively enacted rates of taxation after taking into account available tax credits and rebates, if any. The charge for current tax includes adjustments to charge for prior years, if any Deferred Deferred tax is recognised using the balance sheet method, providing for temporary differences between the carrying amounts of assets and liabilities for financial reporting purposes and the amounts used for taxation purposes. Deferred tax is not recognised on the initial recognition of assets or liabilities in a transaction that is not a business combination and that affects neither accounting nor taxable profit at the time of the transaction. Deferred tax is measured at the tax rates that are expected to be applied to the temporary differences when they reverse, based on the laws that have been enacted or substantively enacted by the reporting date. 110
129 Notes to and Forming Part of the Financial Statements For the year ended 31 December 2013 A deferred tax asset is recognised to the extent that it is probable that future taxable profits will be available against which temporary differences can be utilised. Deferred tax assets are reviewed at each reporting date and are reduced to the extent that it is no longer probable that the related tax benefit will be realised Foreign currency transactions Transactions denominated in foreign currencies are translated to Pakistan Rupees at the exchange rate ruling at the date of transaction. Monetary assets and liabilities in foreign currencies at balance sheet date are translated into Pakistan Rupees at exchange rates ruling on that date. Foreign exchange gains and losses resulting from the settlement of such transactions and from the translation at year-end exchange rates of monetary assets and liabilities denominated in foreign currencies are recognised in the income statement. In respect of foreign currency loans obtained for acquisition of operating property, plant and equipment, the exchange differences on principal amount upto 4 July 2004 were included in the cost of relevant operating property, plant and equipment. All exchange differences, effective 5 July 2004, are taken to the profit and loss account, due to amendments in the Fourth Schedule to the Ordinance Revenue recognition Revenue from the sale of goods is recognised on despatch of goods i.e. when the significant risks and rewards of ownership are transferred to the customer. Dividend income is recognised when the right to receive payment is established Interest income Profit on funds invested is recognised as it accrues in the profit and loss account, using the effective interest method Borrowings and their cost Borrowings are recognised initially at fair value, net of transaction cost incurred. Borrowing costs are recognised as an expense in the period in which these are incurred except to the extent of borrowing costs that are directly attributable to the acquisition, construction or production of a qualifying asset. Such borrowing costs, if any, are capitalised as part of the cost of that asset Earnings per share The Company presents earnings per share (EPS) data for its ordinary shares. EPS is calculated by dividing the profit or loss attributable to ordinary shareholders of the Company by the weighted average number of ordinary shares outstanding during the period Functional and presentation currency These financial statements are presented in Pakistan Rupees which is the functional currency of the Company and figures are rounded off to the nearest thousands of Rupees. 111
130 Notes to and Forming Part of the Financial Statements For the year ended 31 December CRITICAL ACCOUNTING ESTIMATES AND JUDGEMENTS Estimates and judgements are continually evaluated and are based on historical experience and other factors, including expectations of future events that are believed to be reasonable under the circumstances. 3.1 Critical accounting estimates and assumptions The Company makes estimates and assumptions concerning the future. The resulting accounting estimates will, by definition, seldom equal the related actual results. The estimates and assumptions that have a significant risk of causing a material adjustment to the carrying amounts of assets and liabilities within the next financial year are addressed below Income taxes In making the estimates for income taxes, the Company takes into account the current income tax law and decisions taken by appellate authorities on certain issues in the past. There may be various matters where the Company s view differs with the view taken by the income tax department at the assessment stage and where the Company considers that its view on items of a material nature is in accordance with the law. The difference between the potential and actual tax charge, if any, is disclosed as a contingent liability. The deemed assessment order of the Company for the Tax Year 2003 was rectified by the tax department in 2008 without any cause and basis, allowing tax losses brought forward relating to the pre de-merger period. This treatment was apparently made as a consequence of the action undertaken to effect the amendment of assessment for the Tax Year 2003 in the case of ICI Pakistan Limited. In that case the tax department had taken certain actions in the order, considered by the department as protective assessment, on the matter of unabsorbed depreciation carried forward by ICI Pakistan Limited relating to assets of the PTA business as of the date of de-merger. The Company s position under the tax law is that such depreciation should be allowed to ICI Pakistan Limited and a writ petition was, therefore, filed jointly with ICI Pakistan Limited in the High Court of Sindh challenging this rectification. The honourable High Court of Sindh vide its order dated 31 January 2009, directed the tax department that no further action shall be taken until the next date of hearing. The matter is still pending. Recently in the case of that company, the availability of the said depreciation loss from the year has attained finality after the decision of the Appellate Tribunal Inland Revenue. However, the matter is still pending as the department has preferred appeal. In 2008 while issuing the rectification order for the Tax Year 2003, the Taxation Officer had erroneously disallowed the loss brought forward of Rs 2.6 billion for which a rectification application and corresponding appeal was filed with the Additional Commissioner of Income Tax and CIT (Appeals) respectively. During 2011, the Commissioner (Appeals) disposed off the Company s appeal via order No. 156 dated 14 March 2011 and allowed the said loss while maintaining certain disallowances against which corresponding appeals were filed with the Appellate Tribunal Inland Revenue [ATIR]. In its order passed on 14 September 2011, ATIR referred back the matter of disallowance of such loss against which rectification appeal was filed on 13 October The issue is still pending in appeal. 112
131 Notes to and Forming Part of the Financial Statements For the year ended 31 December Defined benefit plans The Company has adopted certain actuarial assumptions as disclosed in note 21 to the financial statements for valuation of present value of defined benefit obligations and fair value of plan assets, based on actuarial advice. 3.2 No critical judgement has been used in applying the accounting policies. 4. CHANGE IN ACCOUNTING POLICY IAS 19 (revised) - Employee Benefits effective for annual periods beginning on or after 1 January 2013 amends the accounting for employee benefits. The standard requires immediate recognition of past service cost and also replaces the interest cost on the defined benefit obligation and the expected return on plan assets with a net interest cost based on the net defined benefit asset or liability and the discount rate, measured at the beginning of the year. Further, a new term remeasurements has been introduced. This is made up of actuarial gains and losses, the difference between actual investment returns and the return implied by the net interest cost. The standard requires remeasurements to be recognised in the Balance Sheet immediately, with a charge or credit to Other Comprehensive Income in the periods in which they occur. Following the application of IAS 19 (revised), the Company s policy for Staff Retirement Benefits - Defined Benefit Plans stands amended as follows: - The amount arising as a result of remeasurements are recognised in the Balance Sheet immediately, with a charge or credit to Other Comprehensive Income in the periods in which they occur. - The change in accounting policy has been accounted for retrospectively in accordance with the requirements of IAS 8 Accounting Policies, Changes in Accounting Estimates and Errors and comparative figures have been restated. 113
132 Notes to and Forming Part of the Financial Statements For the year ended 31 December 2013 The Company s financial statements are affected by the remeasurements relating to prior years. The effects have been summarised below: Amount in Rs Impact on Balance Sheet Increase in deferred liability 16,125 44,229 Decrease in other receivables 15,839 13,795 Decrease in deferred tax liabilities 10,638 19,293 Increase in accumulated losses 21,326 38,731 Impact on Statement of Changes in Equity Increase in accumulated losses Cumulative effect from prior years - 34,088 Impact for the year ended (17,405) 4,643 Impact on Profit & Loss Decrease in cost of sales 2,777 - Decrease in distribution and selling expenses Decrease in administrative expenses 1,064 - Increase in taxation 1,376 - Impact on Other Comprehensive Income Items that will not be reclassified to Profit or Loss 14,612 - The effect of change in accounting policy, due to adoption of IAS 19 (Revised), on earnings per share is immaterial in the overall context of these financial statements. There is no cash flow impact as a result of the retrospective application of change in accounting policy. 114
133 Notes to and Forming Part of the Financial Statements For the year ended 31 December 2013 Amount in Rs FIXED ASSETS Property, plant and equipment Operating assets - note 5.1 4,965,072 5,967,079 Capital work-in-progress - note 5.2 9,352 82,174 4,974,424 6,049,253 Intangible assets - note 5.4 1,390 1,874 4,975,814 6,051, Operating assets The following is a statement of operating property, plant and equipment: Leasehold land Buildings on leasehold land Plant and machinery Owned Held under finance lease Motor vehicles Furniture and equipment Total Net carrying value basis Year ended 31 December 2013 Opening net book value (NBV) 50, ,599 5,659,590 4,395 6,382 80,619 5,967,079 Additions (at cost) , , ,157 Disposals (at NBV) (106) (106) Depreciation charge (1,422) (24,675) (1,169,647) (4,395) (4,868) (20,051) (1,225,058) Closing net book value (NBV) 49, ,551 4,706,480-2,382 65,587 4,965,072 Gross carrying value basis at 31 December 2013 Cost 90, ,836 26,879, ,543 57, ,957 28,596,811 Accumulated depreciation (41,206) (646,574) (20,915,122) (395,543) (55,099) (118,370) (22,171,914) Accumulated impairment losses - (201,711) (1,258,114) (1,459,825) Net book value (NBV) 49, ,551 4,706,480-2,382 65,587 4,965,072 Net carrying value basis Year ended 31 December 2012 Opening net book value (NBV) 51, ,004 6,805,141 30,765 11,785 48,643 7,134,254 Additions (at cost) - 3, , , ,277 Disposals (at NBV) - - (3,432) - - (208) (3,640) Depreciation charge (1,422) (23,752) (1,285,229) (26,370) (5,403) (22,636) (1,364,812) Closing net book value (NBV) 50, ,599 5,659,590 4,395 6,382 80,619 5,967,079 Gross carrying value basis at 31 December 2012 Cost 90, ,209 26,663, ,543 56, ,441 28,445,264 Accumulated depreciation (39,784) (621,899) (19,745,476) (391,148) (50,231) (169,822) (21,018,360) Accumulated impairment losses - (201,711) (1,258,114) (1,459,825) Net book value (NBV) 50, ,599 5,659,590 4,395 6,382 80,619 5,967,079 Depreciation rate % per annum
134 Notes to and Forming Part of the Financial Statements For the year ended 31 December Capital work-in-progress Amount in Rs Civil works and buildings 1,599 - Plant and machinery ,489 Miscellaneous equipments 7, ,352 82, Capital work-in-progress - movement Opening balance 82,174 2,717,177 Capital expenditure 143,862 1,717,595 Transferred to operating property, plant and equipment (216,684) (199,520) Transferred to Lotte Powergen (Private) Limited - wholly owned subsidiary - (4,153,078) Closing balance 9,352 82, INTANGIBLE ASSETS Net carrying value basis Opening net book value 1,874 1,156 Additions during the year 36 1,177 Amortisation charge (520) (459) Closing net book value 1,390 1, Gross carrying value basis Cost 214, ,066 Accumulated amortisation (212,712) (212,192) Net book value 1,390 1, Following assets, having net book value exceeding Rs 50,000 were retired during the year Description Cost Accumulated depreciation Net book value Sales proceeds Particulars of buyers / others Furniture and equipment Dell Latitude Notebook Discarded / Scrapped 116
135 Notes to and Forming Part of the Financial Statements For the year ended 31 December 2013 Amount in Rs LONG-TERM INVESTMENT - unquoted Investment in subsidiary Lotte Powergen (Private) Limited, wholly owned subsidiary - at cost 450,000,000 ordinary shares of Rs 10 each (31 December 2012: 450,000,000) 4,500,000 4,500, The Subsidiary is engaged in generation and sale of electricity and steam to the Company. 7. LONG-TERM LOANS AND ADVANCES - considered good Motor House Others Total Total car building assistance Due from executives - note ,372 14,767-40,139 46,560 Less: Receivable within one year - note 12 (4,891) (7,695) - (12,586) (13,970) 20,481 7,072-27,553 32,590 Due from employees 13,703 1,346 2,957 18,006 19,335 Less: Receivable within one year - note 12 (2,618) (994) (650) (4,262) (4,968) 11, ,307 13,744 14,367 31,566 7,424 2,307 41,297 46, Reconciliation of carrying amount of loans to executives Key management personnel Executives Total Key management personnel Executives Total Balance at 1 January 6,009 40,551 46, ,329 47,135 Disbursements - 19,345 19,345 6,555 13,925 20,480 Repayments (1,311) (24,455) (25,766) (1,352) (19,703) (21,055) Balance at 31 December 4,698 35,441 40,139 6,009 40,551 46,
136 Notes to and Forming Part of the Financial Statements For the year ended 31 December Loans for purchase of motor cars and house building assistance are repayable between two to ten years. All the loans are interest free and are secured, where applicable, against respective assets granted to the employees of the Company in accordance with their terms of employment. 7.3 The maximum aggregate amount of loans and advances due from Executives at the end of any month during the year was Rs million (2012: Rs million). 8. LONG-TERM DEPOSITS AND PREPAYMENTS Amount in Rs Deposits - note ,524 40,524 Prepayments 23,487 38,723 64,011 79, These include Rs million (2012: Rs million) paid to Pakistan Steel Mills Corporation for emergency back-up supply of water and Rs million (2012: Rs million) paid to Karachi Electric Supply Corporation (KESC). 9. STORES AND SPARES Stores 30,021 23,517 Spares 785, ,254 Less: Provision for slow moving, obsolete 815, ,771 and rejected items - note 9.1 (20,860) (15,746) 9.1 Provision for slow moving, obsolete and rejected items 794, ,025 Provision at 1 January 15,746 10,975 Charge for the year 5,114 4,771 20,860 15,746 Write-offs - - Provision at 31 December 20,860 15,
137 Notes to and Forming Part of the Financial Statements For the year ended 31 December 2013 Amount in Rs STOCK-IN-TRADE Raw and packing materials [including in-transit Rs 181 million (2012: Rs 942 million)] 2,166,141 2,802,171 Finished goods - Manufactured goods 735,540 1,538,654 - Trading goods [including in-transit Rs Nil (2012: Rs million)] 71, , ,129 1,678,345 2,973,270 4,480, Raw and packing materials include Rs 1.11 billion (2012: Rs 1.25 billion) held with third party. 11. TRADE DEBTS 11.1 These are secured and considered good All of the Company s trade debts are secured by letters of credit issued by various banks. 12. LOANS AND ADVANCES - considered good Loans due from: - Executives - note 7 12,586 13,970 - Employees - note 7 4,262 4,968 Advances to: 16,848 18,938 - Executives 3,698 4,701 - Employees 1,018 1,148 - Contractors and suppliers 3,080 8,009 7,796 13,858 24,644 32, The maximum aggregate amount of advances due from Executives at the end of any month during the year was Rs 6.16 million (2012: Rs 4.01 million). 119
138 Notes to and Forming Part of the Financial Statements For the year ended 31 December TRADE DEPOSITS AND SHORT-TERM PREPAYMENTS Amount in Rs Deposits 9,499 4,489 Margin on import letters of credit 18,222 47,463 Short-term prepayments 66,612 40,452 94,333 92, OTHER RECEIVABLES (Re-stated) (Re-stated) Rebates receivable - note ,535 62, ,834 Asset recognised in respect of staff retirement benefit funds - note Receivable from subsidiary of the Company 53,294 13,479 - Insurance claims receivable 12,029 27,112 12,828 Others 475 1,586 1,963 87, , , This represents amounts receivable on account of price and exchange rate differentials in respect of paraxylene and acetic acid settlements. 15. TAX REFUNDS DUE FROM GOVERNMENT - SALES TAX Sales tax refundable 511, ,153 Provision for doubtful receivables (94,008) (94,008) 417, , This includes Rs million (31 December 2012: Rs 259 million) on account of input tax arising from sales tax charged to the Company under the Sindh Sales Tax on Services Act, 2011 which is administered by the Sindh Revenue Board with effect from 1 July This is being deferred due to procedural issues between Federal and Provincial Tax collecting agencies, resulting in lack of verification by the refund issuing authority i.e. the Federal Board of Revenue (FBR). The Company had approached Federal Tax Ombudsman (FTO) for resolution of the matter. The FTO in its order dated 2 May 2013 have directed FBR, with certain recommendations, to resolve the issue. The Company is maintaining close focus with the relevant authorities for early resolution for the same. 120
139 Notes to and Forming Part of the Financial Statements For the year ended 31 December 2013 Amount in Rs CASH AND BANK BALANCES Short-term fixed deposits - note ,401, ,950 With banks in current accounts 17,271 44,438 Cash in hand 8,118 8,746 2,426, , During the year ended 31 December 2013, the mark-up rates on term deposits ranged from 6.50% to 9.70% (2012: 6.50% to 11.75%) per annum and had maturities of less than three months. 17. SHARE CAPITAL 17.1 Authorised capital 2,000,000,000 ordinary shares of Rs 10 each 20,000,000 20,000, ,735,636 ordinary shares of Rs 10 each fully paid-up issued pursuant to the Scheme for consideration other than cash - note ,047,356 5,047,356 1,009,471,572 ordinary shares of Rs 10 each fully paid-up in cash 10,094,716 10,094,716 15,142,072 15,142, With effect from 1 October 2000 the PTA Business of ICI Pakistan Limited was demerged under a Scheme of Arrangement (Scheme), dated 12 December 2000, approved by the shareholders and sanctioned by the High Court of Sindh At 31 December 2013 and 2012, Lotte Chemical Corporation - South Korea held 1,135,860,105 ordinary shares of Rs 10 each. 18. CAPITAL RESERVES Capital reserves represent the amount received from various overseas companies of AkzoNobel Group (then group Companies), for purchase of fixed assets. The remitting companies have no claim to their repayments. 121
140 Notes to and Forming Part of the Financial Statements For the year ended 31 December LONG-TERM LOAN FROM SUBSIDIARY Amount in Rs 000 Lender Installments payable Interest rate Repayment month Loan from wholly owned subsidiary Lotte Powergen (Private) Limited - Rs 400 million (31 December 2012: Rs Nil) full payment on maturity 3% p.a. above 6 months KIBOR January , DEFERRED TAX (Re-stated) (Re-stated) Credit balance arising in respect of property, plant and equipment 907,627 1,199,074 1,432,500 (Debit) balances arising in respect of: - liability against assets subject to finance lease - (12,723) (77,598) - provisions for: sales tax refundable (30,365) (31,258) (41,174) staff retirement benefits (24,406) (19,796) (26,205) slow moving, obsolete and rejected items (6,738) (5,236) (3,649) unpaid liabilities (220,791) (209,307) (160,521) - carry forward of turnover tax (157,965) (157,965) - - taxable loss (77,485) , ,789 1,123, Deferred income tax asset is recognised for tax losses available for carry forward to the extent that the related tax benefit available through future taxable profit. 21. RETIREMENT BENEFIT OBLIGATION 21.1 Staff retirement benefits As stated in note , the Company operates three retirement benefit plans (The Plans) namely approved funded defined benefit gratuity scheme for all permanent employees, approved funded defined benefit pension scheme for all management staff and unfunded medical scheme for members of its pension fund subject to minimum service of prescribed period in the respective trust deed. Actuarial valuation of these plans is carried out every year and the latest actuarial valuation was carried out as at 31 December
141 Notes to and Forming Part of the Financial Statements For the year ended 31 December Plan assets held in trust are governed by local regulations which mainly includes Trust Act, 1882, Companies Ordinance, 1984, Income Tax Rules, 2002 and Rules under the Trust deed of the Plans. Responsibility for governance of the Plans, including investment decisions and contribution schedules, lies with the Board of Trustees. The Company appoints the trustees and all trustees are employees of the Company The latest actuarial valuation of the Fund as at 31 December 2013 was carried out using the Projected Unit Credit Method. Details of the Fund as per the actuarial valuation are as follows: Amount in Rs 000 (Re-stated) Funded Unfunded Funded Unfunded Pension Gratuity Total Medical Pension Gratuity Total Medical Balance sheet reconciliation Present value of defined benefit obligation at 31 December - note (62,124) (161,337) (223,461) (38,362) (55,347) (154,764) (210,111) (36,404) Fair value of plan assets at 31 December - note , , ,628-48, , ,874 - (Deficit) / Surplus (6,640) 807 (5,833) (38,362) (7,264) 27 (7,237) (36,404) Movement in the present value of defined benefit obligation Balances as at 1 January 55, , ,111 36,404 48, , ,273 31,313 Benefits paid by the plan - (17,787) (17,787) (325) (3,507) (4,847) (8,354) (210) Current service costs 2,882 12,010 14,892 2,226 2,639 11,524 14,163 2,215 Interest cost 6,365 16,802 23,167 4,168 6,066 16,714 22,780 4,057 Remeasurement on obligation (2,470) (4,452) (6,922) (4,111) 1, ,249 (971) Balance as at 31 December 62, , ,461 38,362 55, , ,111 36, Movement in the fair value of plan assets Fair value of plan assets at 1 January 48, , ,874-34, , ,570 - Contributions paid into the plan 3,343 12,842 16,185-6,279 17,134 23,413 - Benefits paid by the plan - (17,787) (17,787) - (3,507) (4,847) (8,354) - Interest income 5,717 17,524 23,241-4,527 14,549 19,076 - Remeasurement (1,659) (5,226) (6,885) - 5,913 17,256 23,169 - Fair value of plan assets at 31 December 55, , ,628-48, , ,
142 Notes to and Forming Part of the Financial Statements For the year ended 31 December 2013 Amount in Rs 000 (Re-stated) Funded Unfunded Funded Unfunded Pension Gratuity Total Medical Pension Gratuity Total Medical Expense recognised in profit and loss account Current service costs 2,882 12,010 14,892 2,226 2,639 11,524 14,163 2,215 Net Interest cost 648 (722) (74) 4,168 1,539 2,165 3,704 4,057 Expense recognised in profit and loss account 3,530 11,288 14,818 6,394 4,178 13,689 17,867 6, Remeasurement recognised in Other Comprehensive Income Loss from changes in demographic assumptions (171) (1,424) Experience (gain) / losses (2,470) (4,452) (6,922) (4,111) 1, , Remeasurement of fair value of plan assets 1,659 5,226 6,885 - (5,913) (17,256) (23,169) - Remeasurements (811) 774 (37) (4,111) (4,123) (16,797) (20,920) (971) Net recognised liability / (asset) Net liability at beginning of the year 7,264 (27) 7,237 36,404 13,488 20,215 33,703 31,313 Charge for the year 3,530 11,288 14,818 6,394 4,178 13,689 17,867 6,272 Contribution made during the year to the fund (3,343) (12,842) (16,185) (325) (6,279) (17,134) (23,413) (210) Remeasurements recognised in Other Comprehensive Income (811) 774 (37) (4,111) (4,123) (16,797) (20,920) (971) Recognised liability / (asset) as at 31 December 6,640 (807) 5,833 38,362 7,264 (27) 7,237 36, Plan assets comprises of following Government bonds 33,477 79, ,872 30, , ,360 Other bonds (TFCs) ,114 5,214 9,328 Shares 8,392 24,413 32,805 11,268 36,306 47,574 Term deposits 12,094 55,655 67,749-1,533 1,533 Cash at Bank 1,521 2,681 4,202 2,275 4,804 7,079 Total as at 31 December 55, , ,628 48, , , Actuarial assumptions Discount rate at 31 December 13.00% 13.00% 13.00% 11.50% 11.50% 11.50% Future salary increases 10.75% 10.75% 9.50% 9.50% Medical cost trend rate 7.50% 6.25% Future pension increases 7.50% 6.25% Mortality was assumed to be 70% of the EFU(61-66) Table. 124
143 Notes to and Forming Part of the Financial Statements For the year ended 31 December In case of the funded plans, the Company ensures that the investment positions are managed within an asset-liability matching (ALM) framework that has been developed to achieve long-term investments that are in line with the obligations under the retirement benefit plan. Within this framework, the Company s ALM objective is to match assets to the retirement benefit obligations by investing in long-term fixed interest securities with maturities that match the benefit payments as they fall due and in the appropriate currency. The Company actively monitors how the duration and the expected yield of the investments are matching the expected cash outflows arising from the retirement benefit plan obligations. The Company has not changed the processes used to manage its risks from previous periods. The Company does not use derivatives to manage its risk. Investments are well diversified, such that the failure of any single investment would not have a material impact on the overall level of assets. A large portion of assets in 2013 consists of government bonds and term deposits. The Company believes that government bond offer the best returns over the long term with an acceptable level of risk The expected return on plan assets was determined by considering the expected returns available on the assets underlying the current investment policy. Expected yields on fixed interest investments are based on gross redemption yields as at the balance sheet date. The Company s contribution to the pension and gratuity funds in 2014 is expected to amount to Rs 16.2 million. The actuary conducts separate valuations for calculating contribution rates and the Company contributes to the pension and gratuity funds according to the actuary s advice. Expense of the defined benefit plan is calculated by the actuary. Figures in this note are based on the latest actuarial valuation carried out as at 31 December Sensitivity analysis for actuarial assumptions The sensitivity of the defined benefit obligation to changes in the weighted principal assumptions is: Amount in Rs 000 Impact on defined benefit obligation Change in Increase in Decrease in assumption assumption assumption Discount rate at 31 December 1% (27,418) 32,054 Future salary increases 1% 23,746 (21,250) Future pension increases 1% 735 (623) If longevity increases by 1 year, obligation increases by Rs 88,
144 Notes to and Forming Part of the Financial Statements For the year ended 31 December 2013 The above sensitivity analyses are based on a change in an assumption while holding all other assumptions constant. In practice, this is unlikely to occur, and changes in some of the assumptions may be correlated. When calculating the sensitivity of the defined benefit obligation to significant actuarial assumptions the same method (present value of the defined benefit obligation calculated with the projected unit credit method at the end of the reporting period) has been applied as when calculating the pension liability recognised within the statement of financial position. A sensitivity analysis was conducted to determine the impact of a 1% change in the medical cost trend, which was not material. The methods and types of assumptions used in preparing the sensitivity analysis did not change compared to the previous period. Amount in Rs Historical information Present value of the defined benefit obligation as at 31 December 261, , , , ,655 Fair value of plan assets 217, , , , ,724 Deficit in the plan (44,195) (43,641) (65,016) (41,639) (21,931) Experience Adjustments (Gain) / loss on obligation (as percentage of plan obligation) (4)% (1)% (6)% (7)% (9)% Gain / (loss) on plan assets (as percentage of plan assets) (3)% 11% 1% 1% 17% 21.4 The expected return on plan assets is based on the market expectations and depends upon the asset portfolio of the Fund, at the beginning of the period, for returns over the entire life of related obligation The Company s contributions towards the provident fund and defined contribution superannuation fund for the year ended 31 December 2013 amounted to Rs million (2012: Rs million) and Rs million (2012: Rs million) The weighted average duration of the defined benefit obligation is 13 years. Expected maturity analysis of undiscounted retirement benefit plans. At 31 December 2013 Less than a year Between 1-2 years Between 2-5 years Over 5 years Total Retirement benefit plans 4,389 6,585 35, , ,
145 Notes to and Forming Part of the Financial Statements For the year ended 31 December 2013 Amount in Rs TRADE AND OTHER PAYABLES Trade creditors including bills payable - note ,197,423 5,597,069 Accrued expenses 676, ,548 Advances from supplier / customer ,483 Unclaimed dividend 12,262 12,385 Provision for infrastructure cess - note ,453,826 1,249,432 Workers welfare fund 12,572 - Others 92,267 69,713 7,445,711 7,854, This includes payable to subsidiary amounting to Rs million (31 December 2012: Rs million) The Company (along with a number of other parties) is challenging the levy of infrastructure cess on cost and freight value of goods entering the province of Sindh. According to a decision of the High Court, levy of the fee / cess upto December 2006 was declared to be illegal while amounts charged after that date were decreed to be within the law. Appeals were filed in the Supreme Court both by the companies and the Government of Sindh in respect of the aforesaid judgement of the High Court. During the year 2011, the Supreme Court referred the case back to the High Court. The High Court vide its order dated 2 June 2011 provided for an interim arrangement reached through a joint statement filed with the Court by the counsels of the petitioners and respondent of the case. As per the order, bank guarantees / securities furnished in respect of consignments cleared after 27 December 2006 would be encashed to the extent of 50% and guarantees for the remaining balance would be kept till final disposal of the petitions. Consequently, bank guarantees relating to the period upto 27 December 2006 have been cancelled and returned to the Company. As per legal advice sought by the Company in respect of the aforementioned case, the High Court may uphold the validity of the law against the Company upon its re-filing since the matter has been referred back to the High Court by the Supreme Court, thereby making the Company liable to pay the levy for all consignments cleared till date. As a matter of abundant caution, full amount of provision has been made in these financial statements in this respect Balance as at 1 January 1,249,432 1,048,914 Charge 204, ,518 Balance as at 31 December 1,453,826 1,249,
146 Notes to and Forming Part of the Financial Statements For the year ended 31 December 2013 Amount in Rs INTEREST ACCRUED Long-term loans - note , ,685 Long-term loan from subsidiary - note ,246 - Short-term financing , , This represents interest payable to Mortar Investments International Limited amounting to USD 1.52 million (2012: USD 1.52 million) on long-term loans previously repaid. The amount is still unpaid due to certain procedural complexities with respect to foreign remittance This represents interest payable to the Subsidiary Company on long-term loan. 24. SHORT-TERM FINANCING 24.1 The facilities for running finance available from various banks as at 31 December 2013 amounted to Rs 1.68 billion (2012: Rs 1.43 billion). These facilities carry mark-up at rates ranging from 1 month KIBOR plus 1.00 percent per annum to 3 months KIBOR plus 1.75 percent per annum and are secured by joint pari-passu hypothecation charge over all the present and future stock and book debts of the Company Foreign currency import and export finance facilities available from a local bank as at 31 December 2013 amounted to USD 10.0 million (2012: USD 10.0 million). These facilities are available at interest rates to be negotiated at the time of booking and are secured against trust receipts and / or joint pari-passu hypothecation charge over all the present and future stock and book debts of Company. Total facility was unutilised as at 31 December 2013 and LIABILITY AGAINST ASSETS SUBJECT TO FINANCE LEASE - plant and machinery Minimum lease payments Financial charges for future periods Principal outstanding Minimum lease payments Financial charges for future periods Principal outstanding Not later than one year ,687 1,028 42,
147 Notes to and Forming Part of the Financial Statements For the year ended 31 December CONTINGENCIES AND COMMITMENTS 26.1 Commitments in respect of capital expenditure as at 31 December 2013 amount to Rs million (2012: Rs 286 million) Commitments for rentals under operating lease agreements / Ijarah contracts in respect of vehicles as at 31 December are as follows: Amount in Rs 000 Year , ,570 14, ,189 10, ,215 3, ,369-60,343 46, Commitments for rentals under operating lease agreements for certain supplies in respect of goods and services as at 31 December are as follows: Year , , , , , , , , ,800 2,368,175 2,918, Commitments for rentals under operating lease agreements in respect of goods and services are stated at minimum lease payments. These are priced in foreign currency and payable in Pakistan Rupees, converted at exchange rates applicable on the date of payment Outstanding guarantees and letters of credit issued on behalf of the Company as at 31 December 2013 were Rs 1.21 billion (2012: Rs 1.41 billion) and Rs 1.28 billion (2012: Rs 342 million), respectively. 129
148 Notes to and Forming Part of the Financial Statements For the year ended 31 December REVENUE Amount in Rs Manufactured Trading Total Manufactured Trading Total goods goods goods goods Local sales 58,314, ,605 59,313,390 50,405, ,095 51,029,772 Export sales 1,900,190-1,900,190 2,033,562-2,033,562 60,214, ,605 61,213,580 52,439, ,095 53,063,334 Less: Sales tax and excise duty (2,044,882) (43,090) (2,087,972) (61) (7,207) (7,268) Price settlements and discounts (2,024,541) (31,383) (2,055,924) (231,477) (1,332) (232,809) 56,145, ,132 57,069,684 52,207, ,556 52,823, Four (2012: Four) of the Company s customers contributed towards 85% (2012: 84%) of the revenue during the year amounting to Rs billion (2012: Rs billion) and each customer individually exceeded 10% of the revenue. (Re-stated) COST OF SALES Raw and packing materials consumed: Opening stock 2,802,171 3,334,047 Purchases - note ,921,141 47,393,721 Closing stock (2,166,141) (2,802,171) 50,557,171 47,925,597 Salaries, wages and benefits - note , ,202 Stores and spares consumed 144, ,439 Lease rentals / Ijarah arrangements 12,445 11,268 Insurance 86, ,785 Oil, gas and electricity 3,134,195 2,492,496 Travelling expenses 65,192 61,284 Depreciation and amortisation 1,225,578 1,365,271 Repairs and maintenance - note , ,899 Other expenses 45,900 38,389 Cost of goods manufactured 56,105,126 52,675,630 Opening stock of manufactured goods 1,538,654 1,332,340 57,643,780 54,007,970 Closing stock of manufactured goods (735,540) (1,538,654) 56,908,240 52,469,316 Trading goods Opening stock 139,691 2,617 Purchases 804, ,833 Closing stock (71,589) (139,691) 872, ,759 57,780,354 53,035,
149 Notes to and Forming Part of the Financial Statements For the year ended 31 December This includes discount recognised during the year amounting to Rs million (2012: Nil) after renewal of a supplier s contract under the terms of the arrangement Salaries, wages and benefits include Rs million (2012: Rs million) and Rs million (2012: Rs million) in respect of defined benefit and defined contribution plans respectively Repair and maintenance includes Rs 212 million (2012: Nil) in respect of plant overhaul carried out during the year. Amount in Rs DISTRIBUTION AND SELLING EXPENSES (Re-stated) Outward freight and handling charges 53,812 69,065 Salaries and benefits - note ,330 43,924 Lease rentals / Ijarah arrangements 2,079 2,043 Repairs and maintenance 2,521 4,378 Travelling expenses 5,808 5,573 Postage and telephone 1,238 1,304 Advertising and sales promotion Other expenses 8,756 5, , , Salaries and benefits include Rs 1.83 million (2012: Rs 1.87 million) and Rs 4.05 million (2012: Rs 3.63 million) in respect of defined benefit plans and defined contribution plans respectively. 30. ADMINISTRATIVE EXPENSES (Re-stated) Salaries and benefits - note , ,236 Legal, professional and consultancy charges 15,750 15,880 Lease rentals / Ijarah arrangements 5,924 5,555 Travelling expenses 20,728 16,085 Repairs and maintenance 19,324 18,577 Expenses on information technology 14,022 10,539 Security expenses 17,118 13,980 Rent, rates and taxes 26,247 25,754 Publication and subscriptions 2,086 4,324 Postage and telephone 6,300 5,335 Printing and stationery 8,890 6,499 Other expenses 52,695 38, , ,
150 Notes to and Forming Part of the Financial Statements For the year ended 31 December 2013 Amount in Rs Salaries and benefits include Rs 7.06 million (2012: Rs 9.67 million) and Rs 7.74 million (2012: Rs 7.43 million) in respect of defined benefit plans and defined contribution plans respectively OTHER EXPENSES Auditors remuneration - note ,698 4,097 Donations - note ,072 8,953 Loss on retirement of property, plant and equipment 106 3,640 Provision for obsolete stores and spares 5,114 4,771 Workers welfare fund - note ,572 - Others 1, ,567 22, Auditors remuneration Audit fee 2,100 1,900 Taxation Limited reviews, audit of consolidated financial statements, certain funds for staff retirement benefits, group reporting and various certifications 1,480 1,630 Out of pocket expenses ,698 4, Donations include payments in respect of the following: Community services 3,550 3,178 Education 1,852 3, None of the directors or their spouse had any interest in the donee This includes Rs 10.3 million in respect of tax year
151 Notes to and Forming Part of the Financial Statements For the year ended 31 December 2013 Amount in Rs OTHER INCOME Scrap sales 8,226 22,280 Dividend received from subsidiary 810, ,000 Recoveries against provision made in prior year for sales tax refundable - 29,825 Service fee from subsidiary - note 38 16,800 8,400 Liabilities no longer payable written back 42,659 16,700 Return on bank deposits 91, ,970 Others 871 1, , , FINANCE COSTS Interest / mark-up on: - short-term financing workers profit participation fund - 3,433 - finance lease - note ,385 - long term loans from parent company - 20,381 - long term loan from subsidiary company 45,803 - Discounting charges on trade debts 40,562 7,552 Exchange loss - net 31,446 70,068 Bank charges 8,659 10, , , This includes contingent rent of Rs Nil (2012: Rs million) recognised as an expense during the year which is determined by the movement in UK Consumer Price Index. (Re-stated) TAXATION Current - for the year 569, ,421 - for prior year 2,678 32, , ,748 Deferred (374,252) (367,843) 197,936 (61,095) 34.1 Current taxation expense for the year is subject to minimum tax charged at 1% of taxable turnover which is adjustable against the tax liability of succeeding five years. The Company, however, on prudence has not recognised the related deferred tax asset in view of taxable loss for the year. 133
152 Notes to and Forming Part of the Financial Statements For the year ended 31 December 2013 Amount in Rs Reconciliation of income tax expense for the year (Re-stated) Loss before taxation (348,166) (242,019) Applicable tax rate 34% 35% Tax calculated at the applicable tax rate (118,376) (84,707) Tax effect of : - permanent differences (241,691) (32,620) - minimum tax 542, tax credits (21,654) (16,852) - income chargeable to tax under FTR basis 61,546 40,757 - prior year tax charge 2,678 32,327 - change in tax rate (27,228) CASH GENERATED FROM OPERATIONS 197,936 (61,095) Loss before taxation (348,166) (242,019) Adjustments for non cash charges and other items: Depreciation and amortisation 1,225,578 1,365,271 Loss on retirement of property, plant and equipment 106 3,640 Provision for staff retirement benefit scheme 21,212 24,139 Finance costs 95,389 86,912 Unrealised exchange loss on current maturity of long-term loan and current portion of liability against assets subject to finance lease - 100,572 Mark-up accrued on bank deposits (91,497) (269,970) Provision for infrastructure cess 204, ,518 1,455,182 1,511,082 1,107,016 1,269,063 Effect on cashflows due to working capital changes Decrease / (increase) in current assets Stores and spares (66,745) (33,280) Stock-in-trade 1,507, ,488 Trade debts 520,031 (157,116) Loans and advances 8,152 7,807 Trade deposits and short-term prepayments (1,929) 66,994 Other receivables and tax refunds 263,834 (282,675) 2,230,589 (209,782) (Decrease) / increase in trade and other payables (655,849) 172,096 Cash generated from operations 2,681,756 1,231,
153 Notes to and Forming Part of the Financial Statements For the year ended 31 December EARNINGS PER SHARE - basic and diluted Amount in Rs 000 (Re-stated) Loss for the year after tax (546,102) (180,924) Number of shares Weighted average ordinary shares in issue during the year 1,514,207,208 1,514,207,208 Earnings per share (in Rupees) (0.36) (0.12) There is no dilutive effect on the basic earnings per share of the Company. 37. REMUNERATION OF DIRECTORS AND EXECUTIVES The aggregate amounts charged in the financial statements for remuneration, including all benefits, to the Chief Executive, Directors and Executives of the Company were as follows: Chief Executive Executive Directors Executives Managerial remuneration 15,636 14,552 13,547 11, , ,777 Retirement benefits 5,520 7, ,881 48,305 Group insurance Rent and house maintenance ,924 3,380 58,002 55,676 Utilities ,612 11,974 Medical expenses ,276 9,868 21,598 22,389 17,529 14, , ,597 Number of persons In addition to the above, amount charged in the financial statements for remuneration and fee to the non-executive directors, were Rs 0.6 million (2012: Rs 0.6 million) and Rs million (2012: Rs million) respectively An amount of Rs million (2012: Rs million) on account of variable pay has been recognised in the financial statements. This amount is payable in 2014 after verification of target achievements. Out of variable pay recognised for 2012, following payments were made: Paid in 2013 Paid in 2012 relating to relating to Chief Executive 3,006 5,722 Executives 37,257 68,237 Other employees 4,480 7,713 44,743 81, The Chief Executive, Executive Directors and certain Executives are provided with free use of Company maintained cars in accordance with their entitlements. 135
154 Notes to and Forming Part of the Financial Statements For the year ended 31 December TRANSACTIONS WITH RELATED PARTIES 38.1 The related parties comprise parent company, related group companies, directors of the Company, companies where directors also hold directorships, key management personnel and staff retirement funds. Details of transactions with related parties, other than those which have been specifically disclosed elsewhere in these financial statements are as follows: Amount in Rs 000 Relationship Nature of transaction Parent company Repayment of loan - 1,878,950 Payment of interest on loan - 23,696 Purchase of goods 1,496, ,986 Purchase of services - 4,071 Amount payable - 346,486 Subsidiary company Purchase of shares against transfer of asset - 4,153,078 Purchase of shares against cash - 346,922 Purchase of electricity and steam energy 2,418,192 1,304,407 Transfer of spares 73,953 16,661 Fee for providing of services to Subsidiary company 16,800 8,400 Associates Purchase of services - 33 Key management personnel Salaries and other short term benefits 71,551 71,457 Post employment benefit 11,737 13,142 Others Payment to staff retirement benefit funds 52,288 57,
155 Notes to and Forming Part of the Financial Statements For the year ended 31 December The plant and machinery of the Subsidiary is situated at the leasehold land of the Company. No amount is charged in this respect by the Company to the Subsidiary The Company has agreement with the Subsidiary for purchase of electricity and steam energy. The tariffs are determined in light of guidelines of National Electric Power Regulatory Authority Licensing (Generation) Rules, The Company has another agreement for certain technical and administrative services rendered by the Company to its subsidiary under a service level agreement. Further, various expenses incurred on behalf of the Subsidiary are reimbursed to the Company on monthly basis The related party status of outstanding balances as at 31 December 2013 is included in long term loan from subsidiary, other receivables, trade and other payables and interest accrued respectively. These are settled in ordinary course of business. 39. CAPACITY AND PRODUCTION - in metric tonnes Annual name plate capacity 506, ,750 Production 480, ,941 The current Production is based on 95% Plant availability. This was mainly due to a 22 days outage during the year due to overhauling of the plant which is carried out periodically. Last year there was a temporary shutdown of a supplier manufacturing facility. 40. FINANCIAL INSTRUMENTS AND RELATED DISCLOSURES The Company s activities expose it to a variety of financial risks: credit risk, liquidity risk and market risk (including currency interest rate and price risks). The Company s overall risk management policy focuses on the unpredictability of financial markets and seeks to minimise potential adverse effects on the Company s financial performance Risk management framework The Board of Directors has overall responsibility for the establishment and over sight of the Company s risk management framework. The executive management team is responsible for developing and monitoring the Company s risk management policies. The team regularly meets and any changes and compliance issues are reported to the Board of Directors through the audit committee. Risk management systems are reviewed regularly by the executive management team to reflect changes in market conditions and the Company s activities. The Company, through its training and management standards and procedures, aims to develop a disciplined and constructive control environment in which all employees understand their roles and obligations. The audit committee oversees compliance by management with the Company s risk management policies and procedures, and reviews the adequacy of the risk management framework in relation to the risks faced by the Company. 137
156 Notes to and Forming Part of the Financial Statements For the year ended 31 December 2013 Financial assets and liabilities by category and their respective maturities Amount in Rs 000 Maturity up to one year Interest bearing Non-interest bearing Total Maturity Total Maturity Maturity Total after one up to one after one year year year Financial assets Loans and receivables Loans and advances ,644 41,297 65,941 65,941 Deposits - 24,272 24,272 27,721 16,252 43,973 68,245 Trade debts ,780,329-2,780,329 2,780,329 Mark-up accrued on bank deposits ,940-4,940 4,940 Other receivables ,333-86,333 86,333 Cash and bank balances 2,401,350-2,401,350 25,389-25,389 2,426, December ,401,350 24,272 2,425,622 2,949,356 57,549 3,006,905 5,432, December 2012 (Re-stated) 171,950 24, ,222 3,543,388 63,209 3,606,597 3,802,819 Financial liabilities At amortised cost Trade and other payables ,433,139-7,433,139 7,433,139 Long-term loan - 400, , ,000 Interest accrued , , , December , ,000 7,618,446-7,618,446 8,018, December ,659-42,659 8,002,315-8,002,315 8,044,974 On balance sheet date gap 31 December ,401,350 (375,728) 2,025,622 (4,669,090) 57,549 (4,611,541) (2,585,919) 31 December 2012 (Re-stated) 129,291 24, ,563 (4,458,927) 63,209 (4,395,718) 4,242,155) OFF BALANCE SHEET ITEMS Letter of credits / guarantees 1,435,092 Operating lease liability 2,428, December ,911,475 The carrying values of all financial assets and liabilities reflected in the financial statements approximate their fair values Credit risk Credit risk is the risk of financial loss to the Company if a customer or counterparty to a financial instrument fails to meet its contractual obligations and arises principally from the Company s receivables from customers and deposits with banks. 138
157 Notes to and Forming Part of the Financial Statements For the year ended 31 December 2013 Trade and other receivables The Company s exposure to credit risk is influenced mainly by the individual characteristics of each customer. To reduce exposure to credit risk, substantially all the sales are made against letters of credit. Approximately 34 percent (2012: 28 percent) of the Company s revenue is attributable to sales transactions with a single customer. However, geographically there is no concentration of credit risk. The Board has established a credit policy under which each new customer is analysed individually for credit worthiness before the Company s standard payment and delivery terms and conditions are offered. The Company s review includes external ratings, when available. The customers associated with the Company for four years have contributed more than 95% of the revenue and losses have occurred infrequently. The maximum exposure to credit risk as at 31 December was: Amount in Rs 000 Financial assets (Restated) Loans and advances 86,339 98,267 Deposits 68,245 92,476 Trade debts 2,780,329 3,300,360 Mark-up accrued on bank deposits 4, Other receivables 86, ,027 Bank balances 2,418, ,388 5,444,807 3,812,560 Secured 2,780,329 3,300,360 Unsecured 2,664, ,200 5,444,807 3,812,560 Not past due 5,444,807 3,812,560 The maximum exposure to credit risk for trade debts as at 31 December by geographic region was: Domestic 2,780,329 3,300,360 The Company has placed its funds with banks which are rated AA or above by PACRA/ JCR VIS. 139
158 Notes to and Forming Part of the Financial Statements For the year ended 31 December Liquidity risk Liquidity risk is the risk that the Company will encounter difficulty in meeting the obligations associated with its financial liabilities that are settled by delivering cash or another financial assets. The Company s approach to managing liquidity is to ensure, as far as possible, that it will always have sufficient liquidity to meet its liabilities when due, under both normal and stressed conditions, without incurring unacceptable losses or risking damage to the Company s reputation. The table below analyses the Company s financial liabilities into relevant maturity groupings based on the remaining period at the balance sheet to the maturity date. Amount in Rs 000 Carrying amount Contractual cash flows 31 December 2013 Less than one year 1-2 years 2-3 years 3-5 years Financial Liabilities Long-term loan from subsidiary 400, ,000 Trade and other payables 7,433,139 7,433,139 7,433, Interest accrued 185, , , Off balance sheet Operating lease liabilities - 2,428,518-1,225, , ,557 8,018,446 10,046,964 7,618,446 1,225, , ,557 It is not expected that the cash flows included in the maturity analysis could occur significantly earlier, or at significantly different amounts. The Company manages liquidity risk by maintaining sufficient cash in bank accounts. At 31 December 2013, the Company had financial assets of Rs 5.45 billion (2012: Rs 3.81 billion), which include Rs 2.42 billion (2012: Rs 0.22 billion) of cash placed in bank accounts Market risk Market risk is the risk that the fair value or future cash flows of a financial instrument will fluctuate because of changes in the market price. Market risk comprises of three types of risks: currency risk, interest rate risk and other price risk Currency risk Currency risk arises mainly where receivables and payables exist due to transactions based on currencies other than Pakistan Rupees. The Company is exposed to currency risk on receivables, payables and borrowings that are in a currency other than Pakistan Rupees. 140
159 Notes to and Forming Part of the Financial Statements For the year ended 31 December 2013 The currency exposure in Pakistan Rupees at the year end was as follows: Financial liabilities GBP Euro US$ GBP Euro US$ Equivalent Rs Trade payables (1,225) (1,128,252) (2,332,337) (6,809) (6,098) (5,165,621) Liability against assets subject to finance lease (42,659) - - (1,225) (1,128,252) (2,332,337) (49,468) (6,098) (5,165,621) Operating lease liability (off balance sheet) - - (2,368,175) (44,492) - (2,864,446) Significant exchange rates applied during the year were as follows: Average rate for the year Spot rate as at 31 December Rupees Rupees US Dollar Great Britain Pound Sterling Euro Sensitivity analysis Every 1% increase or decrease in exchange rate, with all other variables held constant, will decrease or increase loss before tax for the year by Rs million (2012: Rs million) Interest rate risk Interest rate risk represents the risk that the fair value or future cash flows of a financial instrument will fluctuate because of changes in market interest rates. At the reporting date the interest rate profile of the Company s interest-bearing financial instruments was: Amount in Rs 000 Fixed rate instruments Carrying amount Financial assets 2,425, ,222 Variable rate instruments Financial liabilities 400,000 42,
160 Notes to and Forming Part of the Financial Statements For the year ended 31 December 2013 Sensitivity analysis for fixed rate instruments The Company does not account for any fixed rate financial assets and liabilities at fair value through the profit and loss account. Therefore a change in interest rates at the reporting date would not affect materially profit or loss for the year. Sensitivity analysis for variable rate instruments If KIBOR had been 10% higher / lower with all other variables held constant, the impact on the loss after tax for the year would not have been material Price Risk Price risk is the risk that the value of a financial instrument will fluctuate as a result of changes in market prices, whether those changes are caused by factors specific to the fund issuing that financial instruments, or its management company. 41. CAPITAL RISK MANAGEMENT The Company s objective when managing capital is to safeguard its ability to continue as a going concern in order to provide returns for shareholders and benefit for other stakeholders and to maintain an optimal structure to reduce the cost of capital. The gearing ratio as at 31 December 2013 and 2012 are as follows: Amount in Rs 000 (Re-stated) Debt 400,000 - Equity 11,577,259 12,120,553 Total equity and debt 11,977,259 12,120,553 Gearing ratio 3% PROVIDENT FUND RELATED DISCLOSURES The following information is based on latest un-audited financial statements of the Fund: Size of the fund - Total assets 284, ,701 Percentage of investments made 96% 92% Fair value of investments 272, ,025 The cost of above investments amounted to Rs million (2012: Rs million). 142
161 Notes to and Forming Part of the Financial Statements For the year ended 31 December 2013 The break-up of fair value of investments is as follows: Percentage Rupees 000 Shares in listed companies 15.1% 19.6% 41,206 47,772 Bank deposits 2.1% 2.3% 5,617 5,688 Government securities 82.8% 74.4% 226, ,495 Debt securities - 3.7% - 9,069 The investments out of provident fund have been made in accordance with the provisions of Section 227 of the Companies Ordinance, 1984 and the rules formulated for this purpose. 43. NUMBER OF EMPLOYEES Number of employees at 31 December Average number of employees during the year GENERAL Figures have been rounded-off to the nearest thousand rupees except as stated otherwise. 45. CORRESPONDING FIGURES Corresponding figures have been re-arranged wherever necessary for purposes of better presentation as follows: Reclassification from component Reclassification to component Amount in Rs 000 Finance income Other income - Return on bank deposits - Return on bank deposits 269,970 Finance costs Finance costs - Interest on long term loan - Exchange loss - net 10,926 from parent company 46. DATE OF AUTHORISATION These financial statements were authorised for issue in the Board of Directors meeting held on 28 January Changgyou Kim Chairman M Asif Saad Chief Executive 143
162
163
164
165
166 Auditors Report to the Members We have audited the annexed consolidated financial statements comprising consolidated Balance Sheet of Lotte Chemical Pakistan Limited [formerly Lotte Pakistan PTA Limited] (the Holding Company) and its subsidiary company Lotte Powergen (Private) Limited as at 31 December 2013 and the related consolidated Profit and Loss Account, consolidated Statement of Comprehensive Income, consolidated Cash Flow Statement and consolidated Statement of Changes in Equity together with the notes forming part thereof, for the year then ended. We have also expressed separate opinions on the financial statements of Lotte Chemical Pakistan Limited and its subsidiary company. These financial statements are the responsibility of the Holding Company s management. Our responsibility is to express an opinion on these financial statements based on our audit. Our audit was conducted in accordance with the International Standards on Auditing and accordingly included such tests of accounting records and such other auditing procedures as we considered necessary in the circumstances. In our opinion, the consolidated financial statements present fairly the financial position of Lotte Chemical Pakistan Limited and its subsidiary company as at 31 December 2013 and the results of their operations for the year then ended in accordance with the approved accounting standards as applicable in Pakistan. A. F. Ferguson & Co., Chartered Accountants Karachi Dated: 17 February 2014 Name of Engagement Partner: Farrukh Rehman 148
167 Consolidated Balance Sheet As at 31 December 2013 Amount in Rs 000 ASSETS NON-CURRENT ASSETS (Re-stated) (Re-stated) Note Fixed assets 5 8,713,584 10,065,769 9,852,587 Long-term loans and advances 6 41,297 46,957 46,937 Long-term deposits and prepayments 7 64,011 79, ,212 8,818,892 10,191,973 9,999,736 CURRENT ASSETS Stores and spares 8 840, , ,745 Stock-in-trade 9 2,961,089 4,440,877 4,669,004 Trade debts 10 2,780,329 3,300,360 3,143,244 Loans and advances 11 24,644 32,796 40,603 Trade deposits and short-term prepayments 12 94,333 92, ,398 Mark-up accrued on bank deposits 7, ,831 Other receivables 13 33,846 91, ,625 Tax refunds due from government - sales tax , , ,872 Taxation - payments less provision 868, , ,264 Cash and bank balances 15 3,068, ,990 4,505,251 11,077,929 10,866,869 13,886,837 TOTAL ASSETS 19,896,821 21,058,842 23,886,
168 Amount in Rs 000 (Re-stated) (Re-stated) Note EQUITY SHARE CAPITAL AND RESERVES Share capital 16 15,142,072 15,142,072 15,142,072 Capital reserves 17 2,345 2,345 2,345 Accumulated losses (3,334,528) (2,839,352) (2,100,448) 11,809,889 12,305,065 13,043,969 LIABILITIES NON-CURRENT LIABILITIES Liability against assets subject to finance lease ,039 Deferred tax , ,789 1,123,353 Retirement benefit obligation 20 45,002 43,668 65, , ,457 1,226,408 CURRENT LIABILITIES Trade and other payables 21 7,490,992 7,756,976 7,479,634 Current maturity of long-term loans - - 1,801,150 Interest accrued , , ,074 Short-term financing Current portion of liability against assets subject to finance lease 18-42, ,338 7,652,053 7,947,320 9,616,196 TOTAL LIABILITIES 8,086,932 8,753,777 10,842,604 Contingencies and commitments 24 TOTAL EQUITY AND LIABILITIES 19,896,821 21,058,842 23,886,573 The annexed notes 1 to 44 form an integral part of these consolidated financial statements. Changgyou Kim Chairman M Asif Saad Chief Executive 150
169 Consolidated Profit and Loss Account For the year ended 31 December 2013 Amount in Rs 000 (Re-stated) Note Revenue 25 57,069,684 52,823,257 Cost of sales 26 (56,920,556) (52,614,280) Gross profit 149, ,977 Distribution and selling expenses 27 (120,104) (132,191) Administrative expenses 28 (331,932) (303,595) Other expenses 29 (93,816) (46,500) Other income , ,856 Finance costs 31 (83,664) (146,054) Loss before taxation (300,048) (57,507) Taxation 32 (197,936) 61,095 (Loss) / profit after taxation (497,984) 3,588 Earnings per share - basic and diluted (in Rupees) 34 (0.33) The annexed notes 1 to 44 form an integral part of these consolidated financial statements. Changgyou Kim Chairman M Asif Saad Chief Executive 151
170 Consolidated Statement of Comprehensive Income For the year ended 31 December 2013 Amount in Rs 000 (Re-stated) Note (Loss) / profit after taxation (497,984) 3,588 Other comprehensive income: Items that will not be reclassified to Profit or Loss Remeasurements of post employment benefit obligations 20 4,148 21,891 Impact of deferred tax (1,340) (7,279) 2,808 14,612 Items that may be subsequently reclassified to Profit or Loss - - Total comprehensive (loss) / income for the year (495,176) 18,200 The annexed notes 1 to 44 form an integral part of these consolidated financial statements. Changgyou Kim Chairman M Asif Saad Chief Executive 152
171 Consolidated Cash Flow Statement For the year ended 31 December 2013 Amount in Rs 000 (Re-stated) Note CASH FLOWS FROM OPERATING ACTIVITIES Cash generated from operations 33 3,022,272 1,520,297 Long-term loans and advances - net 5,660 (20) Long-term deposits and prepayments - net 15,236 20,965 Finance costs paid (38,842) (75,789) Payments to staff retirement benefit scheme (16,510) (23,623) Taxes paid (770,389) (799,774) Mark-up received from bank deposits 121, ,886 Net cash generated from operating activities 2,339, ,942 CASH FLOWS FROM INVESTING ACTIVITIES Payments for capital expenditure (150,371) (1,720,529) Net cash used in investing activities (150,371) (1,720,529) CASH FLOWS FROM FINANCING ACTIVITIES Payments for liability against assets subject to finance lease - (217,002) Repayment of long term loan - (1,878,950) Dividend paid (123) (754,722) Net cash used in financing activities (123) (2,850,674) Net increase / (decrease) in cash and cash equivalents 2,188,683 (3,625,261) Cash and cash equivalents at the beginning of the year 879,990 4,505,251 Cash and cash equivalents at the end of the year 3,068, ,990 The annexed notes 1 to 44 form an integral part of these consolidated financial statements. Changgyou Kim Chairman M Asif Saad Chief Executive 153
172 Consolidated Statement of Changes in Equity For the year ended 31 December 2013 Amount in Rs 000 Issued, subscribed and paid-up capital Capital reserves Accumulated loss Total equity Balance as at 1 January 2012 as previously reported 15,142,072 2,345 (2,061,717) 13,082,700 Effect of change in accounting policy with respect to accounting for recognition of actuarial losses on defined benefit plan - net of - tax - note (38,731) (38,731) Balance as at 1 January restated 15,142,072 2,345 (2,100,448) 13,043,969 Final cash dividend for the year ended 31 December Rs 0.5 per share - - (757,104) (757,104) Total comprehensive income for the year ended 31 December Profit for the year ended 31 December ,588 3,588 - Other comprehensive income for the year ended 31 December ,612 14, ,200 18,200 Balance as at 1 January restated 15,142,072 2,345 (2,839,352) 12,305,065 Total comprehensive loss for the year ended 31 December Loss for the year ended 31 December (497,984) (497,984) - Other comprehensive Income for the year ended 31 December ,808 2, (495,176) (495,176) Balance as at 31 December ,142,072 2,345 (3,334,528) 11,809,889 The annexed notes 1 to 44 form an integral part of these consolidated financial statements. Changgyou Kim Chairman M Asif Saad Chief Executive 154
173 Notes to and Forming Part of the Consolidated Financial Statements For the year ended 31 December STATUS AND NATURE OF BUSINESS The Group consists of: i) Lotte Chemical Pakistan Limited (formerly Lotte Pakistan PTA Limited) (the Company) ii) Lotte Powergen (Private) Limited (the Subsidiary) The Subsidiary is a wholly owned subsidiary of the Company. The Parent company of the Group is Lotte Chemical Corporation and the ultimate parent company of the Group is South Korean conglomerate Lotte. The Company is a limited liability company incorporated in Pakistan and is listed on the Karachi, Lahore and Islamabad Stock Exchanges, and is engaged in the manufacture and sale of Pure Terephthalic Acid (PTA). The Subsidiary is engaged in generation and sale of electricity and steam to the Company. The Subsidiary was incorporated in Pakistan on 29 February During the year, National Electric Power Regulatory Authority has issued generation license to the Subsidiary on 26 November Basis of consolidation The consolidated financial statements include the financial statements of Lotte Chemical Pakistan Limited (formerly Lotte Pakistan PTA Limited) and Lotte Powergen (Private) Limited. The financial statements of the Subsidiary have been consolidated on a line by line basis. All inter-company transactions have been eliminated. 2. SUMMARY OF SIGNIFICANT ACCOUNTING POLICIES The principal accounting policies applied in the preparation of these financial statements are set out below. These policies have been consistently applied to all the years presented, except as stated in note Basis of preparation Statement of compliance These financial statements have been prepared in accordance with approved accounting standards as applicable in Pakistan. Approved accounting standards comprise such International Financial Reporting Standards (IFRS) issued by the International Accounting Standards Board and Islamic Financial Accounting Standards (IFAS) issued by the Institute of Chartered Accountants of Pakistan as are notified under the Companies Ordinance, 1984 and provisions of and directives issued under the Companies Ordinance, In case requirements differ, the provisions of or directives issued under the Companies Ordinance, 1984 (the Ordinance) have been followed. 155
174 Notes to and Forming Part of the Consolidated Financial Statements For the year ended 31 December Changes in accounting standards, interpretations and pronouncements a) Standards, interpretations and amendments to published approved accounting standards that are effective and relevant The amendments to following standards have been adopted by the Group for the first time for the financial year beginning on 1 January 2013: Amendment to IAS 1, Financial Statement Presentation regarding other comprehensive income. The main change resulting from these amendments is a requirement for entities to group items presented in other comprehensive income (OCI) on the basis of whether they are potentially reclassifiable to profit or loss subsequently (reclassification adjustments). The new amendment is not expected to materially affect the disclosures in the financial statements of the Group. IAS 19, Employee Benefits was revised in June The changes on the Group s accounting policies has been as follows: to immediately recognise all past service costs; and to replace interest cost and expected return on plan assets with a net interest amount that is calculated by applying the discount rate to the net defined benefit liability (asset). See note 4 for the impact on the financial statements. b) Standards, interpretations and amendments to published approved accounting standards that are effective but not relevant The other new standards, amendments and interpretations that are mandatory for accounting periods beginning on or after 1 January 2013 are considered not to be relevant for the Group s financial statements and hence have not been detailed here. c) Standards, interpretations and amendments to published approved accounting standards that are not yet effective but relevant There are no new standards, amendments to existing approved accounting standards and new interpretations that are not yet effective that would be expected to have a material impact on the financial statements of the Group. 2.2 Overall valuation policy These financial statements have been prepared under the historical cost convention, except that certain exchange elements have been incorporated in the cost of the relevant operating property, plant and equipment upto 4 July Fixed assets Property, plant and equipment and depreciation Operating property, plant and equipment are stated at cost less accumulated depreciation and impairment losses (if any). Cost of certain items of operating property, plant and equipment comprises historical cost, exchange differences referred to in note 2.2 and the cost of borrowings during the construction period in respect of loans taken for the PTA construction project. 156
175 Notes to and Forming Part of the Consolidated Financial Statements For the year ended 31 December 2013 Renewals and improvements are included in an asset s carrying amount or are recognised as a separate asset, as appropriate, only when it is probable that future economic benefits associated with the item will flow to the Group and the cost of the item can be measured reliably. All other expenses are charged to income during the financial period in which they are incurred. Depreciation charge is based on the straight-line method whereby the cost of an asset is written off to profit and loss account over its estimated useful life, from the date the asset is available for use. The cost of leasehold land is amortised in equal instalments over the lease period. When parts of an item of property, plant and equipment have different useful lives, they are accounted for as separate items (major components) of property, plant and equipment. The residual value, depreciation method and the useful lives of each part of property, plant and equipment that is significant in relation to the total cost of the asset are reviewed, and adjusted if appropriate, at each balance sheet date. Gains and losses on disposal of assets are taken to the profit and loss account Intangible assets and amortisation Intangible assets are stated at cost less accumulated amortisation and impairment, if any. Major computer software licences are capitalised on the basis of cost incurred to acquire and bring to use the specific software. These costs are amortised over their estimated useful life of five years using the straight-line method. Full month s amortisation is charged in the month of acquisition and no amortisation is charged in the month of disposal. Costs associated with maintaining computer software programmes are recognised as an expense as and when incurred. 2.4 Stores and spares Stores and spares are stated at the lower of weighted average cost and net realisable value. 2.5 Stock-in-trade Stock-in-trade is valued at the lower of cost and net realisable value. Cost is determined using the weighted average method, except for in transit which comprises invoice value and the direct charges in respect thereof. Manufactured finished goods include prime cost and an appropriate portion of production overheads. Net realisable value signifies the estimated selling price in the ordinary course of business less costs necessarily to be incurred to make the sale. 2.6 Trade debts and other receivables Trade debts are recognised initially at original invoice amount and subsequently measured at amortised cost less provision for impairment, if any. Other receivables are stated at amortised cost less provision for impairment. 157
176 Notes to and Forming Part of the Consolidated Financial Statements For the year ended 31 December Cash and cash equivalents Cash and cash equivalents comprise cash in hand, short term fixed deposits having maturity upto three months and current accounts held with commercial banks. Running finance and short term finance facilities availed by the Group, which are payable on demand and form an integral part of the Group s cash management are included as part of cash and cash equivalents for the purpose of statement of cash flows. 2.8 Impairment Financial assets A financial asset is assessed at each reporting date to determine whether there is any objective evidence that it is impaired. A financial asset is considered to be impaired if objective evidence indicates that one or more events have had a negative effect on the estimated future cash flows of that asset. The Group considers evidence of impairment for receivables and other financial assets at specific asset levels. Losses are recognised as an expense in the profit and loss account. When a subsequent event causes the amount of impairment loss to decrease, this reduction is reversed through the profit and loss account Non-financial assets The carrying amounts of non-financial assets other than inventories and deferred tax asset, are assessed at each reporting date to ascertain whether there is any indication of impairment. If any such indication exists, then the asset s recoverable amount is estimated. An impairment loss is recognised as an expense in the profit and loss account for the amount by which the asset s carrying amount exceeds its recoverable amount. The recoverable amount is the higher of an asset s fair value less cost to sell and value in use. Value in use is ascertained through discounting of the estimated future cash flows using a discount rate that reflects current market assessment of the time value of money and the risk specific to the assets. For the purpose of assessing impairment, assets are grouped at the lowest levels for which there are separately identifiable cash flows (cash-generating units). An impairment loss is reversed if there has been a change in the estimates used to determine the recoverable amount. An impairment loss is reversed only to the extent that the asset s carrying amount does not exceed the carrying amount that would have been determined, net of depreciation or amortisation, if no impairment loss had been recognised. Prior impairments of non-financial assets (other than goodwill) are reviewed for possible reversal at each reporting date. 2.9 Trade and other payables Trade and other payables, excluding provisions are carried at the fair value of the consideration to be paid for goods and services Provisions A provision is recognised when the Group has a legal or constructive obligation as a result of a past event, and it is probable that an outflow of economic benefits will be required to settle the obligation and a reliable estimate of that can be made. 158
177 Notes to and Forming Part of the Consolidated Financial Statements For the year ended 31 December Offsetting Monetary assets and liabilities are offset and the net amount is reported in the financial statements only when there is a legally enforceable right to set-off the recognised amounts and the Group intends either to settle on a net basis, or to realise the assets and to settle the liabilities simultaneously Lease payments Payments made under operating leases / Ijarah contracts are recognised in the profit and loss account on a straight-line basis over the term of the lease. Lease incentives received are recognised as an integral part of the total lease expense, over the term of the lease. Minimum lease payments made under finance leases are apportioned between the finance expense and the reduction of the outstanding liability. The finance expense is allocated to each period during the lease term so as to produce a constant periodic rate of interest on the remaining balance of the liability. Contingent lease payments are accounted for by revising the minimum lease payments over the remaining term of the lease when the lease adjustment is confirmed. At the inception of an arrangement, the Group determines whether such an arrangement is or contains a lease. A specific asset is the subject of a lease if fulfilment of the arrangement is dependent on the use of that specified asset. An arrangement conveys the right to use the asset if the arrangement conveys to the Group the right to control the use of the underlying asset. At inception or upon reassessment of the arrangement, the Group separates payments and other consideration required by such an arrangement into those for the lease and those for other elements on the basis of their relative fair values. If the Group concludes for a finance lease that it is impracticable to separate the payments reliably, an asset and a liability are recognised at an amount equal to the fair value of the underlying asset. Subsequently the liability is reduced as payments are made and an imputed finance charge on the liability is recognised using the Group s incremental borrowing rate Staff retirement benefits Defined benefit plans The Group operates an approved funded defined benefit gratuity scheme for all permanent employees. Minimum qualifying period for entitlement to gratuity is five years continuous service with the Group. The Group also has an approved funded defined benefit pension scheme for all management staff who joined the Group before 1 May The Group also has an unfunded medical scheme to provide post retirement medical benefits to members of its pension fund. Contributions to all schemes are made periodically on the basis of recommendations of the actuary and in line with the provisions of the Income Tax Ordinance,
178 Notes to and Forming Part of the Consolidated Financial Statements For the year ended 31 December 2013 The liability recognised in the balance sheet in respect of defined benefit retirement plans is the present value of the defined benefit obligation at the end of the reporting period less the fair value of plan assets. The defined benefit obligation is calculated annually by independent actuary using the projected unit credit method. The present value of the defined benefit obligation is determined by discounting the estimated future cash outflows using interest rates of high-quality corporate bonds that are denominated in the currency in which the benefits will be paid, and that have terms to maturity approximating to the terms of the related pension obligation. Actuarial gains and losses arising from experience adjustments and changes in actuarial assumptions are charged or credited to equity in other comprehensive income in the period in which they arise. Past-service costs are recognised immediately in income Defined contribution plans The Group operates a provident fund scheme for all its permanent employees. Equal monthly contributions are made to the fund, both by the Group and the employees at the rate of 10 percent of basic salary and cost of living allowance wherever applicable. The Group has no further payment obligations once the contributions have been paid. The contributions are recognised as employee benefit expense when they are due. Prepaid contributions are recognised as an asset to the extent that a cash refund or a reduction in the future payments is available. The Group also operates a defined contribution superannuation fund for its management staff who joined the Group on or after 1 May 2004 and for those who opted out of the defined benefit pension scheme. Contributions are made at the rate of 10.6 percent of basic salary of the members of the fund Dividend 2.15 Taxation Current Dividend distribution to the Group s shareholders is recognised as a liability in the period in which the dividend is approved. Income tax expense comprises current and deferred tax. Income tax expense is recognised in the profit and loss account, except to the extent that it relates to items recognised in other comprehensive income or directly in equity. In this case, the tax is also recognised in other comprehensive income or directly in equity. Provision for current taxation is based on taxable income / turnover at the enacted or substantively enacted rates of taxation after taking into account available tax credits and rebates, if any. The charge for current tax includes adjustments to charge for prior years, if any. 160
179 Notes to and Forming Part of the Consolidated Financial Statements For the year ended 31 December Deferred Deferred tax is recognised using the balance sheet method, providing for temporary differences between the carrying amounts of assets and liabilities for financial reporting purposes and the amounts used for taxation purposes. Deferred tax is not recognised on the initial recognition of assets or liabilities in a transaction that is not a business combination and that affects neither accounting nor taxable profit at the time of the transaction. Deferred tax is measured at the tax rates that are expected to be applied to the temporary differences when they reverse, based on the laws that have been enacted or substantively enacted by the reporting date. A deferred tax asset is recognised to the extent that it is probable that future taxable profits will be available against which temporary differences can be utilised. Deferred tax assets are reviewed at each reporting date and are reduced to the extent that it is no longer probable that the related tax benefit will be realised Foreign currency transactions Transactions denominated in foreign currencies are translated to Pakistan Rupees at the exchange rate ruling at the date of transaction. Monetary assets and liabilities in foreign currencies at balance sheet date are translated into Pakistan Rupees at exchange rates ruling on that date. Foreign exchange gains and losses resulting from the settlement of such transactions and from the translation at year-end exchange rates of monetary assets and liabilities denominated in foreign currencies are recognised in the income statement. In respect of foreign currency loans obtained for acquisition of operating property, plant and equipment, the exchange differences on principal amount upto 4 July 2004 were included in the cost of relevant operating property, plant and equipment. All exchange differences, effective 5 July 2004, are taken to the profit and loss account, due to amendments in the Fourth Schedule to the Ordinance Revenue recognition Revenue from the sale of goods is recognised on despatch of goods i.e. when the significant risks and rewards of ownership are transferred to the customer Interest income Profit on funds invested is recognised as it accrues in the profit and loss account, using the effective interest method Borrowings and their cost Borrowings are recognised initially at fair value, net of transaction cost incurred. Borrowing costs are recognised as an expense in the period in which these are incurred except to the extent of borrowing costs that are directly attributable to the acquisition, construction or production of a qualifying asset. Such borrowing costs, if any, are capitalised as part of the cost of that asset. 161
180 Notes to and Forming Part of the Consolidated Financial Statements For the year ended 31 December Earnings per share The Group presents earnings per share (EPS) data for its ordinary shares. EPS is calculated by dividing the profit or loss attributable to ordinary shareholders of the Group by the weighted average number of ordinary shares outstanding during the period Functional and presentation currency These financial statements are presented in Pakistan Rupees which is the functional currency of the Group and figures are rounded off to the nearest thousands of Rupees. 3. CRITICAL ACCOUNTING ESTIMATES AND JUDGEMENTS Estimates and judgements are continually evaluated and are based on historical experience and other factors, including expectations of future events that are believed to be reasonable under the circumstances. 3.1 Critical accounting estimates and assumptions The Group makes estimates and assumptions concerning the future. The resulting accounting estimates will, by definition, seldom equal the related actual results. The estimates and assumptions that have a significant risk of causing a material adjustment to the carrying amounts of assets and liabilities within the next financial year are addressed below Income taxes In making the estimates for income taxes, the Group takes into account the current income tax law and decisions taken by appellate authorities on certain issues in the past. There may be various matters where the Group s view differs with the view taken by the income tax department at the assessment stage and where the Group considers that its view on items of a material nature is in accordance with the law. The difference between the potential and actual tax charge, if any, is disclosed as a contingent liability. The deemed assessment order of the Group for the Tax Year 2003 was rectified by the tax department in 2008 without any cause and basis, allowing tax losses brought forward relating to the pre de-merger period. This treatment was apparently made as a consequence of the action undertaken to effect the amendment of assessment for the Tax Year 2003 in the case of ICI Pakistan Limited. In that case the tax department had taken certain actions in the order, considered by the department as protective assessment, on the matter of unabsorbed depreciation carried forward by ICI Pakistan Limited relating to assets of the PTA business as of the date of de-merger. The Group s position under the tax law is that such depreciation should be allowed to ICI Pakistan Limited and a writ petition was, therefore, filed jointly with ICI Pakistan Limited in the High Court of Sindh challenging this rectification. The honourable High Court of Sindh vide its order dated 31 January 2009, directed the tax department that no further action shall be taken until the next date of hearing. The matter is still pending. 162
181 Notes to and Forming Part of the Consolidated Financial Statements For the year ended 31 December 2013 Recently in the case of that company, the availability of the said depreciation loss from the year has attained finality after the decision of the Appellate Tribunal Inland Revenue. However, the matter is still pending as the department has preferred appeal. In 2008 while issuing the rectification order for the Tax Year 2003, the Taxation Officer had erroneously disallowed the loss brought forward of Rs 2.6 billion for which a rectification application and corresponding appeal was filed with the Additional Commissioner of Income Tax and CIT (Appeals) respectively. During 2011, the Commissioner (Appeals) disposed off the Group s appeal via order No. 156 dated 14 March 2011 and allowed the said loss while maintaining certain disallowances against which corresponding appeals were filed with the Appellate Tribunal Inland Revenue [ATIR]. In its order passed on 14 September 2011, ATIR referred back the matter of disallowance of such loss against which rectification appeal was filed on 13 October The issue is still pending in appeal Defined benefit plans The Group has adopted certain actuarial assumptions as disclosed in note 20 to the financial statements for valuation of present value of defined benefit obligations and fair value of plan assets, based on actuarial advice. 3.2 No critical judgement has been used in applying the accounting policies. 4. CHANGE IN ACCOUNTING POLICY IAS 19 (revised) - Employee Benefits effective for annual periods beginning on or after 1 January 2013 amends the accounting for employee benefits. The standard requires immediate recognition of past service cost and also replaces the interest cost on the defined benefit obligation and the expected return on plan assets with a net interest cost based on the net defined benefit asset or liability and the discount rate, measured at the beginning of the year. Further, a new term remeasurements has been introduced. This is made up of actuarial gains and losses, the difference between actual investment returns and the return implied by the net interest cost. The standard requires remeasurements to be recognised in the Balance Sheet immediately, with a charge or credit to Other Comprehensive Income in the periods in which they occur. Following the application of IAS 19 (revised), the Group s policy for Staff Retirement Benefits - Defined Benefit Plans stands amended as follows: - The amount arising as a result of remeasurements are recognised in the Balance Sheet immediately, with a charge or credit to Other Comprehensive Income in the periods in which they occur. - The change in accounting policy has been accounted for retrospectively in accordance with the requirements of IAS 8 Accounting Policies, Changes in Accounting Estimates and Errors and comparative figures have been restated. 163
182 Notes to and Forming Part of the Consolidated Financial Statements For the year ended 31 December 2013 The Group s financial statements are affected by the remeasurements relating to prior years. The effects have been summarised below: Amount in Rs 000 Impact on Balance Sheet Rupees 000 Increase in deferred liability 16,125 44,229 Decrease in other receivables 15,839 13,795 Decrease in deferred tax liabilities 10,638 19,293 Increase in accumulated losses 21,326 38,731 Impact on Statement of Changes in Equity Increase in accumulated losses Cumulative effect from prior years - 34,088 Impact for the year ended (17,405) 4,643 Impact on Profit & Loss Decrease in cost of sales 2,777 - Decrease in distribution and selling expenses Decrease in administrative expenses 1,064 - Increase in taxation 1,376 - Impact on Other Comprehensive Income Items that will not be reclassified to Profit or Loss 14,612 - The effect of change in accounting policy, due to adoption of IAS 19 (Revised), on 'earnings per share' is immaterial in the overall context of these financial statements. There is no cash flow impact as a result of the retrospective application of change in accounting policy. 164
183 Notes to and Forming Part of the Consolidated Financial Statements For the year ended 31 December 2013 Amount in Rs FIXED ASSETS Property, plant and equipment Operating assets - note 5.1 8,702,842 9,981,721 Capital work-in-progress - note 5.2 9,352 82,174 8,712,194 10,063,895 Intangible assets - note 5.4 1,390 1,874 8,713,584 10,065, Operating assets The following is a statement of operating property, plant and equipment: Leasehold land Buildings on leasehold land Plant and machinery Owned Held under finance lease Motor vehicles Furniture and equipment Total Net carrying value basis Year ended 31 December 2013 Opening net book value (NBV) 50, ,599 9,674,232 4,395 6,382 80,619 9,981,721 Additions (at cost) , , ,157 Disposals (at NBV) (106) (106) Depreciation charge (1,422) (24,675) (1,446,519) (4,395) (4,868) (20,051) (1,501,930) Closing net book value (NBV) 49, ,551 8,444,250-2,382 65,587 8,702,842 Gross carrying value basis at 31 December 2013 Cost 90, ,836 31,032, ,543 57, ,957 32,749,889 Accumulated depreciation (41,206) (646,574) (21,330,430) (395,543) (55,099) (118,370) (22,587,222) Accumulated impairment losses - (201,711) (1,258,114) (1,459,825) Net book value (NBV) 49, ,551 8,444,250-2,382 65,587 8,702,842 Net carrying value basis Year ended 31 December 2012 Opening net book value (NBV) 51, ,004 6,805,141 30,765 11,785 48,643 7,134,254 Additions (at cost) - 3,347 4,296, ,820 4,354,355 Disposals (at NBV) - - (3,432) - - (208) (3,640) Depreciation charge (1,422) (23,752) (1,423,665) (26,370) (5,403) (22,636) (1,503,248) Closing net book value (NBV) 50, ,599 9,674,232 4,395 6,382 80,619 9,981,721 Gross carrying value basis at 31 December 2012 Cost 90, ,209 30,816, ,543 56, ,441 32,598,342 Accumulated depreciation (39,784) (621,899) (19,883,912) (391,148) (50,231) (169,822) (21,156,796) Accumulated impairment losses - (201,711) (1,258,114) (1,459,825) Net book value (NBV) 50, ,599 9,674,232 4,395 6,382 80,619 9,981,721 Depreciation rate % per annum
184 Notes to and Forming Part of the Consolidated Financial Statements For the year ended 31 December 2013 Amount in Rs Capital work-in-progress Civil works and buildings 1,599 - Plant and machinery ,489 Miscellaneous equipments 7, ,352 82, Capital work-in-progress - movement Opening balance 82,174 2,717,177 Capital expenditure 143,862 1,717,595 Transferred to operating property, plant and equipment (216,684) (4,352,598) Closing balance 9,352 82, INTANGIBLE ASSETS Net carrying value basis Opening net book value 1,874 1,156 Additions during the year 36 1,177 Amortisation charge (520) (459) Closing net book value 1,390 1, Gross carrying value basis Cost 214, ,066 Accumulated amortisation (212,712) (212,192) Net book value 1,390 1, Following assets, having net book value exceeding Rs 50,000 were retired during the year. Description Cost Accumulated depreciation 2013 Net book value Sales proceeds Particulars of buyers / others Furniture and equipment Dell Latitude Notebook Discarded / Scrapped 166
185 Notes to and Forming Part of the Consolidated Financial Statements For the year ended 31 December LONG-TERM LOANS AND ADVANCES - considered good Amount in Rs Motor House Others Total Total car building assistance Due from executives - note ,372 14,767-40,139 46,560 Less: Receivable within one year - note 11 (4,891) (7,695) - (12,586) (13,970) 20,481 7,072-27,553 32,590 Due from employees 13,703 1,346 2,957 18,006 19,335 Less: Receivable within one year - note 11 (2,618) (994) (650) (4,262) (4,968) 11, ,307 13,744 14,367 31,566 7,424 2,307 41,297 46, Reconciliation of carrying amount of loans to executives Key management personnel Executives Total Key management personnel Executives Total Balance at 1 January 6,009 40,551 46, ,329 47,135 Disbursements - 19,345 19,345 6,555 13,925 20,480 Repayments (1,311) (24,455) (25,766) (1,352) (19,703) (21,055) Balance at 31 December 4,698 35,441 40,139 6,009 40,551 46, Loans for purchase of motor cars and house building assistance are repayable between two to ten years. All the loans are interest free and are secured, where applicable, against respective assets granted to the employees of the Group in accordance with their terms of employment. 6.3 The maximum aggregate amount of loans and advances due from Executives at the end of any month during the year was Rs million (2012: Rs million). 7. LONG-TERM DEPOSITS AND PREPAYMENTS Deposits - note ,524 40,524 Prepayments 23,487 38,723 64,011 79,
186 Notes to and Forming Part of the Consolidated Financial Statements For the year ended 31 December These include Rs million (2012: Rs million) paid to Pakistan Steel Mills Corporation for emergency back-up supply of water and Rs million (2012: Rs million) paid to Karachi Electric Supply Corporation (KESC). 8. STORES AND SPARES Amount in Rs Stores 30,021 23,517 Spares 831, , , ,481 Less: Provision for slow moving, obsolete and rejected items - note 8.1 (20,860) (15,746) 8.1 Provision for slow moving, obsolete and rejected items 840, ,735 Provision at 1 January 15,746 10,975 Charge for the year 5,114 4,771 20,860 15,746 Write-offs - - Provision at 31 December 20,860 15, STOCK-IN-TRADE Raw and packing materials [including in-transit Rs 181 million (2012: Rs 942 million)] 2,166,141 2,802,171 Finished goods - Manufactured goods 723,359 1,499,015 - Trading goods [including in-transit Rs Nil (2012: Rs million)] 71, , ,948 1,638,706 2,961,089 4,440, Raw and packing materials include Rs 1.11 billion (2012: Rs 1.25 billion) held with third party. 168
187 Notes to and Forming Part of the Consolidated Financial Statements For the year ended 31 December TRADE DEBTS 10.1 These are secured and considered good All of the Group trade debts are secured by letters of credit issued by various banks. Amount in Rs LOANS AND ADVANCES - considered good Loans due from: - Executives - note 6 12,586 13,970 - Employees - note 6 4,262 4,968 16,848 18,938 Advances to: - Executives 3,698 4,701 - Employees 1,018 1,148 - Contractors and suppliers 3,080 8,009 7,796 13,858 24,644 32, The maximum aggregate amount of advances due from Executives at the end of any month during the year was Rs 6.16 million (2012: Rs 4.01 million). 12. TRADE DEPOSITS AND SHORT-TERM PREPAYMENTS Deposits 9,499 4,489 Margin on import letters of credit 18,222 47,463 Short-term prepayments 66,612 40,452 94,333 92, OTHER RECEIVABLES (Re-stated) (Re-stated) Rebates receivable - note ,535 62, ,834 Asset recognised in respect of staff retirement benefit funds - note Insurance claims receivable 12,029 27,112 12,828 Others 475 1,586 1,963 33,846 91, , This represents amounts receivable on account of price and exchange rate differentials in respect of paraxylene and acetic acid settlements. 169
188 Notes to and Forming Part of the Consolidated Financial Statements For the year ended 31 December 2013 Amount in Rs TAX REFUNDS DUE FROM GOVERNMENT - SALES TAX Sales tax refundable 492, ,664 Provision for doubtful receivables (94,008) (94,008) 398, , This includes Rs million (31 December 2012: Rs 259 million) on account of input tax arising from sales tax charged to the Group under the Sindh Sales Tax on Services Act, 2011 which is administered by the Sindh Revenue Board with effect from 1 July This is being deferred due to procedural issues between Federal and Provincial Tax collecting agencies, resulting in lack of verification by the refund issuing authority i.e. the Federal Board of Revenue (FBR). The Group had approached Federal Tax Ombudsman (FTO) for resolution of the matter. The FTO in its order dated 2 May 2013 have directed FBR, with certain recommendations, to resolve the issue. The Group is maintaining close focus with the relevant authorities for early resolution for the same. 15. CASH AND BANK BALANCES Short-term fixed deposits - note ,043, ,800 With banks in current accounts 17,305 44,444 Cash in hand 8,118 8,746 3,068, , During the year ended 31 December 2013, the mark-up rates on term deposits ranged from 6.50% to 9.70% (2012: 6.50% to 11.75%) per annum and had maturities of less than three months. 16. SHARE CAPITAL Authorised capital 2,000,000,000 ordinary shares of Rs 10 each 20,000,000 20,000, ,735,636 ordinary shares of Rs 10 each fully paid-up issued pursuant to the Scheme for consideration other than cash - note ,047,356 5,047,356 1,009,471,572 ordinary shares of Rs 10 each fully paid-up in cash 10,094,716 10,094,716 15,142,072 15,142,
189 Notes to and Forming Part of the Consolidated Financial Statements For the year ended 31 December With effect from 1 October 2000 the PTA Business of ICI Pakistan Limited was demerged under a Scheme of Arrangement (Scheme), dated 12 December 2000, approved by the shareholders and sanctioned by the High Court of Sindh At 31 December 2013 and 2012, Lotte Chemical Corporation - South Korea held 1,135,860,105 ordinary shares of Rs 10 each. 17. CAPITAL RESERVES Capital reserves represent the amount received from various overseas companies of AkzoNobel Group (then group Companies), for purchase of fixed assets. The remitting companies have no claim to their repayments. 18. LIABILITY AGAINST ASSETS SUBJECT TO FINANCE LEASE - plant and machinery Amount in Rs 000 Minimum lease payments 31 December December 2012 Financial Principal Minimum Financial Principal charges for outstanding lease charges for outstanding future periods payments future periods Not later than one year ,687 1,028 42, DEFERRED TAX (Re-stated) (Re-stated) Credit balance arising in respect of property, plant and equipment 907,627 1,199,074 1,432,500 (Debit) balances arising in respect of: - liability against assets subject to finance lease - (12,723) (77,598) - provisions for: sales tax refundable (30,365) (31,258) (41,174) staff retirement benefits (24,406) (19,796) (26,205) slow moving, obsolete and rejected items (6,738) (5,236) (3,649) unpaid liabilities (220,791) (209,307) (160,521) - carry forward of turnover tax (157,965) (157,965) - - taxable loss (77,485) , ,789 1,123, Deferred income tax asset is recognised for tax losses available for carry forward to the extent that the related tax benefit available through future taxable profit. 171
190 Notes to and Forming Part of the Consolidated Financial Statements For the year ended 31 December RETIREMENT BENEFIT OBLIGATION 20.1 Staff retirement benefits As stated in note , the Group operates three retirement benefit plans (The Plans) namely approved funded defined benefit gratuity scheme for all permanent employees, approved funded defined benefit pension scheme for all management staff and unfunded medical scheme for members of its pension fund subject to minimum service of prescribed period in the respective trust deed. Actuarial valuation of these plans is carried out every year and the latest actuarial valuation was carried out as at 31 December Plan assets held in trust are governed by local regulations which mainly includes Trust Act, 1882, Companies Ordinance, 1984, Income Tax Rules, 2002 and Rules under the Trust deed of the Plans. Responsibility for governance of the Plans, including investment decisions and contribution schedules, lies with the Board of Trustees. The Group appoints the trustees and all trustees are employees of the Group The latest actuarial valuation of the Fund as at 31 December 2013 was carried out using the Projected Unit Credit Method. Details of the Fund as per the actuarial valuation are as follows: Balance sheet reconciliation Amount in Rs 000 (Re-stated) Funded Unfunded Funded Unfunded Pension Gratuity Total Medical Pension Gratuity Total Medical Present value of defined benefit obligation at 31 December - note (62,124) (161,337) (223,461) (38,362) (55,347) (154,764) (210,111) (36,404) Fair value of plan assets at 31 December - note , , ,628-48, , ,874 - (Deficit) / Surplus (6,640) 807 (5,833) (38,362) (7,264) 27 (7,237) (36,404) Movement in the present value of defined benefit obligation Balances as at 1 January 55, , ,111 36,404 48, , ,273 31,313 Benefits paid by the plan - (17,787) (17,787) (325) (3,507) (4,847) (8,354) (210) Current service costs 2,882 12,010 14,892 2,226 2,639 11,524 14,163 2,215 Interest cost 6,365 16,802 23,167 4,168 6,066 16,714 22,780 4,057 Remeasurement on obligation (2,470) (4,452) (6,922) (4,111) 1, ,249 (971) Balance as at 31 December 62, , ,461 38,362 55, , ,111 36, Movement in the fair value of plan assets Fair value of plan assets at 1 January 48, , ,874-34, , ,570 - Contributions paid into the plan 3,343 12,842 16,185-6,279 17,134 23,413 - Benefits paid by the plan - (17,787) (17,787) - (3,507) (4,847) (8,354) - Interest income 5,717 17,524 23,241-4,527 14,549 19,076 - Remeasurement (1,659) (5,226) (6,885) - 5,913 17,256 23,169 - Fair value of plan assets at 31 December 55, , ,628-48, , ,
191 Notes to and Forming Part of the Consolidated Financial Statements For the year ended 31 December 2013 Amount in Rs 000 (Re-stated) Funded Unfunded Funded Unfunded Pension Gratuity Total Medical Pension Gratuity Total Medical Expense recognised in profit and loss account Current service costs 2,882 12,010 14,892 2,226 2,639 11,524 14,163 2,215 Net Interest cost 648 (722) (74) 4,168 1,539 2,165 3,704 4,057 Expense recognised in profit and loss account 3,530 11,288 14,818 6,394 4,178 13,689 17,867 6, Remeasurement recognised in Other Comprehensive Income Loss from changes in demographic assumptions (171) (1,424) Experience (gain) / losses (2,470) (4,452) (6,922) (4,111) 1, , Remeasurement of fair value of plan assets 1,659 5,226 6,885 - (5,913) (17,256) (23,169) - Remeasurements (811) 774 (37) (4,111) (4,123) (16,797) (20,920) (971) Net recognised liability / (asset) Net liability at beginning of the year 7,264 (27) 7,237 36,404 13,488 20,215 33,703 31,313 Charge for the year 3,530 11,288 14,818 6,394 4,178 13,689 17,867 6,272 Contribution made during the year to the Fund (3,343) (12,842) (16,185) (325) (6,279) (17,134) (23,413) (210) Remeasurements recognised in Other Comprehensive Income (811) 774 (37) (4,111) (4,123) (16,797) (20,920) (971) Recognised liability / (asset) as at 31 December 6,640 (807) 5,833 38,362 7,264 (27) 7,237 36, Plan assets comprises of following Government bonds 33,477 79, ,872 30, , ,360 Other bonds (TFCs) ,114 5,214 9,328 Shares 8,392 24,413 32,805 11,268 36,306 47,574 Term deposits 12,094 55,655 67,749-1,533 1,533 Cash at Bank 1,521 2,681 4,202 2,275 4,804 7,079 Total as at 31 December 55, , ,628 48, , , Actuarial assumptions Discount rate at 31 December 13.00% 13.00% 13.00% 11.50% 11.50% 11.50% Future salary increases 10.75% 10.75% 9.50% 9.50% Medical cost trend rate 7.50% 6.25% Future pension increases 7.50% 6.25% Mortality was assumed to be 70% of the EFU(61-66) Table. 173
192 Notes to and Forming Part of the Consolidated Financial Statements For the year ended 31 December In case of the funded plans, the Group ensures that the investment positions are managed within an asset-liability matching (ALM) framework that has been developed to achieve long-term investments that are in line with the obligations under the retirement benefit plan. Within this framework, the Group s ALM objective is to match assets to the retirement benefit obligations by investing in longterm fixed interest securities with maturities that match the benefit payments as they fall due and in the appropriate currency. The Group actively monitors how the duration and the expected yield of the investments are matching the expected cash outflows arising from the retirement benefit plan obligations. The Group has not changed the processes used to manage its risks from previous periods. The Group does not use derivatives to manage its risk. Investments are well diversified, such that the failure of any single investment would not have a material impact on the overall level of assets. A large portion of assets in 2013 consists of government bonds and term deposits. The Group believes that government bond offer the best returns over the long term with an acceptable level of risk The expected return on plan assets was determined by considering the expected returns available on the assets underlying the current investment policy. Expected yields on fixed interest investments are based on gross redemption yields as at the balance sheet date. The Group s contribution to the pension and gratuity funds in 2014 is expected to amount to Rs 16.2 million. The actuary conducts separate valuations for calculating contribution rates and the Group contributes to the pension and gratuity funds according to the actuary s advice. Expense of the defined benefit plan is calculated by the actuary. Figures in this note are based on the latest actuarial valuation carried out as at 31 December Sensitivity analysis for actuarial assumptions The sensitivity of the defined benefit obligation to changes in the weighted principal assumptions is: Amount in Rs 000 Impact on defined benefit obligation Change in Increase in Decrease in assumption assumption assumption Discount rate at 31 December 1% (27,418) 32,054 Future salary increases 1% 23,746 (21,250) Future pension increases 1% 735 (623) If longevity increases by 1 year, obligation increases by Rs 88,
193 Notes to and Forming Part of the Consolidated Financial Statements For the year ended 31 December 2013 The above sensitivity analyses are based on a change in an assumption while holding all other assumptions constant. In practice, this is unlikely to occur, and changes in some of the assumptions may be correlated. When calculating the sensitivity of the defined benefit obligation to significant actuarial assumptions the same method (present value of the defined benefit obligation calculated with the projected unit credit method at the end of the reporting period) has been applied as when calculating the pension liability recognised within the statement of financial position. A sensitivity analysis was conducted to determine the impact of a 1% change in the medical cost trend, which was not material. The methods and types of assumptions used in preparing the sensitivity analysis did not change compared to the previous period. Amount in Rs Historical information Present value of the defined benefit obligation as at 31 December 261, , , , ,655 Fair value of plan assets 217, , , , ,724 Deficit in the plan (44,195) (43,641) (65,016) (41,639) (21,931) Experience Adjustments (Gain) / loss on obligation (as percentage of plan obligation) (4)% (1)% (6)% (7)% (9)% Gain / (loss) on plan assets (as percentage of plan assets) (3)% 11% 1% 1% 17% 20.4 The expected return on plan assets is based on the market expectations and depends upon the asset portfolio of the Fund, at the beginning of the period, for returns over the entire life of related obligation The Group s contributions towards the provident fund and defined contribution superannuation fund for the year ended 31 December 2013 amounted to Rs million (2012: Rs million) and Rs million (2012: Rs million) The weighted average duration of the defined benefit obligation is 13 years. Expected maturity analysis of undiscounted retirement benefit plans. At 31 December 2013 Less than a year Between 1-2 years Between 2-5 years Over 5 years Total Retirement benefit plans 4,389 6,585 35, , ,
194 Notes to and Forming Part of the Consolidated Financial Statements For the year ended 31 December 2013 Amount in Rs TRADE AND OTHER PAYABLES Trade creditors including bills payable 4,919,508 5,332,520 Accrued expenses 914, ,914 Advances from supplier / customer ,483 Unclaimed dividend 12,262 12,385 Provision for infrastructure cess - note ,453,826 1,249,432 Workers profit participation fund - note ,153 23,529 Workers welfare fund 29,771 - Others 92,267 69,713 7,490,992 7,756, The Group (along with a number of other parties) is challenging the levy of infrastructure cess on cost and freight value of goods entering the province of Sindh. According to a decision of the High Court, levy of the fee / cess upto December 2006 was declared to be illegal while amounts charged after that date were decreed to be within the law. Appeals were filed in the Supreme Court both by the companies and the Government of Sindh in respect of the aforesaid judgement of the High Court. During the year 2011, the Supreme Court referred the case back to the High Court. The High Court vide its order dated 2 June 2011 provided for an interim arrangement reached through a joint statement filed with the Court by the counsels of the petitioners and respondent of the case. As per the order, bank guarantees / securities furnished in respect of consignments cleared after 27 December 2006 would be encashed to the extent of 50% and guarantees for the remaining balance would be kept till final disposal of the petitions. Consequently, bank guarantees relating to the period upto 27 December 2006 have been cancelled and returned to the Group. As per legal advice sought by the Group in respect of the aforementioned case, the High Court may uphold the validity of the law against the Group upon its re-filing since the matter has been referred back to the High Court by the Supreme Court, thereby making the Group liable to pay the levy for all consignments cleared till date. As a matter of abundant caution, full amount of provision has been made in these financial statements in this respect Balance as at 1 January 1,249,432 1,048,914 Charge 204, ,518 Balance as at 31 December 1,453,826 1,249,
195 Notes to and Forming Part of the Consolidated Financial Statements For the year ended 31 December 2013 Amount in Rs Reconciliation of workers profit participation fund Balance as at 1 January 23, ,196 Provision / allocation for the year - note 29 44,624 23,529 Interest on funds utilised - note 31-3,433 Amount paid to the fund - (337,629) Balance as at 31 December 68,153 23, INTEREST ACCRUED Long-term loans - note , ,685 Short-term financing , , This represents interest payable to Mortar Investments International Limited amounting to USD 1.52 million (2012: USD 1.52 million) on long-term loans previously repaid. The amount is still unpaid due to procedural complexities with respect to foreign remittance. 23. SHORT-TERM FINANCING 23.1 The facilities for running finance available from various banks as at 31 December 2013 amounted to Rs 1.68 billion (2012: Rs 1.43 billion). These facilities carry mark-up at rates ranging from 1 month KIBOR plus 1.00 percent per annum to 3 months KIBOR plus 1.75 percent per annum and are secured by joint pari-passu hypothecation charge over all the present and future stock and book debts of the Group Foreign currency import and export finance facilities available from a local bank as at 31 December 2013 amounted to USD 10.0 million (2012: USD 10.0 million). These facilities are available at interest rates to be negotiated at the time of booking and are secured against trust receipts and / or joint pari-passu hypothecation charge over all the present and future stock and book debts of Group. Total facility was unutilised as at 31 December 2013 and CONTINGENCIES AND COMMITMENTS 24.1 Commitments in respect of capital expenditure as at 31 December 2013 amount to Rs million (2012: Rs 286 million). 177
196 Notes to and Forming Part of the Consolidated Financial Statements For the year ended 31 December 2013 Amount in Rs Commitments for rentals under operating lease agreements / Ijarah contracts in respect of vehicles as at 31 December are as follows: Year , ,570 14, ,189 10, ,215 3, ,369-60,343 46, Commitments for rentals under operating lease agreements for certain supplies in respect of goods and services as at 31 December are as follows: Year , , , , , , , , ,800 2,368,175 2,918, Commitments for rentals under operating lease agreements in respect of goods and services are stated at minimum lease payments. These are priced in foreign currency and payable in Pakistan Rupees, converted at exchange rates applicable on the date of payment Outstanding guarantees and letters of credit issued on behalf of the Group as at 31 December 2013 were Rs 1.66 billion (2012: Rs 1.41 billion) and Rs 1.28 billion (2012: Rs 342 million), respectively. 178
197 Notes to and Forming Part of the Consolidated Financial Statements For the year ended 31 December REVENUE Amount in Rs Manufactured Trading Total Manufactured Trading Total goods goods goods goods Local sales 58,314, ,605 59,313,390 50,405, ,095 51,029,772 Export sales 1,900,190-1,900,190 2,033,562-2,033,562 60,214, ,605 61,213,580 52,439, ,095 53,063,334 Less: Sales tax and excise duty (2,044,882) (43,090) (2,087,972) (61) (7,207) (7,268) Price settlements and discounts (2,024,541) (31,383) (2,055,924) (231,477) (1,332) (232,809) 56,145, ,132 57,069,684 52,207, ,556 52,823, Four (2012: Four) of the Group s customers contributed towards 85% (2012: 84%) of the revenue during the year amounting to Rs billion (2012: Rs billion) and each customer individually exceeded 10% of the revenue. (Re-stated) 26. COST OF SALES Raw and packing materials consumed: Opening stock 2,802,171 3,334,047 Purchases - note ,921,141 47,393,721 Closing stock (2,166,141) (2,802,171) 50,557,171 47,925,597 Salaries, wages and benefits - note , ,202 Stores and spares consumed 177, ,390 Lease rentals / Ijarah arrangements 12,445 11,268 Insurance 91, ,417 Oil, gas and electricity 1,939,167 1,869,354 Travelling expenses 68,096 62,280 Depreciation and amortisation 1,502,450 1,503,707 Repairs and maintenance - note , ,499 Other expenses 52,198 38,482 Cost of goods manufactured 55,272,786 52,215,196 Opening stock of manufactured goods 1,499,015 1,332,340 56,771,801 53,547,536 Closing stock of manufactured goods (723,359) (1,499,015) 56,048,442 52,048,521 Trading goods Opening stock 139,691 2,617 Purchases 804, ,833 Closing stock (71,589) (139,691) 872, ,759 56,920,556 52,614, This includes discount recognised during the year amounting to Rs million (2012: Nil) after renewal of a supplier s contract under the terms and their arrangements. 179
198 Notes to and Forming Part of the Consolidated Financial Statements For the year ended 31 December Salaries, wages and benefits include Rs million (2012: Rs million) and Rs million (2012: Rs million) in respect of defined benefit and defined contribution plans respectively Repair and maintenance includes Rs 212 million (2012: Nil) in respect of plant overhaul carried out during the year. 27. DISTRIBUTION AND SELLING EXPENSES Amount in Rs 000 (Re-stated) Outward freight and handling charges 53,812 69,065 Salaries and benefits - note ,330 43,924 Lease rentals / Ijarah arrangements 2,079 2,043 Repairs and maintenance 2,521 4,378 Travelling expenses 5,808 5,573 Postage and telephone 1,238 1,304 Advertising and sales promotion Other expenses 8,756 5, , , Salaries and benefits include Rs 1.83 million (2012: Rs 1.87 million) and Rs 4.05 million (2012: Rs 3.63 million) in respect of defined benefit plans and defined contribution plans respectively. 28. ADMINISTRATIVE EXPENSES (Re-stated) Salaries and benefits - note , ,236 Legal, professional and consultancy charges 18,639 15,880 Lease rentals / Ijarah arrangements 5,924 5,555 Travelling expenses 20,728 16,085 Repairs and maintenance 19,324 18,577 Expenses on information technology 14,022 10,539 Security expenses 17,118 13,980 Rent, rates and taxes 26,247 25,754 Publication and subscriptions 2,086 4,324 Postage and telephone 6,300 5,335 Printing and stationery 8,890 6,499 Other expenses 52,695 38, , , Salaries and benefits include Rs 7.06 million (2012: Rs 9.67 million) and Rs 7.74 million (2012: Rs 7.43 million) in respect of defined benefit plans and defined contribution plans respectively. 180
199 Notes to and Forming Part of the Consolidated Financial Statements For the year ended 31 December OTHER EXPENSES Amount in Rs Auditors remuneration - note ,123 4,482 Donations - note ,072 8,953 Loss on retirement of property, plant and equipment 106 3,640 Provision for obsolete stores and spares 5,114 4,771 Workers profit participation fund - note ,624 23,529 Workers welfare fund - note ,772 - Others 1,005 1, Auditors remuneration 93,816 46,500 Audit fee 2,400 2,200 Taxation Limited reviews, audit of consolidated financial statements, certain funds for staff retirement benefits, group reporting package and various certifications 1,580 1,690 Out of pocket expenses Donations include payments in respect of the following: 5,123 4,482 Community services 3,550 3,178 Education 1,852 3, None of the directors or their spouse had any interest in the donee This includes Rs 10.3 million in respect of tax year OTHER INCOME Scrap sales 8,226 22,280 Recoveries against provision made in prior year for sales tax refundable - 29,825 Liabilities no longer payable written back 42,659 16,700 Return on bank deposits 128, ,241 Others 871 1, , ,
200 Notes to and Forming Part of the Consolidated Financial Statements For the year ended 31 December 2013 Amount in Rs FINANCE COSTS Interest / mark-up on: - short-term financing workers profit participation fund - note ,433 - finance lease - note ,385 - long term loans from parent company - 20,381 Discounting charges on trade debts 40,562 7,552 Exchange loss - net 31,446 70,068 Bank charges 11,291 10,235 83, , This includes contingent rent of Rs Nil (2012: Rs million) recognised as an expense during the year which is determined by the movement in UK Consumer Price Index. (Re-stated) TAXATION Current - for the year 569, ,421 - for prior year 2,678 32, , ,748 Deferred (374,252) (367,843) 197,936 (61,095) 32.1 Current taxation expense for the year is subject to minimum tax charged at 1% of taxable turnover which is adjustable against the tax liability of succeeding five years. The Group, however, on prudence has not recognised the related deferred tax asset in view of taxable loss for the year. 182
201 Notes to and Forming Part of the Consolidated Financial Statements For the year ended 31 December 2013 Amount in Rs Reconciliation of income tax expense for the year (Re-stated) Loss before taxation (300,048) (57,507) Applicable tax rate 34% 35% Tax calculated at the applicable tax rate (102,016) (20,127) Tax effect of : - permanent differences 33,709 44,555 - minimum tax 542, tax credits (21,654) (16,852) - income chargeable to tax under FTR basis 61,546 40,757 - prior year tax charge 2,678 32,327 - exempt income (291,760) (141,755) - change in tax rate (27,228) - 197,936 (61,095) 33. CASH GENERATED FROM OPERATIONS Loss before taxation (300,048) (57,507) Adjustments for non cash charges and other items: Depreciation and amortisation 1,502,450 1,503,707 Loss on retirement of property, plant and equipment 106 3,640 Provision for staff retirement benefit scheme 21,212 24,139 Finance costs 52,218 86,912 Unrealised exchange loss on current maturity of long-term loan and current portion of liability against assets subject to finance lease - 100,572 Mark-up accrued on bank deposits (128,584) (291,241) Provision for infrastructure cess 204, ,518 1,651,796 1,628,247 1,351,748 1,570,740 Effect on cashflows due to working capital changes Decrease / (increase) in current assets Stores and spares (107,985) (37,990) Stock-in-trade 1,479, ,127 Trade debts 520,031 (157,116) Loans and advances 8,152 7,807 Trade deposits and short-term prepayments (1,929) 66,994 Other receivables and tax refunds 285,381 (232,707) 2,183,438 (124,885) (Decrease) / increase in trade and other payables (512,914) 74,442 Cash generated from operations 3,022,272 1,520,
202 Notes to and Forming Part of the Consolidated Financial Statements For the year ended 31 December 2013 Amount in Rs EARNINGS PER SHARE - basic and diluted (Re-stated) (Loss) / profit for the year after tax (497,984) 3,588 Number of shares Weighted average ordinary shares in issue during the year 1,514,207,208 1,514,207,208 Earnings per share (in Rupees) (0.33) There is no dilutive effect on the basic earnings per share of the Group. 35. REMUNERATION OF DIRECTORS AND EXECUTIVES The aggregate amounts charged in the financial statements for remuneration, including all benefits, to the Chief Executive, Directors and Executives of the Group were as follows: Chief Executive Executive Directors Executives Managerial remuneration 15,636 14,552 13,547 11, , ,777 Retirement benefits 5,520 7, ,881 48,305 Group insurance Rent and house maintenance ,924 3,380 58,002 55,676 Utilities ,612 11,974 Medical expenses ,276 9,868 21,598 22,389 17,529 14, , ,597 Number of persons In addition to the above, amount charged in the financial statements for remuneration and fee to the non-executive directors, were Rs 0.6 million (2012: Rs 0.6 million) and Rs million (2012: Rs million) respectively An amount of Rs million (2012: Rs million) on account of variable pay has been recognised in the financial statements. This amount is payable in 2014 after verification of target achievements. 184
203 Notes to and Forming Part of the Consolidated Financial Statements For the year ended 31 December 2013 Out of variable pay recognised for 2012, following payments were made: Amount in Rs 000 Paid in 2013 Paid in 2012 relating to relating to Chief Executive 3,006 5,722 Executives 37,257 68,237 Other employees 4,480 7,713 44,743 81, The Chief Executive, Executive Directors and certain Executives are provided with free use of Group maintained cars in accordance with their entitlements. 36. TRANSACTIONS WITH RELATED PARTIES The related parties comprise parent company, related group companies, directors of the Group, companies where directors also hold directorships, key management personnel and staff retirement funds. Details of transactions with related parties, other than those which have been specifically disclosed elsewhere in these financial statements are as follows: Relationship Nature of transaction Parent company Repayment of loan - 1,878,950 Payment of interest on loan - 23,696 Purchase of goods 1,496, ,986 Purchase of services - 4,071 Amount payable - 346,486 Associates Purchase of services - 33 Key management Salaries and other short term personnel benefits 71,551 71,457 Post employment benefit 11,737 13,142 Others Payment to staff retirement benefit funds 52,288 57,
204 Notes to and Forming Part of the Consolidated Financial Statements For the year ended 31 December CAPACITY AND PRODUCTION / GENERATION Pure Terephthalic Acid Annual name plate capacity Actual production / generation in metric tonnes- note , , , ,941 Electricity - in thousands of Kw - note , , , , The current Production is based on 95% Plant availability. This was mainly due to a 22 days outage during the year due to overhauling of the plant which is carried out periodically. Last year there was a temporary shutdown of a supplier manufacturing facility Actual generation is as per the requirement of the Company. 38. FINANCIAL INSTRUMENTS AND RELATED DISCLOSURES The Group s activities expose it to a variety of financial risks: credit risk, liquidity risk and market risk (including currency interest rate and price risks). The Group s overall risk management policy focuses on the unpredictability of financial markets and seeks to minimise potential adverse effects on the Group s financial performance Risk management framework The Board of Directors has overall responsibility for the establishment and over sight of the Group s risk management framework. The executive management team is responsible for developing and monitoring the Group s risk management policies. The team regularly meets and any changes and compliance issues are reported to the Board of Directors through the audit committee. Risk management systems are reviewed regularly by the executive management team to reflect changes in market conditions and the Group s activities. The Group, through its training and management standards and procedures, aims to develop a disciplined and constructive control environment in which all employees understand their roles and obligations. The audit committee oversees compliance by management with the Group s risk management policies and procedures, and reviews the adequacy of the risk management framework in relation to the risks faced by the Group. 186
205 Notes to and Forming Part of the Consolidated Financial Statements For the year ended 31 December 2013 Financial assets and liabilities by category and their respective maturities Amount in Rs 000 Maturity up to one year Interest bearing Non-interest bearing Total Maturity after one year Total Maturity up to one year Maturity after one year Total Financial assets Loans and receivables Loans and advances ,644 41,297 65,941 65,941 Deposits - 24,272 24,272 27,721 16,252 43,973 68,245 Trade debts ,780,329-2,780,329 2,780,329 Mark-up accrued on bank deposits ,020-7,020 7,020 Other receivables ,039-33,039 33,039 Cash and bank balances 3,043,250-3,043,250 25,423-25,423 3,068, December ,043,250 24,272 3,067,522 2,898,176 57,549 2,955,725 6,023, December 2012 (Re-stated) 826,800 24, ,072 3,530,059 63,209 3,593,268 4,444,340 Financial liabilities At amortised cost Trade and other payables ,393,068-7,393,068 7,393,068 Interest accrued , , , December ,554,129-7,554,129 7,554, December ,659-42,659 7,881,132-7,881,132 7,923,791 On balance sheet date gap 31 December ,043,250 24,272 3,067,522 (4,655,953) 57,549 (4,598,404) (1,530,882) 31 December 2012 (Re-stated) 784,141 24, ,413 (4,351,073) 63,209 (4,287,864) (3,479,451) OFF BALANCE SHEET ITEMS Letter of credits / guarantees 1,435,092 Operating lease liability 2,428, December ,911,475 The carrying values of all financial assets and liabilities reflected in the financial statements approximate their fair values. 187
206 Notes to and Forming Part of the Consolidated Financial Statements For the year ended 31 December Credit risk Credit risk is the risk of financial loss to the Group if a customer or counterparty to a financial instrument fails to meet its contractual obligations and arises principally from the Group s receivables from customers and deposits with banks. Trade and other receivables The Group s exposure to credit risk is influenced mainly by the individual characteristics of each customer. To reduce exposure to credit risk, substantially all the sales are made against letters of credit. Approximately 34 percent (2012: 28 percent) of the Group s revenue is attributable to sales transactions with a single customer. However, geographically there is no concentration of credit risk. The Board has established a credit policy under which each new customer is analysed individually for credit worthiness before the Group s standard payment and delivery terms and conditions are offered. The Group s review includes external ratings, when available. The customers associated with the Group for four years have contributed more than 95% of the revenue and losses have occurred infrequently. The maximum exposure to credit risk as at 31 December was: Financial assets Amount in Rs 000 (Restated) Rupees 000 Loans and advances 86,339 98,267 Deposits 68,245 92,476 Trade debts 2,780,329 3,300,360 Mark-up accrued on bank deposits 7, Other receivables 33,039 91,548 Bank balances 3,060, ,244 6,035,527 4,454,081 Secured 2,780,329 3,300,360 Unsecured 3,255,198 1,153,721 6,035,527 4,454,081 Not past due 6,035,527 4,454,081 The maximum exposure to credit risk for trade debts as at 31 December by geographic region was: Domestic 2,780,329 3,300,360 The Group has placed its funds with banks which are rated AA or above by PACRA / JCR VIS. 188
207 Notes to and Forming Part of the Consolidated Financial Statements For the year ended 31 December Liquidity risk Liquidity risk is the risk that the Group will encounter difficulty in meeting the obligations associated with its financial liabilities that are settled by delivering cash or another financial assets. The Group s approach to managing liquidity is to ensure, as far as possible, that it will always have sufficient liquidity to meet its liabilities when due, under both normal and stressed conditions, without incurring unacceptable losses or risking damage to the Group s reputation. The table below analyses the Group s financial liabilities into relevant maturity groupings based on the remaining period at the balance sheet to the maturity date. Amount in Rs 000 Carrying amount Contractual cash flows 31 December 2013 Less than 1-2 years 2-3 years 3-5 years one year Financial Liabilities Trade and other payables 7,393,068 7,393,068 7,393, Interest accrued 161, , , Off balance sheet Operating lease liabilities - 2,428,518-1,225, , ,557 7,554,129 9,982,647 7,554,129 1,225, , ,557 It is not expected that the cash flows included in the maturity analysis could occur significantly earlier, or at significantly different amounts. The Group manages liquidity risk by maintaining sufficient cash in bank accounts. At 31 December 2013, the Group had financial assets of Rs 6.04 billion (2012: Rs 4.45 billion), which include Rs 3.06 billion (2012: Rs 0.87 billion) of cash placed in bank accounts Market risk Market risk is the risk that the fair value or future cash flows of a financial instrument will fluctuate because of changes in the market price. Market risk comprises of three types of risks: currency risk, interest rate risk and other price risk Currency risk Currency risk arises mainly where receivables and payables exist due to transactions based on currencies other than Pakistan Rupees. The Group is exposed to currency risk on receivables, payables and borrowings that are in a currency other than Pakistan Rupees. 189
208 Notes to and Forming Part of the Consolidated Financial Statements For the year ended 31 December 2013 The currency exposure in Pakistan Rupees at the year end was as follows: GBP Euro US$ GBP Euro US$ Equivalent Rupees Financial liabilities Trade payables (1,225) (1,128,252) (2,332,337) (6,809) (6,098) (5,165,621) Liability against assets subject to finance lease (42,659) - - (1,225) (1,128,252) (2,332,337) (49,468) (6,098) (5,165,621) Operating lease liability (off balance sheet) - - (2,368,175) (44,492) - (2,864,446) Significant exchange rates applied during the year were as follows: Average rate for the year Spot rate as at 31 December Rupees Rupees US Dollar Great Britain Pound Sterling Euro Sensitivity analysis Every 1% increase or decrease in exchange rate, with all other variables held constant, will decrease or increase loss before tax for the year by Rs million (2012: Rs million) Interest rate risk Interest rate risk represents the risk that the fair value or future cash flows of a financial instrument will fluctuate because of changes in market interest rates. At the reporting date the interest rate profile of the Group s interest-bearing financial instruments was: Amount in Rs 000 Carrying amount Fixed rate instruments Financial assets 3,067, ,072 Variable rate instruments Financial liabilities - 42,
209 Notes to and Forming Part of the Consolidated Financial Statements For the year ended 31 December 2013 Sensitivity analysis for fixed rate instruments The Group does not account for any fixed rate financial assets and liabilities at fair value through the profit and loss account. Therefore a change in interest rates at the reporting date would not affect materially profit or loss for the year. Sensitivity analysis for variable rate instruments If KIBOR had been 10% higher / lower with all other variables held constant, the impact on the loss after tax for the year would not have been material Price Risk Price risk is the risk that the value of a financial instrument will fluctuate as a result of changes in market prices, whether those changes are caused by factors specific to the fund issuing that financial instruments, or its management company. 39. CAPITAL RISK MANAGEMENT The Group s objective when managing capital is to safeguard its ability to continue as a going concern in order to provide returns for shareholders and benefit for other stakeholders and to maintain an optimal structure to reduce the cost of capital. The Group has no debt as at 31 December PROVIDENT FUND RELATED DISCLOSURES The following information is based on latest un-audited financial statements of the Fund: Amount in Rs Size of the fund - Total assets 284, ,701 Percentage of investments made 96% 92% Fair value of investments 272, ,025 The cost of above investments amounted to Rs million (2012: Rs million). 191
210 Notes to and Forming Part of the Consolidated Financial Statements For the year ended 31 December 2013 The break-up of fair value of investments is as follows: Percentage Rupees 000 Shares in listed companies 15.1% 19.6% 41,206 47,772 Bank deposits 2.1% 2.3% 5,617 5,688 Government securities 82.8% 74.4% 226, ,495 Debt securities - 3.7% - 9,069 The investments out of provident fund have been made in accordance with the provisions of Section 227 of the Companies Ordinance, 1984 and the rules formulated for this purpose. 41. NUMBER OF EMPLOYEES Number of employees at 31 December Average number of employees during the year GENERAL Figures have been rounded-off to the nearest thousand rupees except as stated otherwise. 43. CORRESPONDING FIGURES Corresponding figures have been re-arranged wherever necessary for purposes of better presentation as follows: Reclassification from component Reclassification to component Amount in Rs 000 Finance income Other income - Return on bank deposits - Return on bank deposits 291,241 Finance costs Finance costs - Interest on long term loan - Exchange loss - net 10,926 from parent company 44. DATE OF AUTHORISATION These financial statements were authorised for issue in the Board of Directors meeting held on 28 January Changgyou Kim Chairman M Asif Saad Chief Executive 192
211
212
213
214
215
216
217

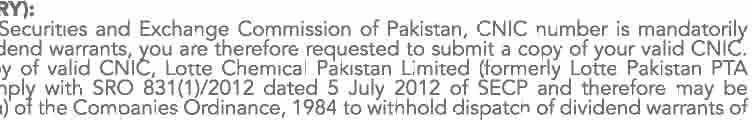
218
219
220
221
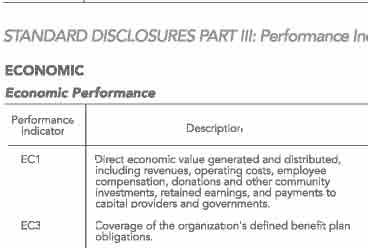
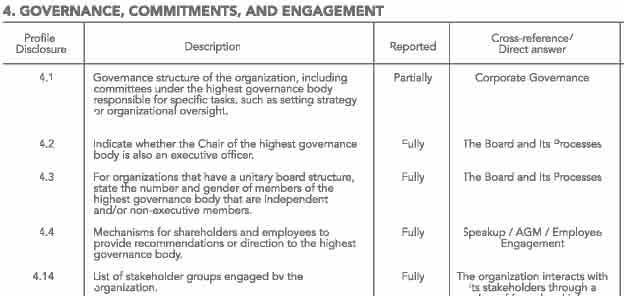
222
223

224


225
226
227
228
229
230
231

232
 Auditors Report to the Members We have audited the annexed balance sheet of Lotte Chemical Pakistan Limited [formerly Lotte Pakistan PTA Limited] as at 31 December 2013 and the related profit and loss
MUGHAL IRON & STEEL INDUSTRIES LIMITED FINANCIAL STATEMENTS. for the year ended June 30, Annual Report for the year ended June 30, 2015 /
 MUGHAL IRON & STEEL INDUSTRIES LIMITED FINANCIAL STATEMENTS for the year ended June 30, 2015 Annual Report for the year ended June 30, 2015 / 69 GLOBAL PRESENCE LOCAL EXCELLENCE FAZAL MAHMOOD & COMPANY
Annual Report for the year ended June 30, 2014 FINANCIAL STATEMENTS
 Annual Report FINANCIAL STATEMENTS 33 34 Mughal Iron & Steel Industries Limited Annual Report 35 AUDITORS REPORT TO THE MEMBERS We have audited the annexed balance sheet of MUGHAL IRON & STEEL INDUSTRIES
Chief Executive. March 7, Annual Report 2007 Azgard 9 21
 Statement of Compliance with Best Practices of Code of Corporate Governance for the Year Ended December 31, 2007 AZGARD-9 This statement is being presented to comply with the Code of Corporate Governance
ROSHAN PACKAGES (PRIVATE) LIMITED
 LIMITED") ROSHAN PACKAGES (PRIVATE) LIMITED FINANCIAL STATEMENTS FOR THE YEAR ENDED JUNE 30, 2016 AUDITORS' REPORT TO THE MEMBERS We have audited the annexed balance sheet of Roshan Packages (Private) Limited ('the
ROSHAN PACKAGES (PRIVATE) LIMITED FINANCIAL STATEMENTS FOR THE YEAR ENDED JUNE 30, 2016 AUDITORS' REPORT TO THE MEMBERS We have audited the annexed balance sheet of Roshan Packages (Private) Limited ('the
ANJUM TEXTILE MILLS (PVT.) LTD. BALANCE SHEET AS AT JUNE 30, 2012
 LTD. BALANCE SHEET AS AT JUNE 30, 2012") ANJUM TEXTILE MILLS (PVT.) LTD. BALANCE SHEET AS AT JUNE 30, 2012 2012 2011 2012 2011 NOTE RUPEES RUPEES NOTE RUPEES RUPEES EQUITY & LIABILITIES SHARE CAPITAL AND RESERVES ASSETS NON CURRENT ASSETS SHARE
ANJUM TEXTILE MILLS (PVT.) LTD. BALANCE SHEET AS AT JUNE 30, 2012 2012 2011 2012 2011 NOTE RUPEES RUPEES NOTE RUPEES RUPEES EQUITY & LIABILITIES SHARE CAPITAL AND RESERVES ASSETS NON CURRENT ASSETS SHARE
FINANCIAL STATEMENTS FOR THE YEAR ENDED DECEMBER 31, 2013 ANNUAL REPORT 13
 FINANCIAL STATEMENTS 41 ANNUAL REPORT 13 AUDITORS REPORT TO THE MEMBERS We have audited the annexed statement of financial position of Pakistan Telecommunication Company Limited (the Company) as at December
Crescent Steel and Allied Products Limited Unconsolidated Financial Statements For the year ended 30 June 2014
 Crescent Steel and Allied Products Limited Unconsolidated Financial Statements Financial Statements of this Annual Report are printed on 100% recycled paper. REVIEW REPORT TO THE MEMBERS on Statement of
 Statement of Financial Position As at September 30, 2018 September 30 September 30 September 30 2018 2017 2016... Restated... ASSETS Notes... (Rupees in '000)... NON-CURRENT ASSETS Property, plant and
UNCONSOLIDATED FINANCIAL STATEMENTS
 Crescent Steel and Allied Products Limited UNCONSOLIDATED FINANCIAL STATEMENTS FOR THE YEAR ENDED 30 JUNE 2016 Financial Statements of this Annual Report are printed on 100% recycled paper. REVIEW REPORT
Financial Report 2016 EXCELLENCE THROUGH GROWTH
 Financial Report 2016 EXCELLENCE THROUGH GROWTH CONTENTS 01 02 04 Auditors Report to the Members Balance Sheet Profit and Loss Account 05 06 07 Statement of Comprehensive Income Cash Flow Statement Water
ICI Pakistan Limited Unconsolidated Balance Sheet As at June 30, 2017
 ICI Pakistan Limited Unconsolidated Balance Sheet ASSETS Note Non-current assets Property, plant and equipment 3 19,613,523 17,040,334 Intangible assets 4 19,273 16,460 19,632,796 17,056,794 Long-term
MCB Bank Limited Financial Statements For the year ended December 31, 2017
 MCB Bank Limited Financial Statements For the year ended December 31, 2017 MCB BANK LIMITED UNCONSOLIDATED STATEMENT OF FINANCIAL POSITION AS AT DECEMBER 31, 2017 Note 2017 2016 ASSETS Cash and balances
ANJUM TEXTILE MILLS (PVT) LTD. BALANCE SHEET AS AT JUNE 30, 2014
 LTD. BALANCE SHEET AS AT JUNE 30, 2014") ANJUM TEXTILE MILLS (PVT) LTD. BALANCE SHEET JUNE 30, 2014 2014 2013 2014 2013 NOTE RUPEES RUPEES NOTE RUPEES RUPEES EQUITY & LIABILITIES SHARE CAPITAL AND RESERVES ASSETS NON CURRENT ASSETS SHARE CAPITAL
ANJUM TEXTILE MILLS (PVT) LTD. BALANCE SHEET JUNE 30, 2014 2014 2013 2014 2013 NOTE RUPEES RUPEES NOTE RUPEES RUPEES EQUITY & LIABILITIES SHARE CAPITAL AND RESERVES ASSETS NON CURRENT ASSETS SHARE CAPITAL
Auditors Report to the Members
 Auditors Report to the Members We have audited the annexed unconsolidated balance sheet of Habib Bank Limited as at December 31, 2008 and the related unconsolidated profit and loss account, unconsolidated
TO THE MEMBERS AUDITORS REPORT
 61 62 AUDITORS REPORT TO THE MEMBERS We have audited the annexed statement of financial position of Pakistan Telecommunication Company Limited (the Company) as at December 31, 2016 and the related statement
BlueScope Financial Report 2013/14
 BlueScope Financial Report /14 ABN 16 000 011 058 Annual Financial Report - Page Financial statements Statement of comprehensive income 2 Statement of financial position 4 Statement of changes in equity
AUDITORS REPORT TO THE MEMBERS
 AUDITORS REPORT TO THE MEMBERS We have audited the annexed balance sheet of Clover Pakistan Limited (the Company) as at June 30, 2007 and the related profit and loss account, cash flow statement and statement
PSO: Financial Overview
 PSO: Financial Overview Driving the Economy Nation s PSO at a Glance Rupees in Million (Unless Noted) 2008 2007 2006 2005 2004 2003 2002 2001 2000 1999 Sales Volume (Million Tons) 13.0 11.8 9.8 9.7 8.6
BLUESCOPE STEEL LIMITED FINANCIAL REPORT 2011/2012
 BLUESCOPE STEEL LIMITED FINANCIAL REPORT / ABN 16 000 011 058 Annual Financial Report - Page Financial statements Statement of comprehensive income 2 Statement of financial position 3 Statement of changes
ICI Pakistan Limited Condensed Interim Unconsolidated Statement of Financial Position As at September 30, 2018
 Condensed Interim Unconsolidated Statement of Financial Position ASSETS Note Non-current assets Property, plant and equipment 4 20,181,628 20,576,333 Intangible assets 5 923,124 924,294 21,104,752 21,500,627
Auditors Report to the Members
 Auditors Report to the Members We have audited the annexed consolidated financial statements comprising consolidated balance sheet of Azgard Nine Limited ("the Company") and its subsidiaries (hereinafter
Reliance Weaving Mills Limited Balance Sheet As at 30 June 2010
 Reliance Weaving Mills Limited Balance Sheet As at 30 June 2010 EQUITY AND LIABILITIES Note 2010 2009 Note 2010 2009 ASSETS Share capital and reserves Non-current assets Authorized capital Property, plant
AUDITORS REPORT TO THE MEMBERS OF FEROZSONS LABORATORIES LIMITED
 AUDITORS REPORT TO THE MEMBERS OF FEROZSONS LABORATORIES LIMITED We have audited the annexed consolidated financial statements comprising consolidated balance sheet of Ferozsons Laboratories Limited (
the expenditure incurred during the year was for the purpose of the Bank s business; and
 A.F. FERGUSON & CO CHARTERED ACCOUNTANTS State Life Building No.1-C, I.I. Chundrigar Road, Karachi KPMG TASEER HADI & CO. CHARTERED ACCOUNTANTS Sheikh Sultan Trust Building No. 2, Beaumont Road, Karachi
CONTINGENCIES AND COMMITMENTS 24. The annexed notes 1 to 48 and Annexures I to IV form an integral part of these financial statements.
 FAYSAL BANK LIMITED STATEMENT OF FINANCIAL POSITION AS AT DECEMBER 31, 2014 Note 2014 2013 -------------- Rupees '000 ------------- ASSETS Cash and balances with treasury banks 8 20,285,851 28,422,497
Condensed Interim Consolidated Financial Information
 Report for the quarter & six months ended 2014 Contents Company Information 01 Directors' Report 02 Auditors' Report to the Members on Review of Interim Financial Information 05 Condensed Interim Balance
Consolidated Balance Sheet As at 30 June 2010
 Consolidated Balance Sheet As at 30 June 2010 Crescent Steel & Allied Products Ltd. Note EQUITY AND LIABILITIES Share capital and reserves Authorized capital 100,000,000 ordinary shares of Rs. 10 each
NOTES TO THE FINANCIAL STATEMENTS
 NOTES TO THE FINANCIAL STATEMENTS 1. ACCOUNTING POLICIES 1.1 Nature of business Super Group Limited (Registration number 1943/016107/06), the holding Company (the Company) of the Group, is a Company listed
ALLIED FOODS (N.Z.) LIMITED AND SUBSIDIARIES ANNUAL REPORT FOR THE 52 WEEK PERIOD ENDED 3 SEPTEMBER 2017
 LIMITED AND SUBSIDIARIES ANNUAL REPORT FOR THE 52 WEEK PERIOD ENDED 3 SEPTEMBER 2017") ALLIED FOODS (N.Z.) LIMITED AND SUBSIDIARIES ANNUAL REPORT FOR THE 52 WEEK PERIOD ENDED 3 SEPTEMBER 2017 Directors' declaration Directors' report Audit report 2 3 4-5 Consolidated financial statements
ALLIED FOODS (N.Z.) LIMITED AND SUBSIDIARIES ANNUAL REPORT FOR THE 52 WEEK PERIOD ENDED 3 SEPTEMBER 2017 Directors' declaration Directors' report Audit report 2 3 4-5 Consolidated financial statements
MCB Bank Limited Financial Statements For the year ended December 31, 2012
 MCB Bank Limited Financial Statements For the year ended December 31, 2012 MCB BANK LIMITED STATEMENT OF FINANCIAL POSITION AS AT DECEMBER 31, 2012 ASSETS Note 2012 2011 Cash and balances with treasury
Vitafoam Nigeria Plc. Consolidated and Separate financial statements Year ended 30 September 2014
 . Year ended 30 September 2014 Table of Contents Statement of Directors Responsibilities... i Report of the independent auditors... 1 & Statement of Profit or Loss and other Comprehensive Income... 2 &
To the Shareholders of Major Cineplex Group Public Company Limited
 AUDITOR S REPORT To the Shareholders of I have audited the accompanying consolidated and company financial statements of Major Cineplex Group Public Limited and its subsidiaries and of, which comprise
Notes to the financial statements
 11 1. Accounting policies 1.1 Nature of business Super Group Limited (Registration number 1943/016107/06), the holding Company of the Group (the Company), is a Company listed on the Main Board of the JSE
OUR GOVERNANCE. The principal subsidiary undertakings of the Company at 3 April 2015 are detailed in note 4 to the Company balance sheet on page 109.
 STRATEGIC REPORT OUR GOVERNANCE FINANCIAL STATEMENTS SHAREHOLDER INFORMATION POLICIES GENERAL INFORMATION Halfords Group plc is a company domiciled in the United Kingdom. The consolidated financial statements
Notes to the Financial Statements
 170 MARUTI SUZUKI INDIA LIMITED Notes to the Financial Statements 1. Summary of Significant Accounting Policies 1.1 General Information The Company is primarily in the business of manufacturing, purchase
ICI Pakistan Limited Condensed Interim Consolidated Statement of Financial Position As at September 30, 2018
 ICI Pakistan Limited Condensed Interim Consolidated Statement of Financial Position As at ASSETS Note Non-current assets Property, plant and equipment 4 23,149,981 22,375,943 Intangible assets 5 1,687,206
 CONDENSED INTERIM BALANCE SHEET As At September 30, 2012 ASSETS Non-current assets Property plant and equipment 5 9,702,680 9,491,653 Intangible assets 6 13,028 11,343 Long term loans 5,352 4,032 Long
Nigerian Aviation Handling Company PLC
 Nigerian Aviation Handling PLC Financial Statements -- Q1 2018 Nigerian Aviation Handling PLC Consolidated Statement of Comprehensive Income 1 Consolidated Statement of Financial Position 2 Statement of
AUDITORS REPORT TO THE MEMBERS
 A. F. FERGUSON & CO. Chartered Accountants State Life Building 1-C I. I. Chundrigar Road Karachi KPMG TASEER HADI & CO. Chartered Accountants Sheikh Sultan Trust Building No. 2 Beaumont Road Karachi AUDITORS
CHELLARAMS PLC RC 639
 CHELLARAMS PLC RC 639 QUARTERLY FINANCIAL STATEMENTS FOR THE PERIOD ENDING 31 DECEMBER, 2018 FRC/2013/IODN/00000005336 FRC/2013/IODN/00000005335 Page 1 CONTENTS COMPLIANCE CERTIFICATE 3-4 CONSOLIDATED
LIVESTOCK FEEDS PLC FINANCIAL STATEMENTS 31 DECEMBER 2015
 LIVESTOCK FEEDS PLC FINANCIAL STATEMENTS 31 DECEMBER 2015 REPORT OF THE INDEPENDENT AUDITORS TO THE MEMBERS OF LIVESTOCK FEEDS PLC We have audited the accompanying financial statements of Livestock Feeds
UNCONSOLIDATED FINANCIAL STATEMENTS FOR THE YEAR ENDED DECEMBER 31, 2016.
 UNCONSOLIDATED FINANCIAL STATEMENTS FOR THE YEAR ENDED DECEMBER 31, 2016. UNCONSOLIDATED STATEMENT OF FINANCIAL POSITION AS AT DECEMBER 31, 2016 ASSETS Note 2016 2015 Cash and balances with treasury banks
Chairman s Review
 Chairman s Review Balance Sheet as at June 30, 2009 Note EQUITY AND LIABILITIES CAPITAL AND RESERVES Authorised capital 3,600,000,000 (2008: 3,600,000,000) ordinary shares of Rs 10 each 36,000,000
ICI Pakistan Limited Condensed Interim Consolidated Balance Sheet As at December 31, 2016
 Condensed Interim Consolidated Balance Sheet As at ASSETS Note Non-current assets Property, plant and equipment 4 17,301,593 17,164,769 Intangible assets 5 13,694 16,460 17,315,287 17,181,229 Long-term
NOTES FORMING PART OF THE FINANCIAL STATEMENTS 1. CORPORATE INFORMATION. 2. BASIS OF PREPARATION AND PRESENTATION 2.1 Statement of compliance
 103 1. CORPORATE INFORMATION company domiciled and incorporated under the provisions of the Companies Act, 1956. The Company is engaged in the manufacturing and selling of motorised 2. BASIS OF PREPARATION
Auditors Report to the Members
 Auditors Report to the Members We have audited the annexed balance sheet of Shakarganj Mills Limited as at September 30, 2010 and the related profit and loss account, statement of comprehensive income,
Total Non-Current Assets 11,052,694 7,819,990
 Balance Sheet as at Notes As at As at ASSETS Non-current Assets Property Plant and Equipment ('PPE') 3 6,074,314 2,513,990 Financial Assets (i) Other Financial Assets 4 4,978,380 4,386,000 Other Non-current
Independent Auditor s report to the members of Standard Chartered PLC
 Financial statements and notes Independent Auditor s report to the members of Standard Chartered PLC For the year ended 31 December We have audited the financial statements of the Group (Standard Chartered
Continuing operations Revenue 3(a) 464, ,991. Revenue 464, ,991
 464, ,991. Revenue 464, ,991") STATEMENT OF PROFIT OR LOSS For the year ended 30 June 2017 Consolidated Consolidated Note Continuing operations Revenue 3(a) 464,411 323,991 Revenue 464,411 323,991 Other Income 3(b) 4,937 5,457 Share
STATEMENT OF PROFIT OR LOSS For the year ended 30 June 2017 Consolidated Consolidated Note Continuing operations Revenue 3(a) 464,411 323,991 Revenue 464,411 323,991 Other Income 3(b) 4,937 5,457 Share
ICI Pakistan Limited Condensed Interim Unconsolidated Balance Sheet As at December 31, 2016
 Condensed Interim Unconsolidated Balance Sheet As at Note June 30, (Audited) ASSETS Non-current assets Property, plant and equipment 4 17,201,095 17,040,334 Intangible assets 5 13,694 16,460 17,214,789
Nigerian Aviation Handling Company PLC
 Nigerian Aviation Handling PLC Financial Statements -- H1 2018 Nigerian Aviation Handling PLC Consolidated Statement of Comprehensive Income 1 Consolidated Statement of Financial Position 2 Statement of
Independent auditors report to the members of GKN plc
 .73 Independent auditors report to the members of We have audited the Group financial statements of for the year ended 31 December 2011 which comprise the Consolidated Income Statement, the Consolidated
Total assets Total equity Total liabilities
 Group balance sheet as at 31 December Notes R 000 R 000 ASSETS Non-current assets Property, plant and equipment 3 3 263 500 3 166 800 Intangible assets 4 69 086 66 917 Retirement benefit asset 26 117 397
Presentation of Financial Statements
 Presentation of Financial Statements Disclosure Requirements as per The Companies Ordinance, 1984 TABANI'S SCHOOL OF ACCOUNTANCY Presented by : Mr. Sharif Tabani 2005 Balance Sheet Note 2005 2004 SHARE
Jubilant Infrastructure Limited Ind AS financial statements March 2017
 Ind AS financial statements March 2017 Balance Sheet as at Notes 1 April 2015 ASSETS Non-current assets Property, plant and equipment 3 1,459,327 1,354,722 1,227,256 Capital work-in-progress 3 11,073 24,708
TRUE MOVE COMPANY LIMITED CONSOLIDATED AND COMPANY FINANCIAL STATEMENTS 31 DECEMBER 2013
 TRUE MOVE COMPANY LIMITED CONSOLIDATED AND COMPANY FINANCIAL STATEMENTS 31 DECEMBER 2013 Statement of Financial Position As at 31 December 2013 Restated Restated Restated Restated 31 December 31 December
Independent Auditor s Report to the Members of Caltex Australia Limited
 61 Independent Auditor s Report to the Members of Caltex Australia Limited Report on the financial report We have audited the accompanying financial report of Caltex Australia Limited (the Company), which
Learn Africa Plc. Quarter 1 Unaudited Financial Statement 1 st January to 31 st March 2018
 Learn Africa Plc Quarter 1 Unaudited Financial Statement 1 st January to 31 st March 2018 1 Contents Statements of Accounting Policies 3 Statement of Comprehensive Income 11 Statement of Financial Position
AUDITORS REPORT TO THE MEMBERS
 A.F. FERGUSON & CO CHARTERED ACCOUNTANTS State Life Building No.1-C, I.I. Chundrigar Road, Karachi KPMG TASEER HADI & CO. CHARTERED ACCOUNTANTS Sheikh Sultan Trust Building No. 2, Beaumont Road, Karachi
INDEPENDENT AUDITOR S REPORT. To the Members of Lucina Infrastructure Limited Report on the Financial Statements
 INDEPENDENT AUDITOR S REPORT To the Members of Lucina Infrastructure Limited Report on the Financial Statements We have audited the accompanying financial statements of Lucina Infrastructure Limited (
Financial review Refresco Financial review 2017
 Financial review 2017 Financial review 2017 Financial review 2017 1 69 Consolidated income statement For the year ended December 31, 2017 (x 1 million euro) Note December 31, 2017 December 31, 2016 Revenue
Notes to the Financial Statements
 1. CORPORATE INFORMATION The Company was incorporated as an exempted company with limited liability in the Cayman Islands on 26 November 2003 under the Companies Law, Cap. 22 (Law 3 of 1961, as consolidated
Financial Information. Shaukat Khanum Memorial Trust
 2010 ANNUAL REPORT Financial Information Shaukat Khanum Memorial Trust HONORARY AUDITORS REPORT TO THE BOARD OF GOVERNORS We have audited the annexed balance sheet of Shaukat Khanum Memorial Trust ( the
PAO SIBUR Holding. International Financial Reporting Standards Consolidated Financial Statements and Independent Auditor s Report.
 PAO SIBUR Holding International Financial Reporting Standards Consolidated Financial Statements and Independent Auditor s Report 31 December 2017 Table of Contents Independent Auditor s Report IFRS Consolidated
Financial statements: contents
 Section 6 Financial statements 93 Financial statements: contents Consolidated financial statements Independent auditors report to the members of Pearson plc 94 Consolidated income statement 96 Consolidated
Directors Review 1. Condensed Interim Balance Sheet 2. Condensed Interim Profit & Loss Account 4. Condensed Interim Statement of Changes in Equity 5
 Contents Directors Review 1 Condensed Interim Balance Sheet 2 Condensed Interim Profit & Loss Account 4 Condensed Interim Statement of Changes in Equity 5 Condensed Interim Statement of Cash Flows 6 Condensed
Interpretations effective in the year ended 28 February 2009 Standards and interpretations not yet effective
 Accounting Policies Interpretations effective in the year ended 28 February 2009 IFRS 7 Financial instruments: disclosures. This amendment introduces new disclosures relating to financial instruments and
NOTES TO THE FINANCIAL STATEMENTS For the year ended 31st December, 2013
 1. GENERAL Cosmos Machinery Enterprises Limited (the Company ) is a public limited company domiciled and incorporated in Hong Kong and its shares are listed on The Stock Exchange of Hong Kong Limited (the
Homeserve plc. Transition to International Financial Reporting Standards
 Homeserve plc Transition to International Financial Reporting Standards 28 November 2005 1 Transition to International Financial Reporting Standards ( IFRS ) Homeserve is today announcing its interim results
Financials. Mike Powell Group Chief Financial Officer
 Financials 98 Group income statement 99 Group statement of comprehensive income 99 Group statement of changes in equity 100 Group balance sheet 101 Group cash flow statement 102 Notes to the consolidated
OIL AND GAS DEVELOPMENT COMPANY LIMITED BALANCE SHEET AS AT 30 JUNE 2013
 BALANCE SHEET AS AT 30 JUNE 2013 Note Note SHARE CAPITAL AND RESERVES NON CURRENT ASSETS Fixed assets Share capital 4 43,009,284 43,009,284 Property, plant and equipment 12 52,605,226 40,966,441 Development
ICI Pakistan Limited Consolidated Balance Sheet As at June 30, 2017
 ICI Pakistan Limited Consolidated Balance Sheet ASSETS Note June 30, Amounts in PKR '000 June 30, Non-current assets Property, plant and equipment 4 19,958,615 17,164,769 Intangible assets 5 783,356 16,460
Pearson plc IFRS Technical Analysis
 Pearson plc IFRS Technical Analysis Contents A. Introduction B. Basis of presentation C. Accounting Policies D. Critical Accounting Assumptions and Judgements Schedules 1. Income statement Reconciliation
Nigerian Breweries Plc RC: 613. Unaudited Interim Financial Statements
 RC: 613 Unaudited Interim Financial Statements As at 31 st March, 2014 Condensed Interim Financial Statements for the three months period ended 31 st March, 2014 Contents Page Statement of Condensed Financial
DR. WU SKINCARE CO., LTD. AND SUBSIDIARIES CONSOLIDATED FINANCIAL STATEMENTS AND REVIEW REPORT OF INDEPENDENT ACCOUNTANTS DECEMBER 31, 2017 AND 2016
 DR. WU SKINCARE CO., LTD. AND SUBSIDIARIES CONSOLIDATED FINANCIAL STATEMENTS AND REVIEW REPORT OF INDEPENDENT ACCOUNTANTS DECEMBER 31, 2017 AND 2016 For the convenience of readers and for information purpose
 01 03 04 05 DIRECTORS' REPORT TO THE MEMBERS ON UNCONSOLIDATED CONDENSED INTERIM FINANCIAL INFORMATION On behalf of the Board, I am pleased to present the unconsolidated financial information of the Company
statements annual financial statements 70 Group salient features 71 Five-year summary of results Annexure a: interest-bearing borrowings
 annual financial statements Annual financial statements 70 Group salient features 71 Five-year summary of results 72 Summary of statistics 73 Definitions 74 Ordinary share ownership 75 Financial review
The notes on pages 7 to 59 are an integral part of these consolidated financial statements
 CONSOLIDATED BALANCE SHEET As at 31 December Restated Restated Notes 2013 $'000 $'000 $'000 ASSETS Non-current Assets Investment properties 6 68,000 68,000 - Property, plant and equipment 7 302,970 268,342
Statements of Changes in Equity
 Statements of Changes in Equity Attributable to owners of the parent Revalua- Fair Actuarial Non- Share Share Share tion value Hedging losses Associate Retained Owners controlling application Total Note
Notes. These financial statements were approved for issue by the board of directors on May 08, 2017.
 THE WELSPUN CORP STORY GOVERNANCE REPORTS FINANCIAL STATEMENTS annexed to and forming part of the standalone balance sheet as at and the standalone statement of profit and loss for the year ended Statement
GLAXOSMITHKLINE CONSUMER NIGERIA PLC ANNUAL REPORT AND FINANCIAL STATEMENTS FOR THE PERIOD ENDED 30 SEPTEMBER, 2015
 GLAXOSMITHKLINE CONSUMER NIGERIA PLC ANNUAL REPORT AND FINANCIAL STATEMENTS FOR THE PERIOD ENDED 30 SEPTEMBER, Statements of comprehensive income Note N'000 N'000 N'000 N'000 N'000 N'000 Revenue 4 23,040,004
 Industrial and Commercial Bank of China Limited - Pakistan Branches Notes to the Financial Statements For the year ended December 31, 2013 1. STATUS AND NATURE OF BUSINESS The Pakistan branches of Industrial
Income Statements...39 Statements of Recognised Income and Expense...40 Balance Sheets...41 Statements of Cash Flows...42
 38 GWA INTERNATIONAL LIMITED 2007 ANNUAL REPORT CONTENTS Income Statements...39 Statements of Recognised Income and Expense...40 Balance Sheets...41 Statements of Cash Flows...42 Note 1 Significant accounting
Vitafoam Nigeria Plc. Unaudited Interim Consolidated and separate financial statements for the 3 months ended 31 December, 2016
 Unaudited Interim Consolidated and separate financial statements for the 3 months ended 31 December, 2016 Unaudited Interim Consolidated and separate financial statements for the 3 months ended 31 December,
INDEPENDENT AUDITOR S REPORT TO THE BOARD OF DIRECTORS OF HEXAWARE TECHNOLOGIES LIMITED
 INDEPENDENT AUDITOR S REPORT TO THE BOARD OF DIRECTORS OF HEXAWARE TECHNOLOGIES LIMITED Report on the Condensed Interim Standalone Ind AS Financial Statements We have audited the accompanying condensed
Thai Carbon Black Public Company Limited and its Subsidiary. Financial statements for the year ended 31 March 2017 and Independent Auditor s Report
 Thai Carbon Black Public Company Limited and its Subsidiary Financial statements for the year ended 31 March 2017 and Independent Auditor s Report Independent Auditor s Report To the Shareholders of Thai
RC: NOTORE CHEMICAL INDUSTRIES PLC UNAUDITED INTERIM FINANCIAL STATEMENTS FOR THE NINE MONTHS ENDED 30 JUNE 2018
 RC: 640303 NOTORE CHEMICAL INDUSTRIES PLC UNAUDITED INTERIM FINANCIAL STATEMENTS UNUADITED INTERIM FINANCIAL STATEMENTS Page Financial statements Consolidated statements of profit or loss and other comprehensive
Total assets
 GROUP BALANCE SHEET AS AT 31 DECEMBER Notes R 000 R 000 ASSETS Non-current assets Property, plant and equipment 3 3 166 800 2 697 148 Intangible assets 4 66 917 59 777 Retirement benefit asset 27 142 292
BİM Birleşik Mağazalar Anonim Şirketi. Financial Statements March 31, 2008
 BİM Birleşik Mağazalar Anonim Şirketi Financial Statements BİM BİRLEŞİK MAĞAZALAR A.Ş. TABLE OF CONTENTS Page Balance Sheet 1 Statement of Income 2 Statement of Changes in Equity 3 Statement of Cash Flows
Coca- Cola Hellenic Bottling Company S.A.
 Coca- Cola Hellenic Bottling Company S.A. Annual Report Table of Contents A. Independent Auditor s Report B. Consolidated Financial Statements Consolidated Balance Sheet... 1 Consolidated Income Statement........
STATEMENT OF FINANCIAL POSITION as at 31 March 2009
 STATEMENT OF FINANCIAL POSITION as at 31 March 2009 Restated Restated Restated Restated 31 March 31 March 1 April 31 March 31 March 1 April 2009 2008 2007 2009 2008 2007 Note R 000 R 000 R 000 R 000 R
Financial reports. 10 Eumundi Group Limited & Controlled Entities
 Financial reports 10 Eumundi Group Limited & Controlled Entities The Directors Eumundi Group Limited Level 15, 10 Market Street BRISBANE QLD 4000 Auditor s Independence Declaration As lead auditor for
Financial Statements 2016
 Financial Statements 2016 TREET GROUP OF COMPANIES Treet Corporation Limited CONTENTS Consolidated Financial Statements Financial Statements Society for Cultural Education 02 Auditors Report to the Members
Consolidated Financial Statements Summary and Notes
 Consolidated Financial Statements Summary and Notes Contents Consolidated Financial Statements Summary Consolidated Statement of Total Comprehensive Income 57 Consolidated Statement of Financial Position
Frontier Digital Ventures Limited
 Frontier Digital Ventures Limited Significant accounting policies This note provides a list of the significant accounting policies adopted in the preparation of these consolidated financial statements
CONSOLIDATED STATEMENT OF FINANCIAL POSITION as at 31 March 2016
 CONSOLIDATED STATEMENT OF FINANCIAL POSITION as at 31 March Notes (Restated) (Restated) 2014 ASSETS Non-current assets 5 604 3 654 3 368 Property, equipment and vehicles 5 3 199 2 985 2 817 Intangible
INDEPENDENT AUDITOR S REPORT. To the Members of Sentia Properties Limited Report on the Financial Statements
 INDEPENDENT AUDITOR S REPORT To the Members of Sentia Properties Limited Report on the Financial Statements We have audited the accompanying financial statements of Sentia Properties Limited ( the Company
SAUDI ARAMCO TOTAL REFINING & PETROCHEMICAL COMPANY (SATORP) (A Saudi Arabian Mixed Limited Liability Company)
 (A Saudi Arabian Mixed Limited Liability Company)") SAUDI ARAMCO TOTAL REFINING & PETROCHEMICAL COMPANY (SATORP) CONSOLIDATED FINANCIAL STATEMENTS FOR THE YEAR ENDED 31 DECEMBER 2017 AND INDEPENDENT AUDITOR S REPORT CONSOLIDATED FINANCIAL STATEMENTS FOR
SAUDI ARAMCO TOTAL REFINING & PETROCHEMICAL COMPANY (SATORP) CONSOLIDATED FINANCIAL STATEMENTS FOR THE YEAR ENDED 31 DECEMBER 2017 AND INDEPENDENT AUDITOR S REPORT CONSOLIDATED FINANCIAL STATEMENTS FOR
For the 52 weeks ended 2 May 2010
 36 Greene King plc Annual Report 2010 1 Accounting policies Corporate information The consolidated financial statements of Greene King plc for the 52 weeks ended 2 May 2010 were authorised for issue by