Nufarm Finance (NZ) Limited. Annual Report For the year ended 31 July 2014
|
|
|
- Sherilyn Gregory
- 6 years ago
- Views:
Transcription

1 Annual Report For the year ended 31 July 2014
2 Contents 1 List of abbreviations 2 Directors' report 3 Company directory 4 Corporate governance 5-6 Independent auditor's report 7 Statement of comprehensive income 8 Statement of financial position 9 Statement of cash flows 10 Statement of changes in equity Notes to the financial statements 29 Directors' declaration List of abbreviations ASX Australian Stock Exchange IFRS International Financial Reporting Standards NSS Nufarm Step-up Securities Nufarm Nufarm Limited NZ GAAP New Zealand Generally Accepted Accounting Practice NZ IFRS New Zealand equivalents to International Financial Reporting Standards NZX New Zealand Stock Exchange The Company Nufarm Finance (NZ) Limited $ AUD Nufarm Group Nufarm Limited and subsidiaries 1
3 Directors' Report The directors of the Company have pleasure in submitting their report in respect of the financial year ended 31 July Principal Activities Nufarm Finance (NZ) Limited acts as a financing company for the Nufarm Group. NZX waivers The Company was granted a waiver by NZX Regulation from the requirement under NZX Listing Rule to provide half-yearly reports on the condition that: (a) the Company announced to the market that a half-yearly report for the Company will not be supplied and the reasons for that; the Company made this announcement to the market on 22 March 2007; (b) the Company continues to exist with no other substantive business except as a financing company for the Nufarm group; and (c) that NZX receives Nufarm Limited's half-yearly and full year reports and the Company's full year report and those reports are made available to all Nufarm Step Up Securities holders in accordance with NZX Listing Rule B. Full details of the waiver and NZX decision are available on the Company's site at NZX. Results The net profit attributable to members of the Company for the 12 months to 31 July 2014 is $9,668,244. The comparable figure for the 12 months to 31 July 2013 was a net profit of $11,461,961 For and on behalf of the Board KM Hoggard Director WB Goodfellow Director Date:
4 Company directory Nature of Business Credit rating Registered Office To act as a financing company for the Nufarm Group. The Company has 2,510,000 Nufarm Step-up Securities issued, and is a listed debt issuer on the NZX. Nufarm Limited has a credit rating of BB issued by S&P. 6 Manu Street Otahuhu, AUCKLAND Telephone: Facsimile: Incorporation Number Directors Directors Interest Dr W B Goodfellow Mr K M Hoggard Mr D J Rathbone Mr B K Sutherland (appointed 1 April 2014) Mr P J Clement (ceased 1 April 2014) Directors' Fees were not paid by Nufarm Finance (NZ) Limited. Dr W B Goodfellow held a non-beneficial interest in 47,723 and a beneficial interest in 700 Nufarm Step-up Securities at balance date. Mr D J Rathbone held a non-beneficial interest in 1,000 and a beneficial interest in 500 Nufarm Step-up Securities at balance date. Parent Company Auditor Bank Solicitor Nufarm Limited KPMG Bank of New Zealand Dawson Harford & Partners Distribution of Nufarm Step-up Securities Holders and Nufarm Step-up Securities as at 31 July 2014 Size of Holding Number of Security Holders Number of Securities % 34, % , % 743, % 1,000-4, % 432, % 5,000-9, % 123, % 10, % 1,177, % 3, % 2,510, % Geographic distribution: New Zealand 1, % 663, % Australia 1, % 1,836, % Rest of World % 10, % 3, % 2,510, % 3
5 Corporate Governance The Company recognises its responsibilities to comply with appropriate corporate governance standards and guidelines, including those set out by the New Zealand Securities Commission, ASX and NZX. As a wholly owned subsidiary of Nufarm a company registered in Australia and listed on the ASX, the Company fully complies with the corporate governance practices of Nufarm. A copy of Nufarm's corporate governance practices are disclosed in full in its annual report and are also available to Nufarm Step-up Securities Holders on Nufarm's website at The Board of the Company includes the Managing Director and one further Director of the Nufarm Group. The directors of Nufarm Finance believe that the overarching governance procedures of Nufarm provides an appropriate basis for ensuring the company meets its fiduciary obligations to the Nufarm Step-Up Securities holders. 4
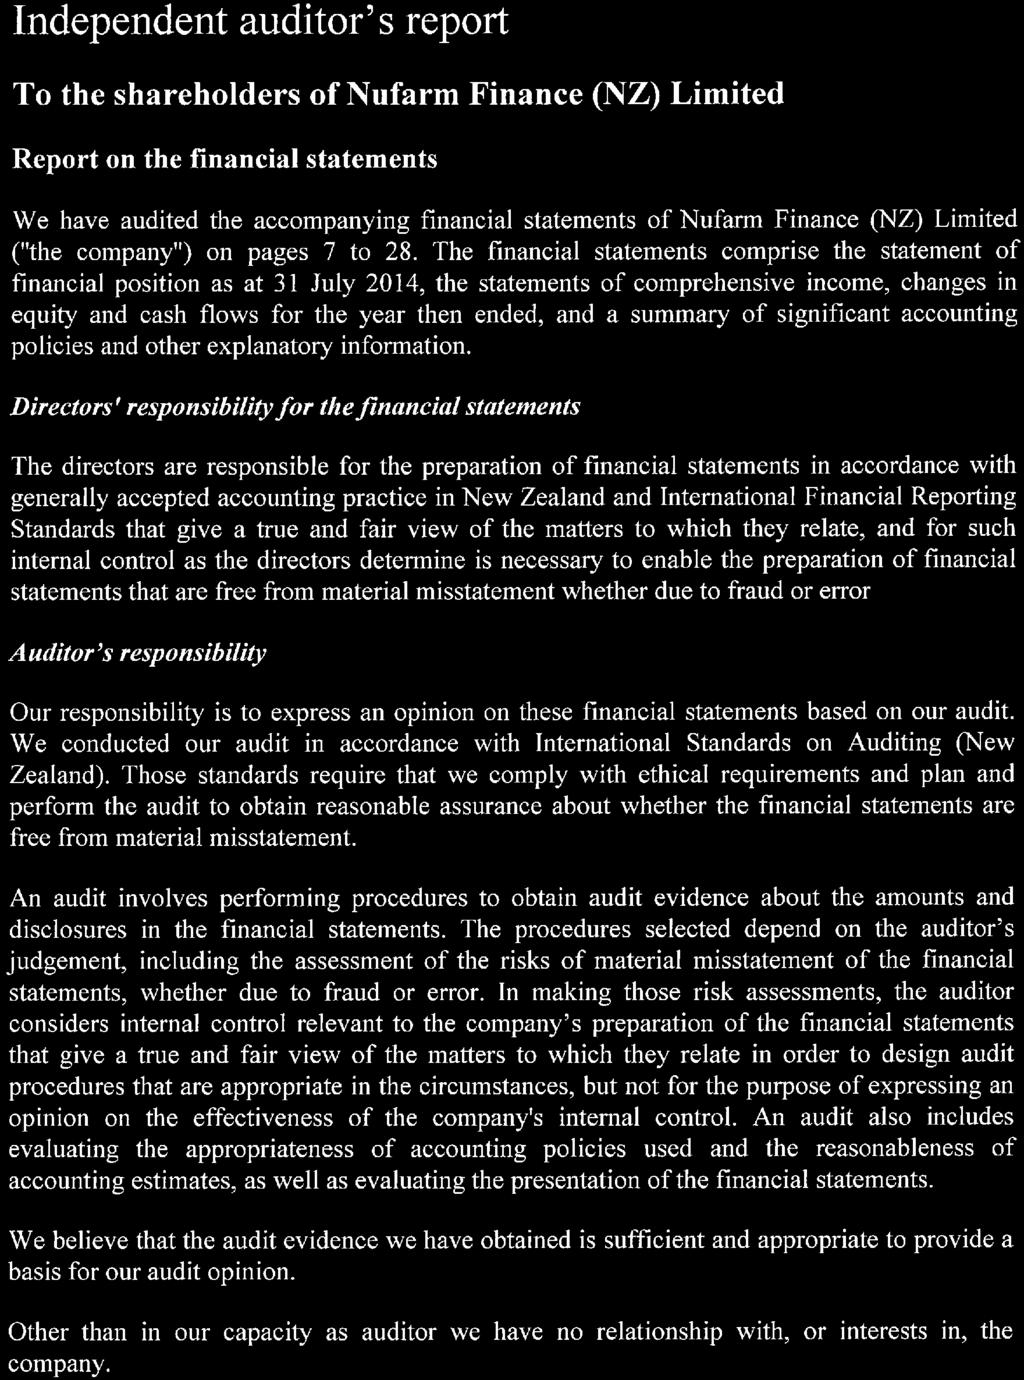
6 5
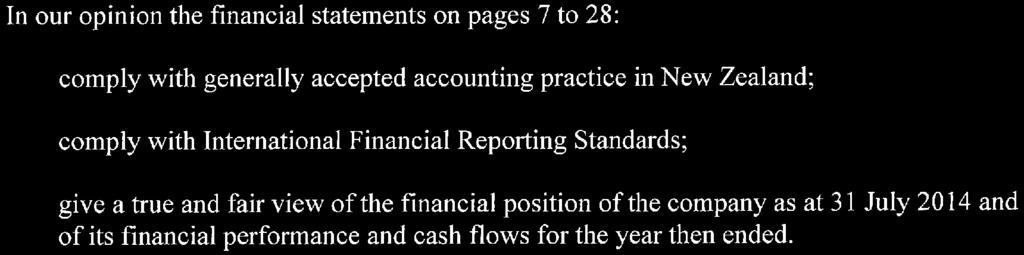
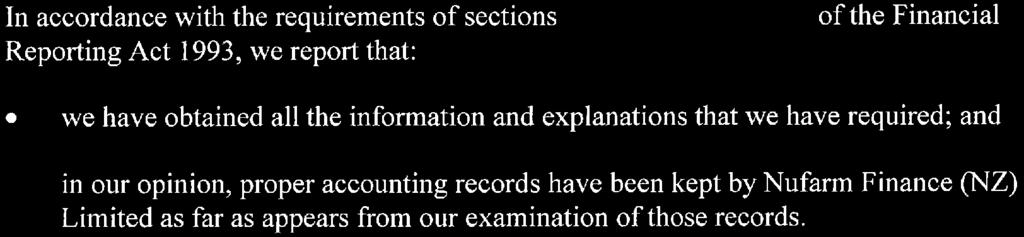

7 6
8 Statement of comprehensive income Note Operating expenses (237,162) (227,429) Finance income 6 16,077,522 19,241,115 Finance expense 7 (165,981) (1,681,768) Net Finance Income 15,911,541 17,559,347 Profit before income tax 15,674,379 17,331,918 Income tax expense 8 (6,006,135) (5,869,957) Profit for the period 9,668,244 11,461,961 Other comprehensive income for the period, net of income tax - - Total comprehensive income for the period 9,668,244 11,461,961 Earnings per share Basic earnings per share (cents) Diluted earnings per share (cents) The Statement of comprehensive income is to be read in conjunction with the attached notes. 7
9 Statement of financial position As at 31 July 2014 Note Assets Loan receivable - related parties ,145, ,340,899 Deferred tax asset 9 4,370,065 7,936,703 Total non-current assets 230,515, ,277,602 Cash and cash equivalents ,299 4,964,022 Receivables - related parties 10 1,362,397 4,122,327 Income tax receivable 10,829 26,759 Total current assets 2,184,525 9,113,108 Total Assets 232,700, ,390,710 Equity Share capital 12 9,984,530 9,984,530 Retained earnings (24,321,164) (21,620,472) Total equity attributable to ordinary shareholders (14,336,634) (11,635,942) Nufarm Step-up Securities ,932, ,932,148 Total equity 232,595, ,296,206 Liabilities Payables - other 74,838 94,504 Payables - related parties 10 29,729 - Total current liabilities 104,567 94,504 Total liabilities 104,567 94,504 Total equity and liabilities 232,700, ,390,710 The statement of financial position is to be read in conjunction with the attached notes. 8
10 Statement of cash flows Note Cash flows from operating activities Payments to suppliers (256,828) (217,925) Interest received 18,916,560 17,463,722 Taxation paid (376,594) (445,938) Net cash from operating activities 16 18,283,138 16,799,859 Cash flows from financing activities Nufarm Step Securities distribution (16,905,343) (18,944,511) Related Party Loans - repaid/(advanced) (5,530,518) 2,932,918 Net cash used in financing activities (22,435,861) (16,011,593) Net increase/(decrease) in cash and cash equivalents (4,152,723) 788,266 Opening cash and cash equivalents 4,964,022 4,175,756 Cash and cash equivalents at 31 July ,299 4,964,022 The statement of cash flows is to be read in conjunction with the attached notes. 9
11 Statement of changes in equity For the year ended 31 July 2014 Share Retained Total equity Nufarm Total capital earnings attributable to Step-up equity ordinary shareholders securities 2013 Balance at 1 August ,984,530 (19,108,310) (9,123,780) 246,932, ,808,368 Comprehensive income for the year Profit or loss - 11,461,961 11,461,961-11,461,961 Other comprehensive income Total comprehensive income for the year - 11,461,961 11,461,961-11,461,961 Nufarm Step-up Securities distribution - (18,944,511) (18,944,511) - (18,944,511) Tax effect of Nufarm Step-up Securities distribution - 4,970,388 4,970,388-4,970,388 Balance at 31 July ,984,530 (21,620,472) (11,635,942) 246,932, ,296, Balance at 1 August ,984,530 (21,620,472) (11,635,942) 246,932, ,296,206 Comprehensive income for the year Profit or loss - 9,668,244 9,668,244-9,668,244 Other comprehensive income Total comprehensive income for the year - 9,668,244 9,668,244-9,668,244 Nufarm Step-up Securities distribution - (16,905,343) (16,905,343) - (16,905,343) Tax effect of Nufarm Step-up Securities distribution - 4,536,407 4,536,407-4,536,407 Balance at 31 July ,984,530 (24,321,164) (14,336,634) 246,932, ,595,514 The statement of changes in equity is to be read in conjunction with the attached notes. 10
12 Notes to the financial statements 1 Reporting entity The Company is a company incorporated and domiciled in New Zealand The financial statements of the Company are for the year ended 31 July The Company acts as a financing company for the Nufarm Group. The parent and ultimate parent is Nufarm Limited, an Australian registered and listed company. 2 Basis of Preparation (a) Statement of compliance The financial statements have been prepared in accordance with NZ GAAP. They comply with NZ IFRS and other applicable Financial Reporting Standards, as appropriate for profit-oriented entities. The financial statements comply with IFRS. From 1 April 2014, the new Financial Reporting Act 2013 ( FRA 2013 ) has come into force replacing the Financial Reporting Act 1993, this is effective for all for-profit entities with reporting periods beginning on or after 1 April This will be effective for the Company s 31 July 2015 year end. It is expected that the change in legislation will have no material impact on the Company s obligation to prepare general purpose financial statements. In addition to the change in legislation the External Reporting Board of New Zealand ( XRB ) has released a new accounting standards framework which establishes the financial standards to be applied to entities with statutory financial reporting obligations. The Company is currently reporting under NZ IFRS. Under the new XRB framework Management expects that the Company is expected to continue to apply NZ IFRS as applicable for Tier 1 for-profit entities. Management expects that this will have no material impact on the preparation and disclosures included in the financial statements. The financial statements were authorised for issue by the directors on 23 September (b) Basis of measurement The financial statements are prepared on the historical cost basis, except for derivative financial instruments which are measured at fair value. The methods used to measure fair values are discussed further in note 4. This financial report of the Company and the Nufarm Group have been prepared on a going concern basis, which assumes the realisation of assets and extinguishment of liabilities in the ordinary course of business. The going concern basis is considered appropriate by the Directors having regard to the Nufarm Group's access to appropriate lines of credit to support the Nufarm Group's working capital and general corporate financing requirements through its three year A$530 million syndicated bank facility, entered into in December 2013, a debtor's securitisation facility, entered into in August 2011, and the completion of a US $325 million Senior Unsecured Notes offering in October Refer to note 15 for further discussion regarding liquidity risk. 11
13 Notes to the financial statement 2 Basis of preparation (continued) (c) Foreign currency and presentation currency The financial statements are presented in AUD, which is the Company's functional currency. (d) Use of estimates and judgements The preparation of financial statements requires management to make judgements, estimates and assumptions that effect the application of policies and the reported amounts of assets, liabilities, income and expenses. Actual results may differ from these estimates. The estimates and underlying assumptions are reviewed on an ongoing basis. Revisions to accounting estimates are recognised in the period in which the estimates are revised and in any future periods affected. Information about significant areas of estimation uncertainty and critical judgements in applying accounting policies that have the most significant impact on the amount recognised in the financial statements are described below. (i) Income taxes The Company is subject to income taxes in New Zealand. There are many transactions and calculations undertaken during the ordinary course of business for which the ultimate tax determination is uncertain. Where the final tax outcome of these matters is different from the amounts initially recorded, such differences will impact the current and deferred tax provisions in the period in which the tax determination is made. Deferred tax assets are recognised only to the extent that it is probable that future taxable profits will be available against which the assets can be utilised. The assessment of probability involves estimation of a number of factors including future taxable income. (e) Reclassification Where appropriate the comparatives items for 2013 year have been reclassified to conform to the current year's presentation. Such reclassifications did not affect net income or equity. 3 Significant accounting policies Except as described immediately below, the Company's accounting policies have been applied consistently to all periods presented in these financial statements. New standards that have been applied for the first time for the 31 July 2014 annual report are NZ IFRS 13 Fair Value Measurement, Amendments to NZ IFRS 7 Disclosures Offsetting Financial Assets and Financial Liabilities. These standards have introduced new disclosures for the annual report but did not materially affect the entity s accounting policies or any of the amounts recognised in the financial statements. (a) Foreign currency Transactions in foreign currencies are translated to the functional currency at exchange rates at the dates of the transactions. Monetary assets and liabilities denominated in foreign currencies at the reporting date are retranslated to the functional currency at the exchange rate at that date. Foreign currency differences arising on retranslation are recognised in the profit or loss except for differences arising on retranslation of qualifying cash flow hedges. 12
14 Notes to the financial statement 3 Significant accounting policies (continued) (b) Financial Instruments (i) Non-derivative financial assets The company initially recognises loans and receivables on the date that they are originated. All other financial assets (including assets designated at fair value through profit or loss) are recognised initially on the trade date at which the company becomes a party to the contractual provisions of the instrument. The company derecognises a financial asset when the contractual rights to the cash flows from the asset expire, or it transfers the rights to receive the contractual cash flows on the financial asset in a transaction in which substantially all the risk and rewards of ownership of the financial asset are transferred. Any interest in transferred financial assets that is created or retained by the company is recognised as a separate asset or liability. Financial assets and liabilities are offset and the net amount presented in the balance sheet when, and only when, the company has the legal right to offset the amounts and intends to settle on a net basis or to realise the asset and settle the liability simultaneously. The company has the following non-derivative financial assets: loans and receivables. Loans and receivables Loans and receivables are financial assets with fixed or determinable payments that are not quoted in an active market. Such assets are recognised initially at fair value plus any direct attributable transaction costs. Subsequent to initial recognition loans and receivables are measured at amortised cost using the effective interest method, less any impairment losses. Loans and receivables comprise trade and other receivables. Cash and cash equivalents Cash and cash equivalents comprise cash balances. (ii) Non-derivative financial liabilities The company initially recognises debt securities and subordinated liabilities on the date they are originated. All other financial liabilities (including liabilities designated at fair value through profit or loss) are recognised initially on the trade date at which the company becomes a party to the contractual provisions of the instrument. The company derecognises a financial liability when its contractual obligations are discharged or cancelled or expired. Financial assets and liabilities are offset and the net amount presented in the balance sheet when, and only when, the company has the legal right to offset the amounts and intends to settle on a net basis or to realise the asset and settle the liability simultaneously. The company has the following non-derivative financial liabilities: loans and other payables. Such financial liabilities are recognised initially at fair value plus any directly attributable transaction costs. Subsequent to initial recognition these financial liabilities are measured at amortised cost using the effective interest rate method. 13
15 Notes to the financial statement 3 Significant accounting policies (continued) (b) Financial Instruments (continued) (iii) Share capital Ordinary shares Ordinary shares are classified as equity. Incremental costs directly attributable to the issue of ordinary shares are recognised as a deduction from equity, net of any related income tax benefit. Dividends on ordinary shares are recognised as a liability in the period in which they are declared. Hybrid securities The NSS are classified as equity instruments. distributions within equity. After-tax distributions thereon are recognised as The NSS are perpetual step up securities. Distributions on the NSS are at the discretion of the directors and are at a floating rate, unfranked, non-cumulative and subordinated. However, distributions of profits and capital by Nufarm Limited are restricted if distributions to NSS holders are not made, until such time that Nufarm Finance (NZ) Limited makes up the arrears. Further details can be found in note 12 Share capital and reserves. (c) Impairment (i) Non-derivative financial assets A financial asset, not carried at fair value through profit or loss, is assessed at each reporting date to determine whether there is any objective evidence that it is impaired. A financial asset is impaired if objective evidence indicates that a loss event has occurred after the initial recognition of the asset, and that the loss event had a negative effect on the estimated future cash flows of that asset that can be estimated reliably. Objective evidence of impairment includes default or deliquency by a debtor, indications that a debtor will enter bankruptcy, and, in the case of an investment in an equity security, a significant or prolonged decline in its fair value. (ii) Non-financial assets The carrying amounts of the company's non-financial assets, other than inventories and deferred tax assets, are reviewed at each reporting date to determine whether there is any indication of impairment. If any such indication exists, then the asset's recoverable amount is estimated. For goodwill and intangible assets that have indefinite lives or that are not yet available for use, the recoverable amount is estimated at each reporting date. The recoverable amount of an asset or cash-generating unit is the greater of its value in use and its fair value less costs to sell. In assessing value in use, the estimated future cash flows are discounted to their present value using a pre-tax discount rate that reflects current market assessments of the time value of money and the risks specific to the asset. For the purpose of impairment testing, assets are grouped together into the smallest group of assets that generates cash inflows from continuing use that are largely independent of the cash inflows of other assets or groups of assets (the "cash-generating unit"). The goodwill acquired in a business combination, for the purpose of impairment testing, is allocated to cash-generating units that are expected to benefit from the synergies of the combination. 14
16 Notes to the financial statement 3 Significant accounting policies (continued) (c) Impairment (continued) (ii) Non-financial assets (continued) An impairment loss is recognised if the carrying amount of an asset or its cash-generating unit exceeds its estimated recoverable amount. Impairment losses are recognised in profit or loss. Impairment losses recognised in respect of cash-generating units are allocated first to reduce the carrying amount of any goodwill allocated to the units and then to reduce the carrying amount of other assets in the unit on a pro-rata basis. An impairment loss in respect of goodwill is not reversed. In respect of other assets, impairment losses recognised in prior periods are assessed at each reporting date for any indications that the loss has decreased or no longer exists. An impairment loss is reversed if there has been a change in the estimates used to determine the recoverable amount. An impairment loss is reversed only to the extent that the asset's carrying amount does not exceed the carrying amount that would have been determined, net of depreciation or amortisation, if no impairment loss had been recognised. (d) Provisions A provision is recognised if, as a result of a past event, the company has a present legal or constructive obligation that can be estimated reliably, and it is probable that an outflow of economic benefits will be required to settle the obligation. Provisions are determined by discounting the expected future cash flows at a pre-tax rate that reflects current market assessments of the time value of money and the risks specific to the liability. The unwinding of the discount is recognised as a finance cost. (e) Finance income and finance expenses Finance income comprises interest income on funds invested, changes in the fair value of financial assets at fair value through profit or loss, and gains on hedging instruments that are recognised in profit or loss. Interest income is recognised as it accrues in profit or loss, using the effective interest method. Finance expenses comprise interest expense on borrowings, transaction costs, unwinding of the discount on provisions, changes in the fair value of financial assets classified as fair value through profit or loss, dividends on preference shares classified as liabilities, impairment losses recognised on financial assets and losses on hedging instruments that are recognised in profit or loss. Borrowing costs that are not directly attributable to the acquisition, construction or production of a qualifying asset are recognised in profit or loss using the effective interest rate method. (f) Income tax Income tax expense comprises current and deferred tax. Current and deferred taxes are recognised in profit or loss except to the extent that it relates to a business combination, or items recognised directly in equity or in other comprehensive income. Current tax is the expected tax payable or receivable on the taxable income or loss for the year, using tax rates enacted or substantively enacted at the reporting date, and any adjustment to tax payable in respect of previous years. 15
17 Notes to the financial statement 3 Significant accounting policies (continued) (f) Income tax (continued) Deferred tax is recognised in respect of temporary differences between the carrying amounts of assets and liabilities for financial reporting purposes and the amounts used for taxation purposes. Deferred tax is not recognised for the following temporary differences: the initial recognition of assets or liabilities in a transaction that is not a business combination and that affects neither accounting nor taxable profit or loss, and differences relating to investments in subsidiaries and jointly controlled entities to the extent that they will probably not reverse in the foreseeable future. In addition, deferred tax is not recognised for taxable temporary differences arising on the initial recognition of goodwill. Deferred tax is measured at the tax rates that are expected to be applied to the temporary differences when they reverse, based on the laws that have been enacted or substantively enacted by the reporting date. Deferred tax assets and liabilities are offset if there is a legally enforceable right to offset current tax liabilities and assets, and they relate to income taxes levied by the same tax authority on the same taxable entity, or on different tax entities, but they intend to settle current tax liabilities and assets on a net basis or their tax assets and liabilities will be realised simultaneously. A deferred tax asset is recognised for unused tax losses, tax credits and deductible temporary differences, to the extent that it is probable that future taxable profits will be available against which they can be utilised. Deferred tax assets are reviewed at each reporting date and are reduced to the extent that it is no longer probable that the related tax benefit will be realised. (g) Earnings per share The company presents basic and diluted earnings per share (EPS) data for its ordinary shares. Basic EPS is calculated by dividing the profit or loss attributable to ordinary shareholders of the company by the weighted average number of ordinary shares outstanding during the period. Diluted EPS is determined by adjusting the profit or loss attributable to ordinary shareholders and the weighted average number of ordinary shares outstanding for the effects of all potential dilutive ordinary shares, which comprise convertible notes. (h) New standards and interpretations not yet adopted A number of new standards, amendments to standards and interpretations are effective for annual periods beginning after 1 August 2013, and have not been applied in preparing these financial statements. None of these are expected to have a significant effect on the financial statements, except for NZ IFRS 9 Financial Instruments, which becomes mandatory for the 2016 financial statements and could change the classification and measurement of financial assets. The Company does not currently plan to adopt this standard early and the extent of the impact has not been determined. 16
18 Notes to the financial statement 4 Determination of fair values A number of the group s accounting policies and disclosures require the determination of fair value, for both financial and non-financial assets and liabilities. Fair values have been determined for measurement and/or disclosure purposes based on the following methods. When applicable, further information about the assumptions made in determining fair values is disclosed in the notes specific to that asset or liability. (i) Trade and other receivables The fair value of trade and other receivables is estimated as the present value of future cash flows, discounted at the market rate of interest at the reporting date. This fair value is determined for disclosure purposes. (ii) Non-derivative financial liabilities Fair value, which is determined for disclosure purposes, is calculated based on the present value of future principal and interest cash flows, discounted at the market rate of interest at the reporting date. 5 Segment reporting The Company acts as a financing company for the Nufarm Group. It operates solely within the financing industry in New Zealand. It is listed in both Australia and New Zealand as the Nufarm Stepup Securities were issued to holders in both countries. 17
19 Notes to the financial statements (continued) Finance income Interest received from loans to group entities 10 15,867,969 16,640,564 Other interest received 48,401 90,299 Realised gain on foreign currency denominated assets 161,152 - Unrealised gain on foreign currency denominated assets - 2,510,252 16,077,522 19,241,115 7 Finance expense Realised foreign exchange loss - (1,681,768) Unrealised foreign exchange loss (165,981) - (165,981) (1,681,768) 8 Income tax Current tax expense Current tax expense Deferred tax expense Origination and reversal of temporary differences - - Tax losses utilized - (recognised) 4,568,178 5,873,338 Adjustments for prior years 1,437,957 (3,381) 6,006,135 5,869,957 Income tax expense recognised in statement of comprehensive income 6,006,135 5,869,957 Tax expense/(benefit) recognised directly in equity Tax benefit of NSS distribution (4,536,407) (4,970,388) (4,536,407) (4,970,388) Reconciliation of effective tax rate Profit before tax 15,674,379 17,331,918 Income tax at company rate 28% 4,388,826 4,852,937 Adjustments for prior years 1,437,957 (3,381) Other adjustments 179,352 1,020,401 Income tax expense recognised in statement of comprehensive income 6,006,135 5,869,957 The Company has imputation credits available for use in subsequent reporting periods of $1,346,277 at 31 July 2014 (2013: $1,309,179). 18
20 Notes to the financial statements (continued) 9 Deferred tax assets Recognised deferred tax assets and liabilities Deferred tax assets are attributable to the following items: Assets Tax loss carry-forwards 4,370,065 7,936,703 Deferred tax assets 4,370,065 7,936,703 The Company has no deferred tax liabilities. The tax losses have been recognised on the basis of forecasted operating earnings of the Nufarm Limited New Zealand companies and as management consider it probable that future profits will be available against which they can be utilised. Movement in temporary differences during the year Balance Recognised Transfers Adjustments Recognised Balance 1-Aug-13 in profit to group to NZD Tax in 31-Jul-14 or loss companies Benefit equity Tax loss carry-forwards 7,936,703 (6,006,135) (2,489,433) 392,523 4,536,407 4,370,065 Deferred tax assets 7,936,703 (6,006,135) (2,489,433) 392,523 4,536,407 4,370,065 Balance Recognised Transfers Adjustments Recognised Balance 1-Aug-12 in profit to group to NZD Tax in 31-Jul-13 or loss companies Benefit equity Tax loss carry-forwards 7,197,736 (5,869,957) - 1,638,536 4,970,388 7,936,703 Deferred tax assets 7,197,736 (5,869,957) - 1,638,536 4,970,388 7,936,703 19
21 Nufarm Finance ( NZ ) Limited Notes to the financial statements (continued) 10 Related parties Nufarm Limited, an Australian registered and listed company, is the Company's ultimate parent. The company had the following related party transaction during, and as at, the year ended 31 July 2014: Type of Amount of transaction Name of related party transaction Nufarm Limited (NZ Branch)# Expenses / Management Fee 128, ,890 Croplands Equipment Ltd# Interest Income 118,086 - Nufarm Holdings (NZ) Ltd^ Interest Income / expense 1,859,266 - Nufarm Holdings (SAS) Ltd^# Interest Income 13,890,617 14,639,820 Nufarm Australia Ltd^ Interest Income - 775,480 Nufarm Treasury Pty Ltd^ Interest Income - 1,168,123 Nufarm America ^ Interest Income - 57,144 Interest rates on related party loans are considered to be at arms length Related party receivables Non current Croplands Equipment Ltd# 818,420 3,018,090 Nufarm Holdings (NZ) Ltd^ 31,700,277 21,387,804 Nufarm Holdings (SAS) Ltd^* 193,626, ,935, ,145, ,340,899 Current Nufarm Limited (NZ Branch)# - 13,050 Croplands Equipment Ltd# 5,158 - Nufarm Holdings (NZ) Ltd^ 183,124 - Nufarm Holdings (SAS) Ltd^* 1,174,115 3,654,305 Nufarm Australia Ltd^ - 178,644 Nufarm Treasury Pty Ltd^ - 276,328 1,362,397 4,122,327 Related party payable Current Nufarm Limited (NZ Branch) (29,729) - (29,729) - The nature of the relationship with the related parties is they are other group companies. The above related party transactions and balances at year end are denominated in the following currencies: ^=AUD, *=USD, #=NZD The Nufarm Holdings (SAS) non current and current receivable includes a portion denominated in USD, the remaining balance is denominated in AUD. As at 31 July the non current portion was USD$7,329,724 (2013: USD $7,329,724) the current portion is USD$24,338 (2013: USD $76,875) The Company has completed the following transactions with Nufarm Limited (NZ Branch): - Audit fees of $36,000 were paid on behalf of the Company (2013: $36,000). - The Company paid $92,874 (2013: $82,980) fees for accounting and administrative services. 20
22 Notes to the financial statements (continued) 10 Related parties (continued) The Company did not incur any expenses in relation to key management personnel. Those expenses are incurred by the Nufarm Limited and disclosed in full in the Nufarm Limited financial statements which are publicly available. There were no other transactions with related parties other than the Directors Interests disclosed in the Company Directory. 11 Cash and cash equivalents Bank balances 811,299 4,964, ,299 4,964,022 $744,859 of the above balance is denominated in NZD (2013: $1,046,376). The Company NZD bank account is grouped under the Bank of New Zealand Set-Off Deed. Under this arrangement the NZD bank accounts of, Nufarm Ltd (NZ Branch), Croplands Equipment Ltd and Nufarm Finance are offset, with the net funds being placed on call. The Company AUD bank account interest rate is dependant on the daily account balance. At 31 July 2014 the range was 0.00% for balances under $10,000 to 1.73% for balances over $850,000 (2013: 0%-2.40%). 12 Share capital and reserves Ordinary shares (a) Share capital On issue at 1 August 10,000,000 10,000,000 On issue at 31 July - fully paid 10,000,000 10,000,000 All shares are fully paid and have no par value. Nufarm Limited, an Australian registered company, is the parent and ultimate parent entity. Nufarm Limited holds 100% of the shares. The holders of ordinary shares are entitled to receive dividends as declared from time to time. All shares on winding up, share equally in both dividends and surplus or deficit. No dividends to the ordinary shareholders were declared in the current year (2013: Nil). (b) Nufarm Step-up Securities In the year ended 31 July 2007, the company issued a hybrid security called Nufarm Step-up Securities (NSS). The NSS are perpetual step up securities and on 24 November 2006, 2,510,000 NSS were allotted at an issue price of $100 per security raising $251 million. The NSS are listed on the ASX under the code 'NFNG' and on the NZDX under the code 'NFFHA'. The after-tax costs associated with the issue of the NSS, totalling $4.1 million, were deducted from the proceeds. 21
23 Notes to the financial statements (continued) 12 Share capital and reserves (continued) (b) Nufarm Step-up Securities (continued) Distributions on the NSS are at the discretion of the directors and are at a floating rate, unfranked, non-cumulative and subordinated. However, distributions of profits and capital by Nufarm Limited are curtailed if distributions to NSS holders are not made, until such time that Nufarm Finance (NZ) Limited makes up the arrears. The first distribution date for the NSS was 16 April 2007 and on a sixmonthly basis after this date. The floating rate is the average mid-rate for Australian denominated bills with a term of six months plus a margin of 3.9% (2013: 3.9%). On 24 November 2011, Nufarm "stepped-up" the NSS which resulted in the interest margin attached to the NSS being stepped up by 2.0 per cent, with the new interest margin being set at 3.9 per cent. No other terms were adjusted and there are no further step-up dates. Nufarm retains the right to redeem or exchange the NSS on future distribution dates. The NSS are considered an equity instrument as the Company has no present contractual obligation to deliver cash or another financial asset to the holder of the security. The step up feature does not of itself establish a contractual obligation to pay the distributions or to call the security. Distributions Distributions recognised in the current year on the NSS are: Distribution Total amount Payment rate date 2014 Distribution 6.52% 8,156, Apr-14 Distribution 6.95% 8,749, Oct-13 Total 16,905, Distribution 7.03% 8,798, Apr-13 Distribution 8.11% 10,146, Oct-12 Total 18,944,511 All distributions payable on the Nufarm Step-up securities have been paid. 13 Earnings per share Basic and diluted earnings per share The calculation of basic and diluted earnings per share at 31 July 2014 was based on the profit attributable to ordinary shareholders of $9,668,244 (2013: $11,461,961) and a weighted number of ordinary shares outstanding of 10,000,000 (2013: 10,000,000), calculated as follows: Profit attributable to ordinary shareholders Net profit/(loss) for the period 9,668,244 11,461,961 Net profit/(loss) attributable to ordinary shareholders 9,668,244 11,461,961 22
24 Notes to the financial statements (continued) 13 Earnings per share (continued) Weighted number of ordinary shares Ordinary shares On issue at 1 August 10,000,000 10,000,000 On issue at 31 July - fully paid 10,000,000 10,000,000 The company may elect to redeem the NSS for a number of ordinary shares in Nufarm Limited, the parent company, an Australian registered and listed company. This election would therefore not result in a dilutive impact on the number of ordinary shares issued in the Company. Earnings per share Basic earnings per share (cents) Diluted earnings per share (cents) Contingent liabilities The Company is one of the guarantors of Nufarm Limited's senior secured syndicated bank facility (SFA) and would be obliged, along with other guarantors, to make payment on the SFA in the unlikely event of a default by one of the borrowers. On 5 October 2012 the Nufarm Group successfully closed the offer of US $325 million aggregate principal amount of senior unsecured notes. The Company is one of the guarantors of the senior unsecured notes. 15 Financial instruments The Company's activities expose it to a variety of financial risks: (a) Market risk (including interest rate risk and currency risk), (b) Credit risk (c) Liquidity risk. (a) Market Risks Market risk is the risk that changes in market prices, such as foreign exchange rates, interest rates and equity prices will affect the Company's income or the value of its holding of financial instruments. The objective of market risk management is to manage and control market risk exposures within acceptable parameters, while optimising the return. (i) Interest Rate Risk The Company has the ability to use derivative financial instruments to manage specifically identified interest rate risks. The distribution rate on the NSS is based on a floating rate of the average mid-rate for bills with a term of six months plus a margin of 3.90%. Profile At the reporting date the interest rate profile of the group and company's interest-bearing financial instruments was: Variable rate instruments Financial assets 226,145, ,340,899 Financial liabilities including NSS (251,000,000) (251,000,000) (24,854,509) (32,659,101) 23
25 Notes to the financial statements (continued) 15 Financial instruments (continued) (a) Market Risks (continued) Sensitivity analysis for variable rate instruments The company does not hedge the exposures to interest rate risk on the cash and loan receivable balances. A change of 100 basis points in interest rates at the reporting date would have increased/(decreased) profit or loss by the amounts shown below. This analysis assumes that all other variables, in particular foreign currency rates, remain constant. The sensitivity is calculated on the debt at 31 July. This analysis is performed on the same basis for Profit or loss 100 bp increase 100 bp decrease 2014 Variable rate instruments (186,065) 186, Variable rate instruments (263,659) 263,659 (ii) Foreign exchange risk In April 2012, the Company settled the loans receivable from related parties that were denominated in foreign currencies and reissued them in Australian dollars. This has largely eliminated the foreign exchange exposure for the Company. The company does not hedge the remaining foreign exchange exposure. At 31 July 2014 the Company has exposure to NZD and USD, the financial effect of changes in foreign exchange rates on this exposure is outlined below. Profit or loss Spot Rate AUD rise 10% AUD drop 10% NZD 862, (71,699) 87,632 USD 7,329, (716,493) 875,714 (788,192) 963,346 (b) Credit Risk Credit risk arises from cash and derivative financial instruments with banks, as well as loans and outstanding receivables to related parties. The related parties and the Company have Nufarm Limited, an Australian registered company, as their parent entity. The Company requires banks to have, as a minimum, a independent rating agency rating of AA. The Company has credit policies in place and the exposure to credit risk is monitored on an ongoing basis. The maximum exposure to credit risk is represented by the carrying value of each financial asset in the balance sheet. The carrying amounts of the Company s assets are reviewed at each balance date to determine whether there is any indication of impairment. The maximum exposure to credit risk at the reporting date was: Carrying Amount Loans receivable-related parties (non-current) 226,145, ,340,899 Receivables-related parties (current) 1,362,397 4,122,327 Cash and cash equivalents 811,299 4,964, ,319, ,427,248 An impairment loss is recognised whenever the carrying amount of an asset exceeds its recoverable amount. Impairment losses directly reduce the carrying amount of assets and are recognised in the Statement of comprehensive income. There was no impairment loss recognised during the period in the Statement of comprehensive income. 24
26 Notes to the financial statements (continued) 15 Financial instruments (continued) (c) Liquidity Risk Liquidity risk is the risk that the group will encounter difficulty in meeting the obligations associated with its financial liabilities that are settled by delivering cash or another financial asset. The group's approach to managing liquidity is to ensure, as far as possible, that it will always have sufficient liquidity to meet its liabilities when due, under both normal and stressed conditions, without incurring unacceptable losses or risking damage to the group's reputation. The company's liquidity is considered in the context of the Nufarm Group. Nufarm Group has the following financing facilities in place as at 31 July On 23 August 2011, Nufarm executed a A$300 million trade receivables securitisation facility. Subsequent to execution, the facility size was reduced to A$250 million to reflect the value of trade receivables being used to secure funding under the program at the time. On 13 June 2013 the facility size was increased to A$300 million to reflect the increase in the current value of trade receivables being used to secure funding under this program. The facility provides funding that aligns with the working capital cycle of the company. On 8 October 2012, the group completed a US$325 million Senior Unsecured Notes offering due in October 2019 (the "Notes"). The group holds a three year A$530 million senior secured syndicated bank facility (SFA) (2013: A$406 million), of which A$520 million is due in December 2016 and A$10 million is due in December 2014 (2013: A$406 million due in November 2014). The SFA is secured by assets in the primary geographies in which Nufarm operates including Australia, New Zealand and United States (2013: Australia, United States, Canada, United Kingdom, and France). The SFA includes covenants of a type normally associated with facilities of this kind, and the group was in compliance with these covenants throughout the financial year. The amount drawn down under the facility at 31 July 2014 is $51 million (2013: $164 million). The majority of debt facilities that reside outside the Notes, the SFA and trade receivables securitisation facility are regional working capital facilities, primarily located in Brazil and Europe, with amounts drawn at 31 July totalling A$572 million (2013: A$343 million). At 31 July 2014, the group had access to debt of $1,743 million (2013: $1,322 million) under the Notes, SFA, trade receivables securitisation facility and with other lenders. A parent guarantee is provided to support working capital facilites in Brazil and the Notes. The Company's largest liquidity exposure relates to the NSS security which is classified as equity. The liquidity risk is immaterial because it is largely offset by the related party receivables with a matching maturity date and distributions on the NSS security are at the discretion of the issuer. Refer to Note 12 for details. All amounts relating to other payables are due within the next six months. 25
27 Notes to the financial statements (continued) 15 Financial instruments (continued) Liquidity risk (continued) The tables below present the Company's cash flows by remaining contractual maturities as at balance date. The amounts disclosed in the tables are the contractual undiscounted cash flows and therefore, may not agree to the carrying values on the balance sheet Within 6 More than Total months 12 months Contractual Cash Flows Non-derivative financial assets Cash and cash equivalents (811,299) - (811,299) Receivables - related parties (1,362,397) - (1,362,397) Loan receivable - related parties - (226,145,491) (226,145,491) Non-derivative financial liabilities Payables - other 74,838-74,838 Payables - related parties 29,729-29,729 (2,069,129) (226,145,491) (228,214,620) The Company has Nufarm Step up Securities of $251 million (refer to note 12) Within 6 More than Total months 12 months Contractual Cash Flows Non-derivative financial assets Cash and cash equivalents (4,964,022) - (4,964,022) Receivables - related parties (4,122,327) - (4,122,327) Loan receivable - related parties - (218,340,899) (218,340,899) Non-derivative financial liabilities Payables - other 94,504-94,504 Payables - related parties (8,991,845) (218,340,899) (227,332,744) 26
28 Notes to the financial statements (continued) 15 Financial instruments (continued) Fair Valuation All financial assets and financial liabilities, other than derivatives, are initially recognised at the fair value of consideration paid or received, net of transaction costs as appropriate, and subsequently carried at fair value or amortised cost as indicated below. The carrying values of the financial assets and liabilities reflected in the tables below approximate their fair values. At fair value through profit and loss At amortised cost Carrying Value 2014 Assets as per Balance Sheet Cash and Cash Equivalents - 811, ,299 Loans Receivable - Related Parties - 226,145, ,145,491 Related party receivables - 1,362,397 1,362,397 Total - 228,319, ,319,187 Liabilities as per Balance Sheet Account payables - 74,838 74,838 Total - 74,838 74, Assets as per Balance Sheet Cash and Cash Equivalents - 4,964,022 4,964,022 Loans Receivable - Related Parties - 218,340, ,340,899 Related party receivables - 4,122,327 4,122,327 Total - 227,427, ,427,248 Liabilities as per Balance Sheet Account payables - 94,504 94,504 Total - 94,504 94,504 Fair Value Hierarchy The Company does not have derivative financial instruments carried at fair value (2013: nil). As such, the fair value hierarchy table is not presented. Loans and Receivables Cash and cash equivalents and related party receivables are short term in nature and the related carrying value is equivalent to the fair value. Loan receivable-related parties are floating rate loans, therefore the carrying value is considered a reasonable estimate of their fair value. 27
29 Notes to the financial statements (continued) 15 Financial instruments (continued) Other Financial Liabilities All the balances under this classification are short term in nature and thus the related carrying values are equivalent to their fair value. Capital Management The Company's capital includes share capital, reserves, retained earnings and the Nufarm Step-up Securities. The Company is part of the Nufarm Limited group, which is an Australian listed company. Nufarm Limited group's policy is to maintain a strong capital base so as to maintain investor, creditor and market confidence and to sustain future development of the business. The Company's capital management policies are reviewed regularly by the Directors. There have been no material changes in the Company's management of capital during the period. 16 Reconciliation of the profit for the period with the net cash flow from operating activities Profit for the period 9,668,244 11,461,961 Adjustments for: Unrealised foreign exchange loss / (gain) 165,981 (2,510,252) Income tax expense 6,006,135 5,869,957 15,840,360 14,821,666 Change in other payables (19,666) 9,504 Change in related party current receivable 2,759, ,859 Change in related party loans 79,108 1,681,768 Changes in tax balances (376,594) (445,938) Net cash from operating activities 18,283,138 16,799, Commitments There were no commitments as at 31 July 2014 (2013: Nil). 18 Subsequent Events The Company has evaluated the period after the balance date to 23 September 2014, which is the date that the financial statements were issued, and determined that there were no subsequent events or transactions that required recognition or disclosure in the financial statements. 28
30 Directors' declaration In the opinion of the directors of Nufarm Finance (NZ) Limited, the financial statements and notes, on pages 7 to 28: (a) comply with New Zealand generally accepted accounting principles and NZ IFRS and give a true and fair view of the Company as at 31 July 2014 and the results of its operations and cash flows for the year ended on that date; and (b) have been prepared using appropriate accounting policies, which have been consistently applied and supported by reasonable judgements and estimates. The directors believe that proper accounting records have been kept which enable, with reasonable accuracy, the determination of the financial position of the Company and facilitate compliance of the financial statements with the Financial Reporting Act The directors consider that they have taken adequate steps to safeguard the assets of the Company, and to prevent and detect fraud and other irregularities. Internal control procedures are also considered to be sufficient to provide a reasonable assurance as to the integrity and reliability of the financial statements. The directors are pleased to present the financial statements of Nufarm Finance (NZ) Limited for the year ended 31 July For and on behalf of the Board of Directors: Dated at Auckland this 23rd day of September 2014 KM Hoggard Director WB Goodfellow Director
Nufarm Finance ( NZ ) Limited Annual Report For the year ended 31 July 2011
 Limited Annual Report For the year ended 31 July 2011") Nufarm Finance ( NZ ) Limited Annual Report For the year ended 31 July 2011 NUFARM FINANCE (NZ) LIMITED 1 Contents 2 Directors report 3 Company directory 4 Corporate governance 5-6 Auditor report 7 Statement
Nufarm Finance ( NZ ) Limited Annual Report For the year ended 31 July 2011 NUFARM FINANCE (NZ) LIMITED 1 Contents 2 Directors report 3 Company directory 4 Corporate governance 5-6 Auditor report 7 Statement
Financial Statements. - Directors Responsibility Statement. - Consolidated Statement of Comprehensive Income
 X.0 HEADER Financial Statements - Directors Responsibility Statement - Consolidated Statement of Comprehensive Income - Consolidated Statement of Financial Position - Consolidated Statement of Changes
Profit/(Loss) before income tax 112, ,323. Income tax benefit/(expense) 11 (31,173) (37,501)
 before income tax 112, ,323. Income tax benefit/(expense) 11 (31,173) (37,501)") Income statement For the year ended 31 July Note 2013 2012 Continuing operations Revenue 2,277,292 2,181,551 Cost of sales (1,653,991) (1,570,657) Gross profit 623,301 610,894 Other income 7 20,677 10,124
Income statement For the year ended 31 July Note 2013 2012 Continuing operations Revenue 2,277,292 2,181,551 Cost of sales (1,653,991) (1,570,657) Gross profit 623,301 610,894 Other income 7 20,677 10,124
For personal use only
 31 ST MARCH AUDITORS REPORT INDEPENDENT AUDITORS REPORT TO THE SHAREHOLDERS OF TRILOGY INTERNATIONAL LIMITED Report on the Financial Statements We have audited the financial statements of Trilogy International
Directors Report 3. Income Statements 4. Statements of Changes in Equity 5. Balance Sheets 6. Statements of Cash Flows 7-8
 Rakon Limited Annual Report 2009 Table of Contents Directors Report 3 Income Statements 4 Statements of Changes in Equity 5 Balance Sheets 6 Statements of Cash Flows 7-8 Notes to Financial Statements
COMVITA LIMITED AND GROUP. Financial Statements. 31 March 2014
 COMVITA LIMITED AND GROUP Financial Statements 31 March 2014 Contents Directors Declaration 2 Income Statement 3 Statement of Comprehensive Income 4 Statement of Changes in Equity 5 6 Statement of Financial
COMVITA LIMITED AND GROUP FINANCIAL STATEMENTS
 COMVITA LIMITED AND GROUP FINANCIAL STATEMENTS For the year ended 31 March 2015 Comvita Financial Statements 2015 - P2 CONTENTS P4 P5 P6 P7 P8 P9 P10 P52 P53 P58 DIRECTORS DECLARATION INCOME STATEMENT
COMVITA LIMITED AND GROUP FINANCIAL STATEMENTS
 COMVITA LIMITED AND GROUP FINANCIAL STATEMENTS For the year ended 31 March 2015 Comvita Financial Statements 2015 - P2 CONTENTS P4 DIRECTORS DECLARATION P5 INCOME STATEMENT P6 STATEMENT OF COMPREHENSIVE
FINANCIAL STATEMENTS 2018
 FINANCIAL STATEMENTS 2018 CONTENTS 2 Auditor s Report 7 Directors Responsibility Statement 8 Statement of Comprehensive Income 9 Statement of Financial Position 10 Statement of Changes in Equity 11 Statement
The Warehouse Group Limited Financial Statements For the 52 week period ended 27 July 2014
 The Warehouse Limited Financial Statements Financial Statements The Warehouse Limited is a limited liability company incorporated and domiciled in New Zealand. The address of its registered office is Level
SLI Systems Limited and its Subsidiaries Financial Statements For the year ended 30 June 2015
 SLI Systems Limited and its Subsidiaries Financial Statements For the year ended 30 June Contents Page Consolidated Statement of Comprehensive Income 6 Consolidated Statement of Changes in Equity 7 Consolidated
Consolidated Statement of Comprehensive Income For the year ended 31 March 2017
 Consolidated Statement of Comprehensive Income YEAR YEAR 31 MARCH 2017 31 MARCH 2016 $'000 Note Revenue 4 151,439 137,379 Other income 184 1,352 Share of profit of equity accounted joint venture - 204
Evolve Education Group Limited. Consoltdated Financial Statements. For the Year Ended 31 March 2018
 evolve e d u c at io n gro u p Evolve Education Group Limited Consoltdated Financial Statements For the Year Ended 31 March 2018 The Directors present the Consolidated Financial Statements of Evolve Education
NZ BOND FUND FINANCIAL STATEMENTS FOR THE YEAR ENDED 31 MARCH Presented by Smartshares Limited, Manager of the NZ Bond Fund
 FINANCIAL STATEMENTS Presented by Smartshares Limited, Manager of the NZ Bond Fund TABLE OF CONTENTS Page Directory 1 Statement by the Manager 2 Financial Statements Statement of Comprehensive Income 3
FINANCIAL REPORT. FINANCIAL STATEMENTS OF PERPETUAL LIMITED AND ITS CONTROLLED ENTITIES for the year ended 30 June 2017
 FINANCIAL REPORT FINANCIAL STATEMENTS OF PERPETUAL LIMITED AND ITS CONTROLLED ENTITIES for the year ended 30 June TABLE OF CONTENTS Primary statements Consolidated Statement of Profit or Loss and Other
Annual. Financial Report. For personal use only. Contents. Company Directory 27. Directors' Responsibility Statement 28
 Annual Financial Report Contents Company Directory 27 Directors' Responsibility Statement 28 Statement of Comprehensive Income 29 Statement of Changes in Equity 30 Statement of Financial Position 30 Statement
COMVITA LIMITED AND GROUP FINANCIAL STATEMENTS
 COMVITA LIMITED AND GROUP FINANCIAL STATEMENTS For the 15 month s end ed 30 June 2016 CONTENTS 2 3 4 5 6 7 8 39 40 45 DIRECTORS DECLARATION INCOME STATEMENT STATEMENT OF COMPREHENSIVE INCOME STATEMENT
A n n u a l f i n a n c i a l r e s u l t s
 A n n u a l f i n a n c i a l r e s u l t s DIRECTORS STATEMENT The directors of Air New Zealand Limited are pleased to present to shareholders the Annual Report* and financial statements for Air New
Livestock Improvement Corporation Limited (LIC) ANNUAL REPORT. Year Ended 31 May 2014
 ANNUAL REPORT. Year Ended 31 May 2014") Livestock Improvement Corporation Limited (LIC) ANNUAL REPORT Year Ended 31 May 2014 Income Statement For the year ended 31 May 2014 In thousands of New Zealand dollars Note 2014 2013 2014 2013 Revenue
Livestock Improvement Corporation Limited (LIC) ANNUAL REPORT Year Ended 31 May 2014 Income Statement For the year ended 31 May 2014 In thousands of New Zealand dollars Note 2014 2013 2014 2013 Revenue
Alpha Bank AD Skopje. Financial Statements for the year ended 31 December 2007
 for the year ended 31 December 2007 Contents Auditors' report Balance sheet 2 Income statement 3 Statement of changes in equity 4 Statement of cash flows 5 Notes to the financial statement 6 Balance sheet
Auditor s Independence Declaration
 Financial reports The Directors Eumundi Group Limited Level 15, 10 Market Street BRISBANE QLD 4000 Auditor s Independence Declaration As lead auditor for the audit of Eumundi Group Limited for the year
CONTENTS CHAIRMAN S REPORT 2 CORPORATE GOVERNANCE 4 DIRECTORS RESPONSIBILITY STATEMENT 6 INDEPENDENT AUDITORS REPORT 7 STATEMENTS OF COMPREHENSIVE
 ANNUAL REPORT 2012 CONTENTS CHAIRMAN S REPORT 2 CORPORATE GOVERNANCE 4 DIRECTORS RESPONSIBILITY STATEMENT 6 INDEPENDENT AUDITORS REPORT 7 STATEMENTS OF COMPREHENSIVE INCOME 9 STATEMENTS OF CHANGES IN EQUITY
GLOBAL BOND FUND FINANCIAL STATEMENTS FOR THE SIX MONTHS ENDED 30 SEPTEMBER Presented by Smartshares Limited, Manager of the Global Bond Fund
 FINANCIAL STATEMENTS Presented by Smartshares Limited, Manager of the Global Bond Fund TABLE OF CONTENTS Page Directory 1 Statement by the Manager 2 Financial Statements Statement of Comprehensive Income
NZ CASH FUND FINANCIAL STATEMENTS FOR THE YEAR ENDED 31 MARCH Presented by Smartshares Limited, Manager of the NZ Cash Fund
 FINANCIAL STATEMENTS Presented by Smartshares Limited, Manager of the NZ Cash Fund TABLE OF CONTENTS Page Directory 1 Statement by the Manager 2 Financial Statements Statement of Comprehensive Income 3
STATEMENT OF COMPREHENSIVE INCOME
 FINANCIAL REPORT STATEMENT OF COMPREHENSIVE INCOME for the year ended 30 June 2014 Notes $ 000 $ 000 Revenue Sale of goods 2 697,319 639,644 Services 2 134,776 130,182 Other 5 1,500 1,216 833,595 771,042
ANNUAL FINANCIAL STATEMENTS - YEAR ENDED 30 JUNE 2018 CONTENTS
 ANNUAL FINANCIAL STATEMENTS - YEAR ENDED 30 JUNE 2018 CONTENTS Directors Responsibility Statement 1 Independent Auditor s Report 2 Income Statement 8 Statement of Comprehensive Income 9 Statement of Changes
PUSHPAY HOLDINGS LIMITED ANNUAL REPORT 2014
 ANNUAL REPORT 2014 ANNUAL FINANCIAL REPORT CONTENTS DIRECTORY 3 DIRECTORS RESPONSIBILITY STATEMENT 4 INDEPENDENT AUDITOR S REPORT 5 STATEMENT OF COMPREHENSIVE INCOME 6 STATEMENT OF CHANGES IN EQUITY 7
Diverse Group Limited 2011 Special Edition
 Diverse Limited 2011 Special Edition Illustrative Financial Statements under NZ IFRS (Reduced Disclosure Regime) November 2012 kpmg.com/nz Diverse Limited financial statements 2 This publication has been
Income Statements...39 Statements of Recognised Income and Expense...40 Balance Sheets...41 Statements of Cash Flows...42
 38 GWA INTERNATIONAL LIMITED 2007 ANNUAL REPORT CONTENTS Income Statements...39 Statements of Recognised Income and Expense...40 Balance Sheets...41 Statements of Cash Flows...42 Note 1 Significant accounting
NEW ZEALAND BOND TRUST
 FINANCIAL STATEMENTS Presented by Smartshares Limited, Manager of the New Zealand Bond Trust TABLE OF CONTENTS Page Directory 1 Statement by the Manager 2 Financial Statements Statement of Comprehensive
Australia and New Zealand Banking Group Limited - ANZ New Zealand Registered Bank Disclosure Statement
 Australia and New Zealand Banking Group Limited - ANZ New Zealand Registered Bank Disclosure Statement FOR THE YEAR ENDED 30 SEPTEMBER 2015 NUMBER 28 ISSUED DECEMBER 2015 Australia and New Zealand Banking
QUAYSIDE HOLDINGS LIMITED AND SUBSIDIARIES
 QUAYSIDE HOLDINGS LIMITED AND SUBSIDIARIES ANNUAL FINANCIAL STATEMENTS For the year ended 30 JUNE 2015 CONTENTS PAGE Auditor s Report 1 Income Statement 4 Statement of Comprehensive Income 5 Statement
Kathmandu Holdings Limited. FINANCIAL STATEMENTS 31 July 2018
 Kathmandu Holdings Limited FINANCIAL STATEMENTS 31 July 2018 Introduction and Table of Contents In this section The financial statements have been presented in a style which attempts to make them less
1 Significant accounting policies
 1 Significant accounting policies 1.1 Investment in joint ventures (equity-accounted investees) Joint ventures are entities over which the Group has joint control as a result of contractual arrangements,
Comvita Financial Statements PI COMVITA LIMITED AND GROUP FINANCIAL STATEMENTS
 Comvita Financial Statements 2017 - PI COMVITA LIMITED AND GROUP FINANCIAL STATEMENTS FOR THE YEAR ENDED 30 JUNE 2017 Comvita Financial Statements 2017 - PII Comvita Financial Statements 2017 - P1 CONTENTS
GOODMAN PROPERTY TRUST
 GOODMAN PROPERTY TRUST Audited annual results for announcement to the market Reporting Period 12 months to 31 March Previous Reporting Period 12 months to 31 March Amount Percentage Change Revenue from
For personal use only
 Re-Issued Annual Special Purpose Financial Report 30 June 2015 Contents Page Trustees' report 1 Statement of profit or loss and other comprehensive income 3 Statement of financial position 4 Statement
BLUESCOPE STEEL LIMITED FINANCIAL REPORT 2011/2012
 BLUESCOPE STEEL LIMITED FINANCIAL REPORT / ABN 16 000 011 058 Annual Financial Report - Page Financial statements Statement of comprehensive income 2 Statement of financial position 3 Statement of changes
Independent Auditor s Report to the Members of Caltex Australia Limited
 61 Independent Auditor s Report to the Members of Caltex Australia Limited Report on the financial report We have audited the accompanying financial report of Caltex Australia Limited (the Company), which
For personal use only
 FINANCIAL REPORT FOR THE FINANCIAL YEAR ENDED 30 JUNE 1 FINANCIAL STATEMENTS YEAR ENDED 30 JUNE CONTENTS Page Directors Responsibility Statement 3 Independent Auditor s Report 4 Consolidated Income Statement
Financial reports. 10 Eumundi Group Limited & Controlled Entities
 Financial reports 10 Eumundi Group Limited & Controlled Entities The Directors Eumundi Group Limited Level 15, 10 Market Street BRISBANE QLD 4000 Auditor s Independence Declaration As lead auditor for
AMS Moderately Conservative Fund
 Annual Financial Report ARSN: 169 105 319 For the year ended Responsible Entity: Ironbark Asset Management (Fund Services) Limited ABN 63 116 232 154 AFSL 298 626 ARSN 169 105 319 Annual financial report
Airports Fiji Limited Financial Statements For the year ended 31 December 2013
 Financial Statements Contents Directors' report 2-3 Statement by Directors 4 Independent auditor's report 5-6 Statement of comprehensive income 7 Statement of changes in equity 8 Statement of financial
AUSTRALIAN PROPERTY FUND
 FINANCIAL STATEMENTS Presented by Smartshares Limited, Manager of the Australian Property Fund TABLE OF CONTENTS Page Directory 1 Statement by the Manager 2 Financial Statements Statement of Comprehensive
Consolidated statement of comprehensive income
 Consolidated statement of comprehensive income Notes 2017 Revenue from continuing operations 5 24,232 23,139 Other income Net gain on fair value adjustment investment properties 13 80 848 Total revenue
ANZ Bank New Zealand Limited Annual Report and Registered Bank Disclosure Statement
 ANZ Bank New Zealand Limited Annual Report and Registered Bank Disclosure Statement FOR THE YEAR ENDED 30 SEPTEMBER 2015 NUMBER 79 ISSUED NOVEMBER 2015 ANZ Bank New Zealand Limited Annual Report and Registered
FINANCIAL STATEMENTS. Approval by Directors FOR THE YEAR ENDED 30 JUNE 2017
 FINANCIAL STATEMENTS 1 FOR THE YEAR ENDED 30 JUNE 2017 Approval by Directors Your Directors have pleasure in presenting the Financial Statements for the year ended 30 June 2017. The Directors have approved
OAO Scientific Production Corporation Irkut
 Consolidated Financial Statements for the year ended 31 December 2011 Consolidated Financial Statements for the year ended 31 December 2011 Contents Independent Auditors Report 3 Consolidated Income Statement
Sestante Diversified Fund
 ARSN 613 157 387 Annual Financial Report Responsible Entity AZ Sestante Limited ABN: 94 106 888 662 AFSL: 284442 ARSN 613 157 387 Annual financial report Contents Page Directors report 2 Auditor s independence
ASIA PACIFIC FUND FINANCIAL STATEMENTS FOR THE YEAR ENDED 31 MARCH Presented by Smartshares Limited, Manager of the Asia Pacific Fund
 FINANCIAL STATEMENTS Presented by Smartshares Limited, Manager of the Asia Pacific Fund TABLE OF CONTENTS Page Directory Statement by the Manager 2 Financial Statements Statement of Comprehensive Income
Kiwi Capital Funding Limited
 Kiwi Capital Funding Limited Annual Report and Financial Statements For the year ended. Contents Directory 2 Directors Report 3 Financial Statements Income statement 4 Statement of comprehensive income
EUROSTANDARD Banka AD Skopje. Consolidated Financial Statements for the year ended 31 December 2007
 Consolidated Financial Statements for the year ended 31 December 2007 Contents Auditors' report Financial Statements Consolidated balance sheet 2 Consolidated income statement 3 Consolidated statement
Financial statements. The University of Newcastle. newcastle.edu.au F1. 52 The University of Newcastle, Australia
 Financial statements The University of Newcastle 52 The University of Newcastle, Australia newcastle.edu.au F1 Contents Income statement................. 54 Statement of comprehensive income..... 55 Statement
6 Intangible assets & property, plant and equipment. 9 Contributed equity. 12 Business combinations. 17 Share based payments
 Financial Report BASIS OF PREPARATION MYOB Group Limited is a for-profit entity for the purpose of preparing financial statements. These financial statements: are general purpose financial statements;
ZAO Bank Credit Suisse (Moscow) Financial Statements for the year ended 31 December 2010
 Financial Statements for the year ended 31 December 2010") Financial Statements for the year ended 31 December 2010 Contents Independent Auditors Report... 3 Statement of Comprehensive Income... 4 Statement of Financial Position... 5 Statement of Cash Flows...
Financial Statements for the year ended 31 December 2010 Contents Independent Auditors Report... 3 Statement of Comprehensive Income... 4 Statement of Financial Position... 5 Statement of Cash Flows...
ASB Covered Bond Trust Financial Statements
 ASB Covered Bond Trust Financial Statements Contents Statement of Comprehensive Income 2 Statement of Changes in Trust Funds 2 Balance Sheet 3 Cash Flow Statement 4 Notes to the Financial Statements 1
99 Wuxian Limited ARBN. 31 May 2013
 99 Wuxian Limited ARBN 31 May 2013 Contents Statement of comprehensive Income... 2 Statement of financial position. 3 Statement of cash flows 4 Statement of changes in equity... 5 Notes to the financial
NOTES TO THE FINANCIAL STATEMENTS For the year ended 31st December, 2013
 1. GENERAL Cosmos Machinery Enterprises Limited (the Company ) is a public limited company domiciled and incorporated in Hong Kong and its shares are listed on The Stock Exchange of Hong Kong Limited (the
Consolidated Statement of Profit or Loss and Other Comprehensive Income For the Financial Year ended 30 June 2013
 Consolidated Statement of Profit or Loss and Other Comprehensive Income For the Financial Year ended 30 2013 2013 2012 Notes $ $ Continuing Operations Revenue 5 92,276 Interest income 5 25,547 107,292
Expenses Impairment - Production 7 - (6,386) Exploration and evaluation expenditure 9 (1,509) (8,369) Administration expenses 8 (2,361) (5,128)
 Exploration and evaluation expenditure 9 (1,509) (8,369) Administration expenses 8 (2,361) (5,128)") Statement of profit or loss and other comprehensive income For the year ended 30 June Note Revenue Production revenue from continuing operations 24,547 35,000 Production costs 5 (16,526) (21,860) Gross
Statement of profit or loss and other comprehensive income For the year ended 30 June Note Revenue Production revenue from continuing operations 24,547 35,000 Production costs 5 (16,526) (21,860) Gross
Financial Statements. DBS Group HolDinGS ltd and its SuBSiDiarieS. DBS Bank ltd
 FINANCIAL STATEMENTS 123 Financial Statements DBS Group HolDinGS ltd and its SuBSiDiarieS 124 Consolidated income Statement 125 Consolidated Statement of Comprehensive income 126 Balance Sheets 127 Consolidated
Australia and New Zealand Banking Group Limited New Zealand Branch Disclosure Statement
 Australia and New Zealand Banking Group Limited New Zealand Branch Disclosure Statement FOR THE YEAR ENDED 30 SEPTEMBER 2011 NUMBER 11 ISSUED NOVEMBER 2011 Australia and New Zealand Banking Group Limited
Independent Auditor s Report To the Board of Directors of Biocon Limited
 Independent Auditor s Report To the Board of Directors of Biocon Limited Report on the audit of standalone Special purpose Ind AS financial statements of Biocon SA ( the Company ) We have audited the accompanying
New Zealand Post Group Finance Limited Annual Report 2016 F.22
 New Zealand Post Group Finance Limited Annual Report 2016 F.22 Contents DIRECTORS REPORT 2 FINANCIAL STATEMENTS Statement of Profit or Loss and Other Comprehensive Income 4 Statement of Changes in Equity
CHATHAM ROCK PHOSPHATE LIMITED
 Consolidated Financial Statements (Expressed in Canadian dollars) CHATHAM ROCK PHOSPHATE LIMITED CONTENTS Canadian declaration Management s Responsibility for 2 Financial Reporting New Zealand declaration
ASIA PACIFIC FUND FINANCIAL STATEMENTS FOR THE YEAR ENDED 31 MARCH Presented by Smartshares Limited, Manager of the Asia Pacific Fund
 FINANCIAL STATEMENTS Presented by Smartshares Limited, Manager of the Asia Pacific Fund TABLE OF CONTENTS Page Directory 1 Statement by the Manager 2 Financial Statements Statement of Comprehensive Income
For personal use only
 Preferred Capital Limited ABN 68 101 938 176 Annual Financial Report For the year ended 30 June 2015 Not guaranteed by Commonwealth Bank of Australia Annual Report for the year ended 30 June 2014 Contents
SAVARIA CORPORATION CONSOLIDATED FINANCIAL STATEMENTS AS AT DECEMBER 31, 2011 AND 2010 AND JANUARY 1, 2010
 SAVARIA CORPORATION CONSOLIDATED FINANCIAL STATEMENTS AS AT DECEMBER 31, 2011 AND 2010 AND JANUARY 1, 2010 SAVARIA CORPORATION CONSOLIDATED FINANCIAL STATEMENTS AS AT DECEMBER 31, 2011 AND 2010 AND JANUARY
ANNUAL BNZ Income Securities 2 Limited
 ANNUAL 2011 BNZ Income Securities 2 Limited Annual Report and Financial Statements for the year ended 30 September 2011 Directory Directors Andrew Gregory Thorburn Nicolette Lisa Fowler Timothy John Main
Notes to the Financial Statements
 85 Notes to the Financial Statements for the year ended 31 December 2010 These Notes are integral to the financial statements. The consolidated financial statements for the year ended 31 December 2010
PINs Securities NZ Limited
 Financial Report PINs Securities NZ Limited is an unlisted public company, incorporated in Australia Registered Office and Principal Place of Business PINS Securities NZ Limited C/o RBS Group (Australia)
DMX Corporation Limited and Controlled Entities Statement of Profit or Loss and Other Comprehensive Income for the year ended 30 June 2017 Note Consol
 Statement of Profit or Loss and Other Comprehensive Income for the year ended 30 June 2017 Note Consolidated 2017 Consolidated Revenue 3 1,814,949 1,711,808 Other income 4 8,785 84,169 Cost of goods sold
JSC VTB Bank (Georgia) Consolidated financial statements
 Consolidated financial statements") Consolidated financial statements For the year ended 31 December 2017 together with independent auditor s report 2017 consolidated financial statements Contents Independent auditor s report Consolidated
Consolidated financial statements For the year ended 31 December 2017 together with independent auditor s report 2017 consolidated financial statements Contents Independent auditor s report Consolidated
Ironbark Global (ex-australia) Property Securities Fund
 Property Securities Fund") Ironbark Global (ex-australia) Property Securities Fund ARSN 110 908 793 Annual Financial Report For the year ended 2018 Responsible Entity Ironbark Asset Management (Fund Serviced) Ltd ABN: 63 116 232
Ironbark Global (ex-australia) Property Securities Fund ARSN 110 908 793 Annual Financial Report For the year ended 2018 Responsible Entity Ironbark Asset Management (Fund Serviced) Ltd ABN: 63 116 232
Australia and New Zealand Banking Group Limited - New Zealand Branch Registered Bank Disclosure Statement
 Australia and New Zealand Banking Group Limited - New Zealand Branch Registered Bank Disclosure Statement FOR THE YEAR ENDED 30 SEPTEMBER 2014 NUMBER 24 ISSUED DECEMBER 2014 Australia and New Zealand Banking
AUSTRALIAN MID CAP FUND
 FINANCIAL STATEMENTS FOR THE YEAR ENDED 31 MARCH Presented by Smartshares Limited, Manager of the Australian Mid Cap Fund TABLE OF CONTENTS Page Directory 1 Statement by the Manager 2 Financial Statements
Lake Powell Almond Property Trust No.2
 Lake Powell Almond Property Trust No.2 Annual report June 2010 Lake Powell Almond Property Trust No.2 Seven Fields Management Limited Responsible Entity Report The Directors of the Responsible Entity present
Consolidated Financial Statements of ANGOSTURA HOLDINGS LIMITED. December 31, 2011 (Expressed in Trinidad and Tobago Dollars)
") Consolidated Financial Statements of ANGOSTURA HOLDINGS LIMITED (Expressed in Trinidad and Tobago Dollars) Limited and its subsidiaries (the Group), which comprises the consolidated statement of We have
Consolidated Financial Statements of ANGOSTURA HOLDINGS LIMITED (Expressed in Trinidad and Tobago Dollars) Limited and its subsidiaries (the Group), which comprises the consolidated statement of We have
NZ PROPERTY FUND FINANCIAL STATEMENTS FOR THE YEAR ENDED 31 MARCH Presented by Smartshares Limited, Manager of the NZ Property Fund
 FINANCIAL STATEMENTS Presented by Smartshares Limited, Manager of the NZ Property Fund TABLE OF CONTENTS Page Directory 1 Statement by the Manager 2 Financial Statements Statement of Comprehensive Income
Frontier Digital Ventures Limited
 Frontier Digital Ventures Limited Significant accounting policies This note provides a list of the significant accounting policies adopted in the preparation of these consolidated financial statements
DBS GROUP HOLDINGS LTD (Incorporated in Singapore. Registration Number: M) AND ITS SUBSIDIARIES
 AND ITS SUBSIDIARIES") DBS GROUP HOLDINGS LTD (Incorporated in Singapore. Registration Number: 199901152M) AND ITS SUBSIDIARIES FINANCIAL STATEMENTS For the financial year ended 31 December 2014 Financial Statements Table of
DBS GROUP HOLDINGS LTD (Incorporated in Singapore. Registration Number: 199901152M) AND ITS SUBSIDIARIES FINANCIAL STATEMENTS For the financial year ended 31 December 2014 Financial Statements Table of
BlueScope Financial Report 2013/14
 BlueScope Financial Report /14 ABN 16 000 011 058 Annual Financial Report - Page Financial statements Statement of comprehensive income 2 Statement of financial position 4 Statement of changes in equity
Australia and New Zealand Banking Group Limited - New Zealand Branch Disclosure Statement
 Australia and New Zealand Banking Group Limited - New Zealand Branch Disclosure Statement FOR THE YEAR ENDED 30 SEPTEMBER 2012 NUMBER 16 ISSUED NOVEMBER 2012 Australia and New Zealand Banking Group Limited
ANNUAL REPORT 2013/2014 C.28
 ANNUAL REPORT 2013/2014 C.28 Annual Report 2013/2014 Message from the Chair and Chief Executive............................................................... 1 Financial Performance... 3 Directors Responsibility
Consolidated Financial Statements of ANGOSTURA HOLDINGS LIMITED. December 31, 2014 (Expressed in Trinidad and Tobago Dollars)
") Consolidated Financial Statements of (Expressed in Trinidad and Tobago Dollars) Consolidated Statement of Comprehensive Income Year ended (Expressed in Trinidad and Tobago Dollars) Restated Notes 2014
Consolidated Financial Statements of (Expressed in Trinidad and Tobago Dollars) Consolidated Statement of Comprehensive Income Year ended (Expressed in Trinidad and Tobago Dollars) Restated Notes 2014
SABIC Capital I B.V. Financial Statements
 Financial Statements For the year ended December 31, 2012 GENERAL INFORMATION Director SABIC Capital B.V. Registered Office Zuidplein 216 1077 XV Amsterdam the Netherlands Auditor Ernst & Young Accountants
NZ TOP 10 FUND FINANCIAL STATEMENTS FOR THE PERIOD 9 SEPTEMBER 2016 TO 31 MARCH 2017
 FINANCIAL STATEMENTS FOR THE PERIOD 9 SEPTEMBER 2016 TO 31 MARCH 2017 BEING THE FIRST FINANCIAL STATEMENTS FOR THE NZ TOP 10 FUND FOLLOWING THE RESETTLEMENT OF THE NZX10 FUND AS THE NZ TOP 10 FUND ON 7
Saving our customers money so they can live better
 Saving our customers money so they can live better MASSMART GROUP ANNUAL FINANCIAL STATEMENTS 2016 1 GROUP INCOME STATEMENT December 2016 December 2015 Rm Notes 52 weeks 52 weeks Revenue 5 91,564.9 84,857.4
Firm Transgarant LLC. Consolidated Financial Statements for the year ended 31 December 2012
 Consolidated Financial Statements for the year ended 31 December 2012 Contents Auditors Report 3 Consolidated Statement of Financial Position 5 Consolidated Statement of Comprehensive Income 6 Consolidated
Independent Auditor s Report To the Board of Directors of Biocon Limited
 Independent Auditor s Report To the Board of Directors of Biocon Limited Report on the audit of standalone Special purpose Ind AS financial statements of Biocon Biologics Limited ( the Company ) We have
CBA CAPITAL AUSTRALIA LIMITED
 CBA CAPITAL AUSTRALIA LIMITED ABN 14 106 780 956 Annual Financial Report For the year ended 30 June 2014 Contents 1 Directors Report 3 Auditor s Independence Declaration 5 Statement of Comprehensive Income
Independent Auditor s Report
 1 Independent Auditor s Report To the Board of s of Syngene International Limited Report on the audit of Special Purpose Indian Accounting Standard ( Ind AS ) Financial Statements of Syngene USA Inc. (
Appendix 4D. ABN Reporting period Previous corresponding December December 2007
 Integrated Research Limited Appendix 4D Half year report ---------------------------------------------------------------------------------------------------------------------------- Appendix 4D Half year
159 Company Income Statement 160 Company Balance Sheet 162 Notes to the Company Financial Statements
 73 Annual Report and Accounts 2018 Consolidated and Company Financial Statements 2018 Page Consolidated Financial Statements, presented in euro and prepared in accordance with IFRS and the requirements
AUDITORS REPORT. December 16, To the Shareholders of FirstCaribbean International Bank Limited
 Financial Statements 2005 December 16, 2005 AUDITORS REPORT To the Shareholders of FirstCaribbean International Bank Limited We have audited the accompanying consolidated balance sheet of FirstCaribbean
UNITED BANK FOR AFRICA PLC. Consolidated Financial Statements for the Quarter Ended 31 March 2014 (Un-audited )
") Consolidated Financial Statements for the Quarter Ended 31 March 2014 (Un-audited ) NOTES TO THE FINANCIAL STATEMENTS UNITED BANK FOR AFRICA PLC SIGNIFICANT ACCOUNTING POLICIES 1 (i) Basis of preparation
Consolidated Financial Statements for the Quarter Ended 31 March 2014 (Un-audited ) NOTES TO THE FINANCIAL STATEMENTS UNITED BANK FOR AFRICA PLC SIGNIFICANT ACCOUNTING POLICIES 1 (i) Basis of preparation
NOTES TO THE FINANCIAL STATEMENTS
 1: Significant Accounting Policies The financial statements of Australia and New Zealand Banking Group Limited (the Company) and its controlled entities (the Group) for the year ended 30 September 2015
Asset Finance Limited
 Asset Finance Limited Financial Statements & Annual Report For the ended 31 March 2012 Asset Finance Limited CONTENTS COMPANY DIRECTORY... 3 DIRECTORS' CERTIFICATE... 4 FINANCIAL OVERVIEW... 5 STATEMENT
Australia and New Zealand Banking Group Limited New Zealand Branch General Disclosure Statement
 Australia and New Zealand Banking Group Limited New Zealand Branch General Disclosure Statement FOR THE YEAR ENDED 30 SEPTEMBER 2010 NUMBER 8 ISSUED NOVEMBER 2010 Australia and New Zealand Banking Group
Consolidated Financial Statements of
 Consolidated Financial Statements of For the years ended December 31, 2017 and 2016 KPMG LLP Telephone (403) 691-8000 205 5th Avenue SW Fax (403) 691-8008 Suite 3100 www.kpmg.ca Calgary AB T2P 4B9 To the