Hexaware Reports Fourth Quarter and FY 2017 results. FY 2017 revenue at $607.5 mn; up 15.6% YoY. Profitability Outgrows Revenue
|
|
|
- Zoe Richardson
- 6 years ago
- Views:
Transcription
1 Hexaware Reports Fourth Quarter and FY 2017 results FY 2017 revenue at $607.5 mn; up 15.6% YoY Profitability Outgrows Revenue PAT at $77.0 mn; up 23.5% YoY Growth Growth USD Mn Q YoY QoQ YoY Revenue (Constant Currency ) % % 10.9% US D Mn Growth Growth Q YoY QoQ YoY Revenue % % 12.3% EBITDA* % % 5.1% EBIT % % 1.1% PAT % % 3.5% ` Mn Growth Growth Q YoY QoQ YoY Revenue 39, % 10, % 6.8% EBITDA* 6, % 1, % -0.1% EBIT 5, % 1, % -3.9% PAT 4, % 1, % -1.7% EBITDA* - Excludes ESOP Cost 1 EBITDA* excludes ESOP Cost The financial results above are in accordance with Ind AS for the quarter and year ended December 30th, Accordingly the figures for previous periods have been restated in accordance with Ind AS.
2 2017 Performance Highlights in US$ terms 2 EBITDA* excludes ESOP Cost The financial results above are in accordance with Ind AS for the quarter and year ended December 30th, Accordingly the figures for previous periods have been restated in accordance with Ind AS.

3 2017 Performance Highlights in ` terms 3 EBITDA* excludes ESOP Cost The financial results above are in accordance with Ind AS for the quarter and year ended December 30th, Accordingly the figures for previous periods have been restated in accordance with Ind AS.
4 Q4 Performance Highlights in US$ terms EBITDA* excludes ESOP Cost The financial results above are in accordance with Ind AS for the quarter and year ended December 30th, Accordingly the figures for previous periods have been restated in accordance with Ind AS. 4
5 Q4 Performance Highlights in ` terms EBITDA* excludes ESOP Cost The financial results above are in accordance with Ind AS for the quarter and year ended December 30th, Accordingly the figures for previous periods have been restated in accordance with Ind AS. 5
 was 49 days at the end of Q4 2017 Fourth Interim Dividend of ` 1.")

6 ROI Cash Cash & Cash equivalents at the end of December 2017 at US$ 86.4 Mn; ` 552 crores Days of Sales Outstanding (DSO) was 49 days at the end of Q Fourth Interim Dividend of ` 1.00 (50%) for Q New Wins 5 new clients signed in Q with TCV of US$ 72 Mn. 17 new clients signed in 2017 with TCV of $180 Mn Human Capital Headcount stood at 13,705 at the end of Q4 2017; up 1,550 YoY, up 217 QoQ Utilization stood at 80.9% (including trainees) in the Quarter Attrition at the end of December 2017 was at 13.1% Revenue Split Vertical Split 6


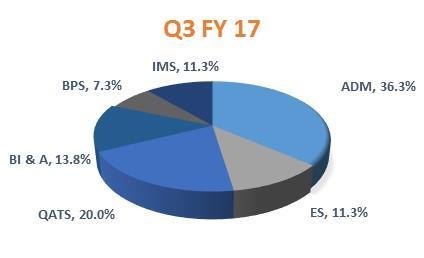
7 Geography Split Service Lines Split 7
8 Revenue Growth Dec-17 Particulars Geography Segments YoY Q o Q Y o Y Americas 12.8% -0.4% 5.8% Europe 12.1% 8.2% 22.7% Asia Pacific 56.8% 8.1% 78.9% Service Lines Split Application Devt & Maint (ADM) 15.3% 3.8% 14.7% Enterprise Solutions (ES) 0.6% -3.5% -4.3% Testing / Digital Assurance (QATS ) 13.3% -1.3% 4.4% Business Intelligence & Analytics (BI&A) 6.7% 1.2% 9.9% Business Process Services (BPS) 24.3% -2.6% 16.2% Infrastructure Management Services (IMS) 55.7% 5.7% 45.1% Vertical Split Banking & Financial Services 23.2% 3.9% 18.6% Travel & Transportation 5.2% -7.5% 2.3% Healthcare & Insurance 11.6% 2.2% 14.2% Manufacturing, Consumer & others 12.2% 1.1% 6.6% Mumbai February 7, 2018: Hexaware Technologies Limited, the fastest growing automationled, next-generation provider of IT, BPO and Consulting services has reported robust numbers for the fourth quarter of the calendar year ended December 31, We have had a spectacular growth of 15.6% in 2017, in an otherwise challenging year for the industry. Going forward, investments in automation, cloud technologies and customer experience transformation continue to be the focus of the Company. remarked Atul Nishar, Chairman, Hexaware Technologies Limited. We are pleased to have delivered industry-leading growth across all parameters in FY17; and are looking forward to continued robust performance in stated R Srikrishna, CEO & Executive Director, Hexaware Technologies Limited. Booking Update Strong TCV Booking of $72 Mn from new customers, in line with our Shrink IT Grow Digital strategy: Shrink IT Grow Digital Global Service Desk for a leading pharmaceutical company Operations Transformation for a financial admin outsourcing and software company Infrastructure support for a communications services provider Digital Workplace services for a facilities management services company Innovation and Transformation for a global imaging technology provider 8
9 Business Update APAC was the fastest growing geography with 56.8% growth in In Q4 2017, APAC showed 8.1% QoQ and 78.9% YoY growth. Banking and Financial Services (BFS) showed an 23.2% growth for the year In Q4 2017, BFS led the vertical growth with 3.9% QoQ and 18.6% YoY growth. IMS and Business Process Services (BPS) showed growth of 55.7% and 24.3% respectively for the year Infrastructure Management Services (IMS) delivered sturdy growth of 5.7% QoQ and 45.1% YoY. Fourth Interim Dividend of 2017 The Board of Directors declared a fourth interim dividend of ` 1.00 per share (50%) on equity shares of ` 2.00 each. The record date is fixed as Tuesday, February 20, 2018 for determining the shareholders entitled for this fourth interim dividend of the year The payment shall be made on February 23, This would result in a cash outflow of ` Crores for dividend payment including tax, resulting in a dividend payout ratio of 30% for Q Earlier in the year, the Board of Directors declared a first interim dividend of ` 1.00 per share (50%), a second interim dividend of ` 1.00 per share (50%) and a third interim dividend of ` 1.00 per share (50%) on equity shares of ` 2.00 each. Including the fourth interim dividend, the dividends declared including tax for the four quarters of 2017 total to ` Crores, amounting to a dividend payout ratio of 29%. This brings the interim dividends for the four quarters of 2017 to ` 4 per share (200%). Foreign Exchange Cover The Company has hedges worth $ Mn at an average exchange rate of ` 70.98, 3.90 Mn at an average exchange rate of ` and 7.50 Mn at an average exchange rate of ` maturing over the course of the next eight quarters (from January 2018 to December 2019). Awards and Recognition Hexaware has been mentioned among the sample list of Vendors offering Healthcare Payer Solutions in the Gartner report titled "How U.S. Healthcare Payers Can Optimize Costs by Choosing the Best Core Administration Vendors" dated 6th October 2017 by Analyst Bryan Cole. Hexaware has been mentioned in "High Performers" category in the HfS report titled "Insurance As a Service" dated 12th October 2017 by Analyst Reetika Joshi. Hexaware has been mentioned in "High Potential" category in the HfS report titled "SAP Success Factors Services 2017 " dated 13th October 2017 by Analyst Khalda De Souza. Hexaware has been mentioned among the sample list of Vendors offering Agile & Devops Solutions in the Gartner report titled "Market Guide for Agile and DevOps Services dated 31st October 2017 by Analyst Neil Barton. Hexaware has been mentioned in Major Contenders category in the Everest report titled "Healthcare Payer IT Services PEAK Matrix 2017 dated 31st October 2017 by Analyst Abhishek Singh. Hexaware has been mentioned in Aspirants category in the Everest report titled Application Modernization PEAK Matrix 2017 dated 3rd November 2017 by Analyst Yugal Joshi & Gunjan Gupta. Hexaware has been mentioned in Aspirants category and adjudged "STAR PERFORMER" in the Everest report titled FAO PEAK Matrix 2017 " dated 9th November 2017 by Rajesh Ranjan. 9
10 Hexaware has been mentioned among the sample list of Vendors offering EA consulting services in the Gartner report titled "Market Guide for Business-Outcome-Driven Enterprise Architecture Consulting" dated 20th November 2017 by analyst James McGovern. Hexaware has been mentioned in Major Contenders category in the Everest report titled Healthcare Provider IT Services dated 9th November 2017 by Abhishek Singh. Hexaware has been mentioned in Major Contenders category in the Everest report titled Healthcare Payer BPO Services dated 11th December 2017 by Manu Aggarwal. About Hexaware Hexaware is a fast growing IT, BPO and Consulting Company. Our focus is to help customers Shrink IT to eliminate costs and improve delivery of commodity IT using automation and technology. Transforming customer experience is at the heart of our Grow Digital strategy. We serve customers in Banking, Financial Services, Capital Markets, Healthcare, Insurance, Manufacturing, Retail, Education, Telecom, Travel, Transportation and Logistics. We deliver highly differentiated services in Rapid Application prototyping, development and deployment; Build, Migrate and Run cloud solutions; Automation-based Application support; Enterprise Solutions for digitizing the back-office; Customer Experience Transformation; Business Intelligence & Analytics; Digital Assurance (Testing); Infrastructure Management Services; and Business Process Services. Hexaware services customers in over two dozen languages, from every major time zone and every major regulatory zone. Our goal is to be the first IT services company in the world to have a 50% digital workforce. Learn more about Hexaware at Safe Harbor Statement Certain statements in this press release concerning our future growth prospects are forward-looking statements, which involve a number of risks, and uncertainties that could cause actual results to differ materially from those in such forward-looking statements. The risks and uncertainties relating to these statements include, but are not limited to, risks and uncertainties regarding fluctuations in earnings, our ability to manage growth, intense competition in IT services including those factors which may affect our cost advantage, wage increases in India, our ability to attract and retain highly skilled professionals, time and cost overruns on fixed-price, fixed-time frame contracts, client concentration, restrictions on immigration, our ability to manage our international operations, reduced demand for technology in our key focus areas, disruptions in telecommunication networks, our ability to successfully complete and integrate potential acquisitions, liability for damages on our service contracts, the success of the companies in which Hexaware has made strategic investments, withdrawal of governmental fiscal incentives, political instability, legal restrictions on raising capital or acquiring companies outside India, and unauthorized use of our intellectual property and general economic conditions affecting our industry. For more information contact: Sreedatri Chatterjee Hexaware Technologies Limited Tel: +91 (22) / 83 sreedatric@hexaware.com 10
11 The financial results are in accordance with Ind AS for the quarter and year ended December 30th, Accordingly, the figures for previous periods have been restated in accordance with Ind AS. Consolidated Income Statement - Ind AS ` Mn Quarterly Data Head Q4 17 Q3 17 QoQ% Q4 16 YoY% Revenues 10,048 9, % 9, % Direct Costs 6,658 6, % 6, % Gross Profit 3,390 3, % 3, % Selling / General And Administration 1,699 1, % 1, % EBITDA* excluding ESOP Costs 1,691 1, % 1, % ESOP Costs % % EBITDA 1,598 1, % 1, % Depreciation and Amortization % % Operating Profit = EBIT 1,440 1, % 1, % Other Income (net) % % Forex Gains / (Losses) % % Profit Before Tax 1,571 1, % 1, % Provision for Tax % % Profit After Tax 1,210 1, % 1, % Share of Profit in associate (0.03) (3.16) NA PAT After Loss in Associate 1,210 1, % 1, % Key Ratios Q3 17 Q2 17 QoQ% Q3 16 YoY% Gross Margin 33.7% 36.0% -2.3% 35.2% -1.5% SG&A to Revenue 16.9% 17.7% -0.8% 17.2% -0.3% EBITDA* excluding ESOP Costs 16.8% 18.3% -1.5% 18.0% -1.2% EBITDA 15.9% 17.4% -1.5% 17.4% -1.5% Operating / EBIT Margin 14.3% 15.8% -1.5% 15.9% -1.6% Profit before tax 15.6% 17.6% -2.0% 17.4% -1.8% Profit after Tax 12.0% 14.3% -2.3% 13.1% -1.0% EPS-INR Basic (0.71) Diluted (0.72) 4.04 (0.02) 11
12 Consolidated Income Statement - Ind AS ` Mn Head FY 17 FY 16 YoY% Revenues 39,420 35, % Direct Costs 25,701 22, % Gross Profit 13,719 12, % Selling / General And Administration 6,818 6, % EBITDA* excluding ESOP Costs 6,901 6, % ESOP Costs % EBITDA 6,552 5, % Depreciation and Amortization % Operating Profit = EBIT 5,919 5, % Other Income (net) % Forex Gains / (Losses) % Profit Before Tax 6,403 5, % Provision for Tax 1,411 1, % Profit After Tax 4,993 4, % Share of Profit in associate (3) - N.A. PAT After Loss in Associate 4,995 4, % Key Ratios FY 17 FY 16 YoY% Gross Margin 34.8% 35.3% -0.5% SG&A to Revenue 17.3% 18.3% -1.0% EBITDA* excluding ESOP Costs 17.5% 17.0% 0.5% EBITDA 16.6% 16.3% 0.3% Operating / EBIT Margin 15.0% 14.7% 0.3% Profit before tax 16.2% 15.9% 0.3% Profit after Tax 12.7% 11.9% 0.8% EPS-INR Basic Diluted
13 Consolidated Audited Balance Sheet- Ind AS Head Assets As at Dec ` Mn As at Sept Property, plant and equipment and intangible 5,414 5,327 Capital work-in-progress 2,563 2,691 Deferred tax assets 1,336 1,388 Other non-current assets & investments in associates 1,571 1,537 Trade receivables and unbilled revenue 7,729 7,919 Other current assets 1,319 1,139 Cash and cash equivalents (inc. restricted) 5,521 4,617 Total assets 25,453 24,620 Equity and liabilities Equity Equity Share capital Other Equity and reserves 19,479 18,553 Total equity 20,073 19,147 Liabilities Non-current liablities Trade payables 2,204 2,292 Other current liablities 2,258 2,119 Provisions 887 1,019 Total liabilities 5,380 5,473 Total equity and liabilities 25,453 24,620 Note : Sept 2017 Balance Sheet has been regrouped and presented in line with current Balance Sheet 13
14 Financial and Operational Metrics Revenue Growth `, Mn Q4 FY 17 Q3 FY 17 Q2 FY 17 Q1 FY 17 Q4 FY 16 FY 17 FY 16 Revenue from Operations 10,048 9,931 9,836 9,605 9,409 39,420 35,349 %, q-o-q Other Income Vertical Split % Q4 FY 17 Q3 FY 17 Q2 FY 17 Q1 FY 17 Q4 FY 16 FY 17 FY 16 Banking and Financial Services Travel & Transportation Healthcare & Insurance Manufacturing, Consumer & others Total Service Lines Split % Q4 FY 17 Q3 FY 17 Q2 FY 17 Q1 FY 17 Q4 FY 16 FY 17 FY 16 Application Development & Maintenance (ADM) Enterprise Solutions QATS /Digital Assurance Business Intelligence & Analytics Business Process Services (BPS) Infrastructure Management Services (IMS) Total Geography % Q4 FY 17 Q3 FY 17 Q2 FY 17 Q1 FY 17 Q4 FY 16 FY 17 FY 16 Americas Europe Asia Pacific Total Onsite: Offshore Mix with BPO % Q4 FY 17 Q3 FY 17 Q2 FY 17 Q1 FY 17 Q4 FY 16 FY 17 FY 16 Onsite Offshore (Incl.Nearshore) Total Client data Repeat Business % Q4 FY 17 Q3 FY 17 Q2 FY 17 Q1 FY 17 Q4 FY Clients billed No Q4 FY 17 Q3 FY 17 Q2 FY 17 Q1 FY 17 Q4 FY Clients added No Q4 FY 17 Q3 FY 17 Q2 FY 17 Q1 FY 17 Q4 FY 16 FY 17 FY
15 DSO Days Q4 FY 17 Q3 FY 17 Q2 FY 17 Q1 FY 17 Q4 FY 16 Billed Including Unbilled Accruals Revenue Concentration % Q4 FY 17 Q3 FY 17 Q2 FY 17 Q1 FY 17 Q4 FY 16 FY 17 FY 16 Top Top Client Size Nos (Last Twelve Months) Q4 FY 17 Q3 FY 17 Q2 FY 17 Q1 FY 17 Q4 FY 16 More than $ 1 Mn Between $ 1 to 5 Mn Between $ 5 to 10 Mn Between $ 10 to 20 Mn Over $ 20 Mn People Numbers % Q4 FY 17 Q3 FY 17 Q2 FY 17 Q1 FY 17 Q4 FY 16 Billable Personnel (IT + BPS Services) Onsite 19.7% 19.9% 20.9% 20.9% 21.0% Offshore 72.5% 72.1% 71.2% 71.0% 70.7% Total 92.2% 92.0% 92.1% 91.9% 91.7% Marketing (Incl. Sales Support) 3.3% 3.3% 3.3% 3.2% 3.3% Others (Incl. Tech. Support) 4.5% 4.7% 4.6% 4.9% 5.0% Grand Total 100.0% 100.0% 100.0% 100.0% 100.0% Utilization % Q4 FY 17 Q3 FY 17 Q2 FY 17 Q1 FY 17 Q4 FY 16 FY 17 FY Attrition Rate % Q4 FY 17 Q3 FY 17 Q2 FY 17 Q1 FY 17 Q4 FY 16 Last Twelve Months Rupee Dollar Rate Q4 FY 17 Q3 FY 17 Q2 FY 17 Q1 FY 17 Q4 FY 16 FY 17 FY 16 Period Closing rate Period average rate
16 Consolidated Income Statement - Ind AS USD K Quarterly Data Head Q4 17 Q3 17 QoQ% Q4 16 YoY% Revenues 156, , % 138, % Direct Costs 103,436 98, % 90, % Gross Profit 52,667 55, % 48, % Selling / General And Administration 26,401 27, % 23, % EBITDA* excluding ESOP Costs 26,267 28, % 24, % ESOP Costs 1,435 1, % % EBITDA 24,831 26, % 24, % Depreciation and Amortization 2,467 2, % 2, % Operating Profit = EBIT 22,365 24, % 22, % Other Income (net) % % Forex Gains / (Losses) 1,984 2, % 1, % Profit Before Tax 24,404 27, % 24, % Provision for Tax 5,613 5, % 6, % Profit After Tax 18,791 21, % 18, % Share of Profit in associate (0) (48) N.A. PAT After Loss in Associate 18,792 22, % 18, % Key Ratios Q4 17 Q3 17 QoQ% Q4 16 YoY% Gross Margin 33.7% 35.9% -2.2% 35.2% -1.5% SG&A to Revenue 16.9% 17.7% -0.8% 17.2% -0.3% EBITDA* excluding ESOP Costs 16.8% 18.3% -1.5% 18.0% -1.2% EBITDA 15.9% 17.4% -1.5% 17.4% -1.5% Operating / EBIT Margin 14.3% 15.8% -1.5% 15.9% -1.6% Profit before tax 15.6% 17.6% -2.0% 17.4% -1.8% Profit after Tax 12.0% 14.3% -2.3% 13.1% -1.1% 16
17 Consolidated Income Statement - Ind AS USD K Head FY 17 FY 16 YoY% Revenues 607, , % Direct Costs 396, , % Gross Profit 211, , % Selling / General And Administration 105,037 95, % EBITDA* excluding ESOP Costs 106,413 89, % ESOP Costs 5,397 3, % EBITDA 101,016 85, % Depreciation and Amortization 9,755 8, % Operating Profit = EBIT 91,261 77, % Other Income (net) % Forex Gains / (Losses) 6,960 5, % Profit Before Tax 98,748 83, % Provision for Tax 21,756 21, % Profit After Tax 76,992 62, % Share of Profit in associate (41) N.A. PAT After Loss in Associate 77,033 62, % Key Ratios FY 17 FY 16 YoY% Gross Margin 34.8% 35.3% -0.5% SG&A to Revenue 17.3% 18.3% -1.0% EBITDA* excluding ESOP Costs 17.5% 17.0% 0.5% EBITDA 16.6% 16.3% 0.3% Operating / EBIT Margin 15.0% 14.8% 0.2% Profit before tax 16.3% 15.9% 0.4% Profit after Tax 12.7% 11.9% 0.8% 17
Growth USD Mn. Q1 18 QoQ YoY Revenue (Constant Currency ) % 10.1%
 % 10.1%") Hexaware Reports Q1 2018 results Q1 Revenue at $162.2 Mn, up 3.9% QoQ, 12.1% YoY Profitability Outgrows Revenue PAT at $20.7 mn; up 10.3% QoQ, 20.3% YoY Growth USD Mn Q1 18 QoQ YoY Revenue (Constant Currency
Hexaware Reports Q1 2018 results Q1 Revenue at $162.2 Mn, up 3.9% QoQ, 12.1% YoY Profitability Outgrows Revenue PAT at $20.7 mn; up 10.3% QoQ, 20.3% YoY Growth USD Mn Q1 18 QoQ YoY Revenue (Constant Currency
Hexaware Reports First Quarter 2019 results
 Hexaware Reports First Quarter 2019 results Mumbai April 24, 2019: Hexaware Technologies Limited, one of the fastest growing automationled, next-generation providers of IT, BPO and Consulting services
Financial Release June 30, 2018
 Hexaware Reports Q2 2018 results Q2 Constant Currency Revenue at $169.8 Mn, up 4.7% QoQ Profitability Outgrows Revenue PAT at $22.7 mn; up 9.5% QoQ, 19.5% YoY EBITDA* - Excludes ESOP Cost Q2 Performance
Hexaware Reports Q results Q1 Revenue at $144.7 Mn, up 4.2% QoQ, 19.0% YoY Q1 EBIT at $22.2 Mn, up 41.2% YoY
 Hexaware Reports Q1 2017 results Q1 Revenue at $144.7 Mn, up 4.2% QoQ, 19.0% YoY Q1 EBIT at $22.2 Mn, up 41.2% YoY Growth USD Mn Q1 17 QoQ YoY Revenue (Constant Currency ) 144.6 4.0% 19.9% ` Mn Q1 17 Growth
Hexaware Reports Q results Q3 Constant Currency Revenue at $171.8 Mn, up 2.1% QoQ Profitability Outgrows Revenue PAT at $24.3 mn; up 6.
 Hexaware Reports Q3 2018 results Q3 Constant Currency Revenue at $171.8 Mn, up 2.1% QoQ Profitability Outgrows Revenue PAT at $24.3 mn; up 6.9% QoQ Growth USD Mn Q3 18 QoQ YoY Revenue (Constant Currency
Hexaware Reports Fourth Quarter and FY 2016 results Q4 Constant Currency Revenue at $139.9 Mn, up 13.2% YoY Q4 EBITDA* at $24.8 Mn, up 24.
 Hexaware Reports Fourth Quarter and FY 2016 results Q4 Constant Currency Revenue at $139.9 Mn, up 13.2% YoY Q4 EBITDA* at $24.8 Mn, up 24.8% YoY USD Mn 2016 Growth Growth YoY Q4 16 QoQ YoY Revenue (Constant
Growth. Growth. Growth
 FY 2015 constant Currency revenue at $496.8 mn; up 17.6% YoY FY 2015 revenue at $485.5 mn; up 14.9% YoY PAT at $60.7 mn; up 15.8% YoY Earnings per share (EPS) was Rs 13.05; up 22.4% YoY New Customer deals
Q revenue at US$ 95.8 mn; at ` 589 Crores
 Q1 2014 revenue at US$ 95.8 mn; at ` 589 Crores First Interim Dividend of 2014: ` 3.00 per share Revenue at $ 95.8 mn up 2% Y-o-Y in $ terms (up 16%Y-o-Y in ` terms to ` 589 Crores) Revenue down 4.3% sequentially
Q Profit after Tax increases by 23% Q-o-Q to ` 97.9 Crores. Q2 Revenue up 1.1% Q-o-Q on constant currency basis; up 0.
 Q2 2013 Profit after Tax increases by 23% Q-o-Q to ` 97.9 Crores Q2 13 Revenue grew by 5.7% Q-o-Q in ` terms; Volume up 1.5% Q-o-Q Q2 Revenue up 1.1% Q-o-Q on constant currency basis; up 0.8% in $ terms
Investor Update Q July 2017
 Investor Update Q2 2017 31 July 2017 Hexaware Technologies. All rights reserved. www.hexaware.com Safe Harbor Statement Certain statements on this presentation concerning our future growth prospects are
Investor Update Q3 2015
 Passionate Employees Investor Update Innovative Services Delighted Customers Q3 2015 4 November 2015 Hexaware Technologies. All rights reserved. www.hexaware.com Safe Harbor Statement Certain statements
Investor Update Q3 2014
 www.hexaware.com Investor Update Q3 2014 Hexaware Technologies. All rights reserved. Safe harbor statement Certain statements on this presentation concerning our future growth prospects are forward-looking
Investor Update Q1 2018
 Investor Update Q1 2018 3 rd May 2018 Hexaware Technologies. All rights reserved. www.hexaware.com Safe Harbor Statement Certain statements on this presentation concerning our future growth prospects are
Investor Update Q3 2018
 Investor Update Q3 2018 24 th October 2018 Hexaware Technologies. All rights reserved. www.hexaware.com Safe Harbor Statement Certain statements on this presentation concerning our future growth prospects
Investor Update Q4 2017
 Investor Update Q4 2017 7 th February 2017 Hexaware Technologies. All rights reserved. www.hexaware.com Safe Harbor Statement Certain statements on this presentation concerning our future growth prospects
Results for Quarter III FY
 Results for Quarter III FY 2012-13 Copyright 2012 Tata Consultancy Services Limited 1 Disclaimer Certain statements in this release concerning our future prospects are forward-looking statements. Forward-looking
TCS Financial Results
 TCS Financial Results Quarter IV & Year Ended FY 2015-16 April 18, 2016 1 Copyright 2014 Tata Consultancy Services Limited Disclaimer Certain statements in this release concerning our future prospects
TCS Financial Results
 TCS Financial Results Quarter IV & Year Ended FY 2014-15 April 16, 2015 1 Copyright 2014 Tata Consultancy Services Limited Disclaimer Certain statements in this release concerning our future prospects
EBIT margin up 280 basis points Y-o-Y in CY 2012; EBIT up 56% Y-o-Y
 CY 2012 revenues up 34% in ` terms and 18% in $ terms EBIT margin up 280 basis points Y-o-Y in CY 2012; EBIT up 56% Y-o-Y PAT for the year 2012: ` 327.6 Crores; up 23% Y-o-Y Diluted EPS increased to `
Highlights of Financial Performance
 Highlights of Financial Performance M. D. Ranganath Chief Financial Officer Safe Harbor Certain statements in this presentation concerning our future growth prospects are forward-looking statements regarding
Financial updates. Rajiv Bansal. Chief Financial Officer Infosys Limited
 Financial updates Rajiv Bansal Chief Financial Officer Safe harbor Certain statements in this presentation concerning our future growth prospects are forward-looking statements regarding our future business
Highlights of Financial Performance FY17
 Safe Harbor Certain statements in this presentation concerning our future growth prospects are forward-looking statements regarding our future business expectations intended to qualify for the 'safe harbor'
Polaris Consulting & Services Limited (BSE: ; NSE: POLARIS) Q1 FY2017 Earnings Presentation August 8, 2016
 Q1 FY2017 Earnings Presentation August 8, 2016") Polaris Consulting & Services Limited (BSE: 532254; NSE: POLARIS) Q1 FY2017 Earnings Presentation August 8, 2016 1 Performance Highlights: Q1 FY2017 Net Revenue EBITDA PAT Rs. 4,955 mn +0.5% y-o-y Rs.
Polaris Consulting & Services Limited (BSE: 532254; NSE: POLARIS) Q1 FY2017 Earnings Presentation August 8, 2016 1 Performance Highlights: Q1 FY2017 Net Revenue EBITDA PAT Rs. 4,955 mn +0.5% y-o-y Rs.
Hexaware. 4QCY18 Result Update. Margin miss, rich valuations. Sector: Technology CMP: ` 322. Recommendation: Hold
 Hexaware 4QCY18 Result Update Margin miss, rich valuations Sector: Technology CMP: ` 322 Recommendation: Hold Market statistics Current stock price (`) 322 Shares O/S (cr.) 29.7 Mcap (` cr) 9,589 52W H/L
Financial Updates. Rajiv Bansal. Vice President and Head Finance
 Financial Updates Rajiv Bansal Vice President and Head Finance Safe harbor Certain statements made here concerning Infosys future growth prospects are forward-looking statements which involve a number
Subject: Outcome of Board Meeting as per SEBI (Listing Obligations and Disclosure Requirements) Regulations, 2015
 Regulations, 2015") . -'EXAWARE Date: 30th January, 2019 To, The Manager Listing, Bombay Stock Exchange Limited Phiroze Jeejeebhoy Towers, Dalal Street, Fort, Mumbai - 400 023 TO, The Manager Listing, National Stock Exchange
. -'EXAWARE Date: 30th January, 2019 To, The Manager Listing, Bombay Stock Exchange Limited Phiroze Jeejeebhoy Towers, Dalal Street, Fort, Mumbai - 400 023 TO, The Manager Listing, National Stock Exchange
Firstsource Solutions Limited Q4 and FY2018 Earnings Update
 Firstsource Solutions Limited Q4 and FY2018 Earnings Update May 07, 2018 Proprietary Notice: This document contains proprietary and confidential statement information of Firstsource. No part of this document
Tech Mahindra Limited Consolidated Fact Sheet Data. P&L Summary (Rs in Mn)
") Tech Mahindra Limited Consolidated Fact Sheet Data. P&L Summary (Rs in Mn) Particulars FY 2015-16 FY 2016-17 Q1 Q2 Q3 Q4 Total Q1 Revenue From Services 62,938 66,155 67,011 68,837 264,942 69,209 Cost of
Tech Mahindra Limited Consolidated Fact Sheet Data. P&L Summary (Rs in Mn) Particulars FY 2015-16 FY 2016-17 Q1 Q2 Q3 Q4 Total Q1 Revenue From Services 62,938 66,155 67,011 68,837 264,942 69,209 Cost of
Earnings Presentation Q U A R T E R E N D E D 3 1 S T D E C E M B E R,
 Earnings Presentation Q U A R T E R E N D E D 3 1 S T D E C E M B E R, 2 0 1 7 Forward Looking Statements Forward-looking statements This presentation contains forward-looking statements which are made
Hexaware. 2QCY17 Result Update. Margin pressure ahead, rich valuations. Sector: Technology CMP: ` 262. Recommendation: Hold
 Hexaware 2QCY17 Result Update Margin pressure ahead, rich valuations Sector: Technology CMP: ` 262 Recommendation: Hold Market statistics Current stock price (`) 262 Shares O/S (cr.) 29.7 Mcap (` cr) 7,774
HCL Tech revenues up 28% to USD 252 million
 Release for Analysts and Investors New Delhi, Apr 19, 2006 HCL Tech revenues up 28% to USD 252 million Quarterly revenues exceed $250 million for the first time annualized revenues in excess of $1 billion
Safe harbor. Copyright 2011 Infosys Technologies Limited
 Safe harbor Certain statements made here concerning Infosys future growth prospects are forward-looking statements which involve a number of risks and uncertainties that could cause actual results to differ
Fact Sheet. Statement of Comprehensive Income for three months ended, Statement of Comprehensive Income for year ended,
 Statement of Comprehensive Income for three months ended, In US $ million, except per equity share data Mar 31, Q4 18 over Dec 31, 2017 Q4 18 over Q4 17 Q3 18 Revenues 2,805 2,569 9.2 2,755 1.8 Cost of
Earnings Presentation Q U A R T E R E N D E D 3 0 T H S E P T E M B E R,
 Earnings Presentation Q U A R T E R E N D E D 3 0 T H S E P T E M B E R, 2 0 1 8 Forward Looking Statements Forward-looking statements This presentation contains forward-looking statements which are made
Safe Harbor Infosys Limited
 Safe Harbor Certain statements in this presentation concerning our future growth prospects are forward-looking statements regarding our future business expectations intended to qualify for the 'safe harbor'
Hexaware. 1QCY16 Result Update. Remaining of CY16 to be better, Rich valuations. Sector: Technology CMP: `227. Recommendation: Hold
 Hexaware 1QCY16 Result Update Remaining of CY16 to be better, Rich valuations Sector: Technology CMP: `227 Recommendation: Hold Market statistics Current stock price (`) 227 Shares O/S (cr.) 30.2 Mcap
FOR IMMEDIATE RELEASE
 Results for the quarter ended June 30, 2015 under IFRS Gross Revenues grew 10% YoY IT Services Revenue grew in line with guidance FOR IMMEDIATE RELEASE Bangalore, India and East Brunswick, New Jersey,
Q2 revenues in Indian Rupee grew by 32% year on year; sequential growth 12%
 Infosys Technologies Announces Results for the Quarter ended September 30, 2008 Q2 revenues in Indian Rupee grew by 32% year on year; sequential growth 12% Q2 revenues in US Dollar grew by 5.3% sequentially;
Tech Mahindra Limited Consolidated Fact Sheet Data. P&L Summary (Rs in Mn)
") Tech Mahindra Limited Consolidated Fact Sheet Data. P&L Summary (Rs in Mn) Particulars FY 2016-17 FY 2017-18 Q1 Q2 Q3 Q4 Total Q1 Revenue From Services 69,209 71,674 75,575 74,950 2,91,408 73,361 Cost
Tech Mahindra Limited Consolidated Fact Sheet Data. P&L Summary (Rs in Mn) Particulars FY 2016-17 FY 2017-18 Q1 Q2 Q3 Q4 Total Q1 Revenue From Services 69,209 71,674 75,575 74,950 2,91,408 73,361 Cost
Earnings Release & Fact Sheet Third Quarter, Fiscal 2019
 Earnings Release & Fact Sheet Third Quarter, Fiscal 2019 Jan 18, 2019 Contents 1. Earnings Release Q3 FY19......3 2. Performance Highlights Q3 FY19 6 3. Financial Statements Q3 FY19 10 4. Contact Information....13
Tech Mahindra Limited Consolidated Fact Sheet Data. P&L Summary (Rs in Mn)
") Tech Mahindra Limited Consolidated Fact Sheet Data. P&L Summary (Rs in Mn) Particulars FY 2016-17 FY 2017-18 Revenue From Services 69,209 71,674 75,575 74,950 291,408 73,361 76,064 Cost of services 48,807
Tech Mahindra Limited Consolidated Fact Sheet Data. P&L Summary (Rs in Mn) Particulars FY 2016-17 FY 2017-18 Revenue From Services 69,209 71,674 75,575 74,950 291,408 73,361 76,064 Cost of services 48,807
Statement of Comprehensive Income for three months ended, Statement of Comprehensive Income for six months ended,
 Statement of Comprehensive Income for three months ended, Sep 30, Q2 18 over Q2 17 In US $ million, except share data Jun 30, 2017 Q2 18 over Q1 18 Revenues 2,728 2,587 5.4 2,651 2.9 Cost of sales 1,743
HCL Tech revenues jump 27%, net income up 35%
 Release for Analysts and Investors New Delhi, Jan 18, 2006 HCL Tech revenues jump 27%, net income up 35% HIGHLIGHTS FOR THE QUARTER On a YOY basis for the quarter, Revenue up 27.0% EBITDA up 24.4% Net
Infosys (NYSE: INFY) announces results for the Quarter and Year ended March 31, 2018
 announces results for the Quarter and Year ended March 31, 2018") Infosys (NYSE: INFY) announces results for the Quarter and Year ended March 31, 2018 Revenues from Digital offerings at $ 2.79 billion (25.5% of total revenues) for FY 18. In Q4, digital revenues grew
Infosys (NYSE: INFY) announces results for the Quarter and Year ended March 31, 2018 Revenues from Digital offerings at $ 2.79 billion (25.5% of total revenues) for FY 18. In Q4, digital revenues grew
Larsen & Toubro Ltd.
 Reasonably Priced Salient features of the IPO: Larsen and Toubro Infotech Ltd. (L&TIL) is a global IT services and solutions company. Incorporated in 1996, it is headquartered in Mumbai, India. The company
NIIT Technologies. 3QFY19 Result Update. Robust revenue visibility, Outlook robust
 NIIT Technologies 3QFY19 Result Update Robust revenue visibility, Outlook robust Sector: Technology CMP: `1227 Recommendation: Buy Market statistics Current stock price (`) 1,227 Shares O/S (cr.) 6.1 Mcap
Performance for the Fourth Quarter and Year ended March 31, Infosys Technologies Limited
 Performance for the Fourth Quarter and Year ended March 31, 2006 Nandan M. Nilekani Chief Executive Officer, President and Managing Director S. Gopalakrishnan Chief Operating Officer and Deputy Managing
Infosys (NYSE: INFY) announces results for the Quarter and Year ended March 31, 2018
 announces results for the Quarter and Year ended March 31, 2018") Infosys (NYSE: INFY) announces results for the Quarter and Year ended March 31, 2018 Revenues from Digital offerings at $ 2.79 billion (25.5% of total revenues) for FY 18 which grew at 3.6% sequentially
Infosys (NYSE: INFY) announces results for the Quarter and Year ended March 31, 2018 Revenues from Digital offerings at $ 2.79 billion (25.5% of total revenues) for FY 18 which grew at 3.6% sequentially
NIIT Technologies. 2QFY19 Result Update. Robust revenue visibility, Outlook robust
 NIIT Technologies 2QFY19 Result Update Robust revenue visibility, Outlook robust Sector: Technology CMP: `1199 Recommendation: Buy Market statistics Current stock price (`) 1,199 Shares O/S (cr.) 6.1 Mcap
Fiscal 2010 revenues expected to grow by 1.7% to 5.7%; to decline by 6.7% to 3.1% in US dollar terms Fiscal 2009 revenue growth of 30% reported
 Infosys Technologies Announces Results for the Quarter and Year Ended March 31, 2009 Fiscal 2010 revenues expected to grow by 1.7% to 5.7%; to decline by 6.7% to 3.1% in US dollar terms Fiscal 2009 revenue
NIIT Technologies. 4QFY17 Result Update. Robust revenue visibility, Margin expansion story intact. Sector: Technology CMP: `471. Recommendation: Buy
 NIIT Technologies 4QFY17 Result Update Robust revenue visibility, Margin expansion story intact Sector: Technology CMP: `471 Recommendation: Buy Market statistics Current stock price (`) 471 Shares O/S
Infosys Technologies Limited Financial Release March 31, 2004
 Infosys expects revenues to grow 24% in fiscal 2005 Becomes a billion dollar company; recommends 3:1 bonus issue and one-time special dividend Bangalore, India April 13, 2004 Highlights Results for the
Financial Performance Q1FY19 Jul 18, 2018
 Financial Performance Q1FY19 Jul 18, 2018 1 Agenda Financial Highlights Business Update Financial Statements Income Statement Balance Sheet Business Analysis Shareholding Pattern 2 Financial Highlights
Hexaware Technologies
 INDUSTRY IT CMP (as on 24 Apr 2017) Rs 220 Target Price Rs 215 Nifty 9,218 Sensex 29,656 KEY STOCK DATA Bloomberg/Reuters HEXW IN No. of Shares (mn) 302 MCap (Rs bn) / ($ mn) 67/1,033 6m avg traded value
Results for the quarter ended December 31, 2012 under IFRS Wipro Records 18% YoY Growth in Net Income in the quarter
 Results for the quarter ended December 31, 2012 under IFRS Wipro Records 18% YoY Growth in Net Income in the quarter FOR IMMEDIATE RELEASE Bangalore, India and East Brunswick, New Jersey, USA January 18,
Mindtree Limited. Earnings release First quarter ended June 30, 2017 (NSE: MINDTREE, BSE: ) July 19, 2017
 July 19, 2017") Mindtree Limited (NSE: MINDTREE, BSE: 532819) Earnings release First quarter ended July 19, Contents 1. Press Release 3 2. Key Financial Metrics 6 3. Key Ratios 6 4. Key Revenue Metrics 7 5. Effort and
Mindtree Limited (NSE: MINDTREE, BSE: 532819) Earnings release First quarter ended July 19, Contents 1. Press Release 3 2. Key Financial Metrics 6 3. Key Ratios 6 4. Key Revenue Metrics 7 5. Effort and
Earnings Presentation Q U A R T E R E N D E D 3 0 T H J U N E,
 Earnings Presentation Q U A R T E R E N D E D 3 0 T H J U N E, 2 0 1 8 Forward Looking Statements Forward-looking statements This presentation contains forward-looking statements which are made pursuant
Q3 Revenues grow by 6.3% quarter on quarter
 Infosys (NYSE: INFY) Announces Results for the Quarter 2012 Q3 Revenues grow by 6.3% quarter on quarter Bangalore, India January 11, 2013 Financial Highlights Consolidated results under International Financial
Infosys Technologies Limited Financial Release June 30, 2008
 Infosys Technologies Announces Results for the Quarter ended June 30, 2008 Q1 revenues grew by 28.7% year on year; sequential growth 7% Bangalore, India July 11, 2008 Highlights Consolidated results for
FOR IMMEDIATE RELEASE
 FOR IMMEDIATE RELEASE Contact: Sridhar Ramasubbu Wipro Limited 408-242-6285 Wipro records 32% growth in Total Revenue Results for the quarter and year ended March 31, 2008 under US GAAP Bangalore, India
FOR IMMEDIATE RELEASE Contact: Sridhar Ramasubbu Wipro Limited Results for the quarter ended December 31, 2005 under US GAAP
 FOR IMMEDIATE RELEASE Contact: Sridhar Ramasubbu Wipro Limited 408-242-6285 Results for the quarter ended December 31, 2005 under US GAAP WIPRO RECORDS 25% GROWTH IN NET INCOME Bangalore, India and Mountain
Q4 revenues sequentially grew by 5.2%; fiscal 2010 revenues grew by 3.0%
 Infosys Technologies (NASDAQ: INFY) Announces Results for the Quarter and Year ended March 31, 2010 Fiscal 2011 revenues expected to grow by 16.0% to 18.0% Q4 revenues sequentially grew by 5.2%; fiscal
10.1% CC YoY Revenue Growth in Q3 Leads to Upward Revision in Guidance
 10.1% CC YoY Revenue Growth in Q3 Leads to Upward Revision in Guidance Infosys (NYSE: INFY) announces results for the Quarter 2018 Bengaluru, India January 11, 2019 With increased client relevance, we
Looking ahead, for the quarter ending September 2004, we expect our Revenue from our Global IT Services business to be approximately $318 million.
 Results for the Quarter ended June 2004 under Consolidated Indian GAAP Wipro records 73% growth in Profit After Tax Global IT business Revenue at $300 million; Sequential Operating Margin expansion by
Infosys. 3QFY19 Result Update. Decent quarter; Strong deal wins. Sector: Technology CMP: ` 684. Recommendation: Buy
 Infosys 3QFY19 Result Update Decent quarter; Strong deal wins Sector: Technology CMP: ` 684 Recommendation: Buy Market statistics Current stock price (`) 684 Shares O/S (cr.) 436.9 Mcap (` cr) 298,684
10.1% CC YoY Revenue Growth in Q3 Leads to Upward Revision in Guidance
 10.1% CC YoY Revenue Growth in Q3 Leads to Upward Revision in Guidance Infosys (NYSE: INFY) announces results for the Quarter 2018 Bengaluru, India January 11, 2019 With increased client relevance, we
Third Quarter FY 2OO7-08. HCL Tech Q3 revenues up by 34% YoY
 HCL Technologies Quarterly Results Third Quarter FY 2OO7-08 I n v e s t o r R e l e a s e N o i d a, N C R, I n d i a, April 15, 2 0 0 8 HCL Tech Q3 revenues up by 34% YoY Deals worth US$ 500 mn inked
Accelerating the Shift to Digital
 Fourth Quarter 2017 Earnings Supplement Accelerating the Shift to Digital February 7, 2018 2017 Cognizant Forward Looking Statements and Non-GAAP Financial Measures This earnings supplement includes statements
Infosys. 4QFY18 Result Update. Decent quarter; margin guidance disappoints
 Infosys 4QFY18 Result Update Decent quarter; margin guidance disappoints Sector: Technology CMP: ` 1169 Recommendation: Buy Market statistics Current stock price (`) 1169 Shares O/S (cr.) 218.4 Mcap (`
FOR IMMEDIATE RELEASE Contact: Sridhar Ramasubbu Wipro Limited Results for the quarter ended December 31, 2009 under IFRS
 FOR IMMEDIATE RELEASE Contact: Sridhar Ramasubbu Wipro Limited 408-242-6285 Results for the quarter ended December 31, 2009 under IFRS Wipro Records 19% YoY Growth in Profit After Tax IT Services Business
Consolidated results under International Financial Reporting Standards (IFRS) for the quarter ended September 30, 2014
 for the quarter ended September 30, 2014") Infosys Announces Results for the Quarter 2014 Q2 revenues at $ 2,201 million. Growth of 3.1% QoQ; 6.5% YoY Q2 constant currency revenue at $ 2,217 million. Growth of 3.9% QoQ; 6.3% YoY Q2 net profit at
Infosys Announces Results for the Quarter 2014 Q2 revenues at $ 2,201 million. Growth of 3.1% QoQ; 6.5% YoY Q2 constant currency revenue at $ 2,217 million. Growth of 3.9% QoQ; 6.3% YoY Q2 net profit at
Fact Sheet Consolidated Financial data, First Quarter,
 Profit and Loss Account summary for the (As per Indian GAAP) Particulars Income from software services, products and business process management June 30, 2009 2008 Growth (%) In Rs. crore, except per share
FOR IMMEDIATE RELEASE. Wipro Limited Results for the year ended March 31, 2005 under US GAAP WIPRO RECORDS 58%GROWTH IN NET INCOME
 FOR IMMEDIATE RELEASE Contact: Results for the year ended March 31, 2005 under US GAAP WIPRO RECORDS 58%GROWTH IN NET INCOME Sridhar Ramasubbu Wipro Limited 650-316-3537 Bangalore, India and Mountain View,
R Systems Announces Record Revenues For Q2 08 Revenues: Rs 90.6 Crores, Up 54% and EBIDT: Rs Crores, Up 147% YoY.
 R Systems Announces Record Revenues For Q2 08 Revenues: Rs 90.6 Crores, Up 54% and EBIDT: Rs 11.05 Crores, Up 147% YoY. Noida, India July 26, 2008 Highlights Consolidated results for the quarter ended
Performance of Infosys for the Fourth Quarter and Year ended March 31, 2004
 Performance of Infosys for the Fourth Quarter and Year ended March 31, 2004 Nandan M. Nilekani Chief Executive Officer, President and Managing Director S. Gopalakrishnan Chief Operating Officer and Deputy
Wipro Limited. October December Presentation to Investors 2015 WIPRO LTD
 Wipro Limited October December 2015 Presentation to Investors 1 Safe Harbor This presentation may contain certain forward looking statements, which involve a number of risks, uncertainties and other factors
Key highlights for the year
 Recommendation Not Rated Snapshot CMP (26/04/2010) Rs. 693 Sector IT & Software Stock Details BSE Code NSE Code Bloomberg Code Market Cap (Rs. Crs) Free Float (%) 52- wk HI/Lo Avg. volume BSE (Quarterly)
Q4 revenues grew by 1.4% sequentially; FY13 revenues grew by 5.8%
 Infosys (NYSE: INFY) Announces Results for the Quarter and Year ended March 31, 2013 Q4 revenues grew by 1.4% sequentially; FY13 revenues grew by 5.8% Bangalore, India April 12, 2013 Financial Highlights
FOR IMMEDIATE RELEASE
 Results for the quarter ended September 30, 2013 under IFRS IT Services Revenue Crosses ` 100 billion per quarter IT Services Operating Margin Expands by 2.5% sequentially Wipro Delivers 28% YoY Net Income
INVESTOR UPDATE FOR. QUARTER ENDED 30 th JUNE (NSE: KPIT, BSE: ) (Apr - June 2009) KEY HIGHLIGHTS
 (Apr - June 2009) KEY HIGHLIGHTS") INVESTOR UPDATE FOR QUARTER ENDED 30 th JUNE 2009 (NSE: KPIT, BSE: 532400) (Apr - June 2009) KEY HIGHLIGHTS Net Profit grew by 73% Y-o-Y and 16% Q-o-Q to Rs. 223.78 Mn. EBITDA grew by 33% Y-o-Y basis to
INVESTOR UPDATE FOR QUARTER ENDED 30 th JUNE 2009 (NSE: KPIT, BSE: 532400) (Apr - June 2009) KEY HIGHLIGHTS Net Profit grew by 73% Y-o-Y and 16% Q-o-Q to Rs. 223.78 Mn. EBITDA grew by 33% Y-o-Y basis to
Consolidated results under International Financial Reporting Standards (IFRS) for the year and quarter ended March 31, 2014
 for the year and quarter ended March 31, 2014") Infosys Announces Results for the Quarter and Year ended March 31, 2014 FY 14 revenue growth doubled to 11.5% in USD terms; increased to 24.2% in INR terms; Q4 operating margins expand 50 bps sequentially
Infosys Announces Results for the Quarter and Year ended March 31, 2014 FY 14 revenue growth doubled to 11.5% in USD terms; increased to 24.2% in INR terms; Q4 operating margins expand 50 bps sequentially
Performance for the. S. Gopalakrishnan Chief Executive Officer and. S. D. Shibulal Chief Operating Officer
 Performance for the Third Quarter ended December 31, 2008 S. Gopalakrishnan Chief Executive Officer and Managing Director S. D. Shibulal Chief Operating Officer Safe Harbour Certain statements in this
TO ALL STOCK EXCHANGES
 TO ALL STOCK EXCHANGES BSE LIMITED NATIONAL STOCK EXCHANGE OF INDIA LIMITED NEW YORK STOCK EXCHANGE July 13, 2018 Dear Sir, Madam, Sub: Outcome of the Board meeting This has reference to our letter dated
2014 NIIT Technologies. July 15, 2014
 July 15, 2014 Outline Financial Highlights Business Update Financial Statements Income Statement Balance Sheet Business Analysis 2014, NIIT Technologies Limited Financial Highlights for Q1 FY15 Consolidated
Luxoft Holding, Inc Q2 FY2018 Call
 Luxoft Holding, Inc Q2 FY2018 Call November 17, 2017 Dmitry Loschinin, CEO & President Evgeny Fetisov, CFO Disclaimer Safe Harbor Forward-Looking Statements 2 Non-GAAP Financial Measures To supplement
Data. Domain. Delivery. eclerx. Financial Performance - FY19 Q1 7 th August, 2018
 Data. Domain. Delivery. eclerx Financial Performance - FY19 Q1 7 th August, 2018 0 Financial Summary Revenue Profit Margin Metrics FY19 Q1 Q-o-Q Y-o-Y OPG revenue (USD mm) 49.2 (6) 1 OPG revenue (INR mm)
INVESTOR UPDATE FOR QUARTER AND YEAR ENDED 31 ST MARCH 2009 KEY HIGHLIGHTS
 INVESTOR UPDATE FOR QUARTER AND YEAR ENDED 31 ST MARCH 2009 KEY HIGHLIGHTS Revenues for the year grew by 36% to Rs.7,931.55Mn. In USD, Revenues grew by 20% to $174.10Mn. Net Profit for the year grew by
Dollar guidance revised upwards; Rupee guidance revised downwards, reflecting appreciating Rupee
 Q1 revenues grew by 25.1% year on year; sequential growth flat Dollar guidance revised upwards; Rupee guidance revised downwards, reflecting appreciating Rupee Bangalore, India July 11, 2007 Highlights
Tech Mahindra. 1QFY18 Result Update. Steps in the right direction, compelling valuation. Sector: Technology CMP: ` 385. Recommendation: Buy
 Tech Mahindra 1QFY18 Result Update Steps in the right direction, compelling valuation Sector: Technology CMP: ` 385 Recommendation: Buy Market statistics Current stock price (`) 385 Shares O/S (cr.) 97.5
Wipro Limited. January - March Presentation to Investors 2016 WIPRO LTD
 Wipro Limited January - March 2016 Presentation to Investors 1 Safe Harbor This presentation may contain certain forward looking statements, which involve a number of risks, uncertainties and other factors
Wipro. 3QFY17 Result Update. Guidance subdued, maintain Hold. Sector: Technology CMP: ` 474. Recommendation: Hold
 Wipro 3QFY17 Result Update Guidance subdued, maintain Hold Sector: Technology CMP: ` 474 Recommendation: Hold Market statistics Current stock price (`) 474 Shares O/S (cr.) 243.1 Mcap (` cr) 115,090 52W
Wipro Limited. April June Presentation to Investors 2015 WIPRO LTD
 Wipro Limited April June 2015 Presentation to Investors 1 Safe Harbor This presentation may contain certain forward looking statements, which involve a number of risks, uncertainties and other factors
TAKE Solutions Ltd - Earnings Release. Quarter and Year Ended March 31, 2018
 TAKE Solutions Ltd - Earnings Release Quarter and Year Ended March 31, 2018 Disclaimer Certain statements in this release concerning our future growth prospects are forward- looking statements, which involve
FOR IMMEDIATE RELEASE
 FOR IMMEDIATE RELEASE Results for the quarter ended June 30, 2006 under Consolidated Indian GAAP Wipro s Profit After Tax grows by 45% Revenue in Global IT business grows 42% to Rs. 24.5 billion Bangalore,
Statement of Comprehensive Income for three months ended,
 Statement of Comprehensive Income for three months ended, In` crore, except share data Growth (%) Dec 31, Growth % Q4 15 over Q3 15 Revenues 13,411 12,875 4.2 13,796 (2.8) Cost of sales 8,174 8,117 0.7
Statement of Comprehensive Income for three months ended, (As per IFRS)
") Statement of Comprehensive Income for three months ended, In` crore, except share data Mar 31 Growth (%) Dec 31, Growth % Q4 16 over Q3 16 Revenues 16,550 13,411 23.4 15,902 4.1 Cost of sales 10,262 8,174
Statement of Comprehensive Income for three months ended, In` crore, except share data Mar 31 Growth (%) Dec 31, Growth % Q4 16 over Q3 16 Revenues 16,550 13,411 23.4 15,902 4.1 Cost of sales 10,262 8,174
Statement of Comprehensive Income for three months ended, (As per IFRS) Statement of Comprehensive Income for nine months ended, (As per IFRS)
 Statement of Comprehensive Income for nine months ended, (As per IFRS)") Statement of Comprehensive Income for three months ended, (As per IFRS) In` crore, except share data Growth (%) Sep 30, 2011 Growth % Particulars Q3 12 over 2011 2010 Q2 12 s 9,298 7,106 30.8 8,099 14.8
Statement of Comprehensive Income for three months ended, (As per IFRS) In` crore, except share data Growth (%) Sep 30, 2011 Growth % Particulars Q3 12 over 2011 2010 Q2 12 s 9,298 7,106 30.8 8,099 14.8
NIIT Technologies. Financial Performance Q4FY14. May 9, NIIT Technologies
 NIIT Technologies Financial Performance Q4FY14 May 9, 2014 Outline Financial Highlights FY14 Q4FY14 Business Update Financial Statements Income Statement Balance Sheet Business Analysis Financial Highlights
Tech Mahindra. 4QFY17 Result Update. Short term blip, compelling valuation. Sector: Technology CMP: ` 429. Recommendation: Buy
 Tech Mahindra 4QFY17 Result Update Short term blip, compelling valuation Sector: Technology CMP: ` 429 Recommendation: Buy Market statistics Current stock price (`) 429 Shares O/S (cr.) 97.1 Mcap (` cr)
Statement of Comprehensive Income for three months ended,
 Statement of Comprehensive Income for three months ended, In` crore, except share data Growth (%) Dec 31, 2013 Growth % Q4 14 over Q3 14 Revenues 12,875 10,454 23.2 13,026 (1.2) Cost of sales 8,117 6,802