Need for Services Trade Data Collection Present Status and a Roadmap for Future
|
|
|
- Todd Boone
- 6 years ago
- Views:
Transcription
1 Need for Services Trade Data Collection Present Status and a Roadmap for Future Panel Discussion at the Seminar organised jointly by Ministry of Commerce & Industry and ICRIER India Habitat Centre, New Delhi June 7, 2016
2 Global Information base on International Trade in Services The collection of data on cross-border trade in services is notoriously difficult, in large part due to the intangible nature of services but also the high capacity needed for such data. This is particularly true for the developing countries..... As a word of caution, it should be added that the quality of trade data in services is still far away from being comparable to trade data for merchandise goods..... Due to intangibility and non-storability of services, at-the-border-duties cannot be applied to services, thus having resulted in much weaker compilation practices with considerably less accuracy. Thus, services statistics has ample space for improvement in terms of measurement, In particular, with respect to modes 3 and 4, measurement is difficult and incomplete. Ongoing revisions and refinements of the BoP classification work towards solving these issues. - The World Bank (in introduction to its Trade in Services Database)
3 Valuation of Goods and Services: Separation Services are the result of a production activity that changes the conditions of the consuming units, or facilitates the exchange of products or financial assets. (BPM6 2008) Services cover a heterogeneous range of intangible products and activities that are difficult to encapsulate within a simple definition. They are often difficult to separate from the goods with they may be associated with varying degree. (MSITS 2010) In BoP, Valuation of goods includes transport within the exporting economy as well as wholesale & retail services. Value of some service items (e.g., travel) includes values of some goods. Some services (e.g., repair services, freight transport) relate to goods. Except some knowledge-capturing products (e.g., computer software) which may be traded separately from their production, like goods, services are not separate items over which ownership rights can be established and cannot generally be separated from their production.
4 Information Base on India s International Trade in Services: The Reserve Bank s Initiatives in recent years Move from Quarterly to Monthly dissemination of data on India s International Trade in Services (April-2011) Dissemination of Detailed Quarterly data on India s Invisibles as per IMF s BPM-6 (Since Q1: ) Foreign Affiliate Trade Statistics (FATS): Inward FATS since Outward FATS since Census / Surveys for capturing Additional Dimensions: International Trade in Banking Services (100% coverage) Computer Software and ITES exports (>75% coverage) Foreign Collaboration in Indian Industries (Voluntary participation Every 2 years) Preparation of Frame of large service exporters (in absence of National Statistical Business Register) for collection of data in trade in services: Collaboration with MoCI(DGCIS)
5 India s International Trade in Services: Receipts and Payments during H1: (US $ million) Broad Category of Services I_Receipts I_Payments 1) Travel 9,603 7,866 2) Transport 7,405 7,964 3) Insurance 1, ) Government Not Included Elsewhere ) Telecommunications, computer and information services 38,399 1,935 6) Construction services ) Financial services 3,003 1,653 8) Royalties, copyright and license fees 262 2,558 9) Business services 15,036 14,814 10) Personal, cultural & Recreational services ) Maintenance and Repair Services ) Manufacturing services on physical inputs owned by others ) Other Services not included elsewhere 350 2,292
6 More Details: Activities under Business Services a) Research & Development i) Research & Development services ii) Market research and public opinion polling service b) Professional and management consulting services i) Legal services ii) Accounting, auditing, book keeping services iii) Business and management consultancy and public relations services iv) Advertising, trade fair service v) Architectural services vi) Engineering Services vii) Tax consulting services c) Technical, trade-related, and other business services i) Trade related services commission on exports / imports ii) Operational leasing services (other than financial leasing) without operating crew, including charter hire- Airlines companies iii) Agricultural services like protection against insects & disease, increasing of harvest yields, forestry services. iv) Inward remittance for maintenance of offices in India v) Environmental Services vi) Publishing and printing services vii) Mining services like on site processing services analysis of ores etc. viii) Commission agent services ix) Wholesale and retailing trade services. x) Operational leasing services (other than financial leasing) without operating crew, including charter hire- Shipping companies xi) Other Technical Services including scientific/space services. Data on receipts & payments under each activity are published every quarter
7 Skewed Coverage of Trade in Services Select services: Sector of Service Export Total no. of transactions Cut-off (Rs.) % Coverage No. Amount Health lakh Education lakh Insurance lakh Telecom lakh Audio-visual lakh Tourism lakh Professional Services: (i) Architectural lakh (ii) Legal lakh (iii) Accounting and auditing lakh (iv) Management consultancy crore (v) Engineering crore (vi) Construction lakh (vii) Tax consulting lakh
8 Census / Surveys conducted by RBI on International Trade in Services Computer Software / ITES Export Banking Services Foreign Technical Collaboration Inward & Outward FATS
9 ITES / BPO Exports Software and IT enabled services plays an important role in the Indian economy net receipts (surplus) on account of trade of computer software services finance the trade deficit and aid in reducing the CAD considerably. It accounts nearly half of the services exports The annual survey on Software and Information Technology Enabled Services Exports is conducted by RBI as per the recommendations of the National Statistical Commission and subsequent guidance from the Technical Group on Computer Services Exports (TGCSE). The survey collect details of: Exports of computer services as defined in BPM6 and MSITS Business activity, type of organization, exports as per major activities, country and currency wise exports, type of exports (onsite and off-site), employment, business done by the subsidiaries / associates abroad. Software exports data as per the four modes of supply as per MSITS The survey frame is prepared using the member companies of NASSCOM and companies registered with STPI. Responses received from around companies, including most of the major Software and IT/BPO companies which together account for about per cent of the total software exports during the year.
10 Rs. billion Indian IT / Software Industry An Overview Indian IT / Software Industry has shown resilience in the face of marked moderation in global demand following the global financial crisis of , though the pace of growth has moderated considerably. Share of India s software services export to total services export Software services Exports Average growth rate Period Per cent (%) Annual to to India's Export of Computer and ITES/BPO services Computer Services ITES/BPO Services
11 Software Exports by Different Modes (per cent) Mode Mode 1: Cross-border Supply Mode 2: Consumption Abroad Mode 3: Commercial Presence Mode 4: Natural Persons Presence Software Business by Foreign Affiliates of Indian Companies: Activity Locally To India (Rs. billion) Other Countries IT services Software Product Development BPO Services Engineering Services Combination of above / Other services Total
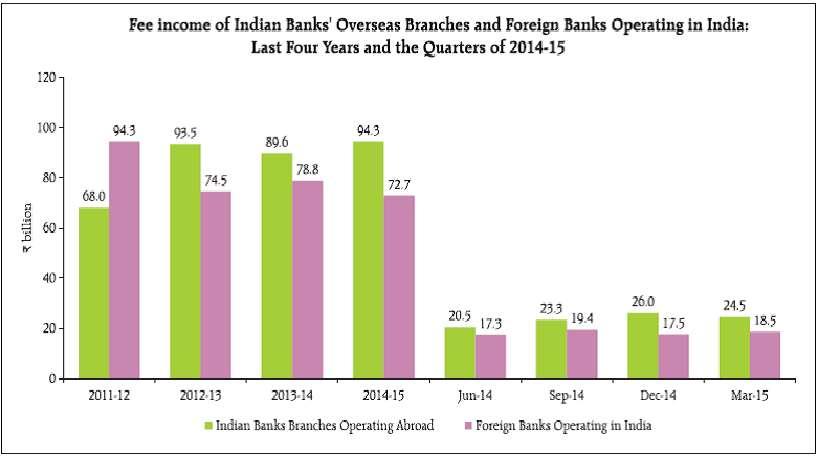
12 International Trade in Banking Services The Reserve Bank s annual survey on International Trade in Banking Services (ITBS) provides information on financial services rendered by: Overseas branches/subsidiaries of Indian banks Branches/subsidiaries of foreign banks operating in India, based on explicit/implicit fee/commission charged to customers. It covers Branch / employee / country profile of their banking business Service activities (both fund and non-fund based) Balance sheet changes, income / expenditure and profitability Since all entities report, it gives a census position
13
14
15 Foreign Technical Collaboration: Highlights of Last Biannual Round Country-wise Distribution of Agreements of Foreign Technical Collaboration (FTC) Mode of Payment Distribution of Agreements According to Mode of Payment of FTC Companies Number % of total Royalty Lump-sum technical fees Both Royalty and Lumpsum technical fees Total 449* Japan United States Germany United Kingdom Singapore Italy Mauritius Korea, Republic of Switzerland France Others * Of the 528 agreements, 449 agreements reported along with the specific mode of payment in the latest survey.
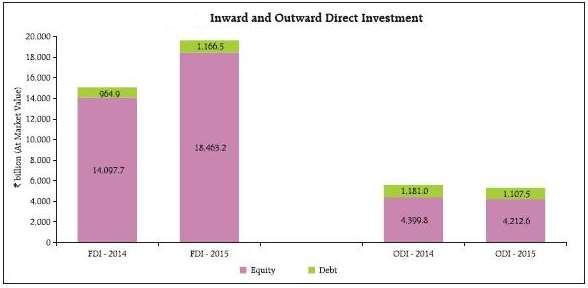
16 Foreign Affiliate Trade Statistics (FATS) Information base in India: India s FLA census has evolved as a rich data source of direct investment to/from India. Over 17,000 companies reported FDI/ODI in March largest annual company-wise database for Indian FDI companies. Partner country-wise inward and outward direct investment (debt and equity) for India, at market prices, are now available annually. India s first census of Foreign Liabilities and Assets was conducted as on June 30, 1948, - information collected under the International Monetary Fund and Bank Act, Since 1997, reporting was annual but participation was not mandatory up to Since reporting is mandatory for the Indian companies which have received FDI and/or made overseas direct investment, for facilitating India s participation in CDIS (since 2010 round). Collection of multidimensional FLA census data by providing a self-validating form with explanations and internal consistency. It has a strict confidentiality clause. Foreign Affiliate Trade Statistics (FATS) is collected as part of this reporting system.
17
18 Sector-wise Distribution of FDI at Market Value: March 2015 (Rs. billion) Activity Total FDI % share in Total A. Agriculture-related, Plantations & Allied activities B. Mining C. Manufacturing 10, Chemicals and chemical products 1, Pharmaceuticals, medicinal chemical & botanical prod Motor vehicles, trailers and semi-trailers 1, Tobacco products Food products Electrical equipment Machinery and equipmen Coke and refined petroleum products Computer, electronic and optical products Basic metals Other Manufacturing 2, D. Electricity, gas, steam and air conditioning supply E. Water supply, sewerage, waste mgt./remediation F. Construction G. Services 7, Information and communication 3, Financial and insurance activities 2, Other Services 1, Total 19,
19 Subsidiary Companies - FATS FLA Census ,296 FDI Companies in India 96 % are unlisted 75 % of Subsidiary companies (Equity > 50%), of which 8,032 companies reported sales and 6,024 companies reported exports 3,608 Overseas Subsidiaries of 2,129 Indian Companies Foreign Trade for Foreign Subsidiary Companies, Inward FATS Outward FATS Export in Sales (%) Imports in Purchase (%)
20 Activity Activity-wise Sales of 10,777 Foreign Subsidiary Companies in India (Amount in billion) No. of Companies Sales in % Share in Total A. Agriculture-related, Plantations & Allied activities B. Mining C. Manufacturing 2,258 10, D. Electricity, gas, steam and air conditioning supply E. Water supply; sewerage, waste management and remediation activities F. Construction G. Services 5,390 5, Wholesale and retail trade; repair of motor vehicles 835 1, Transportation and storage Accommodation and Food service activities Information and communication 2,142 3, Financial and insurance activities Real estate activities Other Services activities 1, Total 8,032* 16, * Of the 10,777 subsidiary companies, 8,032 reported sales
21
RESERVE BANK OF INDIA PAYMENT CODES
 Below is the list of Payment s required for payments to India exceeding 100,000INR (or 1800 USD equivalent). To give you a sense of the reporting that local banks in India are required to make, if the
Appendix I: Purpose of Payment Code
 Appendix I: Purpose of Payment Code LIST OF S FOR RECEIPT S IN INDIA 0 Capital Account P0001 P0002 P0003 P0004 P0005 P0006 P0007 P0008 P0009 P00010 P00011 P00012 P00013 P00014 P00015 P00016 P00017 P00018
NEW PURPOSE CODES FOR REPORTING FOREX TRANSACTIONS PAYMENT PURPOSES. Purpose Code S0001 S0002. S0003 Indian investment abroad -in branches
 Annexure III NEW PURPOSE CODES FOR REPORTING FOREX TRANSACTIONS PAYMENT PURPOSES Group 00 Capital Account Group S0001 S0002 Indian investment abroad -in equity capital (shares) Indian investment" abroad
ZAMBIA: COUNTRY EXPERIENCE ON COMPILATION & PUBLICATION OF FOREIGN AFFLIATES TRADE IN SERVICES STATISTICS (FATS)
") ZAMBIA: COUNTRY EXPERIENCE ON COMPILATION & PUBLICATION OF FOREIGN AFFLIATES TRADE IN SERVICES STATISTICS (FATS) By Christabel & Wilson Phiri, BoZ. SADC Workshop On Trade In Services Statistics, 27 th
ZAMBIA: COUNTRY EXPERIENCE ON COMPILATION & PUBLICATION OF FOREIGN AFFLIATES TRADE IN SERVICES STATISTICS (FATS) By Christabel & Wilson Phiri, BoZ. SADC Workshop On Trade In Services Statistics, 27 th
Foreign Affiliates Statistics
 SADC Workshop on Statistics of International Trade in Services Foreign Affiliates Statistics Johannesburg, South Africa 10-12 February 2016 1 Typical questions on globalization, the monitoring of GATS
NEW PURPOSE CODES FOR REPORTING FOREX TRANSACTIONS RECEIPT PURPOSES. Purpose Code
 Annexure II NEW PURPOSE CODES FOR REPORTING FOREX TRANSACTIONS RECEIPT PURPOSES Group Group 00 Capital Account.P0001 Repatriation of Indian investment abroad in equity capital (shares) P0002 Repatriation
FDI and FATS statistics and tourism
 Regional Workshop on Travel and International Tourism Consumption FDI and FATS statistics and tourism Roseau, Dominica, 14-17 May 2013 1 Value added in Hotels and Restaurants in selected CARICOM Members
The current statistical framework for measuring trade in services and how it can be applied. Contact:
 The current statistical framework for measuring trade in services and how it can be applied Contact: Andreas.Maurer@wto.org 1 World Trade in Commercial Services, Total Exports, 1980-2002 (USD billion and
ZAMBIA-COUNTRY EXPERIENCE IN COMPILING FOREIGN AFFILIATES TRADE STATISTICS (FATS)
") ZAMBIA-COUNTRY EXPERIENCE IN COMPILING FOREIGN AFFILIATES TRADE STATISTICS (FATS) WTO Seminar on Developments in Trade in Services Statistics and the Way Forward Geneva,19 th September 2014 1. FATS in
ZAMBIA-COUNTRY EXPERIENCE IN COMPILING FOREIGN AFFILIATES TRADE STATISTICS (FATS) WTO Seminar on Developments in Trade in Services Statistics and the Way Forward Geneva,19 th September 2014 1. FATS in
Foreign Affiliates Statistics (FATS) FATS COMPILATION. Workshop on the Compilation of Trade in Services Statistics Abu Dhabi, January 2015
 FATS COMPILATION. Workshop on the Compilation of Trade in Services Statistics Abu Dhabi, January 2015") Foreign Affiliates Statistics (FATS) FATS COMPILATION Workshop on the Compilation of Trade in Services Statistics Abu Dhabi, 25-28 January 2015 1 FATS what they are Summary of the statistical framework
Foreign Affiliates Statistics (FATS) FATS COMPILATION Workshop on the Compilation of Trade in Services Statistics Abu Dhabi, 25-28 January 2015 1 FATS what they are Summary of the statistical framework
CEFTA Workshop on Foreign Affiliates Statistics. FATS compilation. Brussels, Belgium 9-10 December 2014
 CEFTA Workshop on Foreign Affiliates Statistics FATS compilation Brussels, Belgium 9-10 December 2014 1 1. What does FATS mean? 1. What does AMNEs stand for? 2. What do they measure? 3. What are FATS useful
FORM A2 (To be completed by the applicant)
") FORM A2 (To be completed by the applicant) Annex-2 FORM A2 (For payments other than imports and remittances covering intermediary trade) Application for Remittance Abroad AD Code Form (To be filled in
FORM A2 (To be completed by the applicant) Annex-2 FORM A2 (For payments other than imports and remittances covering intermediary trade) Application for Remittance Abroad AD Code Form (To be filled in
FORM A2 (To be completed by the applicant)
") FORM A2 (To be completed by the applicant) 7 Annex (For payments other than imports and remittances covering intermediary trade) Application for Remittance Abroad AD No. Form No. (To be filled in by the
FORM A2 (To be completed by the applicant) 7 Annex (For payments other than imports and remittances covering intermediary trade) Application for Remittance Abroad AD No. Form No. (To be filled in by the
Measuring Trade in Services. Training Module. Overview. Specifics of Trade in Services. The 4 Modes of Supply Under GATS.
 Overview Measuring Trade in Services Training Module Carsten Fink Trade in Services and International Agreements Hanoi, Vietnam, May 23-27, 2005 Based on the presentation by Andreas Maurer (WTO) at the
Please refer to the category description to assist you in determining the main category to be used for your transaction type.
 BOP category description aid Inward Please refer to the category description to assist you in determining the main category to be used for your transaction type. Main description Category description Sub
National Accounts Estimates ( ) September 2018 issue
 September 2018 issue") National Accounts Estimates (2015 2018) September 2018 issue 1. INTRODUCTION This issue of Economic and Social Indicators presents National Accounts estimates for the period 2015 to 2018. Concepts and
National Accounts Estimates (2015 2018) September 2018 issue 1. INTRODUCTION This issue of Economic and Social Indicators presents National Accounts estimates for the period 2015 to 2018. Concepts and
National Accounts Estimates ( ) March 2018 issue
 March 2018 issue") National Accounts Estimates (2015 2018) March 2018 issue 1. INTRODUCTION This issue of Economic and Social Indicators presents National Accounts estimates for the period 2015 to 2018. Concepts and definitions
National Accounts Estimates (2015 2018) March 2018 issue 1. INTRODUCTION This issue of Economic and Social Indicators presents National Accounts estimates for the period 2015 to 2018. Concepts and definitions
EUROPEAN UNION SOUTH KOREA TRADE AND INVESTMENT 5 TH ANNIVERSARY OF THE FTA. Delegation of the European Union to the Republic of Korea
 EUROPEAN UNION SOUTH KOREA TRADE AND INVESTMENT 5 TH ANNIVERSARY OF THE FTA 2016 Delegation of the European Union to the Republic of Korea 16 th Floor, S-tower, 82 Saemunan-ro, Jongno-gu, Seoul, Korea
APPLICATION CUM FORM A2 WITH FEMA DECLARATION For Telegraphic Transfer (TT) / Demand Draft (DD) /Foreign Currency Notes (CN)
 / Demand Draft (DD) /Foreign Currency Notes (CN)") APPLICATION CUM FORM A2 WITH FEMA DECLARATION For Telegraphic Transfer (TT) / Demand Draft (DD) /Foreign Currency Notes (CN) AD Code no. Branch code: Form No. Currency Amount (in Foreign currency) Equivalent
APPLICATION CUM FORM A2 WITH FEMA DECLARATION For Telegraphic Transfer (TT) / Demand Draft (DD) /Foreign Currency Notes (CN) AD Code no. Branch code: Form No. Currency Amount (in Foreign currency) Equivalent
Nauru. Key Indicators for Asia and the Pacific Item
 Key Indicators for Asia and the Pacific 2018 1 POPULATION Total population a as of 1 July ( 000) 10.1 10.1 10.1 9.9 9.7 9.5 9.1 9.2 9.4 9.5 9.7 10.1 10.3 10.8 11.9 12.5 13.0 13.3 Population density (persons/km
Balance of Payments (BoP) Categories
 Categories") Balance of Payments () Categories All funds received into and paid from South Africa are required to be reported to the South African Reserve Bank (SARB). This reporting relates to the reason for the receipt
Balance of Payments () Categories All funds received into and paid from South Africa are required to be reported to the South African Reserve Bank (SARB). This reporting relates to the reason for the receipt
Hong Kong, China. Key Indicators for Asia and the Pacific 2017
 Key Indicators for Asia and the Pacific 2017 1 POPULATION a Total population b million; as of 1 July 6.665 6.714 6.744 6.731 6.784 6.813 6.857 6.916 6.958 6.973 7.024 7.072 7.150 7.179 7.230 7.291 7.337
BoP Codes Outward Forex Transactions
 BoP s Outward Forex Transactions All cross-border transactions must be reported to the South African Reserve Bank in accordance with SARB Regulations. Balance of Payments Reporting (BoP Reporting for short)
Outward Categories. BoPCus categories version 2 & version 3 As received from SARB 23 April 2013
 Outward Categories BoPCus categories version 2 & version 3 As received from SARB 23 April 2013 BoP 2 A. Merchandise 100 / 950 100 01 Adjustments / Reversals / Refunds applicable to merchandise Imports:
Tuvalu. Key Indicators for Asia and the Pacific Item
 1 POPULATION Total population thousand; as of 1 July 9.5 9.6 9.6 9.7 10.0 10.3 10.4 11.1 11.0 11.1 11.1 10.6 10.8 10.9 11.0 11.2 11.3 Population density persons per square kilometer 372 374 373 378 389
Tuvalu. Key Indicators for Asia and the Pacific Item
 Key Indicators for Asia and the Pacific 2016 1 POPULATION Total population a thousand; as of 1 July 9.5 9.6 9.6 9.7 10.0 10.3 10.4 11.1 11.0 11.1 11.1 10.6 10.8 10.8 10.8 10.8 Population density persons
National Accounts GROSS DOMESTIC PRODUCT BY PRODUCTION, INCOME AND EXPENDITURE APPROACH
 TB 01 Thematic Bulletin ISSN 2232-7789 National Accounts GROSS DOMESTIC PRODUCT BY PRODUCTION, INCOME AND EXPENDITURE APPROACH Bosnia and Herzegovina BHAS Agency for Statistic of Bosnia and Herzegovina
Hong Kong, China. Key Indicators for Asia and the Pacific 2018
 Key Indicators for Asia and the Pacific 2018 1 POPULATION a Total population as of 1 July (million) 6.7 6.7 6.7 6.7 6.8 6.8 6.9 6.9 7.0 7.0 7.0 7.1 7.2 7.2 7.2 7.3 7.3 7.4 Population density b (persons/km
Japan's Balance of Payments for August 2009 International Department Bank of Japan
 Japan's Balance of Payments for 28 August 29 International Department Bank of Japan This is an English translation of the Japanese original released on March 24, 29 Balance of Payments 28 Please contact
Viet Nam. Key Indicators for Asia and the Pacific Item
 1 POPULATION Total population million; as of 1 July 77.11 78.12 79.08 80.00 80.95 81.91 82.85 84.22 85.12 86.03 86.93 87.84 88.81 89.76 90.73 91.71 92.7* Population density persons per square kilometer
EXTERNAL SECTOR MODULE 1 BALANCE OF PAYMENT
 EXTERNAL SECTOR MODULE 1 BALANCE OF PAYMENT External sector deals with export and import of goods and services, and financial capital between nations. The countries export goods and services over which
SPECIAL RELEASE Annual Survey of Philippine Business and Industry (Total Employment of 20 and Over- Final Results) National Capital Region
 National Capital Region") Number: 2015-04 Date Released: June 15, 2015 REPUBLIC OF THE PHILIPPINES PHILIPPINE STATISTICS AUTHORITY NATIONAL CAPITAL REGION SPECIAL RELEASE 2010 Annual Survey of Philippine Business and Industry (
Number: 2015-04 Date Released: June 15, 2015 REPUBLIC OF THE PHILIPPINES PHILIPPINE STATISTICS AUTHORITY NATIONAL CAPITAL REGION SPECIAL RELEASE 2010 Annual Survey of Philippine Business and Industry (
Japan's Balance of Payments Statistics and International Investment Position for 2017
 Japan's Balance of Payments Statistics and International Investment Position for 217 July 218 International Department Bank of Japan Japan's balance of payments statistics for 217 -- the annually revised
NATIONAL ECONOMIC ACCOUNTS 2011 (Provisional Estimates)
") REPUBLIC OF CYPRUS NATIONAL ECONOMIC ACCOUNTS 2011 (Provisional Estimates) STATISTICAL SERVICE National Accounts Statistics Series II Report No. 28 Obtainable from the Printing Office of the Republic of
REPUBLIC OF CYPRUS NATIONAL ECONOMIC ACCOUNTS 2011 (Provisional Estimates) STATISTICAL SERVICE National Accounts Statistics Series II Report No. 28 Obtainable from the Printing Office of the Republic of
Japan's Balance of Payments Statistics and International Investment Position for 2016
 Japan's Balance of Payments Statistics and International Investment Position for 16 July 17 International Department Bank of Japan Japan's balance of payments statistics for 16 -- the annually revised
The GATS and relevant statistical frameworks
 SADC Workshop on Trade in Services Statistics The GATS and relevant statistical frameworks Gaborone, Botswana, 28-31 January 2014 The GATS System of rules covering international trade in services - Measures
India s International Trade & Investment
 India s International Trade & Investment July 2017 1 Structure of Presentation 1 Indian Economy: A Snapshot 2 Merchandise Trade: A Perspective 3 Services Trade: Recent Trends 4 India s Investment Flows
Viet Nam. Key Indicators for Asia and the Pacific Item
 Key Indicators for Asia and the Pacific 2018 1 POPULATION Total population as of 1 July (million) 77.11 78.12 79.08 80.00 80.95 81.91 82.85 84.22 85.12 86.03 86.93 87.84 88.81 89.76 90.73 91.71 92.69 93.67*
The role of FDI and trade in the catching-up process
 Wiener Institut für Internationale Wirtschaftsvergleiche The Vienna Institute for International Economic Studies wiiw.ac.at 8th East Jour Fixe of the Oesterreichische Nationalbank Bulgaria and Romania
Dr. Lucian Cernat Chief Trade Economist European Commission
 Dr. Lucian Cernat Chief Trade Economist European Commission Trade in services: European and global issues Dr. Lucian Cernat Chief Trade Economist European Commission @Lucian_Cernat 1 Key points The role
Measuring International Investment by Multinational Enterprises
 Measuring International Investment by Multinational Enterprises Implementation of the OECD s Benchmark Definition of Foreign Direct Investment, 4th edition 5 The 4 th edition of the OECD s Benchmark Definition
China, People s Republic of
 1 POPULATION Total population as of 31 December (million) 1,267.4 1,276.3 1,284.5 1,292.3 1,299.9 1,307.6 1,314.5 1,321.3 1,328.0 1,334.5 1,340.9 1,347.4 1,354.0 1,360.7 1,367.8 1,374.6 1,382.7 1,390.1
Chapter 3 Emergence of new sources for growth Section 1 Rise of the services industry and expansion of services trade
 Chapter 3 Emergence of new sources for growth Key points of Part I, Chapter 3 While goods trade has slowed down around the world, services trade is steadily growing. The size of the global market is 1.2
Myanmar. Key Indicators for Asia and the Pacific Item
 Key Indicators for Asia and the Pacific 2017 1 POPULATION a Total population million; as of 1 October 46.1 46.6 47.1 47.6 48.1 48.5 48.8 49.2 49.5 49.8 50.2 50.6 51.0 51.4 52.0 52.5 52.9 Population density
Review of the Economy. E.1 Global trends. January 2014
 Export performance was robust during the third quarter, partly on account of the sharp depreciation in the exchange rate of the rupee and partly on account of a modest recovery in major advanced economies.
Gross domestic product of Montenegro for period
 MONTENEGRO STATISTICAL OFFICE RELEASE No: 211 Podgorica, 30. September 2015 When using these data, please name the source Gross domestic product of Montenegro for period 2010-2014 Real growth rate of gross
Guidelines for Submission of Data: Foreign Exchange Transactions Electronic Reporting System (FETERS) Reporting to RBI: Naming Convention:
 Reporting to RBI: Naming Convention:") Guidelines for Submission of Data: Foreign Exchange Transactions Electronic Reporting System (FETERS) Nodal offices of Authorised Dealer (AD) banks are required to report purpose, country, currency and
Guidelines for Submission of Data: Foreign Exchange Transactions Electronic Reporting System (FETERS) Nodal offices of Authorised Dealer (AD) banks are required to report purpose, country, currency and
Survey on International Trade in Banking Services: *
 Survey on International Trade in Banking Services: 2016-17 ARTICLE Survey on International Trade in Banking Services: 2016-17* The annual survey of international trade in banking services (ITBS) covers
Trade in Services Exports: The Indian Perspective
 International Workshop on Services Trade Statistics Durban, South Africa, June 15-16, 2009 Presentation By R K PATTNAIK, Adviser, Reserve Bank of India Mumbai, India Trade in Services Exports: The Indian
CANADA S MERCHANDISE TRADE WITH THE WORLD
 NOTES The Library of Parliament s Trade and Investment series provides information on Canada s trade and investment relationship with the world and with selected countries. It also describes the trade
How Much, With Whom and What Does the US Trade? It is important to remember that trade includes both Goods and Services.
 How Much, With Whom and What Does the US Trade? It is important to remember that trade includes both Goods and Services. In 2016 1 : The US exported $1.5 trillion in Goods and $750 billion in Services
CROATIA February 2013
 United Nations Conference on Trade And Development INVESTMENT COUNTRY PROFILES CROATIA February 2013 Croatia i NOTE The Division on Investment and Enterprise of UNCTAD is a global centre of excellence,
Gross domestic product of Montenegro in 2011
 MONTENEGRO STATISTICAL OFFICE R E L E A S E No: 257 Podgorica, 28 September 2012 When using the data please name the source Gross domestic product of Montenegro in 2011 Real growth rate of gross domestic
An Overview of World Goods and Services Trade
 Appendix IV An Overview of World Goods and Services Trade An overview of the size and composition of U.S. and world trade is useful to provide perspective for the large U.S. trade and current account deficits
Measuring Trade in Services
 WTO Advanced Trade Policy Course 17 February 2017 Measuring Trade in Services Barbara D Andrea Economic Research and Statistics Division WTO/OMC Why are statistics on international trade in services needed?
CANADA EUROPEAN UNION
 THE EUROPEAN UNION S PROFILE Economic Indicators Gross domestic product (GDP) at purchasing power parity (PPP): US$20.3 trillion (2016) GDP per capita at PPP: US$39,600 (2016) Population: 511.5 million
National accounts of the Netherlands
 National accounts of the Netherlands å 2014 National accounts of the Netherlands 2014 Explanation of symbols. Data not available * Provisional figure ** Revised provisional figure (but not definite) x
BALANCE OF PAYMENTS, INTERNATIONAL INVESTMENT POSITION, AND EXTERNAL DEBT OF THE RUSSIAN FEDERATION. Moscow
 2017 BALANCE OF PAYMENTS, INTERNATIONAL INVESTMENT POSITION, AND EXTERNAL DEBT OF THE RUSSIAN FEDERATION Moscow This publication has been prepared by the Statistics and Data Management Department of the
Foreign Investment Statistics
 2012-2013 Released Date: May 2015 Table of Contents Introduction....4 Key Points......5 Total Stock of Foreign Investment (FI) by Economic Activity....6 Foreign Direct Investment (FDI) by Economic Activity.......8
Supply and Use Tables for Macedonia. Prepared by: Lidija Kralevska Skopje, February 2016
 Supply and Use Tables for Macedonia Prepared by: Lidija Kralevska Skopje, February 2016 Contents Introduction Data Sources Compilation of the Supply and Use Tables Supply and Use Tables as an integral
III. TRADE-RELATED ASPECTS OF INVESTMENT POLICIES. (1) Foreign Direct Investment: General Policy Direction
 Foreign Direct Investment: General Policy Direction") Page 26 III. TRADE-RELATED ASPECTS OF INVESTMENT POLICIES (1) Foreign Direct Investment: General Policy Direction 1. Singapore's rapid economic growth has been to a large extent due to massive foreign
Page 26 III. TRADE-RELATED ASPECTS OF INVESTMENT POLICIES (1) Foreign Direct Investment: General Policy Direction 1. Singapore's rapid economic growth has been to a large extent due to massive foreign
If you have any queries regarding the above, please feel free to contact our Client Services Group:
 Dear Valued Clients, RE: Updates to Straight2Bank Purpose of Payment Code (i) Straight2Bank Purpose of Payment Following Bank Negara Malaysia s (BNM) revision to the policy document on External Sector
VI. THE EXTERNAL ECONOMY
 VI. THE EXTERNAL ECONOMY India s external sector has continued to register robust performance during 2006-07 so far. Merchandise exports have exhibited strong growth, notwithstanding some deceleration.
COMPILATION OF R-RETURNS - REPORTING UNDER FETERS
 COMPILATION OF R-RETURNS - REPORTING UNDER FETERS A.P. (DIR SERIES 2011-12) CIRCULAR NO. 84, DATED 29-2-2012 Attention of Authorised Dealer (Category I) banks is invited to A.P. (DIR Series) Circular No.77
If you have any queries regarding the changes, please feel free to contact our Client Services Group:
 Dear Valued Clients, RE: Updates to Straight2Bank Purpose of Payment. In line with the recent change and revision of the purpose code list, the updated list of Purpose of Payment codes will be made available
GROSS DOMESTIC PRODUCT, THIRD QUARTER OF 2018 (PRELIMINARY DATA)
") GROSS DOMESTIC PRODUCT, THIRD QUARTER OF 2018 (PRELIMINARY DATA) In the third quarter of 2018 Gross Domestic Product (GDP) 1 at current prices amounts to 29 822 million BGN. In Euro terms GDP is 15 248
GROSS DOMESTIC PRODUCT, THIRD QUARTER OF 2018 (PRELIMINARY DATA) In the third quarter of 2018 Gross Domestic Product (GDP) 1 at current prices amounts to 29 822 million BGN. In Euro terms GDP is 15 248
Solomon Islands. Key Indicators for Asia and the Pacific 2018
 1 POPULATION Total population a ( 000) 418.6 428.5 438.5 448.8 459.4 470.1 481.2 492.5 504.0 515.9 528.0 540.4 553.1 566.0 579.3 592.9 606.8 620.8 Population density (persons/km 2 ) 14 14 14 15 15 15 16
India. Key Indicators for Asia and the Pacific Item
 1 POPULATION a Total population as of 1 October (million) 1,019 1,040 1,056 1,072 1,089 1,106 1,122 1,138 1,154 1,170 1,186 1,220 1,235 1,251 1,267 1,283 1,299 1,316 Population density (persons/km 2 )
GROSS DOMESTIC PRODUCT, SECOND QUARTER OF 2017 (PRELIMINARY DATA)
") GROSS DOMESTIC PRODUCT, SECOND QUARTER OF 2017 (PRELIMINARY DATA) In the second quarter of 2017 Gross Domestic Product (GDP) 1 at current prices amounts to 24 149 million BGN. In Euro terms GDP is 12 347
GROSS DOMESTIC PRODUCT, SECOND QUARTER OF 2017 (PRELIMINARY DATA) In the second quarter of 2017 Gross Domestic Product (GDP) 1 at current prices amounts to 24 149 million BGN. In Euro terms GDP is 12 347
CANADA GERMANY GERMANY S PROFILE NOTES. Dylan Gowans
 GERMANY S PROFILE Economic Indicators Gross domestic product (GDP) at purchasing power parity (PPP): US$4.0 trillion (2016) GDP per capita at PPP: US$48,700 (2016) Population: 82.7 million (2016) International
A2 CUM OUTWARD REMITTANCE APPLICATION
 For Official Use only Track No. SOL ID AD CODE Rate by Client Rate by ICICI Bank Deal ID Rate Application for Outward Remittance I. Details of the Applicant (Remitter) Name of the Applicant Address of
Request for Outward Remittance from NRO account
 FOR BRANCH USE: Branch Code: Receipt Date: / / Action Taken on: / / Signature Request for Outward Remittance from NRO account NRI-11.2 I / We request you to debit my / our
GROSS DOMESTIC PRODUCT, FIRST QUARTER OF 2017 (PRELIMINARY DATA)
") GROSS DOMESTIC PRODUCT, FIRST QUARTER OF 2017 (PRELIMINARY DATA) In the first quarter of 2017 GDP at current prices amounts to 20 066 million BGN. In Euro terms GDP is 10 260 million Euro or 1 445 euro
GROSS DOMESTIC PRODUCT, FIRST QUARTER OF 2017 (PRELIMINARY DATA) In the first quarter of 2017 GDP at current prices amounts to 20 066 million BGN. In Euro terms GDP is 10 260 million Euro or 1 445 euro
THE BUREAU of Economic Analysis (BEA) takes a
 takes a") 18 October 21 U.S. International Services Cross-Border Trade in 29 and Services Supplied Through Affiliates in 28 By Jennifer Koncz-Bruner and Anne Flatness THE BUREAU of Economic Analysis (BEA) takes
18 October 21 U.S. International Services Cross-Border Trade in 29 and Services Supplied Through Affiliates in 28 By Jennifer Koncz-Bruner and Anne Flatness THE BUREAU of Economic Analysis (BEA) takes
Ayaz Ahmed and Henna Ahsan
 Ayaz Ahmed and Henna Ahsan Services sector is the largest and fastest growing sector in the world economy, accounting largest share in total output and employment in most developed countries. The share
Regional seminar on international trade statistics for Arab countries June, Amman, Jordan Report of the meeting
 Regional seminar on international trade statistics for Arab countries 12-14 June, Amman, Jordan Report of the meeting 1. The opening session of the meeting was chaired by Mrs Maysaa Mohammed, the acting
Second estimate for the first quarter of 2010 EU27 current account deficit 34.8 bn euro 10.8 bn euro surplus on trade in services
 109/2010-22 July 2010 Second estimate for the first quarter of 2010 EU27 current account deficit 34.8 bn euro 10.8 bn euro surplus on trade in According to the latest revisions 1, the EU27 2 external current
Information Report. Annual Survey Finances of Enterprises. Version 2017
 Information Report Annual Survey Finances of Enterprises Version 2017 Index 1. Significant points of interest 4 1.1 Consolidated annual statement of accounts 4 1.2 Take-over or becoming independent during
Ronald Jansen Chief of the Trade Statistics Branch United Nations Statistics Division / DESA
 Ronald Jansen Chief of the Trade Statistics Branch United Nations Statistics Division / DESA E-mail: Jansen1@un.org 1 Part I General Frameworks Conceptual Framework Modes of supply Resident-nonresident
APPENDIX 2 TO ANNEX VIII ICELAND SCHEDULE OF SPECIFIC COMMITMENTS
 APPENDIX 2 TO ANNEX VIII ICELAND SCHEDULE OF SPECIFIC COMMITMENTS I. HORIZONTAL COMMITMENTS ALL SECTORS INCLUDED IN THIS SCHEDULE 3) All foreign investment and currency transfers must be reported to the
GROSS DOMESTIC PRODUCT FOR THE THIRD QUARTER OF 2013
 GROSS DOMESTIC PRODUCT FOR THE THIRD QUARTER OF 2013 In the third quarter of 2013 GDP at current prices amounts to 21 590 million BGN. In Euro terms GDP is 11 039 million euro or 1 519 euro per person.
S U M M A R Y. Table 1(a) : Monthly Import of Goods & Services Items
 : Monthly Import of Goods & Services Items") VI S U M M A R Y Table 1(a) : Monthly Import of Goods & Items (Million US$) August 2012 2011 I. Import Payments (Banks) 3,169 3,610 II. Freight & Insurance 190 217 III. Other Import unaccounted by Banks
VI S U M M A R Y Table 1(a) : Monthly Import of Goods & Items (Million US$) August 2012 2011 I. Import Payments (Banks) 3,169 3,610 II. Freight & Insurance 190 217 III. Other Import unaccounted by Banks
A. Definitions and sources of data
 Poland A. Definitions and sources of data Data on foreign direct investment (FDI) in Poland are reported by the National Bank of Poland (NBP), the Polish Agency for Foreign Investment (PAIZ) and the Central
Request for Outward Remittance from NRO account
 FOR BRANCH USE: Branch Code: Receipt Date: / / Action Taken on: / / Signature Request for Outward Remittance from NRO account NRI-11.2 I / We request you to debit my / our
Gross domestic product of Montenegro in 2016
 MONTENEGRO STATISTICAL OFFICE R E L E A S E No:174 Podgorica 29 September 2017 When using the data pleaase name the source Gross domestic product of Montenegro in 2016 Real growth rate of gross domestic
GROSS DOMESTIC PRODUCT, FIRST QUARTER OF 2018 (PRELIMINARY DATA)
") GROSS DOMESTIC PRODUCT, FIRST QUARTER OF 2018 (PRELIMINARY DATA) In the first quarter of 2018 Gross Domestic Product (GDP) 1 at current prices amounts to 21 479 million BGN. In Euro terms GDP is 10 982
GROSS DOMESTIC PRODUCT, FIRST QUARTER OF 2018 (PRELIMINARY DATA) In the first quarter of 2018 Gross Domestic Product (GDP) 1 at current prices amounts to 21 479 million BGN. In Euro terms GDP is 10 982
GROSS DOMESTIC PRODUCT FOR THE FIRST QUARTER OF 2014 (PRELIMINARY DATA)
") GROSS DOMESTIC PRODUCT FOR THE FIRST QUARTER OF 2014 (PRELIMINARY DATA) In the first quarter of 2014 GDP at current prices amounts to 16 097 Million Levs. In Euro terms GDP is 8 230 Million Euro or 1 136
GROSS DOMESTIC PRODUCT FOR THE FIRST QUARTER OF 2014 (PRELIMINARY DATA) In the first quarter of 2014 GDP at current prices amounts to 16 097 Million Levs. In Euro terms GDP is 8 230 Million Euro or 1 136
PRESS RELEASE. IMPORT PRICE INDEX IN INDUSTRY: May 2017 IMPORT PRICE INDEX IN INDUSTRY: May 2017, y-o-y increase of 4.0%
 HELLENIC REPUBLIC HELLENIC STATISTICAL AUTHORITY Piraeus, 14 July 2017 PRESS RELEASE IMPORT PRICE INDEX IN INDUSTRY: May 2017 IMPORT PRICE INDEX IN INDUSTRY: May 2017, y-o-y increase of 4.0% The Overall
Fiji. Key Indicators for Asia and the Pacific Item
 1 POPULATION Total population as of 1 July ( 000) 802.0 805.0 810.0 816.0 821.0 827.0 830.0 834.5 841.4 845.5 850.7 854.3 858.0 862.1 865.7 869.5 873.2 884.9 Population density (persons/km 2 ) 44 44 44
THE UNION OF MYANMAR THE STATE PEACE AND DEVELOPMENT COUNCIL THE DAWEI SPECIAL ECONOMIC ZONE LAW
 THE UNION OF MYANMAR THE STATE PEACE AND DEVELOPMENT COUNCIL THE DAWEI SPECIAL ECONOMIC ZONE LAW JANUARY, 2011 The Dawei Special Economic Zone Law CONTENTS No. Particulars Page 1. Chapter I Title and Definition
METHODOLOGY OF COMPILING QUARTERLY GDP ESTIMATES
 METHODOLOGY OF COMPILING QUARTERLY GDP ESTIMATES The Central Statistical Organisation (CSO) introduced the quarterly estimates of Gross Domestic Product (GDP) on 30.6.1999. Quarterly Releases include GDP
GROSS DOMESTIC PRODUCT, THIRD QUARTER OF 2015 (PRELIMINARY DATA)
") GROSS DOMESTC PRODUCT, THRD QUARTER OF 2015 (PRELMNARY DATA) GDP at current prices is 23 490 million BGN in the third quarter of 2015. n Euro terms GDP is 12 010 million Euro or 1 671 euro per capita.
GROSS DOMESTC PRODUCT, THRD QUARTER OF 2015 (PRELMNARY DATA) GDP at current prices is 23 490 million BGN in the third quarter of 2015. n Euro terms GDP is 12 010 million Euro or 1 671 euro per capita.
CHAPTER 4 BALANCE OF PAYMENTS
 CHAPTER 4 BALANCE OF PAYMENTS 4.1. Balance of Payments (BoP) statistics systematically summaries the economic transactions of an economy with the rest of the World for a specific period. The Reserve Bank
GROSS DOMESTIC PRODUCT, SECOND QUARTER OF 2014 (PRELIMINARY DATA)
") GROSS DOMESTIC PRODUCT, SECOND QUARTER OF 2014 (PRELIMINARY DATA) In the second quarter of 2014 GDP at current prices amounts to 19 517 million BGN. In Euro terms GDP is 9 979 million Euro or 1 379 euro
GROSS DOMESTIC PRODUCT, SECOND QUARTER OF 2014 (PRELIMINARY DATA) In the second quarter of 2014 GDP at current prices amounts to 19 517 million BGN. In Euro terms GDP is 9 979 million Euro or 1 379 euro
Chapter-2. Trends in India s Foreign Trade
 Chapter-2 India s Trade Performance India s merchandise exports reached a level of US $ 251.14 billion during 2010-11 registering a growth of 40.49 percent as compared to a negative growth of 3.53 percent
In 2014, Services exports reach 52,656.5 million euros and imports reach 35,415.6
 21 October 2015 International Trade in Services Survey (ITSS) In 2014, Services exports reach 52,656.5 million euros and imports reach 35,415.6 45.7% of imports are generated by companies which belong
DG Trade Statistical Guide Trade
 DG Trade Statistical Guide 2016 Trade EUROPEAN COMMISSION DG Trade Chief Economist and Trade Analysis Statistics Sector E-mail: trade-statistics@ec.europa.eu EUROPEAN COMMISSION DG Trade Statistical Guide
Scotland's Exports
 SPICe Briefing Pàipear-ullachaidh SPICe Scotland's Exports - 2016 Andrew Aiton This briefing analyses the Export Statistics Scotland 2016 release from the Scottish Government, providing a breakdown of
June 27, 2013 Developments in India s Balance of Payments during the Fourth Quarter (January- March 2013) of
 of") स क शन PRESS RELEASE स च र वभ ग, क य क य लय, एस.ब.एस.म ग, म बई 400001 DEPARTMENT OF COMMUNICATION, Central Office, S.B.S.Marg, Mumbai 400001 फ न/Phone: 91 22 2266 0502 फ स/Fax: 91 22 2266 0358 भ रत य रज़व
स क शन PRESS RELEASE स च र वभ ग, क य क य लय, एस.ब.एस.म ग, म बई 400001 DEPARTMENT OF COMMUNICATION, Central Office, S.B.S.Marg, Mumbai 400001 फ न/Phone: 91 22 2266 0502 फ स/Fax: 91 22 2266 0358 भ रत य रज़व
GROSS DOMESTIC PRODUCT FOR THE THIRD QUARTER OF 2012
 GROSS DOMESTIC PRODUCT FOR THE THIRD QUARTER OF 2012 In the third quarter of 2012 GDP at current prices amounted to 21 734 Million Levs. In Euro terms GDP was 11 112 Million Euro or 1 522 Euro per person.