Financial Results for the First Half of the Fiscal Year Ending March 31, 2015
|
|
|
- Evangeline Brown
- 6 years ago
- Views:
Transcription


1 Financial Results for the First Half of the Fiscal Year Ending March 31, 2015 NOK CORPORATION (7240 / TSE1) November 2014 Disclaimer Any plans, targets, forecasts, strategies, policies and opinions relating to NOK CORPORATION or NOK Group companies or other information contained in these materials that are not historical facts constitute forward-looking statements. The content of such statements is based on the best information available to management at the time of publication. Actual performance may differ substantially from projections due to changes in a number of important factors implying risk and uncertainty with the potential to affect results, including economic conditions across operating regions, prices and foreign exchange rates. While every effort has been made to ensure the accuracy of the content of these materials, NOK provides no assurances to that effect. NOK assumes no liability whatsoever for harm related to any errors that may be caused to persons attending this presentation. NOK Corporation retains the copyright on these materials: unauthorized reproduction or duplication is prohibited. 2
2 Table of Contents Page 4 Financial Results for the First Half of the Fiscal Year Ending March 31, 2015 and Financial Forecasts for the Fiscal Year Ending March 31, 2015 Page 11 Page 20 Page 32 Page 44 Financial Results by Business Segment for the First Half of the Fiscal Year Ending March 31, 2015 Financial Forecasts by Business Segment for the Fiscal Year Ending March 31, 2015 Business Overview by Industry and by Region References 3 Financial Results for the First Half of the Fiscal Year Ending March 31, 2015 and Financial Forecasts for the Fiscal Year Ending March 31, 2015
 12,789 13,497 13,347 14,070 (Millions of units) 676 8,045 8,328 8,564 9,300 454 550 549 2,350 2,283 2,236 2,020 2,394 2,886 2,547 2,750 Apr-Sep")


3 The Market Trend Surrounding the NOK Group Motor Vehicle Unit Production Smartphone Worldwide Unit Shipments Domestic Export Overseas Production (Thousands of units) 12,789 13,497 13,347 14,070 (Millions of units) 676 8,045 8,328 8,564 9, ,350 2,283 2,236 2,020 2,394 2,886 2,547 2,750 Apr-Sep Oct-Mar Apr-Sep Oct-Mar (Forecast) Jan-Jun CY2013 Jul-Dec CY2013 Jan-Jun CY2014 Jul-Dec CY2014 Forecast) 5 Financial Highlight for the First Half of the Fiscal Year Ending March 31, 2015 NOK Business Overview Seal Business Backlash from the last minute surge in demand prior to the rise in consumption tax remained small, and sales to automobile manufactures were robust in Japan as well as in China and North America. Electronic Device Product Business Sales were strong for smartphones and tablet terminals. Roll Business Sales were robust in products for copiers in overseas markets despite a slump in replacement parts.
4 Financial Results for the First Half of the Fiscal Year Ending March 31, 2015 [vs. ] ( billion) [Net Sales] 40 [Income] Net Sales Operating Income Ordinary Income Net Income Operating Income Margin % 1 5.3% Average Exchange Rate $/Yen) Financial Forecasts for the Fiscal Year Ending March 31, 2015 [vs. ] ( billion) [Net Sales] 80 [Income] Net Sales Operating Income Ordinary Income Net Income Operating Income Margin % 2 6.4% Full Year Full Year (Revised Forcasts) Average Exchange Rate $/Yen)

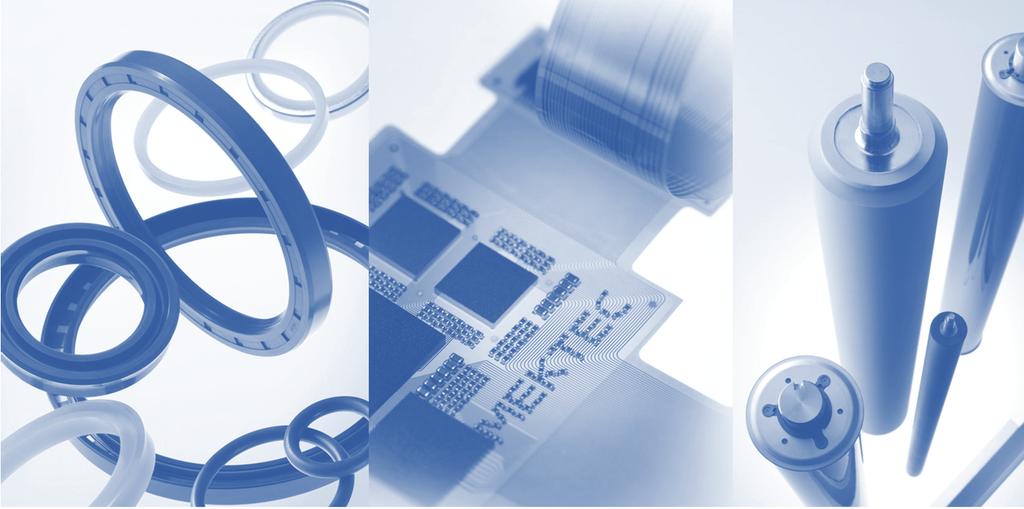
5 Interim Dividend for the Fiscal Year Ending March 31, 2015 Interim Dividend Dividend Payout Ratio 15.0 Interim Dividend Term-end Dividend TBD 15 TBD Interim Dividend Dividend Payout Ratio FY2010 FY2011 FY2012 The term-end dividend for has not been fixed. 9 NOK Group Topics for the First Half of the Fiscal Year Ending March 31, 2015 Electronic Device Product Business Completed new administration building of Ushiku Plant, NIPPON MEKTRON, LTD. Objective To consolidate the technology and production divisions, and strengthen coordination To improve operation efficiency Overview Four stories high Total Floor Area: 4,800 Number of Workers: 300
6 Financial Results by Business Segment for the First Half of the Fiscal Year Ending March 31, 2015 Financial Results by Business Segment for the First Half of the Fiscal Year Ending March 31, 2015 ( billion) Seal Business Electronic Device Product Business Roll Business Others Total Reference Actual Revised Forecast 2H Full Year 2H Full Year Amount Ratio Net Sales % Operating Income % Net Sales % Operating Income Net Sales % Operating Income % Net Sales % Operating Income % Net Sales % Operating Income YoY Change %
7 Seal Business: Financial Results [vs. ] billion) [Net sales] Capital Investment Depreciation No. of Employees [Operating Income] Net Sales Operating Income 3 Operating Income Margin % 11.0 bn 9.4 bn 19, % 9.2 bn 6.7 bn 19, Results Net Sales bn ( 4.4 bn YoY) Vehicle production in Japan was robust. Demand was robust in China and North America. Demand was also robust in sales to manufacturers of general industrial machinery in Japan and overseas markets. Demand dropped in Thailand. Operating Income 15.7 bn ( 2.1 bn YoY ) Operating income increased on the back of increased sales. The change in depreciation method had a positive impact. Personnel and other expenses increased. Seal Business: Changes in Operating Income [vs. ] ( billion) 13.6 Impact of Net Sales 1.3 Raw Materials Cost 2.1 bn Cost of Sales Reduction 0.2 Personnel and SG&A Expenses Depreciation 0.1 Change in Depreciation Method Impact of FX Operating Income Operating Income
8 Electronic Device Product Business: Financial Results [vs. ] billion) [Net Sales] [Operating Income] Net Sales Operating Income 2 Operating Income Margin % % Results Net Sales bn ( 16.5 bn YoY) Sales were strong in new models for smartphones. Sales were also strong for hard disk drives, tablet terminals and automobiles. Sales were sluggish for digital cameras. Operating Income 8.2 bn ( 7.6 bn YoY) Operating income increased on the back of increased sales of smartphones. Improvement in the yield rate and reduction in cost of sales contributed positively. Personnel expenses increased in China and other countries. Capital Investment 9.1 bn 8.9 bn Depreciation 8.0 bn 8.0 bn No. of Employees 25,007 22,402 Electronic Device Product Business: Changes in Operating Income [vs. ] ( billion) Impact of Net Sales Yield Rate Cost of Sales Reduction 3.5 Personnel and SG&A Expenses Depreciation Change in Depreciation Method Impact of FX bn 0.5 Operating Income Operating Income
9 Roll Business: Financial Results [vs. ] billion) [Net Sales] [Operating Income] Net Sales Operating Income 4.0 Operating Income Margin % % Results Net Sales 14.8 bn ( 0 bn YoY) Sales increased mainly for color printers and copiers in Europe and the U.S. markets. Order intake slumped in copier replacement parts due to a rise in durability. Operating Income 1.2 bn ( 0.2 bn YoY) Profit structure was strengthened on the back of promoting reduction in cost of sales. The change in depreciation method had a positive impact. Personnel and other expenses increased. Capital Investment 0.1 bn 0.5 bn Depreciation 0.5 bn 0.5 bn No. of Employees 2,477 2,825 Roll Business: Changes in Operating Income [vs. ] ( billion) Impact of Net Sales Raw Materials Cost Cost of Sales Reduction Personnel and SG&A Expenses Depreciation Change in Depreciation Method Impact of FX bn Operating Income Operating Income
10 Financial Forecasts by Business Segment for the Fiscal Year Ending March 31, 2015
11 Unification of Accounting Period and Change in Depreciation Method Jan Feb Mar Apr May Jun Jul Aug Sep Oct Nov Dec Jan Feb Mar Apr Before Domestic Overseas 1Q 2Q 3Q 4Q 1Q 2Q 3Q 4Q After Domestic Overseas 1Q 2Q 3Q 4Q 1Q 2Q 3Q 4Q Unification of Accounting Period Accompanying NOK s growth in overseas business, it has become necessary and is deemed effective from a management perspective, to manage strategies based on a unified accounting period (Apr-Mar) rather than by consolidating two different accounting periods (Apr- Mar and Jan-Dec). Therefore, NOK has changed the accounting period of its overseas subsidiaries (originally Jan-Dec) to Apr-Mar to conform to that of NOK and its domestic subsidiaries. Change in Depreciation Method From the fiscal year ending March 31, 2015, NOK and its domestic subsidiaries have changed their depreciation method of property, plant and equipment to a straight-line method to conform to overseas subsidiaries. Due to the shift from the conventional fixed-rate method, operating income is expected to increase by 6.3 billion. * results in this presentation are calculated based on the unified accounting period described above, for reference purposes. Revised Financial Forecasts for the Second Half and Full Year of the Fiscal Year Ending March 31, 2015 ( billion) Full Year 2H Full Year Changes vs. Initial Forecasts Initial Forecasts Actual Revised Forecasts Amount Ratio Net Sales % Operating Income % Ordinary Income % Net Income % Capital Investment Depreciation Average Exchange Rate* ($/Yen) No. of Employees 45,826 44,704 45,385 45, * Positive with weakening of the yen, negative with appreciation of the yen
12 Revised Financial Forecasts for the Fiscal Year Ending March 31, 2015 [vs. Reference] ( billion) YoY Changes Reference Actual Revised Forecasts 2H Full Year 2H Full Year 2H Full Year Amount Ratio Amount Ratio Amount Ratio Net Sales % % % Operating Income % % % Ordinary Income % % % Net Income % % % Capital Investment Depreciation Average Exchange Rate* ($/Yen) No. of Employees 47,286 44,272 44,272 44,704 45,385 45,385 2,582 1,113 1,113 * Positive with weakening of the yen, negative with appreciation of the yen Revised Financial Forecasts by Business Segment for the Fiscal Year Ending March 31, 2015 [vs. Initial Forecasts] ( billion) Seal Business Electronic Device Product Business Roll Business Others Total Changes Full Year 2H Full Year vs. Initial Forecasts Initial Actual Revised Forecasts Amount Ratio Forecasts Net Sales % Operating Income % Net Sales % Operating Income % Net Sales % Operating Income % Net Sales % Operating Income % Net Sales % Operating Income %
13 Seal Business: Financial Forecasts [vs. ] billion) [Net Sales] [Operating Net Sales Operating Income Margin Income] Operating Income () Operating Income (2H) % Full Year % Full Year (Revised Forecasts) Forecasts Net Sales bn ( 7.7 bn YoY) Sales are expected to increase on the back of the rise in Japanese vehicle production. Sales are expected to recover for manufacturers of general industrial machinery. Operating Income 33.0 bn ( 4.0 bn YoY) Operating income is expected to increase on the back of increasing sales. Positive impact is expected from the change in depreciation method (approx. 5.3 bn). Personnel expenses are expected to increase in China, Asia and other countries. Capital Investment 21.9 bn 22.3 bn Depreciation 19.5 bn 14.5 bn No. of Employees 19,086 19,361 Seal Business: Changes in Operating Income [vs. ] ( billion) Impact of Net Sales 1.8 Raw Materials Cost 0.3 Cost of Sales Reduction 0.6 Personnel and SG&A Expenses Depreciation 4.0 bn Change in Depreciation Method 5.3 Impact of FX Full Year Operating Income Full Year Operating Income (Revised Forecast)
14 Electronic Device Product Business: Financial Forecasts [vs. ] billion) [Net Sales] [Operating Net Sales Operating Income Margin Income] Operating Income () Operating Income (2H) Forecasts Net Sales bn ( 21.9 bn YoY) Sales are expected to increase for smartphones and automobiles Sales are also expected to be robust for hard disk drives and tablet terminals. Sales are expected to decrease for digital cameras. 10 Capital Investment Depreciation No. of Employees % Full Year 18.4 bn 16.7 bn 22, % Full Year (Revised Forecast) 14.1 bn 15.8 bn 22,966 1 Operating Income 17.2 bn ( 10.2 bn YoY) Operating income is expected to increase on the back of increasing sales. Positive impact is expected from promotion of increase in yield rate and reduction in cost of sales. Personnel expenses are expected to increase in China. Electronic Device Product Business: Changes in Operating Income [vs. ] ( billion) Impact of Net Sales 7.0 Yield Rate 2.7 Cost of Sales Reduction 7.5 Personnel and SG&A Expenses 7.5 Depreciation 0.4 Change in Depreciation Method Impact of FX bn Full Year Operating Income Full Year Operating Income (Revised Forecast)
15 Roll Business: : Financial Forecasts [vs. ] billion) [Net Sales] 4 3 [Operating Net Sales Operating Income Margin Income] Operating Income () Operating Income (2H) Forecasts Net Sales 28.5 bn ( 1.0 bn YoY) Demand is expected to drop in products for replacement parts % Full Year % Full Year (Revised Forecasts) Operating Income 1.8 bn ( 0.4 bn YoY) Operating income is expected to decrease on the back of decreasing sales. Personnel expenses is expected to increase in China and other countries. Positive impact is expected from promotion of reduction in cost of sales. Capital Investment 0.2 bn 1.8 bn Depreciation 1.1 bn 1.1 bn No. of Employees 2,694 2,904 Roll Business: Changes in Operating Income [vs. ] ( billion) Impact of Net Sales Raw Materials Cost Cost of Sales Reduction Personnel and SG&A Expenses Depreciation Change in Depreciation Method Impact of FX bn Full Year Operating Income Full Year Operating Income (Revised Forecast)
16 Business Overview by Industry and by Region
17 Consolidated Net Sales Trend by Industry (by Quarter) Net Sales by Industry ( billion) Automotive Industry (AI) Electronic Industry (EI) General Industry (GI) Q 2Q 3Q 4Q 1Q 2Q Consolidated Net Sales Trend by Industry (by Half Year) Net Sales by Industry ( billion) Automotive Industry (AI) Electronic Industry (EI) General Industry (GI) H 2H (Forecast)
18 Consolidated Net Sales Trend by Region (by Quarter) Net Sales by Region ( billion) Japan China Other Asia Other Q 2Q 3Q 4Q 1Q 2Q Consolidated Net Sales Trend by Region (by Half Year) Net Sales by Region ( billion) Japan China Other Asia Other H 2H (Forecast)
19 Net Sales Trend for Seal Business by Region (by Quarter) Seal Business: Net Sales by Region ( billion) Japan China Other Asia Other Q 2Q 3Q 4Q 1Q 2Q Net Sales Trend for Seal Business by Region (by Half Year) Seal Business: Net Sales by Region ( billion) Japan China Other Asia Other H 2H (Forecast)
20 Net Sales Trend for Electronic Device Product Business by Region (by Quarter) Electronic Device Product Business: Net Sales by Region ( billion) Japan China Other Asia Other Q Q 3Q 4Q 1Q 2Q Net Sales Trend for Electronic Device Product Business by Region (by Half Year) Electronic Device Product Business: Net Sales by Region ( billion) Japan China Other Asia Other H 2H (Forecast)
21 Trend of Capital Investment by Region (by Half Year) Capital Investment ( billion) Japan Asia Europe / the U.S FY2012 2H FY H 8.1 The blue graph represents results based on the conventional accounting period (consolidation of two different accounting periods); the green graph represents forecasts based on the current unified accounting period. Capital investment includes the acquisition of intangible assets H (Forecast) Trend of Depreciation by Region (by Half Year) Depreciation ( billion) Japan Asia Europe / the U.S FY H FY H The blue graph represents results based on the conventional accounting period (consolidation of two different accounting periods); the green graph represents forecasts based on the current unified accounting period. From, deprecation of property, plant and equipment is calculated based on the straight-line method. 2H (Forecast)
22 References
 1995 Subsidiary Wuxi NOK-Freudenberg Oilseal Co., Ltd. established in China 1996 Subsidiary named P.")
23 Corporate History 1939 Edogawa Seiki Co., Ltd. founded 1941 Japan Bearing Production Co., Ltd. founded in Kobe Tokyo Oil Seal Industry Co., Ltd. merges with Nippon Yushi Industry Co., Ltd., and the company name changed to Nippon Oil Seal Industry Co., Ltd Subsidiary NOK KLUEBER CO., LTD. established 1978 Equity stake taken in Pyung Hwa Oil Seal Industry Co., Ltd. (South Korea) 1995 Subsidiary Wuxi NOK-Freudenberg Oilseal Co., Ltd. established in China 1996 Subsidiary named P.T. NOK Indonesia established in Indonesia; subsidiary named NOK Asia Co., Ptd. Ltd. established in Singapore 2013 Neopt Corporation s business transferred to Eagle Industry Co., Ltd ( billion) Capital participation agreement concluded with Carl Freudenberg KG (Germany) Listed on the Tokyo Stock Exchanges 1968 NOK-USA, Inc. established (changes its name to NOK INC. in 1980) 1969 Subsidiary NIPPON MEKTRON, LTD. established 12.5% 12.0% % % % 7.6% % 5.6% Company name changed from Nippon Oil Seal Industry Co., Ltd. to NOK CORPORATION 1988 Subsidiary named THAI NOK CO., LTD. established in Thailand 1989 Subsidiary NOK EG&G Optoelectronics Co., Ltd. established 1989 FREUDENBERG-NOK G.P. established as an affiliate company in the U.S. Net Sales Trend Net Sales Operating Income Operating Margin 1.6% % % 2000 SIGMA FREUDENBERG NOK PVT. LTD. established as an affiliate company in India 2002 Subsidiary named UNIMATEC CO., LTD. established 2004 Subsidiary named VIETNAM NOK CO., LTD. established in Vietnam 2007 Subsidiary named SYNZTEC CO., LTD. 6.1% % 5.5% % FY2000 FY2001 FY2002 FY2003 FY2004 FY2005 FY2006 FY2007 FY2008 FY2009 FY2010 FY2011 FY2012 (Forecast) % % 12.0% 1% 8.0% 6.0% 4.0% 2.0% % Global Deployment


24 NOK Group Strengths NOK Group companies make up a Group of Compound Technology Manufacturers like one firm connected to each division, an enterprise group sharing core technologies. Each company boasts its individual strengths while sharing a common vision, and conducts business operations to handle any and all client requirements. NOK s R&D The Shonan Development Center aggregates all of NOK s advanced technologies, and was established with the aim of accelerating the development process. This development system removes barriers between each division, and provides a self contained comprehensive approach from product design through shipment inspections. The center actively promotes merging R&D and production technologies, churning out products with unique cutting edge technology that can t be imitated by others. POINT NOK s Shonan Development Center was opened in 2005 as a think tank concentrating all the company s advanced technologies, striving to be global No. 1 technology creator. The Center has functional abilities in materials technologies, evaluation analysis technologies and production technologies, making possible self contained operations execution. NOK responds to the needs of society, and will further pursue R&D in order to continue supplying products that contribute to daily living convenience and the environment.


 Flexible printed circuits (FPC)")


25 NOK Major Products: Oil Seals Oil seals are a functional part to seal oil. For moving parts of machinery, revolving and vertical up and down motion etc, oil seals prevent leakage of lubricant oils, water, chemical solutions, gas etc, and also prevent outside particulates from getting in. They are indispensable parts for a wide range of machinery types including automobiles, ships, planes, air conditioners, washing machines, water works etc. (Example of Use) POINT NOK s history is the history of oil seals. The road to becoming Japan s No. 1 oil seal maker began in 1960, when the company concluded a technology partnership agreement with Carl Freudenberg KG of the former West Germany. After that the company built a production plant in the US when there was still only one Japanese auto manufacturer located there, eventually supplying oil seals to the US Big 3. Today the company boasts top shares domestically of 70% and globally 50%, recognized for its reliability and actual performance results. NOK Major Products: Flexible Printed Circuits (FPC) Flexible printed circuits (FPC) are flexible circuit boards based on films. Thanks to the functionality of flexible printed circuit boards, compact cellular phones became a reality. Applications are not limited to cell phones, but also cover many areas including digital cameras and notebook PCs. (Example of Use) This is electronics business of NOK Group company NIPPON MEKTRON, LTD. These thin and light circuit boards are used in smart phones. FPCs which have the characteristics of being thin, lightweight and flexible, are expected to see further increased functionality in the future. NOK has the No. 1 domestic and global shares.
 12,789 12,603 12,151 7,695 7,509 8,045")
26 NOK Products in Automobiles 㟷 䛻ኚ 㓄 ኚ Ꮠᣑ Market Trends by Sector: Motor Vehicle Unit Production (by Half Year, Fiscal Year) Motor Vehicle Unit Production (Thousands of units) Domestic Export 15,000 9,000 14,070 13,497 13,347 8,328 8,564 9,300 2,350 2,283 2,236 2,020 2,355 2,394 2,886 2,547 2,750 Oct-Mar FY2012 Apr-Sep Oct-Mar Apr-Sep Oct-Mar (Forecast) 12,789 12,603 12,151 7,695 7,509 8,045 2,371 2,288 2,538 Apr-Sep FY ,000 Overseas Production 6,000 3,000 0 From, the value for overseas production has been modified to include completed vehicle units produced overseas in addition to knock-down units. Source: Estimates by NOK CORPORATION
 60,000 40,000 20,000 0 Apr-Sep FY2012 Oct-Mar FY2012 Apr-Sep Oct-Mar Source: Estimates by NOK")
27 NOK Products in General Industrial Machinery Market Trends by Sector: Construction Machinery Domestic Unit Production (by Half Year, Fiscal Year) Construction Machinery Domestic Unit Production ق Units ك 120, ,000 80,000 74,641 66,627 76,346 81,282 75,504 77,500 Apr-Sep Oct-Mar (Forecast) 60,000 40,000 20,000 0 Apr-Sep FY2012 Oct-Mar FY2012 Apr-Sep Oct-Mar Source: Estimates by NOK CORPORATION
 made with advanced technology is indispensable for the miniaturization and high functionality of IT electronic devices.")
28 NOK Products in IT Electronic Devices Boasting the top global share of flexible circuits (FPC), these are used in a wide range of advanced electronic devices. Also, multilayer flexible boards (Flex-Boards) made with advanced technology is indispensable for the miniaturization and high functionality of IT electronic devices. They are also widely used in waterproof electronic devices. FPC for Smartphones Flex-Boards for Digital Cameras FPC for Tablet PC FPC for Hard Disk Drives Market Trends by Sector: Mobile Phone Worldwide Unit Shipments (by Half Year, Calendar Year) Mobile Phone Worldwide Unit Shipments (Millions of units) 1,500 Smartphones Other 1, , Jan-Jun CY Jul-Dec CY2012 Jan-Jun CY Jul-Dec CY2013 Jan-Jun CY Jul-Dec CY2014 (Forecast) Source: Estimates by NOK CORPORATION
29 Market Trends by Sector: Hard Disk Drives Worldwide Unit Production (by Half Year, Calendar Year) (Million of units) 500 Hard Disk Drives Worldwide Unit Production Jan-Jun CY2012 Jul-Dec CY2012 Jan-Jun CY2013 Jul-Dec CY2013 Jan-Jun CY2014 Jul-Dec CY2014 (Forecast) Source: Estimates by NOK CORPORATION Market Trends by Sector: Digital Camera Domestic Unit Shipments (by Half Year, Calendar Year) Digital Camera Domestic Unit Shipments (Million of units) 100 Single-Lens Reflex-type Compact-type Jan-Jun CY2012 Jul-Dec CY2012 Jan-Jun CY Jul-Dec CY Jan-Jun CY2014 Jul-Dec CY2014 (Forecast) Source: Estimates by NOK CORPORATION
30 Market Trends by Sector: Tablet PC Worldwide Unit Shipments (by Half Year, Calendar Year) (Millions of units) Tablet PC Worldwide Unit Shipments Jan-Jun CY2012 Jul-Dec CY2012 Jan-Jun CY2013 Jul-Dec CY2013 Jan-Jun CY2014 Jul-Dec CY2014 (Forecast) Source: Estimates by NOK CORPORATION
31 Contact: NOK CORPORATION CORPORATE PLANNING OFFICE CORPORATE PLANNING DEPT. CORPORATE COMMUNICATION SECT. Phone: URL:
32 Segment Information: Fiscal 2014 Forecasts Nov 11, 2014 NOK Corporation (Millions of yen) Segment Fiscal (Results) Fiscal 2H, Results & Annual Forecasts Year-on-Year Year-on-Year Year-on-Year Fiscal % Change Fiscal 2H % Change Change Change Change % Change External sales 141, , , ,315 4, % 150,100 3, % 296,416 7, % Inter-segment sales 1,858 1,353 3,211 1, , , Net Sales 143, , , ,809 3, ,315 3, ,124 7,187 Seal Operating Income 13,581 15,386 28,967 15,725 2, % 17,274 1, % 33,000 4, % Business Profit Margin 9.4% 10.4% 9.9% 10.6% 1.2pt 11.4% 1.0pt 11.0% 1.1pt Capital Investment 10,965 10,949 21,914 9,240 1,725 13,060 2,111 22, Depreciation 9,419 10,127 19,546 6,676 2,743 7,824 2,303 14,500 5,046 No. of Personnel 19,612 19,086 19,086 19, , , External sales 130, , , ,039 16, % 154,234 5, % 301,273 21, % Inter-segment sales Electronic Net Sales 130, , , ,043 16, ,234 5, ,277 21,883 Device Operating Income 512 6,472 6,984 8,152 7,640-9,000 2, % 17,152 10, % Product Profit Margin 0.4% 4.3% 2.5% 5.5% 5.2pt 5.8% 1.5pt 5.7% 3.2pt Business Capital Investment 9,071 9,288 18,359 8, ,229 4,059 14,100 4,259 Depreciation 8,004 8,648 16,652 7, , , No. of Personnel 25,007 22,345 22,345 22, , , External sales 14,799 14,708 29,507 14, % 13,667 1, % 28,488 1, % Inter-segment sales Net Sales 14,799 14,708 29,507 14, ,667 1,041 28,488 1,019 Roll Operating Income 1,053 1,164 2,217 1, % % 1, % Business Profit Margin 7.1% 7.8% 7.4% 8.3% 1.2pt 4.0% 3.7pt 6.3% 1.2pt Capital Investment ,327 1,152 1,800 1,568 Depreciation , , No. of Personnel 2,477 2,694 2,694 2, , , External sales 5,564 5,800 11,364 5, % 5, % 11, % Inter-segment sales Net Sales 5,864 6,100 11,964 5, , , Other Operating Income % % % Business Profit Margin 5.7% 7.1% 6.4% 7.2% 1.5pt 2.8% 4.3pt 5.0% 1.5pt Capital Investment Depreciation No. of Personnel Elimination of Inter-segment sales 2,158 1,653 3,811 1, , , External sales 292, , , ,951 21, % 324,000 7, % 638,000 29, % Inter-segment sales Net Sales 292, , , ,951 21, ,000 7, ,000 29,009 Consolidated Operating Income 15,481 23,466 38,947 25,549 10, % 27,000 3, % 52,500 13, % Profit Margin 5.3% 7.4% 6.4% 8.1% 2.9pt 8.3% 0.9pt 8.2% 1.8pt Capital Investment 20,114 20,501 40,615 18,688 1,426 19, ,400 2,215 Depreciation 17,992 19,439 37,431 15,220 2,772 16,280 3,159 31,500 5,931 No. of Personnel 47,286 44,272 44,272 44, ,385 1,113 45,385 1,113 Note: The above forecasts are based on currently available information. Actual performance may differ substantially from these forecasts due to various factors. :Year-on-Year change of No.of Personnel is calculated by comparing with a previous term. The actual performance for that was used in the Year-on-Year comparison for the outlook for FY 2014 is the performance that was re-composed at the Company (April to March for both domestic and overseas subsidiaries). Subjects of the re-composition: Net sales to external customers, inter-segment net sales, net sales, operating income :Consolidated forecasts of FY 2014 is handled a fraction.
Financial Results for the First Half of the Fiscal Year Ending March 31, 2017
 Second Quarter Financial Results for the First Half of the Fiscal Year Ending March 31, 2017 NOK CORPORATION (7240 / TSE1) November 9, 2016 Disclaimer Any plans, targets, forecasts, strategies, policies
Financial Results for the Fiscal Year Ended March 31, 2018
 Fiscal Year Financial Results for the Fiscal Year Ended March 31, 2018 NOK CORPORATION (7240 / TSE1) May 10, 2018 Disclaimer Any plans, targets, forecasts, strategies, policies and opinions relating to
NOK CORPORATION and Consolidated Subsidiaries Consolidated Financial Results for Fiscal Year Ended March 31, 2014 (Japanese GAAP)
") Member of Financial Accounting Standards Foundation NOK CORPORATION and Consolidated Subsidiaries Consolidated Financial Results for Fiscal Year Ended March 31, 2014 (Japanese GAAP) Date: May 9, 2014 Company
Member of Financial Accounting Standards Foundation NOK CORPORATION and Consolidated Subsidiaries Consolidated Financial Results for Fiscal Year Ended March 31, 2014 (Japanese GAAP) Date: May 9, 2014 Company
NOK CORPORATION and Consolidated Subsidiaries Consolidated Financial Results for Fiscal Year Ended March 31, 2013 (Japanese GAAP)
") Member of Financial Accounting Standards Foundation NOK CORPORATION and Consolidated Subsidiaries Consolidated Financial Results for Fiscal Year Ended March 31, 2013 (Japanese GAAP) Date: May 10, 2013
Member of Financial Accounting Standards Foundation NOK CORPORATION and Consolidated Subsidiaries Consolidated Financial Results for Fiscal Year Ended March 31, 2013 (Japanese GAAP) Date: May 10, 2013
Presentation on Business Results for the 1st-Half of Fiscal Year Ending March 31, 2019
 Presentation on Business Results for the 1st-Half of Fiscal Year Ending March 31, 2019 November 16, 2018 This presentation contains forward-looking statements relating to expected future performance as
NOK CORPORATION and Consolidated Subsidiaries Consolidated Financial Results for Fiscal Year Ended March 31, 2018 (Japanese GAAP)
") Member of Financial Accounting Standards Foundation NOK CORPORATION and Consolidated Subsidiaries Consolidated Financial Results for Fiscal Year Ended March 31, 2018 (Japanese GAAP) Date: May 10, 2018
Member of Financial Accounting Standards Foundation NOK CORPORATION and Consolidated Subsidiaries Consolidated Financial Results for Fiscal Year Ended March 31, 2018 (Japanese GAAP) Date: May 10, 2018
1Q of FY ending December 31, (0.2) (1.9) 11.3 (0.2) (0.2) (0.2) (0.2) (1.2) (89.2) 0.1
 (1.9) 11.3 (0.2) (0.2) (0.2) (0.2) (1.2) (89.2) 0.1") August 6, ISEKI & CO., LTD. Supplementary Information to Consolidated Financial Results (April 1, June 30, ) I. Consolidated business results for the three months ended June 30, (Billions of yen, %) Year-on
August 6, ISEKI & CO., LTD. Supplementary Information to Consolidated Financial Results (April 1, June 30, ) I. Consolidated business results for the three months ended June 30, (Billions of yen, %) Year-on
Six months of FY ending December 31, (0.4) (1.9) 22.5 (0.4) (0.3) (0.4) (0.1) (0.4) (0.7) (2.0) 0.9 (1.
 (1.9) 22.5 (0.4) (0.3) (0.4) (0.1) (0.4) (0.7) (2.0) 0.9 (1.") November 11, ISEKI & CO., LTD. Supplementary Information to Consolidated Financial Results (April 1, September 30, ) I. Consolidated business results for the six months ended September 30, (Billions of
November 11, ISEKI & CO., LTD. Supplementary Information to Consolidated Financial Results (April 1, September 30, ) I. Consolidated business results for the six months ended September 30, (Billions of
NOK CORPORATION and Consolidated Subsidiaries Consolidated Financial Results for the Six Months Ended September 30, 2017 (Japanese GAAP)
") Member of Financial Accounting Standards Foundation NOK CORPORATION and Consolidated Subsidiaries Consolidated Financial Results for the Six Months Ended September 30, 2017 (Japanese GAAP) Company name:
Member of Financial Accounting Standards Foundation NOK CORPORATION and Consolidated Subsidiaries Consolidated Financial Results for the Six Months Ended September 30, 2017 (Japanese GAAP) Company name:
FY ended March 31, 2015 Restated *1. Year-on year change. Difference (forecast/ actual) FY ended December 31, December 31, 2015 Forecast *2
 FY ended December 31, December 31, 2015 Forecast *2") February 12, 2016 ISEKI & CO., LTD. Supplementary Information to Consolidated Financial Results (April 1, ) I. Consolidated business results for the fiscal year ended (Billions of yen, %) March 31, Restated
February 12, 2016 ISEKI & CO., LTD. Supplementary Information to Consolidated Financial Results (April 1, ) I. Consolidated business results for the fiscal year ended (Billions of yen, %) March 31, Restated
Note: The original disclosure in Japanese was released on May 12, 2017 at 13:20 (GMT +9). (All amounts are rounded down to the nearest million yen.
. (All amounts are rounded down to the nearest million yen.") May 12, 2017 Consolidated Financial Results for the Fiscal Year Ended March 31, 2017 [Japanese GAAP] Company name: C. Uyemura & Co., Ltd. Listing: Second Section of the Tokyo Stock Exchange Stock code:
May 12, 2017 Consolidated Financial Results for the Fiscal Year Ended March 31, 2017 [Japanese GAAP] Company name: C. Uyemura & Co., Ltd. Listing: Second Section of the Tokyo Stock Exchange Stock code:
1. Consolidated Financial Results (April 1, 2017 June 30, 2017) (1) Results of operations (Percentages represent year-over-year changes.
 (1) Results of operations (Percentages represent year-over-year changes.") August 9, 2017 Consolidated Financial Results for the First Quarter of the Fiscal Year Ending March 31, 2018 (Three Months Ended June 30, 2017) [Japanese GAAP] Company name: C. Uyemura & Co., Ltd. Listing:
August 9, 2017 Consolidated Financial Results for the First Quarter of the Fiscal Year Ending March 31, 2018 (Three Months Ended June 30, 2017) [Japanese GAAP] Company name: C. Uyemura & Co., Ltd. Listing:
GS Yuasa Corporation Consolidated Earnings Report for the. (Japanese GAAP)
") GS Yuasa Corporation Consolidated Earnings Report for the December 31, 2017 (Japanese GAAP) February 2, 2018 Stock listing: Tokyo Stock Exchange Securities code: 6674 URL: http://www.gs-yuasa.com/en Representative:
GS Yuasa Corporation Consolidated Earnings Report for the December 31, 2017 (Japanese GAAP) February 2, 2018 Stock listing: Tokyo Stock Exchange Securities code: 6674 URL: http://www.gs-yuasa.com/en Representative:
Presentation for Institutional Investors (FY16 1 st Half)
") Nippon Paint Holdings Co., Ltd. Presentation for Institutional Investors (FY16 1 st Half) November 17, 2016 Nippon Paint Holdings Co., Ltd. Tetsushi Tado, President & CEO Table of Contents 1.Financial
Nippon Paint Holdings Co., Ltd. Presentation for Institutional Investors (FY16 1 st Half) November 17, 2016 Nippon Paint Holdings Co., Ltd. Tetsushi Tado, President & CEO Table of Contents 1.Financial
Briefing on Financial Statements for the First Half of the Year Ending March 2016
 Briefing on Financial Statements for the First Half of the Year Ending March 216 November 12, 215 http://www.tsugami.co.jp Copyright 215 TSUGAMI CORPORATION All rights reserved. 1. Business performance
DMG MORI CO., LTD. CY 2016 (Jan.- Dec.) 3Q Result. IR Conference 0/28. IR Conference 2016/11/7
 3Q Result. IR Conference 0/28. IR Conference 2016/11/7") DMG MORI CO., LTD. CY 2016 (Jan.- Dec.) 3Q Result 0/28 Agenda 1) Full integration with DMG MORI AG 2) Financials 3) Business Environment 4) Topics from DMG MORI Group 1/28 Full integration with DMG MORI
DMG MORI CO., LTD. CY 2016 (Jan.- Dec.) 3Q Result 0/28 Agenda 1) Full integration with DMG MORI AG 2) Financials 3) Business Environment 4) Topics from DMG MORI Group 1/28 Full integration with DMG MORI
Q1 FY2019 (April 1, 2018 June 30, 2018) Financial Announcement
 Financial Announcement") Q1 FY219 (April 1, 218 June 3, 218) Financial Announcement July 26, 218 Agenda: Q1 FY219 Consolidated Financial Summary Ken Sasagawa, Vice President, Accounting Dept. Business Environment and Financial
Q1 FY219 (April 1, 218 June 3, 218) Financial Announcement July 26, 218 Agenda: Q1 FY219 Consolidated Financial Summary Ken Sasagawa, Vice President, Accounting Dept. Business Environment and Financial
Olympus Group Consolidated Financial Results for the 2nd Quarter of the Fiscal Year Ending March 31, 2016
 Olympus Group Consolidated Financial Results for the 2nd Quarter of the Fiscal Year Ending March 31, 2016 Hiroyuki Sasa President and Representative Director Olympus Corporation November 6, 2015 Highlights
Consolidated Financial Results for 3Q FY2018
 Consolidated Financial Results for 3Q FY2018 February 1, 2019 Fuji Electric Co., Ltd. 2019 Fuji Electric Co., Ltd. All rights reserved. 1 Summary of Consolidated Financial Results for (Apr. - Dec.) FY2018
Management Policies (Fiscal 2014)
") Management Policies (Fiscal 2014) Hiroyuki Sasa President and Representative Director Olympus Corporation May 9, 2014 2 II. Challenges and Responses 3 4 5 6 I. Successes during 2 Years under New Management
Management Policies (Fiscal 2014) Hiroyuki Sasa President and Representative Director Olympus Corporation May 9, 2014 2 II. Challenges and Responses 3 4 5 6 I. Successes during 2 Years under New Management
Flash Report Consolidated Basis Results for the First Half of Fiscal 2017 (April 1, 2017 September 30, 2017) <under Japanese GAAP>
 <under Japanese GAAP>") Flash Report Consolidated Basis Results for the First Half of Fiscal 2017 (April 1, 2017 September 30, 2017) Company name: Nippon Steel & Sumitomo Metal Corporation Stock listing:
Flash Report Consolidated Basis Results for the First Half of Fiscal 2017 (April 1, 2017 September 30, 2017) Company name: Nippon Steel & Sumitomo Metal Corporation Stock listing:
Presentation on Business Results for the 1st-Half of Fiscal Year Ending March 31, 2017
 Presentation on Business Results for the 1st-Half of Fiscal Year Ending March 31, 2017 November 17, 2016 This presentation contains forward-looking statements relating to expected future performance as
FY2017 SECOND QUARTER FINANCIAL RESULTS BRIEFING
 FY2017 SECOND QUARTER FINANCIAL RESULTS BRIEFING Nov 20, 2017 Page.01 FY2017 SECOND QUARTER FINANCIAL RESULTS BRIEFING 1. Status of the Kansai Paint Group 2. Financial Results & Forecasts 3. Regional Overview
B-GUIDE: Economic Outlook
 Aug-12 Apr-13 Dec-13 Aug-14 Apr-15 Dec-15 Aug-16 Apr-17 Jul-15 Nov-15 Mar-16 Jul-16 Nov-16 Mar-17 Jul-17 Quarterly Economic Outlook: Quarter 4 2017 4 January 2018 B-GUIDE: Economic Outlook The economy
FINANCIAL SUMMARY FOR THE FIRST QUARTER ENDED JUNE 30, 2009
 Company Name: ANRITSU CORPORATION (Code Number:6754) Listed at : Tokyo Stock Exchange URL http://www.anritsu.co.jp/ Representative: Hiromichi Toda ; President and Director Contact Person: Tetsuo Kawabe
FY2018 Financial Result <Supplement>
 FY2018 Financial Result February 13, 2019 Round off to the first decimal place (the same shall apply hereafter) Summary Higher net sales but lower net income Net sales: Steady expansion of
Consolidated Financial Results
 - 11-1. Fiscal 2018 ended March 31, 2018 A. Operating Results Net sales 7,982.2 7,343.7 109% Operating profit 380.5 276.8 137% Profit before income taxes 378.6 275.1 138% Net profit attributable to stockholders
Bando Chemical Industries, Ltd.
 Consolidated Business Results for the Fiscal Year Ending March 31, 217 Bando Chemical Industries, Ltd. May 12, 217 Ⅰ. Financial summary for the fiscal year ending March 31, 217 Ⅱ. Business forecast for
Flash Report Consolidated Basis Results for the First Quarter of Fiscal 2018 (April 1, 2018 June 30, 2018) <under Japanese GAAP>
 <under Japanese GAAP>") Flash Report Consolidated Basis Results for the First Quarter of Fiscal 2018 (April 1, 2018 June 30, 2018) Company name: Nippon Steel & Sumitomo Metal Corporation Stock listing: Tokyo,
Flash Report Consolidated Basis Results for the First Quarter of Fiscal 2018 (April 1, 2018 June 30, 2018) Company name: Nippon Steel & Sumitomo Metal Corporation Stock listing: Tokyo,
First Quarter of the Fiscal Year Ending December 31, 2015 Unicharm Presentation Materials for Investor Meeting
 First Quarter of the Fiscal Year Ending December 31, 2015 Unicharm Presentation Materials for Investor Meeting May 8, 2015 Takahisa Takahara President and CEO Unicharm Corporation Projections stated herein
Summary of Consolidated Financial Results for Second Quarter of FY2017
 Summary of Consolidated Financial Results for Second Quarter of FY2017 Nov 1, 2017 Mitsui Chemicals, Inc. 1. Summary of Income Statement Net sales Operating income Ordinary income Profit attributable to
Notes to Consolidated Financial Statements
 CONSOLIDATED FINANCIAL DATA Notes to Consolidated Financial Statements 1. Basis for preparing consolidated financial statements (1) Scope of consolidation (i) Consolidated subsidiaries (a) Number of consolidated
FY08/3 Q1 Financial Results and Outlook
 FY08/3 Q1 Financial Results and Outlook NEC Electronics Corporation July 30, 2007 http://www.necel.com/ir/en/ 1 Welcome to NEC Electronics webcast. My name is Hank Sato, CFO of NEC Electronics. 1 Agenda
Consolidated Financial Results for the 1 st Half of FYE 2019
 Consolidated Financial Results for the 1 st Half of SUBARU CORPORATION Toshiaki Okada Corporate Executive Vice President & CFO November 5 th, 2018 1 Summary Consolidated Financial Results for the 1 st
Olympus Group Financial Results for the 2nd Quarter of the Fiscal Year Ending March 31, 2015
 Olympus Group Financial Results for the 2nd Quarter of the Fiscal Year Ending March 31, 2015 Hiroyuki Sasa President and Representative Director Olympus Corporation November 7, 2014 2Q of Fiscal 2015 Consolidated
Consolidated Financial Results for the Fiscal Year Ended March 31, 2018
 Consolidated Financial Results for the Fiscal Year Ended March 31, 2018 Ⅰ. Consolidated Financial Results for Fiscal 2017 Ⅱ. Consolidated Financial Results Forecast for Fiscal 2018 Ⅲ. Supplementary Data
Financial Results for the First Quarter Fiscal Year Ending December 2015 Investor Relations Presentation Materials
 Financial Results for the First Quarter Fiscal Year Ending December 2015 Investor Relations Presentation Materials ISEKI & CO., LTD. Susumu Tada, Director & Senior managing executive officer August 7,
Financial Results for the Second Quarter Fiscal Year Ending March 2015 Investor Relations Presentation Materials ISEKI & CO., LTD.
 Financial Results for the Second Quarter Fiscal Year Ending March 2015 Investor Relations Presentation Materials ISEKI & CO., LTD. Noriyuki Kimura, President November 14, 2014 Index 1. Outline of Financial
Operating Results. Financial Review. Business Overview. Net Sales
 Financial Review Panasonic has begun applying International Financial Reporting Standards (IFRS) on a voluntary basis as of the fiscal year ended March 217. Financial figures for previous consolidated
[Disclaimer Regarding Forecast and Projections]
![[Disclaimer Regarding Forecast and Projections]](/thumbs/95/126032084.jpg "[Disclaimer Regarding Forecast and Projections]") [Disclaimer Regarding Forecast and Projections] This Consolidated Financial Results includes forecasts, projections and other predictive statements that represent Fullcast s assumptions and expectations
[Disclaimer Regarding Forecast and Projections] This Consolidated Financial Results includes forecasts, projections and other predictive statements that represent Fullcast s assumptions and expectations
Consolidated Financial Results for 1H FY2017
 Consolidated Financial Results for 1H FY2017 October 27, 2017 Fuji Electric Co., Ltd. 2017Fuji Electric Co., Ltd. All rights reserved. 1 Summary of Consolidated Financial Results for 1H FY2017 (YoY Comparison)
Summary of Consolidated Financial Statements for the Nine Months ended September 30,2012 (Japanese GAAP)
") Summary of Consolidated Financial Statements for the Nine Months ended September 30,2012 (Japanese GAAP) November 6, 2012 Company name HORIBA, Ltd. Listed stock exchanges: Tokyo, Osaka Listing code 6856
Summary of Consolidated Financial Statements for the Nine Months ended September 30,2012 (Japanese GAAP) November 6, 2012 Company name HORIBA, Ltd. Listed stock exchanges: Tokyo, Osaka Listing code 6856
Consolidated Financial Summary for Fiscal Year 2004 ended March 31, 2005
 Consolidated Financial Summary for Fiscal Year 2004 ended March 31, 2005 May 13, 2005 Name of Listed Company: NOK Corporation Securities Code Number: 7240 Share Listing: Tokyo, Nagoya (URL http://www.nok.co.jp)
Consolidated Financial Results for the 1st Quarter of Fiscal Year Ending March 31, 2016
 Consolidated Financial Results for the 1st Quarter of Fiscal Year Ending March 31, 2016 Yasuo Takeuchi Director, Senior Executive Managing Officer Head of Corporate Management Office, CFO Olympus Corporation
Consolidated Financial Results for the 1st Quarter of Fiscal Year Ending March 31, 2015
 Consolidated Financial Results for the 1st Quarter of Fiscal Year Ending March 31, 2015 Yasuo Takeuchi Director, Senior Executive Managing Officer Group President of Group Management Office Olympus Corporation
Honda Information Meeting 2012 Autumn. Honda FY2011 Rating Review
 Honda Information Meeting 212 Autumn Honda FY211 Rating Review 1 1 Honda Information Meeting Honda FY211 Rating Review Current Honda Business Business Strategy Automobile Business Motorcycle Business FY13b
Net sales Operating profit Ordinary profit
 November 8, 2017 Summary of Consolidated Financial Results for the Second Quarter of Fiscal Year Ending March 31, 2018 (Six Months Ended September 30, 2017) [Japanese GAAP] Company name: ALCONIX CORPORATION
GS Yuasa Corporation Consolidated Earnings Report for the. (Japanese GAAP)
") GS Yuasa Corporation Consolidated Earnings Report for the (Japanese GAAP) August 9, 2018 Stock listing: Tokyo Stock Exchange Securities code: 6674 URL: http://www.gs-yuasa.com/en/ Representative: Osamu
GS Yuasa Corporation Consolidated Earnings Report for the (Japanese GAAP) August 9, 2018 Stock listing: Tokyo Stock Exchange Securities code: 6674 URL: http://www.gs-yuasa.com/en/ Representative: Osamu
Consolidated Financial Results for 3Q FY2017
 Consolidated Financial Results for 3Q FY2017 January 30, 2018 Fuji Electric Co., Ltd. 2018 Fuji Electric Co., Ltd. All rights reserved. 1 Summary of Consolidated Financial Results for (Apr.- Dec.) FY2017
Financial Results for FY2014
 Financial Results for FY2014 Mitsubishi Motors Corporation April 24, 2015 FY2014 Financial Results NEW 2016 MITSUBISHI OUTLANDER 1 FY2014 Results Summary (vs. FY2013 and Feb. 3 FY2014 Forecast) Achieved
Financial Summary. Mitsui Chemicals, Inc. May 12, Results of FY2016 & Outlook for FY2017. Copyright 2017 Mitsui Chemicals, Inc.
 Financial Summary Results of & Outlook for FY2017 Mitsui Chemicals, Inc. May 12, 2017 indicates the period from April 1, 2016 to March 31, 2017. Contents 1. Results of (April 1, 2016 March 31,
Q2 FY2018 (July - September 2017) Financial Announcement
 Financial Announcement") FY218 (July - September 217) Financial Announcement October 31, 217 Agenda: FY218 Consolidated Financial Summary Tetsuro Hori, Representative Director, CFO, Executive Vice President Business Environment
FY218 (July - September 217) Financial Announcement October 31, 217 Agenda: FY218 Consolidated Financial Summary Tetsuro Hori, Representative Director, CFO, Executive Vice President Business Environment
FY2013 Management Plan. May 2013 Mitsuyoshi Shibata, President Furukawa Electric
 FY2013 Management Plan May 2013 Mitsuyoshi Shibata, President Furukawa Electric 1 FY2012 Highlights Both sales and profits increased from a year ago, reflecting the strong performance of the auto parts
CONSOLIDATED FINANCIAL STATEMENTS
 CONSOLIDATED FINANCIAL STATEMENTS (for the fiscal year 2014.12 ended December 31, 2014) Name of Company: SUMIDA CORPORATION Stock Listing: Tokyo Security Code No.: 6817 (URL http://www.sumida.com) Representative:
Financial Summary. Mitsui Chemicals, Inc. February 5, Results for 3 rd Quarter of FY2018 & Outlook for FY2018
 Financial Summary Results for 3 rd Quarter of FY2018 & Outlook for FY2018 Mitsui Chemicals, Inc. February 5, 2019 FY2018 indicates the period from April 1, 2018 to March 31, 2019. Contents 1.
Consolidated Financial Results for the Third Quarter, Fiscal 2018
 Consolidated Financial Results for the Third Quarter, Fiscal 2018 Ⅰ. Consolidated Financial Results for the Third Quarter, Fiscal 2018 Consolidated Financial Results Forecast for Fiscal 2018 Ⅱ. Supplementary
Outline of Consolidated Results for The Third Quarters of FY2016. February 2, 2017
 Outline of Consolidated Results for The Third Quarters of FY2016 February 2, 2017 目次 1. Outline of Consolidated Results for the Third Quarter of FY2016 2. Revision of Full-Year Consolidated Forecast for
Performance Summary. Copyright 2018 Harmonic Drive Systems Inc.
 Performance Summary 2 1st-half consolidated results (versus original forecasts for the period) Original forecasts (announced May 11) 1st-half FY ending Mar.31,2019 Vs. original forecasts for the period
Third Quarter of FY Japan Display Inc. Consolidated Financial Results. February 14, (Oct. 1, 2018 Dec. 31, 2018)
") Third Quarter of FY 2018 (Oct. 1, 2018 Dec. 31, 2018) Consolidated Financial Results Japan Display Inc. February 14, 2019 Today s Speakers Yoshiyuki Tsukizaki Chief Operating Officer and President Takanobu
Third Quarter of FY 2018 (Oct. 1, 2018 Dec. 31, 2018) Consolidated Financial Results Japan Display Inc. February 14, 2019 Today s Speakers Yoshiyuki Tsukizaki Chief Operating Officer and President Takanobu
FY 2017 Presentation
 FY 2017 Presentation 1 2 At a glance Overview FY 2017 YoY revenue growth of 2.2% to EUR 82.5 mn (FY 2016: EUR 80.7 mn) in a challenging year after 13.5% decline at the end of H1/17 (compared YoY) New order
Consolidated Financial Results Briefing Materials for 3 rd Quarter of Fiscal Year Ending March 31, 2015
 Consolidated Financial Results Briefing Materials for 3 rd Quarter of Fiscal Year Ending March 31, 2015 IRISO ELECTRONICS CO., LTD. Stock Code: 6908 (February 18, 2015) Copyright 2015 IRISO Electronics
Monthly Economic Insight
 Monthly Economic Insight Prepared by : TMB Analytics Date: 22 February 2018 Executive Summary Synchronized global economic growth continued to brighten global economic outlook and global trade outlook.
GS Yuasa Corporation Consolidated Earnings Report for the Nine Months ended December 31, 2018 (Japanese GAAP)
") GS Yuasa Corporation Consolidated Earnings Report for the (Japanese GAAP) February 12, 2019 Stock listing: Tokyo Stock Exchange Securities code: 6674 URL: http://www.gs-yuasa.com/en/ Representative: Osamu
GS Yuasa Corporation Consolidated Earnings Report for the (Japanese GAAP) February 12, 2019 Stock listing: Tokyo Stock Exchange Securities code: 6674 URL: http://www.gs-yuasa.com/en/ Representative: Osamu
Financial Report 2015 Japan Aviation Electronics Industry, Limited and consolidated subsidiaries Years ended March 31
 Financial Report Japan Aviation Electronics Industry, Limited and consolidated subsidiaries Financial Outlook While US economy continued its stable growth driven by improvement in employment, consumer
FY18 3rd Quarter Financial Results
 3rd Quarter Financial Results Honda Motor Co., Ltd. February 2, 2018 Clarity Plug-In Hybrid (U.S.) 1 Topics -Outline of Results Summary - Honda Group Unit Sales - Main Markets - News Topics - Financial
Fuji Heavy Industries Ltd.
 President & CEO, Yasuyuki Yoshinaga Fuji Heavy Industries Ltd. May 9, 2014 0 Business Results for the FYE2014 ( 100M) Consolidated automobile sales FYE2013 FYE2014 YoY 724,000 825,000 High +13.9 % Net
2Q of FY ended December 31, 2015 Restated basis *1. Year-on year change (Restated basis) 2Q of FY ending December 31, 2016 Forecast
 2Q of FY ending December 31, 2016 Forecast") August 10, 2016 ISEKI & CO., LTD. Supplementary Information to Consolidated Financial Results (January 1, 2016 June 30, 2016) I. Consolidated business results for the six months ended June 30, 2016 (Billions
August 10, 2016 ISEKI & CO., LTD. Supplementary Information to Consolidated Financial Results (January 1, 2016 June 30, 2016) I. Consolidated business results for the six months ended June 30, 2016 (Billions
NAGASE & CO., LTD. Contents. 1. FYE March 2015 Results P FYE March 2016 Earnings Projections P. 13. Management Plan P. 19
 NAGASE & CO., LTD. Contents 1. FYE March 2015 Results P. 3 2. FYE March 2016 Earnings Projections P. 13 3. Mid-Term Management Plan Overview/Long-Term Management Plan P. 19 4. (Reference) Information by
Financial Results for the First Six Months of the Fiscal Year Ending March 31, 2017 [J-GAAP] (Consolidated)
![Financial Results for the First Six Months of the Fiscal Year Ending March 31, 2017 [J-GAAP] (Consolidated)](/thumbs/86/93348926.jpg "Financial Results for the First Six Months of the Fiscal Year Ending March 31, 2017 [J-GAAP] (Consolidated)") Company Name: Stock exchange listed on: Financial Results for the First Six Months of the Fiscal Year Ending March 31, 2017 [J-GAAP] (Consolidated) Kintetsu World Express, Inc. (KWE) Tokyo Stock Exchange
Company Name: Stock exchange listed on: Financial Results for the First Six Months of the Fiscal Year Ending March 31, 2017 [J-GAAP] (Consolidated) Kintetsu World Express, Inc. (KWE) Tokyo Stock Exchange
4. Other 1) Reclassification of significant subsidiaries during the period (Reclassification due to the change in scope of consolidation) : No 2) Adop
 Reclassification of significant subsidiaries during the period (Reclassification due to the change in scope of consolidation) : No 2) Adop") 1Q FY 3/2015 Summary of Consolidated Financial Results Company Name Wacom Co., Ltd. (URL http://www.wacom.com ) Representative: Masahiko Yamada, CEO TEL: 0120-056-665 Contact: Wataru Hasegawa, CFO Preparation
1Q FY 3/2015 Summary of Consolidated Financial Results Company Name Wacom Co., Ltd. (URL http://www.wacom.com ) Representative: Masahiko Yamada, CEO TEL: 0120-056-665 Contact: Wataru Hasegawa, CFO Preparation
FY2018, FY2019 Economic Outlook - The Japanese economy is continuing to follow a recovery track -
 REVISED to reflect the 2 nd QE for the Apr-Jun Qtr of 2018 FY2018, FY2019 Economic Outlook - The Japanese economy is continuing to follow a recovery track - September 10, 2018 Copyright Mizuho Research
FY rd Quarter Business Results
 FY2011 3 rd Quarter Business Results Nozza (Vietnam) Launched in Sep. Yamaha Motor Co., Ltd. November 4, 2011 1 Agenda Consolidated Financial Results for the 3 rd Quarter and Nine months of the FY2011
Financial Results for FY2016 1H (Apr.-Sep.)
") Financial Results for FY2016 (Apr.-Sep.) October 31, 2016 2012 MITSUBISHI HEAVY INDUSTRIES, LTD. All Rights Reserved. Table of Contents Ⅰ. FY2016 Financial Results - Summary of Financial Results 3 - Financial
Financial Results for FY2016 (Apr.-Sep.) October 31, 2016 2012 MITSUBISHI HEAVY INDUSTRIES, LTD. All Rights Reserved. Table of Contents Ⅰ. FY2016 Financial Results - Summary of Financial Results 3 - Financial
Financial Summary. Mitsui Chemicals, Inc. Aug 2, Results of the 1 st Quarter of FY2018 & Outlook for FY2018
 Financial Summary Results of the 1 st Quarter of FY2018 & Outlook for FY2018 Mitsui Chemicals, Inc. Aug 2, 2018 FY2018 indicates the period from April 1, 2018 to March 31, 2019. Contents 1. Results
FY09/3 Q2 Financial Results
 FY09/3 Q2 Financial Results Toshio Nakajima President and CEO October 29, 2008 NEC Electronics Corporation http://www.necel.com/ir/en/ 1 Executive Summary Despite the effects of considerable yen depreciation,
Toridoll. corporation FY2014 (2Q) Financial Result. Nov. 5, 2014
 Financial Result. Nov. 5, 2014") Toridoll. corporation FY2014 (2Q) Financial Result Nov. 5, 2014 1 Financial Result Digest FY2014(2Q) 2 Financial summary Consolidated Net sales: 43.2bn. yen (+9.0% vs. last 2Q) Consolidated Ordinary income:
Toridoll. corporation FY2014 (2Q) Financial Result Nov. 5, 2014 1 Financial Result Digest FY2014(2Q) 2 Financial summary Consolidated Net sales: 43.2bn. yen (+9.0% vs. last 2Q) Consolidated Ordinary income:
Financial Results for the First Three Months of the Fiscal Year Ending March 31, 2017 [J-GAAP] (Consolidated)
![Financial Results for the First Three Months of the Fiscal Year Ending March 31, 2017 [J-GAAP] (Consolidated)](/thumbs/78/78430408.jpg "Financial Results for the First Three Months of the Fiscal Year Ending March 31, 2017 [J-GAAP] (Consolidated)") Company Name: Stock exchange listed on: Financial Results for the First Three Months of the Fiscal Year Ending March 31, 2017 [J-GAAP] (Consolidated) Kintetsu World Express, Inc. (KWE) Tokyo Stock Exchange
Company Name: Stock exchange listed on: Financial Results for the First Three Months of the Fiscal Year Ending March 31, 2017 [J-GAAP] (Consolidated) Kintetsu World Express, Inc. (KWE) Tokyo Stock Exchange
for the year ended December 31, 2016
 Financial Results for the year ended December 31, 2016 Shigeru Kimura Director and Senior Managing Executive Officer, General Manager of Planning & Control Headquarters February 20, 2017 Financial Summary
U.S. Steel Market Outlook. Amy Ebben ArcelorMittal USA November 30, 2018
 U.S. Steel Market Outlook Amy Ebben ArcelorMittal USA November 30, 2018 Agenda ArcelorMittal introduction U.S. steel industry performance and trade Global steel industry Review of steel markets 1 About
First Section, TSE, Securities Code: Aeon Fantasy Co., Ltd.
 First Section, TSE, Securities Code: 4343 Aeon Fantasy Co., Ltd. SUMMARY OF CONSOLIDATED FINANCIAL STATEMENTS FOR THE SECOND QUARTER OF THE FISCAL YEAR ENDING FEBRUARY 28, 2015 1 Topics for the Second
Quarterly Economic Outlook: Quarter on 25 September 2018 Strong Economic Expansions amidst Uncertainty of Trade War
 Foregin Direct Investment (Billion USD) China U.S. Asia World Quarterly Economic Outlook: Quarter 3 2018 on 25 September 2018 Strong Economic Expansions amidst Uncertainty of Trade War Thai Economy: Thai
FY2011 3rd Quarter Consolidated Results
 FY2011 3rd Quarter Consolidated Results (Fiscal year ended March 31, 2012) February 15, 2012 1 The forecasted results which appear in this report have been prepared based solely on the information which
Note: The original disclosure in Japanese was released on May 11, 2018, at 15:10 (GMT +9). (All amounts are rounded down to the nearest million yen)
. (All amounts are rounded down to the nearest million yen)") May 11, 2018 Summary of Consolidated Financial Results for the Fiscal Year Ended March 31, 2018 [Japanese GAAP] Company name: NITTOKU ENGINEERING CO., LTD. Listing: Tokyo Stock Exchange (JASDAQ) Stock
May 11, 2018 Summary of Consolidated Financial Results for the Fiscal Year Ended March 31, 2018 [Japanese GAAP] Company name: NITTOKU ENGINEERING CO., LTD. Listing: Tokyo Stock Exchange (JASDAQ) Stock
FY17/12 Q1 FINANCIAL RESULTS
 FY17/12 Q1 FINANCIAL RESULTS RENESAS ELECTRONICS CORPORATION MAY 12, 2017 2017 Renesas Electronics Corporation. All rights reserved. FY17/12 Q1 FINANCIAL RESULTS Since FY16/3, Renesas Electronics Group
Fully diluted net income per share Dividend per share (Record date) End of 1Q End of 2Q End of 3Q Year-end Annual
 End of 1Q End of 2Q End of 3Q Year-end Annual") NIPPON SHOKUBAI CO., LTD. (4114) Financial Results for the Second Quarter of FY3/11 Summary of Consolidated Financial Results For the Second Quarter of the Fiscal Year Ending March 31, 2011 (Six Months
NIPPON SHOKUBAI CO., LTD. (4114) Financial Results for the Second Quarter of FY3/11 Summary of Consolidated Financial Results For the Second Quarter of the Fiscal Year Ending March 31, 2011 (Six Months
ANNOUNCEMENT OF PRELIMINARY RESULTS
 The leading high service distributor to engineers worldwide ANNOUNCEMENT OF PRELIMINARY RESULTS YEAR ENDED 31 MARCH 2009 29 May 2009 Agenda Overview and current trading Ian Mason Financial performance
FY ending. 3Q of FY ended December 31, 2015 Restated basis *1. Year-on-year change (Restated basis) 3Q of FY ending
 3Q of FY ending") November 11, 2016 ISEKI & CO., LTD. Supplementary Information to Consolidated Financial Results (January 1, 2016 September 30, 2016) I. Consolidated business results for the nine months ended September
November 11, 2016 ISEKI & CO., LTD. Supplementary Information to Consolidated Financial Results (January 1, 2016 September 30, 2016) I. Consolidated business results for the nine months ended September
1H FY08/3 Financial Results and Outlook
 1H FY8/3 Financial Results and Outlook Toshio Nakajima President and CEO November 13, 27 NEC Electronics Corporation http://www.necel.com/ir/en/ 1 Thank you for joining NEC Electronics webcast. Before
2017 1Q Results. May 2017
 217 1Q Results May 217 Agenda 1. Financials 2. Market Fundamental 3. Industry Outlook 4. Plant Operation 5.Expansion 2 Financial Status (Unit: NTD Million) 4Q16 1Q17 QoQ 1Q16 YoY Revenues 152,287 164,486
FY11/3 Q2 Financial Results
 FY11/3 Q2 Financial Results Renesas Electronics Corporation October 27, 2010 Yasushi Akao, President 2010 Renesas Electronics Corporation. All rights reserved. 00000-A (NOTE) FY10/3 consolidated results
Bando Chemical Industries, Ltd.
 Consolidated Business Results for the Fiscal Year Ending March 31, 216 Bando Chemical Industries, Ltd. May 12, 216 Contents Ⅰ. Company overview Ⅱ. Financial summary for the fiscal year ending March 31,
Consolidated Financial Results
 ORIX Corporation (TSE: 8591; NYSE: IX) Consolidated Financial Results For the Consolidated Fiscal Year Ended March 31, 2013 May 10, 2013 Copyright 2013 ORIX Corporation All rights reserved. Disclaimer
Financial Results for the First Quarter of FY2019/3 AIFUL CORPORATION
 Financial Results for the First Quarter of FY219/3 AIFUL CORPORATION August 218 Highlights for FY219/3 (Consolidated/ AIFUL) (Consolidated) ( million) 17/6 18/6 19/3 % (E) % Total operating assets 67,491
Consolidated Financial Results of Kyocera Corporation and its Subsidiaries for the Year Ended March 31, 2017
 Consolidated Financial Results of and its Subsidiaries for the Year Ended March 31, 2017 The consolidated financial information is prepared in accordance with generally accepted accounting principles in
Business Report for FY2010 From Apr. to Sep SMK Corporation Oct, 2010
 Business Report for FY21 From Apr. to Sep. 21 SMK Corporation Oct, 21 FY21 Outline of 1H Financial Statement Director and Executive Vice President Hajime Yamada 1H Financial Result 1 Sales
First Quarter of FY Japan Display Inc. Consolidated Financial Results. August 9, 2016
 First Quarter of FY 2016 Consolidated Financial Results Japan Display Inc. August 9, 2016 Agenda 1. 1Q16 Results & 2Q16 Forecast 2. Sales Trends and JDI s Action 3. Management Challenges Note: The depreciation
Kurita Water Industries Reports Earnings for the Nine Months ended December 31, 2010
 FOR IMMEDIATE RELEASE Kurita Water Industries Reports Earnings for the Nine Months ended December 31, 2010 Tokyo, Japan, January 31, 2011 Kurita Water Industries Ltd. (TSE Securities Code 6370) announced
CHINA BIWEEKLY. Innovation in the Electronics and Information Technology Manufacturing Industry Developed Significantly in 2017
 CHINA BIWEEKLY RMB Internationalization Business Promotion Office Global Business Division December 24th 2018 BIWEEKLY DIGEST [Economy] Manufacturing PMI in Distinct Downward Trend, Recording 50.0 Points
Ferrotec Corporation Results for the 1 st half of the fiscal year ended March 31, 2014
 Ferrotec Corporation Results for the 1 st half of the fiscal year ended March 31, 2014 November 27, 2013 (JASDAQ 6890) http://www. ferrotec. co. jp/ 1. This 1st half results cover six months period from
Summary of Consolidated Financial Results for Third Quarter of FY2017
 Summary of Consolidated Financial Results for Third Quarter of FY Feb 2, 2018 Mitsui Chemicals, Inc. 1. Summary of Income Statement Net sales Operating income Ordinary income Profit attributable to owners