Analysts activities and the timing of returns: Implications for predicting returns
|
|
|
- Cleopatra Hawkins
- 5 years ago
- Views:
Transcription
1 Analysts activities and the timing of returns: Implications for predicting returns ABSTRACT Andrew A. Anabila University of Texas Pan American This study examines the influence of analysts on the timing of returns associated with firms earnings news, and the implications for returns prediction. This is important for determining the lapse between the time when pieces of earnings news are available, when such news are incorporated in prices, and the implications for a returns trading strategy based on earnings prediction. The results show that depending on the level of analysts forecasting activities for a firm, there is a significant variation in the timing of the returns associated with the firm s total, industry-wide and firm-specific components of earnings news. For firms that are subject to high (low and none) analysts forecasting activities, the returns in a given period tend to be more associated with the contemporaneous and future (lagged and contemporaneous) earnings news. A returns trading strategy based on earnings prediction, would want to impound earnings information from the analysts forecasts of the firms with more analysts forecasting activities into the earnings forecasts of firms with less forecasting activities. Keywords: Analysts forecasting activities, Earnings, Returns prediction. Data Availability: Data used in this study are available from the public sources indicated. Copyright statement: Authors retain the copyright to the manuscripts published in AABRI journals. Please see the AABRI Copyright Policy at Analyst s activities and, page
2 INTRODUCTION Piotroski and Roulstone (2004) show that the co-movement (defined as stock returns synchronicity) in the returns of firms within an industry is positively associated with the level of analysts forecasting activities. This, they argue, is because analysts forecasting activities incorporate earnings information into prices. This study examines the implications of those findings for a returns trading strategy that predicts earnings. Since the earnings of a firm are associated with those of its industry peers (Baber et al., 999; Ramnath, 2002 and Anabila, 2003), differences in analysts forecasting activities suggest that fund managers and arbitrageurs could transfer earnings news from forecasts for firms with more analysts activities to those of firms with low activities. First, this study modifies Ayers and Freeman (997) to analyze the incremental impact of analysts forecasting activities on the relation between stock returns and the components of earnings news (i.e. industry-wide and firm-specific components of the annual change in earnings). The objective here is to determine which, if any, stocks do not incorporate all available information on the earnings news at a given time. Such stocks are potential candidates for portfolio selection in the returns trading strategy. The Ayers and Freeman (997) approach enables this study to decompose firms' earnings into news components as potential inputs to the earnings prediction part of the returns trading strategy. The industry-wide earnings news can be obtained from information released on the industry by the firms, government agents, and analysts who follow the industry. The firm-specific earnings information is relatively idiosyncratic, with fewer and less public sources such as fundamental analysis of the firm s historical information, disclosures by management and other insiders, or analysts' forecasts. Second, this study modifies the methodology in Ball and Brown (968) to examine the impact of analysts forecasting activities on the dynamics of the returns associated with earnings news. The objective is to determine the pattern, in time, of the availability of the industry-wide and firm-specific earnings information, when it is impounded in prices, and how this varies with the level of analysts forecasting activities. This is important because fund managers and arbitrageurs would be looking to exploit mispricing due to timing differences between the availability of news and its pricing. The significance of identifying the components of earnings news for pricing, the sources of information on the news, and the timing of the pricing of such news, are crucial. For example, Thomas and Zhang (2008), show strong evidence of returns overreaction by later announcers to earnings news from earlier announcing industry peers. Therefore, it is not sufficient that information is available, the timing of its incorporation is crucial for avoiding "duplication" and price overreaction. The sample comprises of USA firm year observations with December fiscal years from 980 through 200, at the intersection of Compustat and CRSP. Following Piotroski and Roulstone (2004), the level of analysts forecasting activities is the average number of forecasts issued during the year, in I/B/E/S (FirstCall in this study) summary file. The results in this study show that the level of analysts forecasting activities has a significant positive impact on the timing (how early), direction, and strength of the returns associated with the total, industry, and firm specific earnings news. For example, the returns of firms with higher (lower) analysts forecasting activities are more positively associated with the current and future (current and prior) years earnings news. Analyst s activities and, page 2
3 Also, in reacting to the earnings news, returns anticipate bad news (negative change in earnings) by up to 5 months before the period begins, but anticipate good news only around the period s beginning. Further, the returns of firms that have higher analysts forecasting activities anticipate both good and bad news by up to a month earlier than that of firms with the low and no analysts forecasting activities. Therefore differences in returns synchronicity are related largely to timing differences in the incorporation of earnings news and analysts activities. In sum, an earnings prediction returns trading strategy should consider predicting the earnings long before their announcements. Also, the strategy needs to transfer earnings information say, from analysts forecasts of firms with higher analysts forecasting activities to predict the earnings and returns of firms with lower analysts forecasting activities. This study contributes to prior research in two major ways. First, the results in Piotroski and Roulstone (2004), while very inspiring, do not relate the differences in returns synchronicity to the earnings news. It is possible that for firms whose returns do not move with the industry, their earnings news also are less related to that of the industry, and this probably explains the low or no analysts forecasting activities for such firms. This is the assumption underlying Ramnath (2002), who forms industry groups based on commonality of analysts following. However, the approach in Ramnath (2002) has the potential to cause overreaction by duplicating news, if the same news is incorporated from more than one earlier announcer. Thomas and Zhang (2008) show strong evidence on stock price overreaction to earlier announcers. This study shows that the difference in returns synchronicity is contemporaneous and is moderated by analysts forecasting activities. This makes fundamental analysis potentially profitable. Second, Ramnath (2002) requires that actual earnings of firms be released before the implications for the industry-wide earnings are ascertained and priced for other firms. Such an approach is less feasible because firms may announce earnings on the same date, and may be followed by different analysts. Using analysts forecasts of industry peers that have more (not necessarily the same) analysts activities, as suggested by this study will be more feasible because forecasts are often available even before the period begins. The rest of the study proceeds as follows: Section 2 provides a link to prior research; section 3 describes the models used in the study, section 4 describes the sample and the treatment of data; section 5 discusses the results and the implications, section 6 summarizes and concludes the study. PRIOR RESEARCH A number of research studies have examined the relation between returns and earnings news. For example, Ball and Brown (968) shows that prices tend to start impounding earnings news about 2 months prior to the earnings announcement month. Ayers and Freeman (997) show that the returns of a firm are positively (negatively) associated with industry-wide and firm-specific components of the current and future (prior) period s earnings news. Those studies show that the market anticipates and incorporates the earnings news before the period ends, and that an earnings prediction The approach in this study, similar to Ayers and Freeman (997) adjusts the earnings news for that of the market so it does not consider the economy-wide earnings as in Anilowski et al. (2005). Therefore, the findings in Anilowski et al. (2005) do not have a direct implication for those of this study. Analyst s activities and, page 3
4 approach to stock trading would require a prediction of the earnings news before the period ends. Piotroski and Roulstone (2004), show that the co-movement in the returns of firms within an industry increases in analysts forecasting activities. Though Piotroski and Roulstone (2004) do not relate earnings news to returns, the study stresses that it takes trade generating activities such as earnings forecasting by analysts to incorporate earnings news into prices. However, it is not certain whether the differences in the returns co-movement is due to differences in earnings results amongst the firms and/or differences in analysts forecasting activities. Earnings co-movement is the basis of Baber et al. (999) and Ramnath (2002). These two studies assume indirectly (for the former) and directly (for the latter study) that commonality of analysts following should enhance co-movement of earnings, and similarly, returns. The results in Ramnath (2002) are consistent with this assumption. This study argues that an earnings prediction approach to returns prediction requires that returns do not impound available earnings news. Accordingly, firms whose earnings co-move (usually industry peers) but whose returns vary in the speed (based on analysts forecasting activities) with which the earnings news are impounded into prices, are candidates for such a trading strategy. Consistent with its conjectures, this study shows that variations in the levels of analysts forecasting activities provide a role for fundamental analysis (earnings prediction) approach to returns trading. It shows that it is possible for earnings to comove (Magee 974, Brown and Ball, 967) yet returns would appear not to co-move because of variations in the level of analysts forecasting activities. It also shows that there is an asymmetry in the speed with which a change in news is anticipated: an annual change from bad (negative change in earnings) to good (positive change in earnings) news is anticipated earlier than a change from good to bad news. Elgers et al. (200) shows that the stock prices exhibit a significant delay before impounding earnings news from analysts forecasts that are available at the beginning of the year. This study extends those results by showing that the delay in impounding earnings news is inversely related to the level of analysts forecasting activities and the sign of the earnings news. This is important in guiding arbitrageurs and fund managers as to what positions to take and for which firms when doing fundamental analysis involving earnings and returns prediction. Both an over- and under-reaction exist, because of differences first in industry and firm-specific news, and second analysts activities. METHODOLOGY For each year, this study ranks firms by their level of analysts forecasting activities: zero for no analysts forecasts at all, one for low, two for medium and three for high analysts forecasting activities. This is done within the first two-digit SIC code. 2 There are two parts to the analysis in this paper. The first part of the analysis ascertains whether the relation between earnings components and returns vary with the level of analysts forecasting activities. Following Ayers and Freeman (997), this study estimates a regression of excess returns for the year on the industry-wide and firmspecific earnings components for the current, prior and next year. The specification is in model () below. Unlike Ayers and Freeman (997), the regression is modified to include 2 Using the NAICS shows that about 0% of the sample belonging to an SIC did not belong to the same NAICS. However, using NAICS groupings for the analysis yields similar results to those reported here. Analyst s activities and, page 4
5 the following: first, the interaction between the earnings news and the level of analysts forecasting activities, and second returns drivers identified in prior research (see model (2). The controls are size, book-to-market, trading volume (Piotroski, 2000), change in financing (Bradshaw et al., 2004). The models are as follows: i, t IML j, t FILi, t i t i, t IML j, t FILi, t * FCAF i, t FCAF i, t * IML j, t FCAF i, t * FILi, t BM i, t TVOLi, t SIZAi, t DFINAi, t VWRi, t i, t VWR (see Ayers and Freeman, 997). (), VWR Where: VWR i,t is the cumulative excess (over value weighted market) returns (see (3) below); Industry-wide earnings news; IML j, t DINDP50 j, t DMARP 50t (3a); Firmspecific earnings news; FIL i, t DFEL i, t DINDP50 j, t (3b); DINDP50 jt =Two-digit industry s median change in earnings for industry j, DMARP50 t =Market (entire sample) median change in earnings, DFEL i,t =Firm i s change in earnings, FCAF i,t =Mean number of Analysts Forecasts, scaled. The variables BM i,t-, SIZA i,t-, TVOL i,t-, VWR i,t- and DFINA i,t- represent book-to-market, size, trading volume, momentum and change in financing respectively. Returns are accumulated over the 2 months to the fiscal year t end for use in the regressions. 3 Model (4) captures the returns accumulation: m0 m0 i, t ( RETi, t, m ) ( VWRETD t, m ) m m VWR (3) Where: RET i,t,m = firm i s raw returns for month m of year t; VWRETD,t,m = CRSP value-weighted market returns in month m, for fiscal year t. The second part of the analysis examines the returns reaction to the earnings news, by the ranks of analysts forecasting activities. Following Ball and Brown (968), this study plots mean cumulative excess monthly returns by the sign of earnings news. SAMPLE Data Sources and Sample The analysis is based on USA listed firm year observations from 980 through 200. The principal source of financial data for computing the earnings news (change in earnings) and other financial variables is the COMPUSTAT annual file. The extent of analysts forecasting activities (mean number of forecasts for the fiscal year issued during the fiscal year) is from the FIRSTCALL summary file. Returns are computed using the CRSP monthly stock files. Alternative analyses are presented using different returns measures. Following Ayers and Freeman (997), only December fiscal year end firms with change in earnings before extraordinary items for the prior, current and next fiscal year are considered. This ensures that earnings news, especially for the industry, are well aligned for the observations, and avoids the impact of seasonality on firms fundamentals. The change in earnings is scaled by lagged market value. Like Ayers and Freeman (997), observations with absolute value of earnings news exceeding.5 are dropped. 3 Alternative returns windows were used (not tabulated), but they yielded similar conclusions as reported. (2) Analyst s activities and, page 5
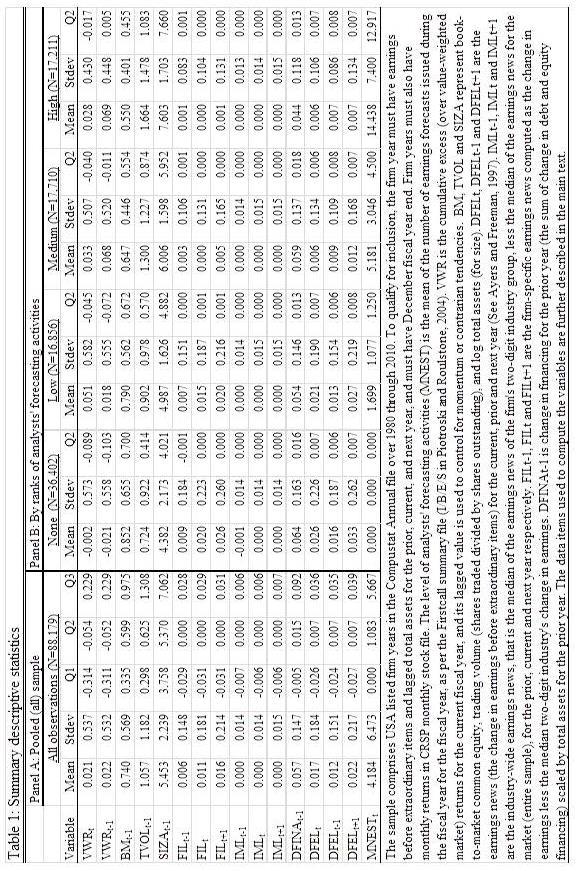
6 Applying the foregoing criteria yields an initial sample of 97,29, but 88,79 of these qualify for final inclusion in the sample after requiring the availability of monthly returns data over the entire fiscal period through the six months of the following period (for the plots). The earnings news (DFEL i,t+τ,τ = -,0,) is the change in earnings before extraordinary items (variable ib ) scaled by lagged market value of common equity (CRSP monthly stock file variable prccd *cshoc/000000). 4 Size (SIZA) is defined as log of total assets (data item at ). Book-to-market (BM) is defined as book value of common equity (data item ceq ) divided by market value of common equity. Trading volume is the number of shares traded (data item cshtr_f ) divided by number of shares outstanding (data item cshoc ). The change in total financing (DFINA) is the sum of the change in equity (data item seq less its lag), and debt financing (sum of data items dlc for current portion of longterm debt + dltt for longterm debt, less the sum of the lagged values), scaled by total assets. Descriptive Statistics I report summary statistics in Table. Panel A of the table pools together the entire sample. Panel B breaks the sample down by the level of analysts forecasting activities. See Table (appendix). From panel A of Table, the mean (0.2) and median (-0.054) excess returns suggest that most firm years earned less than the value-weighted market portfolio but a few have a very high (than the market) return. This is expected because the sample comprises the larger well established firms that have a history of data, and tend to be efficiently priced early on. The book-to-market ratio (0.740 mean, median) is less than one. Similar to Ayers and Freeman (997), the sample has positive mean (0.7, 0.2, 0.22 for DFELt, DFEL t-, and DFEL t+ respectively), and median (0.007, 0.007, 0.007, for DFELt, DFEL t-, and DFEL t+ respectively) total earnings news. Also, as would be expected, the mean and median industry-wide and firm-specific news are zero or almost, since they represent the means and medians of deviations from the median. The panel B of Table shows that the mean (median) number of monthly forecasts issued and revised in the fiscal year for the year, i.e. MNEST, for high, medium and low ranks of MNEST are (2.97), 5.8 (4.500) and.699 (.250) respectively. In that panel, there is no clear pattern as to which category of firms in Panel B earn the most excess (over value-weighted market adjusted) returns, i.e. VWR. The dispersion in returns (Stdev) are similar in all the panels. The variation in the earnings news (DFEL t ) is not clearly different over the levels of analysts forecasting activities. The caution in drawing conclusions here is that multivariate analysis based on multiple regressions for example, are necessary. This is because the maintained hypothesis of this study is that prices impound earnings news at different rates depending on the level of analysts forecasting activities. Book-to-market (trading volume and size) seems to decrease (increase) in analysts forecasting activities. This is consistent with prior research (Hayes, 998; McNichols and O Brien, 997 and Piotroski, 2000). There is no obvious relation between change in financing activities and analysts forecasting activities ranks as per the table. 4 The division by,000,000 converts the market value to the million scale, similar to the financial data. Analyst s activities and, page 6
7 RESULTS Simple Analysis Correlation analyses are reported in Table 2. Only the main test variables are considered. All coefficients are computed using the Pearson approach. See Table 2 (appendix). Most of the correlation coefficients are significant at % or better. The excess returns (VWR) are positively correlated with the industry-wide earnings news (IML) of the prior, current and next year (coefficients of 0.033, 0.32 and respectively). However, coefficients for the correlation between VWR and firm specific news (FIL) of the prior, current and future year are mixed (coefficients of 0.052, and ). The correlation between VWR and FCAF is positive (0.00). However, the correlation between VWR and TFML (interaction between FCAF and IML for all periods), and between VWR and TFFL (interaction between FCAF and FIL for prior and current year) are all positive (0.0, 0.060, 0.030, 0.0 and 0.36), but the coefficient for VWR and TFFL for the future year is These suggest that analysts forecasting activities speed up the incorporation of industry-wide news and to a lesser extent firm-specific earnings news into prices. Further analysis is necessary to ascertain the potential incremental impact of analysts forecasting activities on the returns. The Relation between Excess Returns and the Components of Earnings News The multiple regressions that explain the excess returns using the components of the earnings news are reported in Table 3. These are based on model (2). To mitigate autocorrelation in the variables, yearly regressions are estimated, and then the time series means of the parameters are computed. Each part of the results specifies the model used. See Table 3 (appendix). The first specification in Table 3 is a replication of Ayers and Freeman (997). Consistent with the results in Ayers and Freeman (997), the returns are significantly positively associated with the current industry (slope and 4.246), and the prior and current firm-specific (slopes of and respectively) news. These suggest that the firm-specific news is generally not as speedily impounded in prices as the industry news, so that the prior firm specific news (but not the prior industry news) still explains the current returns, a year after the news is realized. This presents a general opportunity to trade if such news can be predicted early. The earnings news explain about.6% (i.e. AdjRsq of 0.6) of the variations in the excess returns. The second specification goes beyond Ayers and Freeman (997) by modifying the first specification, introducing interaction terms and control variables. The interactions are first between analysts forecasting activities and the industry news (TFML=FCAF*IML), and second between analysts forecasting activities and the firmspecific news (TFFL=FCAF*FIL), for each firm j in periods t-, t, and t+ respectively. They are meant to capture the incremental relation between the industry-wide earnings news and the excess returns as the level of analysts forecasting activities varies. The control variables are drivers of returns that have been identified in prior research. All the parameters (except for IML j,t- with slope of and FIL t+ with slope of -0.80, that Analyst s activities and, page 7
8 become significant) are similarly significant as in the first specification. The extent of analysts forecasting activities (FCAF) is incrementally significant (slope ) in explaining the excess returns, consistent with the conjecture in Piotroski and Roulstone (2004). Of the interaction terms, TFML t+ with slope of 5.23, TFFL t- with slope of , TFFL t with slope of , and TFFL t+ with slope of.9349 are significantly positively associated with VWR. These suggest that analysts forecasting activities are incrementally significant for incorporating future industry news and past, current and future firm-specific news into prices. Still on the second specification, BM is positively associated with returns, suggesting that the book value lags the market in impounding future expectations. However, SIZA is negatively associated with returns, suggesting that big firms impound future news in prices sooner than small firms. The other control variables are not clearly significant. The adjusted R-square is (i.e. 7.38%). Thus, including those return drivers improves on the estimation and supports the original conjectures being tested. These results suggest overall that first, industry-wide news are priced earlier than firm-specific news (corroborating Ayers and Freeman, 997), and second that firms with lower or no analysts forecasting activities delay in pricing earnings news. The returns are explained more by the prior and current period industry earnings news. 5 This part of the analysis has demonstrated the variations in the delay at incorporating the earnings news into prices. However, an earnings prediction approach to returns prediction may not be feasible if the delay does not allow enough time for implementing the strategy. Also, the source of the earnings news for use in predicting the earnings may not be clear, for example where would a fund manager obtain the industrywide earnings news? The following sub-section addresses these questions. The Timing of the Returns Associated With Earnings News I employ graphs similar to those of Ball and Brown (968) to examine the association between returns and the earnings news over time. Figures a through c, present the relation between excess returns and total earnings news. See Figures a through (Appendix). In figure a, the stock prices start impounding the earnings news, both good and bad, from the first month of the fiscal year. Figure b shows that depending on the level of analysts forecasting activities, the prices may impound the earnings news with a different speed. For the firms with positive total good news, the returns are less associated with the current earnings news for the firms with the most forecasting activities, but this association increases as analysts forecasting activities decreases. The relation between the excess returns and the current earnings news for the firms with high analysts forecasting activities (VWRF3_B and VWRF3_G) is weak because analysts are also impounding the future year s earnings news in the prices. Similarly, for the firms with no forecasting activities (VWRF0_B and VWRF0_G), the weak returns association 5 As explained under the methodology section, the analysis was repeated using two different return windows as follows: first the 2 months that end in the third month after the fiscal year end as done in Ayers and Freeman (997), second the 2 months period that ends in the earnings announcement month as done in Ball and Brown (968). Each of those two replications yielded similar results as reported in this study. Analyst s activities and, page 8
9 is because the returns are reacting in part to some of the prior period news. The relation between the returns and forecasting activities for the bad news portfolios (labels ending in B in figure b e.g. VWRF0_B) is not monotone as the plots are not clearly distinguishable for each of the rankings of forecasting activities. To ascertain the implications for returns prediction, figure c presents a plot of the returns to a hedge portfolio that goes long (short) on the good (bad) news firms within each ranking of forecasting activities. For each rank of analysts forecasting activities, the hedge portfolio returns are obtained by subtracting the returns for the bad news from that for the good news firms of Figure b. At the end of the fiscal year (month =0), the hedge portfolio returns increase monotonically from a low of about 22% for the highest rank firms to about 32% for the low rank. The monotone pattern is broken by the portfolio with no analysts forecasting activities which has returns of about 29%. This is partly because the returns are also related to the prior earnings news as well (see Table 3 in the appendix). Thus, assuming all else equal, the potentially profitable portfolios are, in decreasing order, those in the Low, Medium, and then zero forecasting activities. See Figures 2a through 2c (Appendix). Figures 2a through 2c repeat the analysis in figures a through c, but consider the industry-wide earnings news rather than total earnings news, for the current period only. The plot in figure a shows an overreaction (which is stronger for bad news than good news) to industry earnings news. The overreaction reverses, beginning 3 months earlier for good news, and at the end of the year (month=0) for bad news portfolios respectively. This is consistent in part with Thomas and Zhang (2008) who document a widespread overreaction to earlier announcing industry peers earnings news. The returns in these figures (2a through 2c) are not as high as those in figures a through c, because they are the returns to only a part of the total earnings news. The patterns in figures 2a and 2b are similar to those of figures a and b; firms with low and medium forecasting activities earn higher returns to the current industry earnings news than firms with high and no forecasting activities. The differences are attributable to the fact that the no forecasting activities portfolio are reacting in part to the prior industry and firm specific earnings news, and the current firm specific news. The hedge portfolio returns, computed and plotted using a similar approach as c, show that at the year end, the returns decrease monotonically beginning with firms that have low to those with high forecasting activities. The portfolio with no analysts forecasting activities earns higher (lower) returns than for the high (medium) forecasting activities. Figures 3a through 3c repeat the analysis in a through c, but for only the firmspecific (idiosyncratic) earnings news components. The tenor of the results is similar to those for the total earnings news in figures a through c: By the year end (month 0), the portfolio in the highest forecasting activities rank show the least hedge returns (3c). Unlike figures 2a through 2c, there is no evidence of overreaction to firm specific news. See Figures 3a through 3c (Appendix). How Early Does the Market Anticipate a Change in Earnings News The results in Table 3 of this study, and those of Ayers and Freeman (997) show that the returns tend to react to the earnings news of more than one period. The plots in figures a through 3c do not control for the prior and future earnings news so it is not Analyst s activities and, page 9
10 certain on average when precisely the market completes reacting to a given period s news and starts reacting to that of a subsequent period. This is important for determining when to start implementing a trading strategy. For this objective, this study plots the returns to the earnings news, for two adjacent periods (t, through six months into period t+), in figures 4a and 4b. The plots consider the signs of the news for both period t and t+. See Figures 4a through 4c (Appendix). Figure 4a, presents the returns after double sorting by the sign of the news in both period t and t+ for the entire sample. These plots focus on the total earnings news. For example, VWRNN_BB represents the portfolio of firms with bad news in both period t and t+, and VWRNN_BG represents that of firms with bad news in period t but good news in t+. In this figure, the returns to the portfolios for which the sign of the news did not change from period t to period t+ (VWRNN_BB and VWRNN_GG) continue in the same direction from period t to period t+, so, one cannot tell when the reaction to period t news ended and when that for t+ started. For the portfolios with a change in news from period t to period t+ (VWRNN_BG and VWRNN_GB), the excess returns do change in direction. The change is consistent with the change in news, revealing the approximate average timing of when the reaction to period t news ends, and when the reaction to period t+ news starts. The reaction to the good news (VWRNN_BG) starts roughly at the beginning of the year (month=0, i.e. the beginning of year t+, or 2 months to the fiscal year end). However, the reaction to the bad news (VWRNN_GB) starts at around month=-4 (i.e. about 5 months to the beginning of the fiscal year t+, equivalent to 5+2=7months before the fiscal year end). Clearly, bad news is anticipated earlier than good news, and the transition shows the end (start) in the reaction to period t (t+) news. Figure 4b focuses on the portfolios with a change in news, but sorts further by analysts forecasting activities rank. First figure 4b corroborates 4a, that bad news is anticipated earlier than good news. It is apparent from 4b that the high rank (of analysts forecasting activities) portfolio starts impounding the news first, followed by the medium and low ranks. The portfolios that have no analysts forecasts show a clear point in time for the change in returns direction only for the bad news portfolio. Robustness Tests Results of the most important of the various robustness tests conducted in this study are discussed below. First, for model (2), instead of directly interacting the analysts forecasting activities with the earnings news, dummies for the analysts forecasting activities ranks are used and interacted with the earnings news components. For this specification, the results were similar to those in Table 3 based on model (2). Second, this study computes and uses size decile-adjusted returns and also the equally weighted market excess returns. For the size-deciles, firm-years in a given year are ranked into 0 using their year-end market capitalization as of the end of the prior year. This is important because though most studies use the market-adjusted (reported in Table 3 of this study) and size-adjusted returns interchangeably, Ayers and Freeman (997) used the size adjusted returns. The results were quite similar to those reported in Table 3. Analyst s activities and, page 0
11 CONCLUSION This study has examined the association between components of earnings news and returns, and the effect of analysts forecasting activities on the association. The analysis also examines the timing of returns to earnings news. The results show that the returns of firms that are subject to high (low or none at all) forecasting activities tend to be more associated with current and future (current and prior) earnings news. The results also show that the returns of firms in the portfolio that characterizes high analyst forecasting activities tend to incorporate the earnings news faster. Also, the timing of the incorporation of the earnings news is inversely related to the sign of the news (bad news is incorporated earlier). Future research can examine directly the profitability of an earnings prediction approach to fundamental analysis that predicts the earnings of firms with lower analysts forecasting activities and uses these to predict the returns of such firms. Understandably, such a strategy would have to control for transaction costs and beat current or existing trading strategies. REFERENCES Anabila,A.A Improving earnings forecasts using intra-industry information transfers. PhD Dissertation, Columbia University. Anilowski, C., M. Feng and D.J. Skinner Is guidance a macro factor? The nature and information content of aggregate earnings guidance. Working paper. University of Chicago. Ayers B. and R.N. Freeman Market assessment of industry and firm earnings information. Journal of Accounting and Economics. 24: Baber, W. R., J. D. Kim, and K. R. Kumar On the use of intra-industry information to improve earnings forecasts. Journal of Business Finance and Accounting 26 (November/December): Ball, R., and Brown, P An empirical evaluation of accounting income numbers. Journal of Accounting Research 6: Bradshaw, M. T., S. A. Richardson and R. G. Sloan The relation between corporate financing activities, analysts forecasts and stock returns. Working paper, University of Michigan Brown, L Earnings forecasting research: Its implications for capital markets research. International Journal of Forecasting 9: Brown, P., and R. Ball Some preliminary findings on the association between the earnings of a firm, its industry, and the economy. Journal of Accounting Research Supplement: Elgers P. T., M.H. Lo and R. J. Pfeiffer Delayed security price adjustments to financial analysts forecasts of annual earnings. The Accounting Review 76 (4): Hayes, R The impact of trading commission incentives on analysts stock coverage decisions and earnings forecasts. Journal of Accounting Research 36 (Autumn): Magee, R. P Industry-wide commonalities in earnings. Journal of Accounting Research 2 (Autumn): McNichols, M., and P. O Brien Self-selection and analysts coverage. Journal of Accounting Research 35 (Supplement): Analyst s activities and, page
12 Piotroski, J. D Value investing: The use of historical financial statement information to separate winners from losers. Journal of Accounting Research 38 (Supplement): -4. Piotroski, J. D. and D. T. Roulstone The influence of analysts, institutional investors, and insiders on the incorporation of market, industry, and firm-specific information into stock prices. The Accounting Review 79 (4): 9-5. Ramnath, S Investor and analyst reactions to earnings announcements of related firms: An empirical analysis. Journal of Accounting Research 40 (December): Thomas, J., and F. Zhang Overreaction to intra-industry information transfers? Journal of Accounting Research 46 (4): Analyst s activities and, page 2

13 Analyst s activities and, page 3

14 Analyst s activities and, page 4
15 Table 3: Regression of excess returns on earnings news Dependent VWR (Excess over value-weighted market returns) Variable Slope t-val p-val Slope t-val p-val Intercept IML t IML t IML t FIL t FIL t FIL t FCAF t TFML t TFML t TFML t TFFL t TFFL t TFFL t BM t TVOL t SIZA t DFINA t VWR t AdjRsq N (Years) 3 3 This table reports the results from regressions of cumulative excess (over value-weighted market) returns on industry-wide and firm-specific components of earnings news, and the interaction of such news with the level of analysts' forecasting activities. The returns are cumulated over the fiscal year. The parameters reported in this table are based on the mean for the annual regressions over the 3 years from 980 through 200. All variables are defined in Tables and 2. The total number of firm year observations is 88,79, varying between,662 in 980 and 3,000 in Variance Inflation Factors were computed along with the regression and these were found to have averages below 4 for each of all the independent variables over all the years. VWR i, t IML j, t FILi, t * FCAF i, t FCAF i, t * FCAF i, t * FIL j, t BM i, t TVOLi, t SIZAi, t DFINAi, t VWRit (2) i, t IML j, t Analyst s activities and, page 5

16 Analyst s activities and, page 6
17 Analyst s activities and, page 7
18 Analyst s activities and, page 8
19 Excess returns Excess returns Journal of Finance and Accountancy Figure 4a: Excess returns to total earnings news for years t, t Months to fiscal year t end VWRNN_BB VWRNN_BG VWRNN_GB VWRNN_GG Figure 4b: Excess returns to change in sign (e.g. good to bad), over years t to t+) of total earnings news, by analysts' forecasting actitivies rank VWRF0_BG VWRF0_GB VWRF_BG VWRF_GB VWRF2_BG VWRF2_GB VWRF3_BG VWRF3_GB Months to fiscal year t end Figures 4a and 4b: These present the returns to total earnings news of two adjacent periods (t and t+). Figure 4a plots the mean cumulative excess returns for the whole sample by the sign of news in both year t and t+ (e.g. VWRNN_BB for Bad news in t and t+, VWRNN_BG for Bad in t, Good in t+). Figure 4b considers only "change in news" portfolios, (i.e. the VWRNN_BG and VWRNN_GB from 4a), but breaks these by analysts forecasting activities F"i", where i ϵ {0 for no analysts, for low, 2 for medium, 3 for high}. Earnings news is defined as the change in earnings before extraordinary items, scaled by lagged total assets. See Table for the number of analysts forecasts associated with each of the rankings of analysts forecasting activities (F"i"). Analyst s activities and, page 9
Online Appendix to. The Value of Crowdsourced Earnings Forecasts
 Online Appendix to The Value of Crowdsourced Earnings Forecasts This online appendix tabulates and discusses the results of robustness checks and supplementary analyses mentioned in the paper. A1. Estimating
Stock price synchronicity and the role of analyst: Do analysts generate firm-specific vs. market-wide information?
 Stock price synchronicity and the role of analyst: Do analysts generate firm-specific vs. market-wide information? Yongsik Kim * Abstract This paper provides empirical evidence that analysts generate firm-specific
The Effect of Matching on Firm Earnings Components
 Scientific Annals of Economics and Business 64 (4), 2017, 513-524 DOI: 10.1515/saeb-2017-0033 The Effect of Matching on Firm Earnings Components Joong-Seok Cho *, Hyung Ju Park ** Abstract Using a sample
Pricing and Mispricing in the Cross Section
 Pricing and Mispricing in the Cross Section D. Craig Nichols Whitman School of Management Syracuse University James M. Wahlen Kelley School of Business Indiana University Matthew M. Wieland J.M. Tull School
Volatility Appendix. B.1 Firm-Specific Uncertainty and Aggregate Volatility
 B Volatility Appendix The aggregate volatility risk explanation of the turnover effect relies on three empirical facts. First, the explanation assumes that firm-specific uncertainty comoves with aggregate
Core CFO and Future Performance. Abstract
 Core CFO and Future Performance Rodrigo S. Verdi Sloan School of Management Massachusetts Institute of Technology 50 Memorial Drive E52-403A Cambridge, MA 02142 rverdi@mit.edu Abstract This paper investigates
What Drives the Earnings Announcement Premium?
 What Drives the Earnings Announcement Premium? Hae mi Choi Loyola University Chicago This study investigates what drives the earnings announcement premium. Prior studies have offered various explanations
The Post Forecast Revision Drift and Underreaction to Industry-Wide and/or Firm-Specific Earnings
 The Post Forecast Revision Drift and Underreaction to Industry-Wide and/or Firm-Specific Earnings Kai Wai Hui Department of Accounting Hong Kong University of Science and Technology Clear Water Bay, Kowloon,
Post-Earnings-Announcement Drift: The Role of Revenue Surprises and Earnings Persistence
 Post-Earnings-Announcement Drift: The Role of Revenue Surprises and Earnings Persistence Joshua Livnat Department of Accounting Stern School of Business Administration New York University 311 Tisch Hall
Yale ICF Working Paper No March 2003
 Yale ICF Working Paper No. 03-07 March 2003 CONSERVATISM AND CROSS-SECTIONAL VARIATION IN THE POST-EARNINGS- ANNOUNCEMENT-DRAFT Ganapathi Narayanamoorthy Yale School of Management This paper can be downloaded
The cross section of expected stock returns
 The cross section of expected stock returns Jonathan Lewellen Dartmouth College and NBER This version: March 2013 First draft: October 2010 Tel: 603-646-8650; email: jon.lewellen@dartmouth.edu. I am grateful
Do Investors Fully Understand the Implications of the Persistence of Revenue and Expense Surprises for Future Prices?
 Do Investors Fully Understand the Implications of the Persistence of Revenue and Expense Surprises for Future Prices? Narasimhan Jegadeesh Dean s Distinguished Professor Goizueta Business School Emory
Positive Correlation between Systematic and Idiosyncratic Volatilities in Korean Stock Return *
 Seoul Journal of Business Volume 24, Number 1 (June 2018) Positive Correlation between Systematic and Idiosyncratic Volatilities in Korean Stock Return * KYU-HO BAE **1) Seoul National University Seoul,
Interactions between Analyst and Management Earnings Forecasts: The Roles of Financial and Non-Financial Information
 Interactions between Analyst and Management Earnings Forecasts: The Roles of Financial and Non-Financial Information Lawrence D. Brown Seymour Wolfbein Distinguished Professor Department of Accounting
Insider Trading Filing and Intra-Industry Information Transfer 1
 Insider Trading Filing and Intra-Industry Information Transfer 1 Renhui (Michael) Fu Purdue University Darren T. Roulstone Ohio State University November 2013 This paper examines whether insider trading
Another Look at Market Responses to Tangible and Intangible Information
 Critical Finance Review, 2016, 5: 165 175 Another Look at Market Responses to Tangible and Intangible Information Kent Daniel Sheridan Titman 1 Columbia Business School, Columbia University, New York,
Liquidity Variation and the Cross-Section of Stock Returns *
 Liquidity Variation and the Cross-Section of Stock Returns * Fangjian Fu Singapore Management University Wenjin Kang National University of Singapore Yuping Shao National University of Singapore Abstract
Asubstantial portion of the academic
 The Decline of Informed Trading in the Equity and Options Markets Charles Cao, David Gempesaw, and Timothy Simin Charles Cao is the Smeal Chair Professor of Finance in the Smeal College of Business at
The Journal of Applied Business Research January/February 2013 Volume 29, Number 1
 Stock Price Reactions To Debt Initial Public Offering Announcements Kelly Cai, University of Michigan Dearborn, USA Heiwai Lee, University of Michigan Dearborn, USA ABSTRACT We examine the valuation effect
Post-Earnings-Announcement Drift (PEAD): The Role of Revenue Surprises
: The Role of Revenue Surprises") Post-Earnings-Announcement Drift (PEAD): The Role of Revenue Surprises Joshua Livnat Department of Accounting Stern School of Business Administration New York University 311 Tisch Hall 40 W. 4th St. New
Post-Earnings-Announcement Drift (PEAD): The Role of Revenue Surprises Joshua Livnat Department of Accounting Stern School of Business Administration New York University 311 Tisch Hall 40 W. 4th St. New
Evaluating the accrual-fixation hypothesis as an explanation for the accrual anomaly
 Evaluating the accrual-fixation hypothesis as an explanation for the accrual anomaly Tzachi Zach * Olin School of Business Washington University in St. Louis St. Louis, MO 63130 Tel: (314)-9354528 zach@olin.wustl.edu
Discussion Paper No. DP 07/02
 SCHOOL OF ACCOUNTING, FINANCE AND MANAGEMENT Essex Finance Centre Can the Cross-Section Variation in Expected Stock Returns Explain Momentum George Bulkley University of Exeter Vivekanand Nawosah University
Hedge Funds as International Liquidity Providers: Evidence from Convertible Bond Arbitrage in Canada
 Hedge Funds as International Liquidity Providers: Evidence from Convertible Bond Arbitrage in Canada Evan Gatev Simon Fraser University Mingxin Li Simon Fraser University AUGUST 2012 Abstract We examine
Appendix. In this Appendix, we present the construction of variables, data source, and some empirical procedures.
 Appendix In this Appendix, we present the construction of variables, data source, and some empirical procedures. A.1. Variable Definition and Data Source Variable B/M CAPX/A Cash/A Cash flow volatility
The Comovements Along the Term Structure of Oil Forwards in Periods of High and Low Volatility: How Tight Are They?
 The Comovements Along the Term Structure of Oil Forwards in Periods of High and Low Volatility: How Tight Are They? Massimiliano Marzo and Paolo Zagaglia This version: January 6, 29 Preliminary: comments
Dispersion in Analysts Target Prices and Stock Returns
 Dispersion in Analysts Target Prices and Stock Returns Hongrui Feng Shu Yan January 2016 Abstract We propose the dispersion in analysts target prices as a new measure of disagreement among stock analysts.
Deviations from Optimal Corporate Cash Holdings and the Valuation from a Shareholder s Perspective
 Deviations from Optimal Corporate Cash Holdings and the Valuation from a Shareholder s Perspective Zhenxu Tong * University of Exeter Abstract The tradeoff theory of corporate cash holdings predicts that
A Synthesis of Accrual Quality and Abnormal Accrual Models: An Empirical Implementation
 A Synthesis of Accrual Quality and Abnormal Accrual Models: An Empirical Implementation Jinhan Pae a* a Korea University Abstract Dechow and Dichev s (2002) accrual quality model suggests that the Jones
Real Estate Ownership by Non-Real Estate Firms: The Impact on Firm Returns
 Real Estate Ownership by Non-Real Estate Firms: The Impact on Firm Returns Yongheng Deng and Joseph Gyourko 1 Zell/Lurie Real Estate Center at Wharton University of Pennsylvania Prepared for the Corporate
The Effect of Kurtosis on the Cross-Section of Stock Returns
 Utah State University DigitalCommons@USU All Graduate Plan B and other Reports Graduate Studies 5-2012 The Effect of Kurtosis on the Cross-Section of Stock Returns Abdullah Al Masud Utah State University
A Replication Study of Ball and Brown (1968): Comparative Analysis of China and the US *
: Comparative Analysis of China and the US *") DOI 10.7603/s40570-014-0007-1 66 2014 年 6 月第 16 卷第 2 期 中国会计与财务研究 C h i n a A c c o u n t i n g a n d F i n a n c e R e v i e w Volume 16, Number 2 June 2014 A Replication Study of Ball and Brown (1968):
DOI 10.7603/s40570-014-0007-1 66 2014 年 6 月第 16 卷第 2 期 中国会计与财务研究 C h i n a A c c o u n t i n g a n d F i n a n c e R e v i e w Volume 16, Number 2 June 2014 A Replication Study of Ball and Brown (1968):
The predictive power of investment and accruals
 The predictive power of investment and accruals Jonathan Lewellen Dartmouth College and NBER jon.lewellen@dartmouth.edu Robert J. Resutek Dartmouth College robert.j.resutek@dartmouth.edu This version:
INTRA-INDUSTRY REACTIONS TO STOCK SPLIT ANNOUNCEMENTS. Abstract. I. Introduction
 The Journal of Financial Research Vol. XXV, No. 1 Pages 39 57 Spring 2002 INTRA-INDUSTRY REACTIONS TO STOCK SPLIT ANNOUNCEMENTS Oranee Tawatnuntachai Penn State Harrisburg Ranjan D Mello Wayne State University
Earnings Announcement Idiosyncratic Volatility and the Crosssection
 Earnings Announcement Idiosyncratic Volatility and the Crosssection of Stock Returns Cameron Truong Monash University, Melbourne, Australia February 2015 Abstract We document a significant positive relation
A Portrait of Hedge Fund Investors: Flows, Performance and Smart Money
 A Portrait of Hedge Fund Investors: Flows, Performance and Smart Money Guillermo Baquero and Marno Verbeek RSM Erasmus University Rotterdam, The Netherlands mverbeek@rsm.nl www.surf.to/marno.verbeek FRB
The Consistency between Analysts Earnings Forecast Errors and Recommendations
 The Consistency between Analysts Earnings Forecast Errors and Recommendations by Lei Wang Applied Economics Bachelor, United International College (2013) and Yao Liu Bachelor of Business Administration,
An analysis of momentum and contrarian strategies using an optimal orthogonal portfolio approach
 An analysis of momentum and contrarian strategies using an optimal orthogonal portfolio approach Hossein Asgharian and Björn Hansson Department of Economics, Lund University Box 7082 S-22007 Lund, Sweden
Have Earnings Announcements Lost Information Content? Manuscript Steve Buchheit
 Have Earnings Announcements Lost Information Content? Manuscript 0814-1-2 Steve Buchheit University of Houston College of Business Administration Department of Accountancy and Taxation Houston TX, 77204-6283
Analyst Characteristics and the Timing of Forecast Revision
 Analyst Characteristics and the Timing of Forecast Revision YONGTAE KIM* Leavey School of Business Santa Clara University Santa Clara, CA 95053-0380 MINSUP SONG Sogang Business School Sogang University
Online Appendix Results using Quarterly Earnings and Long-Term Growth Forecasts
 Online Appendix Results using Quarterly Earnings and Long-Term Growth Forecasts We replicate Tables 1-4 of the paper relating quarterly earnings forecasts (QEFs) and long-term growth forecasts (LTGFs)
Forecasting Analysts Forecast Errors. Jing Liu * and. Wei Su Mailing Address:
 Forecasting Analysts Forecast Errors By Jing Liu * jiliu@anderson.ucla.edu and Wei Su wsu@anderson.ucla.edu Mailing Address: 110 Westwood Plaza, Suite D403 Anderson School of Management University of California,
A Lottery Demand-Based Explanation of the Beta Anomaly. Online Appendix
 A Lottery Demand-Based Explanation of the Beta Anomaly Online Appendix Section I provides details of the calculation of the variables used in the paper. Section II examines the robustness of the beta anomaly.
LIQUIDITY EXTERNALITIES OF CONVERTIBLE BOND ISSUANCE IN CANADA
 LIQUIDITY EXTERNALITIES OF CONVERTIBLE BOND ISSUANCE IN CANADA by Brandon Lam BBA, Simon Fraser University, 2009 and Ming Xin Li BA, University of Prince Edward Island, 2008 THESIS SUBMITTED IN PARTIAL
Decimalization and Illiquidity Premiums: An Extended Analysis
 Utah State University DigitalCommons@USU All Graduate Plan B and other Reports Graduate Studies 5-2015 Decimalization and Illiquidity Premiums: An Extended Analysis Seth E. Williams Utah State University
`Tis the Season for Earnings! Analysis of Information Spillovers in Earnings Seasons
 `Tis the Season for Earnings! Analysis of Information Spillovers in Earnings Seasons Curtis Hall University of Arizona email: curtish@email.arizona.edu Jayanthi Sunder University of Arizona email: jayanthisunder@email.arizona.edu
The Trend in Firm Profitability and the Cross Section of Stock Returns
 The Trend in Firm Profitability and the Cross Section of Stock Returns Ferhat Akbas School of Business University of Kansas 785-864-1851 Lawrence, KS 66045 akbas@ku.edu Chao Jiang School of Business University
Analysts and Anomalies ψ
 Analysts and Anomalies ψ Joseph Engelberg R. David McLean and Jeffrey Pontiff October 25, 2016 Abstract Forecasted returns based on analysts price targets are highest (lowest) among the stocks that anomalies
Problem Set on Earnings Announcements (219B, Spring 2007)
") Problem Set on Earnings Announcements (219B, Spring 2007) Stefano DellaVigna April 24, 2007 1 Introduction This problem set introduces you to earnings announcement data and the response of stocks to the
Problem Set on Earnings Announcements (219B, Spring 2007) Stefano DellaVigna April 24, 2007 1 Introduction This problem set introduces you to earnings announcement data and the response of stocks to the
Do Investors Value Dividend Smoothing Stocks Differently? Internet Appendix
 Do Investors Value Dividend Smoothing Stocks Differently? Internet Appendix Yelena Larkin, Mark T. Leary, and Roni Michaely April 2016 Table I.A-I In table I.A-I we perform a simple non-parametric analysis
Elisabetta Basilico and Tommi Johnsen. Disentangling the Accruals Mispricing in Europe: Is It an Industry Effect? Working Paper n.
 Elisabetta Basilico and Tommi Johnsen Disentangling the Accruals Mispricing in Europe: Is It an Industry Effect? Working Paper n. 5/2014 April 2014 ISSN: 2239-2734 This Working Paper is published under
A Multifactor Explanation of Post-Earnings Announcement Drift
 JOURNAL OF FINANCIAL AND QUANTITATIVE ANALYSIS VOL. 38, NO. 2, JUNE 2003 COPYRIGHT 2003, SCHOOL OF BUSINESS ADMINISTRATION, UNIVERSITY OF WASHINGTON, SEATTLE, WA 98195 A Multifactor Explanation of Post-Earnings
Seasonal Analysis of Abnormal Returns after Quarterly Earnings Announcements
 Seasonal Analysis of Abnormal Returns after Quarterly Earnings Announcements Dr. Iqbal Associate Professor and Dean, College of Business Administration The Kingdom University P.O. Box 40434, Manama, Bahrain
Eli Amir ab, Eti Einhorn a & Itay Kama a a Recanati Graduate School of Business Administration,
 This article was downloaded by: [Tel Aviv University] On: 18 December 2013, At: 02:20 Publisher: Routledge Informa Ltd Registered in England and Wales Registered Number: 1072954 Registered office: Mortimer
Abnormal Audit Fees and Stock Price Synchronicity: Iranian Evidence
 Abnormal Audit Fees and Stock Price Synchronicity: Iranian Evidence Mikaeil Mansouri Serenjianeh Accounting Department, University of Kurdistan, Kurdistan, Iran E-mail: mmansouri64@yahoo.com Nasrollah
Accounting information uncertainty: Evidence from company fiscal year changes
 Accounting information uncertainty: Evidence from company fiscal year changes ABSTRACT Huabing (Barbara) Wang West Texas A&M University By utilizing a sample of companies that have changed fiscal year
April 13, Abstract
 R 2 and Momentum Kewei Hou, Lin Peng, and Wei Xiong April 13, 2005 Abstract This paper examines the relationship between price momentum and investors private information, using R 2 -based information measures.
Investor protection and the information content of annual earnings announcements: International evidence
 Investor protection and the information content of annual earnings announcements: International evidence Pages 37-67 Mark DeFond, Mingyi Hung and Robert Trezevant Abstract We draw on the investor protection
Margaret Kim of School of Accountancy
 Distinguished Lecture Series School of Accountancy W. P. Carey School of Business Arizona State University Margaret Kim of School of Accountancy W.P. Carey School of Business Arizona State University will
Foreign Fund Flows and Asset Prices: Evidence from the Indian Stock Market
 Foreign Fund Flows and Asset Prices: Evidence from the Indian Stock Market ONLINE APPENDIX Viral V. Acharya ** New York University Stern School of Business, CEPR and NBER V. Ravi Anshuman *** Indian Institute
Investors Opinion Divergence and Post-Earnings Announcement Drift in REITs
 Investors Opinion Divergence and Post-Earnings Announcement Drift in REITs Gow-Cheng Huang Department of International Finance International College I-Shou University Kaohsiung City 84001 Taiwan, R.O.C
Investor Uncertainty and the Earnings-Return Relation
 Investor Uncertainty and the Earnings-Return Relation Dissertation Proposal Defended: December 3, 2004 Kenneth J. Reichelt Ph.D. Candidate School of Accountancy University of Missouri Columbia Columbia,
Earnings Announcements, Analyst Forecasts, and Trading Volume *
 Seoul Journal of Business Volume 19, Number 2 (December 2013) Earnings Announcements, Analyst Forecasts, and Trading Volume * Minsup Song **1) Sogang Business School Sogang University Abstract Empirical
Electricity Usage, Future Earnings, and Stock Prices
 Electricity Usage, Future Earnings, and Stock Prices Bok Baik Jungmin Kim Woojin Kim College of Business Administration Seoul National University April, 2016 Electricity Usage, Future Earnings, and Stock
Gross Profit Surprises and Future Stock Returns. Peng-Chia Chiu The Chinese University of Hong Kong
 Gross Profit Surprises and Future Stock Returns Peng-Chia Chiu The Chinese University of Hong Kong chiupc@cuhk.edu.hk Tim Haight Loyola Marymount University thaight@lmu.edu October 2014 Abstract We show
Contrarian Trades and Disposition Effect: Evidence from Online Trade Data. Abstract
 Contrarian Trades and Disposition Effect: Evidence from Online Trade Data Hayato Komai a Ryota Koyano b Daisuke Miyakawa c Abstract Using online stock trading records in Japan for 461 individual investors
THE DETERMINANTS AND VALUE OF CASH HOLDINGS: EVIDENCE FROM LISTED FIRMS IN INDIA
 THE DETERMINANTS AND VALUE OF CASH HOLDINGS: EVIDENCE FROM LISTED FIRMS IN INDIA A Doctoral Dissertation Submitted in Partial Fulfillment of the Requirements for the Fellow Programme in Management Indian
The Implications of Using Stock-Split Adjusted I/B/E/S Data in Empirical Research
 The Implications of Using Stock-Split Adjusted I/B/E/S Data in Empirical Research Jeff L. Payne Gatton College of Business and Economics University of Kentucky Lexington, KY 40507, USA and Wayne B. Thomas
Determinants and consequences of intra-year error in annual effective tax rate estimates
 Boston University OpenBU Theses & Dissertations http://open.bu.edu Boston University Theses & Dissertations 2015 Determinants and consequences of intra-year error in annual effective tax rate estimates
Asymmetries in the Persistence and Pricing of Cash Flows
 Asymmetries in the Persistence and Pricing of Cash Flows Georgios Papanastasopoulos University of Piraeus, Department of Business Administration email: papanast@unipi.gr Asymmetries in the Persistence
Heterogeneous Beliefs and Momentum Profits
 JOURNAL OF FINANCIAL AND QUANTITATIVE ANALYSIS Vol. 44, No. 4, Aug. 2009, pp. 795 822 COPYRIGHT 2009, MICHAEL G. FOSTER SCHOOL OF BUSINESS, UNIVERSITY OF WASHINGTON, SEATTLE, WA 98195 doi:10.1017/s0022109009990214
Price, Earnings, and Revenue Momentum Strategies
 Price, Earnings, and Revenue Momentum Strategies Hong-Yi Chen Rutgers University, USA Sheng-Syan Chen National Taiwan University, Taiwan Chin-Wen Hsin Yuan Ze University, Taiwan Cheng-Few Lee Rutgers University,
AN ALTERNATIVE THREE-FACTOR MODEL FOR INTERNATIONAL MARKETS: EVIDENCE FROM THE EUROPEAN MONETARY UNION
 AN ALTERNATIVE THREE-FACTOR MODEL FOR INTERNATIONAL MARKETS: EVIDENCE FROM THE EUROPEAN MONETARY UNION MANUEL AMMANN SANDRO ODONI DAVID OESCH WORKING PAPERS ON FINANCE NO. 2012/2 SWISS INSTITUTE OF BANKING
Pricing and Mispricing in the Cross-Section
 Pricing and Mispricing in the Cross-Section D. Craig Nichols Whitman School of Management Syracuse University James M. Wahlen Kelley School of Business Indiana University Matthew M. Wieland Kelley School
Journal of Banking & Finance
 Journal of Banking & Finance 33 (2009) 308 316 Contents lists available at ScienceDirect Journal of Banking & Finance journal homepage: www.elsevier.com/locate/jbf Block ownership and firm-specific information
Does portfolio manager ownership affect fund performance? Finnish evidence
 Does portfolio manager ownership affect fund performance? Finnish evidence April 21, 2009 Lia Kumlin a Vesa Puttonen b Abstract By using a unique dataset of Finnish mutual funds and fund managers, we investigate
Online Appendix for Overpriced Winners
 Online Appendix for Overpriced Winners A Model: Who Gains and Who Loses When Divergence-of-Opinion is Resolved? In the baseline model, the pessimist s gain or loss is equal to her shorting demand times
Analysts long-term earnings growth forecasts and past firm growth
 Analysts long-term earnings growth forecasts and past firm growth Abstract Several previous studies show that consensus analysts long-term earnings growth forecasts are excessively influenced by past firm
The Role of Accounting Accruals in Chinese Firms *
 10.7603/s40570-014-0011-5 148 2014 年 6 月第 16 卷第 2 期 中国会计与财务研究 C h i n a A c c o u n t i n g a n d F i n a n c e R e v i e w Volume 16, Number 2 June 2014 The Role of Accounting Accruals in Chinese Firms
Can Hedge Funds Time the Market?
 International Review of Finance, 2017 Can Hedge Funds Time the Market? MICHAEL W. BRANDT,FEDERICO NUCERA AND GIORGIO VALENTE Duke University, The Fuqua School of Business, Durham, NC LUISS Guido Carli
DETERMINING THE EFFECT OF POST-EARNINGS-ANNOUNCEMENT DRIFT ON VARYING DEGREES OF EARNINGS SURPRISE MAGNITUDE TOM SCHNEIDER ( ) Abstract
 Abstract") DETERMINING THE EFFECT OF POST-EARNINGS-ANNOUNCEMENT DRIFT ON VARYING DEGREES OF EARNINGS SURPRISE MAGNITUDE TOM SCHNEIDER (20157803) Abstract In this paper I explore signal detection theory (SDT) as an
DETERMINING THE EFFECT OF POST-EARNINGS-ANNOUNCEMENT DRIFT ON VARYING DEGREES OF EARNINGS SURPRISE MAGNITUDE TOM SCHNEIDER (20157803) Abstract In this paper I explore signal detection theory (SDT) as an
Ulaş ÜNLÜ Assistant Professor, Department of Accounting and Finance, Nevsehir University, Nevsehir / Turkey.
 Size, Book to Market Ratio and Momentum Strategies: Evidence from Istanbul Stock Exchange Ersan ERSOY* Assistant Professor, Faculty of Economics and Administrative Sciences, Department of Business Administration,
A Comparison of the Results in Barber, Odean, and Zhu (2006) and Hvidkjaer (2006)
 and Hvidkjaer (2006)") A Comparison of the Results in Barber, Odean, and Zhu (2006) and Hvidkjaer (2006) Brad M. Barber University of California, Davis Soeren Hvidkjaer University of Maryland Terrance Odean University of California,
A Comparison of the Results in Barber, Odean, and Zhu (2006) and Hvidkjaer (2006) Brad M. Barber University of California, Davis Soeren Hvidkjaer University of Maryland Terrance Odean University of California,
Conflict in Whispers and Analyst Forecasts: Which One Should Be Your Guide?
 Abstract Conflict in Whispers and Analyst Forecasts: Which One Should Be Your Guide? Janis K. Zaima and Maretno Agus Harjoto * San Jose State University This study examines the market reaction to conflicts
The Free Cash Flow Effects of Capital Expenditure Announcements. Catherine Shenoy and Nikos Vafeas* Abstract
 The Free Cash Flow Effects of Capital Expenditure Announcements Catherine Shenoy and Nikos Vafeas* Abstract In this paper we study the market reaction to capital expenditure announcements in the backdrop
Underreaction to Industry-Wide Earnings and the Post-Forecast Revision Drift
 DOI: 10.1111/1475-679X.12006 Journal of Accounting Research Vol. 00 No. 0 2013 Printed in U.S.A. Underreaction to Industry-Wide Earnings and the Post-Forecast Revision Drift KAI WAI HUI AND P. ERIC YEUNG
THE OPTION MARKET S ANTICIPATION OF INFORMATION CONTENT IN EARNINGS ANNOUNCEMENTS
 THE OPTION MARKET S ANTICIPATION OF INFORMATION CONTENT IN EARNINGS ANNOUNCEMENTS - New York University Robert Jennings - Indiana University October 23, 2010 Research question How does information content
Shareholder-Level Capitalization of Dividend Taxes: Additional Evidence from Earnings Announcement Period Returns
 Shareholder-Level Capitalization of Dividend Taxes: Additional Evidence from Earnings Announcement Period Returns John D. Schatzberg * University of New Mexico Craig G. White University of New Mexico Robert
Managerial compensation and the threat of takeover
 Journal of Financial Economics 47 (1998) 219 239 Managerial compensation and the threat of takeover Anup Agrawal*, Charles R. Knoeber College of Management, North Carolina State University, Raleigh, NC
ALTERNATIVE MOMENTUM STRATEGIES. Faculdade de Economia da Universidade do Porto Rua Dr. Roberto Frias Porto Portugal
 FINANCIAL MARKETS ALTERNATIVE MOMENTUM STRATEGIES António de Melo da Costa Cerqueira, amelo@fep.up.pt, Faculdade de Economia da UP Elísio Fernando Moreira Brandão, ebrandao@fep.up.pt, Faculdade de Economia
Evidence of conditional conservatism: fact or artifact? Panos N. Patatoukas Yale University
 Evidence of conditional conservatism: fact or artifact? Panos N. Patatoukas Yale University panagiotis.patatoukas@yale.edu Jacob Thomas Yale University jake.thomas@yale.edu Current Version: October 5,
CAPITAL STRUCTURE AND THE 2003 TAX CUTS Richard H. Fosberg
 CAPITAL STRUCTURE AND THE 2003 TAX CUTS Richard H. Fosberg William Paterson University, Deptartment of Economics, USA. KEYWORDS Capital structure, tax rates, cost of capital. ABSTRACT The main purpose
How Markets React to Different Types of Mergers
 How Markets React to Different Types of Mergers By Pranit Chowhan Bachelor of Business Administration, University of Mumbai, 2014 And Vishal Bane Bachelor of Commerce, University of Mumbai, 2006 PROJECT
The Journal of Applied Business Research March/April 2015 Volume 31, Number 2
 Accounting Conservatism, Changes In Real Investment, And Analysts Earnings Forecasts Kyong Soo Choi, Keimyung University, South Korea Se Joong Lee, Ph.D student, The University of Hong Kong, Hong Kong
An Online Appendix of Technical Trading: A Trend Factor
 An Online Appendix of Technical Trading: A Trend Factor In this online appendix, we provide a comparative static analysis of the theoretical model as well as further robustness checks on the trend factor.
Are Firms in Boring Industries Worth Less?
 Are Firms in Boring Industries Worth Less? Jia Chen, Kewei Hou, and René M. Stulz* January 2015 Abstract Using theories from the behavioral finance literature to predict that investors are attracted to
Capital allocation in Indian business groups
 Capital allocation in Indian business groups Remco van der Molen Department of Finance University of Groningen The Netherlands This version: June 2004 Abstract The within-group reallocation of capital
Journal Of Financial And Strategic Decisions Volume 10 Number 2 Summer 1997 AN ANALYSIS OF VALUE LINE S ABILITY TO FORECAST LONG-RUN RETURNS
 Journal Of Financial And Strategic Decisions Volume 10 Number 2 Summer 1997 AN ANALYSIS OF VALUE LINE S ABILITY TO FORECAST LONG-RUN RETURNS Gary A. Benesh * and Steven B. Perfect * Abstract Value Line
Optimal Debt-to-Equity Ratios and Stock Returns
 Utah State University DigitalCommons@USU All Graduate Plan B and other Reports Graduate Studies 5-2014 Optimal Debt-to-Equity Ratios and Stock Returns Courtney D. Winn Utah State University Follow this
Does Transparency Increase Takeover Vulnerability?
 Does Transparency Increase Takeover Vulnerability? Finance Working Paper N 570/2018 July 2018 Lifeng Gu University of Hong Kong Dirk Hackbarth Boston University, CEPR and ECGI Lifeng Gu and Dirk Hackbarth
ONLINE APPENDIX. Do Individual Currency Traders Make Money?
 ONLINE APPENDIX Do Individual Currency Traders Make Money? 5.7 Robustness Checks with Second Data Set The performance results from the main data set, presented in Panel B of Table 2, show that the top