Monthly Stock Index Review
|
|
|
- Evelyn Sullivan
- 5 years ago
- Views:
Transcription
1 EQUITY October 2013 Monthly Stock Index Review A Global Trading Summary of Stock Index Futures and Options» Highlights» Stats At-a-Glance» ADVs» 20-Day Historical Volatilities» Index Sector Weightings» Index and Sector Correlations How the world advances


2 Find the latest information and strategies you need to manage your global equity exposure. Equity Index Futures and Options on Futures View comprehensive information on our global portfolio of benchmark equity index futures and options on futures Learn the latest solutions for your risk-management and execution needs using our products Capitalize on analytical tools and educational resources Access the latest volumes, open interest and opportunities related to volatility, index correlations, price returns and sector weightings For more information visit cmegroup.com/equities.
 futures averaged 151,340 contracts per day, up 33% vs.")
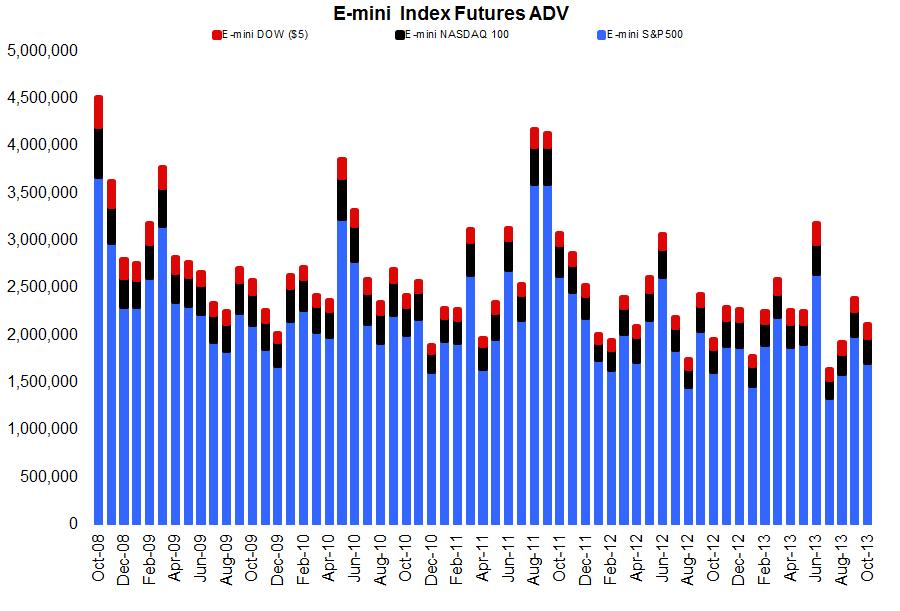
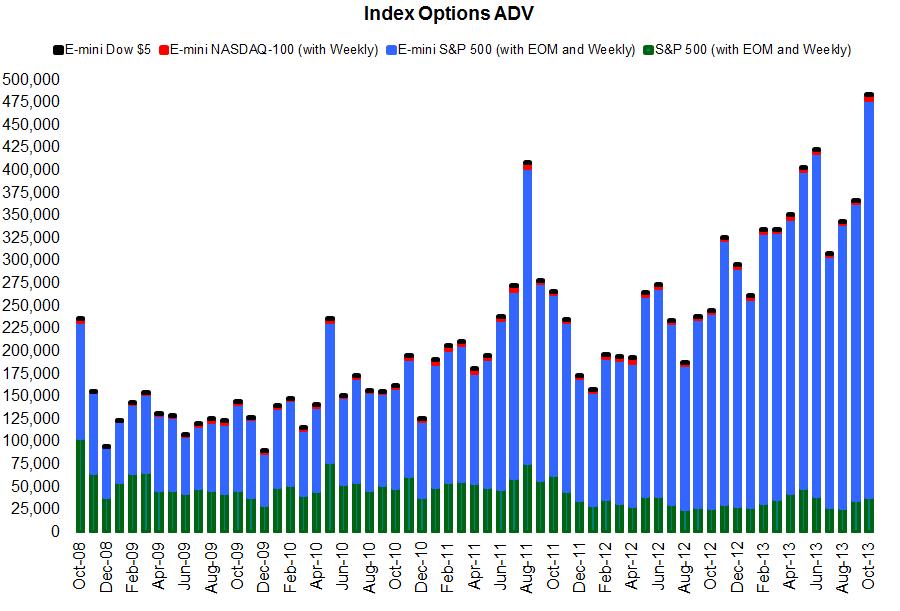
3 Monthly Stock Index Update HIGHLIGHTS October 2013 FUTURES E-mini S&P 500 futures averaged 1,698,660 contracts per day, up 6% vs. October E-mini S&P MidCap 400 futures averaged 20,803 contracts per day, up 6% vs. October E-mini NASDAQ 100 futures averaged 264,224 contracts per day, up 9% vs. October E-mini Dow ($5) futures averaged 151,340 contracts per day, up 33% vs. October Nikkei 225 (Yen) futures averaged 38,958 contracts per day, up 91% vs. October Nikkei 225 (USD) futures averaged 11,819 contracts per day, up 134% vs. October E-mini S&P Select Sector futures averaged 1,055 contracts per day, up 14% vs. October OPTIONS ON FUTURES Weekly S&P 500 options averaged 8,092 contracts per day, up 661% vs. October E-mini S&P 500 options (all expirations) averaged 438,875 contracts per day, up 104% vs. October EOM E-mini S&P 500 options averaged 25,951 contracts per day, up 97% vs. October Weekly E-mini S&P 500 options averaged 102,148 contracts per day, up 114% vs. October E-mini NASDAQ 100 options averaged 4,940 contracts per day, up 160% vs. October E-mini Dow ($5) options averaged 835 contracts per day, up 86% vs. October Learn more about these products at cmegroup.com/equities Learn more about Yen-Denominated Nikkei 225 Options at cmegroup.com/nikkei225 1
4 STATS AT A GLANCE FUTURES October 2013 Average Daily Volume Open Interest October 2013 ADV $Notional Open Interest O.I. $Notional Index Close YTD Price 20 Day Hist. Ticker ADV Contracts ($millions) Contracts ($millions) Oct-'13 Return Volatility S&P 500 E-mini S&P 500 ES 1,698, ,188 2,856, ,837 1, % 12.51% S&P 500 SP 8,122 3, ,334 72,604 S&P 500 Total 1,706, ,755 3,021, ,441 S&P 400 E-mini S&P MidCap 400 EMD 20,803 2, ,384 14, % 13.66% S&P MidCap 400 MD S&P MIdCap 400 Total 20,865 2, ,969 14,479 S&P 600 E-mini S&P SmallCap 600 SMC % 15.10% S&P SmallCap 600 Total S&P Select Sector E-mini S&P Con. Discr XAY % 14.74% E-mini S&P Con. Staple XAP , % 12.12% E-mini S&P Energy XAE % 14.21% E-mini S&P Financial XAF , % 16.66% E-mini S&P Health Care XAV , % 15.07% E-mini S&P Industrial XAI , % 12.87% E-mini S&P Materials XAB % 14.81% E-mini S&P Tech XAK , % 12.48% E-mini S&P Utilities XAU , % 12.57% S&P Select Sector Total 1, , ND100 E-mini NASDAQ-100 NQ 264,224 17, ,989 27, % 14.23% NASDAQ-100 ND ,678 2,931 NASDAQ-100 Total 265,162 18, ,667 30,898 DJIA E-mini Dow $5 YM 151,340 11, ,155 9, % 12.30% DJIA - $10 Dow DJ ,563 2,108 DJIA Total 152,024 11, ,718 11,759 NK225 Nikkei 225 (US$) NK 11, ,999 4, % 19.34% Nikkei 225 (Yen) NIY 38, ,094 82, ,517 Nikkei 225 Total 50, , , ,317 Ibovespa Ibovespa (US$) IBA % 17.96% Ibovespa Total
5 Monthly Stock Index Update STATS AT A GLANCE OPTIONS ON FUTURES October 2013 Oct 2013 ADV Open Index Close 2013 YTD 20 Day Hist. S&P 500 E-mini S&P ,776 1,821,088 1, % 12.51% EOM E-mini S&P ,951 53,776 Weekly E-mini S&P ,148 82,735 S&P , ,072 EOM S&P 500 1,880 2,696 Weekly S&P 500 8,092 2,457 S&P 500 Total 467,368 2,319,824 S&P 400 E-mini S&P MidCap % 13.66% S&P MIdCap 400 Total 4 2 ND100 E-mini NASDAQ-100 4,940 42, % 14.23% Weekly E-mini NASDAQ-100 1, EOM E-mini NASDAQ NASDAQ Weekly NASDAQ NASDAQ-100 Total 6,414 42,476 DJIA E-mini Dow $ , % 12.30% DJIA - $10 Dow DJIA Total ,904 Index GICS Sector Weightings (As of October 31, 2013) S&P 500 S&P MidCap 400 NASDAQ-100 DJIA Consumer Discretionary 12.35% 13.37% 21.46% 11.94% Consumer Staples 10.26% 3.25% 10.67% 9.68% Energy 10.65% 5.95% % Financials 16.19% 22.35% % Health Care 12.96% 10.86% 19.12% 11.63% Industrials 10.72% 17.85% 2.17% 23.20% Technology 20.17% 14.74% 46.33% 18.31% Materials 3.52% 6.94% 0.25% 3.46% Utilities 3.17% 4.67% - - Total % % % % 3
6 4

7 Monthly Stock Index Update 5
8 6
9 Monthly Stock Index Update 7
10 S&P 500 vs. S&P Select Sector Correlations YTD October 2013 S&P 500 S&P % Con. Discretionary Con. Discretionary 93.05% % Con. Staples 81.53% 75.43% % Con. Staples Energy Financial Energy 85.23% 75.55% 59.49% % Financial 93.39% 85.22% 69.63% 80.86% % Health Care 85.87% 82.62% 80.46% 63.66% 76.18% % Industrial 92.59% 86.70% 68.78% 81.60% 85.93% 74.59% % Health Care Industrial Materials Technology Utilities Materials 86.56% 79.17% 62.28% 81.72% 80.90% 68.01% 86.08% % Technology 85.73% 74.33% 61.07% 66.86% 75.35% 63.03% 76.20% 70.96% % Utilities 66.19% 60.45% 68.65% 53.10% 57.37% 56.94% 59.39% 57.38% 47.59% % Index Correlations YTD October 2013 S&P MidCap 400 S&P SmallCap 600 DJIA ND100 R2000 DJ U.S. Real Estate Nikkei 225 Brazil Ibovespa CSI 300 S&P 500 MEXBOL S&P % S&P MidCap % % S&P SmallCap % 95.49% % DJIA 95.74% 85.88% 84.00% % NASDAQ % 83.23% 81.44% 82.42% % Russell % 96.15% 99.32% 84.42% 83.29% % DJ U.S. Real Estate 71.98% 70.64% 65.66% 67.87% 58.68% 66.42% % Nikkei % 7.89% 9.82% 4.94% 1.40% 7.92% 5.24% % Brazil Ibovespa 43.09% 42.03% 40.35% 40.32% 39.63% 41.13% 32.05% 2.73% % CSI % 12.12% 12.93% 7.71% 14.78% 12.35% 7.22% 27.96% 15.18% % CNX Nifty 31.93% 33.44% 29.92% 28.89% 27.62% 30.07% 24.55% 19.41% 16.26% 17.78% % MEXBOL 54.74% 55.49% 49.58% 51.08% 49.98% 50.87% 45.87% 14.19% 33.43% 19.04% 29.76% % S&P CNX Nifty 8
11 CME Group Equity Index Products CME Group is the leading equity index derivatives marketplace, offering futures and options on key benchmark indexes that cover the spectrum of small-, medium- and large-cap indexes in the United States, Europe and Asia. Our global product suite includes contracts on such well-known indexes as the S&P 500, MidCap 400, SmallCap 600, Dow Jones Industrial Average, NASDAQ-100, Nikkei 225 Stock Average, CNX Nifty, Ibovespa and more. CME Clearing matches and settles all trades and guarantees the creditworthiness of every transaction that takes place in our markets. With CME Group, you gain access to the tools that enable you to manage global equity investment risks and gain access to pricing variations efficiently, cost-effectively and securely. For more information, please contact the Equity Products team: Chicago Thomas Boggs Richard Co Scot Warren New York Tim McCourt Giovanni Vicioso


12 CME GROUP HEADQUARTERS CME GROUP REGIONAL OFFICES 20 South Wacker Drive Chicago, Illinois cmegroup.com New York Calgary São Paulo Washington D.C London Hong Kong Seoul Singapore Houston Tokyo Futures trading is not suitable for all investors, and involves the risk of loss. Futures are a leveraged investment, and because only a percentage of a contract s value is required to trade, it is possible to lose more than the amount of money deposited for a futures position. Therefore, traders should only use funds that they can afford to lose without affecting their lifestyles. And only a portion of those funds should be devoted to any one trade because they cannot expect to profit on every trade. All references to options refer to options on futures. This communication does not constitute a Prospectus, nor is it a recommendation to buy, sell or retain any specific investment. This communication is for the exclusive use of Professional Clients only and must not be relied upon by Private Clients who should take independent financial advice. Circulation should be restricted accordingly. Issued by CME Marketing Europe Limited. CME Marketing Europe Limited is authorised and regulated by the Financial Services Authority. The Globe logo, E-mini, CME and CME Group are trademarks of Chicago Mercantile Exchange Inc. CBOT and Chicago Board of Trade are trademarks of The Board of Trade of the City of Chicago, Inc. All other trademarks are the property of their respective owners. The information within this presentation has been compiled by CME Group for general purposes only. Although every attempt has been made to ensure the accuracy of the information within this presentation, CME Group assumes no responsibility for any errors or omissions. Additionally, all examples in this presentation are hypothetical situations, used for explanation purposes only, and should not be considered investment advice or the results of actual market experience. All matters pertaining to rules and specifications herein are made subject to and are superseded by official CME, CBOT and CME Group rules. Current rules should be consulted in all cases concerning contract specifications. Copyright 2013 CME Group. All rights reserved. EQ258.9/0/0413
Monthly Stock Index Review
 EQUITY INDEX JULY 2014 Monthly Stock Index Review A Global Trading Summary of Stock Index Futures and Options» Highlights» Stats At-a-Glance» ADVs» 20-Day Historical Volatilities» Index Sector Weightings»
Monthly Stock Index Review
 EQUITY October 2011 Monthly Stock Index Review A Global Trading Summary of Stock Index Futures and Options» Highlights» Stats At-a-Glance» ADVs» 20-Day Historical Volatilities» Index Sector Weightings»
Monthly Agricultural Review
 AGRICULTURE June 214 Monthly Agricultural Review A Global Trading Summary of Grain, Oilseed and Livestock Markets» Highlights» Futures» Options How the world advances Monthly Agricultural Review AGRICULTURAL
CME Group Equity Quarterly Roll Analyzer
 CME Group Equity Quarterly Roll Analyzer Guide to getting started August 2017 Powered by QuikStrike Each quarter during the roll period, CME Group s Equity Quarterly Roll Analyzer is populated with the
Monthly Metals Review
 Monthly Metals Review Monthly Metals Review METALS TRADING HIGHLIGHTS October 216 Highlights: Average daily volume for October 216 COMEX metal (Gold, Silver and Copper) futures was 316,25 contracts, compared
Monthly Metals Review
 METALS August 213 Monthly Metals Review A Global Trading Summary of Metals Markets» Highlights» Futures» Options How the world advances Monthly Metals Review METALS TRADING HIGHLIGHTS August 213 Records:
Monthly Energy Review
 Monthly Energy Review Monthly Energy Review ENERGY TRADING HIGHLIGHTS October 216 Average daily volume for October 216 Light Sweet Crude Oil futures was 1,96,161 contracts, compared with 794,78 during
Monthly Energy Review
 ENERGY May 216 Monthly Energy Review A Global Trading Summary of Energy Markets Highlights Futures Options How the world advances Monthly Energy Review ENERGY TRADING HIGHLIGHTS May 216 Average daily volume
Monthly Metals Review
 Monthly Metals Review Monthly Metals Review METALS TRADING HIGHLIGHTS November 216 Highlights: Average daily volume for November 216 COMEX metal (Gold, Silver and Copper) futures was 612,111 contracts,
Monthly Metals Review
 Monthly Metals Review Monthly Metals Review METALS TRADING HIGHLIGHTS February 217 Highlights: Average daily volume for February 217 COMEX metal (Gold, Silver and Copper) futures was 449,987 contracts,
Monthly Energy Review
 ENERGY February 216 Monthly Energy Review A Global Trading Summary of Energy Markets Highlights Futures Options How the world advances Monthly Energy Review ENERGY TRADING HIGHLIGHTS February 216 Average
Monthly Energy Review
 Monthly Energy Review Monthly Energy Review ENERGY TRADING HIGHLIGHTS September 216 Average daily volume for September 216 Light Sweet Crude Oil futures was 1,158,68 contracts, compared with 79,692 during
Monthly Metals Review
 Monthly Metals Review Monthly Metals Review METALS TRADING HIGHLIGHTS September 216 Highlights: Average daily volume for September 216 COMEX metal (Gold, Silver and Copper) futures was 314,63 contracts,
First Quarter Quarterly FX Update. A Global Trading Summary of FX Futures and Options Highlights Futures Options. How the world advances
 FX First Quarter 2011 Quarterly FX Update A Global Trading Summary of FX Futures and Options»» Highlights»» Futures»» Options How the world advances As the world s leading and most diverse derivatives
Monthly Metals Review JULY 2016
 Monthly Metals Review JULY 216 Monthly Metals Review METALS TRADING HIGHLIGHTS July 216 Highlights: Average daily volume for July 216 COMEX metal (Gold, Silver and Copper) futures was 438,37 contracts,
Monthly Metals Review JUNE 2016
 Monthly Metals Review JUNE 216 Monthly Metals Review METALS TRADING HIGHLIGHTS June 216 Highlights: Average daily volume for June 216 COMEX metal (Gold, Silver and Copper) futures was 45,152 contracts,
Third Quarter Quarterly FX Review. A Global Trading Summary of FX Futures and Options Highlights Futures Options. How the world advances
 FX Third Quarter 212 Quarterly FX Review A Global Trading Summary of FX Futures and Options»» Highlights»» Futures»» Options How the world advances As the world s leading and most diverse derivatives marketplace,
THIRD QUARTER 2010 QUARTERLY FX UPDATE. A Global Trading Summary of FX Futures and Options. Highlights Futures Options
 THIRD QUARTER 2010 QUARTERLY FX UPDATE A Global Trading Summary of FX Futures and Options Highlights Futures Options As the world s leading and most diverse derivatives marketplace, CME Group (www.cmegroup.com)
Monthly Metals Review
 METALS January 216 Monthly Metals Review A Global Trading Summary of Metals Markets Highlights Futures Options How the world advances Monthly Metals Review METALS TRADING HIGHLIGHTS January 216 Highlights:
Monthly Metals Review
 METALS May 216 Monthly Metals Review A Global Trading Summary of Metals Markets Highlights Futures Options How the world advances Monthly Metals Review METALS TRADING HIGHLIGHTS May 216 Highlights: Average
Sink your FANGs into E-mini NASDAQ-100 Futures
 EQUITY INDEX Sink your FANGs into E-mini NASDAQ-100 Futures Craig Bewick Director of Client Development and Sales Retail Facebook, Amazon, Netflix and Alphabet (Google), collectively the FANG stocks, have
Monthly Agricultural Review
 Monthly Agricultural Review Monthly Agricultural Review AGRICULTURAL TRADING HIGHLIGHTS February 217 Average daily volume for February 217 Grain and Oilseed futures was 1,198,561 contracts, compared with
Monthly Agricultural Review
 Monthly Agricultural Review Monthly Agricultural Review AGRICULTURAL TRADING HIGHLIGHTS September 216 Average daily volume for September 216 Grain and Oilseed futures was 653,245 contracts, compared with
FOURTH QUARTER QUARTERly FX. A Global Trading Summary of FX Futures and Options. Highlights Futures Options
 FOURTH QUARTER 2010 QUARTERly FX Update A Global Trading Summary of FX Futures and Options Highlights Futures Options As the world s leading and most diverse derivatives marketplace, CME Group (www.cmegroup.com)
Monthly Agricultural Review JUNE 2016
 Monthly Agricultural Review JUNE 216 Monthly Agricultural Review AGRICULTURAL TRADING HIGHLIGHTS June 216 Average daily volume for June 216 Grain and Oilseed futures was 1,329,415 contracts, compared with
CME FX Link LIQUIDITY, LINKED QUOTATION AND PRICING GUIDE
 CME FX Link LIQUIDITY, LINKED QUOTATION AND PRICING GUIDE CME FX Link: One CME Globex Spread, Connecting OTC FX and FX Futures Markets CME FX Link is a CME Globex basis spread between FX Futures and OTC
Monthly Agricultural Review
 AGRICULTURE February 216 Monthly Agricultural Review A Global Trading Summary of Grain, Oilseed and Livestock Markets Highlights Futures Options How the world advances Monthly Agricultural Review AGRICULTURAL
Gold Futures vs. Gold ETF s
 PRECIOUS METALS Gold Futures vs. Gold ETF s UNDERSTANDING THE DIFFERENCES AND OPPORTUNITIES There are significant differences in the liquidity, leverage and costs of futures and ETFs that need to be understood
Fee Summary Guide. Proprietary Trading Firms
 Fee Summary Guide Proprietary Trading Firms Fees effective as of February 1, 2018 Fee Summary Guide As the world s leading and most diverse derivatives marketplace, CME Group is where the world comes to
AGRICULTURAL PRODUCTS. Soybean Crush Reference Guide
 AGRICULTURAL PRODUCTS Soybean Crush Reference Guide As the world s largest and most diverse derivatives marketplace, CME Group (cmegroup.com) is where the world comes to manage risk. CME Group exchanges
GREATER SECURITY. MORE CERTAINTY. CME CLEARPORT.
 GREATER SECURITY. MORE CERTAINTY. CME CLEARPORT. FLEXIBLE SOLUTIONS FOR MITIGATING YOUR RISK CME ClearPort is a comprehensive set of flexible clearing services for the global OTC market. Launched in 2002
Live Cattle Delivery Manual Relating to Chapter 101
 AGRICULTURE Live Cattle Delivery Manual Relating to Chapter 101 Table of Contents I. Submission Requirements...1 II. Live Delivery Requirements...2 A. Duties of the short...2 B. Duties of the long...3
A Global Trading Summary of Interest Rate Markets
 first Quarter 2011 QUARTERly INTEREST RATE Update A Global Trading Summary of Interest Rate Markets Highlights Volume Credit Spreads Deliveries Cash Market Penetration Foreign Holdings of Treasury Securities
CME DataMine Product Guide
 CME DataMine Product Guide When precision matters. CME DataMine offers comprehensive CME, CBOT and NYMEX historic market data raw and straight from the source. This product guide explains each data type
To receive advanced notification of Performance Bond (margin) changes, through our free automated mailing list, go to
 changes, through our free automated mailing list, go to") 18-071 TO: Clearing Member Firms Chief Financial Officers Back Office Managers Margin Managers FROM: CME Clearing SUBJECT: Performance Bond Requirements TE: Thursday, February 15, 2018 To receive advanced
18-071 TO: Clearing Member Firms Chief Financial Officers Back Office Managers Margin Managers FROM: CME Clearing SUBJECT: Performance Bond Requirements TE: Thursday, February 15, 2018 To receive advanced
FX PRODUCTS. Making a world of forex opportunities accessible to you.
 FX PRODUCTS Making a world of forex opportunities accessible to you. In a world of increasing volatility, customers around the globe rely on CME Group as their premier source for managing risk. Formed
Probability Analytics and Transactions Costs in the Era of Event Risk Blu Putnam, Chief Economist CME Group June 2017
 Probability Analytics and Transactions Costs in the Era of Event Risk Blu Putnam, Chief Economist CME Group June 2017 2017 CME Group. All rights reserved. Investment advice is neither given nor intended
Agricultural Options. March 2018
 Agricultural Options March 2018 CME GROUP INTERNAL Ag Option Product Suite Highlights Implied volatility showing large ranges during the first quarter KC Wheat CSO s have a record volume month Uptick in
Risk Management for Equity Asset Managers. John W. Labuszewski
 Risk Management for Equity Asset Managers John W. Labuszewski Disclaimer Futures trading is not suitable for all investors, and involves the risk of loss. Futures are a leveraged investment, and because
OTC SOFR Swaps Clearing
 OTC SOFR Swaps Clearing April 17, 2018 OTC CLEARING THE WAY FORWARD 2018 CME Group. All rights reserved. 1 CME SOFR Offering The Secured Overnight Funding Rate (SOFR) What is SOFR? Endorsed by the Alternative
November 4, 2011 Page 1 of 8
 November 4, 2011 Page 1 of 8 Introduction The Capital Asset Pricing Model (CAPM) determines the theoretical rate of return an investor expects to obtain from investing in a financial asset. The model postulates
Futures Contract Spread Opportunies
 Futures Contract Spread Opportunies David Gibbs September 2011 Background & fundamentals Spread Trading In futures trading the simultaneous buying and selling of two contracts against each other is known
Equities Market Overview
 Equities Market Overview Equity F&O Volume: Last 5 Trade Days Equity F&O Open Interest: Last 5 Trade Days Trade Date F&O Volume 09/25/2018 1,972,292 09/24/2018 2,327,554 09/21/2018 3,011,268 09/20/2018
Agricultural Options. June 2018
 Agricultural Options June 2018 CME GROUP INTERNAL Ag Option Product Suite Highlights Grain & Oilseed markets experienced large ranges in implied volatility and skew throughout June Record percent of volume
METALS Products. Where the metals market
 METALS Products Where the metals market manages risk. In a world of increasing volatility, customers around the globe rely on CME Group as their premier source for managing risk across all major asset
interest rate products Liability Driven Investing: Challenges and Opportunities
 interest rate products Liability Driven Investing: Challenges and Opportunities Liability Driven Investing Challenges and Opportunities introduction Fretting over the free and easy ways of government
To receive advanced notification of Performance Bond (margin) changes, through our free automated mailing list, go to
 changes, through our free automated mailing list, go to") TO: Clearing Member Firms Chief Financial Officers Back Office Managers Margin Managers FROM: CME Clearing SUBJECT: Performance Bond Requirements DATE: Tuesday, February 06, 2018 To receive advanced notification
TO: Clearing Member Firms Chief Financial Officers Back Office Managers Margin Managers FROM: CME Clearing SUBJECT: Performance Bond Requirements DATE: Tuesday, February 06, 2018 To receive advanced notification
Bloomberg Analytics for CME Swap Clearing
 Bloomberg Analytics for CME Swap Clearing CME-Specific USD Valuation Curve CME Cleared Swaptions Initial Margin Calculations 2016 CME Group. All rights reserved. CME-Specific USD Valuation Curve 2016 CME
Capitalize on the CME Group/MexDer Partnership. Trade MexDer Equity Index (IPC) Futures
 Futures") Capitalize on the CME Group/MexDer Partnership Trade MexDer Equity Index (IPC) Futures Trade MexDer Equity Index (IPC) Futures Open a New Door to Opportunity with MexDer Equity Index (IPC) Futures The
Capitalize on the CME Group/MexDer Partnership Trade MexDer Equity Index (IPC) Futures Trade MexDer Equity Index (IPC) Futures Open a New Door to Opportunity with MexDer Equity Index (IPC) Futures The
Agricultural Options. September CME Group. All rights reserved.
 Agricultural Options September 2018 Ag Option Product Suite Highlights Wheat complex continues to show strong volume with HRW implied volatility trading 1% higher than SRW. HRW/SRW Wheat call skew showing
Agricultural Options. November CME Group. All rights reserved.
 Agricultural Options November 2018 Ag Option Product Suite Highlights Livestock spread volume on CME Globex hit an all-time high of 35%, led by verticals, 3-ways and delta-hedged options Weekly options
RISK DISCLOSURE STATEMENT
 RISK DISCLOSURE STATEMENT TRADING FUTURES AND OPTIONS INVOLVES SUBSTANTIAL RISK OF LOSS AND IS NOT SUITABLE FOR ALL INVESTORS. THERE ARE NO GUARANTEES OF PROFIT NO MATTER WHO IS MANAGING YOUR MONEY. PAST
FUTURES OPTIONS A TRADING STRATEGY GUIDE STRATEGY GUIDE OPTIONS ON FUTURES CONTRACTS:
 OPTIONS ON FUTURES CONTRCTS: FUTURES OPTIONS TRDING STRTEGY GUIDE STRTEGY GUIDE 1.800.800.3840 25 for trading options on CME Group futures WORLD OF OPTIONS ON SINGLE POWERFUL PLTFORM. With nearly 3 billion
Quarterly Interest Rate Review
 INTEREST RATES Third Quarter 2014 Quarterly Interest Rate Review A Global Trading Summary of Interest Rate Futures, Options and OTC Products»» Highlights»» Quarterly Outlook»» Product Overview»» New Tools»»
CME Clearing Risk Management and Financial Safeguards Brochure
 CME Clearing Risk Management and Financial Safeguards Brochure CME Clearing Risk Management and Financial Safeguards CME Clearing Overview CME Clearing serves as the counterparty to every cleared transaction,
Volatility Jam Session
 Volatility Jam Session Aligning Options Strategies with Volatility Dave Lerman Sr. Director, Marketing/Education CME Group David.lerman@cmegroup.com 312-648-3721 Disclaimer Futures trading is not suitable
Equities Market Overview
 Equities Market Overview Equity F&O Volume: Last 5 Trade Days Equity F&O Open Interest: Last 5 Trade Days Trade Date F&O Volume 06/29/2018 3,139,989 06/28/2018 3,279,544 06/27/2018 4,020,200 06/26/2018
OTC SOFR Swaps Clearing
 OTC SOFR Swaps Clearing Q4 2018 OTC CLEARING THE WAY FORWARD 1 CME SOFR Offering The Secured Overnight Funding Rate (SOFR) What is SOFR? Endorsed by the Alternative Reference Rate Committee (ARRC) in June
Finding Opportunities in a New Interest Rate Environment
 INTEREST RATES Finding Opportunities in a New Interest Rate Environment The Interest Rate market is experiencing significant volatility in 2015, as market participants are anticipating when the FOMC will
MarketGrader Indexes Report Card MarketGrader
 Indexes Report Card 2016 Indexes Report Card U.S. Indexes - Annual Returns 2008 2009 2010 2011 2012 2013 2014 2015 2016 Barron's 400 Total Return -39.21 41.12 23.97 0.52 15.08 41.60 7.05-3.10 18.26 Dow
Divergent Levels of Debt: Differing National Strategies and Their Consequences for Investors
 Divergent Levels of Debt: Differing National Strategies and Their Consequences for Investors Erik Norland, Senior Economist & Executive Director Intelligence & Analytics November 2018 1 Investment Advice
Trade Entry - Trade Management - Trade Exit The Best Things Come in Threes
 Trade Entry - Trade Management - Trade Exit The Best Things Come in Threes Timothy Morge, CTA and President Blackthorne Capital, Inc. Sovereign Wealth Managers Internet Presentation Sponsored by Interactive
Clearing Member Firms Chief Financial Officers Back Office Managers Margin Managers TO: FROM: CME Clearing SUBJECT:
 16-247 TO: Clearing Member Firms Chief Financial Officers Back Office Managers Margin Managers FROM: CME Clearing SUBJECT: Performance Bond Requirements DATE: Friday, June 24, 2016 To receive advanced
MarketGrader Global Indexes - Report Card MarketGrader
 Global Indexes - Report Card 2017 Indexes Report Card U.S. Indexes - Annual Returns 2017 2016 2015 2014 2013 2012 2011 2010 2009 2008 Barron's 400 Total Return 19.66 18.26-3.10 7.05 41.60 15.08 0.52 23.97
Manage global FX risk and capture opportunity. In every corner of the world.
 Fx Manage global FX risk and capture opportunity. In every corner of the world. With over $120 billion in daily liquidity, CME Group is the world s largest regulated FX marketplace. We offer transparent
CME Group and the Benefits of the Tighter WTI Specifications
 CME Group and the Benefits of the Tighter WTI Specifications Daniel Brusstar Denver, May 23, 2018 COQA CCQTA Joint Meeting Agenda Update on the Phase-in of the additional WTI tests The benefits of adopting
Volatility Monitor. 3 rd Quarter 2012 OCTOBER 11, John W. Labuszewski
 Volatility Monitor 3 rd Quarter 2012 OCTOBER 11, 2012 John W. Labuszewski Managing Director Research & Product Development 312-466-7469 jlab@cmegroup.com Volatility is one of several key inputs into mathematical
2.0. Learning to Profit from Futures Trading with an Unfair Advantage! Trading Essentials Framework What Are the E-Mini Futures
 2.0 Learning to Profit from Futures Trading with an Unfair Advantage! Trading Essentials Framework What Are E-Mini Futures? E-mini futures track the most popular broad-based stock index benchmarks in the
Cleared OTC Credit at CME Security. Neutrality. Transparency.
 Cleared OTC Credit at CME Security. Neutrality. Transparency. Contents Why CME for CDS Clearing? CDS Margin Model & Benefits Cleared OTC CDS Product Scope Client Clearing Reporting & Tools Next Steps and
Implied Price Functionality Overview
 Implied Price Functionality Overview Implied Orders First Generation An implied order is an order created from individual outright orders available in the market place. Implied IN/OUT spreading occurs
MGEX CBOT Wheat Spread Options. Product Overview
 MGEX CBOT Wheat Spread Options Product Overview May 7, 2012 MGEX-CBOT Wheat Spread Options Overview - MGEX: Hard Red Spring Wheat futures listed on the Minneapolis Grain Exchange, Inc. - CBOT: Soft Red
PROVEN STRATEGIES. for trading options on CME Group futures
 25 PROVEN STRTEGIES for trading options on CME Group futures world of options on a single powerful platform. With more than 2.2 billion contracts (valued at $1.1 quadrillion) traded in 2007, CME Group
Creating Forward-Starting Swaps with DSFs
 INTEREST RATES Creating -Starting Swaps with s JULY 23, 2013 John W. Labuszewski Managing Director Research & Product Development 312-466-7469 jlab@cmegroup.com CME Group introduced its Deliverable Swap
Ukrainian Grain Congress Black Sea Wheat Futures
 Ukrainian Grain Congress 2011 Black Sea Wheat Futures Kiev - October 10, 2011 Jeffry Kuijpers DISCLAIMER Futures trading is not suitable for all investors, and involves the risk of loss. Futures are a
US Treasury Classic Bond Futures Describing the Gap in the Delivery Basket & Presenting Potential Options to Address.
 US Treasury Classic Bond Futures Describing the Gap in the Delivery Basket & Presenting Potential Options to Address November 2013 Agenda US Treasury Bond Futures Gap in Delivery Basket Potential Options
Invoice Swap Spreads and Portfolio Margining Benefits
 Invoice Swap Spreads and Portfolio Margining Benefits Unparalleled Capital Efficiencies for Interest Rate Swap Portfolios 2016 CME Group. All rights reserved. Recent Developments in Packaged Trades Between
Hedging FX Intertek. ACT Webinar, 16 th April
 Hedging FX Intertek ACT Webinar, 16 th April 2015 1 www.intertek.com Who is Intertek? We are Electrical engineers Chemists Mechanical engineers Medical doctors Consultants Biologists Inspectors Geologists
10Y Eris Primary Standard Swap Futures: Contract Specifications
 10Y Eris Primary Standard Swap Futures: Contract Specifications Trading Hours Contract Structure Underlying Swap Tenor Contract Short Name Fixed Rate Contract Size Trading Conventions Swap Futures Leg
CHAT User Manual. July 21, 2017
 User Manual July 21, 2017 Disclaimer Futures trading is not suitable for all investors, and involves the risk of loss. Futures are a leveraged investment, and because only a percentage of a contract s
Lori Aldinger. Managing Director. Manager
 STOCK INDEXES Unde ersta andin ng Equity EFRP Ps SEPTEMBER 3, 2013 John W. Labuszewski Managing Director Research & Product Development 312-466-7469 jlab@cmegroup.com Lori Aldinger Manager Research & Product
2017 CME Group. All rights reserved.
 Most Successful Product Launch in CME Group History Fulfilled by physical delivery of original-issue 10-year Treasury notes with terms to maturity between 9-Yrs 5Mos and 10-Yrs (on-the run, old, and double
CBOT Invoice Swap Spreads
 CBOT Invoice Swap Spreads New enhancements & efficiencies coming June 6, 2016 CBOT Invoice Swap Spread Update and Enhancements On June 6, CME will offer new functionality for CBOT listed invoice spreads
2015 CME Group. All rights reserved.
 Ultra 10-Year US Treasury & Options Launching January 11, 2016 Based on Strong Client Demand Capital constraints have reduced liquidity in the cash market, driving strong client demand for and Options
10T and U10T Eris Standard Invoice Swap Futures: Contract Specifications
 10T and U10T Eris Standard Invoice Swap Futures: Contract Specifications Trading Hours Contract Description Contract Structure Contract Short Name Regular Trading Hours (RTH): Monday Friday; 7:00 am to
Portfolio Margining Benefits
 Portfolio Margining Benefits Unparalleled Capital Efficiencies for Interest Rate Swap Portfolios Portfolio Margining IRS and CME Group Futures Unparalleled Margin Efficiencies for a Capital Constrained
To receive advanced notification of Performance Bond (margin) changes, through our free automated mailing list, go to
 changes, through our free automated mailing list, go to") ADV: TO: CH ADV 16-237 Clearing Member Firms Chief Financial Officers Back Office Managers Margin Managers FROM: CME Clearing SUBJECT: Performance Bond Requirements DATE: Monday, June 20, 2016 To receive
ADV: TO: CH ADV 16-237 Clearing Member Firms Chief Financial Officers Back Office Managers Margin Managers FROM: CME Clearing SUBJECT: Performance Bond Requirements DATE: Monday, June 20, 2016 To receive
2017 CME Group. All rights reserved.
 Most Successful Product Launch in CME Group History Fulfilled by physical delivery of original-issue 10-year Treasury notes with terms to maturity between 9-Yrs 5 Mos and 10-Yrs (on-the run, old, and double
Welcome to NYMEX WTI Light Sweet Crude Oil Futures
 Welcome to NYMEX WTI Light Sweet Crude Oil Futures Product Overview Looking to take part in today s active oil markets? Consider NYMEX WTI Light Sweet Crude Oil futures (ticker symbol CL). NYMEX WTI is
Clearing Overview. Jason Silverstein, Executive Director & Associate General Counsel October 25, CME Group. All rights reserved.
 Clearing Overview Jason Silverstein, Executive Director & Associate General Counsel October 25, 2016 Disclaimer Futures trading is not suitable for all investors, and involves the risk of loss. Futures
Do you have what it takes to trade CME Group Product from Mexico? South to North Connectivity
 Do you have what it takes to trade CME Group Product from Mexico? South to North Connectivity December 9, 2013 Disclaimer Futures trading is not suitable for all investors, and involves the risk of loss.
Introduction to Risk Management CME Group. All rights reserved.
 Introduction to Risk Management What does risk look like? It s different for every industry. It s different for every industry. It s different for every industry. We bring those who want to manage risk
Is it time for a boneless beef trimmings derivative contract? David Farley 1 st March 2012
 Is it time for a boneless beef trimmings derivative contract? David Farley 1 st March 2012 Why does AAco care? 680,000 head of cattle Substantial price risk over which AAco has limited ability to take
Cleared OTC Credit Default Swaps
 Cleared OTC Credit Default Swaps Changing the CDS Clearing Landscape Q3 2015 Contents Why CME for CDS Clearing? CDS Margin Model & Benefits Cleared OTC CDS Product Scope Client Clearing Reporting & Tools
CME Group Interest Rate Options
 CME Group Interest Rate Options January 2018 Dave Reif Interest Rate Business Line Management cmegroup.com +1 312 648 3839 Interest Rate Options Overview Strong electronic growth has expanded access and
CME Group Latin American IRS Clearing
 CME Group Latin American IRS Clearing Mexican Peso TIIE Swaps Brazilian Real CDI Swaps The Broadest Global IRS Product Scope with 21 Currencies ADV (Pesos Billion) Open Interest (Pesos Billion) Mexican
Short-Term Interest Rate (STIR) Intercommodity Spreads on Globex. Including the Eurodollar Fed Funds Spread, and spreads involving SOFR Futures
 Intercommodity Spreads on Globex. Including the Eurodollar Fed Funds Spread, and spreads involving SOFR Futures") Short-Term Interest Rate (STIR) Intercommodity Spreads on Globex Including the Eurodollar Fed Funds Spread, and spreads involving SOFR Futures CME Group Short Term Interest Rate Inter-Commodity Spreads
Short-Term Interest Rate (STIR) Intercommodity Spreads on Globex Including the Eurodollar Fed Funds Spread, and spreads involving SOFR Futures CME Group Short Term Interest Rate Inter-Commodity Spreads
Command the Curve: Treasury Futures and Options for the Active Trader June 26, 2018
 Command the Curve: Treasury Futures and Options for the Active Trader June 26, 2018 David Lerman Sr. Director, Education CME Group david.lerman@cmegroup.com Market Development Historical developments Birth
CME Group Latin American IRS Clearing
 CME Group Latin American IRS Clearing Mexican Peso TIIE Swaps Brazilian Real CDI Swaps The Broadest Global IRS Product Scope with 24 Currencies Mexican Peso Swap Details CME will clear MXN IRS with the
Welcome to OneChicago Using the Single Stock Futures Calculator
 Welcome to OneChicago Using the Single Stock Futures Calculator Copyright 2008 OneChicago, LLC. All rights reserved. Single Stock Futures Security futures is the term used to collectively describe futures
CME Group Market Regulation. Update on Revisions to Rule 538 and Associated Regulatory Guidance
 CME Group Market Regulation Update on Revisions to Rule 538 and Associated Regulatory Guidance October 13, 2016 Agenda 1 Introduction 2 What is an EFRP? 3 Description of Recent Changes and Review of Unchanged