FUCHS PETROLUB SE The leading independent lubricants manufacturer of the world
|
|
|
- Ruth Mitchell
- 6 years ago
- Views:
Transcription
1 The leading independent lubricants manufacturer of the world Dr. Alexander Selent, Vice Chairman & CFO Dagmar Steinert, Head of Investor Relations September 2014
2 The leading independent lubricants manufacturer of the world Founded d in sales revenues: 1.8 bn 2013 number of employees: 3,888 in 50 operating companies worldwide 31 production facilities 100,000 customers in more than 150 countries Member of the MDAX, DAXplus Family 30 and STOXX Europe 600 2
3 FUCHS - business model FUCHS is fully focussed on lubricants (advantage over major oil companies) Technology, innovation and specialisation leadership in strategically important product areas Independence allows customer and market proximity, responsiveness, speed and flexibility (advantage over major oil companies) FUCHS is a full-line supplier (advantage over most independent companies) Global presence (advantage over most independent companies) 3
4 FUCHS - long-term strategic objectives Continue to be the world s largest independent d manufacturer of lubricants and related specialities Value-based growth through innovation and specialisation leadership Organic growth in emerging markets and organic and external growth in mature markets Creating shareholder value by generating returns above the cost of capital Remain independent which is decisive for FUCHS business model 4
5 Regional breakdown of world lubricants demand World lubricants demand 2013: 35 mn t Demand (mn t) % 20% Asia-Pacific biggest regional lubricants market with highest growth rate 34% 28% Europe Americas North thamerica and Western Europe mature markets; focus is more on a specialized product portfolio and specialities 39% 52% Asia-Pacific & Rest of World
6 2013 per-capita lubricants demand shows significant growth opportunities kg Western Europe 11% Latin America 9% Africa 5% Middle East 6% Central/ Eastern Europe 9% North America 19% Word lubricants demand 2013: 35 mn t Asia- Pacific 42% Source: FUCHS Global Competitive Intelligence 6
7 Top 20 lubricants countries 2013 Kt tons 7,000 6,000 5,000 4,000 3,000 2,000 1,000 0 China USA India Russia Japan Brazil Germany Korea Mexico Iran Indonesia UK Canada France Thailand Taiwan Turkey Australia Egypt Italy 7
8 Competition strong fragmentation manufacturers: 130 major oil companies 590 independent manufacturers 720 manufacturers High degree of fragmentation ti Concentration especially among smaller companies sizes: manufacturers volumes % top 10 > < Differences in the size of manufacturers are enormous Source: FUCHS Global Competitive Intelligence 8

9 FUCHS strategic position 9

10 FUCHS is fully focused on lubricants Sales 2013: 1.8 mn Automotive lubricants 40.4% other 3.6% Industrial lubricants 56.0% 100,000 customers Automotive industry Manufacturing Engineering Construction & Mining & Trade, services & transportation passenger cars & trucks steel & cement conveyer belt & aeronautic agriculture industry wind energy railway & food industry 10
11 FUCHS is strategically well positioned 9 th largest lubricant company worldwide* Among 590 independent lubricant companies the number 1 * by volume Source: FUCHS Global Competitive Intelligence 11
12 FUCHS is the specialist for lubricants Worldwide lubricant market 2013 FUCHS manufactured lubricants 2013 (volume) (volume) Process Oils 9.9% Automotive Oils 56.0% MWF/CP/ MWF/CP/ Greases* Greases 83% 8.3% 30.0% 0% Process Oils 1.6% Automotive Oils 45.8% Industrial Oils 25.8% Industrial Oils 22.8% *metalworking fluids/corrosion preventatives/lubricating greases Source: FUCHS Global Competitive Intelligence 12


13 FUCHS is the specialist and occupies technology and market leadership positions in strategically important niche areas High-performance No. 1 speciality open gear lubricants (cement industry etc.) Metalworking No. 2-4 fluids Corrosion No. 2 preventives Mining specialities No. 1 (fire-resistant hydraulic fluids for underground coal mining i and high-performance lubricants Forging g lubricants No. 2 Environmentally Friendly lubricants Greases No


14 FUCHS - the niche specialist R&Dexpenses in mn Technical leadership through intensive Research & Development. 398 researchers around the globe help our customers to solve their problems. FUCHS PETROLUB spent 31 mn in R&D expenses during
15 Breakdown of group sales revenues by customer sector Manufacturing industry (incl. Chemicals production)* 20% Automotive industry (vehicle manufacturing and components) 27% Engineering 8% Sales FUCHS 1,831.6 mn Agriculture and construction 8% Energy and mining 9% Trade, transport and services 28% As a percentage of sales * Manufacturing industry = producer goods, capital goods, consumer goods Source: FUCHS Global Competitive Intelligence 15
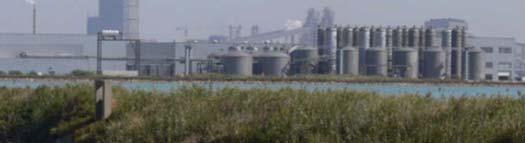
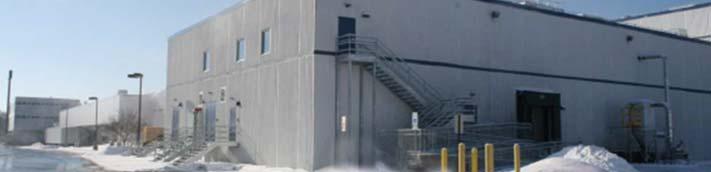
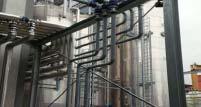
16 We have a worldwide network production sites 16
, #9 worldwide and by far the largest independent producer, close to customers leader in innovation,")
17 FUCHS strategic position is a combination of Comments High Degree of Specialisation& Technical Excellence Size & Global Presence Customer Focus and Tailor made Products around 1.8 bn in sales (80% outside Germany, Asia Pacific is FUCHS 2nd largest regional market), #9 worldwide and by far the largest independent producer, close to customers leader in innovation, specialisation & technology, clear focus on highvalue products & market segments, basis for strong profitability, high cash flows & value creation Local & Flat Organisation Motivated Employees optimized and highly flexible cost structure, highly committed teams in management, production, R&D, sales and admin supported by company s independence, steering via FVA tool successful Independence d & Financial i Strength 17
18 Our business model has paid dividends 18
19 During the past 10 years, FVA increased by 25% p.a. and market capitalization presently is close to 4.5 bn. FVA = Fuchs Value Added FUCHS market capitalization 250 5, , mn ,000 2,000 1,000 0 mn 19
20 During the past 10 years, sales revenues have increased by 5.8% p.a. and earnings after tax by 18.5% p.a. Sales Earnings after tax mn 1,800 mn 250 1, , , ,096 1, ,3 23 1, , , , ,652 1,819 1,
21 Solid balance sheet mn 1, net debt/net cash equity 21
22 Solid financing increase of equity ratio to 73.5% and net payment items of 167,4 mn mn Equity Equity ratio 52.7% 61.1% 66.8% 70.5% 73.5% Return on equity (ROE) 35.3% 36.6% 31.0% 29.0% 26.7% Return on capital employed (ROCE) 32.8% 42.7% 39.1% 39.7% 39.7% Net debt 1 (-) / net cash (+) excl. pensions 22
23 Generation of free cash flow on average of more than 100 mn since 2006 million Free cash flow
24 Since IPO in 1985 we have paid dividends - during the past 10 years, dividends have been increased by 22.8% p.a. Dividend id d per preference share (adjusted for changes in equity structure)
25 Growth Initiative 25
26 Growth initiative - We have significantly expanded our global footprint mn 80 Main focus of investments were the construction of new plants in growth regions such as Russia, China and Brazil, the modernization and expansion of our large sites in the U.S. and Germany as well as an expansion of our R&D capacities Capex Depreciation


27 Investments India: Mumbai (2010) China: Yingkou (2013) Russia: Kaluga (2013) USA: Chicago (2012/2013) Germany 27
28 Growth initiative Personnel increase mainly in sales and R&D Number of employees (on 31 December) 4, % Marketing and sales 1,512 (1,463) 34.8% Production 1,353 (1,334) 3,500 3,000 3, , , , 773 3, % Administr. 625 (598) 2013: 3,888 employees 10.2% R&D 398 (378) 28
29 Acquisitions 2014
30 Acquisition of LUBRITENE Acquisition iti of the lubricant business of LUBRITENE group in May 2014 Purchase of product technology and customer base Sales: approx. 15 mn p.a. Business mainly exists of lubricants for mining and the food industry Production will be transferred midterm to the FUCHS sites in Johannesburg and Melbourne 30
31 Acquisition of BATOYLE Acquisition iti of the lubricant business of the BATOYLE FREEDOM Group on 20 June 2014 Purchase of product technology and customer base Sales: approx. 15 mn p.a. Business exists of automotive and industrial lubricants as well as lubricants for the glass industry After transition phase it is intended to transfer the production to the FUCHS site in Hanley 31
32 Thank you for your attention This presentation contains statements about future development that are based on assumptions and estimates by the management of FUCHS PETROLUB SE. Even if the management is of the opinion that these assumptions and estimates are accurate, future actual developments and future actual results may differ significantly from these assumptions and estimates due to a variety of factors. These factors can include changes to the overall economic climate, changes to exchange rates and interest rates and changes in the lubricants industry. provides no guarantee that future developments and the results actually achieved in the future will agree with the assumptions and estimates set out in this presentation and assumes no liability for such. 32
33 Appendix
34 Appendix The year 2013 Q1 and Q st half year 2014 and outlook Share buyback / bonus shares Shareholder structure 34
35 The year 2013
36 2013: EBIT 2013 increase by 6.66 % or 19.3 mn mn Mio. in % Sales revenues 1, , Gross profit Gross profit margin 37.7 % 36.6 % Admin., sales, R&D and other net operating expenses Expenses as a percentage of sales 21.4 % 21.3 % EBIT before at equity income EBIT margin before at equity income 16.3 % 15.3 % Income from participations EBIT Earnings after tax Net profit margin 11.9 % 11.4 % Earnings per share in (adj. for changes in equity structure) Ordinary Preference
37 2013: Organic sales growth in all three world regions, high growth rate in Asia Regional sales growth 2013 Asia Pacific / Africa North- and South America Group* mn Organic growth Currency effects External growth Total growth +22% 2.2% +23% 2.3% - 41% 4.1% +07% 0.7% Organic growth + 3.0% + 9.4% + 1.2% + 4.0% Currency effects - 0.8% - 7.1% - 5.3% - 3.3% * Consolidation effect mn 37
38 2013: Europe and Asia-Pacific, Africa contributed to the increase in EBIT whereas America could not achieve previous year s figures mn (variance to previous year %) Asia-Pacific, Africa* sales % EBIT % EBIT margin** 18.3% (17.1) 30.6%*** (29.4) 52.3%*** (52.7) Europe* sales 1, % EBIT % EBIT margin** 13.7% (12.3) Sales FUCHS 1,831.6 EBIT margin** 16.3.% (15.3) North and South thamerica* sales % EBIT % EBIT margin** 20.2% (21.1) 17.1%*** (17.9) * By companies location ** before at equity *** by customers location 38
39 2013: Free cash flow of mn allows higher dividends and share buyback mn Gross cash flow Changes in net current asset Changes in other current assets Operating cash flow Investments Acquisitions Other changes Free cash flow
40 Q1 and Q2 2014
41 Quarterly development mn Q1 13 Q2 13 Q3 13 Q4 13 Q1 14 Q2 14 Sales revenues Gross profit (37.5%) (37.9%) (37.9%) (37.4%) (37.4%) (37.2%) Admin., sales, R&D and other net operating expenses (21.6%) (21.5%) (20.8%) (21.5%) (21.5%) (21.6%) EBIT before at equity income 70.2 (15.9%) 76.8 (16.4%) 80.1 (17.1%) 71.7 (15.8%) 72.6 (15.9%) 72.4 (15.7%) EBIT Earnings after tax Net profit margin 11.7% 12.0% 12.4% 11,7% 11.6% 11.4% 41
42 Q1: EBIT before income from at equity developed in the same manner as sales revenues mn Q Q Variance Sales revenues % Gross profit % Gross profit margin 37.4% 37.5% Sales, admin., R&D and other net expenses % Expenses as a percentage of sales 21.5% 21.6% EBIT before income from at equity % EBIT margin before income from at equity 15.9% 15.9% Income from at equity EBIT % Earnings after tax % Net profit margin 11.6% 11.7% Earnings per share Ordinary Preference % % 42
43 Q1: Organic growth rose considerably in all three regions Regional sales growth 1 st quarter 2014 Asia-Pacific / Africa North- and South America Group* Organic growth Currency effects External growth mn Total growth +7.2% +1.4% -0.3% 03% +3.3% 3% Organic growth +7.4% +11.0% +7.4% +7.3% Currency effects -0.5% -9.6% -7.7% -4.2% * Consolidation effect mn 43
44 Q1: Regional results show increased segment earnings for Europe EBIT 1 st quarter 2014 mn % +3.0% 30% % -8.7% 22.1 (24.2) 13.7 (15.3) -1.5 (-0.2) 75.6 (73.4) (34.1) 0 Europe Asia-Pacific, Africa North and South America Holding costs/cons. Group EBIT margin before income from at equity 14.3% 16.4% 18.2% 15.9% (previous year) (12.7) (18.1) (20.2) (15.9) 44
45 Q1: Net operating working capital increased as expected Cash flow mn Q Q Gross cash flow Changes in net operating working capital Other changes Operating cash flow Capex Other changes Free cash flow
46 Q2: EBIT of 75.6 mn below previous year mn Q Q Variance Sales revenues % Gross profit % Gross profit margin 37.2% 37.9% Admin., sales, R&D and other net operating expenses % Expenses as a percentage of sales 21.6% 21.5% EBIT before at equity income % EBIT margin before at equity income 15.7% 16.4% Income from participations % EBIT % Earnings after tax % Net profit margin 11.4% 12.0% Earnings per share ordinary % preference % 46
47 Q2: Organic growth in Asia/Pacific, Africa and Americas Regional sales growth 2 nd quarter 2014* Asia/Pacific, Africa North and South America Group mn Organic growth Currency effects External growth Total growth -1.9% +0.4% -1.9% -1.2% Organic growth -1.7% +8.3% +5.5% 5% +2.3% Currency effects -0.4% -7.9% -7.4% -3.6% External growth +0.2% % * Consolidation effect 0.6 million 47
48 Q2: EBIT of 75.6 mn below previous year EBIT 2 nd quarter 2014 mn % -11.8% 23.9 (27.1) -10.2% 14.1 (15.7) -1.3 (-2.4) -6.0% 60% 75.6 (80.4) (40.0) 0 Europe Asia-Pacific, Africa North and South America Holding costs/cons. Group EBIT margin before income from at equity 14.0% 16.6% 6% 18.1% 1% 15.7% (previous year) (14.1) (18.9) (19.8) (16.4) 48
49 Q2: Free Cash flow above previous year Cash flow mn Q Q Gross cash flow Change in working capital Other changes Operating cash flow Capex (incl. acquisitions) Other changes Free cash flow


50 1 st half year 2014 and outlook
51 The first half year 2014 Good organic growth of just under 5% substantially ti eroded d by currency effects; sales revenues rise by 1% to 919 million EBIT of 151 million just under 2% lower than in previous year, currency adjusted an EBIT increase of 2% Earnings per share at previous year s level 51
52 H1: EBIT of million below previous year by almost 2%, currency adjusted an increase of 2% mn 1-6/ /2013 Variance Sales revenues % Gross profit % 0.0% Gross profit margin 37.3% 37.7% Admin., sales, R&D and other net operating expenses % Expenses as a percentage of sales 21.5% 21.5% EBIT before at equity income % EBIT margin before at equity income 15.8% 16.1% Income from participations % EBIT % Earnings after tax % Net profit margin 11.5% 11.8% Earnings per share ordinary % 0.0% preference % 52
53 H1: Organic growth outside Europe eroded by currency effects Regional sales growth 1st half year 2014* Asia/Pacific, Africa North and South America Group Organic growth Currency effects External growth mn g Total growth +2.5% +0.9% -1.1% +1.0% Organic growth +2.7% +9.6% +6.4% +4.7% Currency effects -0.5% -8.7% -7.5% -3.9% External growth +0.2% % * Consolidation effect million 53
54 H1 2014: EBIT increase in Europe EBIT 1 st half year 2014 mn -10.3% -1.7% % % Europe Asia Pacific, North and Holding Group Africa South America costs/cons. EBIT margin before at equity income (previous year) 14.2% 16.5% 18.1% 15.8% (13.4%) (18.5%) (20.0%) (16.1%) 54
55 H1: Free cash flow at previous year s level Cash flow mn 1-6/ /2013 Gross cash flow Change in working capital Other changes Operating cash flow Capex (incl. acquisitions) Other changes Free cash flow
56 Outlook 2014 FUCHS remains committed to its forecast of organic growth in the low single-digit it range for the financial year 2014 and for the second half of the year. However, the development of currency exchange rates must be taken into account. As regards EBIT, the Group has become more cautious due to the severe loss in value of a number of currencies important t to FUCHS and expects last year s very good results to be repeated in Investments will substantially increase during the second half of the year. We expect a free cash flow of more than 100 million. 56
57 Share buyback / bonus shares 57
58 Share buyback / bonus shares Share buyback b started t on 27 November 2013, ended d on 28 April Repurchase of 740,000 ordinary shares at an average price of per share and 740,000 preference shares at an average price of per share. Total purchase price amounted to 98.4 mn ( 22.0 mn in 2013; 76.4 mn in 2014). Withdrawal of the repurchased shares in June Issuance of bonus shares through capital increase from corporate funds at the ratio of 1:1 in June 2014 New share capital: 139,000,000 69,500,000 ordinary shares and 69,500,000 preference shares Dividend policy of constantly growing or at least steady payouts will be continued. No impact on acquisition strategy. 58
59 Total return to FUCHS shareholders through dividends and share buyback Dividend id d payout and share buyback b since 2002 mn per share payout (in mn) share buyback (in mn) dividend per preference share (in ) 59
60 Shareholder structure 60
61 Breakdown of shares Ordinary shares Preference shares Free float * 47 % Family Fuchs 53 % 69,500, ,500, ordinary shares preference shares Free float 100 % *) voting rights notification: DWS Investment, Frankfurt: 5.2% (15 Dec. 2003) 61
62 Investor Relations Friesenheimer Str Mannheim Telefon +49 (0) , Fax +49 (0)
FUCHS PETROLUB SE The leading independent lubricants manufacturer of the world
 The leading independent lubricants manufacturer of the world Dr. Alexander Selent, Vice Chairman & CFO Dagmar Steinert, Head of Investor Relations January 2015 The leading independent lubricants manufacturer
FUCHS PETROLUB SE The leading independent lubricants manufacturer of the world
 The leading independent lubricants manufacturer of the world Dr. Alexander Selent, Vice Chairman & CFO Dagmar Steinert, Head of Investor Relations Main First Bank, Zurich, 5 June 2014 The leading independent
FUCHS PETROLUB SE. manufacturer of the world. Dr. Alexander Selent, Vice Chairman & CFO. April 2015
 The leading independent lubricants manufacturer of the world Dr. Alexander Selent, Vice Chairman & CFO DagmarSteinert Steinert, Headof Investor Relations April 2015 The leading independent lubricants manufacturer
FUCHS PETROLUB SE The leading independent lubricants manufacturer of the world
 FUCHS PETROLUB SE The leading independent lubricants manufacturer of the world Dr. Alexander Selent, Vice Chairman & CFO Reiner Schmidt, GMC-Member Warburg Highlights - Handout June 2015 The leading independent
FUCHS PETROLUB AG The leading independent lubricants manufacturer of the world
 The leading independent lubricants manufacturer of the world Dr. Alexander Selent, Vice Chairman & CFO Dagmar Steinert, Head of Investor Relations April 2013 FUCHS the leading independent lubricants manufacturer
FUCHS PETROLUB SE The leading independent lubricants manufacturer of the world
 FUCHS PETROLUB SE The leading independent lubricants manufacturer of the world Dr. Alexander Selent, Vice Chairman & CFO Dagmar Steinert, Head of Investor Relations DZ BANK Equity Conference on 18 and
FUCHS PETROLUB AG. manufacturer of the world. Tina Vogel, Head of Public Relations. MainFirst Chemicals One-on-One Forum 27 June 2013
 The leading independent lubricants manufacturer of the world Reiner Schmidt, Member of the Group Management Committee Tina Vogel, Head of Public Relations MainFirst Chemicals One-on-One Forum 27 June 2013
FUCHS PETROLUB AG. Dagmar Steinert, Head of Investor Relations. May 2013
 The lubricants specialist Stefan Fuchs, CEO Dagmar Steinert, Head of Investor Relations May 2013 Overview and business model 2 FUCHS the lubricants specialist Founded d in 1931 2012 sales revenues: 1.8
FUCHS GROUP. Setting Standards - Worldwide
 FUCHS GROUP Setting Standards - Worldwide dbaccess German, Swiss & Austrian Conference, 8 th June 2016, Berlin Stefan Fuchs, CEO Thomas Altmann, Investor Relations Agenda 01 The Leading Independent Lubricants
FUCHS GROUP. Setting Standards - Worldwide
 FUCHS GROUP Setting Standards - Worldwide Commerzbank Sector Conference, 30 th August 2016, Frankfurt Dagmar Steinert, CFO Thomas Altmann, Investor Relations Agenda 01 The Leading Independent Lubricants
FUCHS PETROLUB SE The lubricants specialist
 The lubricants specialist Stefan Fuchs, CEO Reiner Schmidt, Member of the Group Management Committee Commerzbank Sector Conference Week 27 August 2013 Overview and business model 2 FUCHS the lubricants
FUCHS PETROLUB SE Capital Market Day
 Capital Market Day Stefan Fuchs, Chairman of the Board Dr. Alexander Selent, Vice Chairman & CFO 17 September 2014 Group organisation Stefan Fuchs Dr. Alexander Selent Dr. Lutz Lindemann Dr. Ralph Rheinboldt
FUCHS GROUP. Setting Standards - Worldwide. September 2016, Munich Dagmar Steinert, CFO Thomas Altmann, Investor Relations
 FUCHS GROUP Setting Standards - Worldwide September 2016, Munich Dagmar Steinert, CFO Thomas Altmann, Investor Relations Agenda 01 The Leading Independent Lubricants Company 02 H1 2016 03 Shares 04 Appendix
FUCHS GROUP. Setting Standards - Worldwide. Roadshow Presentation November 2016 Dagmar Steinert, CFO Thomas Altmann, Investor Relations
 FUCHS GROUP Setting Standards - Worldwide Roadshow Presentation November 2016 Dagmar Steinert, CFO Thomas Altmann, Investor Relations Agenda 01 The Leading Independent Lubricants Company 02 Q1-3 2016 03
FUCHS PETROLUB SE. Roadshow Presentation. 23 rd March 2016 Frankfurt Dagmar Steinert / Thomas Altmann
 FUCHS PETROLUB SE Roadshow Presentation 23 rd March 2016 Frankfurt Dagmar Steinert / Thomas Altmann Agenda 01 02 03 04 Our company Consolidated Financial Statements 2015 Balance Sheet, Cash flow, FVA 2015
FUCHS GROUP. Setting Standards - Worldwide. Company Presentation, January 2017 Dagmar Steinert, CFO Thomas Altmann, Head of Investor Relations
 FUCHS GROUP Setting Standards - Worldwide Company Presentation, January 2017 Dagmar Steinert, CFO Thomas Altmann, Head of Investor Relations Agenda 01 The Leading Independent Lubricants Company 02 Q1-3
FUCHS PETROLUB / 1st half year 2014 Analyst Conference Call
 FUCHS PETROLUB / 1st half year 2014 Analyst Conference Call Dr. Alexander Selent, Vice Chairman & CFO Reiner Schmidt, Member of the Group Management Committee Dagmar Steinert, Head of Investor Relations
FUCHS GROUP. Setting Standards - Worldwide. Company Presentation, March 2017 Dagmar Steinert, CFO Thomas Altmann, Head of Investor Relations
 FUCHS GROUP Setting Standards - Worldwide Company Presentation, March 2017 Dagmar Steinert, CFO Thomas Altmann, Head of Investor Relations Agenda 01 The Leading Independent Lubricants Company 02 FY 2016
FUCHS GROUP. In Motion. Company Presentation, May 2017 Dagmar Steinert, CFO Thomas Altmann, Head of Investor Relations
 FUCHS GROUP In Motion Company Presentation, May 2017 Dagmar Steinert, CFO Thomas Altmann, Head of Investor Relations Agenda 01 The Leading Independent Lubricants Company 02 Q1 2017 03 Shares 04 Appendix
FUCHS GROUP. In Motion. Investor Presentation, June 2017 Stefan Fuchs, CEO Thomas Altmann, Head of Investor Relations
 FUCHS GROUP In Motion Investor Presentation, June 2017 Stefan Fuchs, CEO Thomas Altmann, Head of Investor Relations Agenda 01 The Leading Independent Lubricants Company 02 Q1 2017 03 Shares 04 Appendix
FUCHS GROUP. In Motion. Investor Presentation, November 2017 Dagmar Steinert, CFO Thomas Altmann, Head of Investor Relations
 FUCHS GROUP In Motion Investor Presentation, November 2017 Dagmar Steinert, CFO Thomas Altmann, Head of Investor Relations Agenda 01 02 03 04 The Leading Independent Lubricants Company Q1-3 2017 Shares
FUCHS GROUP. In Motion. Investor Presentation, September 2017 Dagmar Steinert, CFO Thomas Altmann, Head of Investor Relations
 FUCHS GROUP In Motion Investor Presentation, September 2017 Dagmar Steinert, CFO Thomas Altmann, Head of Investor Relations Agenda 01 02 The Leading Independent Lubricants Company H1 2017 03 Shares 04
FUCHS GROUP. Setting Standards - Worldwide. FUCHS Capital Market Day, 8 th September 2016, Mannheim Stefan Fuchs, CEO Dagmar Steinert, CFO
 FUCHS GROUP Setting Standards - Worldwide FUCHS Capital Market Day, 8 th September 2016, Mannheim Stefan Fuchs, CEO Dagmar Steinert, CFO The executive board Stefan Fuchs: CEO, Corporate Development, HR,
FUCHS GROUP. New Thinking. FUCHS Capital Market Day, June 2018 Stefan Fuchs, CEO Dagmar Steinert, CFO
 FUCHS GROUP New Thinking FUCHS Capital Market Day, June 2018 Stefan Fuchs, CEO Dagmar Steinert, CFO FUCHS at a glance Established 3 generations ago as a family-owned business No. 1 among the independent
FUCHS PETROLUB / Q2/2015 Conference Call
 FUCHS PETROLUB / Q2/2015 Conference Call Dr. Alexander Selent, Vice Chairman & CFO Dagmar Steinert, Head of Investor Relations Mannheim, 4 August 2015 For the first time FUCHS generates group sales of
FUCHS GROUP. In Motion. Investor Presentation, January 2018 Dagmar Steinert, CFO Thomas Altmann, Head of Investor Relations
 FUCHS GROUP In Motion Investor Presentation, January 2018 Dagmar Steinert, CFO Thomas Altmann, Head of Investor Relations Agenda 01 02 03 04 The Leading Independent Lubricants Company Q1-3 2017 Shares
FUCHS PETROLUB / Q1 2013
 FUCHS PETROLUB / Q1 2013 Conference Call Dr. Alexander Selent, Vice Chairman and CFO Reiner Schmidt, Member of the Group Management Committee Mannheim, 2 May 2013 FUCHS increases EBIT to 73.4 million and
FUCHS PETROLUB / Q Conference Call
 FUCHS PETROLUB / Q1 2014 Conference Call Dr. Alexander Selent, Vice Chairman & CFO Dagmar Steinert, Head of Investor Relations Mannheim, 5 May 2014 Changes in the Board of Directors of Dr. Georg Lingg,
FUCHS GROUP. New Thinking. Investor Presentation, March 2018 Thomas Altmann, Head of Investor Relations
 FUCHS GROUP New Thinking Investor Presentation, March 2018 Thomas Altmann, Head of Investor Relations Agenda 01 02 03 04 The Leading Independent Lubricants Company FY 2017 Shares Appendix l 2 01 The Leading
FUCHS GROUP. New Thinking. Investor Presentation, June 2018 Dagmar Steinert, CFO Thomas Altmann, Head of Investor Relations
 FUCHS GROUP New Thinking Investor Presentation, June 2018 Dagmar Steinert, CFO Thomas Altmann, Head of Investor Relations Agenda 01 02 03 04 The Leading Independent Lubricants Company Q1 2018 Shares Appendix
FUCHS GROUP. New Thinking. Investor Presentation, September 2018
 FUCHS GROUP New Thinking Investor Presentation, September 2018 Agenda 01 02 03 04 The Leading Independent Lubricants Company H1 2018 Shares Appendix l 2 01 The Leading Independent Lubricants Company FUCHS
FUCHS GROUP. Investor Presentation. November 2018 Dagmar Steinert, CFO Thomas Altmann, Head of Investor Relations
 FUCHS GROUP Investor Presentation November 2018 Dagmar Steinert, CFO Thomas Altmann, Head of Investor Relations Agenda 01 02 03 04 The Leading Independent Lubricants Company Q1-3 2018 Shares Appendix l
FUCHS Group. Financial Results Analysts' Conference, 21 st March 2017, Frankfurt Stefan Fuchs, CEO Dagmar Steinert, CFO
 FUCHS Group Financial Results 2016 Analysts' Conference, 21 st March 2017, Frankfurt Stefan Fuchs, CEO Dagmar Steinert, CFO Agenda 01 Full Year 2016 02 Outlook 2017 l 2 01 Full Year 2016 Highlights FY
FUCHS GROUP. Financial Results Analyst s Conference, 21 st March 2018, Frankfurt Stefan Fuchs, CEO Dagmar Steinert, CFO
 FUCHS GROUP Financial Results 2017 Analyst s Conference, 21 st March 2018, Frankfurt Stefan Fuchs, CEO Dagmar Steinert, CFO Highlights FY 2017 Sales +9% to 2.5 bn Strong organic growth in Asia-Pacific,
Q Quarterly Statement as at September 30, 2016
 Q1 3 2016 Quarterly Statement as at September 30, 2016 Sales revenues increase by 11 % to 1.7 billion Earnings (EBIT) up 6 % to 276 million Outlook for the financial year 2016 reaffirmed: Organic and acquisition-based
QUARTERLY REPORT. For the first half of >> Profit for first half considerably higher than previous year Second quarter confirms positive outlook
 QUARTERLY REPORT For the first half of 2007 >> Profit for first half considerably higher than previous year Second quarter confirms positive outlook FUCHS PETROLUB AG THE FIRST HALF 2007 AT A GLANCE [in
+ 6 % Earnings (EBIT) increase to 297 million
 increase to 297 million") Quarterly statement as at September 30, 2018 Q3 / 2018 Sales revenues up by 5 % to 1,953 million + 6 % Earnings (EBIT) increase to 297 million (including one-off effect) Outlook updated: Sales revenue
Quarterly statement as at September 30, 2018 Q3 / 2018 Sales revenues up by 5 % to 1,953 million + 6 % Earnings (EBIT) increase to 297 million (including one-off effect) Outlook updated: Sales revenue
Outlook unchanged: Sales revenues up by 4 % to 643 million. Quarterly Statement as at March 31 Q1 / 2018
 Quarterly Statement as at March 31 Q1 / 2018 Sales revenues up by 4 % to 643 million Currencies ( 6 %) burden organic (+ 10 %) EBIT of 92 million down 2 % on previous year s high level due to currency
H Half-year financial report as at June 30
 H1 2016 Half-year financial report as at June 30 Sales revenues up by 13 % to 1,136 million Earnings (EBIT) increase to 183 million (+7 %) Outlook reaffirmed Content FUCHS at a glance 03 Half-year financial
FOR THE FIRST QUARTER OF
 Fall in demand continues As expected the profit after tax of 16.2 million remained at the level of the fourth quarter of 2008 Cost-cutting measures are taking effect Free cash flow rose to 39 million Group
2007 Revenue and Results. 2007: strong increase in results Strengthened growth momentum. February 15 th, 2008
 2007 Revenue and Results 2007: strong increase in results Strengthened growth momentum February 15 th, 2008 2007 revenue and results Agenda A successful 2007 Be the recognized industry leader John Glen
Investors Conference Commerzbank Sector Conference
 Investors Conference Commerzbank Sector Conference August 30, 2017, Frankfurt Clear focus. Sharpened profile. Draft, version 4, as of 3/8/2016, 11:20 a.m. Disclaimer Note: This presentation contains statements
FUCHS GROUP. Financial Results Q Analyst s Conference, 30 th October 2018 Dagmar Steinert, CFO
 FUCHS GROUP Financial Results Q1-3 2018 Analyst s Conference, 30 th October 2018 Dagmar Steinert, CFO Highlights Q1-3 2018 Sales +5% to 1,953 mn EBIT increase by 6% to 297 mn (including 12 mn one-off effect)
Global Construction 2030 Expo EDIFICA 2017 Santiago Chile. 4-6 October 2017
 Global Construction 2030 Expo EDIFICA 2017 Santiago Chile 4-6 October 2017 Graham Robinson Global Construction Perspectives Global Construction 2030 is the fourth in a series of global studies of the construction
Investors Conference quirin Champions 2017
 Investors Conference quirin Champions 2017 June 1, 2017, Frankfurt Clear focus. Sharpened profile. Draft, version 4, as of 3/8/2016, 11:20 a.m. Disclaimer Note: This presentation contains statements concerning
+2 % Earnings (EBIT) increase
 increase") Statement as at September 30 Q3Quarterly 2017 Sales revenues rise by 9 % to 1,862 million +2 % Earnings (EBIT) increase Earnings outlook adjusted to 281 million Content FUCHS at a glance 03 Business development
Statement as at September 30 Q3Quarterly 2017 Sales revenues rise by 9 % to 1,862 million +2 % Earnings (EBIT) increase Earnings outlook adjusted to 281 million Content FUCHS at a glance 03 Business development
FINANCIAL RESULTS 2012 CONTINUED REVENUE GROWTH, ABOVE AVERAGE INCREASE IN PROFIT AND FURTHER INVESTMENTS IN EMERGING MARKETS
 FINANCIAL RESULTS 2012 CONTINUED REVENUE GROWTH, ABOVE AVERAGE INCREASE IN PROFIT AND FURTHER INVESTMENTS IN EMERGING MARKETS SIKA ROADSHOW PRESENTATION / BAAR MARCH 2013 SHORT LIST World market leader
2014 Interim report as at March 31
 2014 Interim report as at March 31 sales revenues up 3.3 % despite unfavorable currency effects earnings before interest and tax (EBIT) increase by 3.0 % to 75.6 million outlook for the financial year
Imerys and S&B: A strategic combination
 Accelerating development, strengthening core business, creating value Gilles MICHEL - Chairman & CEO Michel DELVILLE - CFO Disclaimer More comprehensive information about Imerys may be obtained on its
Quaker Chemical Corporation. Investor Presentation. August 2016
 Quaker Chemical Corporation Investor Presentation August 2016 1 Risk and Uncertainties Statement Regulation G The attached charts include Company information that does not conform to generally accepted
Henkel AG & Co. KGaA. Klaus Keutmann Frankfurt,
 Henkel AG & Co. KGaA Klaus Keutmann Frankfurt, 21.01.2015 Disclaimer This information contains forward-looking statements which are based on current estimates and assumptions made by the corporate management
Positive trend in earnings and strong cash flow
 Positive trend in earnings and strong cash flow Presentation of the Q3/2017 result Martin Lindqvist, President & CEO Håkan Folin, CFO October 25, 2017 Agenda Q3/2017 and performance by division Financials
Strong performance in a challenging environment
 Investor Relations News February 20, 2014 Henkel delivers on 2013 financial targets Strong performance in a challenging environment Solid organic sales growth of 3.5% Sales impacted by foreign exchange
AEGIS GROUP PLC 2008 ANNUAL RESULTS. 19 March 2009
 AEGIS GROUP PLC 2008 ANNUAL RESULTS 19 March 2009 AGENDA OVERVIEW OF RESULTS John Napier FINANCIAL REVIEW Alicja Lesniak OUTLOOK John Napier Q&A Aegis Group plc Page 2 OVERVIEW OF RESULTS John Napier,
Financial Information
 Financial Information H1 revenues reached 12.8bn up 9.8%, flat org. in Q2 Adj. EBITA reached 1.6bn, up 6.4%, Adj. EBITA margin flat excl. Invensys in a challenging environment 2015 targets: Around flat
Global Styrene Butadiene Rubber (SBR) Market Study ( )
 Market Study ( )") Global Styrene Butadiene Rubber (SBR) Market Study (2014 2025) Table of Contents 1. INTRODUCTION 1.1. Introduction to SBR Market Product Description Properties Industry Structure Value Chain Market Dynamics
Global Styrene Butadiene Rubber (SBR) Market Study (2014 2025) Table of Contents 1. INTRODUCTION 1.1. Introduction to SBR Market Product Description Properties Industry Structure Value Chain Market Dynamics
BUSINESS YEAR 2017/18 1 st QUARTER
 BUSINESS YEAR 2017/18 1 st QUARTER Investor Relations September 2017 www.voestalpine.com voestalpine GROUP OVERVIEW» voestalpine is a leading technology and capital goods group with combined material and
July 26, 2017 LafargeHolcim Ltd 2015
 Second Quarter 2017 Results Beat Hess, Chairman and Interim CEO Roland Köhler, Interim COO and Regional Head of Europe, Australia/NZ & Trading Ron Wirahadiraksa, CFO July 26, 2017 LafargeHolcim Ltd 2015
Bilfinger Berger: Entering new growth phase
 Bilfinger Berger: Entering new growth phase Roadshow London, Roland Koch, CEO Andreas Müller, Head of Corporate Accounting and Investor Relations Agenda 1. Bilfinger Berger Overview 2. Preliminary figures
GLOBAL LIQUID CRYSTAL POLYMER (LCP) RESINS MARKET RESEARCH REPORT,
 RESINS MARKET RESEARCH REPORT,") GLOBAL LIQUID CRYSTAL POLYMER (LCP) RESINS MARKET RESEARCH REPORT, 2005-2025 Prismane Consulting 519 Amanora Chambers, Magarpatta Road, Hadapsar, Pune 411028, India. sales@prismaneconsulting.com 1. INTRODUCTION
GLOBAL LIQUID CRYSTAL POLYMER (LCP) RESINS MARKET RESEARCH REPORT, 2005-2025 Prismane Consulting 519 Amanora Chambers, Magarpatta Road, Hadapsar, Pune 411028, India. sales@prismaneconsulting.com 1. INTRODUCTION
Credit Suisse 2008 Global Steel and Mining Conference, London, September 24, ThyssenKrupp
 0 Cornerstones of the Group s Strategy 1 Increasing earnings Active portfolio management Growth in core businesses Group initiatives/measures Divestments Capex (billion ) 10-12 TKS TKL Steel Focus on America
New Debt Issue Investor Presentation. September 2007
 Carrefour Group Representatives Eric Reiss Chief Financial Officer Jean-Brieuc Le Tinier Director of Corporate Treasury 2 Summary Group Overview Business Strategy Financial overview Key credit strengths
Text. improvement in earnings. Textdemand drove continued
 Good Textdemand drove continued improvement in earnings Text Presentation of the Q2/2018 results Martin Lindqvist, President & CEO Håkan Folin, CFO July 20, 2018 Agenda Market and demand trends Performance
ElringKlinger Group. Mobilität erfahren Zukunft entwickeln. Experience mobility Drive the future. Conference Call Results Third Quarter 2009
 ElringKlinger Group Mobilität erfahren Zukunft entwickeln. Experience mobility Drive the future. Conference Call Results Third Quarter 2009 1 Q3 2009: News and Business Trends! Unprecedented weakness in
Global Helicopter Forecast
 Global Helicopter Forecast C&P untapped demand is rising Key world economies are still underequipped TOP 10 Countries in 2016 ( H/C fleet in service) U.S.A. Russia Canada Brazil Australia United Kingdom
2018 Results and Outlook. February 22, 2019
 2018 Results and Outlook February 22, 2019 1. 2018 HIGHLIGHTS 2. 2018 RESULTS 3. STRATEGY 4. OUTLOOK 2 / Sales Actual Like-for-like Operating income Actual 41.8bn +2.4% +4.4% 3,122m +3.1% +4.5% Operating
HALF-YEAR RESULTS 2014 AND STRATEGY 2018 SIKA PRESENTATION JULY 2014
 HALF-YEAR RESULTS 2014 AND STRATEGY 2018 SIKA PRESENTATION JULY 2014 1. HIGHLIGHTS AND RESULTS HALF-YEAR 2014 HIGHLIGHTS HALF-YEAR 2014 Strategy 2018 well on track 18.1% sales growth (10.6% in CHF) to
Goldman Sachs BRICs Conference
 Goldman Sachs BRICs Conference Markus Akermann CEO Bandra Worli Sea Link Mumbai Holcim Ltd 2010 Founded back in 1912 Holcim started its internationalisation more than 80 years ago 1953 1912 1925 1990 1955
Analysts Conference Full Year Results 2004 Frankfurt, March 22, pm
 Analysts Conference Full Year Results 2004 Frankfurt, March 22, 2005 3.00pm Page 4 Page 17 Page 32 Presentation of Dr Wolfgang Reitzle President & CEO, Linde AG Presentation of Dr Peter Diesch CFO, Linde
Roadshow Frankfurt // Kepler Cheuvreux
 Roadshow Frankfurt // Kepler Cheuvreux HUGO BOSS Company Handout August 5, 2014 Mark Langer (CFO) & Dennis Weber (Head of Investor Relations) Roadshow Frankfurt // Kepler Cheuvreux HUGO BOSS August 5,
Financial Results for the First Quarter Ended June 30, 2015
 July 29, 2015 Company name : Nissan Motor Co., Ltd. Code no : 7201 (URL http://www.nissan-global.com/en/ir/) Representative : Carlos Ghosn, President Contact person : Joji
Interim announcement 1 st quarter 2016
 Interim announcement 1 st quarter 2016 Danfoss at a glance Danfoss engineers technologies that enable the world of tomorrow to do more with less. We meet the growing need for infrastructure, food supply,
Henkel s sales and earnings reaching record levels
 Press Release March 6, 2013 2012 targets fully achieved Henkel s sales and earnings reaching record levels Sales rise 5.8 percent to 16,510 million euros (organic: +3.8%) Adjusted* operating profit: +15.1
SKF Group Presented by Tom Johnstone President and CFO
 SKF Group Presented by Tom Johnstone President and CFO SKF Capital Markets Day 2008 SKF Group Vision To equip the world with SKF knowledge SKF Group financial targets Operating margin, level 12 % Growth
2011 Results and Outlook. Paris, February 17, 2012
 2011 Results and Outlook Paris, February 17, 2012 Contents 1. 2011 Highlights 2. 2011 Results 3. Strategy C O N T E N T S 4. Outlook and Objectives for 2012 1. 2011 Highlights 2011 key figures Amounts
Wacker Neuson SE. Analyst conference results for Q May 14, Dr.-Ing. Georg Sick, CEO - Mag. Günther Binder, CFO.
 Wacker Neuson SE Analyst conference results for Q1 2009 May 14, 2009 Dr.-Ing. Georg Sick, CEO - Mag. Günther Binder, CFO Overview Summary Q1 2009 Financials Q1 2009 Outlook 2 Wacker Neuson SE maintained
Global Research and Development Expenditures: Fact Sheet
 Global Research and Development Expenditures: Fact Sheet John F. Sargent Jr. Specialist in Science and Technology Policy June 16, 2017 Congressional Research Service 7-5700 www.crs.gov R44283 R esearch
ThyssenKrupp AG 3rd Annual Stockholders Meeting
 1 AG 3rd Annual Stockholders Meeting Essen, March 1, 2002 Report by the Executive Board Chairman 2 The Group s strategy stock An overview of fiscal year 2000/2001 1st quarter 2001/2002 and outlook strategic
Henkel FY Kasper Rorsted Carsten Knobel. Düsseldorf March 4, 2015
 Henkel FY 2014 Kasper Rorsted Carsten Knobel Düsseldorf March 4, 2015 Disclaimer This information contains forward-looking statements which are based on current estimates and assumptions made by the corporate
Investor Meeting Presentation
 Investor Meeting Presentation November 2014 Investor Meeting Presentation HUGO BOSS November 2014 2 / 54 Agenda Update on Key Strategic Initiatives Nine Months Results 2014 Outlook Investor Meeting Presentation
On Track to Meet Strategic Growth Targets
 The Shard, London On Track to Meet Strategic Growth Targets 2011 Financial Results March 1, 2012 2 Itinerary Welcome (Dr. Walter Grüebler) 2011 Financial Statements (Ronald Trächsel) Trends, Strategy,
The LEONI Group. 1 st Quarter The Quality Connection
 The LEONI Group 1 st Quarter 2015 The Quality Connection Contents 1. LEONI Group 2. LEONI Divisions 3. Report 1 st Quarter 2015 4. Outlook 5. Appendix LEONI AG 2 LEONI Group Divisions 2014 Divisions Sales
Updated Summary of Consolidated Financial Statements for Third Quarter of Fiscal Year Ending March 31, 2017(Japan GAAP)
") Updated Summary of Consolidated Financial Statements for Third Quarter of Fiscal Year Ending March 31, 2017(Japan GAAP) February 10, 2017 Listed Exchanges: TSE Name of Listed Company: Ishihara Sangyo Kaisha,
Updated Summary of Consolidated Financial Statements for Third Quarter of Fiscal Year Ending March 31, 2017(Japan GAAP) February 10, 2017 Listed Exchanges: TSE Name of Listed Company: Ishihara Sangyo Kaisha,
Investors Conference HSBC SRI Conference. February 7, 2017, Frankfurt. Driving transformation. Shaping the future.
 Investors Conference HSBC SRI Conference February 7, 2017, Frankfurt Driving transformation. Shaping the future. Disclaimer Note: This presentation contains statements concerning the future business trend
Summary of Consolidated Financial Statements for First Quarter of Fiscal Year Ending March 31, 2018(Japan GAAP)
") Summary of Consolidated Financial Statements for First Quarter of Fiscal Year Ending March 31, 2018(Japan GAAP) August 10, 2017 Listed Exchanges: TSE Name of Listed Company: Ishihara Sangyo Kaisha, Ltd.
Summary of Consolidated Financial Statements for First Quarter of Fiscal Year Ending March 31, 2018(Japan GAAP) August 10, 2017 Listed Exchanges: TSE Name of Listed Company: Ishihara Sangyo Kaisha, Ltd.
Driving innovation. Developing potential.
 Driving innovation. Developing potential. Presentation of the 2017 Annual Report Frankfurt, March 22, 2018 Andreas Busemann, CEO Oliver Schuster, CFO Volker Schenk, CSO Disclaimer Note: This presentation
Report on Finnish Technology Industry Exports
 Report on Finnish Technology Industry Exports Last observation October 2018, 2.1.2019 Goods Export of Technology Industry from Finland Goods Export of Technology Industry from Finland by Branches Source:
2015 Results and Outlook. February 26, 2016
 2015 Results and Outlook February 26, 2016 2015 HIGHLIGHTS 2015 RESULTS STRATEGY OUTLOOK 2 2015 HIGHLIGHTS 3 2015 KEY FIGURES (Following the sale of the Packaging business and in accordance with IFRS 5,
The world s leading infrastructure developer. April 2012
 The world s leading infrastructure developer Investors Presentation Company profile, strategy and key financials April 2012 Grupo ACS The world s leading infrastructure developer Engineering contractor
Roadshow London // Deutsche Bank
 Roadshow London // Deutsche Bank HUGO BOSS Company Handout August 6, 2014 Mark Langer (CFO) & Dennis Weber (Head of Investor Relations) Roadshow London // Deutsche Bank HUGO BOSS August 6, 2014 2 / 52
CEOs Less Optimistic about Global Economy for 2015
 Press Release Date 22 January 2014 Contact Vu Thi Thu Nguyet Tel: (04) 3946 2246, Ext. 4690; Mobile: 0947 093 998 E-mail: vu.thi.thu.nguyet@vn.pwc.com Pages 6 CEOs Less Optimistic about Global Economy
highlights key figures dividend outlook organic revenue growth +5% earnings per share +16% continued investments in growth and innovations
 organic revenue growth +5% earnings per share +16% continued investments in growth and innovations Utrecht, 26 February 2019 highlights revenue +2% to EUR 2,759 million (organic +5%) operating profit (EBITA)
1 st Quarter, 2014 Danfoss delivers strong first quarter
 1 st Quarter, 2014 Danfoss delivers strong first quarter www.danfoss.com www.danfoss.com Danfoss at a glance Danfoss is a world-leading supplier of technologies that meet the growing need for food supply,
2011 Annual Results. Martin Hirzel, Chief Executive Officer (CEO)
") 2011 Annual Results Martin Hirzel, Chief Executive Officer (CEO) Independent company since May 13, 2011 Autoneum successfully mastered its first year of independence in 2011 and enjoys the ongoing confidence
2011 Annual Results Martin Hirzel, Chief Executive Officer (CEO) Independent company since May 13, 2011 Autoneum successfully mastered its first year of independence in 2011 and enjoys the ongoing confidence
Linde Group. January - June 2006 Conference Call. July 28, Dr Peter Diesch, CFO
 January June 2006 Conference Call July 28, 2006 Dr Peter Diesch, CFO Contents 04 Linde Group 09 Gas & Engineering 11 Linde Gas 18 Linde Engineering 21 Material Handling 2 Disclaimer This investor presentation
Vontobel Summer Conference
 Pierre L. Ozendo Member of the Executive board Head of Asia Division Cautionary note on forward-looking statements Slide 2 Certain statements contained herein are forward-looking. These statements provide
Economic Stimulus Packages and Steel: A Summary
 Economic Stimulus Packages and Steel: A Summary Steel Committee Meeting 8-9 June 2009 Sources of information on stimulus packages Questionnaire to Steel Committee members, full participants and observers
BUSINESS YEAR 2017/18 2 nd QUARTER, 1 st HALF
 BUSINESS YEAR 2017/18 2 nd QUARTER, 1 st HALF Investor Relations November 2017 www.voestalpine.com OVERVIEW BUSINESS MODEL» voestalpine is a leading technology and capital goods group with combined material
HeidelbergCement. Results January to March 2007 Heidelberg, 10 May 2007 Dr. Bernd Scheifele, CEO and Dr. Lorenz Näger, CFO
 HeidelbergCement Results January to March 2007 Heidelberg, 10 May 2007 Dr. Bernd Scheifele, CEO and Dr. Lorenz Näger, CFO Slide 1-09.05.2007 Contents Overview Key figures Results per Group area Financial
Linde Group. January - March 2006 Conference Call. April 26, Dr Peter Diesch, CFO
 January - March 2006 Conference Call April 26, 2006 Dr Peter Diesch, CFO Contents 04 Linde Group 09 Gas & Engineering 11 Linde Gas 19 Linde Engineering 22 Material Handling 2 Disclaimer This investor presentation