Interactive Brokers Group Investor Presentation. Third Quarter 2017
|
|
|
- Lily Osborne
- 6 years ago
- Views:
Transcription

1 Interactive Brokers Group Investor Presentation Third Quarter 2017
2 Disclaimer The following information contains certain forward-looking statements that reflect the Company s current views with respect to certain current and future events and financial performance. These forward-looking statements are and will be, as the case may be, subject to many risks, uncertainties and factors relating to the Company s operations and business environment which may cause the Company s actual results to be materially different from any future results, expressed or implied, in these forward-looking statements. Any forward-looking statements are based upon information available to the Company on the date of this presentation. The Company does not undertake to publicly update or revise its forward-looking statements even if experience or future changes make it clear that any statements expressed or implied therein will not be realized. Additional information on risk factors that could potentially affect the Company s financial results may be found in the Company s filings with the Securities and Exchange Commission. 1
3 Our Business Today We began as a market maker in 1977 and used this technology and knowledge to launch our electronic brokerage business in 1993 Today, we are: Largest publicly-traded U.S. electronic broker as measured by DARTs Fastest organically-growing U.S. electronic broker as measured by client accounts and equity Broad global reach Access to over 120 markets in 26 countries Highly efficient, scalable business model $1.2M net revenue / employee (4)(5) Recognized industry leader - Rated as Low Cost Broker 16 years in a row by Barron s 457,000 $6.3B 695,000 61% 23% client accounts (3) equity capital (3) Daily avg. brokerage pretax YoY (3) revenue trades (1)(2) margin (1) account growth (1) 3Q17 (2) DARTs are based on client orders (3) 9/30/17 (4) Excludes extraordinary items from market maker, currency & MtM on U.S. Treasuries (5) Trailing 12 months to 9/30/17 2
4 Who we are Where we are going We aim to grow the following five market segments worldwide: Individuals Prop Trading Groups Hedge and Mutual Funds Registered Investment Advisors Introducing Brokers 3
5 Strong Balance Sheet Since our IPO 10 years ago, we have maintained a strong and growing balance sheet At May 2007 At September 30, 2017 Long-term debt $0.3 billion $0 Total equity $2.8 billion $6.3 billion + $3.5 billion in dividends distributed since IPO Excess regulatory capital $1.2 billion $4.9 billion Public shares 40 million 10% 72 million 17% Private ownership 360 million 90% 340 million 83% Total 400 million 100% 412 million 100% 4


6 Corporate Strategy Automation allows IB to be the lowest cost processor in our industry Majority of senior management are software engineers From account opening to the entire transaction lifecycle, our processes are automated As a result, we were able to execute, clear and settle over 1.1 million trades per day in 3Q 2017 across multiple product classes at over 120 market centers in 26 countries with 1,190 (3Q17 average) employees Automated, real-time risk management 5 Excludes MtM on Treasuries and extraordinary events: Singapore losses in 2013 and CHF client losses in 2015.


7 Diversified Enterprise Brokerage Accounts Brokerage Client Equity Brokerage Year To Date Commissions by Client 457K $478M $116B Individual traders and investors 36% Financial advisors 24% Individual traders and investors 50% Financial advisors 17% Introducing brokers 19% Proprietary trading groups 12% Introducing brokers 8% Proprietary trading groups 17% Hedge and mutual funds 9% Hedge and mutual funds 8% As of September 30,


8 Client Geographic Distribution Our clients reside in over 200 countries 7

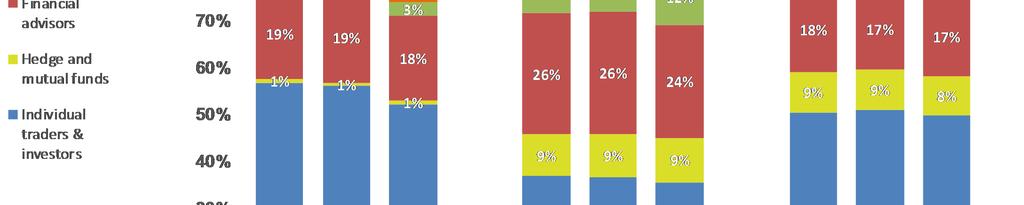
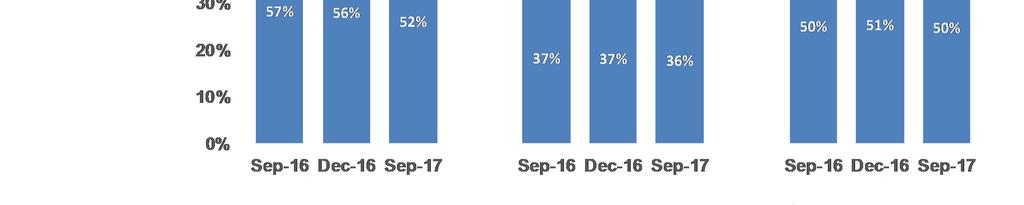
9 Client Segment Distribution 8
10 Our Competitive Strengths Low Cost & Best Execution Low execution costs: U.S. Stock $ to $0.0035/ share U.S. Options $0.15 to $0.70/ contract (1) U.S. margin interest rates range from 1.41% to 2.66% (1) IB achieves the industry s best price improvement (2) because we do not sell client order flow Breadth of Product Clients can trade on 120+ market centers in 26 countries and 22 currencies Seamless electronic market access to stocks, options, futures, forex, bonds, funds and ETFs from a single IB Universal Account TM Superior Trading Technology Sophisticated marketmaker designed technology Multiple desktop and mobile trading platforms Advanced trading tools 60+ order types and algos API solutions (1) For additional information see (2) See 9
11 Our Competitive Strengths The cost to buy or sell a security includes: 1. Commissions charged by your broker IB provides: 1. Low commission rates U.S. Stock $ to $0.0035/ share U.S. Options $0.15 to $0.70/ contract (1) 2. Execution fees charged by the exchanges 2. No mark up of exchange fees IB customers pay only what an exchange charges (2) 3. Execution price on your purchase or sale 3. Smartrouter sm technology Seeks to obtain the all-in lowest price on purchases and highest price on sales All-in price includes commissions and fees, less any rebates offered by exchanges IB does not sell order flow to other brokers (1) For additional information see (2) IB s Tiered commission models are not intended to be a direct pass-through of exchange and third-party fees and rebates. See for more information. 10
12 Client All-in Execution Costs Interactive Brokers Reg. NMS Stock Trading Expense Summary basis points Total Commissions & Fees 3.0 Execution Cos t 4.0 Previous Oct '16 Nov '16 Dec '16 Jan '17 Feb '17 Mar '17 Apr '17 May '17 Jun '17 Jul '17 Aug '17 Sep '17 12 Months Total Commissions & Fees Execution Cost Net Expense (basis points) Cost to trade U.S. stocks for the 12-month period ended September 30, 2017: IB s average commissions and fees were 1.1 basis points IB s Smartrouting SM technology led to execution prices that were an average 0.2 basis points better than daily VWAP The average all-in cost of an IBKR client trade was 0.9 basis points (1) 11 (1) In a U.S. Reg.-NMS stock, as measured against daily VWAP (Volume Weighted Average Price)
13 Cost Comparison Rated as Low Cost Broker 16 years in a row by Barron s U.S. Margin Loan Rates Comparison* Commission Rates Comparison* Margin Loan Amount $25K $300K $1.5M $3.5M Equity Trades Option Trades Futures Trades Interactive Brokers 2.66% 2.32% 2.02% 1.78% $2.45 E-Trade 9.25% 7.75% 6.25% 6.25% $6.95 Fidelity 8.07% 6.82% 4.25% 4.25% $4.95 $0.00 base $0.72 per contract $6.95 base + $0.75 per contract $4.95 base + $0.65 per contract $1.70 exchange & regulatory fees plus $1.50 N/A Schwab 8.07% 6.82% 6.25% 6.00% $4.95 TD Ameritrade 9.00% 7.50% 6.75% 6.75% $6.95 Vanguard 7.25% 6.00% 5.25% 5.25% $7-$20 $4.95 base + $0.65 per contract $6.95 base + $0.75 per contract $7.00 base + $1.00 per contract $3.50 exchange & regulatory fees plus $2.25 N/A * Rates were obtained on October 25, 2017 from each firm s website. Each firm s information reflects the standard online trades pricing obtained from their respective websites. Competitor pricing and offers subject to change without notice. Some of the firms listed may have additional fees and some firms may reduce or waive commissions or fees, depending on account activity or total account value. Supporting documentation for any claims and statistical information will be provided upon request. The IB equity and futures commission rates shown are the average of the client commissions for trades executed in September 2017 and are subject to minimums and maximums as shown on the IB website. IB has lower commission rates for larger volumes and comparable rates worldwide. Services vary by firm. IB calculates the interest charged on margin loans using the applicable rates for each interest rate tier listed on its website. 12


14 Effect of IB s Low Margin Rates 13 Industry defined as IB, AMTD, SCHW, and ETFC
15 Brokerage Expansion Market leading growth in every key metric 14 * AMTD purchased Scottrade 3Q17 IB AMTD* ETFC SCHW
16 Competition Metrics IBKR ETFC AMTD (1) SCHW 3-year 3-year 3-year Change To: 3-year 3Q2017 Change 3Q2017 Change 3Q2017 3Q17 2Q17 3Q2017 Change 3Q17 Brokerage Metrics (in thousands) ex-scottrade Number of accounts % 3,589 15% 11,004 75% 17% 10,565 14% Client equity (in billions) 3 $ % $322 35% $1,119 71% 36% $3,181 32% Average commission per DART (actual) $3.96-6% $ % $ % -17% $ % Average client equity per account $254 26% $90 17% $102-2% 16% $301 17% Total DARTs % % % 27% % DARTs per account (actual, annualized) % 14 17% 14-10% 9% 7 2% Number of employees 1,186 27% 3,584 14% 10,412 80% 15% 17,300 21% Trailing 12 Months' Financials ($ in millions) Revenues per employee $1.2 $0.6 $0.4 $0.5 Compensation per employee (in thousands) $217 $148 $117 $159 Total pretax profit 4 $787 $970 $1,394 $3,521 Pretax profit margin 55% 43% 38% 42% (1) Ameritrade bought Scottrade, 3Q17 (2) E*Trade and Charles Schwab are brokerage accounts only (3) Charles Schwab s client equity includes all client assets (4) Interactive Brokers pretax profit is adjusted for currency diversification, one-time gains and Treasury marks-to-market 15
17 Recent Enhancements and New Products Interactive Brokers Debit Mastercard Integrated financial management for our customers and advisors. Spend and borrow directly against your account and invest in securities on over 100 global exchanges. Insured Bank Deposit Sweep Program Provides eligible customers with up to an additional $2.5 million of FDIC insurance on the cash in their accounts, in addition to the $250,000 of SIPC protection, for total coverage of $2.75 million. Clients will continue to earn the same competitive interest rates currently applied to cash held in their IB accounts. Forex Auto Swap Program Provides qualified IB clients who carry large forex positions that are not closed out intraday with superior carry costs. The program is offered at no cost with no commissions or markups, and lets these clients benefit from our participation in the interbank forex swaps market. Split Spread Algo Prices orders within the spread between bid and ask values, usually yielding significant price improvement when filled. Because these orders typically add liquidity, they may also have the added benefit of earning exchange rebates. Offshore Mutual Funds and Expanded Mutual Fund Offerings Now offering offshore mutual funds to our non-u.s. customers IB offers over 10,000 funds, including new exchange-traded managed funds 16
18 Investors Marketplace We are building a marketplace that brings investors, wealth managers and money managers together: 1,456 as of 10/12/17 Investing Research Technology Administration Business Development Advisors Research Software Vendors Administrators Advertising Firms Hedge Funds Education & Coaches Programming Consultants Auditing Firms Business Analysts Money Managers News Feeds Compliance Firms Careers Brokers Trading Publications Legal Firms Corporate Access Providers Tax Firms We believe that the Investors Marketplace can make it easier for the investment community to find valuable service providers, and for our partner service providers to more efficiently reach individual and institutional investors worldwide. -Thomas Peterffy, Chairman and CEO 17


19 Recognized Industry Leader IB s multiple trading platforms, extensive suite of advanced trading tools, algos and order types continue to earn awards, year after year Interactive Brokers earned an overall rating of 4.5 stars in Winner 2017 Best Broker-Dealer Futures Winner 2017 Best Broker-Dealer Options Winner 2017 Best Prime Broker Technology 1 Barron s is a registered trademark of Dow Jones & Company, Inc. For more information, see ibkr.com/awards Winner 2017 Best FCM - Technology Winner 2016 Best Options Trading Platform - Broker Winner 2016 Best Broker-Dealer Futures 18 * Supporting documentation for any claims and statistical information will be provided upon request. For additional information, please see
Interactive Brokers Group Investor Presentation. Third Quarter 2018
 Interactive Brokers Group Investor Presentation Third Quarter 2018 Disclaimer The following information contains certain forward-looking statements that reflect the Company s current views with respect
Sandler O Neill Global Exchange and Brokerage Conference June 4, Member SIPC
 Sandler O Neill Global Exchange and Brokerage Conference June 4, 2014 Member SIPC www.sipc.org 1 Disclaimer The following information contains certain forward-looking statements that reflect the Company's
KBW Securities Broker and Market Structure Conference November 19, Member SIPC
 KBW Securities Broker and Market Structure Conference November 19, 2014 Member SIPC www.sipc.org 1 Disclaimer The following information contains certain forward-looking statements that reflect the Company's
Investor Presentation. November 2012
 Investor Presentation November 2012 Disclaimer The following information contains certain forward-looking statements that reflect the Company's current views with respect to certain current and future
Investor Presentation. February, 2014
 Investor Presentation February, 2014 Disclaimer The following information contains certain forward-looking statements that reflect the Company's current views with respect to certain current and future
Keefe, Bruyette & Woods Securities Brokerage & Market Structure Conference. November 2009
 Keefe, Bruyette & Woods Securities Brokerage & Market Structure Conference November 2009 1 Disclaimer The following information contains certain forward-looking statements that reflect the Company's current
INTERACTIVE BROKERS GROUP ANNOUNCES 3Q2014 RESULTS
 INTERACTIVE BROKERS GROUP ANNOUNCES 3Q2014 RESULTS REPORTS COMPREHENSIVE LOSS PER SHARE OF $0.13, INCOME BEFORE TAXES OF $40 MILLION ON $171 MILLION IN NET REVENUES AND EARNINGS PER SHARE ON NET INCOME
INTERACTIVE BROKERS GROUP ANNOUNCES 2Q2011 RESULTS
 INTERACTIVE BROKERS GROUP ANNOUNCES 2Q2011 RESULTS REPORTS INCOME BEFORE TAXES OF $149 MILLION ON $297 MILLION IN NET REVENUES, EARNINGS PER SHARE OF $0.22 AND EARNINGS PER SHARE ON COMPREHENSIVE INCOME
INTERACTIVE BROKERS GROUP ANNOUNCES 1Q2011 RESULTS
 INTERACTIVE BROKERS GROUP ANNOUNCES 1Q2011 RESULTS REPORTS INCOME BEFORE TAXES OF $222 MILLION ON $368 MILLION IN NET REVENUES, GAAP EARNINGS PER SHARE OF $0.38 AND, ON A NON-GAAP BASIS, INCOME BEFORE
INVESTORS/ANALYSTS: Rich Fowler Charles Schwab Phone:
 News Release Contacts: MEDIA: Mayura Hooper Charles Schwab Phone: 415-667-1525 INVESTORS/ANALYSTS: Rich Fowler Charles Schwab Phone: 415-667-1841 SCHWAB REPORTS RECORD QUARTERLY NET INCOME OF $866 MILLION,
INTERACTIVE BROKERS GROUP ANNOUNCES 3Q10 RESULTS
 INTERACTIVE BROKERS GROUP ANNOUNCES 3Q10 RESULTS REPORTS INCOME BEFORE TAXES OF $162 MILLION ON $299 MILLION IN NET REVENUES, EARNINGS PER SHARE OF $0.26 GREENWICH, CONN, October 21, 2010 Interactive Brokers
INTERACTIVE BROKERS GROUP ANNOUNCES 2Q2017 RESULTS
 INTERACTIVE BROKERS GROUP ANNOUNCES 2Q2017 RESULTS REPORTS COMPREHENSIVE EARNINGS PER SHARE OF $0.41, INCOME BEFORE TAXES OF $204 MILLION ON $387 MILLION IN NET REVENUES, AND EARNINGS PER SHARE ON NET
INTERACTIVE BROKERS GROUP ANNOUNCES 3Q2017 RESULTS
 INTERACTIVE BROKERS GROUP ANNOUNCES 3Q2017 RESULTS REPORTS COMPREHENSIVE EARNINGS PER SHARE OF $0.44, INCOME BEFORE TAXES OF $268 MILLION ON $426 MILLION IN NET REVENUES, AND EARNINGS PER SHARE ON NET
The Charles Schwab Corporation
 UNITED STATES SECURITIES AND EXCHANGE COMMISSION Washington, D.C. 20549 FORM 8-K CURRENT REPORT Pursuant to Section 13 or 15(d) of The Securities Exchange Act of 1934 Date of Report (Date of earliest event
INTERACTIVE BROKERS GROUP ANNOUNCES 2011 RESULTS
 INTERACTIVE BROKERS GROUP ANNOUNCES 2011 RESULTS REPORTS INCOME BEFORE TAXES OF $745 MILLION ON $1,358 MILLION IN NET REVENUES, EARNINGS PER SHARE OF $1.40 AND EARNINGS PER SHARE ON COMPREHENSIVE INCOME
The Charles Schwab Corporation
 UNITED STATES SECURITIES AND EXCHANGE COMMISSION Washington, D.C. 20549 FORM 8-K CURRENT REPORT Pursuant to Section 13 or 15(d) of The Securities Exchange Act of 1934 Date of Report (Date of earliest event
INTERACTIVE BROKERS GROUP ANNOUNCES 4Q2017 RESULTS
 INTERACTIVE BROKERS GROUP ANNOUNCES 4Q2017 RESULTS REPORTS COMPREHENSIVE LOSS PER SHARE OF $0.02, INCOME BEFORE TAXES OF $364 MILLION ON $515 MILLION IN NET REVENUES, AND LOSS PER SHARE ON NET INCOME OF
INTERACTIVE BROKERS GROUP ANNOUNCES 2010 RESULTS
 INTERACTIVE BROKERS GROUP ANNOUNCES 2010 RESULTS REPORTS INCOME BEFORE TAXES OF $341 MILLION ON $922 MILLION IN NET REVENUES, GAAP LOSS PER SHARE OF $(0.22) AND, ON A NON-GAAP BASIS, INCOME BEFORE TAXES
INTERACTIVE BROKERS GROUP ANNOUNCES 2013 RESULTS
 INTERACTIVE BROKERS GROUP ANNOUNCES 2013 RESULTS REPORTS COMPREHENSIVE EARNINGS PER SHARE OF $0.67, INCOME BEFORE TAXES OF $451 MILLION ON $1,076 MILLION IN NET REVENUES, AND EARNINGS PER SHARE ON NET
The Charles Schwab Corporation
 UNITED STATES SECURITIES AND EXCHANGE COMMISSION Washington, D.C. 20549 FORM 8-K CURRENT REPORT Pursuant to Section 13 or 15(d) of The Securities Exchange Act of 1934 Date of Report (Date of earliest event
INTERACTIVE BROKERS GROUP ANNOUNCES RECORD 2008 RESULTS
 INTERACTIVE BROKERS GROUP ANNOUNCES RECORD 2008 RESULTS REPORTS INCOME BEFORE TAXES AND MINORITY INTEREST OF $1.25 BILLION ON $1.85 BILLION IN NET REVENUES, EARNINGS PER SHARE OF $2.24 GREENWICH, CONN,
TD Ameritrade, Inc., member FINRA/SIPC/NFA, is a subsidiary of TD Ameritrade Holding Corporation. TD Ameritrade is a trademark jointly owned by TD
 TD Ameritrade, Inc., member FINRA/SIPC/NFA, is a subsidiary of TD Ameritrade Holding Corporation. TD Ameritrade is a trademark jointly owned by TD Ameritrade IP Company, Inc. and The Toronto-Dominion Bank.
TD Ameritrade. Citi Asset Management Broker Dealer & Exchanges Investor Conference New York, NY March 3, Fred Tomczyk Chief Executive Officer
 TD Ameritrade Citi Asset Management Broker Dealer & Exchanges Investor Conference New York, NY March 3, 2016 Fred Tomczyk Chief Executive Officer TD Ameritrade Holding Corporation (Nasdaq: AMTD). Brokerage
TD Ameritrade. BofA Merrill Lynch Conference New York, NY November 13, Fred Tomczyk President and CEO
 TD Ameritrade BofA Merrill Lynch Conference New York, NY November 13, 2014 Fred Tomczyk President and CEO TD Ameritrade Holding Corporation (NYSE: AMTD). Brokerage services provided by TD Ameritrade, Inc.,
March 21, 2018 MEMORANDUM
 David Battan Executive Vice President and General Counsel Interactive Brokers LLC 2200 Pennsylvania Ave NW Suite 280E Washington, DC 20037 T: 202.530.3205 dbattan@ibkr.com March 21, 2018 MEMORANDUM Re:
Summer Business Update. July 20, 2018
 Summer Business Update July 20, 2018 Introduction Jennifer Como Vice President Investor Relations 2 Agenda Walt Bettinger, President and Chief Executive Officer Peter Crawford, EVP and Chief Financial
Knight Capital Group Analyst & Investor Meeting. November 2, 2006
 Knight Capital Group Analyst & Investor Meeting November 2, 2006 Welcome Margaret E. Wyrwas Safe Harbor & Regulation G Safe Harbor Certain statements contained in this presentation, including without limitation,
TD Ameritrade. Raymond James 33 rd Annual Institutional Investors Conference Orlando, FL March 5, 2012
 TD Ameritrade Raymond James 33 rd Annual Institutional Investors Conference Orlando, FL March 5, 2012 TD Ameritrade, Inc., member FINRA/SIPC/NFA, is a subsidiary of TD Ameritrade Holding Corporation. TD
INVESTORS/ANALYSTS: Rich Fowler Charles Schwab Phone:
 News Release Contacts: MEDIA: Mayura Hooper Charles Schwab Phone: 415-667-1525 INVESTORS/ANALYSTS: Rich Fowler Charles Schwab Phone: 415-667-1841 SCHWAB FOURTH QUARTER NET INCOME OF $597 MILLION CAPS RECORD
 www.greenhavenroad.com 1 GREENHAVEN ROAD Who We Are A long-biased hedge fund. Concentrated and patient. Pursue both quality companies (compounders) and special situations (spinoffs, rights offerings, SPAC,
American Express. Financial Community Meeting. Kenneth I. Chenault Chairman and Chief Executive Officer
 American Express Financial Community Meeting Kenneth I. Chenault Chairman and Chief Executive Officer Daniel T. Henry Executive Vice President and Chief Financial Officer February 4, 2009 Agenda 2008 Financial
Interactive Brokers Group, Inc.
 January 06, 2015 Interactive Brokers Group, Inc. (IBKR-NASDAQ) Current Recommendation NEUTRAL Prior Recommendation Outperform Date of Last Change 07/08/2014 Current Price (01/05/15) $28.88 Target Price
Kiwoom Securities Profile
 Kiwoom Securities Profile Kiwoom Securities was established in January 2000 with the vision of introducing full-service online brokerage in Korea. Since then, Kiwoom has continued to grow at a remarkable
FUEL PRICE RISK MANAGEMENT POLICY REPORT "FUEL HEDGE"
 FUEL PRICE RISK MANAGEMENT POLICY REPORT "FUEL HEDGE" Sep-18 FUEL PRICE RISK MANAGEMENT POLICY REPORT Sep-18 (Office of Management and Budget 09/30/2018) The Fuel Price Risk Management Policy approved
Option Strategies for a Long-Term Outlook
 Option Strategies for a Long-Term Outlook Interactive Brokers Webcast June 20, 2018 Russell Rhoads, CFA Disclosure Options involve risk and are not suitable for all investors. Prior to buying or selling
2017 ANNUAL REPORT indd 17 2/21/18 3:39 PM
 2017 ANNUAL REPORT A YEAR OF MILESTONES This year, Interactive Brokers......celebrated the 40th anniversary of our founding....commemorated 10 years as a publicly traded company.... achieved several record
TD Ameritrade Holding Corporation (NYSE: AMTD). Brokerage services provided by TD Ameritrade, Inc., member FINRA/SIPC/NFA, and TD Ameritrade
. Brokerage services provided by TD Ameritrade, Inc., member FINRA/SIPC/NFA, and TD Ameritrade") TD Ameritrade Holding Corporation (NYSE: AMTD). Brokerage services provided by TD Ameritrade, Inc., member FINRA/SIPC/NFA, and TD Ameritrade Clearing, Inc., member FINRA/SIPC, subsidiaries of TD Ameritrade
TD Ameritrade Holding Corporation (NYSE: AMTD). Brokerage services provided by TD Ameritrade, Inc., member FINRA/SIPC/NFA, and TD Ameritrade Clearing, Inc., member FINRA/SIPC, subsidiaries of TD Ameritrade
TD Ameritrade. Sandler O Neill 2011 Global Exchange & Brokerage Conference New York, NY June 9, 2011
 1 TD Ameritrade Sandler O Neill 2011 Global Exchange & Brokerage Conference New York, NY June 9, 2011 TD Ameritrade, Inc., member FINRA/SIPC/NFA, is a subsidiary of TD Ameritrade Holding Corporation. TD
The Charles Schwab Corporation
 UNITED STATES SECURITIES AND EXCHANGE COMMISSION Washington, D.C. 20549 FORM 8-K CURRENT REPORT Pursuant to Section 13 or 15(d) of The Securities Exchange Act of 1934 Date of Report (Date of earliest event
FTSE Nareit All Equity REITs equity market capitalization = $986.8 billion
 Nareit REIT Industry Fact Sheet Data as of, except where noted. Unless otherwise noted, all data are derived from, and apply only to, publicly traded US REITs. Industry Size FTSE Nareit All REITs equity
TD AMERITRADE Holding Corporation
 www.amtd.com TD AMERITRADE Holding Corporation TD AMERITRADE Holding Corporation, through its brokerage subsidiaries, (1) combines innovative trading technology, easy-to-use and understand trading tools,
TD Ameritrade Holding Corporation (NYSE: AMTD). Brokerage services provided by TD Ameritrade, Inc., member FINRA/SIPC/NFA, and TD Ameritrade
. Brokerage services provided by TD Ameritrade, Inc., member FINRA/SIPC/NFA, and TD Ameritrade") TD Ameritrade Holding Corporation (NYSE: AMTD). Brokerage services provided by TD Ameritrade, Inc., member FINRA/SIPC/NFA, and TD Ameritrade Clearing, Inc., member FINRA/SIPC, subsidiaries of TD Ameritrade
TD Ameritrade Holding Corporation (NYSE: AMTD). Brokerage services provided by TD Ameritrade, Inc., member FINRA/SIPC/NFA, and TD Ameritrade Clearing, Inc., member FINRA/SIPC, subsidiaries of TD Ameritrade
Spring Business Update. April 21, 2017
 Spring Business Update April 21, 2017 Introduction Rich Fowler Senior Vice President Investor Relations 2 Agenda Walt Bettinger, President & Chief Executive Officer Joe Martinetto, Senior EVP & Chief Financial
Algo Trading System RTM
 Year Return 2016 15,17% 2015 29,57% 2014 18,57% 2013 15,64% 2012 13,97% 2011 55,41% 2010 50,98% 2009 48,29% Algo Trading System RTM 89000 79000 69000 59000 49000 39000 29000 19000 9000 2-Jan-09 2-Jan-10
Interactive Brokers Annual Report
 Interactive Brokers 2016 Annual Report Interactive Brokers continues to grow at a record pace. Equity capital Accounts Daily average revenue trades Client equity 2012 2016 $4.8 $5.8 210,000 385,000 Billion
FUEL PRICE RISK MANAGEMENT POLICY REPORT "FUEL HEDGE"
 FUEL PRICE RISK MANAGEMENT POLICY REPORT "FUEL HEDGE" December 2018 FUEL PRICE RISK MANAGEMENT POLICY REPORT December 2018 The Fuel Price Risk Management Policy approved by the Board on February 16, 2006
Interactive Brokers Rule 606 Quarterly Order Routing Report Quarter Ending September 30, 2017
 Interactive Brokers Rule 606 Quarterly Order Routing Report Quarter Ending September 30, 2017 I. Introduction Interactive Brokers ( IB ) has prepared this report pursuant to a U.S. Securities and Exchange
Growth Stock Conference June 11,
 William Blair Growth Stock Conference June 11, 2009 www.theice.com FORWARD-LOOKING STATEMENTS Forward-Looking Statements This presentation may contain forward-looking statements made pursuant to the safe
Russell 2000 Index Options
 Interactive Brokers Webcast Russell 2000 Index Options April 20, 2016 Presented by Russell Rhoads, Senior Instructor Disclosure Options involve risks and are not suitable for all investors. Prior to buying
TD Ameritrade to acquire Scottrade
 TD Ameritrade to acquire Scottrade Combination enhances scale, accelerates growth Tim Hockey, President and CEO Steve Boyle, EVP and CFO October 24, 2016 TD Ameritrade Holding Corporation (Nasdaq: AMTD).
ETF portfolio review, 30th September ETF portfolios with ESG overlay. market overview. portfolio performance
 ETF portfolio review, 30th September 2017 market overview All our ETF portfolios performed better than s in September and all portfolios bar fixed-income continued to add to their gains year-to-date. Our
Interactive Brokers Rule 606 Quarterly Order Routing Report Quarter Ending December 31, 2016
 Interactive Brokers Rule 606 Quarterly Order Routing Report Quarter Ending December 31, 2016 I. Introduction Interactive Brokers ( IB ) has prepared this report pursuant to a U.S. Securities and Exchange
Interactive Brokers Rule 606 Quarterly Order Routing Report Quarter Ending March 30, 2016
 Interactive Brokers Rule 606 Quarterly Order Routing Report Quarter Ending March 30, 2016 I. Introduction Interactive Brokers ( IB ) has prepared this report pursuant to a U.S. Securities and Exchange
SEC Rule 606 Report Interactive Brokers 1st Quarter 2018
 SEC Rule 606 Report Interactive Brokers 1st Quarter 2018 Scottrade Inc. posts separate and distinct SEC Rule 606 reports that stem from orders entered on two separate platforms. This report is for Scottrade,
Municipal Bond ETF Applications. Solomon Stewart, CFA ishares Fixed Income Strategy
 Municipal Bond ETF Applications Solomon Stewart, CFA ishares Fixed Income Strategy Municipal Bond Market Update FOR FINANCIAL PROFESSIONAL USE ONLY - NOT FOR PUBLIC DISTRIBUTION. Jan-07 Jun-07 Nov-07 Apr-08
Interactive Brokers Rule 606 Quarterly Order Routing Report Quarter Ending June 30, 2014
 Interactive Brokers Rule 606 Quarterly Order Routing Report Quarter Ending June 30, 2014 I. Introduction Interactive Brokers ( IB ) has prepared this report pursuant to a U.S. Securities and Exchange Commission
Interactive Brokers Rule 606 Quarterly Order Routing Report Quarter Ending September 30, 2015
 Interactive Brokers Rule 606 Quarterly Order Routing Report Quarter Ending September 30, 2015 I. Introduction Interactive Brokers ( IB ) has prepared this report pursuant to a U.S. Securities and Exchange
 SEC Rule 606 Report Interactive Brokers 3 rd Quarter 2017 Scottrade Inc. posts separate and distinct SEC Rule 606 reports that stem from orders entered on two separate platforms. This report is for Scottrade,
E*TRADE FINANCIAL CORPORATION ANNOUNCES FOURTH QUARTER AND FULL YEAR 2015 RESULTS
 FOR IMMEDIATE RELEASE E*TRADE Media Relations Thayer Fox 646-521-4418 thayer.fox@etrade.com E*TRADE Investor Relations Brett Goodman 646-521-4406 brett.goodman@etrade.com E*TRADE FINANCIAL CORPORATION
Interactive Brokers Rule 606 Quarterly Order Routing Report Quarter Ending December 31, 2018
 Interactive Brokers Rule 606 Quarterly Order Routing Report Quarter Ending December 31, 2018 I. Introduction Interactive Brokers ( IB ) has prepared this report pursuant to a U.S. Securities and Exchange
Interactive Brokers Rule 606 Quarterly Order Routing Report Quarter Ending December 31, 2017
 Interactive Brokers Rule 606 Quarterly Order Routing Report Quarter Ending December 31, 2017 I. Introduction Interactive Brokers ( IB ) has prepared this report pursuant to a U.S. Securities and Exchange
Goldman Sachs Conference
 Goldman Sachs Conference December 11, 2008 1 TD AMERITRADE, Inc., member FINRA/SIPC, subsidiary of TD AMERITRADE Holding Corporation. TD AMERITRADE is a trademark jointly owned by TD AMERITRADE IP Company,
TD Ameritrade, Inc., member FINRA/SIPC/NFA, is a subsidiary of TD Ameritrade Holding Corporation. TD Ameritrade is a trademark jointly owned by TD
 TD Ameritrade, Inc., member FINRA/SIPC/NFA, is a subsidiary of TD Ameritrade Holding Corporation. TD Ameritrade is a trademark jointly owned by TD Ameritrade IP Company, Inc. and The Toronto-Dominion Bank.
a complete turnkey solution for Advisors that provides trading, clearing, and reporting capability for advisors of all sizes
 a complete turnkey solution for Advisors that provides trading, clearing, and reporting capability for advisors of all sizes Interactive Broker (UK) Limited Webinar: Professional Advisors Presenter Gerald
BMO Exchange Traded Funds
 BMO Exchange Traded Funds June 2012 Alfred Lee, CFA, CMT, DMS Vice President & Investment Strategist BMO BMO Global Asset Management Agenda The Growing ETF Landscape Institutional Usage of ETFs Mechanics
Foundations of Investing
 www.edwardjones.com Member SIPC Foundations of Investing 1 5 HOW CAN I STAY ON TRACK? 4 HOW DO I GET THERE? 1 WHERE AM I TODAY? MY FINANCIAL NEEDS 3 CAN I GET THERE? 2 WHERE WOULD I LIKE TO BE? 2 Develop
Dividend Report. December 2018
 Warning: Aberdeen Global has the discretion to determine the and rate of dividend to be distributed. The dividends are not guaranteed and may be investment income, gains or at the discretion of the Board
Nasdaq US Large Cap Equities for Rising Rates Index
 Nasdaq US Large Cap Equities for Rising Rates Index The Nasdaq US Large Cap Equities for Rising Rates Index (NQERR) consists of 5 U.S. securities whose stock prices have historically exhibited relatively
Raymond James The 35 th Annual Institutional Investors Conference
 Raymond James The 35 th Annual Institutional Investors Conference Edward Tilly, CEO March 4, 2014 1 Forward-Looking Statements This presentation may contain forward-looking statements, within the meaning
E*TRADE FINANCIAL CORPORATION ANNOUNCES FOURTH QUARTER AND FULL YEAR 2018 RESULTS
 FOR IMMEDIATE RELEASE E*TRADE Media Relations 646-521-4418 mediainq@etrade.com E*TRADE Investor Relations 646-521-4406 ir@etrade.com E*TRADE FINANCIAL CORPORATION ANNOUNCES FOURTH QUARTER AND FULL YEAR
DKK: foreign investors bought government bonds and treasury bills in August
 DKK: foreign investors bought government bonds and treasury bills in August Jens Nærvig Pedersen Analyst Danske Bank Markets jenpe@danskebank.dk +45 45 12 8 61 27 September 213 Important disclosures and
Investor Presentation Sandler O Neill Global Exchange and Brokerage Conference. Peter Hiom June 2015
 Investor Presentation Sandler O Neill Global Exchange and Brokerage Conference Peter Hiom June 2015 Disclaimer The material contained in this document is a presentation of general information about the
Singapore Exchange Limited FY2005 Full Year Results Presentation
 Singapore Exchange Limited FY2005 Full Year Results Presentation Hsieh Fu Hua, CEO Seck Wai Kwong, CFO Singapore Exchange 28 July 2005 1 Agenda 1. Highlights 2. Financial Review 3. Strategy Update 4. Q
LPL Financial. Investor Presentation Q October 26, Member FINRA/SIPC
 LPL Financial Investor Presentation Q3 2017 October 26, 2017 Member FINRA/SIPC Notice to Investors: Safe Harbor Statement Statements in this presentation regarding the Company's future financial and operating
E-MONITOR Gold Monitor Awards
 E-MONITOR Gold Monitor Awards 2015 Award Winners About Us Corporate Insight provides competitive intelligence and user experience research to the nation s leading financial institutions. For over 20 years,
For personal use only
 Investor Update 1Q17 Overview Half Year to 31 December 2016 Well positioned for growth and diversification. NPAT 1 $5.6 million NPAT 1 (Before merger transaction and restructure costs) $8.2 million Net
Interactive Brokers Group, Inc. (IBKR) Q Earnings Call October 22, :00 pm ET
 Q Earnings Call October 22, :00 pm ET") Interactive Brokers Group, Inc. (IBKR) Q3 2009 Earnings Call October 22, 2009 5:00 pm ET Executives Deborah Liston - Director of Investor Relations Thomas Peterffy - Chairman and CEO Paul Brody - Group
Interactive Brokers Group, Inc. (IBKR) Q3 2009 Earnings Call October 22, 2009 5:00 pm ET Executives Deborah Liston - Director of Investor Relations Thomas Peterffy - Chairman and CEO Paul Brody - Group
United Bank Limited Performance Review September 2014
 United Bank Limited Performance Review September 2014 1 Key Highlights Standalone PAT up 23% YoY to Rs 15.8B. Consolidated PAT up 22% YoY to Rs 17.2B Net Interest income up by 17% YoY to Rs 32B Core deposits
Spheria Australian Smaller Companies Fund
 29-Jun-18 $ 2.7686 $ 2.7603 $ 2.7520 28-Jun-18 $ 2.7764 $ 2.7681 $ 2.7598 27-Jun-18 $ 2.7804 $ 2.7721 $ 2.7638 26-Jun-18 $ 2.7857 $ 2.7774 $ 2.7690 25-Jun-18 $ 2.7931 $ 2.7848 $ 2.7764 22-Jun-18 $ 2.7771
Common stock prices 1. New York Stock Exchange indexes (Dec. 31,1965=50)2. Transportation. Utility 3. Finance
2. Transportation. Utility 3. Finance") Digitized for FRASER http://fraser.stlouisfed.org/ Federal Reserve Bank of St. Louis 000 97 98 99 I90 9 9 9 9 9 9 97 98 99 970 97 97 ""..".'..'.."... 97 97 97 97 977 978 979 980 98 98 98 98 98 98 987 988
Digitized for FRASER http://fraser.stlouisfed.org/ Federal Reserve Bank of St. Louis 000 97 98 99 I90 9 9 9 9 9 9 97 98 99 970 97 97 ""..".'..'.."... 97 97 97 97 977 978 979 980 98 98 98 98 98 98 987 988
CME Group 3Q 2015 Earnings Conference Call
 CME Group 3Q 2015 Earnings Conference Call October 29, 2015 Forward Looking Statements Statements in this presentation that are not historical facts are forward-looking statements. These statements are
Spring Business Update. April 20, 2018
 Spring Business Update April 20, 2018 Introduction Jennifer Como Vice President Investor Relations 2 Agenda Walt Bettinger, President and Chief Executive Officer Peter Crawford, EVP and Chief Financial
TD AMERITRADE Client Assets at Record $282 Billion
 TD AMERITRADE Client Assets at Record $282 Billion Asset-Based Revenues of 61%; New Accounts Up 52% from the December Quarter OMAHA, Neb., Apr 17, 2007 (BUSINESS WIRE) -- TD AMERITRADE Holding Corporation
E*TRADE FINANCIAL CORPORATION ANNOUNCES SECOND QUARTER 2018 RESULTS
 FOR IMMEDIATE RELEASE E*TRADE Media Relations 646-521-4418 mediainq@etrade.com E*TRADE Investor Relations 646-521-4406 ir@etrade.com E*TRADE FINANCIAL CORPORATION ANNOUNCES SECOND QUARTER 2018 RESULTS
UBS Global Financial Services Conference
 Todd Maclin, Chief Executive Officer Consumer & Business Banking May 8, 2012 UBS Global Financial Services Conference Consumer & Business Banking is a strong franchise today Strong profitability in a flat
The HGC Merger Arbitrage Fund. Extremely Focused. Uniquely Disciplined. December 2017
 The HGC Merger Arbitrage Fund Extremely Focused. Uniquely Disciplined. December 2017 HGC Investment Management About HGC Investment Management HGC Investment Management Inc. ("HGC") is an employee-owned,
4. MACQUARIE SECURITIES GROUP
 4. MACQUARIE SECURITIES GROUP Roy Laidlaw Group Head Macquarie Group Limited Operational Briefing 5 February 2009 Presentation to Investors and Analysts 49 Three Divisions Macquarie Securities Group Sales
LOAN MARKET DATA AND ANALYTICS BY THOMSON REUTERS LPC
 LOAN MARKET DATA AND ANALYTICS BY THOMSON REUTERS LPC GLOBAL LOAN MARKET DATA AND ANALYTICS BY THOMSON REUTERS LPC Secondary Market Bid Levels: Europe Slide 2 European CLO New Issue Volume Monthly Slide
ALTERNATIVE INVESTMENT SOLUTIONS SERVE INVESTOR NEEDS AND UNCOVER A GROWTH OPPORTUNITY
 ALTERNATIVE INVESTMENT SOLUTIONS SERVE INVESTOR NEEDS AND UNCOVER A GROWTH OPPORTUNITY DIVERSIFY CLIENT ASSETS AND DIFFERENTIATE YOUR BUSINESS COMPREHENSIVE AND FLEXIBLE ALTERNATIVE INVESTMENT SOLUTIONS
Second Quarter 2013 Earnings Presentation. August 2, 2013
 Second Quarter 2013 Earnings Presentation August 2, 2013 Agenda Strategic Review Financial Review Questions and Answers Edward Tilly Chief Executive Officer Alan Dean Executive Vice President, CFO and
VIX ETPs, Inter-Relationships between Volatility Markets and Implications for Investors and Traders
 Not a Product of Research / Not for Retail Distribution Citi Equities I U.S. Equity Trading Strategy VIX ETPs, Inter-Relationships between Volatility Markets and Implications for Investors and Traders
E*TRADE FINANCIAL CORPORATION ANNOUNCES FOURTH QUARTER AND FULL YEAR 2017 RESULTS. E*TRADE Bank reduces Tier 1 leverage ratio threshold to 7.
 FOR IMMEDIATE RELEASE E*TRADE Media Relations 646-521-4418 mediainq@etrade.com E*TRADE Investor Relations 646-521-4406 ir@etrade.com E*TRADE FINANCIAL CORPORATION ANNOUNCES FOURTH QUARTER AND FULL YEAR
WESTWOOD LUTHERAN CHURCH Summary Financial Statement YEAR TO DATE - February 28, Over(Under) Budget WECC Fund Actual Budget
 Budget WECC Fund Actual Budget") WESTWOOD LUTHERAN CHURCH Summary Financial Statement YEAR TO DATE - February 28, 2018 General Fund Actual A B C D E F WECC Fund Actual Revenue Revenue - Faith Giving 1 $ 213 $ 234 $ (22) - Tuition $ 226
WESTWOOD LUTHERAN CHURCH Summary Financial Statement YEAR TO DATE - February 28, 2018 General Fund Actual A B C D E F WECC Fund Actual Revenue Revenue - Faith Giving 1 $ 213 $ 234 $ (22) - Tuition $ 226
Active Asset Allocation Fund
 Active Asset Allocation Fund Targeting good long-term growth with an asset mix that can deliver lower volatility. Features of the Active Asset Allocation Fund Significant level of diversification. Active
7 March Senior Executive, Financial Market Infrastructure. Level 5, 100 Market Street SYDNEY NSW 2000 SYDNEY NSW 2000
 7 March 2016 Australian Securities and Investments Commission ASX Market Announcements Office Mr Oliver Harvey ASX Limited Senior Executive, Financial Market Infrastructure 20 Bridge Street Level 5, 100
July 2012 Chartbook The Halftime Report
 Average Daily $VA LUE Traded ($Billions ) $Billions (212 ( US China Japan CHI-X London Hong Kong Germany France Canada Korea Australia Brazil Taiwan Spain India Italy $billions Switzerland Sweden Amsterdam
Trading in India. The Status Quo. Anshuman Jaswal Senior Analyst, Celent
 Trading in India The Status Quo Anshuman Jaswal Senior Analyst, Celent Roadmap Brief look at equity, bond and derivative markets Level of electronic trading DMA and Algorithmic trading Industry evolution
Interactive Brokers March 2009
 Interactive Brokers March 2009 Disclaimer: This material contains information only. ASX does not represent or warrant that it is complete or accurate. The information is for education purposes only and
FX PRODUCTS. Making a world of forex opportunities accessible to you.
 FX PRODUCTS Making a world of forex opportunities accessible to you. In a world of increasing volatility, customers around the globe rely on CME Group as their premier source for managing risk. Formed
Record first quarter earnings
 Record first quarter earnings DBS Group Holdings 2015 financial results April 27, 2015 Disclaimer: The information contained in this document is intended only for use during the presentation and should