Five Year Forecast Financial Report
|
|
|
- Rudolph Sparks
- 5 years ago
- Views:
Transcription

1 Exhibit T-2 As approved by Board of Education 10/09/18 LOGO Shaker Heights City Schools Five Year Forecast Financial Report October, Public Finance Resources, Inc. 2016
2 Shaker Heights City Schools Table of Contents Table of Contents 2 Forecast Summary 3 Revenue Sources and Forecast Year-Over-Year Projected Overview General Property Tax (Real Estate) Public Utility Personal Property Income Tax Unrestricted Grants-in-Aid & Restricted Grants-in-Aid Property Tax Allocation All Other Operating Revenues Total Other Financing Sources 12 Expenditures Overview Personnel Services Employee Benefits Purchased Services Supplies and Materials Capital Outlay Intergovernmental & Debt Other Objects Total Other Financing Uses 21 Five Year Forecast 22 FY 2019 Current Forecast Compared to Last Filed Forecast(05/15/2018) 23 Current Five Year Forecast Change to Net Operating Revenue (Line 6.01) Compared to Last Filed Forecast 24 Page Forecast Purpose/Objectives Ohio Department of Education's purposes/objectives for the five-year forecast are: To engage the local board of education and the community in the long range planning and discussions of financial issues facing the school district. To serve as a basis for determining the school district's ability to sign the certificate required by O.R.C , commonly known as the "412 certificate." To provide a method for the Department of Education and Auditor of State to identify school districts with potential financial problems. Forecast Methodology - This forecast is prepared based upon historical trends and current factors. This information is then extrapolated into estimates for subsequent years. The forecast variables can change multiple times throughout the fiscal year and while cash flow monitoring helps to identify unexpected variances no process is guaranteed. The intent is to provide the district's financial trend over time and a roadmap for decisions aimed at encouraging financial sustainability and stability. Public Finance Resources, Inc. 2016
3 Five-Year Forecast-Basics Required two times per year- May & Oct. Last one approved May 2018 Can amend/submit any time throughout the year 3
4 Five-Year Forecast-Basics Basic Format-3 yrs of historical & 5 yrs. of projected data-general Fund Reflects actual rev. & exp. thru F18 And projected rev. & exp. F19 thru F23 based upon final F18 and YTD F19 data 4
5 Five-Year Forecast-Basics To be used as a planning tool in long-term strategic planning Designed to identify issues to be addressed in advance But one approach to balancing District s finances 5
6 Five-Year Forecast-Basics Does not reflect the exact layout of future events, as other events will occur that will impact this forecast: State Budget Bills Continued recovery of Ohio economy Continued recovery of real estate markets Other market forces 6
7 Five-Year Forecast-Basics Only thing for sure, is that most of these numbers will be different! 7
8 October, 2018 Forecast Summary Shaker Heights City Schools $120,000,000 Financial Forecast - Revenue, Expenditures, Levies, and Cash Balance $100,000,000 $80,000,000 $60,000,000 $40,000,000 $36,176,869 $20,000, Actual 2019Proj. 2020Proj. 2021Proj. 2022Proj. 2023Proj. Total Revenue Replace/Renew Levies New Levies Total Expenditures Cash Balance Shaker Heights City Schools Financial Forecast Fiscal Year Fiscal Year Fiscal Year Fiscal Year Fiscal Year Beginning Balance 56,236,792 54,909,884 54,325,421 52,773,778 49,260,890 + Revenue 96,234,967 99,401,637 99,405,837 98,658,937 98,573,037 + Proposed Renew/Replacement Levies Proposed New Levies - - 2,923,050 5,846,100 5,846,100 - Expenditures (97,561,875) (99,986,100) (103,880,530) (108,017,925) (112,068,112) = Revenue Surplus or Deficit (1,326,908) (584,463) (1,551,643) (3,512,888) (7,648,975) Ending Balance with renewal levies 54,909,884 54,325,421 52,773,778 49,260,890 41,611,915 Note: Not Reduced for Encumbrances Analysis Without Renewal Levies Included: Revenue Surplus or Deficit w/o Levies (1,326,908) (584,463) (4,474,693) (9,358,988) (13,495,075) Ending Balance w/o Levies 54,909,884 54,325,421 49,850,728 40,491,740 26,996,665 Excluding the timing impact of the accordion effect of the accelerated real estate tax receipts in Fiscal 2018, the District will generate an operating excess of revenues over expenditures (operating surplus) in Fiscal 2019, after which expenditures begin to exceed revenues, by.6 million in Fiscal 2020 and by $1.6 million in Fiscal This forecast reflects the actual financial impacts of Option #3 of the District's proposed Reduction in Force to address the continuing projected declining enrollment. Option #3 incorporated a reduction of 6 positions effective in Fiscal 2019 and an additional reduction of 19 positions effective in Fiscal 2020 (total of 25 positions). The fall 2018 forecast reflects the actual 11 positions eliminated beginning in Fiscal 2019 with the remaining reductions projected to occurr in Fiscal While fund balance continues to decline under this forecast, the fund balance has improved from the May 2018 forecast with an increase to 32.5% (up from 24.5% in May 2018) of total expenditures by the end of Fiscal Likewise, the peak fund balance at the end of Fiscal 2018 improved from $49.9 million or 51.1% to $50.8 million or 52.4%. We continue to project that at least a 6.9 mill levy would need to be submitted for approval in 2020 (six years since the last operating levy approved in 2014) for collections starting in calendar 2021, in order to stave off falling into a deficit position in future years not shown on this forecast. 8 Public Finance Resources, Inc. 2016

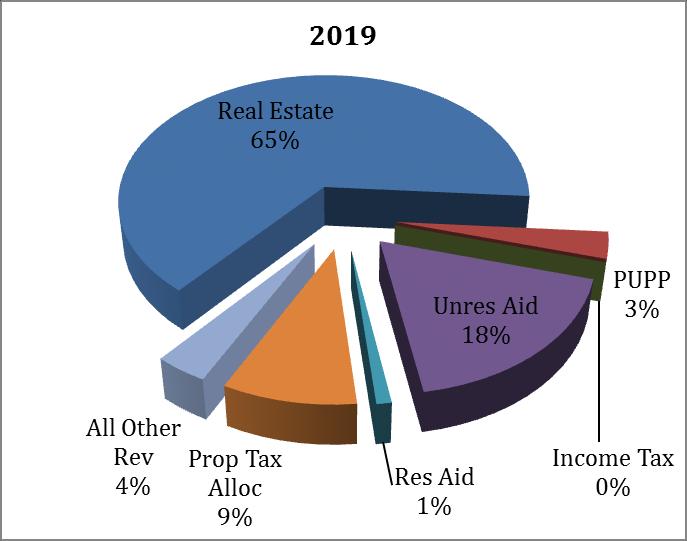
9 Shaker Heights City Schools Revenue Sources and Forecast Year-Over-Year Projected Overview Real Estate 66.4% 67.4% Public Utility Real Estate 2.8% 3.5% Income Tax 66.4% 0.0% 0.0% State Funding 17.3% 16.9% Prop Tax Alloc 8.3% 8.9% All Othr Op Rev 5.1% 3.3% Public Othr Sources 0.0% 0.0% Utility State Funding 2.8% 17.3% Income Tax 0.0% Othr Sources 0.0% All Othr Op Rev 5.1% 2018 Prop Tax Alloc 8.3% Othr Sources 0.0% All Othr Op Rev 3.3% Real Estate 67.4% Prop Tax Alloc 8.9% 2023 State Funding 16.9% Public Utility 3.5% Income Tax 0.0% Prev. 5-Year PROJECTED 5-Year Avg. Annual Fiscal Year Fiscal Year Fiscal Year Fiscal Year Fiscal Year Avg. Annual Change Change Revenue: Real Estate 2.78% % 6.35% -0.21% -0.01% -0.01% -0.89% Public Utility 10.08% 3.99% 2.88% 2.87% 2.79% 2.71% 3.05% Income Tax n/a 0.00% 0.00% 0.00% 0.00% 0.00% 0.00% State Funding 5.75% 0.00% -5.00% 0.00% -5.00% 0.00% -2.00% Restricted Aid % 0.89% 0.81% 0.80% 0.80% 0.79% 0.82% Restr Federal SFSF % 0.00% 0.00% 0.00% 0.00% 0.00% 0.00% Property Tax Alloc -0.66% 0.00% 0.00% 0.00% 0.00% 0.00% 0.00% All Other Operating 22.99% % -1.23% 1.19% -0.60% -5.14% -8.15% Total Revenue 3.61% -8.70% 3.29% 0.00% -0.75% -0.09% -1.25% Total Other Sources n/a 0.00% 0.00% 0.00% 0.00% 0.00% 0.00% Total w/other Srcs 3.61% -8.70% 3.29% 0.00% -0.75% -0.09% -1.25% Most revenues are expected to be relatively flat during the forecast period. The substantial real estate tax increase in Fiscal 2018, decrease in Fiscal 2019, and increase in Fiscal 2020 is attributable to the accordion effect of the receipt of tax payer accelerated payments in December 2017 made so as to take advantage of the federal income tax law change that went into effect January 1, The decrease in State Foundation funding in Fiscal 2020 and Fiscal 2022 reflects an anticipated maximum 5% reduction in the "guaranteed" funding assumed to occur due to the expected continuing declining enrollment at the onset of the succeeding State biennial budgets. The substantial increase in Fiscal 2018 and subsequent decrease in Fiscal 2019 in All Other Operating Revenues is due to the $1.7 million receipt in December 2017 from the bond issue proceeds that reimbursed the General Fund for its expenditures for the Middle School roof project during the summer of Public Finance Resources, Inc. 2016
10 Projected Revenues-F
11 $60,663,636 $63,215,714 $65,897,070 $66,041,948 $70,025,913 $62,600,210 $66,577,508 $66,440,693 $66,437,128 $66,429,463 Shaker Heights City Schools General Property Tax (Real Estate) Revenue collected from taxes levied by a school district by the assessed valuation of real property using effective tax rates for class I (residential/agricultural) and class II (business). $80,000,000 $70,000,000 $60,000,000 $50,000,000 $40,000,000 $30,000,000 $20,000,000 $10,000,000 Actual Projected Revenu Renewal Levy Revenue Projected 2014 $60,663,636 $ $63,215, $65,897, $66,041, $70,025, $62,600, $66,577, $66,440, $66,437, $66,429, Projected Revenue Renewal Levy Revenue FORECASTED Total With Renewal Levies 70,025,913 62,600,210 66,577,508 66,440,693 66,437,128 66,429,463 YOY $ Change 3,983,965 (7,425,703) 3,977,298 (136,815) (3,565) (7,665) YOY % Change 6.0% -10.6% 6.4% -0.2% 0.0% 0.0% Percentage of Total Revenue 66.4% 65.0% 67.0% 66.8% 67.3% 67.4% Values, Tax Rates and Gross Collections Tax Yr Valuation Value Change Class I Rate Change Class II Rate Change ,291,310 (6,192,470) ,750,000 73,458, (7.12) (14.11) ,212,000 (1,538,000) ,583,000 (5,629,000) ,862,000 43,279, (3.88) (5.12) ,000,000 (1,862,000) Gross Collection Rate Including Delinquencies 99.9% 98.1% 98.1% 98.1% 98.1% 98.1% Collections of the 2014 approved operating levy began in calendar 2015 thus providing a half year of the new revenue in Fiscal 2015 and a whole year in Fiscal 2016 and thereafter. The substantial real estate tax increase in Fiscal 2018, decrease in Fiscal 2019, and increase in Fiscal 2020 is attributable to the accordion effect of the receipt of tax payer accelerated payments in December 2017 made so as to take advantage of the federal income tax law change that went into effect January 1, Key Assumption: No decline in property tax assessed valuation during the forecast period, and that collection rates remain consistent with recent years. *Projected % trends include renewal levies 11 Public Finance Resources, Inc. 2016
12 $3,524,862 $2,895,898 $2,675,818 $2,771,899 $2,989,196 $3,108,343 $3,198,015 $3,289,730 $3,381,445 $3,473,160 Shaker Heights City Schools Public Utility Personal Property Revenue generated from public utility personal property valuations multiplied by the district's full voted tax rate. $4,000,000 $3,500,000 $3,000,000 $2,500,000 $2,000,000 $1,500,000 $1,000,000 $500,000 Actual Projected Revenu Renewal Levy Revenue 2014 Projected $3,524,862 $3,524, $2,895,898 $2,895, $2,675,818 $2,675, $2,771,899 $2,771, $2,989,196 $2,989, $3,108,343 $3,108, $3,198,015 $3,198, $3,289,730 $3,289, $3,381,445 $3,381, $3,473,160 $3,473, Projected Revenue FORECASTED Total With Renewal Levies 2,989,196 3,108,343 3,198,015 3,289,730 3,381,445 3,473,160 YOY $ Change 217, ,147 89,672 91,715 91,715 91,715 YOY % Change 7.8% 4.0% 2.9% 2.9% 2.8% 2.7% Percentage of Total Revenue 2.8% 3.2% 3.2% 3.3% 3.4% 3.5% Values and Tax Rates Tax Year Valuation Value Change Full Voted Rate Change ,650,160 1,139, ,150, , ,650, , ,150, , ,650, , ,150, , Renewal Levy Revenue Gross Collection Rate Including Delinquencies 100.0% 100.0% 100.0% 100.0% 100.0% 100.0% This line reflects the breakout of the Public Utility Tangible payments previously included with the real estate tax revenues. Note Fiscal 2014 & 2015 included the $1.2 million and $181,460, respectively of non-recurring delinquent tangible personal property settlement payments. *Projected % trends include renewal levies 12 Public Finance Resources, Inc. 2016
13 Key Revenue Assumption State Support 3 Basic Funding Methods for State Foundation Gain Cap Formula Guarantee 13
14 Key Revenue Assumption State Support Gain Cap District receives less than formula calculation Increase in funding from prior year is limited by State to no more than 3.0% over last year-simply a budget balancing method utilized by the State Shaker had been on for several years Shaker amount not received under gain cap in F16 approximated $1 million; F17 14
15 Key Revenue Assumption State Support Formula District receives amount as calculated by the formula Shaker transitioned from Gain Cap to Formula method in F17 due to fact it was approaching the calculation combined with declining enrollment 15
16 Key Revenue Assumption State Support Guarantee District receives more than formula calculation Guarantee for Shaker in the new biennium is based upon 100% of F17 base funding amount since we had < 5% decline in enrollment F14 to F16 Shaker transitioned to the Guarantee funding method in F18, due to low State increase in per pupil amount combined with declining enrollment 16
17 Key Revenue Assumption State Support F19 is projected to be same as F18 due to Guarantee, but Assume a continuation of declining Guarantee for declining enrollment and thus Projecting a 5% reduction in F20/F21 and again in F22/F23 17
18 State Foundation-Funds Received Under Guarantee 17a
19 $14,140,592 $15,683,307 $16,772,300 $17,111,841 $17,306,003 $17,306,000 $16,440,700 $16,441,000 $15,618,950 $15,619,000 Shaker Heights City Schools Unrestricted Grants-in-Aid Funds received through the State Foundation Program with no restriction. $20,000,000 $18,000,000 $16,000,000 $14,000,000 $12,000,000 $10,000,000 $8,000,000 $6,000,000 $4,000,000 $2,000,000 Actual Projected FORECASTED Total 17,306,003 17,306,000 16,440,700 16,441,000 15,618,950 15,619,000 YOY $ Change 194,162 (3) (865,300) 300 (822,050) 50 YOY % Change 1.1% 0.0% -5.0% 0.0% -5.0% 0.0% Percentage of Total Revenue 16.4% 18.0% 16.5% 16.5% 15.8% 15.8% Core Funding Per Pupil 6,010 6,020 6,100 6,200 6,200 6,020 State Share Index (SSI) 41.1% 41.1% 39.1% 39.1% 36.8% 36.8% State Core Funding Per Pupil 2,471 2,475 2,382 2,421 2,280 2,213 Formula ADM (Funded Student Count) 5,020 4,849 4,728 4,635 4,540 4,449 Funding Status Guarantee Guarantee Guarantee Guarantee Guarantee Guarantee Increase in State Foundation funding due to the last State biennial budget bill, House Bill No. 64, of $1.1 million in Fiscal 2016 and another.3 million in Fiscal The District shifted from "gain capped" in Fiscal 2016, to "formula" funding in Fiscal 2017, and to "guarantee" funding for Fiscal years 2018 and beyond. Based upon the provision in the new biennial budget, the forecast contemplates a 5% reduction in the "guarantee" amount resulting in a 5% reduction in funding in Fiscal 2020 and again in Fiscal Public Finance Resources, Inc. 2016
20 $276,534 $2,299,171 $1,166,771 $1,045,195 $979,302 $988,000 $996,000 $1,004,000 $1,012,000 $1,020,000 Shaker Heights City Schools & Restricted Grants-in-Aid Funds received through the State Foundation Program or other allocations that are restricted for specific purposes. $2,500,000 Actual Projected $2,000,000 $1,500,000 $1,000,000 $500, FORECASTED Total 979, , ,000 1,004,000 1,012,000 1,020,000 YOY $ Change (65,893) 8,698 8,000 8,000 8,000 8,000 YOY % Change -6.3% 0.9% 0.8% 0.8% 0.8% 0.8% Percentage of Total Revenue 0.9% 1.0% 1.0% 1.0% 1.0% 1.0% Economic Disadvantaged Funding 191, , , , , ,042 Percentage of Disadvantaged Students 32.2% 32.2% 31.7% 31.7% 31.7% 31.7% Fiscal 2014 and 2015 amounts impacted by delay and double payment cycle for catastrophic aid reimbursements, but returned to normal schedule in Fiscal 2016 and are projected to be consistent during the rest of the projection years. 19 Public Finance Resources, Inc. 2016
21 $8,975,200 $8,967,738 $8,945,285 $8,800,663 $8,749,414 $8,749,414 $8,749,414 $8,749,414 $8,749,414 $8,749,414 Shaker Heights City Schools Property Tax Allocation Includes funds received for Tangible Personal Property Tax Reimbursement, Electric Deregulation, Homestead and Rollback. $10,000,000 $9,000,000 $8,000,000 $7,000,000 $6,000,000 $5,000,000 $4,000,000 $3,000,000 $2,000,000 $1,000,000 Actual Projected Revenu Renewal Levy Revenue 2014 Projected $8,975, $8,967, $8,945, $8,800, $8,749, $8,749, $8,749, $8,749, $8,749, $8,749, Projected Revenue Renewal Levy Revenue FORECASTED Total With Renewal Levies 8,749,414 8,749,414 8,749,414 8,749,414 8,749,414 8,749,414 YOY $ Change (51,249) YOY % Change -0.6% 0.0% 0.0% 0.0% 0.0% 0.0% Percentage of Total Revenue 8.3% 9.1% 8.8% 8.8% 8.9% 8.9% % of Residental Real Estate 10% Rollback 9.21% 9.21% 9.21% 9.21% 9.21% 9.21% % of Residental Real Estate 2.5% Rollback 1.86% 1.86% 1.86% 1.86% 1.86% 1.86% % of Residental Real Estate Homestead 2.06% 2.06% 2.06% 2.06% 2.06% 2.06% Due to State change in the previous State budget bill, there is no increase in Homestead Exemption RollBack (HERB) payments from the State for levies after 2013, thus no change projected in this item going forward. *Projected % trends include renewal levies 20 Public Finance Resources, Inc. 2016
22 $2,832,400 $2,241,846 $3,240,153 $2,951,607 $5,353,798 $3,483,000 $3,440,000 $3,481,000 $3,460,000 $3,282,000 Shaker Heights City Schools All Other Operating Revenues Operating revenue sources not included in other lines; examples include tuition, fees, earnings on investments, rentals, and donations. $6,000,000 $5,000,000 $4,000,000 $3,000,000 $2,000,000 $1,000,000 Actual Projected FORECASTED Total 5,353,798 3,483,000 3,440,000 3,481,000 3,460,000 3,282,000 YOY $ Change 2,402,191 (1,870,798) (43,000) 41,000 (21,000) (178,000) YOY % Change 81.4% -34.9% -1.2% 1.2% -0.6% -5.1% Percentage of Total Revenue 5.1% 3.6% 3.5% 3.5% 3.5% 3.3% Fiscal 2014 included.7 million of Medicaid reimbursement settlement payments for Fiscal 2010 & Fiscal 2015 included no final settlement payments, while Fiscal 2016 included the four-year interim period ( ) settlement amounting to $437,000; $318,000 for the Fiscal 2012 Medicaid settlement payment; and the early receipt of the Fiscal 2013 Medicaid settlement in June. Year-to-year fluctuations during the forecast period are attributable to various periodic and/or nonrecurring payments. The substantial increase in Fiscal 2018 and subsequent decrease in Fiscal 2019 is due to the $1.7 million receipt in December 2017 from the bond issue proceeds that reimbursed the General Fund for its expenditures for the Middle School roof project during the summer of Public Finance Resources, Inc. 2016
23 Shaker Heights City Schools Total Other Financing Sources Includes proceeds from sale of notes, state emergency loans and advancements, operating transfers-in, and all other financing sources like sale and loss of assets, and refund of prior year expenditures. $1 $1 $1 $1 $1 $1 Actual Projected FORECASTED Total YOY $ Change YOY % Change 0.0% 0.0% 0.0% 0.0% 0.0% 0.0% Percentage of Total Revenue 0.0% 0.0% 0.0% 0.0% 0.0% 0.0% Transfers In Advances In N/A for the District at this time. 22 Public Finance Resources, Inc. 2016

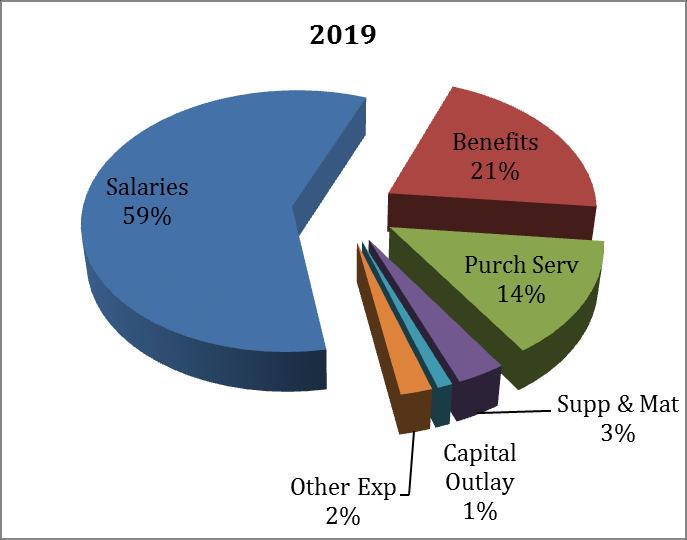
24 Shaker Heights City Schools Expenditure Categories and Forecast Year-Over-Year Projected Overview Salaries 57.8% 56.7% Benefits 20.1% 22.6% Purch Serv Salaries 13.1% 14.1% 57.8% Supp & Mat 2.9% 3.0% Capital Outlay 3.8% 1.1% Intergov & Debt 0.3% Benefits 0.3% Othr Objects 1.8% 20.1% 1.8% Othr Uses 0.3% 0.3% Salaries 56.7% 2023 Benefits 22.6% Othr Uses 0.3% Intergov & Debt 0.3% Othr Objects 1.8% Capital Outlay 3.8% Purch Serv 13.1% Supp & Mat 2.9% Othr Uses 0.3% Othr Objects 1.8% Intergov & Debt 0.3% Capital Outlay 1.1% Purch Serv 14.1% Supp & Mat 3.0% Prev. 5-Year PROJECTED 5-Year Avg. Annual Fiscal Year Fiscal Year Fiscal Year Fiscal Year Fiscal Year Avg. Annual Change Change Expenditures: Salaries 2.00% 2.02% 1.53% 3.07% 3.08% 3.09% 2.56% Benefits 2.14% 3.31% 4.34% 6.27% 6.54% 6.65% 5.42% Purchased Services -0.72% 7.84% 3.45% 4.18% 2.84% 3.54% 4.37% Supplies & Materials -3.21% 14.77% 1.60% 1.60% 7.65% -4.03% 4.32% Capital Outlay 22.64% % 5.00% 5.05% 4.99% 5.01% % Intergov n/a n/a n/a n/a n/a n/a n/a Debt % 42.34% 0.83% -1.77% 0.78% -0.56% 8.32% Other Objects 3.04% -2.58% 4.39% 4.37% 4.40% 4.42% 3.00% Total Expenditures 1.87% 0.62% 2.47% 3.88% 3.97% 3.74% 2.94% Total Other Uses % 9.43% 8.62% 7.94% 7.35% 6.85% 8.04% Total w/other Uses 1.89% 0.64% 2.48% 3.89% 3.98% 3.75% 2.95% Expenditures reflect the salary & wage growth in accordance with the collective bargaining agreement settlements, replacement savings from retirees and other terminations, expected increases in related fringe benefits and other District operating expenditures. This forecast reflects the actual financial impacts of Option #3 of the District's Reduction in Force action to address the continuing projected declining enrollment. Option #3 incorporated a reduction of 6 positions effective in Fiscal 2019 and an additional reduction of 19 positions effective in Fiscal 2020 (total of 25 positions). The fall 2018 forecast reflects the actual 11 positions eliminated beginning in Fiscal 2019 with the remaining reductions projected to occurr in Fiscal Public Finance Resources, Inc. 2016
25 Projected Expenditures-F
26 $50,647,786 $50,924,709 $52,699,569 $54,058,679 $56,000,930 $57,134,000 $58,007,000 $59,790,000 $61,631,000 $63,537,000 Shaker Heights City Schools Personnel Services Employee salaries and wages, including extended time, severance pay, supplemental contracts, etc. $70,000,000 $60,000,000 $50,000,000 $40,000,000 $30,000,000 $20,000,000 $10,000,000 Actual Projected FORECASTED Total 56,000,930 57,134,000 58,007,000 59,790,000 61,631,000 63,537,000 YOY $ Change 1,942,251 1,133, ,000 1,783,000 1,841,000 1,906,000 YOY % Change 3.6% 2.0% 1.5% 3.1% 3.1% 3.1% Percentage of Total Budget 57.8% 58.6% 58.0% 57.6% 57.1% 56.7% Reflects economic provisions of current collective bargaining agreements, including SHTA, SHTA-Support Teachers, OAPSE-Clerical, OAPSE-Security, Local 200-Custodial & Bus Drivers, and OAPSE-Aides three-year contracts (SHTA renewed thru 12/31/20; OAPSE-Security, OAPSE-Paraprofessionals and OAPSE-Clerical recently renewed thru 6/30/21; Local 200-Custodial & Bus Drivers and SHTA-Support Teachers are currently still in negotiations). Also reflects replacement savings from retirements and other terminations, as well as added positions during the historical period. Major Growth Rates Used for Salaries & Wages: SHTA 2%, 2%, & 2% base salary increases effective 1/1/18, 19 & 20, respectively per new contract; All Others 2%, 2% & 2% including 1.5% base and other CBA provision salary increases effective 7/1/18, 19 & 20, respectively; Beyond the last year of contracts, assumed 2%/year base and other CBA provision salary growth plus steps. Note: This forecast reflects the actual financial impacts of Option #3 of the District's Reduction in Force action to address the continuing projected declining enrollment. Option #3 incorporated a reduction of 6 positions effective in Fiscal 2019 and an additional reduction of 19 positions effective in Fiscal 2020 (total of 25 positions). The fall 2018 forecast reflects the actual 11 positions eliminated beginning in Fiscal 2019 with the remaining reductions projected to occurr in Fiscal Public Finance Resources, Inc. 2016
27 $16,991,881 $16,919,876 $17,666,678 $18,519,428 $19,482,515 $20,127,000 $21,000,025 $22,317,355 $23,776,750 $25,359,087 Shaker Heights City Schools Employees' Benefits Retirement for all employees, Workers Compensation, early retirement incentives, Medicare, unemployment, pickup on pickup, and all healthrelated insurances. $30,000,000 $25,000,000 $20,000,000 $15,000,000 Actual Projected $10,000,000 $5,000, FORECASTED Total 19,482,515 20,127,000 21,000,025 22,317,355 23,776,750 25,359,087 YOY $ Change 963, , ,025 1,317,330 1,459,395 1,582,337 YOY % Change 5.2% 3.3% 4.3% 6.3% 6.5% 6.7% Percentage of Total Budget 20.1% 20.6% 21.0% 21.5% 22.0% 22.6% Major Growth Rates Used Retirement is a fixed % of actual salaries-14% for certificated wages and up to 16% for classified wages. The health insurance rates are expected to increase 8.0% effective 1/1/19. Combined with the other half of the 3.75% increase that went into effect on 1/1/18, overall health care costs are expected to rise by a blended 5.875% in Fiscal Fiscal 2020 costs are expected to increase 10.0% effective 1/1/20 for an effective 9.0% in Fiscal Fiscal 2021 and beyond are forecasted to grow at a 10.0% annual rate based upon advice from the District insurance consultants. Note: This forecast reflects the actual financial impacts of Option #3 of the District's Reduction in Force action to address the continuing projected declining enrollment. Option #3 incorporated a reduction of 6 positions effective in Fiscal 2019 and an additional reduction of 19 positions effective in Fiscal 2020 (total of 25 positions). The fall 2018 forecast reflects the actual 11 positions eliminated beginning in Fiscal 2019 with the remaining reductions projected to occurr in Fiscal Public Finance Resources, Inc. 2016
28 $13,517,019 $13,196,942 $13,006,266 $12,668,098 $12,727,796 $13,725,600 $14,199,600 $14,792,600 $15,212,600 $15,750,600 Shaker Heights City Schools Purchased Services Amounts paid for personal services rendered by personnel who are not on the payroll of the school district, and other services which the school district may purchase. $18,000,000 $16,000,000 $14,000,000 $12,000,000 $10,000,000 $8,000,000 $6,000,000 $4,000,000 $2,000,000 Actual Projected FORECASTED Total 12,727,796 13,725,600 14,199,600 14,792,600 15,212,600 15,750,600 YOY $ Change 59, , , , , ,000 YOY % Change 0.5% 7.8% 3.5% 4.2% 2.8% 3.5% Percentage of Total Budget 13.1% 14.1% 14.2% 14.2% 14.1% 14.1% Major Growth Rates Used Out-of-District Tuition 5%; Out-of-District Transportation 5%; Repairs & Maintenance 4%; Utilities: Natural Gas 4% & Electricity 3%. Fiscal 2019 and beyond includes reserve funds for increased technology needs, loss of grant funds and other unforseen expenditures. 27 Public Finance Resources, Inc. 2016
29 $2,867,264 $3,027,687 $2,832,127 $3,041,024 $2,778,575 $3,189,000 $3,240,000 $3,292,000 $3,544,000 $3,401,000 Shaker Heights City Schools Supplies & Materials Expenditures for general supplies, instructional materials including textbooks and media material, bus fuel and tires, and all other maintenance supplies. $4,000,000 $3,500,000 $3,000,000 $2,500,000 $2,000,000 $1,500,000 $1,000,000 $500,000 Actual Projected FORECASTED Total 2,778,575 3,189,000 3,240,000 3,292,000 3,544,000 3,401,000 YOY $ Change (262,449) 410,425 51,000 52, ,000 (143,000) YOY % Change -8.6% 14.8% 1.6% 1.6% 7.7% -4.0% Percentage of Total Budget 2.9% 3.3% 3.2% 3.2% 3.3% 3.0% Major Growth Rates Used Bus Fuel 5% (including an additional allotment to cover any major price fluctuations); Also reflects projected cyclical textbook replacements in Fiscal 2019 and Public Finance Resources, Inc. 2016
30 $1,572,532 $1,357,753 $1,268,533 $1,835,476 $3,655,300 $1,000,000 $1,050,000 $1,103,000 $1,158,000 $1,216,000 Shaker Heights City Schools Capital Outlay This line includes expenditures for items having at least a five-year life expectancy, such as land, buildings, improvements of grounds, equipment, computers/technology, furnishings, and buses. Actual Projected $4,000,000 $3,500,000 $3,000,000 $2,500,000 $2,000,000 $1,500,000 $1,000,000 $500, FORECASTED Total 3,655,300 1,000,000 1,050,000 1,103,000 1,158,000 1,216,000 YOY $ Change 1,819,824 (2,655,300) 50,000 53,000 55,000 58,000 YOY % Change 99.1% -72.6% 5.0% 5.0% 5.0% 5.0% Percentage of Total Budget 3.8% 1.0% 1.1% 1.1% 1.1% 1.1% Assumes a 5% growth in capital outlay expenditures on a reduced budget due to availability of the $30 million bond issue and the 1.25 mill permanent improvement levy beginning in Fiscal Fiscal 2018 includes the non-recurring impact of the General Fund paying for the Middle School roof project in the summer of This expenditure was reimbursed in December 2017 from the proceeds of the first bond issuance and is reflected in All Other Operating Revenues. 29 Public Finance Resources, Inc. 2016
31 $245,563 $94,300 $247,898 $275,875 $271,375 $386,275 $389,475 $382,575 $385,575 $383,425 Shaker Heights City Schools Intergovernmental & Debt These lines account for pass through payments, as well as monies received by a district on behalf of another governmental entity, plus principal and interest payments for general fund borrowing. $450,000 $400,000 $350,000 $300,000 $250,000 $200,000 $150,000 $100,000 $50,000 Actual Projected FORECASTED Total 271, , , , , ,425 YOY $ Change (4,500) 114,900 3,200 (6,900) 3,000 (2,150) YOY % Change -1.6% 42.3% 0.8% -1.8% 0.8% -0.6% Percentage of Total Budget 0.3% 0.4% 0.4% 0.4% 0.4% 0.3% Expenses in this category reflect unvoted debt service repayments. The increase in Fiscal 2019 is due to the General Fund assumption of the bus bond payments due to the exhaustion of the non-bond portion of funds available in the Capital Fund 004 that were previously used to make such payments. 30 Public Finance Resources, Inc. 2016
32 $1,537,905 $1,694,414 $1,476,571 $1,515,540 $1,755,307 $1,710,000 $1,785,000 $1,863,000 $1,945,000 $2,031,000 Shaker Heights City Schools Other Objects Primary components for this expenditure line are membership dues and fees, ESC contract deductions, County Auditor/Treasurer fees, audit expenses, and election expenses. $2,500,000 Actual Projected $2,000,000 $1,500,000 $1,000,000 $500, FORECASTED Total 1,755,307 1,710,000 1,785,000 1,863,000 1,945,000 2,031,000 YOY $ Change 239,767 (45,307) 75,000 78,000 82,000 86,000 YOY % Change 15.8% -2.6% 4.4% 4.4% 4.4% 4.4% Percentage of Total Budget 1.8% 1.8% 1.8% 1.8% 1.8% 1.8% Assumes a 5% growth in most of these expenditures which primarily consist of County Auditor & Treasurer fees (for collecting the District's property taxes). The increase in Fiscal 2018 was attributable to election expenses charged for the bond issue on the May 2017 ballot. 31 Public Finance Resources, Inc. 2016
33 $2,446,264 $220,000 $235,000 $245,000 $265,000 $290,000 $315,000 $340,000 $365,000 $390,000 Shaker Heights City Schools Total Other Financing Uses Operating transfers-out, advances out to other funds, and all other general fund financing uses. $3,000,000 $2,500,000 $2,000,000 $1,500,000 Actual Projected $1,000,000 $500, FORECASTED Total 265, , , , , ,000 YOY $ Change 20,000 25,000 25,000 25,000 25,000 25,000 YOY % Change 8.2% 9.4% 8.6% 7.9% 7.4% 6.8% Percentage of Total Budget 0.3% 0.3% 0.3% 0.3% 0.3% 0.3% Transfers Out 265, , , , , ,000 Advances Out This category includes transfers to other funds, primarily Fund 300 for District athletics. Fiscal 2014 included the transfer of $2.2 million to the District's capital fund. 32 Public Finance Resources, Inc. 2016
34 FY 2019 Current Forecast Compared to Last Filed Forecast(05/15/2018) FY 2019 Current Revenue Forecast Compared to Prior 1.01 Real Estate $1,795, Public Utility FY 2019 $142,673 Current Revenue Forecast Compared to Prior 1.03 $100 Income Tax 2.xx Other Sources 1.035, 1.04 State Funding -$32, Other Rev. $476, Prop Tax Alloc Prop Tax Alloc Other 1.035, Rev State Funding -$32,000 $476,000 2.xx Other Sources 1.03 Income Tax 1.02 Public Utility $142, Real Estate $1,795,951 FY 2019 Current Expenditure Forecast Compared to Prior 3.01 Salaries -$197, Benefits Intergov + Debt + Other $109, Purchased Serv. 4.3 Other Exp -$8, Capital $160,000 -$452, Supplies 3.04 Supplies -$153,000 -$153, Capital 3.03 Purchase -$452, Other Exp 3.02 Benefits $59, Salaries -$197,000 -$8,000 Intergov + Debt + Other Note: Individual category variances beteween -$100 and +$100 are not reflected. FY 2019 Current Expenditure Forecast Compared to Prior $59,332 $160,000 $109,500 Previous Filed Forecast: 05/15/2018 Summary Analysis of Current Compared to Last Filed Forecast FY 2019 Impact Net FY 2019 Revenue Variance $2,382,624 Net FY 2019 Exependiture Variance -$481,568 Net FY 2019 Impact on Ending Cash Balance $2,864,192 Favorable Percentage of Budget 2.94% May 2018 vs. October 2018 for Fiscal 2019: The $2.4 million favorable revenue variance for Fiscal 2019 is primarily attributable to the $1.9 million property tax favorable variance resulting from the accelerated real estate tax collections caused by the change in federal income tax laws; and the.35 million interest income favorable variance due to higher interest rates and cash balances. The.5 million favorable expenditure variance is primarily attributable to reduced projected utility and out-of-district tuition expenditures. The combination of the revenue and expenditure variances nets to a $2.9 million favorable variance from the May forecast for Fiscal Public Finance Resources, Inc. 2016
35 Current vs Prior Forecast F2019 Revenues 34
36 Current vs Prior Forecast F2019 Expenditures 35
37 Shaker Heights City Schools Five Year Forecast Actual FORECASTED Fiscal Year: Revenue: General Property Tax (Real Estate) 70,025,913 62,600,210 66,577,508 66,440,693 66,437,128 66,429, Public Utility Personal Property 2,989,196 3,108,343 3,198,015 3,289,730 3,381,445 3,473, Income Tax Unrestricted Grants-in-Aid 17,306,003 17,306,000 16,440,700 16,441,000 15,618,950 15,619, Restricted Grants-in-Aid 979, , ,000 1,004,000 1,012,000 1,020, Property Tax Allocation 8,749,414 8,749,414 8,749,414 8,749,414 8,749,414 8,749, All Other Operating Revenues 5,353,798 3,483,000 3,440,000 3,481,000 3,460,000 3,282, Total Revenue 105,403,626 96,234,967 99,401,637 99,405,837 98,658,937 98,573,037 Other Financing Sources: Proceeds from Sale of Notes State Emergency Loans and Adv Operating Transfers-In Advances-In All Other Financing Sources Total Other Financing Sources Total Rev & Other Sources 105,403,626 96,234,967 99,401,637 99,405,837 98,658,937 98,573,037 Expenditures: Personnel Services 56,000,930 57,134,000 58,007,000 59,790,000 61,631,000 63,537, Employee Benefits 19,482,515 20,127,000 21,000,025 22,317,355 23,776,750 25,359, Purchased Services 12,727,796 13,725,600 14,199,600 14,792,600 15,212,600 15,750, Supplies and Materials 2,778,575 3,189,000 3,240,000 3,292,000 3,544,000 3,401, Capital Outlay 3,655,300 1,000,000 1,050,000 1,103,000 1,158,000 1,216, & Intergov'mtal & Debt Service 271, , , , , , Other Objects 1,755,307 1,710,000 1,785,000 1,863,000 1,945,000 2,031, Total Expenditures 96,671,798 97,271,875 99,671, ,540, ,652, ,678,112 Other Financing Uses Operating Transfers-Out 265, , , , , , Advances-Out All Other Financing Uses Total Other Financing Uses 265, , , , , , Total Exp and Other Financing Uses 96,936,798 97,561,875 99,986, ,880, ,017, ,068, Excess of Rev Over/(Under) Exp 8,466,828 (1,326,908) (584,463) (4,474,693) (9,358,988) (13,495,075) Cash Balance July 1 (No Levies) 47,769,964 56,236,792 54,909,884 54,325,421 49,850,728 40,491, Cash Balance June 30 (No Levies) 56,236,792 54,909,884 54,325,421 49,850,728 40,491,740 26,996,665 Reservations: Estimated Encumbrances June 30 5,081,976 5,081,976 5,081,976 5,081,976 5,081,976 5,081, Reservations Subtotal 353, , , , , , Fund Bal June 30 for Cert of App 50,801,746 49,474,838 48,890,375 44,415,682 35,056,694 21,561,619 Rev from Replacement/Renewal Levies & Renewal Levies Cumulative Balance of Levies Fund Bal June 30 for Cert of Obligations 50,801,746 49,474,838 48,890,375 44,415,682 35,056,694 21,561,619 Revenue from New Levies & New Levies - - 2,923,050 5,846,100 5,846, Cumulative Balance of New Levies ,923,050 8,769,150 14,615, Unreserved Fund Balance June 30 50,801,746 49,474,838 48,890,375 47,338,732 43,825,844 36,176,869 Ending Fund Bal. as % of Total Expend.-pre levy 52.4% 50.7% 48.9% 42.8% 32.5% 19.2% 36 Public Finance Resources, Inc. 2016
38 OTHER FINANCIAL ANALYSIS 37
")
39 Revenue, Expenses, Fund Balance (with New Levies) 38
40 Revenues Net of Expenditures 39
41 Net Income Surplus/Deficit 40
42 CASH BALANCES 41

43 Cash Balances 42

44 Yearend Cash Balances 43
45 ENROLLMENT 44

46 Historic vs Projected Enrollment 45
47 Enrollment Projection Head Count Summary/Analysis Shaker Heights City Schools Prior Year Actual/Estimated Enrollment (October Count) 4,865 4,708 4,587 4,493 4,398 Projected Changes to Prior Year Enrollment Net All-Grade Level Mobility Factor (Change) to Prior Year New Kindergartners In Loss of Seniors from Prior Year Net Change in Outgoing and Incoming Pupils Current Year Estimated Enrollment (Simulated October Count) 4,708 4,587 4,493 4,398 4,308 District Head Count Grade K Total Can Differ by Rounding 4,708 4,587 4,493 4,398 4,308 Year-Over-Year Percentage Change -3.23% -2.58% -2.03% -2.12% -2.06% 46
48 ADM-Yr. Over Yr. % Change (and trendline) 47
49 Enrollment-Mobility Step 2 - Select Grades 1-12 Mobility (Gain/Loss) Factor 0 YOY Student Count Change due to Mobility YOY Student Count Change due to Mobility 10 Y -8 5 Yr## 3 Yr## Yr Average 5 Yr Average 3 Yr Average Press Mobility Button to Model >> % -1.88% -2.88% 10 - Year Average 5 - Year Average 3 - Year Average << YOY << YOY 48

50 Enrollment-Kindergarten Note: on average Kindergarteners enrolled were less than resident births 49
51 ASSESSED VALUATION 50

52 Millage & Valuation by Tax Year

53 Assessed Valuation Tax Year 2017=$811 million 52
Shaker Heights City Schools
 Exhibit T-3 As Approved by Board of Education 5/10/2016 Insert Logo Shaker Heights City Schools Financial Report Five Year Forecast May, 2016 Public Finance Resources, 2015 1 Shaker Heights City Schools
Five Year Forecast Financial Report
 Five Year Forecast Financial Report October, 2018 Kevin Hawley, CFO 1 Table of Contents Table of Contents 2 Forecast Summary 3 Revenue Sources and Forecast Year-Over-Year Overview 4 1.010 - General Property
Five Year Forecast Financial Report
 BRECKSVILLE-BROADVIEW HEIGHTS CITY SCHOOL DISTRICT - - CUYAHOGA COUNTY Five Year Forecast Financial Report October, 2018 Jeff Hall, CFO 1 Table of Contents Table of Contents 2 Forecast Summary 3 Revenue
Five Year Forecast Financial Report
 Five Year Forecast Financial Report May, 2018 Terrah Floyd, Interim CFO 1 Table of Contents Table of Contents 2 Executive Summary 3 PAGE # Revenue Overview 4 1.010 General Property Tax (Real Estate) 5
Five Year Forecast Financial Report
 Five Year Forecast Financial Report October, 2017 Greg Slemons, CPA Chief Financial Officer 1 Table of Contents PAGE # Table of Contents 2 Executive Summary 3 Revenue Overview 4 1.010 General Property
Five Year Forecast Financial Report
 Five Year Forecast Financial Report October, 2017 Mark Astorino, Treasurer/CFO 1 Table of Contents PAGE # Table of Contents 2 Executive Summary 3 Revenue Overview 4 1.010 General Property Tax (Real Estate)
Five Year Forecast Financial Report
 Five Year Forecast Financial Report May, 2017 Brett Griffith, CFO 1 Table of Contents PAGE # Table of Contents 2 Executive Summary 3 Revenue Overview 4 1.010 General Property Tax (Real Estate) 5 1.020
Five Year Forecast Financial Report
 Five Year Forecast Financial Report October, 2017 1 Table of Contents Table of Contents 2 Executive Summary 3 PAGE # Revenue Overview 4 1.010 General Property Tax (Real Estate) 5 1.020 Public Utility Personal
Loveland City Schools
 Financial Report Five Year Forecast Update May, 2016 Public Finance Resources, 2015 1 Table of Contents Table of Contents 2 Executive Summary 3 PAGE # Revenue Overview 4 1.010 General Property Tax (Real
Five Year Forecast Financial Report
 May, 2018 RIVERSIDE LOCAL SCHOOL DISTRICT - - LAKE COUNTY Five Year Forecast Financial Report 1 Table of Contents Table of Contents 2 Executive Summary 3 PAGE # Revenue Overview 4 1.010 - General Property
Berea City School District
 Financial Report Five Year Forecast May, 2018 Public Finance Resources, 2015 1 Table of Contents Table of Contents 2 Executive Summary 3 PAGE # Revenue Overview 4 1.010 General Property Tax (Real Estate)
Five Year Forecast Financial Report
 RIVER VALLEY LOCAL SCHOOL DISTRICT MARION COUNTY Five Year Forecast Financial Report May, 2017 1 Table of Contents Table of Contents 2 Executive Summary 3 PAGE # Revenue Overview 4 1.010 General Property
Five Year Forecast Financial Report
 LOGO CLARK SHAWNEE LOCAL SCHOOL DISTRICT CLARK COUNTY Five Year Forecast Financial Report October, 2017 1 Table of Contents Table of Contents 2 Executive Summary 3 PAGE # Revenue Overview 4 1.010 General
Five Year Forecast Financial Report
 LOGO Springboro Community City Schools Five Year Forecast Financial Report May, 2017 Terrah Floyd, CFO 1 Table of Contents Table of Contents 2 Executive Summary 3 PAGE # Revenue Overview 4 1.010 General
Five Year Forecast Financial Report
 Five Year Forecast Financial Report October, 2016 1 Table of Contents Table of Contents 2 Executive Summary 3 PAGE # Revenue Overview 4 1.010 - General Property Tax (Real Estate) 5 1.020 - Public Utility
Five Year Forecast Financial Report
 May, 2018 TEAYS VALLEY LOCAL SCHOOL DISTRICT PICKAWAY COUNTY Five Year Forecast Financial Report 1 Table of Contents Table of Contents 2 Executive Summary 3 PAGE # Revenue Overview 4 1.010 General Property
Five Year Forecast Financial Report
 Five Year Forecast Financial Report October, 2017 1 Table of Contents Table of Contents 2 Executive Summary 3 PAGE # Revenue Overview 4 1.010 - General Property Tax (Real Estate) 5 1.020 - Public Utility
Five Year Forecast Financial Report
 Five Year Forecast Financial Report May, 2018 1 Table of Contents Table of Contents 2 Executive Summary 3 PAGE # Revenue Overview 4 1.010 - General Property Tax (Real Estate) 5 1.020 - Public Utility Personal
Five Year Forecast Financial Report
 Five Year Forecast Financial Report October, 2016 1 Table of Contents Table of Contents 2 Executive Summary 3 PAGE # Revenue Overview 4 1.010 General Property Tax (Real Estate) 5 1.020 Public Utility Personal
Five Year Forecast Financial Report
 LOGO SOUTHERN LOCAL SCHOOL DISTRICT - - MEIGS COUNTY Five Year Forecast Financial Report May, 2018 1 Table of Contents Table of Contents 2 Executive Summary 3 PAGE # Revenue Overview 4 1.010 - General
Five Year Forecast Financial Report
 Five Year Forecast Financial Report May, 2017 1 Table of Contents Table of Contents 2 Executive Summary 3 PAGE # Revenue Overview 4 1.010 - General Property Tax (Real Estate) 5 1.020 - Public Utility Personal
Paint Valley Local School District
 Paint Valley Local School District Financial Forecast Summary & Report May 5, 2016 Kristin O Dell, Treasurer Paint Valley Local Schools (kristin.odell@pvlsd.org) 1 Forecast Purpose This forecast is intended
Springboro Community City School District
 Springboro Community City School District Updated Financial Forecast Summary & Report November 2014 Terrah Floyd, CFO tfloyd@springboro.org Forecast Purpose This forecast is intended to assist the school
HUDSON CITY SCHOOLS FINANCIAL REPORT. October 2014 Five-Year Forecast Update KATHRYN L. SINES TREASURER / CFO.
 HUDSON CITY SCHOOLS FINANCIAL REPORT October 2014 Five-Year Forecast Update KATHRYN L. SINES TREASURER / CFO www.sinesk@hudson.edu 1 Forecast Purpose This forecast is intended to assist the school district
Five Year Forecast Financial Report
 Five Year Forecast Financial Report October, 2017 1 Table of Contents Table of Contents 2 Executive Summary 3 PAGE # Revenue Overview 4 1.010 - General Property Tax (Real Estate) 5 1.020 - Public Utility
Springboro Community City School District
 Springboro Community City School District Financial Forecast Summary & Report May 29, 2014 Terrah Floyd, CFO tfloyd@springboro.org 1 Forecast Purpose This forecast is intended to assist the school district
Clear Fork Valley LSD
 Financial Report Five Year Forecast May, 2016 Treasurer/CFO: Bradd Stevens Table of Contents PAGE # Table of Contents 2 Executive Summary 3 Revenue Overview 4 1.010 - General Property Tax (Real Estate)
Loveland City School District
 Financial Forecast Summary & Report March 24, 2015 Brett Griffith, CFO Loveland City Schools (griffibr@lovelandschools.org) Forecast Purpose This forecast is intended to assist the school district in the
Paint Valley Local School District
 Paint Valley Local School District Financial Forecast Summary & Report October 2014 Kristin O Dell, CFO Paint Valley Local Schools Kristin.odell@pvlsd.org 1 Forecast Purpose This forecast is intended to
FIVE-YEAR FINANCIAL FORECAST NOTES AND ASSUMPTIONS. For the Fiscal Years Ending June 30, 2014 through 2018
 FIVE-YEAR FINANCIAL FORECAST NOTES AND ASSUMPTIONS For the Fiscal Years Ending June 30, 2014 through 2018 October 19, 2013 The mission of the Dayton City Schools is to provide a high-quality education
LANCASTER CITY SCHOOL DISTRICT - - FAIRFIELD COUNTY IRN:
 LANCASTER CITY SCHOOL DISTRICT - - FAIRFIELD COUNTY IRN: 44206 Schedule of Revenues, Expenditures and Changes in Fund Balances ACTUAL AND FORECASTED OPERATING FUND Actual Forecasted Fiscal Year Fiscal
Summary of Significant Forecast Assumptions Amanda-Clearcreek Local School District July 1, 2017 June 30, 2022 October 2017.
 Summary of Significant Forecast Assumptions Amanda-Clearcreek Local School District July 1, 2017 June 30, 2022 October 2017 Revenues: 1.010 Real Estate: This line item contains revenue collected from taxes
Hilliard City School District
 Hilliard City School District Five-Year Forecast For the Projected Years Ending June 30, 2018 through June 30, 2022 October 2017 Please visit the Ohio Department of Education website at ftp://ftp.ode.state.oh.us/geodoc/5-yrforecast/.
Brunswick City School District Five Year Financial Forecast Fiscal Year 2017 to Fiscal Year 2021 (Including Historical Data)
") Brunswick City School District Five Year Financial Forecast Fiscal Year 2017 to Fiscal Year 2021 (Including Historical Data) Prepared by the Office of the Treasurer/CFO 3643 Center Road Brunswick, Ohio
Brunswick City School District Five Year Financial Forecast Fiscal Year 2017 to Fiscal Year 2021 (Including Historical Data) Prepared by the Office of the Treasurer/CFO 3643 Center Road Brunswick, Ohio
Miami County, Ohio FIVE-YEAR FINANCIAL FORECAST NOTES AND ASSUMPTIONS. For the Fiscal Years Ending June 30, 2013 through 2017
 Miami County, Ohio FIVE-YEAR FINANCIAL FORECAST NOTES AND ASSUMPTIONS For the Fiscal Years Ending June 30, 2013 through 2017 May 13, 2013 General The Ohio Constitution assigns the state the responsibility
Licking Heights Local School District 5 Year Forecast Assumptions (FY 2013 FY 2017) Board Approved: October 24, Revenue:
 Board Approved: October 24, Revenue:") Licking Heights Local School District 5 Year Forecast Assumptions (FY 2013 FY 2017) Board Approved: October 24, 2012 Revenue: General Property Tax (Real Estate) Property values dropped 7.04% in aggregate
Licking Heights Local School District 5 Year Forecast Assumptions (FY 2013 FY 2017) Board Approved: October 24, 2012 Revenue: General Property Tax (Real Estate) Property values dropped 7.04% in aggregate
Miami County, Ohio FIVE-YEAR FINANCIAL FORECAST NOTES AND ASSUMPTIONS. For the Fiscal Years Ending June 30, 2012 through 2016
 Miami County, Ohio FIVE-YEAR FINANCIAL FORECAST NOTES AND ASSUMPTIONS For the Fiscal Years Ending June 30, 2012 through 2016 April 9, 2012 General The Ohio Constitution assigns the state the responsibility
Cash Balance June 30 15,940,136 15,271,647 13,479,243 12,241,640 11,698,295 10,837,831 9,756,394 8,379,673
 Whitehall City School District Schedule Of Revenue, Expenditures and Changes In Fund Balances Actual and Forecasted Operating Fund ACTUAL FORECASTED Fiscal Year Fiscal Year Fiscal Year Fiscal Year Fiscal
XENIA COMMUNITY CITY SCHOOL DISTRICT-GREENE COUNTY SCHEDULE OF REVENUE, EXPENDITURES, AND CHANGES IN FUND BALANCES FOR THE FISCAL YEARS ENDED JUNE
 XENIA COMMUNITY CITY SCHOOL DISTRICT-GREENE COUNTY SCHEDULE OF REVENUE, EXPENDITURES, AND CHANGES IN FUND BALANCES FOR THE FISCAL YEARS ENDED JUNE 30, 2014, 2015 and 2016 ACTUAL FORECASTED FISCAL YEARS
Forecast Provided By Newark City School District Treasurer's Office Julio Valladares, MBA, Treasurer/CFO
 Newark City School District Licking County SCHEDULE OF REVENUE, EXPENDITURES, AND CHANGES IN FUND BALANCES FOR THE FISCAL YEARS ENDED JUNE 30, 2015, 2016 and 2017 ACTUAL FORECASTED FISCAL YEARS ENDING
TECUMSEH LOCAL SCHOOL DISTRICT IRN # FIVE-YEAR FORECAST ASSUMPTIONS OCTOBER
 TECUMSEH LOCAL SCHOOL DISTRICT IRN #046243 2018 FIVE-YEAR FORECAST ASSUMPTIONS OCTOBER As stated on the Ohio Department of Education Five-Year Forecast Webpage: The reader should remember that a forecast
Brunswick City School District Five Year Financial Forecast Fiscal Year 2017 to Fiscal Year 2021 (Including Historical Data)
") Brunswick City School District Five Year Financial Forecast Fiscal Year 2017 to Fiscal Year 2021 (Including Historical Data) Prepared by the Office of the Treasurer/CFO Brunswick City School District 3643
Brunswick City School District Five Year Financial Forecast Fiscal Year 2017 to Fiscal Year 2021 (Including Historical Data) Prepared by the Office of the Treasurer/CFO Brunswick City School District 3643
7.020 Cash Balance June 30 3,709,735 4,692,492 5,469, % 5,455,806 5,183,533 4,810,736 4,205,146 3,345,106
 Ripley-Union-Lewis-Huntington S.D. Brown County Schedule of Revenues, Expenditures and Changes in Fund Balances For the Fiscal Years Ended June 30, 2015, 2016 and 2017 Actual; Forecasted Fiscal Years Ending
MARYSVILLE EXEMPTED VILLAGE SCHOOL DISTRICT- UNION COUNTY SCHEDULE OF REVENUE, EXPENDITURES, AND CHANGES IN FUND BALANCES FOR THE FISCAL YEARS ENDED
 MARYSVILLE EXEMPTED VILLAGE SCHOOL DISTRICT- UNION COUNTY SCHEDULE OF REVENUE, EXPENDITURES, AND CHANGES IN FUND BALANCES FOR THE FISCAL YEARS ENDED JUNE 30, 2014, 2015 and 2016 ACTUAL FORECASTED FISCAL
The Notes To The Five Year Forecast Are An Integral Part Of This Presentation.
 ACTUAL ACTUAL ACTUAL ACTUAL ACTUAL ESTIMATED ESTIMATED ESTIMATED ESTIMATED ESTIMATED 7/06-6/07 7/07-6/08 7/08-6/09 7/09-6/10 7/10-6/11 7/11-6/12 7/12-6/13 7/13-6/14 7/14-6/15 7/15-6/16 OPERATING REVENUES:
NORTHRIDGE LOCAL SCHOOL DISTRICT - LICKING COUNTY SCHEDULE OF REVENUE, EXPENDITURES, AND CHANGES IN FUND BALANCES FOR THE FISCAL YEARS ENDED ACTUAL
 NORTHRIDGE LOCAL SCHOOL DISTRICT - LICKING COUNTY SCHEDULE OF REVENUE, EXPENDITURES, AND CHANGES IN FUND BALANCES FOR THE FISCAL YEARS ENDED ACTUAL JUNE 30, 2015, 2016, and 2017 FORECASTED FISCAL YEARS
Summary of Significant Forecast Assumptions and Accounting Policies For the Fiscal Years Ending June 30, 2018 through 2022
 ONTARIO LOCAL SCHOOL DISTRICT RICHLAND COUNTY 1 Summary of Significant Forecast Assumptions and Accounting Policies For the Fiscal Years Ending June 30, 2018 through 2022 Note 1 - Nature and Limitations
Tipp City Exempted Village Schools. Miami County
 Tipp City Exempted Village Schools Miami County Assumptions for Five-Year Financial Forecast Projected Fiscal years June 30, 2014 through June 30, 2018 Forecast provided by: Tipp City Exempted Village
Forecast Provided By Dublin City School District Treasurer's Office Mr. Brian Kern, Treasurer/CFO. December 10, 2018 (revised)
") DUBLIN CITY SCHOOL DISTRICT - FRANKLIN COUNTY SCHEDULE OF REVENUE, EXPENDITURES, AND CHANGES IN FUND BALANCES FOR THE FISCAL YEARS ENDED JUNE 30, 2016, 2017 and 2018 ACTUAL FORECASTED FISCAL YEARS ENDING
DUBLIN CITY SCHOOL DISTRICT - FRANKLIN COUNTY SCHEDULE OF REVENUE, EXPENDITURES, AND CHANGES IN FUND BALANCES FOR THE FISCAL YEARS ENDED JUNE 30, 2016, 2017 and 2018 ACTUAL FORECASTED FISCAL YEARS ENDING
Marietta City School District Assumptions for October year Forecast
 Marietta City School District Assumptions for October 2018 5 year Forecast Marietta City School District is articulating to users of forecasts that assumptions are the basis of any forecast. An assumption
Forecast Provided By Dublin City School District Treasurer's Office Mr. Brian Kern, Treasurer/CFO
 DUBLIN CITY SCHOOL DISTRICT-FRANKLIN COUNTY SCHEDULE OF REVENUE, EXPENDITURES, AND CHANGES IN FUND BALANCES FOR THE FISCAL YEARS ENDED JUNE 30, 2015, 2016 and 2017 ACTUAL FORECASTED FISCAL YEARS ENDING
HUBER HEIGHTS CITY SCHOOL DISTRICT MONTGOMERY COUNTY SCHEDULE OF REVENUE, EXPENDITURES, AND CHANGES IN FUND BALANCES FOR THE FISCAL YEARS ENDED JUNE
 HUBER HEIGHTS CITY SCHOOL DISTRICT MONTGOMERY COUNTY SCHEDULE OF REVENUE, EXPENDITURES, AND CHANGES IN FUND BALANCES FOR THE FISCAL YEARS ENDED JUNE 30, 2016, 2017 and 2018 ACTUAL FORECASTED FISCAL YEARS
Forecast Provided By Fairborn City School District Treasurer's Office Nicole Marshall, Treasurer/CFO
 FAIRBORN CITY SCHOOL DISTRICT-GREENE COUNTY SCHEDULE OF REVENUE, EXPENDITURES, AND CHANGES IN FUND BALANCES FOR THE FISCAL YEARS ENDED JUNE 30, 2015, 2016 and 2017 ACTUAL FORECASTED FISCAL YEARS ENDING
LAKEWOOD CITY SCHOOLS
 LAKEWOOD CITY SCHOOLS Financial Forecast and Summary Report May 2017 Kent R. Zeman, CPA CFO/Treasurer In Collaboration with: Lakewood Board of Education Members Mr. Jeff Patterson, Superintendent Administrative
Enclosure C-1-c. May 9, 2016
 Enclosure C-1-c May 9, 2016 WORTHINGTON CITY SCHOOL DISTRICT-FRANKLIN COUNTY SCHEDULE OF REVENUE, EXPENDITURES, AND CHANGES IN FUND BALANCES FOR THE FISCAL YEARS ENDED JUNE 30, 2013, 2014 and 2015 ACTUAL
Summary of Significant Forecast Assumptions and Accounting Policies For the Fiscal Years Ending June 30, 2013 through 2017
 ONTARIO LOCAL SCHOOL DISTRICT RICHLAND COUNTY 1 Summary of Significant Forecast Assumptions and Accounting Policies For the Fiscal Years Ending June 30, 2013 through 2017 Note 1 - Nature and Limitations
Forecast Provided By Groveport-Madison School District Treasurer's Office John Walsh, Treasurer
 Groveport-Madison City School District Franklin County SCHEDULE OF REVENUE, EXPENDITURES, AND CHANGES IN FUND BALANCES FOR THE FISCAL YEARS ENDED JUNE 30, 2014, 2015 and 2016 ACTUAL FORECASTED FISCAL YEARS
WORTHINGTON CITY SCHOOL DISTRICT-FRANKLIN COUNTY SCHEDULE OF REVENUE, EXPENDITURES, AND CHANGES IN FUND BALANCES FOR THE FISCAL YEARS ENDED JUNE 30,
 WORTHINGTON CITY SCHOOL DISTRICT-FRANKLIN COUNTY SCHEDULE OF REVENUE, EXPENDITURES, AND CHANGES IN FUND BALANCES FOR THE FISCAL YEARS ENDED JUNE 30, 2012, 2013 and 2014 ACTUAL FORECASTED FISCAL YEARS ENDING
DUBLIN CITY SCHOOL DISTRICT - FRANKLIN COUNTY
 DUBLIN CITY SCHOOL DISTRICT - FRANKLIN COUNTY SCHEDULE OF REVENUE, EXPENDITURES, AND CHANGES IN FUND BALANCES FOR THE FISCAL YEARS ENDED ACTUAL JUNE 30, 2014, 2015, 2016 FORECASTED FISCAL YEARS ENDING
Change
 CLEARVIEW LOCAL SCHOOL DISTRICT Lorain County Schedule of Revenues, Expenditures and Changes in Fund Balances For the Fiscal Years Ended June 30, 2015, 2016, and 2017 Actual Forecasted Fiscal Years Ending
Findlay City School District Hancock County Five Year Forecast for Fiscal Years 2016 through 2023
 Findlay City School District Hancock County Five Year Forecast for Fiscal Years 2016 through 2023 Actual Forecasted Fiscal Year Fiscal Year Fiscal Year Average Fiscal Year Fiscal Year Fiscal Year Fiscal
Miami Trace Local School District Fayette County Actual Forecasted Revenues Other Financing Sources Expenditures Other Financing Uses
 Miami Trace Local School District Fayette County Schedule of Revenues, Expenditures and Changes in Fund Balances For the Fiscal Years Ended June 30, 2015, 2016 and 2017 Actual; Forecasted Fiscal Years
CINCINNATI CITY SCHOOL DISTRICT-HAMILTON COUNTY SCHEDULE OF REVENUES, EXPENDITURES, AND CHANGES IN FUND BALANCES FOR THE FISCAL YEARS ENDED JUNE 30,
 CINCINNATI CITY SCHOOL DISTRICT-HAMILTON COUNTY SCHEDULE OF REVENUES, EXPENDITURES, AND CHANGES IN FUND BALANCES FOR THE FISCAL YEARS ENDED JUNE 30, 2013, 2014 and 2015 ACTUAL FORECASTED FISCAL YEARS ENDING
Harrison Hills City School District Treasurer's Office Roxane Harding, Treasurer
 HARRISON HILLS CITY SCHOOL DISTRICT HARRISON COUNTY SCHEDULE OF REVENUE, EXPENDITURES, AND CHANGES IN FUND BALANCES FOR THE FISCAL YEARS ENDED JUNE 30, 2011, 2012 and 2013 ACTUAL FORECASTED FISCAL YEARS
Loveland City Schools FY Revenue
 FREQUENTLY ASKED QUESTIONS 1. Where does the Loveland City School District revenue come from? In Ohio, the funding of schools is shared by the state and local school districts. The Ohio General Assembly
Bellefontaine City School District. Fiscal Year Five Year Forecast
 Bellefontaine City School District Fiscal Year 2018 Five Year Forecast Adopted May 21, 2018 Compiled By: Keith E. Krieger, Treasurer/CFO PURPOSE OF THE FORECAST BELLEFONTAINE CITY SCHOOL DISTRICT The five-year
Ferndale School District #502 Business and Support Services Budget Summary Citizens' Budget General Fund
 Ferndale School District #502 Business and Support Services 2018-19 Budget Summary Citizens' Budget General Fund 7/31/2018 Prepared by: Mark Deebach, Assistant Superintendent for Business & Support Services
BIG WALNUT LOCAL SCHOOL DISTRICT- DELAWARE COUNTY SCHEDULE OF REVENUE, EXPENDITURES, AND CHANGES IN FUND BALANCES FOR THE FISCAL YEARS ENDED JUNE 30,
 BIG WALNUT LOCAL SCHOOL DISTRICT- DELAWARE COUNTY SCHEDULE OF REVENUE, EXPENDITURES, AND CHANGES IN FUND BALANCES FOR THE FISCAL YEARS ENDED JUNE 30, 2015, 2016 and 2017 ACTUAL FORECASTED FISCAL YEARS
Forecast Provided By Trotwood-Madison City School District Treasurer's Office Janice Allen, Treasurer
 Trotwood-Madison City School District Montgomery County SCHEDULE OF REVENUE, EXPENDITURES, AND CHANGES IN FUND BALANCES FOR THE FISCAL YEARS ENDED JUNE 30, 2011, 2012 and 2013 ACTUAL FORECASTED FISCAL
LAKOTA LOCAL SCHOOL DISTRICT-BUTLER COUNTY SCHEDULE OF REVENUE, EXPENDITURES, AND CHANGES IN FUND BALANCES FOR THE FISCAL YEARS ENDED JUNE 30, 2013,
 LAKOTA LOCAL SCHOOL DISTRICT-BUTLER COUNTY SCHEDULE OF REVENUE, EXPENDITURES, AND CHANGES IN FUND BALANCES FOR THE FISCAL YEARS ENDED JUNE 30, 2013, 2014 and 2015 ACTUAL FORECASTED FISCAL YEARS ENDING
MOHAWK LOCAL SCHOOL DISTRICT Wyandot COUNTY, OHIO IRN #050740
 MOHAWK LOCAL SCHOOL DISTRICT Wyandot COUNTY, OHIO IRN #050740 605 State Highway 231 Sycamore, Ohio 44882 FIVE YEAR FINANCIAL FORECAST FISCAL 2012-2016 Prepared by Treasurer, Roy B. Swartz, CPA October
Mansfield City School District Richland County, Ohio
 Richland County, Ohio Fiscal Emergency Termination Local Government Services Section Richland County Fiscal Emergency Termination Table of Contents Certification... 3 Report on Termination of the Financial
Financial Readiness for Leaders
 Financial Readiness for Leaders Prepared by: Public Finance Resources, Inc. In today s era of uncertainty, the data contained in this report will provide you with the tools and training needed to maximize
Northwest Local School District (Hamilton County) 5-Year Forecast Assumptions May 11, 2015
 5-Year Forecast Assumptions May 11, 2015") Northwest Local School District (Hamilton County) 5-Year Forecast Assumptions May 11, 2015 Disclaimers The 5-year forecast for Northwest Local School District (Hamilton County) is derived from the last
Northwest Local School District (Hamilton County) 5-Year Forecast Assumptions May 11, 2015 Disclaimers The 5-year forecast for Northwest Local School District (Hamilton County) is derived from the last
Riverside Local School District
 Riverside Local School District Five Year Forecast Presentation October 22, 2018 Presented by: Gary A. Platko Guidance The Ohio Department of Education (ODE) has developed a guide to assist teachers, administrators,
Cloverleaf Local School District Five-Year Financial Forecast
 Cloverleaf Local School District Five-Year Financial Forecast Jason Myers President Michael Maloney Vice President Jane Rych Board Member Jim Curran Board Member Bill Schmock Board Member James Hudson
EASTWOOD LOCAL SCHOOL DISTRICT
 EASTWOOD LOCAL SCHOOL DISTRICT Five Year Forecast Notes and Assumptions May 15, 2017 HOME OF THE EAGLES REVENUE ASSUMPTIONS School districts operate from three sources of tax revenue: Local Property Taxes,
LAKOTA LOCAL SCHOOL DISTRICT-BUTLER COUNTY SCHEDULE OF REVENUE, EXPENDITURES, AND CHANGES IN FUND BALANCES FOR THE FISCAL YEARS ENDED JUNE 30, 2014,
 LAKOTA LOCAL SCHOOL DISTRICT-BUTLER COUNTY SCHEDULE OF REVENUE, EXPENDITURES, AND CHANGES IN FUND BALANCES FOR THE FISCAL YEARS ENDED JUNE 30, 2014, 2015 and 2016 ACTUAL FORECASTED FISCAL YEARS ENDING
WEST IRON COUNTY PUBLIC SCHOOL DISTRICT. Financial Report with Supplemental Information Prepared in Accordance with GASB 34.
 Financial Report with Supplemental Information Prepared in Accordance with GASB 34 June 30, 2009 1 TABLE OF CONTENTS INDEPENDENT AUDITOR S REPORT... 4 ADMINISTRATION S DISCUSSION AND ANALYSIS... 7 BASIC
LICKING HEIGHTS LOCAL SCHOOL DISTRICT LICKING COUNTY, OHIO
 FINANCIAL FORECAST NOTES OCTOBER 2015 Nick Roberts, CFO/Treasurer njroberts@laca.org Licking Heights Five Year Forecast FISCAL YEAR 2016 Actual Forecasted 2013 2014 2015 2016 2017 2018 2019 2020 1.010
GRANVILLE SCHOOLS CASH BALANCE GUIDELINES AND THE MAY 5-YEAR FORECAST
 GRANVILLE SCHOOLS CASH BALANCE GUIDELINES AND THE MAY 5-YEAR FORECAST Mike Sobul, CFO/Treasurer Dan Gibson, Member, Superintendent s Finance Committee May 2013 CASH BALANCE GUIDELINES Why Have Cash Balance
Williamston Community Schools Williamston, Michigan FINANCIAL STATEMENTS. June 30, 2017
 Williamston, Michigan FINANCIAL STATEMENTS TABLE OF CONTENTS Page INDEPENDENT AUDITOR S REPORT ADMINISTRATION S DISCUSSION AND ANALYSIS i-ii iii-x BASIC FINANCIAL STATEMENTS District-wide Financial Statements:
UPPER SCIOTO VALLEY LOCAL SCHOOL DISTRICT-HARDIN COUNTY SCHEDULE OF REVENUE, EXPENDITURES, AND CHANGES IN FUND BALANCES FOR THE FISCAL YEARS ENDED
 UPPER SCIOTO VALLEY LOCAL SCHOOL DISTRICT-HARDIN COUNTY SCHEDULE OF REVENUE, EXPENDITURES, AND CHANGES IN FUND BALANCES FOR THE FISCAL YEARS ENDED JUNE 30, 2015, 2016 and 2017 ACTUAL FORECASTED FISCAL
Copley-Fairlawn City Schools, Summit County Five Year Forecast Assumptions May, 2011
 Copley-Fairlawn City Schools, Summit County Five Year Forecast Assumptions May, 2011 The Copley-Fairlawn City School District has achieved Excellent with Distinction status as measured and reported in
Piqua City School District 719 East Ash Street Piqua, Ohio ASSUMPTIONS TO THE FIVE-YEAR FORECAST May 2018
 Piqua City School District 719 East Ash Street Piqua, Ohio 45356 ASSUMPTIONS TO THE FIVE-YEAR FORECAST May 2018 INTRODUCTION TO FIVE YEAR FORECAST All school districts in Ohio are required to file a five
ROBIN KLENK, TREASURER
 BASIC FINANCIAL STATEMENTS FOR THE FISCAL YEAR ENDED JUNE 30, 2012 ROBIN KLENK, TREASURER BASIC FINANCIAL STATEMENTS TABLE OF CONTENTS Table of Contents... 1 Accountant s Compilation Report... 2 Management
SHAKER HEIGHTS BOARD OF EDUCATION SHAKER HEIGHTS, OHIO. May 5, Members, Shaker Heights Board of Education
 SHAKER HEIGHTS BOARD OF EDUCATION SHAKER HEIGHTS, OHIO TO: FROM: SUBJECT: Members, Shaker Heights Board of Education Bryan C. Christman, Treasurer Financial and Miscellaneous Briefs I. GENERAL FUND (As
LAKOTA LOCAL SCHOOL DISTRICT-BUTLER COUNTY SCHEDULE OF REVENUE, EXPENDITURES, AND CHANGES IN FUND BALANCES FOR THE FISCAL YEARS ENDED JUNE 30, 2013,
 LAKOTA LOCAL SCHOOL DISTRICT-BUTLER COUNTY SCHEDULE OF REVENUE, EXPENDITURES, AND CHANGES IN FUND BALANCES FOR THE FISCAL YEARS ENDED JUNE 30, 2013, 2014 and 2015 ACTUAL FORECASTED FISCAL YEARS ENDING
Bloomfield Hills Schools FY2013/14 Midyear Budget and Forecast Preview
 Bloomfield Hills Schools FY2013/14 Midyear Budget and Forecast Preview February 6, 2014 Overview: General Fund Special Revenue Funds changes 1 Mid-Year Budget Update Fiscal Year 2013/14 General Fund Fund
Public School Finance 101
 Public School Finance 101 FREQUENTLY ASKED QUESTIONS When were new operating tax levies passed in the Eastwood district? Continuing Operating Property Tax Levies were passed by district voters in 1976,
Fulton Schools Middleton, Michigan FINANCIAL STATEMENTS. June 30, 2018
 Middleton, Michigan FINANCIAL STATEMENTS Middleton, Michigan BOARD OF EDUCATION Karla Childers President Lee Williams Vice-President Deana Grover Secretary Amy Case Treasurer Edward V. Lorenz Trustee Matthew
Five Year Plan Assumptions For Fiscal Years Ending June 30, 2016 Through 2020
 Five Year Plan Assumptions For Fiscal Years Ending June 30, 2016 Through 2020 Non Controllable Forecast Variables: Forecast Variables: State Funding Student Enrollment Educational Needs of Students Property
CUYAHOGA HEIGHTS LOCAL SCHOOL DISTRICT CUYAHOGA COUNTY REGULAR AUDIT
 CUYAHOGA HEIGHTS LOCAL SCHOOL DISTRICT CUYAHOGA COUNTY REGULAR AUDIT FOR THE YEAR ENDED JUNE 30, 2014 CUYAHOGA HEIGHTS LOCAL SCHOOL DISTRICT CUYAHOGA COUNTY TABLE OF CONTENTS TITLE PAGE Independent Auditor
Piqua City School District 719 East Ash Street Piqua, Ohio ASSUMPTIONS TO THE FIVE-YEAR FORECAST October 2013
 Piqua City School District 719 East Ash Street Piqua, Ohio 45356 ASSUMPTIONS TO THE FIVE-YEAR FORECAST October 2013 INTRODUCTION TO FIVE YEAR FORECAST All school districts in Ohio are required to file
The property tax is the predominant method communities use to raise additional revenues in Ohio. The property tax comes in two forms:
 INTRODUCTION The cost to educate young people across the state is significant and those costs continue to rise. More Ohio tax dollars are spent for primary and secondary education than for any other single
Copley-Fairlawn City Schools, Summit County Five Year Forecast Assumptions October, 2011
 Copley-Fairlawn City Schools, Summit County Five Year Forecast Assumptions October, 2011 The Copley-Fairlawn City School District has achieved Excellent status as measured and reported in the state issued
Utica Community Schools. Financial Report with Supplemental Information Prepared in Accordance with GASB 34 Fiscal Year Ended June 30, 2002
 Financial Report with Supplemental Information Prepared in Accordance with GASB 34 Fiscal Contents Report Letter 1-2 Management s Discussion and Analysis 3-10 Basic Financial Statements District-wide Financial
Northwest Local School District (Hamilton County) 5-Year Forecast Assumptions May 27, 2011
 5-Year Forecast Assumptions May 27, 2011") Northwest Local School District (Hamilton County) 5-Year Forecast Assumptions May 27, 2011 Disclaimers The 5-year forecast for Northwest Local School District (Hamilton County) is derived from the last
Northwest Local School District (Hamilton County) 5-Year Forecast Assumptions May 27, 2011 Disclaimers The 5-year forecast for Northwest Local School District (Hamilton County) is derived from the last
Geneva Area City School District Ashtabula County, Ohio
 Geneva Area City School District, Ohio Basic Financial Statements For Fiscal Year Ended: June 30, 2012 Basic Financial Statements Fiscal Year Ended June 30, 2012 TABLE OF CONTENTS Independent Auditor
Van Buren Public Schools Audited Financial Statements June 30, Prepared by Taylor & Morgan, P.C.
 Van Buren Public Schools Audited Financial Statements June 30, 2017 Prepared by Taylor & Morgan, P.C. 2302 Stonebridge Drive, Bldg. D Flint, MI 48532 810.230.8200 3150 Livernois Road, Suite 150 Troy, MI