First ever quarter with over 200m Gross Profit
|
|
|
- Jeffrey Daniels
- 5 years ago
- Views:
Transcription


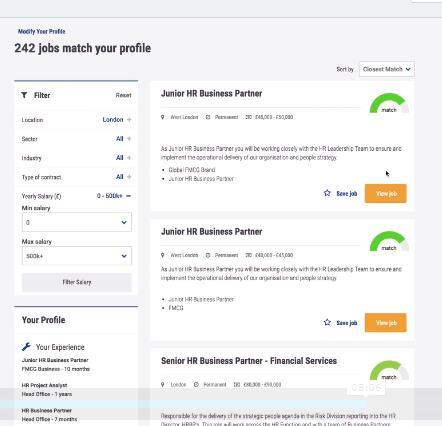
1 11 July 2018 and H Trading Update Steve Ingham Kelvin Stagg Chief Executive Officer Chief Financial Officer First ever quarter with over 200m Gross Profit LSE: PAGE.L Website:
2 Headline Numbers Kelvin Stagg, Chief Financial Officer
3 First ever quarter with over 200m Gross Profit Key financial highlights Gross Profit 208.2m 181.8m 2017 Growth in Constant Currency +16.0% +12.3% 2018 Gross Profit H m 352.0m H Reported Rates +14.5% +10.3% 2018 Michael Page +15.8% +10.8% 2018 Net Cash c. 85m c. 89m 2017 Page Personnel +16.4% Dividend Paid in June +15.9% m 3
4 Financial Review
5 Growth across brands in Perm and Temp Business balance reflects brands and geographic mix 22% 15% 40% 60% 78% 85% Perm Temp Perm Temp Perm Temp Gross Profit growth in permanent +17.6% to 161.5m Temporary +10.7% to 46.7m Perm:Temp ratio 78:22 slightly up on prior year Gross Profit growth in permanent +16.8% to 123.4m Temporary +10.3% to 21.6m Gross Profit growth in permanent +20.1% to 38.1m Temporary +11.1% to 25.1m 5
6 Discipline diversification progress Specialist disciplines continue to deliver record growth 18% 2018 m 2017 m Reported % Constant % Finance Accounting and Financial Services Technical Engineering, Property & Construction, Procurement & Supply Chain Professional Services Legal, Technology, HR, Secretarial, Healthcare % +9.1% % +26.4% % +21.7% Marketing, Sales and Retail % +10.1% Group Total % +16.0% 24% Gross Profit by Discipline 24% 34% Accounting and Financial Services Legal, Technology, HR, Secretarial, Healthcare 25% 25% Engineering, Property & Construction, Procurement & Supply Chain Marketing, Sales and Retail 6
7 Headcount Headline Numbers Financial Review Regional Review Vision & Digital Summary A new record headcount Ratio of fee earners to support staff maintained at a record 78:22 Increase in fee earners of 136 (+2.4%) Fee earner headcount added in our Large, High Potential markets, as well as where we saw strongest growth Fee earner headcount additions spread throughout the Group except UK -16 (-1.6%) Marginal increase in support staff of 10 (+0.6%) Joiners ratio of fee earner to operational support staff was 93:7 8,000 7,000 6,000 5,000 4,000 3,000 2, % 5,680 5,816 1, ,631 1, Support Staff Fee Earners 7
8 Gross Profit ( m) as reported Fee Earners Headline Numbers Financial Review Regional Review Vision & Digital Summary Record fee earners, record gross profit Investment reflects confidence in growth markets Constant currency 8
9 Regional Review Steve Ingham, Chief Executive Officer
10 Highest quarterly growth rate for 7 years 20 countries achieved YoY growth of over 20% A record quarter for our Large, High Potential markets +24% Americas fastest growing region, record quarters in North and Latin America 15% 2018 m 2017 m Reported % Constant % EMEA % +18.6% 17% Gross Profit by Geography 48% Asia Pacific % +18.4% UK % -1.9% 20% Americas % +29.2% Group Total % +16.0% 25% EMEA 25% Asia Pacific UK Americas 10
11 EMEA saw strong market conditions Gross profit records in France, Germany and 5 other countries Michael Page (56% of EMEA) +21%, Page Personnel (44%) +16% France, second largest country in the Group +15% Germany +25%, Michael Page Interim +38% Benelux +24%, with strong growth in Belgium and the Netherlands Record quarter for Southern Europe +15% Middle East & Africa +30% Benelux 15% Other 15% Gross Profit by Geography France 33% m Period Gross Profit Reported % Constant % % +18.6% H % +18.5% Germany 15% S. Europe 22% Headcount 3,175 2, % 48% of Group 11
12 Asia Pacific continues strong growth 8 countries achieved YoY growth of over 10% Greater China, our third largest market and 9% of the Group, a record quarter +18% South-East Asia, strong performance +18% including Singapore +25%; opened in Vietnam Japan 14% India +27%, with over 100 fee earners; Japan +35% Australia +10%, following fee earner investment and new Canberra office SE Asia & India 18% Gross Profit by Geography Greater China 43% m Period Gross Profit Reported % Constant % % +18.4% H % +16.3% Australasia 25% Headcount 1,660 1, % 20% of Group 12
13 UK remained challenging Although positive growth in Page Personnel Brexit continued to weigh on market sentiment Page Personnel +5% Midlands 18% Michael Page -4% Midlands was strongest performing region London 34% South 24% Gross Profit by Geography m Period Gross Profit Reported % % H % North 24% Headcount 1,395 1, % 17% of Group 13
14 Americas was our fastest growing region All countries achieved growth of over 20% Record quarters for US +27% and Canada +30% Particularly strong growth in US excluding New York +38% Latin America +32%; Mexico +25%, Brazil +23% Rest of Latam 17% Other four countries in Latin America +46% Canada 6% Mexico 13% Gross Profit by Geography USA 51% m Period Gross Profit Reported % Constant % % +29.2% H % +24.9% Brazil 13% Headcount 1,227 1, % 15% of Group 14
15 Page Vision & Digital Steve Ingham, Chief Executive Officer
16 Progressing towards Page Vision Aiming for fee earner to operational support staff ratio of 82:18 Gross Profit Total Headcount Vision 1bn Vision 10,000 Last 12 months* 756m HY 18 7,457 Prior 12 months** 674m , m ,549 * Period H to H ** Period H to H


17 Connected Customer Experience ACQUIRE ENGAGE NURTURE Platform 17


18 Continuing a personalised journey On-site Job Matching technology Relevant content 18
19 Summary
20 A record Gross Profit performance Highest growth rate for 7 years First ever quarter with over 200m Gross Profit Gross Profit +16.0% in constant currency Continued investment in Large, High Potential markets Record fee earner headcount Strong net cash position of c. 85m Expect Operating Profit to be slightly ahead of Consensus 20
21 Appendix
22 A growing international business Delivering on our global diversification strategy Gross Profit 24% 17% 39% 61% 76% 83% FY 2007 FY UK International 22
23 Significant variations in recruitment mix Geography Brands 29% 29% 11% 9% 15% 40% 71% 71% 89% 91% 85% 60% EMEA UK Asia Pacific Americas Michael Page Page Personnel Temp Perm 23
24 INTERNATIONAL GROWTH Fee Earner Headcount Headline Numbers Financial Review Regional Review Vision & Digital Summary Notable fee earner and international growth 7,000 EMEA ASIA PACIFIC UK AMERICAS 6,000 5,497 5,816 5,000 4,000 3,000 2,000 1,000 1,657 1,657 1,708 2,075 1,466 1,444 1,174 2,763 3,837 3,654 2,515 4,711 4,484 4,278 3,797 3,624 3,810 3, EMEA APAC Americas UK France (1986) Netherlands (1987) Germany (1993) Spain (1997) Italy (1997) Portugal (2000) Switzerland (2001) Belgium (2002) Sweden (2002) Poland S Africa Austria Ireland Turkey UAE Luxembourg Morocco EMEA Australia (1985) Hong Kong (1995) Singapore (1996) Japan (2001) China (2003) New Zealand India Malaysia Taiwan Indonesia Thailand Vietnam ASIA PACIFIC USA (1998) Brazil (2000) Canada Mexico Argentina Chile Colombia Peru AMERICAS 24
25 Headcount Headline Numbers Financial Review Regional Review Vision & Digital Summary Fee earner investment and support staff H1 H2 H1 H2 H1 H2 H1 H2 H1 H2 H1 H2 H1 H2 H1 H2 H1 H2 H1 H2 H1 H2 H1 H2 H1 H2 H1 H2 H1 H2 H Fee Earner Support Staff 25
26 Year-on-Year Gross Profit Rates EMEA +10.3% +13.6% +10.4% +12.4% +14.8% +13.2% +12.6% +19.3% +18.2% +18.6% Asia Pacific -2.0% -3.3% -4.7% +1.7% +3.9% +6.8% +13.9% +14.9% +13.8% +18.4% Asia -1.5% -6.9% -7.9% -0.5% +3.6% +10.2% +21.9% +20.8% +17.8% +21.2% Australasia -3.0% +6.6% +3.9% +8.1% +4.7% -1.5% -4.4% +0.7% +4.3% +10.6% UK +0.0% -2.3% -4.7% -6.7% -0.1% -4.5% -7.6% -2.8% -7.1% -1.9% Americas -0.6% -1.1% -2.0% +0.9% +15.2% +13.8% +18.4% +18.8% +20.4% +29.2% North America +9.2% -1.9% -10.8% -8.4% +12.5% +14.6% +26.5% +18.7% +16.4% +27.0% Latin America -9.8% -0.1% +9.6% +14.3% +19.2% +12.8% +9.1% +19.0% +25.7% +32.2% Group Total +3.6% +3.7% +1.3% +3.8% +9.1% +7.7% +8.8% +13.8% +12.3% +16.0% 26
27 Contacts and Calendar Contacts Date Event Jeremy Tatham Group Financial Controller Tel: +44 (0) August 2018 HY 2018 Results 10 October Trading Update investorrelations@michaelpage.com Web: 27
28 Disclaimer This presentation contains certain statements that are neither reported financial results nor other historical information. The information contained in this presentation is not audited, is for personal use and informational purposes only and is not intended for distribution to, or use by, any person or entity in any jurisdiction in any country where such distribution or use would be contrary to law or regulation, or which would subject any member of the PageGroup plc group of companies to any registration requirement. No representation or warranty, express or implied, is or will be made in relation to the accuracy, fairness or completeness of the information or opinions made in this presentation. Certain statements included or incorporated by reference within this presentation may constitute forward-looking statements that are based on current expectations or beliefs, as well as assumptions about future events. There are risk factors that can cause actual results to differ materially from those expressed in or implied by such statements. Accordingly, no assurance can be given that any particular expectation will be met and reliance should not be placed on any forward-looking statement. PageGroup plc disclaims any intention or obligation to revise or update any forward-looking statements that may be made in this presentation, regardless of whether those statements are affected as a result of new information, future events or otherwise. Nothing in this presentation should be construed as a profit forecast. This presentation does not constitute or form part of any offer or invitation to sell, or any solicitation of any offer to purchase any shares in PageGroup plc, nor shall it or any part of it or the fact of its distribution form the basis of, or be relied on in connection with, any contract or commitment or investment decision relating thereto, nor does it constitute a recommendation regarding the shares of PageGroup plc. Past performance cannot be relied upon as a guide to future performance. Liability arising from anything in this presentation shall be governed by English Law. Nothing in this presentation shall exclude any liability under applicable laws that cannot be excluded in accordance with such laws. 28
Another quarter of double digit growth
 11 April 2018 2018 Trading Update Steve Ingham Kelvin Stagg Chief Executive Officer Chief Financial Officer Another quarter of double digit growth LSE: PAGE.L Website: http://www.page.com/investors Headline
First Quarter Interim Management Statement. 11 April 2011
 First Quarter Interim Management Statement 11 April 211 Michael Page International First Quarter Interim Management Statement 2 Group Gross profit +29% with growth in every geography Growth Rates Group
SECOND QUARTER AND FIRST HALF 2018 TRADING UPDATE Q2 Gross profit growth of 16.0%
 11 July 2018 Q2 Highlights* SECOND QUARTER AND FIRST HALF 2018 TRADING UPDATE Q2 Gross profit growth of 16.0% Strong growth of 16.0% (14.5% in reported rates); a record quarterly gross profit of 208.2m
FOURTH QUARTER AND FULL YEAR 2017 TRADING UPDATE
 10 January 2018 FOURTH QUARTER AND FULL YEAR 2017 TRADING UPDATE Q4 Highlights* Group gross profit +13.8% (+11.7% in reported rates) up from +8.8% in Q3, a record quarter EMEA +19.3%: France +28%; Germany
FOURTH QUARTER AND FULL YEAR 2018 TRADING UPDATE A record Quarter and Year for the Group
 14 January 2019 FOURTH QUARTER AND FULL YEAR 2018 TRADING UPDATE A record Quarter and Year for the Group Q4 Highlights* Group gross profit growth of +15.4% (+15.8% in reported rates), against a tough comparator
Second Quarter Trading Update 9 July 2010
 Second Quarter Trading Update 9 July 2010 Michael Page International Second Quarter Trading Update 2010 2 Group gross profit Constant Group gross profit m m Reported exchange 2010 vs 2009 111.5 83.8 +33.1%
11 January 2017 FOURTH QUARTER AND FULL YEAR 2016 TRADING UPDATE Q4 Gross profit growth of 3.8%* and 3.0%* for the full year
 11 January 2017 FOURTH QUARTER AND FULL YEAR 2016 TRADING UPDATE Q4 Gross profit growth of 3.8%* and 3.0%* for the full year Q4 Highlights* Group gross profit +3.8% (+20.3% in reported) to 163.4m, a record
SECOND QUARTER AND FIRST HALF 2014 TRADING UPDATE. Growth in all regions in constant currencies
 15 July 2014 SECOND QUARTER AND FIRST HALF 2014 TRADING UPDATE Highlights* Growth in all regions in constant currencies Q2 Group gross profit growth of 8.9% to 137.2m All four regions delivered year-on-year
2012 Results March PageGroup 2012 results 1
 2012 Results March 2013 PageGroup 2012 results 1 PageGroup 2012 results 2 Agenda Financial Review Segmental Analysis Strategy Summary Appendices Financial Review PageGroup 2012 results 3 PageGroup 2012
INTERIM MANAGEMENT STATEMENT QUARTER ENDED 31 MARCH April 2013
 - INTERIM MANAGEMENT STATEMENT QUARTER ENDED 31 MARCH 2013 11 April 2013 Financial summary Growth in net fees for the quarter ended 31 March 2013 (Q3 FY13) (versus the same period last year) Growth Actual
INTERIM MANAGEMENT STATEMENT QUARTER ENDED 31 MARCH 2012
 INTERIM MANAGEMENT STATEMENT QUARTER ENDED 31 MARCH 2012 12 April 2012 Financial summary Growth in net fees for the quarter ended 31 March 2012 (Q3) (versus the same period last year) Actual Growth LFL*
QUARTERLY UPDATE FOR THE THREE MONTHS ENDED 31 MARCH 2017
 QUARTERLY UPDATE FOR THE THREE MONTHS ENDED 31 MARCH 2017 13 April 2017 Financial summary Growth in net fees for the quarter ended 31 March 2017 (Q3 FY17) (versus the same period last year) Growth Actual
INTERIM MANAGEMENT STATEMENT QUARTER ENDED 30 SEPTEMBER 2011
 INTERIM MANAGEMENT STATEMENT QUARTER ENDED 30 SEPTEMBER 2011 6 October 2011 Financial summary Growth in net fees for the quarter ended 30 September 2011 (Q1) (versus the same period last year) actual growth
INTERIM MANAGEMENT STATEMENT QUARTER ENDED 31 MARCH April 2015
 - INTERIM MANAGEMENT STATEMENT QUARTER ENDED 31 MARCH 2015 10 April 2015 Financial summary Growth in net fees for the quarter ended 31 March 2015 (Q3 FY15) (versus the same period last year) Growth Actual
INTERIM MANAGEMENT STATEMENT QUARTER ENDED 30 SEPTEMBER 2010
 INTERIM MANAGEMENT STATEMENT QUARTER ENDED 30 SEPTEMBER 2010 7 October 2010 Financial summary Growth in net fees for the quarter ended 30 September 2010 (Q1) (versus the same period last year) actual growth
QUARTERLY UPDATE FOR THE THREE MONTHS ENDED 30 JUNE 2018
 QUARTERLY UPDATE FOR THE THREE MONTHS ENDED 30 JUNE 2018 13 July 2018 Financial summary Growth in net fees for the quarter ended 30 June 2018 (Q4 FY18) (versus the same period last year) Growth Actual
QUARTERLY UPDATE FOR THE THREE MONTHS ENDED 31 MARCH 2018
 QUARTERLY UPDATE FOR THE THREE MONTHS ENDED 31 MARCH 2018 12 April 2018 Financial summary Growth in net fees for the quarter ended 31 March 2018 (Q3 FY18) (versus the same period last year) Growth Actual
Global Business Barometer April 2008
 Global Business Barometer April 2008 The Global Business Barometer is a quarterly business-confidence index, conducted for The Economist by the Economist Intelligence Unit What are your expectations of
FTSE Global Equity Index Series
 Methodology overview FTSE Global Equity Index Series Built for the demands of global investors Indexes for a global market The FTSE Global Equity Index Series (FTSE GEIS) includes objective, rules-based
COUNTRY COST INDEX JUNE 2013
 COUNTRY COST INDEX JUNE 2013 June 2013 Kissell Research Group, LLC 1010 Northern Blvd., Suite 208 Great Neck, NY 11021 www.kissellresearch.com Kissell Research Group Country Cost Index - June 2013 2 Executive
QUARTERLY UPDATE FOR THE THREE MONTHS ENDED 31 DECEMBER 2017
 QUARTERLY UPDATE FOR THE THREE MONTHS ENDED 31 DECEMBER 2017 11 January 2018 Financial summary Growth in net fees for the quarter ended 31 December 2017 (Q2 FY18) (versus the same period last year) Growth
HALF YEAR RESULTS Robert Walters plc 26 July 2018
 HALF YEAR RESULTS Robert Walters plc 26 July 2018 # AUSTRALIA BELGIUM BRAZIL CANADA CHINA FRANCE GERMANY HONG KONG INDIA INDONESIA IRELAND JAPAN LUXEMBOURG MALAYSIA NETHERLANDS NEW ZEALAND PHILIPPINES
QUARTERLY UPDATE FOR THE THREE MONTHS ENDED 30 SEPTEMBER 2018
 QUARTERLY UPDATE FOR THE THREE MONTHS ENDED 30 SEPTEMBER 2018 11 October 2018 Financial summary Growth in net fees for the quarter ended 30 September 2018 (Q1 FY19) (versus the same period last year) Growth
!!!1!!!!!!!!!!!!!!!!!!!!!!!!!!!!! The Association of Real Estate Funds & Property Funds Research
 1 The Association of Real Estate Funds & Property Funds Research Global Real Estate Funds Review H1 216 Contents CONTENTS 2 EXECUTIVE SUMMARY 3 UNLISTED FUND UNIVERSE: OVERVIEW (EX FOF) 6 UNLISTED FUNDS
EQUITY REPORTING & WITHHOLDING. Updated May 2016
 EQUITY REPORTING & WITHHOLDING Updated May 2016 When you exercise stock options or have RSUs lapse, there may be tax implications in any country in which you worked for P&G during the period from the
Global Select International Select International Select Hedged Emerging Market Select
 International Exchange Traded Fund (ETF) Managed Strategies ETFs provide investors a liquid, transparent, and low-cost avenue to equities around the world. Our research has shown that individual country
Global Consumer Confidence
 Global Consumer Confidence The Conference Board Global Consumer Confidence Survey is conducted in collaboration with Nielsen 4TH QUARTER 2017 RESULTS CONTENTS Global Highlights Asia-Pacific Africa and
HALF-YEAR RESULTS Robert Walters plc 26 July 2017
 HALF-YEAR RESULTS Robert Walters plc STRATEGY & GROUP HIGHLIGHTS Robert Walters, Chief Executive Officer AGENDA FINANCIAL REVIEW Alan Bannatyne, Chief Financial Officer OPERATIONS REVIEW Giles Daubeney,
HALF-YEARLY FINANCIAL RESULTS 2017 ROBERT WALTERS PLC
 HALF-YEARLY FINANCIAL RESULTS ROBERT WALTERS PLC SPECIALISTS IN RECRUITMENT Robert Walters is a market-leading specialist professional recruitment group spanning 28 countries. Our specialist solutions
Financial wealth of private households worldwide
 Economic Research Financial wealth of private households worldwide Munich, October 217 Recovery in turbulent times Assets and liabilities of private households worldwide in EUR trillion and annualrate
All-Country Equity Allocator February 2018
 Leila Heckman, Ph.D. lheckman@dcmadvisors.com 917-386-6261 John Mullin, Ph.D. jmullin@dcmadvisors.com 917-386-6262 Charles Waters cwaters@dcmadvisors.com 917-386-6264 All-Country Equity Allocator February
Guide to Treatment of Withholding Tax Rates. January 2018
 Guide to Treatment of Withholding Tax Rates Contents 1. Introduction 1 1.1. Aims of the Guide 1 1.2. Withholding Tax Definition 1 1.3. Double Taxation Treaties 1 1.4. Information Sources 1 1.5. Guide Upkeep
HALF-YEARLY FINANCIAL RESULTS 2018 ROBERT WALTERS PLC
 HALF-YEARLY FINANCIAL RESULTS ROBERT WALTERS PLC INTRODUCTION PEOPLE ARE THE MOST IMPORTANT COMPONENTS OF OUR BUSINESS. FROM THE JOB SEEKER, TO THE HIRING MANAGER, TO THOSE WHO BRING THEM TOGETHER. SO
STOXX EMERGING MARKETS INDICES. UNDERSTANDA RULES-BA EMERGING MARK TRANSPARENT SIMPLE
 STOXX Limited STOXX EMERGING MARKETS INDICES. EMERGING MARK RULES-BA TRANSPARENT UNDERSTANDA SIMPLE MARKET CLASSIF INTRODUCTION. Many investors are seeking to embrace emerging market investments, because
Performance Derby: MSCI Regions & Countries STRG, STEG, & LTEG
 Performance Derby: MSCI Regions & Countries STRG, STEG, & LTEG February 7, 2018 Dr. Ed Yardeni 516-972-7683 eyardeni@yardeni.com Joe Abbott 732-497-5306 jabbott@yardeni.com Please visit our sites at blog.yardeni.com
San Francisco Retiree Health Care Trust Fund Education Materials on Public Equity
 M E K E T A I N V E S T M E N T G R O U P 5796 ARMADA DRIVE SUITE 110 CARLSBAD CA 92008 760 795 3450 fax 760 795 3445 www.meketagroup.com The Global Equity Opportunity Set MSCI All Country World 1 Index
FTSE Global All Cap Index
 FTSE Russell Factsheet FTSE Global All Cap Index bmktitle1 The FTSE Global All Cap Index is a market-capitalisation weighted index representing the performance of the large, mid and small cap stocks globally.
2017 Global Trends in Investor Relations
 0 2017 Global Trends in Investor Relations Primacy of Geopolitical Risk Geopolitical risk is still the number one concern for companies globally. Concern is increasing regarding the impact of emerging
2013 Global Survey of Accounting Assumptions. for Defined Benefit Plans. Executive Summary
 2013 Global Survey of Accounting Assumptions for Defined Benefit Plans Executive Summary Executive Summary In broad terms, accounting standards aim to enable employers to approximate the cost of an employee
FTSE Global All Cap Index
 FTSE Russell Factsheet FTSE Global All Cap Index bmktitle1 The FTSE Global All Cap Index is a market-capitalisation weighted index representing the performance of the large, mid and small cap stocks globally.
All-Country Equity Allocator July 2018
 Leila Heckman, Ph.D. lheckman@dcmadvisors.com 917-386-6261 John Mullin, Ph.D. jmullin@dcmadvisors.com 917-386-6262 Allison Hay ahay@dcmadvisors.com 917-386-6264 All-Country Equity Allocator July 2018 A
Reporting practices for domestic and total debt securities
 Last updated: 27 November 2017 Reporting practices for domestic and total debt securities While the BIS debt securities statistics are in principle harmonised with the recommendations in the Handbook on
FTSE Annual Country Classification Review Published: 26 September 2018
 FTSE Classification of Markets FTSE Annual Country Classification Review Published: 26 September 2018 Headlines China A to be assigned Secondary Emerging market status commencing June 2019 Iceland to be
FTSE Global Small Cap Index
 FTSE Russell Factsheet FTSE Global Small Cap Index bmktitle1 The FTSE Global Small Cap Index is derived from FTSE's flagship Global Equity Series universe, which comprises around 7,000 securities worldwide,
2015 MERCER BENEFITS ANALYSIS REVIEW
 2015 MERCER BENEFITS ANALYSIS REVIEW Definitions Top Management (Top Mgt) Management (Mgt) Professionals (Prof) Staff (Staff) Employees with roles such as Head of rganization, Function Heads. Typical Career
World s Best Investment Bank Awards 2018
 Global Finance will publish its selections for the 19th Annual World s Best Investment Banks in the April 2018 issue. Winners will be honored at an awards ceremony in New York City in March, and all award
2018 Edelman Trust Barometer
 2018 Edelman Trust Barometer Snapshot Australia #TrustBarometer Trust Index A World of Distrust Average trust in institutions, general population, 2017 vs. 2018 Global Trust Index remains at distruster
FTSE All-World High Dividend Yield
 FTSE Russell Factsheet High Dividend Index Data as at: 31 August 2018 bmktitle1 The High Dividend Index comprises stocks that are characterized by higherthan-average dividend yields, and is based on the
FTSE Environmental Opportunities Index Series
 FTSE Russell Factsheet Opportunities Index Series Data as at: 29 June 2018 bmktitle1 The Opportunities Index Series measures the performance of global companies that have significant involvement in environmental
DFA Global Equity Portfolio (Class F) Quarterly Performance Report Q2 2014
 Quarterly Performance Report Q2 2014") DFA Global Equity Portfolio (Class F) Quarterly Performance Report Q2 2014 This presentation has been prepared by Dimensional Fund Advisors Canada ULC ( DFA Canada ), manager of the Dimensional Funds.
DFA Global Equity Portfolio (Class F) Quarterly Performance Report Q2 2014 This presentation has been prepared by Dimensional Fund Advisors Canada ULC ( DFA Canada ), manager of the Dimensional Funds.
The Capital Requirements (Country-by-Country Reporting) Regulations December 2017
 Regulations December 2017") HSBC Holdings plc The Capital Requirements (Country-by-Country Reporting) Regulations 2013 31 December 2017 This report has been prepared for HSBC Holdings plc and its subsidiaries (the HSBC Group ) to
HSBC Holdings plc The Capital Requirements (Country-by-Country Reporting) Regulations 2013 31 December 2017 This report has been prepared for HSBC Holdings plc and its subsidiaries (the HSBC Group ) to
WHY UHY? The network for doing business
 The network for doing business the network for doing business UHY has over 6,800 professionals to choose from trusted advisors and consultants operating in more than 250 business centres, based in 81 countries
Corrigendum. OECD Pensions Outlook 2012 DOI: ISBN (print) ISBN (PDF) OECD 2012
 ISBN (PDF) OECD 2012") OECD Pensions Outlook 2012 DOI: http://dx.doi.org/9789264169401-en ISBN 978-92-64-16939-5 (print) ISBN 978-92-64-16940-1 (PDF) OECD 2012 Corrigendum Page 21: Figure 1.1. Average annual real net investment
OECD Pensions Outlook 2012 DOI: http://dx.doi.org/9789264169401-en ISBN 978-92-64-16939-5 (print) ISBN 978-92-64-16940-1 (PDF) OECD 2012 Corrigendum Page 21: Figure 1.1. Average annual real net investment
FOREIGN ACTIVITY REPORT
 FOREIGN ACTIVITY REPORT SECOND QUARTER 2012 TABLE OF CONTENTS Table of Contents... i All Securities Transactions... 2 Highlights... 2 U.S. Transactions in Foreign Securities... 2 Foreign Transactions in
DFA Global Equity Portfolio (Class F) Performance Report Q2 2017
 Performance Report Q2 2017") DFA Global Equity Portfolio (Class F) Performance Report Q2 2017 This presentation has been prepared by Dimensional Fund Advisors Canada ULC ( DFA Canada ), manager of the Dimensional Funds. This presentation
DFA Global Equity Portfolio (Class F) Performance Report Q2 2017 This presentation has been prepared by Dimensional Fund Advisors Canada ULC ( DFA Canada ), manager of the Dimensional Funds. This presentation
DFA Global Equity Portfolio (Class F) Performance Report Q3 2018
 Performance Report Q3 2018") DFA Global Equity Portfolio (Class F) Performance Report Q3 2018 This presentation has been prepared by Dimensional Fund Advisors Canada ULC ( DFA Canada ), manager of the Dimensional Funds. This presentation
DFA Global Equity Portfolio (Class F) Performance Report Q3 2018 This presentation has been prepared by Dimensional Fund Advisors Canada ULC ( DFA Canada ), manager of the Dimensional Funds. This presentation
DFA Global Equity Portfolio (Class F) Performance Report Q4 2017
 Performance Report Q4 2017") DFA Global Equity Portfolio (Class F) Performance Report Q4 2017 This presentation has been prepared by Dimensional Fund Advisors Canada ULC ( DFA Canada ), manager of the Dimensional Funds. This presentation
DFA Global Equity Portfolio (Class F) Performance Report Q4 2017 This presentation has been prepared by Dimensional Fund Advisors Canada ULC ( DFA Canada ), manager of the Dimensional Funds. This presentation
Balanced Plus Select Portfolio Pn
 Factsheet as at : August 25, 2018 Balanced Plus Select Portfolio Pn Fund objective This portfolio aims to provide long-term capital growth while keeping risk in a target volatility range of 10-12% over
Best Treasury & Cash Management Providers 2017
 Page 1 of 5 In March 2017, Global Finance will publish its selections for the Seventeenth Annual World s Best Treasury & Cash Management Providers. Global Finance will select the best overall global cash
FTSE All-World ex Fossil Fuels Index Series
 FTSE Russell Factsheet FTSE All-World ex Fossil Fuels Index Series Data as at: 31 August 2018 bmktitle1 Market participants are increasingly looking to manage carbon exposure in their investments, and
DFA Global Equity Portfolio (Class F) Performance Report Q3 2015
 Performance Report Q3 2015") DFA Global Equity Portfolio (Class F) Performance Report Q3 2015 This presentation has been prepared by Dimensional Fund Advisors Canada ULC ( DFA Canada ), manager of the Dimensional Funds. This presentation
DFA Global Equity Portfolio (Class F) Performance Report Q3 2015 This presentation has been prepared by Dimensional Fund Advisors Canada ULC ( DFA Canada ), manager of the Dimensional Funds. This presentation
Quarterly Investment Update First Quarter 2017
 Quarterly Investment Update First Quarter 2017 Market Update: A Quarter in Review March 31, 2017 CANADIAN STOCKS INTERNATIONAL STOCKS Large Cap Small Cap Growth Value Large Cap Small Cap Growth Value Emerging
Quarterly Investment Update First Quarter 2018
 Quarterly Investment Update First Quarter 2018 Dimensional Fund Advisors Canada ULC ( DFA Canada ) is not affiliated with [insert name of Advisor]. DFA Canada is a separate and distinct company. Market
FTSE All-World ex Fossil Fuels Index Series
 FTSE Russell Factsheet FTSE All-World ex Fossil Fuels Index Series Data as at: 31 October 2018 bmktitle1 Market participants are increasingly looking to manage carbon exposure in their investments, and
NORTH AMERICAN UPDATE
 NORTH AMERICAN UPDATE December 6 th, 2018 INNOVATION INSIGHT GROWTH SINCE 1968 TOUGH YEAR FOR RETURNS AROUND THE WORLD Index Year-to-date Performance MSCI World -1.2% MSCI USA 3.9% MSCI Canada -3.9% MSCI
Compagnie Financière Tradition
 Compagnie Financière Tradition H1 2016 results presentation Zurich 1 September 2016 First semester activity in a stabilising market environment Results overview H1 2016 Performance Differentiation in revenue
Full Year Results for the Year Ended 31 December 2015
 10 March 2016 Full Year Results for the Year Ended 31 December 2015 Michael Page International plc ( PageGroup ), the specialist professional recruitment company, announces its full year results for the
IMPORTANT TAX INFORMATION
 00126803 IMPORTANT TAX INFORMATION Dear Hartford Funds Shareholder: The following information about your enclosed 1099-DIV from Hartford Funds should be used when preparing your 2014 tax return. The information
DIVERSIFICATION. Diversification
 Diversification Helps you capture what global markets offer Reduces risks that have no expected return May prevent you from missing opportunity Smooths out some of the bumps Helps take the guesswork out
HARVEY NASH GROUP PLC. Albert Ellis, CEO Mark Garratt, CFO. results ahead of expectations increased dividend strong platform to accelerate growth
 HARVEY NASH GROUP PLC Albert Ellis, CEO Mark Garratt, CFO results ahead of expectations increased dividend strong platform to accelerate growth HIGHLIGHTS Results ahead of expectations Strong operating
FY2016 RESULTS. 1 February 2016 to 31 January Inditex continues to roll out its global, fully integrated store and online model.
 FY2016 RESULTS 1 February 2016 to 31 January 2017 Inditex continues to roll out its global, fully integrated store and online model. Strong operating performance: Net sales for FY2016 reached 23.3 billion,
Corporate Governance and Investment Performance: An International Comparison. B. Burçin Yurtoglu University of Vienna Department of Economics
 Corporate Governance and Investment Performance: An International Comparison B. Burçin Yurtoglu University of Vienna Department of Economics 1 Joint Research with Klaus Gugler and Dennis Mueller http://homepage.univie.ac.at/besim.yurtoglu/unece/unece.htm
FTSE Global Equity Index Series
 FTSE Global Equity Index Series THE FTSE GLOBAL EQUITY INDEX SERIES With an unparalleled record of flexibility, transparency, consistent accuracy and the ability to meet any mandate, FTSE indices are already
FTSE All-World ex Coal Index Series
 FTSE Russell Factsheet FTSE All-World ex Coal Index Series Data as at: 29 March 2019 bmktitle1 Market participants are increasingly looking to manage carbon exposure in their investments, and reduce write-off
Exchange Traded Funds (ETFs): The New Packaged Product of Choice
: The New Packaged Product of Choice") Financial Institutions Profiles Series Exchange Traded Funds (ETFs): The New Packaged Product of Choice (Table of Contents) April 20, 2017 TABLE OF CONTENTS Evolution of the Exchange Traded Funds (ETFs)
Financial Institutions Profiles Series Exchange Traded Funds (ETFs): The New Packaged Product of Choice (Table of Contents) April 20, 2017 TABLE OF CONTENTS Evolution of the Exchange Traded Funds (ETFs)
Global solutions. Local expertise.
 Global solutions. Local expertise. Count on Sedgwick around the world Sedgwick is a leading global provider of technology-enabled risk, benefits and integrated business solutions. Our 21,000 colleagues,
Manpower Employment Outlook Survey Global
 Manpower Employment Outlook Survey Global 3 216 Global Employment Outlook ManpowerGroup interviewed nearly 59, employers across 43 countries and territories to forecast labor market activity in Quarter
ManpowerGroup Employment Outlook Survey Global
 ManpowerGroup Employment Outlook Survey Global 1 218 ManpowerGroup interviewed nearly 59, employers across 43 countries and territories to forecast labor market activity in Quarter 1 218. All participants
Invesco Indexing Investable Universe Methodology October 2017
 Invesco Indexing Investable Universe Methodology October 2017 1 Invesco Indexing Investable Universe Methodology Table of Contents Introduction 3 General Approach 3 Country Selection 4 Region Classification
FTSE All-World GDP Weighted
 FTSE Russell Factsheet FTSE All-World GDP Weighted Indices Data as at: 31 August 2018 bmktitle1 The FTSE GDP Weighted Index Series is designed to reflect the performance of constituent companies in an
Global Economic Briefing: Global Liquidity
 Global Economic Briefing: Global Liquidity December 21, 217 Dr. Edward Yardeni 516-972-7683 eyardeni@ Debbie Johnson 48-664-1333 djohnson@ Mali Quintana 48-664-1333 aquintana@ Please visit our sites at
2009 Half Year Results. August 25, 2009
 1 2009 Half Year Results August 25, 2009 2 Caution statement This presentation may contain forward looking statements, which are subject to risk and uncertainty. A variety of factors could cause our actual
Global Economic Briefing: Global Inflation
 Global Economic Briefing: Global Inflation November, 7 Dr. Edward Yardeni -97-7 eyardeni@ Debbie Johnson -- djohnson@ Mali Quintana -- aquintana@ Please visit our sites at www. blog. thinking outside the
FTSE Global Small Cap
 FTSE Russell Factsheet FTSE Global Small Cap ex US Index Data as at: 31 August 2018 bmktitle1 The FTSE Global Small Cap ex US Index is a market-capitalization weighted index representing the performance
60 Minutes with BT Group
 60 Minutes with BT Group Phil Ainsley, Managing Director, Employee Services, Equiniti Francis O Mahony, Head of Employee Share Plans and Share Registration, BT Group plc Comparing BT s All Employee Share
Balanced Select Portfolio Pn
 Factsheet as at : September 22, 2018 Balanced Select Portfolio Pn Fund objective This portfolio aims to provide long-term capital growth while keeping risk in a target volatility range of 8-10% over a
Global Tax Reset Transfer Pricing Documentation Summary. February 2018
 Global Tax Reset Transfer Pricing Summary February 2018 Global Tax Reset Transfer Pricing Summary Overview The Global Tax Reset Transfer Pricing Summary ( Guide ) compiles essential country-by-country
FTSE All-World GDP Weighted
 FTSE Russell Factsheet FTSE All-World GDP Weighted Indices Data as at: 30 April 2018 bmktitle1 The FTSE GDP Weighted Index Series is designed to reflect the performance of constituent companies in an index
Full Year Results for the Year Ended 31 December 2017
 7 March 2018 Full Year Results for the Year Ended 31 December 2017 PageGroup plc ( PageGroup ), the specialist professional recruitment company, announces its full year results for the year ended 31 December
Important Information
 Important Information CDP is an independent not-for-profit organization that has been requesting information relating to carbon and climate change on behalf of investors since 2002. Thousands of organizations
Overview of Transfer Pricing Regulations. CA Akshay Kenkre
 Overview of Transfer Pricing Regulations CA Akshay Kenkre 1 What is Transfer Pricing What is Transfer Price? A Price at which one person transfers physical goods, services, tangible or/ and intangibles
An FSE Listings Inc Article FSE Listings Inc- Frankfurt Stock Exchange Listings
 FSE Listings How To Prepare Yourself For Listing On The Frankfurt Stock Exchange Author: Mark Bragg An FSE Listings Inc Article FSE Listings Inc- Frankfurt Stock Exchange Listings List your firm fast with
26 MAY Boustead Singapore Limited / Boustead Projects Limited Joint FY2015 Financial Results Presentation
 26 MAY 2015 Boustead Singapore Limited / Boustead Projects Limited Joint FY2015 Financial Results Presentation Disclaimer This presentation contains certain statements that are not statements of historical
2013 Interim Results. 14 August 2013
 2013 Interim Results 14 August 2013 1 This presentation contains statements that are, or may be, forward-looking regarding the group's financial position and results, business strategy, plans and objectives.
Auscap Long Short Australian Equities Fund Newsletter June 2018
 Auscap Long Short Australian Equities Fund Auscap Asset Management Limited Disclaimer: This newsletter contains performance figures and information in relation to the Auscap Long Short Australian Equities
2018 Global Survey of Accounting Assumptions. for Defined Benefit Plans. Executive summary
 2018 Global Survey of Accounting Assumptions for Defined Benefit Plans Executive summary Executive summary In broad terms, accounting standards aim to enable employers to approximate the cost of an employee
Marine. Global Programmes. cunninghamlindsey.com. A Cunningham Lindsey service
 Marine Global Programmes A Cunningham Lindsey service Marine global presence Marine Global Programmes Cunningham Lindsey approach Managing your needs With 160 marine surveyors and claims managers in 36
contents 1 HIGHLIGHTS 2 performance in H business structure 7 Interim management report 19 independent review report
 interim Report 2013 contents 1 HIGHLIGHTS 2 performance in H1 2013 5 business structure for growth 6 positioned for growth 7 Interim management report 19 independent review report 21 financial statements
H S B C H O L D I N G S P L C HSBC HOLDINGS PLC THE CAPITAL REQUIREMENTS. (Country-by-Country Reporting) REGULATION 2013
 REGULATION 2013") HSBC HOLDINGS PLC THE CAPITAL REQUIREMENTS (Country-by-Country Reporting) REGULATION 2013 31 December 2015 This report has been prepared for HSBC Holdings plc and its subsidiaries (the HSBC Group ) to
HSBC HOLDINGS PLC THE CAPITAL REQUIREMENTS (Country-by-Country Reporting) REGULATION 2013 31 December 2015 This report has been prepared for HSBC Holdings plc and its subsidiaries (the HSBC Group ) to
International Statistical Release
 International Statistical Release This release and additional tables of international statistics are available on efama s website (www.efama.org). Worldwide Investment Fund Assets and Flows Trends in the