Comprehensive Annual Financial Report
|
|
|
- William Tucker
- 5 years ago
- Views:
Transcription


1 Comprehensive Annual Financial Report Palm Beach County, Florida Fiscal Year Ended September 30, 2012 Prepared by the Clerk & Comptroller s Office Palm Beach County


2 About the Clerk & Comptroller s Office As the third largest of the 67 Clerk s offices in Florida, the Clerk & Comptroller of Palm Beach County serves a local population of 1.3 million residents. The office performs more than 1,000 different functions and provides services from several locations throughout Palm Beach County and online at More than 170 years ago, the Florida Constitution established the Clerk & Comptroller as an independent public trustee, directly elected by the public to serve four major functions: Sharon R. Bock Clerk & Comptroller Palm Beach County CHIEF FINANCIAL OFFICER, TREASURER & AUDITOR Provides the public with an independent check and balance on Palm Beach County s revenue, debt and spending. Performs unbiased accounting and auditing of funds to ensure every County expense is lawful and serves a public purpose. Invests and earns interest income on County funds to reduce the tax burden on the residents of Palm Beach County. Maintains financial records and produces all required financial statements and reports. CLERK OF THE CIRCUIT COURT Protects the integrity of public records and public funds as an impartial, third-party directly accountable to the citizens. Receives, processes and files all civil and criminal court documents; protects evidence; disburses all court fees, fines and costs; and provides the public with access to court records. The Clerk also manages the County s jury system, issues marriage licenses and provides a Self Service Center for residents who choose to represent themselves in court proceedings. The Clerk also protects the County s most vulnerable citizens through the auditing of Guardianships conducted by its Inspector General division, and a Guardianship Fraud Hotline for citizens to report suspected financial exploitation or mismanagement. COUNTY RECORDER Maintains the Official Records of the County dating back to The Clerk electronically records documents such as mortgages, deeds, liens, judgments and marriage licenses and makes scanned images available online. CLERK OF THE BOARD OF COUNTY COMMISSIONERS Documents and maintains the records and activities of all Palm Beach County Commission meetings and other government meetings; ensures accuracy and accessibility of meeting minutes and is the Clerk to the County s Value Adjustment Board. The Clerk & Comptroller s website at makes many services available online, including court case record searches, Official Record searches, Value Adjustment Board petitions, foreclosure sales, County financial information and County Commission meeting minutes and video. The Clerk & Comptroller has earned the Governor s Sterling Award for Organizational Performance Excellence; an Excellence, Values, Integrity and Ethics Award for Corporate Best Practices Not-for-Profit/Government; and was twice named a finalist for the Best Places to Work Award by the South Florida Business Journal. The office s financial reporting is also regularly recognized for excellence. The Comprehensive Annual Financial Report (CAFR) has earned the Government Finance Officers Association s (GFOA) Certificate of Achievement for Excellence in Financial Reporting for 23 consecutive years. The GFOA has also recognized the CAFR s sister publication, Checks & Balances: Your Guide to County Finances. The user-friendly guide has received the Award for Outstanding Achievement in Popular Annual Financial Reporting every year since its Fiscal Year 2006 debut.
3 COMPREHENSIVE ANNUAL FINANCIAL REPORT FISCAL YEAR ENDED SEPTEMBER 30, 2012 Prepared By SHARON R. BOCK Clerk & Comptroller Palm Beach County Finance Department

4
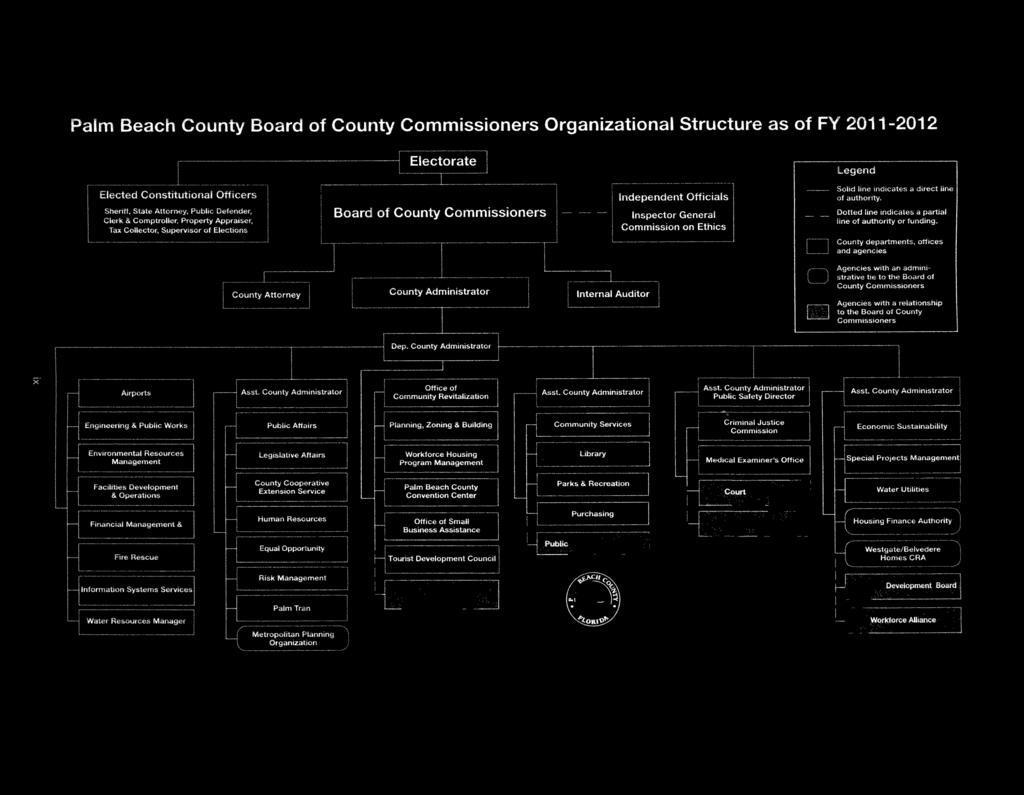
5 COMPREHENSIVE ANNUAL FINANCIAL REPORT Fiscal Year Ended September 30, 2012 TABLE OF CONTENTS PAGE INTRODUCTORY SECTION Transmittal Letter of the Clerk & Comptroller...i Principal Officials... viii Organization Chart...ix Certificate of Achievement for Excellence in Financial Reporting...x FINANCIAL SECTION Report of Independent Certified Public Accountants...xi Management s Discussion and Analysis... xiii Basic Financial Statements Government-wide Financial Statements Statement of Net Assets...2 Statement of Activities...4 Fund Financial Statements Descriptions of Major Funds...7 Balance Sheet - Governmental Funds...8 Reconciliation of the Balance Sheet-Governmental Funds to the Statement of Net Assets - Governmental Activities...10 Statement of Revenues, Expenditures, and Changes in Fund Balances - Governmental Funds...12 Reconciliation of the Statement of Revenues, Expenditures, and Changes in Fund Balances of Governmental Funds to the Statement of Activities - Governmental Activities...14 Statement of Net Assets - Proprietary Funds...16 Statement of Revenues, Expenses, and Changes in Fund Net Assets - Proprietary Funds...20 Statement of Cash Flows - Proprietary Funds...22 Statement of Fiduciary Net Assets - Agency Funds...26 Notes to the Financial Statements...27
6 Required Supplementary Information: Schedules of Revenues, Expenditures, and Changes in Fund Balances - Budget and Actual for General Fund and Major Special Revenue Funds with Annually Appropriated Budgets: - General Fund Fire Rescue Special Revenue Fund Community & Social Development Special Revenue Fund Schedules of Funding Progress - Pension Plans Schedules of Funding Progress Other Post Employment Benefits Combining and Individual Fund Statements and Schedules General Fund by Category Descriptions Combining Balance Sheet - General Fund by Category Combining Schedule of Revenues, Expenditures, and Changes in Fund Balances - General Fund by Category Schedules of Revenues, Expenditures, and Changes in Fund Balances - Budget and Actual: General Fund - BOCC General Fund - Sheriff General Fund - Clerk & Comptroller General Fund - Tax Collector General Fund - Property Appraiser General Fund - Supervisor of Elections Nonmajor Governmental Funds Descriptions Combining Balance Sheet - Nonmajor Governmental Funds Combining Statement of Revenues, Expenditures, and Changes in Fund Balances - Nonmajor Governmental Funds Schedules of Revenues, Expenditures, and Changes in Fund Balances - Budget and Actual: Special Revenue Funds: Tourist Development Law Enforcement Grants County Transportation Trust Municipal Service Taxing District Library Taxing District Affordable Housing (SHIP) Trust Fund Palm Tran Other Special Revenue Fund Debt Service Funds: General Obligation Bonds Revenue Bonds...155
7 Other Financing Capital Projects Funds: Criminal Justice Environmental Lands Fire Rescue Libraries Parks and Recreation Street and Drainage Major Fund - Road Program Major Fund General Government Internal Service Funds Descriptions Combining Statement of Net Assets Combining Statement of Revenues, Expenses, and Changes in Fund Net Assets Combining Statements of Cash Flows Agency Funds Descriptions Combining Statement of Fiduciary Net Assets - Agency Funds Combining Statement of Changes in Assets and Liabilities - All Agency Funds STATISTICAL SECTION Net Assets by Component Changes in Net Assets Fund Balance Governmental Funds Changes in Fund Balance Governmental Funds Tax and Intergovernmental Revenue by Source Actual Value and Assessed Value of Taxable Property Direct and Overlapping Property Tax Rates Principal Property Tax Payers Property Tax Levies and Collections Non-Ad Valorem Revenue Ratios of Outstanding Debt by Type Ratios of Net General Bonded Debt Outstanding Direct and Overlapping Governmental Activities Debt Legal Debt Margin Information Pledged Revenue Coverage Demographic and Economic Statistics Principal Employers County Government Employees by Function/Program Operating Indicators by Function/Program Capital Asset Statistics by Function/Program...214


8


9 Introductory Section The Introductory Section contains the letter of transmittal, which provides an overview of Palm Beach County s finances, economic prospects, and achievements. Also, included in this section is the Certificate of Achievement for Excellence in Financial Reporting awarded by the Government Finance Officers Association. It is the highest form of recognition in governmental financial reporting.
10
 for the fiscal year ended September 30, 2012, is a")
 and the standards applicable to financial audits contained in Government Auditing Standards issued by the Comptroller")
11 March 25, 2013 To the residents of Palm Beach County, Florida and the Honorable Steven L. Abrams, Mayor, and the Members of the Board of County Commissioners: The Palm Beach County, Florida, Comprehensive Annual Financial Report (CAFR) for the fiscal year ended September 30, 2012, is a complete set of financial statements presented in conformity with accounting principles generally accepted in the United States (GAAP) and audited by independent Certified Public Accountants in accordance with auditing standards generally accepted in the United States (GAAS) and the standards applicable to financial audits contained in Government Auditing Standards issued by the Comptroller General of the United States (GAGAS). The CAFR was prepared by the Finance Department of the Clerk & Comptroller of Palm Beach County in accordance with Section and , Florida Statutes. Responsibility for both the accuracy of the data presented, and the completeness and fairness of the presentation, including all disclosures, rests with the Clerk & Comptroller s office. Palm Beach County has established a comprehensive set of internal controls designed to ensure that the County s assets are protected from loss, theft or misuse, and that sufficient reliable accounting information is compiled to allow for financial statement preparation in conformity with GAAP. Since the cost of internal control should not exceed its expected benefit, the County s internal control structure has been designed to provide reasonable, but not absolute, assurance that the financial statements will be free from material misstatement. To the best of our knowledge and belief, this financial report is complete and reliable in all material respects. 301 North Olive Avenue West Palm Beach, FL P.O. Box 229 West Palm Beach, FL Telephone Facsimile In accordance with Sections and , Florida Statutes, the Palm Beach County financial statements were audited by McGladrey LLP, an independent Certified Public Accounting firm. The goal of the independent audit was to provide reasonable assurance that the financial statements of the County for the fiscal year ended September 30, 2012, are free of material misstatements. The independent audit involved examining, on a test basis, evidence supporting the amounts and disclosures in the financial statements; assessing the accounting principles used and significant estimates made by management; and evaluating the overall financial statement presentation. Based on their audit, the independent Certified Public Accountants concluded that there was a reasonable basis for rendering an unqualified opinion stating that the County s financial statements for the fiscal year ended September 30, 2012, were fairly presented in conformity with GAAP. i
12 Management s Discussion and Analysis (MD&A) is a narrative required to accompany the basic financial statements. It provides an objective and easy to read analysis of the County s financial activities based on currently known facts, decisions, or conditions. This letter of transmittal is designed to complement MD&A and should be read in conjunction with it. The MD&A can be found immediately following the independent Certified Public Accountants report. PROFILE OF THE GOVERNMENT Palm Beach County is a political subdivision of the State of Florida governed by the State Constitution and general laws of the State of Florida. The legislative and governing body of the County is the seven-member Board of County Commissioners (BOCC). Each County Commissioner is elected on a district basis for a four-year term of office and each County Commissioner is a resident of their Commission District. The Commission elects a Mayor who serves as presiding officer. The Clerk & Comptroller s office is responsible for safeguarding public records and public funds. The Clerk is independently elected by and accountable to Palm Beach County residents. In addition to the roles of Chief Financial Officer, Treasurer and Auditor for Palm Beach County, the Clerk & Comptroller is the Clerk of the Circuit Court, County Recorder and Clerk of the Board of County Commissioners As a result of a County-wide general election on November 6, 1984, Palm Beach County became a Home Rule Charter County on January 1, 1985, operating under a County Manager form of government with separation of legislative and executive functions. The County Administrator is responsible for the operations of all departments of the County, except for the elected Constitutional Officers, the joint State/County agencies or the staff departments that report directly to the Commission. The County and its independently elected constitutional officers provide a full range of services, including law enforcement, fire protection, conservation and resource management, public improvements, human services, parks, recreation and cultural facilities, planning and zoning, transportation, economic development, property assessment, tax collection, official recordkeeping, court-related support functions, and financial services, including investment of public funds and financial reporting. The County also operates two enterprise activities; the Department of Airports and the Water Utilities Department. The separately elected members of the BOCC and the Constitutional Officers together are the elected officials who are accountable to the residents of Palm Beach County. The officials holding these offices as of September 30, 2012, are identified on the page immediately following this letter. The organizations of the BOCC and the Constitutional Officers together comprise the Palm Beach County primary government. This report covers the Palm Beach County reporting entity which includes the primary government as well as the component units. Component units are legally separate entities for which the primary government is financially accountable. Component units are either classified as blended component units or discretely presented component units depending on the nature of the entity s relationship with the primary government. ii
13 The blended component units are included as a part of the primary government because although they are legally separate entities, in substance they are considered to be a part of the primary government s operations. Palm Tran is a blended component unit. The discretely presented component units are reported in a separate column in the governmentwide financial statements to emphasize that they are legally separate from the primary government. The Housing Finance Authority of Palm Beach County, the Metropolitan Planning Organization, the Westgate/Belvedere Homes Community Redevelopment Agency, and the Solid Waste Authority are reported as discretely presented component units. More information on the financial reporting entity may be obtained in Note 1 of the Notes to the Financial Statements. The County's annual budget is prepared pursuant to Chapter 129, Florida Statutes, and represents the legal authority to levy taxes and expend funds for all County purposes. Florida Statutes also require that the County have a balanced budget. The County has complied with this requirement after inclusion of re-appropriated beginning fund balances, in accordance with the County s budget policy. The Office of Financial Management and Budget (OFMB) initiates the budget process by reviewing revenue and expenditure projections for the coming year. Based on the County Administrator's direction, OFMB prepares and distributes specific instructions to the various department heads and to the elected Constitutional Officers to guide them in the preparation of their budget requests. The County Administrator's tentative budget is prepared by OFMB and presented to the County Commission prior to July 15. The BOCC reviews the budget and makes such changes as it deems necessary. A summary of the tentative budget is advertised and publicly reviewed and revised prior to approval and adoption by the County Commission. For managerial purposes, the Board has delegated its authority to approve intradepartmental transfers to the Director of OFMB. All other amendments to the adopted budget must be approved by Board action at a regularly scheduled Board meeting. LOCAL ECONOMY Located on the southeast coast, Palm Beach County is the largest of Florida s sixty-seven counties. The County s 2,228 square miles include 1,977 square miles of land and 251 square miles of surface water, making it one of the largest counties east of the Mississippi River. The surface water areas include the Intracoastal Waterway and approximately one-third of Lake Okeechobee. Lake Okeechobee is the largest freshwater lake in the state and the largest in the United States except for the Great Lakes. The County has 45 miles of shoreline and is 53 miles wide. Palm Beach County s climate has enhanced its image as a location that provides a high quality of life to its residents. The average temperature is 75 degrees with an average of 82 degrees in the summer and 67 degrees in the winter. The wet season extends from June through October, with an average annual rainfall of 62 inches. There are 38 municipalities within the County encompassing a total of 324 square miles, or approximately 16% of the County s area. An estimated 56% of the County s population resides within the municipalities. iii
14 Tourism Palm Beach County government is making a concentrated and continuing effort to increase the number of visitors to our area each year, which is expected to generate a 3% increase in revenues in fiscal year There are an estimated 61,800 people employed in jobs related to the tourism industry, with tourists contributing $1.45 billion annually to the County s economy. Fiscal year 2012 tourism revenues increased almost 8% from the previous fiscal year. Aerospace - Palm Beach County is particularly strong when it comes to aerospace engineering and manufacturing. Pratt & Whitney is a world leader in the design, manufacture and service of aircraft engines, industrial gas turbines, and space propulsion systems. Sikorsky Aircraft Corporation, a sister company of Pratt & Whitney, manufactures helicopters at its Florida Assembly and Flight Test Operations Center in northern Palm Beach County. Agriculture Palm Beach County agricultural acreage has remained stable for the last four years. Palm Beach County still leads the state of Florida, and all counties east of the Mississippi River, in agricultural proceeds. Currently, Palm Beach County ranks among the top counties in the United States and first in the state of Florida for agricultural sales. Palm Beach County leads the nation in the production of sugarcane, bell peppers and fresh sweet corn. It leads the state in the production of rice, lettuce, radishes, Chinese vegetables, specialty leaf produce, and celery. The 459,865 acres dedicated to agriculture represent 36 percent of the County s total land mass. It ranks third in Florida in nursery production with estimated sales at $279 million, and leads the state in agricultural wages and salary with over $316 million. The industry currently uses bagasse, a sugarcane by-product, in conjunction with other waste wood products as the fuel source for the largest agriculturally based biomass co-generation plant in the United States for electricity generation. Several crops are currently grown as potential sources for ethanol production. Equestrian acreage in western Palm Beach County continues to expand, currently ranking it as the second largest equine county in the state, behind Marion County. Bioscience Scripps Research Institute and the Max Planck Florida Institute are anchors to an eight million square feet Bioscience Cluster in Northern Palm Beach County. A cluster of related bio-technology businesses will form a hub to strengthen the County s position as a leader in this industry. Smaller bio-related companies have either expanded or moved to the County such as Ocean Ridge Biosciences LLC and Sancilio & Company, Inc. Construction During FY 2012, the total volume for permits remained approximately the same as FY The Building Permit fee revenue increased from $11 million to $11.9 million. In residential construction, there were 928 single unit permit starts and 23 multi-family unit permit starts representing 404 units compared to 875 single unit permits and 17 multi-unit permit starts as previously reported for FY Total value for these residential permit starts were $340.3 million, compared to values of $238.1 million seen in FY Many of the multi-family units are affordable housing grant recipients. Overall permitting shows an upward trend, reflective of an increase in property development. iv
15 LONG-TERM FINANCIAL PLANNING The BOCC adopted a millage rate of (excluding debt service) for FY 2012, which is 1.92% below the roll back rate. Balancing the budget was challenging and required difficult funding decisions. This was accomplished by a careful review of County operations and capital project requirements. This year s cuts included $19 million to County Departments and Agencies and $1 million to reserves. A major component of the County Departments cuts/reduced funding (approximately $7 million) was from the reduced FRS pension contribution rate. The majority of this savings is from the new 3% employee contribution. Reducing the levels of service in many programs is necessary to maintain funding for nearly all of the services that the Board has traditionally supplied to County residents and visitors. Funding will be available to keep commitments to employees (union contracts) and to provide adequate supplies, materials and equipment so they can perform their jobs safely and satisfactorily. RELEVANT FINANCIAL POLICIES The County has in place a federally approved overhead distribution system which allocates General Fund Administrative Charges to the various County entities benefitting from such administrative activities. The existence of this system assures qualification for federal reimbursement of administrative costs associated with federal programs. The adopted budget for the General Fund includes unassigned reserves (reserve for balance brought forward and contingency) in an amount which, when combined with the statutory reserve, is between 10% and 15% of net budgeted expenditures and transfers for this fund. The County maintains year-end General Fund unassigned fund balance in an amount which is between 15% and 20% of audited General Fund expenditures and transfers to other funds. To the extent that the year-end audited fund balance falls outside this range, corrective action will be taken over a three-year period to bring the balance into conformity with this policy. MAJOR INITIATIVES On November 2, 2010, 72% of Palm Beach County voters approved a referendum placing the independent Commission on Ethics and Inspector General into the county charter. On May 17, 2011, the original Office of Inspector General Ordinance was repealed and a new ordinance was adopted. Ethics laws already in force for county government have expanded and now cover all 38 municipalities within Palm Beach County. The mission of the Palm Beach County Commission on Ethics is to foster integrity in public services, to promote the public's trust and confidence in that service, and to prevent conflicts between private interests and public duties. The Ethics Commission receives and investigates complaints and is charged with enforcement of the Palm Beach County Code of Ethics, Lobbyist registration and Post Employment Ordinances. The commission also issues advisory opinions to county officials, employees and others subject to its jurisdiction such as county vendors, lobbyists and their employers. The commission is composed of five members appointed by v
16 various civic, educational and professional associations. nonpartisan and nonpolitical. The position of commissioner is The County s Ten-Year Plan to end homelessness outlines the various strategies and timelines to target homelessness and the lack of affordable housing in the County. Significant strides continue to be made in this endeavor. The first Homeless Resource Center the Senator Philip D. Lewis Center opened on July 2, The Center s operating budget is comprised of primarily Ad Valorem funds coupled with federal Community Development Block Grant dollars, grants and donations. An Agreement was signed late in FY 2011 between the BOCC and the Homeless Coalition of Palm Beach County, establishing a working relationship to advocate and educate on behalf for the homeless as well as pursue resources in support of the Ten-Year Plan, focusing on back-door housing affordable long-term permanent housing for those served through the Lewis Center. The County has selected a developer to build a hotel adjacent to the Palm Beach County Convention Center in downtown West Palm Beach. The BOCC recently approved a $27 million public subsidy for the hotel s construction. Estimates are that the project will create more than 1,500 construction and tourism jobs and contribute more than $1 billion to the County economy over 10 years. Construction of the 400- room Hilton Hotel is to commence by May Under the deal, the County will retain ownership of both the hotel and the property it sits on. AWARDS AND ACKNOWLEDGMENTS The Government Finance Officers Association of the United States and Canada (GFOA) awarded a Certificate of Achievement for Excellence in Financial Reporting to Palm Beach County, Florida, for its Comprehensive Annual Financial Report (CAFR) for the fiscal year ended September 30, This was the 23rd consecutive year that the government achieved this prestigious award. In order to be awarded a Certificate of Achievement, a government must publish an easily readable and efficiently organized comprehensive annual financial report. This report must satisfy both accounting principles generally accepted in the United States and applicable legal requirements. A Certificate of Achievement is valid for a period of one year only. We believe that our current Comprehensive Annual Financial Report continues to meet the Certificate of Achievement Program s requirements, and we are submitting it to the GFOA to determine its eligibility for another certificate. The GFOA has also given an Award for Outstanding Achievement in Popular Annual Financial Reporting to Palm Beach County, Florida, for its Popular Annual Financial Report (PAFR) for the fiscal year ended September 30, The Award for Outstanding Achievement in Popular Annual Financial Reporting is a prestigious national award recognizing conformance with the highest standards for preparation of state and local government popular reports. In order to receive an Award for Outstanding Achievement in Popular Annual Financial Reporting, a government unit must publish a Popular Annual Financial Report, whose contents conform to program standards of creativity, presentation, understandability, and reader appeal. An Award for Outstanding Achievement in Popular Annual Financial Reporting is valid for a period of one year only. Palm Beach County has received a Popular Award for the last six consecutive years. vi
17 In addition, Palm Beach County also received the GFOA's Award for Distinguished Budget Presentation for its annual adopted budget for the fiscal year beginning October 1, This was the 26th time that Palm Beach County received this prestigious award. In order to qualify for the Distinguished Budget Presentation Award, the budget document was judged to be proficient in several categories including policy documentation, financial planning and organization. The preparation of this Comprehensive Annual Financial Report on a timely basis was made possible by the dedicated services of the entire Clerk & Comptroller Finance Department with special acknowledgment to the Accounting and Financial Reporting staff. Our appreciation is also extended to the Board of County Commissioners, Constitutional Officers, County Administrator, Office of Financial Management and Budget and their respective staffs, as well as our external auditors McGladrey LLP for making preparation of this report possible. Respectfully submitted, SHARON R. BOCK, Esq. Clerk & Comptroller Palm Beach County, Florida vii
18 PRINCIPAL OFFICIALS AS OF SEPTEMBER 30, 2012 BOARD OF COUNTY COMMISSIONERS SHELLEY VANA County Commission Chair District #3 KAREN T. MARCUS BURT AARONSON County Commissioner County Commissioner District #1 District #5 PAULETTE BURDICK JESS R. SANTAMARIA County Commissioner County Commissioner District #2 District #6 STEVEN L. ABRAMS PRISCILLA A. TAYLOR County Commissioner County Commissioner District #4 District #7 APPOINTED OFFICIALS COUNTY ADMINISTRATOR COUNTY ATTORNEY COMMISSION AUDITOR Robert Weisman Denise Nieman Joseph F. Bergeron CONSTITUTIONAL OFFICERS Sharon R. Bock CLERK & COMPTROLLER Susan Bucher SUPERVISOR OF ELECTIONS Anne Gannon TAX COLLECTOR Gary R. Nikolits PROPERTY APPRAISER Ric Bradshaw SHERIFF viii
19


20


21 Financial Section The Financial Section includes the Independent Auditor s Report, management s discussion and analysis, basic financial statements, required supplementary information, and combining and individual fund statements and schedules.
22
23 Independent Auditor s Report Honorable Chair and Members of the Board of County Commissioners Palm Beach County, Florida Honorable Sharon R. Bock Clerk and Comptroller Honorable Gary R. Nikolits Property Appraiser Honorable Ric L. Bradshaw Sheriff Honorable Susan Bucher Supervisor of Elections Honorable Anne Gannon Tax Collector We have audited the accompanying financial statements of the governmental activities, the business-type activities, the aggregate discretely presented component units, each major fund, and the aggregate remaining fund information of Palm Beach County, Florida (the County ), as of and for the year ended September 30, 2012, which collectively comprise the County s basic financial statements as listed in the table of contents. These financial statements are the responsibility of the County s management. Our responsibility is to express opinions on these financial statements based on our audit. We did not audit the financial statements of the Solid Waste Authority, the Westgate Belvedere Homes Community Redevelopment Agency, and the Housing Finance Authority, discretely presented component units, which collectively represent 99% of the total assets and 99% of the total revenues of the aggregate discretely presented component units. Those financial statements were audited by other auditors whose reports thereon have been furnished to us, and our opinion, insofar as it relates to the amounts included for the Solid Waste Authority, Westgate Belvedere Homes Community Redevelopment Agency, and Housing Finance Authority, is based on the reports of the other auditors. We conducted our audit in accordance with auditing standards generally accepted in the United States of America and the standards applicable to financial audits contained in Government Auditing Standards, issued by the Comptroller General of the United States. Those standards require that we plan and perform the audit to obtain reasonable assurance about whether the financial statements are free of material misstatement. An audit includes examining, on a test basis, evidence supporting the amounts and disclosures in the financial statements. An audit also includes assessing the accounting principles used and significant estimates made by management, as well as evaluating the overall financial statement presentation. We believe that our audit and the reports of other auditors provide a reasonable basis for our opinions. In our opinion, based on our audit and the reports of the other auditors, the financial statements referred to above present fairly, in all material respects, the respective financial position of the governmental activities, the business-type activities, the aggregate discretely presented component units, each major fund, and the aggregate remaining fund information of Palm Beach County, Florida, as of September 30, 2012, and the respective changes in financial position and, where applicable, cash flows thereof for the year then ended in conformity with accounting principles generally accepted in the United States of America. In accordance with Government Auditing Standards, we have also issued, under separate cover, our report dated March 25, 2013, on our consideration of the County's internal control over financial reporting and our tests of its compliance with certain provisions of laws, regulations, contracts, grant agreements and other matters. The purpose of that report is to describe the scope of our testing of internal control over financial reporting and compliance and the results of that testing, and not to provide an opinion on the internal control over financial reporting or on compliance. That report is an integral part of an audit performed in accordance with Government Auditing Standards and should be considered in assessing the results of our audit. Accounting principles generally accepted in the Unites States of America require that the Management s Discussion and Analysis, the Budgetary Comparison Schedules General Fund, Fire Rescue Special Revenue Fund and Community & Social Development Special Revenue Fund, and the schedules of funding progress as listed in the table of contents be presented to supplement the basic financial statements. Such information, although not a part of the basic financial statements, is required by the Governmental Accounting Standards Board who considers it to be an essential part of financial reporting for placing the basic financial statements in an appropriate operational, economic, or historical context. We have applied certain limited procedures to the required supplementary information in accordance with auditing standards generally accepted in the United States of America, which consisted of inquiries of management about the methods of preparing the information and comparing the information for consistency with management s responses to our inquiries, the basic financial statements, and other knowledge we obtained during our audit of the basic financial statements. We do not express an opinion or provide any assurance on the information because the limited procedures do not provide us with sufficient evidence to express an opinion or provide any assurance. xi
24 Our audit was conducted for the purpose of forming opinions on the financial statements that collectively comprise the County s basic financial statements. The introductory section, combining and individual fund financial statements and schedules, and the statistical section are presented for purposes of additional analysis and are not a required part of the basic financial statements. Such information is the responsibility of management and was derived from and relates directly to the underlying accounting and other records used to prepare the basic financial statements. The combining and individual fund financial statements and schedules have been subjected to the auditing procedures applied in the audit of the basic financial statements and certain additional procedures, including comparing and reconciling such information directly to the underlying accounting and other records used to prepare the basic financial statements or to the basic financial statements themselves, and other additional procedures in accordance with auditing standards generally accepted in the United States of America. In our opinion, the combining and individual fund financial statements and schedules are fairly stated in all material respects in relation to the basic financial statements taken as a whole. The introductory and statistical sections have not been subjected to the auditing procedures applied in the audit of the basic financial statements and, accordingly, we do not express an opinion or provide any assurance on them. West Palm Beach, Florida March 25, 2013 xii


25 Management s Discussion & Analysis Photo: Morikami Museum and Japanese Gardens The Management s Discussion and Analysis subsection provides a narrative introduction to and overview and analysis of the basic financial statements. It includes a description of the government-wide and fund financial statements, as well as an analysis of Palm Beach County s overall financial position and results of operations.
26
27 Management s Discussion and Analysis Our discussion and analysis provides an overview of the financial activities of Palm Beach County, Florida (the County ) for the fiscal year ended September 30, We encourage reading this narrative in conjunction with the additional information provided in the transmittal letter (beginning on page i) and the accompanying financial statements (beginning on page 2). Financial Highlights The County s assets exceeded its liabilities (net assets) by approximately $3.709 billion and $3.634 billion at the close of fiscal years 2012 and 2011, respectively. Of these amounts, $2.508 billion and $2.446 billion were invested in capital assets, net of related debt. In addition, $689 million and $676 million were restricted by law, grant agreements, debt covenants, or for capital projects. As a result, $512 million and $512 million were available at year-end to meet the County s ongoing obligations to residents, creditors, and enterprise fund customers. During the year, the County s net assets increased $75 million, compared to an increase of $38 million during the previous fiscal year. Business-type activities increased $48 million, and governmental activities increased by $27 million. At September 30, 2012, the County s governmental funds reported a combined ending fund balance of $1.121 billion, a decrease of $26.4 million or 2.3% from the previous year. At September 30, 2012, the fund balance for the General Fund, including Constitutional Officers, was $217.6 million which is an increase of $16.8 million or 8.4% from the previous year. The County s two enterprise funds had a combined increase in net assets of $47.3 million. The Department of Airports increase was $13.3 million and the Water Utilities Department had an increase of $34.0 million. The County s total liabilities at September 30, 2012 and 2011 were $1.886 billion and $1.960 billion, respectively. Overview of the Financial Statements This CAFR consists of the Basic Financial Statements and other statements. The County s basic financial statements contain three components: government-wide financial statements, fund financial statements, and notes to the financial statements. xiii
28 Minimum Financial Reporting Requirements Information Type RSI Required Financial Information Management s Discussion and Analysis Basic Financial Statements Government-wide Financial Statements Fund Financial Statements Basic Financial Statements Notes to the Financial Statements RSI RSI (other than MD&A) Government-wide Financial Statements The government-wide financial statements provide an overview of the County s financial position using the accrual basis of accounting, which is similar to the accounting used by privatesector businesses. The statement of net assets presents information on the assets and liabilities of the County as a whole. The difference between assets and liabilities is reported as net assets. Changes in net assets may serve as an indicator of whether the financial position of the County is improving or deteriorating. The statement of activities presents information showing how the County s net assets changed during the fiscal year. Changes in net assets are reported as soon as the underlying economic transactions occur, regardless of when cash is received or paid. Therefore, some of the revenues or expenses reported in the statement of activities will have cash flows in future fiscal periods. For example, certain sales taxes are shown as revenues although cash receipts will occur early in the following fiscal year. An increase in unused vacation leave is recorded as an expense although related cash outflows will occur in the future. The government-wide financial statements show a distinction between activities that are supported primarily by taxes and intergovernmental revenues (governmental activities) and activities that are supported by the recovery of all or most of their costs through user fees and charges (business-type activities). The governmental activities of the County include general government, public safety, physical environment, transportation, economic environment, human services, and culture and recreation functions. The business-type activities of the County are the Department of Airports and the Water Utilities Department. The government-wide financial statements include not only the County itself (known as the primary government), but also the legally separate entities for which the County is financially xiv
29 accountable (known as component units). The discretely presented component units of the County are the Metropolitan Planning Organization, the Housing Finance Authority of Palm Beach County, the Westgate/Belvedere Homes Community Redevelopment Agency, and the Solid Waste Authority. The financial activity of these component units is reported separately from the financial information of the primary government. To obtain the separately issued financial statements of the discretely presented component units, see Note 1 Summary of Significant Accounting Policies, in the Notes to the Financial Statements for contact information. Fund Financial Statements A fund is a grouping of related accounts that is used to maintain control over resources that have been segregated for specific activities or objectives. The County uses fund accounting to ensure and demonstrate compliance with legal, legislative, contractual, and other finance-related provisions. All of the County s funds can be divided into three categories: governmental funds, proprietary funds, and fiduciary funds. Governmental funds Most of the County s basic services are reported in governmental funds, which focus on how money or other spendable resources flow into and out of those funds and on the level of balances remaining at year-end that are available for expenditure. These funds are reported using an accounting method called modified accrual accounting, which measures cash and all other financial assets that can be readily converted to cash. The governmental fund statements provide a detailed short-term view of the County s general governmental operations to help control current financial resources and demonstrate fiscal accountability. Governmental fund information helps determine the extent of financial resources that are available for expenditure on County programs. Reconciliations of the differences between the government-wide and fund financial statements are provided immediately after the Balance Sheet-Governmental Funds and Statement of Revenues, Expenditures, and Changes in Fund Balances-Governmental Funds, respectively, in the Basic Financial Statements. Funds that are significant in terms of revenues, expenditures, assets or liabilities are identified as major funds in the Basic Financial Statements and reported separately. Budget and actual comparison schedules are also presented as Required Supplementary Information for the General Fund and each major special revenue fund with an annually adopted budget. The County s nonmajor funds, and budget and actual comparisons schedules for any nonmajor funds with annually appropriated budgets, are presented in the Combining and Individual Fund Statements and Schedules section of this report. Proprietary funds The County uses both types of proprietary funds, Enterprise and Internal Service Funds. Enterprise funds are used to report the same functions presented as business-type activities in the government-wide financial statements. The County uses enterprise funds to account for its Airports and Water Utilities operations. Both of these operations are considered to be major xv
30 proprietary funds of the County. Internal Service funds are used to accumulate and allocate costs internally among the County s other functions. The County uses internal service funds to account for its Fleet Management and Risk Management programs. These programs are included within governmental activities in the government-wide financial statements because they predominantly benefit governmental rather than business-type functions. The three internal service funds are combined into a single presentation in the proprietary fund financial statements. Individual fund data for the internal service funds are provided in the Combining and Individual Fund Statements and Schedules section of this report. The proprietary fund financial statements can be found in the Basic Financial Statements. Fiduciary funds Fiduciary funds are used to account for resources held for the benefit of parties outside the government. Agency funds are the only type of fiduciary fund used by the County. The amounts in these agency funds are not included in the government-wide financial statements because the resources of these funds are not available to support the County s own programs. However, the Statement of Fiduciary Net Assets Agency Funds in the Basic Financial Statements is provided for information on the agency funds. In addition, the individual agency funds are presented in the Combining and Individual Fund Statements and Schedules section of this report. Notes to the financial statements The notes provide additional information that is essential for a more complete understanding of the data provided in the government-wide and fund financial statements. Other information In addition to the basic financial statements and accompanying notes, this report also presents certain required supplementary information containing budget to actual comparisons for the General Fund and major special revenue funds. The combining statements for the nonmajor funds, internal service funds, agency funds, as well as individual fund budget and actual comparison schedules are found in the Combining and Individual Fund Statements and Schedules section of this report. Government-wide Financial Analysis Over time, net assets may serve as the most useful indicator of a government s financial position. At September 30, 2012 and 2011, the County s total net assets, or total assets less liabilities, were $3.709 billion and $3.634 billion, respectively. A significant portion of the County s net assets, $2.508 billion or 67.6%, is identified as an investment in capital assets (such as land, buildings, equipment, infrastructure), less related debt outstanding that was used to acquire those assets. Since the County uses capital assets to provide services to its residents, the net assets represented by invested in capital assets, net of related debt are not available for future spending. In fact, the payment of maintenance and debt service costs on those capital assets will themselves require governmental resources. xvi
31 Another portion of the County s net assets is restricted net assets which represent assets that are subject to constraints such as by debt covenants, grantors, laws or regulations. Unrestricted net assets are net assets that are available to meet the County s ongoing obligations to residents, creditors, and enterprise fund customers. As shown on the following chart, the County reported positive balances at September 30, 2012 and 2011, in all three categories of net assets, for governmental activities, business-type activities, as well as the County as a whole. Palm Beach County, Florida Net Assets at Year-End (in millions) TOTAL PRIMARY Governmental Activities Business-type Activities GOVERNMENT Assets Current and other assets $ 1,388 $ 1,446 $ 419 $ 380 $ 1,807 $ 1,826 Capital assets 2,528 2,500 1,260 1,268 3,788 3,768 Total assets 3,916 3,946 1,679 1,648 5,595 5,594 Liabilities Current Long-term debt due in more than one year 1,279 1, ,581 1,639 Total liabilities 1,537 1, ,886 1,960 Net Assets Invested in capital assets, net of related debt 1,546 1, ,508 2,446 Restricted Unrestricted Total net assets $ 2,379 $ 2,352 $ 1,330 $ 1,282 $ 3,709 $ 3,634 xvii
32 Governmental activities Significant changes in the Statement of Net Assets are as follows: Current and other assets for Governmental activities decreased by $58 million. Much of the change can be attributed to acquisitions of Capital Assets and payments on long-term debt. Capital assets for Governmental activities increased by $28 million. Refer to the subsequent section on Capital assets for additional detail. The overall decrease in long-term debt for Governmental activities of $39 million consists primarily of principal payments made on bonds, notes and loans, primarily offset by increases in claims, judgments and Other Post-Employment Benefits. Governmental activities were responsible for a $27 million increase in the County s net assets during fiscal year 2012, as compared with a $1 million increase during the previous fiscal year. This year s $27 million increase in net assets from governmental activities is attributed to several factors: Investment income decreased $7 million or 15% from the previous fiscal year. The decrease was primarily the result of the aging of the portfolio combined with continued market low interest rates. Ad valorem tax revenue decreased $16 million or 2% from the previous fiscal year. The decrease continues to be due to lower overall taxable values. General government expenses decreased $28 million or 8% from the previous fiscal year due in part to continued budget reduction strategies. Economic environment expenses increased $34 million or 42% from the previous fiscal year. This can be attributed in part to continued focus on the Bio-technology industry expansion. Interest expense decreased $4 million or 8% from the previous fiscal year due to lower debt service payments made in fiscal year The County s governmental activities had net expenses of $1.106 billion. These services are intended to be primarily funded by taxes and other general revenues as opposed to charges for service and grants. Total revenues (both program and general revenues) were greater than total expenses by $30 million. xviii
33 REVENUES BY SOURCE Governmental Activities Fiscal Years 2011 and 2012 (Amounts in millions) $1,000 $800 $600 $400 $200 $0 FY 2011 FY 2012 Business-type activities The County s business-type activities had total revenues of $271 million and had total revenues in excess of total expenses of $48 million. Refer to the Proprietary funds section of Financial Analysis of the Government s Funds which follows for more information on the County s business-type activities. The significant change in the business-type activities Statement of Net Assets was due to substantial payments on long-term debt, which decreased $19 million during fiscal year xix
34 Palm Beach County, Florida Changes in Net Assets (in millions) Revenues Program Revenues: Charges for services 291 TOTAL PRIMARY Governmental Activities Business-type Activities GOVERNMENT $ $ 264 $ 234 $ 231 $ 525 $ 495 Operating grants and contributions Capital grants and contributions General Revenues: Ad valorem taxes Other local taxes State shared revenues Franchise fees Investment income Other Total revenues 1,670 1, ,941 1,908 Expenses General government Public safety Physical environment Transportation Economic environment Human services Culture and recreation Interest expense Department of Airports Water Utilities Department Total expenses 1,640 1, ,863 1,866 Excess Transfers In (Out) (3) (2) Special Items - - (3) (4) (3) (4) Change in net assets Beginning net assets 2,352 2,351 1,282 1,245 3,634 3,596 Ending net assets $ 2,379 $ 2,352 $ 1,330 $ 1,282 $ 3,709 $ 3,634 xx
35 Financial Analysis of the Government s Funds As mentioned earlier, the County uses fund accounting to ensure and demonstrate compliance with legal, legislative, contractual, and other finance-related provisions. Governmental funds. The focus of the County s governmental funds is to provide information on near-term inflows, outflows, and balances of spendable resources. This information is useful in determining the County s financing resources. Changes in Fund Balance Governmental Funds The increase in the General Fund s fund balance of $16.8 million is primarily attributable to lower expenditures in the current year. General Government expenditures were lower by $13.0 million from the previous year, as well as a decrease in Public Safety expenditures of $10.0 million from the previous fiscal year. The increase in the Fire Rescue Special Revenue Fund of $1.0 million is partially attributable to overall lower expenditures compared with the previous year. The decrease in the Community and Social Development Special Revenue Fund of $4.3 million is related to fewer grants provided by both the federal and state governments. The increase of $4.2 million in the Road Program Capital Projects Fund is related to overall reductions of road related expenditures in the current fiscal year. The decrease of $10.4 million in the General Government Capital Projects Fund is due to the spending of County capital projects funds. GENERAL FUND BALANCE BY CATEGORY Total $217,550,022 September 30, 2012 Sheriff, $7,072,586 Clerk & Comptroller, $14,043,277 BOCC, $196,434,159 xxi
36 At September 30, 2012, the County s governmental funds reported combined ending fund balances of $1.121 billion, a decrease of $26.4 million from the previous year. This decrease was the result of a combination of a $16.8 million increase in the ending fund balance of the General Fund; a decrease of $10.4 million in the General Government Program Capital Projects Fund; an increase in the Fire Rescue Special Revenue Fund of $1.0 million; a decrease in the Community & Social Development Special Revenue Fund of $4.3 million; an increase in the Road Program Capital Project Fund of $4.2 million; and a decrease in Other Governmental Funds of $33.7 million. $900 $800 $700 $600 $500 $400 $300 $200 $100 $0 EXPENDITURES BY FUNCTION Governmental Activities Fiscal Years 2011 and 2012 (Amounts in millions) FY 2011 FY 2012 Proprietary funds. The proprietary funds provide the same type of information found in the government-wide financial statements, but in more detail. Financial highlights of each of the County s enterprise funds are as follows: Department of Airports: Operating revenues decreased by $900,000 (1%) to $65.5 million. The largest contributor being airline rents which decreased by $1.9 million, or 11%, over the prior year, due to decreased lease rates charged to airlines and decreased terminal area. Landing fee revenue decreased by $128,000 (2%) as a result of decreased landing fees which declined 3.7% to signatory airlines. Pursuant to the Airline-Airport Use and Lease Agreement, rates to signatory carriers declined due to decreased net operating expenses to operate airline terminal and airfield facilities. Car rental concession revenues and non-airline rentals both xxii
37 increased during fiscal year 2012 by a cumulative $1.3 million, partially offsetting declines in airline rents and landing fees. Compared to the prior year, operating expenses (excluding depreciation and amortization) decreased by $1.4 million, or 3.5%, to $40.5 million in fiscal year Looking longer term, the Department s annual operating expenses were 11% less than in fiscal year 2009 which translates into annual savings of $5 million. This reduction in costs has led to decreased rates to Airlines pursuant to the terms of our lease agreement with the signatory airlines. Cost savings have been achieved over a broad range of areas including salary freezes, reduced pension costs, decreased staffing, more favorable contracts, increased energy efficiency, and general cost cutting. As a result of the factors above, 2012 operating income before depreciation increased $500,000. Water Utilities Department: The Department s net assets increased by $34.0 million, or 3.7%, compared to an increase of $20.3 million, or 2.3% in fiscal year Long-term debt (net of the current portion) decreased by $8.1 million, or 4.1%, during the year. Operating revenues in fiscal year 2012 totaled $153.8 million, an increase of $2.3 million or 1.5%. Fiscal year 2012 included the effect of rate indexing and a.4% increase in the customer base. Operating expenses before depreciation and amortization and equity interest in net loss of joint venture totaled $100.5 million, an increase of $0.9 million or.9%. Non-operating income increased by $1.8 million, or 75.0% in fiscal year The Department showed net income before contributions, transfers, and special item of $16.7 million for fiscal year 2012, an increase of $3.8 million or 29.2% from fiscal year Budgetary Highlights Budget and actual comparison schedules are provided as Required Supplementary Information for the General Fund and all major special revenue funds with annually appropriated budgets. Budget and actual comparison schedules are also provided in the Combining and Individual Fund Statements and Schedules section for all nonmajor funds with annually appropriated budgets. The budget and actual comparison statements and schedules show the original adopted budget, the final revised budget, actual results and a variance between the final budget and actual results. There were no funds with total actual expenditures in excess of the final revised budget. xxiii
38 After the original budget is approved, it may be revised for a variety of reasons such as unforeseen circumstances, corrections or errors, new bond or loan proceeds, new grant awards and other revenues. During fiscal year 2012, supplemental appropriations to the Board of County Commissioners budget excluding component units, were approximately $346.6 million, or approximately 9% of the original adopted budget. Differences between the original budget for fiscal year 2012 and the final amended budget for the General Fund can be summarized as follows: On March 20, 2012, the Board amended the budget to reflect the true up of the original budgeted beginning fund balance to the actual fund balance, which accounts for a $26.9 million adjustment to the reserves for balances forward in the General Government budget, reduced the Reserve for Contingency by $2.6 million, reduced the transfer to the County Transportation Trust Fund in the amount of $.3 million, increased the transfer to the Palm Tran Operations Fund in the amount of $2.1 million, increased the transfers to debt service funds in the amount of $.7 million, and the remaining $.2 million for transfers for various Special Revenue funds and general government expenses. On November 20, 2012, the Board amended the budget to reflect year-end adjustments. These adjustments included recognizing the transfer of excess reserve balances in internal service funds in the amount of $12.8 million and revenue from the SWA for hurricane Jeanne related refund in the amount of $.3 million. These additional funds were appropriated as follows: Contingency Reserves - $10.7 million, transfer to Capital Outlay fund of $2.1 million to fund write-off of bad debt and $.3 million as refund of prior year revenue. The remaining amendments were primarily associated with new grants and carry forward of existing grant funds. Budget to Actual Expenditures General Fund budgeted reserves had a balance at year-end of $115.7 million, which represents 80% of the total unexpended appropriations in the fund. These unexpended funds will be carried over into fiscal year 2013 and will be re-appropriated. The actual Community Redevelopment Agency obligation was approximately $900,000 under budget. Division of Juvenile Justice Pre-Predisposition Costs were $2.2 million under budget. The remaining unspent funds can be primarily attributed to County departments spending less than budgeted. xxiv
39 Budget to Actual Revenues Ad valorem tax collections were 96% of budget, in line with the historical collection rate. Florida Statutes require revenues to be budgeted at 95% of reasonably anticipated receipts. Palm Beach County budgets a negative 5% statutory reserve to accomplish this. Allowing for the reserve, ad valorem taxes were actually over collected by $5.4 million. In addition, actual delinquent ad valorem tax collections were $1.4 million over budget. While State Revenue Sharing exceeded the budget in fiscal year 2012 by $3.9 million, actual collections were only $1.4 million over the previous year. The County received a $1.8 million payment from FAU associated with the Scripps project. In FY 2011, this revenue was recorded in debt service Fund In FY 2012, this revenue was recorded in the General Fund and was unbudgeted. While investment income was approximately 5% under budget, GASB 31 has made it difficult to project investment income that will be recognized. Fair market gains and losses cannot be projected accurately, resulting in possible variances in recognized income. Budget to Actual Other financing sources Actual excess fees (transfers in) received from the Sheriff and the Supervisor of Elections amounted to $22.8 million, of which no amount was budgeted. The Clerk & Comptroller returned $1.9 million in excess fees, $1.4 million more than the final budget. Capital Assets and Debt Administration Capital assets. The County s capital assets for its governmental and business-type activities as of September 30, 2012, amounts to $3.788 billion (net of accumulated depreciation). This investment in capital assets includes a broad range of capital assets, including land, buildings and improvements, improvements other than buildings, equipment, infrastructure, and construction in progress. The total increase in the County s capital assets for fiscal year 2012 was just under 1% or $20 million, (a $28 million increase for governmental activities and an $8 million decrease for business-type activities). xxv
40 Primary Government: Palm Beach County, Florida Capital Assets, net of Accumulated Depreciation at Year-End (in millions) TOTAL PRIMARY Governmental Activities Business-type Activities GOVERNMENT Land $ 740 $ 739 $ 115 $ 114 $ 855 $ 853 Buildings & improvements Improvements other than buildings Equipment Infrastructure Intangible - easement rights Leasehold interest Goodwill Construction in progress TOTALS $ 2,528 $ 2,500 $ 1,260 $ 1,268 $ 3,788 $ 3,768 Major capital asset events during the fiscal year include the following: Substantially completed projects during fiscal year 2012 included $131.7 million for the Jail Expansion Project, improvements to 45 th Street/Jog Road to Haverhill Road for $12.8 million and $2.3 million for the Main Library Expansion. Governmental activities Net Capital assets increased overall by $28 million due to acquisitions of $5 million for improvements other than buildings, $3 million in equipment, $1 million for land, and $42 million added to Construction in progress, offset by reductions of infrastructure of $20 million and buildings and improvements of $3 million. Business-type activities Net Capital assets decreased overall by $8 million to $1.260 billion. Major projects by the Water Utilities Department included improvements to the Water Treatment Plant #2 for $10.0 million and improvements to the Southern Region Water Reclamation Facility for $2.8 million. The Department of Airports expended $26.5 million on capital activities. Completed projects during 2012 totaling $17.1 million were transferred from construction-inprogress to their respective capital accounts. The major projects completed in fiscal year 2012 involved runway and taxiway improvements, as well as parking garage rehabilitation. xxvi
41 Equipment 6% Infrastructure 8% Construction in progress 16% CAPITAL ASSETS, NET Total Primary Government September 30, 2012 Other 1% Land 22% Improvements other than buildings 26% Buildings & improvements 21% See Note 4, Capital Assets, in the Notes to the Financial Statements for additional information. Long-term liabilities. At September 30, 2012, the primary government had 44 issues of bonded debt totaling $1.349 billion. Of this amount, $210 million comprises debt backed by the full faith and credit of the government, $824 million is special obligation debt secured by dedicated revenue sources and $315 million is secured by specified enterprise revenue sources. See chart below for more information. Palm Beach County, Florida Long-Term Liabilities at Year-End (in millions) TOTAL PRIMARY Governmental Activities Business-type Activities GOVERNMENT General obligation bonds $ 210 $ 229 $ - $ - $ 210 $ 229 Non-ad valorem revenue bonds Revenue bonds Notes and loans payable Other obligations TOTALS $ 1,394 $ 1,438 $ 320 $ 340 $ 1,714 $ 1,778 Bonded Debt. The County s bond issues are rated by three primary bond rating agencies; Moody s Investors Service, Standard and Poor s and Fitch Ratings. These ratings, which are listed in the following chart, are indicative of the County s strong management team, broadbased economy, continually well-performing tax base, increasingly strong financial position, xxvii
42 minimal debt requirements and high quality residential tax base. At September 30, 2012, the County s non-ad valorem revenues were 3.60 times the debt service required in the current or any future fiscal year. Fitch Type of Debt Issue Moody's Ratings S&P General obligation bonds Aaa AAA AAA Non-ad valorem revenue bonds Aa1 AA+ AA+ Water and Sewer System Enterprise revenue bonds Aaa AAA AAA Water and Wastewater System Enterprise revenue bonds Aaa AAA AAA Airport System Enterprise revenue bonds A2 A A Note: Highest rating: AAA/Aaa Investment grade ratings: AAA/Aaa through BBB/Baa, Lowest Rating: C LONG-TERM LIABILITIES Total Primary Government September 30, 2012 General obligation bonds 12% Other obligations 20% Notes and loans payable 1% Revenue bonds 19% Non-ad valorem revenue bonds 48% See Note 13, Long-Term Debt, in the Notes to the Financial Statements for additional information. Economic Factors Local, national, and international economic factors influence the County s revenues in a variety of ways. Positive economic growth is correlated with increased revenues from property taxes, sales taxes, fuel taxes, charges for services, state revenue sharing as well as state and federal grants. Economic growth may be measured by a variety of indicators such as employment xxviii
43 growth, unemployment, new construction and assessed values, diversification of the property tax base, and Enterprise Fund revenue and net asset growth. The County s population increased from 1,325,758 in 2011 to 1,335,415 in 2012, an increase of 9,657 people or.73%. The civilian labor force for Palm Beach County increased from 621,616 at September 30, 2011 to 622,775 at September 30, The County s unemployment rate decreased from 10.9% at September 30, 2011 to 9.2% at September 30, Gross property taxes levied for fiscal year 2012 decreased from $873.7 million in 2011 to $855.0 million for 2012, a decrease of $18.7 million or 2.1%. Palm Beach County has a diversified property tax base. The ten largest property taxpayers in the County represent 13.6% of the total ad valorem property taxes levied. Residential building permits issued in Palm Beach County for both single family and multi-family units rose from 2,299 in 2011 to 4,180 in 2012, an increase of 82%. Palm Beach County closed sales for single-family homes increased from 12,441 in 2011 to 13,668 in 2012, an increase of 9.9%. The median sales price for a single-family home in Palm Beach County rose from $193,000 in 2011 to $212,000 in 2012, an increase of 9.8%. Foreclosure filings in Palm Beach County rose from 12,154 in 2011 to 15,419 in 2012, an increase of 27%. More information on economic factors is provided in the Statistical Section. To Obtain Further Information This financial report was designed to provide an overview of the County s finances. If you have any questions concerning budgets, long-term financial planning, future debt issuances, or questions related to the management of County operations, please contact the County Administrator at: County Administrator 301 North Olive Avenue, 11 th Floor West Palm Beach, FL If you have any questions concerning the Basic Financial Statements or other accounting information in this report, please contact the Financial Reporting Manager at: Clerk & Comptroller, Palm Beach County Finance Department 301 North Olive Avenue, 2 nd Floor West Palm Beach, FL xxix


44 xxx


45 Basic Financial Statements The Basic Financial Statements subsection includes the government-wide financial statements, which incorporate governmental and business type activities of Palm Beach County and activities of component units in order to provide an overview of the financial position and results of operation for the reporting entity. This subsection also includes the fund financial statements of the County and the accompanying notes to the financial statements.
46
47 1
48 Statement of Net Assets September 30, 2012 Primary Government Governmental Business-Type Activities Activities Total ASSETS Cash, cash equivalents, and investments $ 821,768,430 $ 235,521,499 $ 1,057,289,929 Interest receivable 252, , ,034 Accounts receivable - net 21,915,467 20,680,460 42,595,927 Internal Balances (6,635,330) 6,635,330 - Due from primary government Due from other governments 51,341,698 4,814,332 56,156,030 Due from component units 421, ,225 Inventory 13,757,125 8,194,564 21,951,689 Other assets 6,145,905 1,332,570 7,478,475 Other receivable - noncurrent 20,979,356 16,400,546 37,379,902 Investment in joint ventures - 49,123,038 49,123,038 Deferred debt issuance costs 6,741,093 2,864,632 9,605,725 Noncurrent restricted cash, cash equivalents and investments 450,833,337 73,017, ,850,841 Capital assets Non-depreciable capital assets 1,299,955, ,201,789 1,456,157,176 Depreciable capital assets, net 1,228,463,338 1,103,339,251 2,331,802,589 Total assets 3,915,939,065 1,678,813,515 5,594,752,580 LIABILITIES Vouchers payable and accruals 75,483,753 13,586,155 89,069,908 Due to primary government Due to other governments 14,873,301 1,457,658 16,330,959 Due to component units 11,726, ,727,147 Due to individuals 1,088,507 6,269,545 7,358,052 Accrued interest payable 16,082,901 7,848,729 23,931,630 Unearned revenue 13,271, ,889 13,427,397 Other current liabilities 10,187,446-10,187,446 Long-term liabilities Long-term liabilities due within one year 115,439,305 17,860, ,300,055 Long-term liabilities due more than one year 1,278,718, ,886,903 1,580,605,676 Total liabilities 1,536,872, ,065,838 1,885,938,270 NET ASSETS Invested in capital assets, net of related debt 1,546,566, ,437,487 2,509,004,001 Restricted for: Debt service 18,040,048 19,695,155 37,735,203 Capital projects 368,636,293 50,228, ,864,725 Library services 11,229,738-11,229,738 Fire rescue services 80,148,414-80,148,414 Tourist development programs 20,852,839-20,852,839 Grant programs 33,415,887-33,415,887 Environmental protection programs 11,804,435-11,804,435 Public safety and judicial programs 26,269,454-26,269,454 Other services and programs 37,537,345 10,811,241 48,348,586 Unrestricted 224,565, ,575, ,141,028 Total net assets $ 2,379,066,633 $ 1,329,747,677 $ 3,708,814,310 The notes to the financial statements are an integral part of this statement. 2
49 Component Units Westgate/ Belvedere Homes Metropolitan Housing Community Solid Planning Finance Redevelopment Waste Organization Authority Agency Authority $ 100 $ 4,780,755 $ 412,405 $ 330,109,577-13, , , ,704 5,959, ,496 6,406, ,837 4,886, ,065,581 15,945 25,595 3,932,933 5,218, , ,779 12,522, ,262, ,094, ,263, ,860, ,233, ,541 11,685,086 11,452,560 1,783,174,462 42, , ,833 43,025,999 2,089 46, , , ,592, , ,455 16, , ,277 15,848, ,500-2,495,138 1,192,796, , ,544 3,722,626 1,277,584, ,694, ,911, , ,562,208 14,231, ,700,821 88,187 11,266, ,595 82,746,380 $ 88,187 $ 11,266,542 $ 7,729,934 $ 505,589,744 3
50 Statement of Activities For the fiscal year ended September 30, 2012 Expenses Program Revenues PRIMARY GOVERNMENT Operating Grants, Fines, Fees Contributions Capital and Charges and Restricted Grants and Direct Indirect for Services Interest Income Contributions Governmental Activities General Government $ 331,862,438 $ (17,196,192) $ 111,559,056 $ 39,122,385 $ 5,692,359 Public Safety 754,170,349 5,728, ,831,187 12,742, ,653 Physical Environment 29,206,388-8,298,140 5,438,522 2,707,629 Transportation 168,483,843-27,167,174 54,054,263 9,648,757 Economic Environment 114,700, ,639 3,354,941 72,138,310 - Human Services 97,081, ,830 3,547,332 38,582,333 - Culture and Recreation 104,939,360 2,843,851 19,313,804 1,422,527 1,814,960 Interest Expense 48,095, Total Governmental Activities 1,648,539,223 (7,751,966) 291,071, ,500,504 20,135,358 Business Activities Department of Airports 72,543,969 1,294,580 77,400,041-7,943,252 Water Utilities Department 142,964,452 6,345, ,177,871-22,260,813 Total Business Activities 215,508,421 7,640, ,577,912-30,204,065 Total Primary Government $ 1,864,047,644 $ (111,519) $ 525,649,546 $ 223,500,504 $ 50,339,423 COMPONENT UNITS Metropolitan Planning Organization $ 1,462,222 $ 111,519 $ - $ 1,857,463 $ - Housing Finance Authority 480, , ,560 - Westgate/Belvedere CRA 1,623,641-1,946, Solid Waste Authority 223,695, ,122,184 2,188, ,386 Total Component Units $ 227,262,299 $ 111,519 $ 257,570,367 $ 4,367,729 $ 741,386 General Revenues Taxes - levied by the County Ad-valorem taxes Utility service taxes Local option gas taxes Tourist development taxes State shared sales tax-unrestricted Franchise gross receipts fee State shared revenues-unrestricted Investment income Other general revenues Transfers - net Special item Total general revenues, transfers and special item Increase in net assets Beginning net assets (deficit) Ending net assets The notes to the financial statements are an integral part of this statement. 4
51 Net (Expense) Revenue and Changes in net Assets Primary Government Component Units Westgate/ Belvedere Homes Metropolitan Housing Community Solid Governmental Business-Type Planning Finance Redevelopment Waste Activities Activities Total Organization Authority Agency Authority $ (158,292,446) $ - $ (158,292,446) $ - $ - $ - $ - (629,054,251) - (629,054,251) (12,762,097) - (12,762,097) (77,613,649) - (77,613,649) (39,332,500) - (39,332,500) (55,697,701) - (55,697,701) (85,231,920) - (85,231,920) (48,095,197) - (48,095,197) (1,106,079,761) - (1,106,079,761) ,504,744 11,504, ,128,365 30,128, ,633,109 41,633, $ (1,106,079,761) $ 41,633,109 $ (1,064,446,652) $ - $ - $ - $ - $ - $ - $ - $ 283,722 $ - $ - $ , , ,356,409 $ - $ - $ - $ 283,722 $ 342,812 $ 322,721 $ 34,356,409 $ 824,015,386 $ - $ 824,015,386 $ - $ - $ 1,170,137 $ - 33,553,838-33,553, ,637,158-45,637, ,821,660-28,821, ,206,178-70,206, ,955,780-34,955, ,026,652-55,026, ,425,709 7,041,371 47,467,080 2, ,138,225-3,138, ,836 - (2,831,473) 2,831, (3,572,024) (3,572,024) ,132,949,113 6,300,820 1,139,249,933 2,212-1,237,548-26,869,352 47,933,929 74,803, , ,812 1,560,269 34,356,409 2,352,197,281 1,281,813,748 3,634,011,029 (197,747) 10,923,730 6,169, ,233,335 $ 2,379,066,633 $ 1,329,747,677 $ 3,708,814,310 $ 88,187 $ 11,266,542 $ 7,729,934 $ 505,589,744 5
52 6
53 DESCRIPTIONS OF MAJOR FUNDS GOVERNMENTAL FUNDS General Fund - To account for all financial resources of the general government except those required to be accounted for in other funds.the General Fund is subdivided into the following categories: Board of County Commissioners (BOCC), Sheriff, Clerk & Comptroller, Tax Collector, Property Appraiser and the Supervisor of Elections. Fire Rescue Special Revenue Fund - To account for ad-valorem taxes and other revenues designated for fire rescue services. Community & Social Development Special Revenue Fund - To account for governmental grant funds and other revenues designated for community and social services. Road Program Capital Projects - To account for costs related to the design, acquisition of rights-of-way and construction of improvements to the County's major thoroughfare road system, primarily represented by the County's Five Year Road Program. General Government Capital Projects - To account for costs of capital improvements not included in any other category. PROPRIETARY FUNDS Airports - To account for activities related to the operation of the four County-owned airports - Palm Beach International Airport in West Palm Beach and three general aviation airports located in Lantana, Pahokee and Palm Beach Gardens. Water Utilities - To account for activities related to the operation of the County-owned water and sewage system which provides water and sewer services to portions of the unincorporated area of the County as well as to certain municipalities. 7
54 Balance Sheet Governmental Funds September 30, 2012 MAJOR FUNDS Community Fire & Social Rescue Development General Special Revenue Special Revenue Fund Fund Fund ASSETS Cash, cash equivalents, and investments $ 269,698,612 $ 121,063,071 $ 2,500 Accounts receivable, net 10,699,960 1,367,468 1,222,420 Due from other county funds 32,586,991 3,512,424 6,141,022 Due from other governments 11,024,492 2,857,871 18,951,527 Due from component unit 418, Inventory 5,634,149 2,648,263 - Other assets 258, Other receivable, noncurrent 6,000,000-11,769,356 Total assets $ 336,320,762 $ 131,449,172 $ 38,086,825 LIABILITIES Vouchers payable and accrued liabilities $ 35,924,950 $ 9,544,300 $ 7,208,744 Due to other county funds 27,879, ,927 10,968,723 Due to other governments 11,822, ,717 1,537,404 Due to component unit 11,573,352-20,301 Due to individuals 387, ,933 Insurance claims payable 1,834, Deferred and unearned revenue 19,170,924-24,542,617 Other liabilities 10,176, Total liabilities 118,770,740 10,240,944 44,829,722 FUND BALANCE Non-Spendable Inventory 5,634,149 2,648,263 - Prepaid items 128, Spendable Restricted for: Debt service Capital projects Library services Fire rescue services - 118,559,965 - Tourist development programs Grant programs ,534 Environmental protection programs Public safety and judicial programs 17,648, Other services and programs - - 1,028,565 Assigned to: Debt service Capital projects Tourist development programs Public safety and judicial programs 437, Other services and programs Unassigned 193,701,053 - (8,619,996) Total fund balance 217,550, ,208,228 (6,742,897) Total liabilities and fund balance $ 336,320,762 $ 131,449,172 $ 38,086,825 The notes to the financial statements are an integral part of this statement. 8
55 Road General Program Government Other Total Capital Capital Governmental Governmental Projects Projects Funds Funds $ 364,187,523 $ 111,156,653 $ 314,000,066 $ 1,180,108,425 4, ,673,416 19,968,141-2,877,050 15,605,346 60,722,833 5,181, ,875 12,863,006 51,158, , ,937,902 12,220, , , ,210,000 20,979,356 $ 369,373,573 $ 114,313,798 $ 356,909,922 $ 1,346,454,052 $ 5,386,903 $ 1,200,505 $ 12,097,017 $ 71,362,419 29, ,287,295 50,320,338 2, ,495 14,737, ,285 11,726, ,938 1,088, ,834,775 3,248,869 62,400 17,052,970 64,077, ,695 10,187,446 8,668,128 1,263,721 41,562, ,335, ,937,902 12,220, , , ,010,123 27,010, ,512,339 34,407, ,643, ,563, ,520,596 13,520, ,559, ,852,839 20,852, ,717,059 32,565, ,769,002 11,769, ,770,231 30,419, ,862,402 26,890, , ,103 89,193,106 78,642,769 19,437, ,273, ,163,570 4,163, , ,792,917 7,792, (2,391,106) 182,689, ,705, ,050, ,347,227 1,121,118,102 $ 369,373,573 $ 114,313,798 $ 356,909,922 $ 1,346,454,052 9
56 Reconciliation of the Balance Sheet - Governmental Funds to the Statement of Net Assets - Governmental Activities September 30, 2012 Fund balance for total of governmental funds (page 9) Amounts reported for governmental activities in the statements of net assets are different because: Report internal service funds as governmental activities Internal service funds are used by management to charge the costs of certain activities, such as insurance, computer services, and vehicles to individual funds. The assets and liabilities of the internal service funds are included in governmental activities in the statement of net assets. Net assets per fund statements $ 51,027,644 Less amount due to business-type activities for 'look-back' allocation (4,609,516) Report as a liability general long-term debt obligations Liabilities that are not due and payable in the current period do not encumber current financial resources and therefore are not reported in the governmental fund statements. General obligation bonds payable (207,340,000) Non-ad valorem bonds payable (793,276,168) Notes and loans payable (22,574,341) Compensated absences (128,964,111) Net OPEB Obligation (93,610,375) Claims and judgments (33,584,143) Unamortized premium (52,897,403) Arbitrage accrued (7,237,320) Net Pension Obligation (15,366,045) Termination benefits (910,259) Deferred loss on refundings 19,783,268 Report as an asset the cost of general capital assets and accumulated depreciation Capital assets used in governmental activities are not financial resources and therefore are not reported in the governmental fund statements. Non-depreciable capital assets 1,299,955,387 Depreciable capital assets, net of accumulated depreciation 1,204,938,088 Report other adjustments to convert from modified accrual to full accrual $ 1,121,118,102 46,418,128 (1,335,976,897) 2,504,893,475 Net OPEB Obligation Asset Cumulative plan contributions in excess of ARC is reported as an asset. However, the plan contributions are reported as expenditures in the governmental fund statements. 1,149,361 Deferred Debt Issuance Costs Issue cost for new debt is reported as a deferred charge and amortized over the life of the debt as an expense. However, issue costs are recorded as expenditures in the governmental fund statements. 6,741,093 Accrued Interest Payable Accrued Interest Payable that is not due and payable in the current period is not reported in the governmental fund statements. Deferred Revenue Revenue is recognized when earned. However, revenue is deferred until the current financial resources are available in the governmental fund statements. (16,082,901) 50,806,272 42,613,825 Net assets of governmental activities (page 2) $ 2,379,066,633 10
57 11
58 Statement of Revenues, Expenditures, and Changes in Fund Balances Governmental Funds For the fiscal year ended September 30, 2012 MAJOR FUNDS Community Fire & Social Rescue Development General Special Revenue Special Revenue Fund Fund Fund Revenues: Taxes (net of discount) $ 634,630,927 $ 184,661,800 $ - Special assessments - 271,653 - Licenses and permits 33,026,711 13,020 - Intergovernmental 133,339, ,734 93,815,427 Charges for services 192,803,535 32,855, ,798 Less - excess fees paid out (39,445,243) - Fines and forfeitures 2,782, Investment income 10,432,112 5,076, ,766 Miscellaneous 7,626, ,941 1,533,601 Total revenues 975,197, ,017,942 96,583,592 Expenditures: Current: General government 240,793, Public safety 444,089, ,459,000 1,976,029 Physical environment 11,066, Transportation 4,235,000-68,088 Economic environment 23,058, ,098 63,496,336 Human services 47,617,113-48,595,612 Culture and recreation 48,206, Capital outlay 25,289,807 1,398, ,754 Debt service ,385 Total expenditures 844,356, ,348, ,191,204 Excess of revenues over (under) expenditures 130,840,813 (5,330,669) (18,607,612) Other financing sources (uses): Transfers in 29,966,825 6,457,119 12,932,295 Transfers out (143,795,916) (243,767) (2,195,492) Issuance of long-term debt - - 3,561,000 Issuance of refunding debt Premium on refunding debt Payment to escrow agent for refunding Total other financing sources (uses) (113,829,091) 6,213,352 14,297,803 Net change in fund balances 17,011, ,683 (4,309,809) Fund balances, October 1, ,780, ,196,849 (2,433,088) Increase (decrease) in nonspendable fund balance (241,868) 128,696 - Fund balances, September 30, 2012 $ 217,550,022 $ 121,208,228 $ (6,742,897) The notes to the financial statements are an integral part of this statement. 12
59 Road General Program Government Other Total Capital Capital Governmental Governmental Projects Projects Funds Funds $ 9,363,976 $ 800 $ 130,139,069 $ 958,796,572 12,854, ,975 18,475,072 32,282, ,421,296 50,461,027 18,994,483 2,983,554 73,695, ,637, ,573 31,965, ,051, (39,445,243) - - 4,432,219 7,215,209 9,365,609 3,043,436 9,530,310 38,090,657 4,391, ,505 10,027,706 24,492,007 54,970,427 8,124, ,687,293 1,654,581,460 1,354,261 23,866,803 8,340, ,355, ,608, ,133, ,431 16,324,650 27,896,485 4,801,643 3,695, ,392, ,192, ,796 27,497, ,737, , ,720 96,774, ,514,975 90,721,377 44,394,105 5,525,628 64,898, ,048, ,128, ,641,429 50,550,009 33,895, ,159,725 1,699,501,423 4,420,418 (25,770,481) (130,472,432) (44,919,963) 814,000 17,137, ,064, ,372,253 (1,029,000) (1,814,897) (47,555,927) (196,634,999) ,561, ,189, ,189, ,470,407 28,470, (191,000,713) (191,000,713) (215,000) 15,322,472 97,167,752 18,957,288 4,205,418 (10,448,009) (33,304,680) (25,962,675) 356,500, ,498, ,033,646 1,147,575, (381,739) (494,911) $ 360,705,445 $ 113,050,077 $ 315,347,227 $ 1,121,118,102 13
60 Reconciliation of the Statement of Revenues, Expenditures, and Changes in Fund Balances of Governmental Funds to the Statement of Activities - Governmental Activities For the fiscal year ended September 30, 2012 Net increase (decrease) in fund balances for total governmental funds (page 13) Amounts reported for governmental activities in the statements of activities are different because: $ (25,962,675) Report internal service funds as governmental activities Internal service funds are used by management to charge the cost of certain activities, such as vehicles and insurance to individual funds. The net revenue (loss) of the internal service funds is reported with governmental activities. Net income (loss) per fund statements $ (24,861,197) Plus current year allocation of internal service funds to business-type activities (653,838) (25,515,035) Report as a liability long-term debt obligations Debt issuance Debt provides current financial resources to governmental funds, but issuing debt increases long-term liabilities in the statement of net assets. Current year face value of debt issued (166,750,340) Governmental funds report the premium and discount as other financing sources/uses when debt is issued, but in the statement of activities these amounts are amortized to interest expense over the term of the debt. Current year (premium) discount on debt issued (28,470,407) Current year amortization & retirement of premium / discount 11,087,345 Governmental funds report the effect of gains and losses on refundings when the debt is first issued, but in the statement of activities these amounts are deferred and amortized. Current year refunding (gain) loss deferred 12,104,850 Current year amortization & retirement of deferred refunding gain / loss (1,934,413) Debt retirement Repayment of debt principal is an expenditure in the governmental funds, but the repayment reduces long-term liabilities in the statement of net assets and does not result in an expense. 254,319,989 The change in accrued liabilities reported as long-term obligations do not require the use of current financial resources and therefore are not reported in the governmental fund statements. (Increase) Decrease in arbitrage 'long term' accrued liability 1,419,222 (Increase) Decrease in Net OPEB Obligation (23,318,029) (Increase) Decrease in estimated self-insurance obligation (2,000,535) (Increase) Decrease in termination benefits 1,893,264 (Increase) Decrease in Net Pension Obligation (7,310,672) (Increase) Decrease in compensated absences liability (5,264,105) 45,776,169 14
61 Reconciliation of the Statement of Revenues, Expenditures, and Changes in Fund Balances of Governmental Funds to the Statement of Activities - Governmental Activities For the fiscal year ended September 30, 2012 Report as an asset the cost of general capital assets and accumulated depreciation Acquisition of capital assets Governmental funds report capital outlays as expenditures, but capital purchases increase assets in the statement of net assets and do not result in an expense. 144,338,142 Acquisition of capital assets from contributions do not generate current financial resources and therefore are not reported in the governmental fund statements as revenue. 4,301,789 Depreciation expense The cost of capital assets is allocated over their useful life as depreciation expense. However, depreciation does not require the use of current financial resources and therefore is not reported in the governmental fund statements. (111,175,642) Retirement of capital assets In the statement of activities, only the gain on the sale of capital assets is reported, whereas in the governmental funds, the proceeds from the sale increase financial resources. Thus, the change in net assets differs from the change in fund balance. (4,321,120) 33,143,169 Report other adjustments for converting from modified accrual to full accrual Net Increase (Decrease) in deferred issue costs: Current year debt issue costs deferred 645,637 Current year amortization & retirement of deferred issue costs (2,505,204) (1,859,567) Increase (Decrease) in inventory (494,911) Increase (Decrease) in accrued interest receivable (262,498) Increase (Decrease) in Net OPEB Obligation Asset 475,095 (Increase) Decrease in accrued interest payable 440,515 (Increase) Decrease in deferred revenue 1,129,090 (572,276) Increase (decrease) in net assets of governmental activities (page 5) $ 26,869,352 15
62 Statement of Net Assets Proprietary Funds September 30, 2012 Business-type Activities - Airports Water Utilities ASSETS Current assets: Cash and cash equivalents $ 48,708,981 $ 155,143,161 Cash and cash equivalents - restricted 186,145 17,266,327 Cash with fiscal agent - restricted 14,216,885 - Interest receivable - restricted - 688,000 Accounts receivable, net 2,479,007 15,496,560 Due from other county funds 347,605 2,447,874 Due from other governments 3,174,478 1,639,854 Due from component unit - - Inventory 1,244,288 6,950,276 Current portion of other receivables 134, ,327 Other assets 1,046, ,862 Total current assets 71,538, ,748,241 Noncurrent assets: Restricted assets: Cash and cash equivalents 63,015,304 10,002,200 Accounts receivable, net 1,739,966 - Total noncurrent restricted assets 64,755,270 10,002,200 Capital assets: Land 100,016,274 14,886,536 Buildings 354,852, ,899,151 Improvements other than buildings 222,957,115 1,184,553,650 Furniture, fixtures and equipment 41,463,078 69,942,922 Leasehold interest - 12,411,525 Goodwill - 6,915,903 Intangible - easement rights 13,754,957 1,660,856 Accumulated depreciation and amortization (376,840,754) (527,571,159) Construction in progress 24,238,160 15,399,963 Total capital assets 380,441, ,099,347 Investment in joint ventures - 49,123,038 Other receivables, noncurrent 216,762 16,183,784 Deferred debt issuance costs 1,322,896 1,541,736 Total noncurrent assets 446,736, ,950,105 Total assets $ 518,275,318 $ 1,156,698,346 The notes to the financial statements are an integral part of this statement. 16
63 Enterprise Funds Totals Governmental Activities Internal Service Funds $ 203,852,142 $ 92,493,342 17,452,472-14,216, ,000-17,975,567 2,199,360 2,795,479 4,354,336 4,814, ,534-3,008 8,194,564 1,536, ,927-1,332,570 4,117, ,286, ,888,333 73,017,504-1,739,966-74,757, ,902, ,752, ,558 1,407,510, , ,406,000 74,835,035 12,411,525-6,915,903-15,415,813 - (904,411,913) (52,028,629) 39,638,123-1,259,541,040 23,525,250 49,123,038-16,400,546-2,864,632-1,402,686,726 23,525,250 $ 1,674,973,664 $ 128,413,583 17
64 Statement of Net Assets Proprietary Funds September 30, 2012 Business-type Activities - Airports Water Utilities LIABILITIES Current liabilities payable from current assets: Vouchers payable and accrued liabilities $ 6,737,673 $ 6,166,267 Due to other county funds 241, ,777 Due to other governments 186,018 1,271,640 Due to component unit Unearned revenue 155,889 - Current portion of long-term debt 45,292 83,325 Compensated absences 53, ,000 Insurance claims payable - - Other liabilities 557,534 33,598 Total current liabilities payable from current assets 7,977,636 8,301,607 Current liabilities payable from restricted assets: Customers' deposits 163,900 6,105,645 Accounts and contracts payable 26,970 64,113 Current portion of long-term debt 10,995,000 6,465,000 Interest payable on bonds 3,217,160 4,631,569 Total current liabilities payable from restricted assets 14,403,030 17,266,327 Total current liabilities 22,380,666 25,567,934 Noncurrent liabilities: Due to other governments - 164,260 Compensated absences 1,029,773 2,795,837 Revenue bonds payable, net 110,503, ,207,183 Insurance claims payable and other long-term liabilities 76, ,000 Total noncurrent liabilities 111,609, ,277,280 Total liabilities 133,990, ,845,214 NET ASSETS Invested in capital assets, net of related debt 258,943, ,493,997 Restricted for: Debt service 13,230,155 6,465,000 Capital projects 49,228,432 1,000,000 Grants and other 10,311, ,000 Unrestricted 52,571, ,394,135 Total net assets $ 384,285,029 $ 940,853,132 Some amounts reported for business-type activities in the statement of net assets (page 2) are different because certain internal service fund assets and liabilities are included with business-type activities. Net assets of business-type activities The notes to the financial statements are an integral part of this statement. 18
65 Enterprise Funds Totals Governmental Activities Internal Service Funds $ 12,903,940 $ 4,121, ,665 16,782,645 1,457, , , ,617 34, , ,175, ,132-16,279,243 34,249,545 6,269,545-91,083-17,460,000-7,848,729-31,669,357-47,948,600 34,249, ,260-3,825, ,710, ,646 43,136, ,886,903 43,136, ,835,503 77,385, ,437,487 23,525,250 19,695,155-50,228,432-10,811, ,965,846 27,502,394 1,325,138,161 $ 51,027,644 4,609,516 $ 1,329,747,677 19
66 Statement of Revenues, Expenses, and Changes in Fund Net Assets Proprietary Funds For the fiscal year ended September 30, 2012 Business-type Activities - Airports Water Utilities Operating revenues: Charges for services $ 62,675,551 $ 148,390,799 Miscellaneous 2,802,345 5,379,318 Total operating revenues 65,477, ,770,117 Operating expenses: Aviation services 40,532,190 - Water and sewer services - 100,547,618 Transportation services - - Self-insurance services - - Equity interest in net loss of joint ventures - 1,007,748 Depreciation and amortization 26,933,358 39,716,768 Total operating expenses 67,465, ,272,134 Operating income (loss) (1,987,652) 12,497,983 Nonoperating revenues (expenses): Investment income 1,643,687 5,397,684 Guaranteed revenue - 4,010,517 Passenger facility charges 11,514,479 - Deferred issue costs (53,218) (120,421) Interest expense (6,434,318) (8,457,067) Other revenues (expenses) 407,666 3,407,754 Total nonoperating revenues (expenses) 7,078,296 4,238,467 Income (loss) before capital contributions, special item, and transfers 5,090,644 16,736,450 Capital contributions 7,943,252 18,250,296 Special item - contribution of cash and capital assets to Glades Utility Authority - (3,572,024) Transfers in 347,933 2,621,173 Transfers out (37,633) (100,000) Change in net assets 13,344,196 33,935,895 Net assets, October 1, ,940, ,917,237 Net assets, September 30, 2012 $ 384,285,029 $ 940,853,132 Some amounts reported for business-type activities in the statement of activities (page 5) are different because the net revenue (expense) of certain internal service funds is reported with business-type activities. Change in net assets of business-type activities The notes to the financial statements are an integral part of this statement. 20
67 Enterprise Funds Totals Governmental Activities Internal Service Funds $ 211,066,350 $ 110,369,219 8,181, ,248, ,369,219 40,532, ,547, ,922,956-91,156,572 1,007,748-66,650,126 8,371, ,737, ,450,580 10,510,331 (13,081,361) 7,041,371 2,335,050 4,010,517-11,514,479 - (173,639) - (14,891,385) - 3,815,420 3,438,056 11,316,763 5,773,106 21,827,094 (7,308,255) 26,193,548 15,785 (3,572,024) - 2,969, ,000 (137,633) (18,178,727) 47,280,091 (24,861,197) 75,888,841 $ 51,027, ,838 $ 47,933,929 21
68 Statement of Cash Flows Proprietary Funds For the fiscal year ended September 30, 2012 Business-type Activities - Airports Water Utilities Cash flows from operating activities: Cash received from customers $ 63,905,800 $ 145,951,348 Cash received from other funds for goods and services - - Cash payments to vendors for goods and services (13,801,188) (50,448,988) Cash payments to employees for services (10,378,557) (29,130,003) Cash payments to other funds (16,305,454) (20,470,076) Claims paid - - Other receipts 29,876 6,474,520 Net cash provided by operating activities 23,450,477 52,376,801 Cash flows from noncapital financing activities: Cash contributed to other governments - (3,914,110) Operating grants 360,760 - Transfers in 347, ,384 Transfers out (37,633) (100,000) Net cash (used in) noncapital financing activities 671,060 (3,825,726) Cash flows from capital and related financing activities: Proceeds from sale of capital assets 19, ,802 Contributed capital 7,231,642 17,458,046 Purchase and construction of capital assets (23,737,103) (21,983,370) Payments to joint ventures - (1,746,238) Principal payments on debt (10,270,000) (8,043,000) Interest payments on debt (6,729,580) (9,447,614) Paying agent fees - (4,183) Passenger facility charges received 10,394,081 - Net cash (used in) capital and related financing activities (23,091,836) (23,535,557) Cash flows from investing activities: Interest on investments 1,643,687 5,388,184 Receipt of repayments on other receivables 127,181 - Net cash provided by investing activities 1,770,868 5,388,184 Net increase (decrease) in cash and cash equivalents 2,800,569 30,403,702 Cash and cash equivalents, October 1, ,326, ,007,986 Cash and cash equivalents, September 30, 2012 $ 126,127,315 $ 182,411,688 The notes to the financial statements are an integral part of this statement. 22
69 Enterprise Funds Totals Governmental Activities Internal Service Funds $ 209,857,148 $ 12,690,168-97,312,825 (64,250,176) (29,409,946) (39,508,560) (6,783,150) (36,775,530) (2,488,251) - (74,559,729) 6,504,396 2,397,543 75,827,278 (840,540) (3,914,110) - 360, , ,000 (137,633) (1,499,411) (3,154,666) (889,411) 249,926 1,252,093 24,689,688 - (45,720,473) (4,368,527) (1,746,238) - (18,313,000) - (16,177,194) - (4,183) - 10,394,081 - (46,627,393) (3,116,434) 7,031,871 2,335, ,181-7,159,052 2,335,050 33,204,271 (2,511,335) 275,334,732 95,004,677 $ 308,539,003 $ 92,493,342 23
70 Statement of Cash Flows Proprietary Funds For the fiscal year ended September 30, 2012 Business-type Activities - Airports Water Utilities Reconciliation of operating income (loss) to net cash provided by operating activities: Operating income (loss) $ (1,987,652) $ 12,497,983 Adjustments to reconcile operating income to net cash provided by (used in) operating activities: Depreciation and amortization 26,933,358 39,716,768 Equity interest in net loss of joint ventures - 1,007,748 Provision for doubtful accounts - 283,500 Miscellaneous revenue 29,876 - Change in assets and liabilities: (Increase) in accounts receivable (973,661) (1,361,961) (Increase) decrease in due from other county funds (344,339) 23,054 (Increase) decrease in due from other governments - (1,072,956) (Increase) decrease in inventory (62,268) (197,781) (Increase) decrease in other assets 16,243 (25,475) Decrease in due from component unit - - Increase in vouchers payable and accrued liabilities 175,985 1,201,089 Increase in due to other county funds 29,528 53,190 Increase (decrease) in due to other governments (40,475) (Decrease) in other current liabilities (112,497) - (Decrease) in due to individuals - (Decrease) in unearned revenue (250,078) - (Decrease) in current portion of long-term debt - Increase (decrease) in customer deposits (4,018) 292,117 Increase in insurance claims payable - - Increase in other long-term liabilities - - Net cash provided by (used in) operating activities $ 23,450,477 $ 52,376,801 Supplemental disclosure of noncash capital and related financing activities: Amortization of deferred debt issuance costs $ 120,325 $ 120,421 Amortization of premium on bonds $ 225,794 $ 399,741 Amortization of deferred advance refunding loss $ 158,688 $ 77,708 Payables related to capital asset acquisition $ 2,528,515 $ 2,495,890 Contribution of capital assets $ - $ 7,435,785 Capitalized interest $ - $ 516,534 Disposal of fully depreciated capital assets $ 1,644,053 $ 1,648,758 The notes to the financial statements are an integral part of this statement. 24
71 Enterprise Funds Totals Governmental Activities Internal Service Funds $ 10,510,331 $ (13,081,361) 66,650,126 8,371,052 1,007, ,500-29,876 2,397,543 (2,335,622) (79,135) (321,285) (493,598) (1,072,956) 206,167 (260,049) 192,898 (9,232) 243, ,377, ,344 82,718 1,139 (40,475) 135,503 (112,497) - - (103,028) (250,078) - - (38,230) 288, , ,836 $ 75,827,278 $ (840,540) $ 240,746 $ - $ 625,535 $ - $ 236,396 $ - $ 5,024,405 $ - $ 7,435,785 $ 19,386 $ 516,534 $ - $ 3,292,811 $ 3,354,812 25
72 Statement of Fiduciary Net Assets - Agency Funds September 30, 2012 ASSETS Total Agency Funds Cash, cash equivalents, and investments $ 123,338,549 Accounts receivable, net 825,264 Due from other governments 1,457,523 Other assets 315 Total assets $ 125,621,651 LIABILITIES Vouchers payable and accrued liabilities $ 3,595,971 Due to other governments 40,035,833 Due to individuals 81,253,551 Other liabilities 736,296 Total liabilities $ 125,621,651 The notes to the financial statements are an integral part of this statement. 26
73 NOTES TO THE FINANCIAL STATEMENTS SEPTEMBER 30, 2012 INDEX 1. SUMMARY OF SIGNIFICANT ACCOUNTING POLICIES CASH AND INVESTMENTS RELATED PARTY TRANSACTIONS CAPITAL ASSETS INTERFUND TRANSFERS IN AND OUT RETIREMENT PLANS COMMITMENTS RISK MANAGEMENT OTHER POST EMPLOYMENT BENEFITS (OPEB) LEASES REFUNDING OF DEBT INTERFUND RECEIVABLE AND PAYABLE BALANCES LONG-TERM DEBT CONTINGENCIES PLEDGED REVENUES SUBSEQUENT EVENTS
74 NOTES TO THE FINANCIAL STATEMENTS SEPTEMBER 30, SUMMARY OF SIGNIFICANT ACCOUNTING POLICIES The financial statements of the Palm Beach County, Florida reporting entity (the County) have been prepared in conformity with accounting principles generally accepted in the United States (GAAP) as applied to governmental units. The Governmental Accounting Standards Board (GASB) is the accepted standard-setting body for establishing governmental accounting and financial reporting principles. The County s more significant accounting policies are described below. A. Financial Reporting Entity Palm Beach County is a political subdivision of the State of Florida pursuant to Article VIII, Section (1) of the Constitution of the State of Florida. It is governed by a seven member elected Board of County Commissioners (the Board) which is regulated by State Statutes and a local County Charter, operating under a County Manager form of government with separation of legislative and executive functions. In addition to the members of the Board, there are five elected Constitutional Officers: the Tax Collector, Property Appraiser, Clerk & Comptroller, Sheriff, and the Supervisor of Elections. The Board and the Constitutional Officers comprise the Palm Beach County primary government. As required by GAAP, these financial statements cover the Palm Beach County reporting entity which includes the Palm Beach County primary government as well as its component units. Component units are legally separate entities for which the primary government is financially accountable. In accordance with GASB Statement No. 14, The Financial Reporting Entity, Component units are either classified as blended component units or discretely presented component units, depending on the nature of the entity s relationship with the primary government. GASB Statement No. 14 provides the following criteria for determining whether or not an entity is a component unit of the reporting entity: The definition of the reporting entity is based primarily on the concept of financial accountability. A primary government is financially accountable for the organizations that make up its legal entity. It is also financially accountable for legally separate organizations if its officials appoint a voting majority of the separate organization s governing body and either is able to impose its will on that organization or there is the potential for the organization to provide specific financial benefits to, or to impose specific financial burdens on, the primary government. A primary government may also be financially accountable for governmental organizations that are fiscally dependent on it. A primary government has the ability to impose its will on an organization if it can significantly influence the programs, projects, activities of, or the level of services performed or provided by the organization. A financial benefit or burden relationship exists if the primary government is entitled to the organization s resources; is legally obligated or has otherwise assumed the obligations to finance the deficits of, or provide financial support to, the organization; or is obligated in some manner for the debt of the organization. Some organizations are included as component units because of their fiscal dependency on the primary government. An organization is fiscally dependent on the primary government if it is unable to adopt its budget, levy taxes or set rates or charges, or issue bonded debt without approval by the primary government. 28
75 NOTES TO THE FINANCIAL STATEMENTS SEPTEMBER 30, 2012 In addition, any entity, for which the primary government is not financially accountable but for which exclusion would cause the primary government s financial statements to be misleading, should be included as a component unit. In accordance with GASB Statement No. 39, Determining Whether Certain Organizations Are Component Units: an Amendment of GASB Statement No. 14, a government must include certain legally separate, tax-exempt entities in the government s financial reporting entity as discretely presented component units if they meet all three of the following conditions: (a) the economic resources received or held by the separate organization are entirely or almost entirely for the direct benefit of the primary government, its component units, or its constituents; (b) the primary government or its component units, are entitled to or have the ability to otherwise access a majority of the economic resources received or held by the separate organizations; or (c) the economic resources received or held by an individual organization that the specific primary government is entitled to, or has the ability to otherwise access, are significant to that primary government. GASB Statement No. 39 had no effect on determining the County s discretely presented component units and therefore had no effect on the financial statements. Based on the criteria specified above, the Palm Beach County reporting entity includes both blended component units and discretely presented component units. Blended Component Units The following organizations have been presented as blended component units because either (a) the organization s governing body is substantially the same as the governing body of the County and (1) there is a financial benefit or burden relationship between the primary government and component unit or (2) management of the primary government has operational responsibility, (b) the organization provides services almost entirely to the primary government and (c) the component unit s total debt outstanding is expected to be repaid entirely or almost entirely with resources of the primary government. Palm Beach County Public Building Corporation This corporation was created by Palm Beach County Ordinance pursuant to Article VIII, Section 1 (f) of the Constitution of the State of Florida and Sections (w) and , Florida Statutes. The corporation was incorporated on April 2, 1981 to provide financial assistance for and on behalf of the County by paying the costs of acquiring, constructing and equipping an Administrative Complex located at 301 North Olive Avenue in the City of West Palm Beach, Florida (the Project). The corporation also participates in certain activities incidental to such purpose, including the leasing of the Project to the County. This corporation currently has no fiscal activity. Transportation Authority (Palm Tran, Inc.) This corporation was created by Palm Beach County Resolution D pursuant to Chapter 617, Florida Statutes. Its purpose is to operate for the advancement of public transportation and lessening the burden on Palm Beach County to provide a transportation system. The Board of Palm Tran, Inc. consists of the seven members of the Board of County Commissioners of Palm Beach County. The bylaws provide that the corporation shall have a president to act as the corporation s chief executive officer who shall be the County Administrator, a secretary/treasurer who shall be the Clerk to the Board of County Commissioners or a 29
76 NOTES TO THE FINANCIAL STATEMENTS SEPTEMBER 30, 2012 deputy clerk designated for such purposes, and an executive director who shall be responsible for the day to day management and operations of the corporation. Palm Tran, Inc. is reported as a special revenue fund. Discretely Presented Component Units The Component Unit columns in the basic financial statements include the financial data of the County s discretely presented Component Units. They are reported in separate columns to emphasize that they are legally separate from the County. The following organizations are included in the reporting entity because the primary government (1) appointed a voting majority of the organization s board, (2) is able to impose its will on the organization, and (3) the organization provides services to the citizenry of Palm Beach County. Additionally, as a result of GASB Statement No. 61, the following four component units do not qualify to be reported as blended component units because (a) the governing body is not substantially the same as the primary government and (1) The Primary Government and the Component Unit are not financially interdependent (i.e. there is not a relationship of potential financial benefit or burden between them) and (2) Management is not responsible for the day-today operations of the component unit. (i.e. operational responsibility), (b) the component unit does not provide services entirely or almost entirely to the primary government, and (c) the component unit s total debt outstanding is not expected to be repaid entirely or almost entirely with resources of the primary government. Housing Finance Authority of Palm Beach County, Florida (HFA) This public authority was created by Palm Beach County Ordinance 79-3 pursuant to Chapter 159, Florida Statutes, as amended and supplemented. It was created to alleviate the shortage of housing available at affordable rates in Palm Beach County and the shortage of capital for investments in such housing. The HFA has the power to issue single family and multi-family revenue bonds to finance the purchase of housing by families of low and moderate income through investing in mortgage loans to eligible families. The HFA is presented as a proprietary fund type. The governing board of HFA is appointed by the Board of County Commissioners. Westgate/Belvedere Homes Community Redevelopment Agency (CRA) This agency was created by Palm Beach County Resolution pursuant to Section , Florida Statutes. It was created in order to develop and revitalize the blighted area known as Westgate/Belvedere Homes with intent to benefit Palm Beach County as a whole by returning improved property to the County s tax base. The CRA has the power to issue redevelopment revenue bonds from time to time to finance its undertaking of community redevelopment to the designated area. The CRA is presented as a governmental fund type. The Board of Directors of the CRA consists of seven members appointed by the Board of County Commissioners. Metropolitan Planning Organization (MPO) This organization was created by Palm Beach County Resolution pursuant to Section , Florida Statutes, as amended by Section , Florida Statutes. The members of the MPO are appointed by the Governor and consist of five members of the Board of County Commissioners, 30
77 NOTES TO THE FINANCIAL STATEMENTS SEPTEMBER 30, 2012 eleven members from local municipalities, and one member from the governing board of the Port of Palm Beach. The purpose of the MPO is to administer and execute the interlocal agreement providing for short-term and long-term planning for all modes of travel in order to benefit the citizens of Palm Beach County. The MPO is reported as a governmental fund type. Solid Waste Authority of Palm Beach County (SWA) The SWA is a dependent special district created under the Palm Beach County Solid Waste Act (the Act), Chapter , Laws of Florida. Chapter , Laws of Florida, became effective October 1, 1991 and amended Chapter by providing that the seven members of the Palm Beach County Board of County Commissioners shall serve as the governing board of the Authority. The Board of the SWA is responsible for adopting an annual, nonappropriated, operating budget as a financial plan for the year. The Act gives the SWA the power to construct and operate solid waste disposal facilities and to require that all solid waste collected by private and/or public agencies within the County for disposal in the County be delivered to processing and disposal facilities designated by the SWA. The SWA is reported as a proprietary fund type. Complete financial statements for each of the individual component units may be obtained at the respective entity s administrative offices. Palm Beach County Public Building Corporation 301 North Olive Avenue West Palm Beach, FL Solid Waste Authority of Palm Beach County 7501 North Jog Road West Palm Beach, FL Metropolitan Planning Organization 160 Australian Avenue, Suite 201 West Palm Beach, FL Housing Finance Authority of Palm Beach County 810 Datura Street West Palm Beach, FL Westgate/Belvedere Homes Community Redevelopment Agency 160 Australian Ave, Suite 500 West Palm Beach, FL Related Organizations The County s officials are also responsible for appointing the members of the boards of other organizations, but the County s accountability for these organizations do not extend beyond making the appointments. The following organizations are related organizations which have not been included in the reporting entity: Palm Beach County Educational Facilities Authority This organization was created by Palm Beach County Resolution pursuant to Chapter , Florida Statutes. Members of the authority are appointed by the Board of County Commissioners of Palm 31
78 NOTES TO THE FINANCIAL STATEMENTS SEPTEMBER 30, 2012 Beach County, but the County does not provide funding, has no obligation for the debt issued by the authority and cannot impose its will. Palm Beach County Health Facilities Authority This organization was created pursuant to Part III Chapter 154, Florida Statutes, and by Ordinance and adopted by the Board of County Commissioners. Members of the authority are appointed by the Board of County Commissioners of Palm Beach County, but the County does not provide the funding, has no obligation for the debt issued by the authority and cannot impose its will. Palm Beach County Workforce Development Board, Inc. This Board was created pursuant to Palm Beach County Resolution D, as amended by Resolutions D and Dm as a result of the enactment by the Florida Legislature of the Workforce Florida Act of Members of the board are appointed by the Board of County Commissioners of Palm Beach County, but the County does not provide the funding, has no obligation for the debt issued by the board and cannot impose its will. Equity Joint Ventures East Central Regional Wastewater Facility In September 1992, Palm Beach County entered into a thirty-year joint inter-local agreement (the Agreement) with four municipalities for the East Central Regional Wastewater Facility (the Facility). The Facility was created to receive, treat and dispose of sewage generated within each municipality and the County. Under GAAP, the County is required to account for this joint venture using the equity method. Accordingly, the County recorded its initial investment at cost and is required to record its proportionate share of the Facility s income or loss as well as additional contributions made or distributions received. Palm Beach County s interest in the joint venture is recorded in the County s Water Utilities Enterprise Fund. As of September 30, 2011, the Facility had total assets of $99,858,345 and total net assets of $90,465,911 including $68,993,982 invested in capital, net of debt, and $13,440,341 of unrestricted net assets. September 30, 2012 amounts are expected to approximate the above figures. As of September 30, 2012, the County s investment in this joint venture is $24.8 million. The Agreement provides for the establishment of a board comprised of one representative from each participating entity, with the City of West Palm Beach being designated to administer and operate the Facility. The Facility s board has the authority to accept and disburse funds, approve an annual budget, transact business, enter into contracts and decide all other matters related to the Facility. The proportionate share for each entity is determined by the reserve capacity of the Facility allocated to each participant. At September 30, 2012, Palm Beach County had a 34.29% interest. The participants and each entity s interest at September 30, 2012 are as follows: 32
79 NOTES TO THE FINANCIAL STATEMENTS SEPTEMBER 30, 2012 RESERVE CAPACITY PARTICIPANT PERCENTAGES City of West Palm Beach 29.29% Palm Beach County 34.29% City of Lake Worth 17.86% City of Riviera Beach 11.42% Town of Palm Beach 7.14% TOTAL % Separate financial statements for the Facility may be obtained at the following address: East Central Regional Wastewater Facilities City of West Palm Beach P.O. Box 3506 West Palm Beach, FL Biosolids Processing and Recycling Facility On September 23, 2003, the Board of County Commissioners, on behalf of the Water Utilities Department, entered into an interlocal agreement (Agreement) with the Solid Waste Authority (SWA) to fund a portion of the cost to design, build, and operate a Biosolids Processing and Recycling Facility (BPF). The BPF processes certain wastewater treatment residuals (biosolids) and is necessary to comply with increasingly stringent environmental regulations that have significantly decreased the number of land application sites available. Bulk land application was the method of disposing of the biosolids. The agreement is for a period of twenty years beginning with the August 1, 2009 operations commencement. Upon the conclusion of the term of the agreement, the BPF will remain the property of SWA with each participating entity owning its share of the BPF, in perpetuity, for the life of the plant. Under accounting principles generally accepted in the United States of America, the Department is required to account for this arrangement as a joint venture. Therefore, an asset is reported on the Water Utilities financial statements under the caption Investment in Joint Ventures. Since the BPF agreement does not state that the participants are to share in the profits and losses of the joint venture, the investment in joint venture account will not be adjusted to reflect the joint venture s results of operations. Rather, the investment in joint venture will be amortized using the straight line method over the twenty-year life of the agreement. The Department s 27.5% share resulted in pro rata obligations of $8.7 million for construction costs and $580,000 annually for operating expenses for the twenty-year period. The Department s operating costs were $1,150,200 for the year ended September 30, During the fiscal year ended September 30, 2012, zero was paid to SWA by the Department for its pro rata share of the construction costs and is shown as an asset investment in joint ventures on the statement of net assets. As of September 30, 2012, the County s investment in the BPF is $7.9 million. 33
80 NOTES TO THE FINANCIAL STATEMENTS SEPTEMBER 30, 2012 No separate financial statements are prepared for the BPF which is reported as part of SWA operations. SWA financial statements may be obtained from their office at 7501 North Jog Road, West Palm Beach, Florida, Non - Equity Joint Ventures Glades Utility Authority On June 16, 2009, the Glades Utility Authority (GUA) was established when the BCC adopted a Resolution determining that the transfer of certain utility assets to the GUA was in the public interest, as required under Section , Florida Statutes. This transaction was accounted for by the Department as a non-exchange transaction which recognized a $56.4 million contribution expense to other governments to reflect the $55.7 million transfer of the Lake Region Water Treatment Plant and $0.7 million in the Renewal & Replacement Fund for same to the GUA on October 1, The GUA, which began operations on October 1, 2009, is a regional partnership established through an interlocal agreement between the County and the Cities of Belle Glade, Pahokee and South Bay for the purpose of providing water, wastewater, and reclaimed water services to the residents of Belle Glade, Pahokee, and South Bay. The Governing Board (Board) for the GUA consists of seven members, one each from Pahokee and South Bay, two from Belle Glade and three from the County, each of whom shall be appointed by their respective entity except that one member appointed by the County must be a resident in the service area of the GUA. No elected officials may be appointed to the Board. Initially the Board members from the three Cities and the resident of the service area shall have one vote and each of the other County members shall have two votes each. The affirmative vote of members holding a majority of the votes shall be required for passage of any item provided the affirmative vote of at least one of the three cities shall be required for passage of the item. As such the County does not appoint a voting majority of the Board. As part of the formation of the GUA, the County agreed to provide a backup pledge on some of the debt which was being acquired and refinanced by the GUA. Through this backup pledge the County has become obligated in some manner for the debt of the GUA. However, the County has no equity interest in the GUA and as such this entity is reported as a Non-Equity Joint Venture of the County. The GUA is currently experiencing operating difficulties. If they have a default on their outstanding loans, described in Note 7- Commitments under Water Utilities, the County could be subject to a call on its back-up pledge. Separate financial statements for the GUA may be obtained by contacting the Water Utilities Department. Sunshine State Governmental Financing Commission The Sunshine State Governmental Financing Commission (the "Commission") was created in November As a joint venture among the member governmental units, the Commission enables a limited number of qualifying governments to participate in pooled debt financing with 34
81 NOTES TO THE FINANCIAL STATEMENTS SEPTEMBER 30, 2012 pricing and cost structures not normally available to governmental entities acting individually. The County has no current borrowings. Financial Statements may be obtained from the Commission. B. Basic Financial Statements The County s Basic Financial Statements contain three components; government-wide financial statements, fund financial statements and notes to the financial statements. Government-wide financial statements - The government-wide financial statements provide an overview of the County s financial position using the accrual basis of accounting. The Statement of Net Assets presents information on all of the assets and liabilities of the County as a whole, excluding fiduciary funds. The difference between assets and liabilities is reported as net assets. Changes in net assets may serve as an indicator of whether the financial position of the County is improving or deteriorating. The Statement of Activities presents information showing how the County s net assets changed during the fiscal year. All changes in net assets are reported as soon as the underlying economic transactions occur, regardless of when cash is received or paid. Therefore, some of the revenues or expenses reported in the Statement of Activities will have cash flows in future fiscal periods. For example, uncollected taxes are reported as revenues although cash receipts will occur in the future. Unused vacation leave results in an expense although related cash outflows will occur in the future. The government-wide financial statements presentation distinguishes between activities that are supported primarily by taxes and intergovernmental revenues (governmental activities) and activities that are intended to recover all or most of their costs through user fees and charges (business-type activities). The governmental activities of the County include general government, public safety, physical environment, transportation, economic environment, human services and culture and recreation. The business-type activities of the County include the Water Utilities Department and the Department of Airports. The government-wide financial statements include not only the County itself (the primary government) but also its discretely presented component units, the legally separate entities for which the County is financially accountable. Fund financial statements A fund is a grouping of related accounts that is used to maintain control over resources that have been segregated for specific activities or objectives. The County uses fund accounting to ensure and demonstrate compliance with legal, legislative, contractual, and other finance-related provisions. All of the funds of the County may be divided into three categories: governmental funds, proprietary funds, and fiduciary funds. Governmental funds Most of the County s basic services are reported in governmental funds, which focus on how money or other spendable financial resources flow into and out of those funds and the balances left at year-end that are available for spending. These funds are reported using the modified accrual basis of accounting, which measures cash and all other financial assets that can be readily converted to cash. The governmental fund statements provide a detailed short-term view of the County s general governmental operations and the basic services 35
82 NOTES TO THE FINANCIAL STATEMENTS SEPTEMBER 30, 2012 it provides. The measurement focus is based upon determination of changes in financial resources. Governmental fund information helps determine whether there are more or fewer financial resources that can be spent in the near future to finance the County s programs. The governmental fund category includes the general fund, special revenue funds, debt service funds, and capital project funds. There is a reconciliation of the governmental activities presented in the Statement of Net Assets and the Statement of Activities to the governmental funds presented in the fund financial statements. The following are definitions of the governmental fund types: General Fund: Used to account for and report all financial resources not accounted for and reported in another fund. Special Revenue Funds: Used to account for and report the proceeds of specific revenue sources that are restricted or committed to expenditures for specified purposes other than debt service or capital projects. The restricted or committed proceeds of specific revenue sources should be expected to continue to comprise a substantial portion of the inflows reported in the fund. The county uses a minimum of 50% as its definition of substantial. Capital Projects Funds: Used to account for and report financial resources that are restricted, committed or assigned to expenditures for capital outlays, including the acquisition or construction of capital facilities and other capital assets. Capital projects funds exclude those types of capital related outflows financed by proprietary funds or assets that will be held in trust for individuals, private organizations or other governments. Debt Service Funds: Used for and reports financial resources that are restricted, committed or assigned to expenditures for principal and interest. The following is a description of the County s major governmental funds: The General Fund is the primary operating fund of the County. It is used to account for all financial resources of the general government except those required to be accounted for in other funds. The General Fund is subdivided into the following categories representing each of the elected officials of the County: Board of County Commissioners (BOCC), Sheriff, Clerk & Comptroller, Tax Collector, Property Appraiser and the Supervisor of Elections. Special Revenue Funds: The Fire Rescue Special Revenue Fund is used to account for ad valorem taxes and other revenues designated for fire rescue services. The Community and Social Development Special Revenue Fund is used to account for governmental grant funds and other revenues designated for community and social services. 36
83 Capital Projects Funds: PALM BEACH COUNTY, FLORIDA NOTES TO THE FINANCIAL STATEMENTS SEPTEMBER 30, 2012 The Road Program Capital Projects Fund is used to account for costs related to the design and acquisition of rights of way and the construction of improvements to the County s major thoroughfare road system, primarily represented by the County s Five Year Road Program. The General Government Capital Projects Fund is used to account for costs of capital improvements not included in any other category. All other nonmajor governmental funds are aggregated into a single column for presentation purposes. Proprietary Funds The County maintains two different types of proprietary funds. Enterprise funds are used to report the same functions presented as business-type activities in the government-wide financial statements. The County uses enterprise funds to account for its Water Utilities Department and the Department of Airports. These two operations are considered to be major proprietary funds of the County. Internal Service Funds are used to accumulate and allocate costs internally among the County s other functions. The County uses internal service funds to account for Fleet Management and Risk Management programs. These programs are included in the governmental activities column of the government-wide financial statements because they predominantly benefit governmental rather than business-type functions. The measurement focus is based on changes in economic resources. The three internal service funds are aggregated into a single column for presentation in the proprietary fund financial statements. The County s two major proprietary funds are described below: The Water Utilities Department Fund is used to account for the operations of the water and wastewater system in the unincorporated areas of the County. Water and wastewater fees are determined annually by rate studies and are set at levels to recover the expenses of operations, including debt service, in a manner similar to private business enterprises. Activities necessary to provide water and wastewater service are accounted for in this fund, including customer service, engineering, operations and maintenance. The Department of Airports Fund is used to account for the operations of the four Countyowned airports Palm Beach International Airport in West Palm Beach and three general aviation airports located in Palm Beach Gardens, Lantana and Pahokee. Agency Funds are custodial in nature (assets equal liabilities) and do not measure results of operations. Agency funds are used to account for resources held by the government as an agent for individuals, private organizations and other governments. Assets held include cash bonds, purchasing bid bonds, security deposits, fines and forfeitures, tax deeds, tax payments, and license and registration payments. These funds are not included in the government-wide financial statements because the resources in these funds are not available to support the County s own programs. 37
84 NOTES TO THE FINANCIAL STATEMENTS SEPTEMBER 30, 2012 C. Measurement Focus and Basis of Accounting The accounting and financial reporting treatment for transactions is determined by the applicable measurement focus and basis of accounting. Measurement focus indicates the type of resources being measured such as current financial resources (current assets less current liabilities) or economic resources (all assets and liabilities). The basis of accounting indicates the timing of transactions or events for recognition in the financial reports. The government-wide and proprietary fund financial statements are presented using the economic resources measurement focus and the accrual basis of accounting. The governmental fund financial statements are presented using the current financial resources measurement focus and the modified accrual basis of accounting. The Agency fund financial statements are presented using the accrual basis of accounting. With the economic resources measurement focus, all assets and liabilities associated with the operation of these funds are included on the balance sheet. With the accrual method of accounting, revenues are recorded when earned and expenses are recorded at the time liabilities are incurred. Government-wide financial statements and proprietary fund financial statements show increases (revenues) and decreases (expenses) in net assets. Governmental fund financial statements are presented using the current financial resources and the modified accrual basis of accounting. With this measurement focus, only current assets and current liabilities are generally included on the balance sheet. Operating statements of these funds show increases (i.e. revenues and other financing resources) and decreases (i.e. expenditures and other financing uses) in net current assets. Under the modified accrual basis of accounting, revenues are recorded when susceptible to accrual, that is, when they become both measurable and available to pay liabilities of the current period. For this purpose, the County considers revenue to be available if they are collected within 60 days of year-end. Revenues not considered available are recorded as deferred revenues. Property taxes when levied, intergovernmental revenue when all eligibility requirements have been met, franchise fees, utility taxes, licenses and permits, charges for services and investment income associated with the current fiscal period are all considered to be susceptible to accrual and so have been recognized as revenues of the current fiscal period. Expenditures generally are recorded when a liability is incurred; however, debt service expenditures, as well as expenditures related to compensated absences, claims and judgments, and other postemployment benefits are recorded only when payment is due. D. Cash and Investments Additional information is provided in Note 2, Cash and Investments. Deposits All deposits are held in qualified public depositories pursuant to the Florida Statutes, Chapter 280, "Florida Security for Public Deposits Act" and are covered by either federal depository insurance or collateral held by the Chief Financial Officer of Florida. 38
85 NOTES TO THE FINANCIAL STATEMENTS SEPTEMBER 30, 2012 In the event of a default by a qualified public depository, all claims for government deposits would be satisfied by the Chief Financial Officer of Florida from the proceeds of federal deposit insurance, pledged collateral of the public depository in default and, if necessary, a pro rata assessment to the other qualified public depositories in the collateral pool. Cash Equivalents Highly liquid investments with maturities of three months or less when purchased are reported as cash equivalents. The County maintains an internal investment pool for substantially all funds. Earnings are allocated daily to each fund based on their equity balances in the pool. Each fund reports their equity in the County s internal investment pool as a cash equivalent. Investments All investments are reported at fair value except for the following which are reported at amortized cost as permitted by GASB Statement No. 31, Accounting and Financial Reporting for Certain Investments and for External Investment Pools: - Florida Prime Investment Pool - Money Market Mutual Funds. State statutes and local ordinances authorize County investments in obligations of the U.S. Government, its agencies and instrumentalities, repurchase agreements, interest-bearing time deposits, savings accounts, Florida Prime Investment Pool (formerly known as the Local Government Surplus funds Trust Fund LGIP administered by the State Board of Administration), the Florida Local Government Investment Trust (FLGIT), collateralized mortgage obligations (CMO), certain corporate securities, instruments backed by the full faith and credit of the State of Israel, bankers acceptances, and money market mutual funds. State statutes authorize Solid Waste Authority (SWA) investments in the Florida Prime Investment Pool (formerly known as the Local Government Surplus funds Trust Fund LGIP administered by the State Board of Administration), interest-bearing time deposits, savings accounts, negotiable direct obligations of or obligations unconditionally guaranteed by the U.S. Government, obligations of the Federal Farm Credit Banks, the Federal Home Loan Mortgage Corporation, the Federal Home Loan Bank or its districts, interest rate swap agreements, and obligations guaranteed by the Government National Mortgage Association and obligations of the Federal National Mortgage Association and mutual funds limited to U.S. Government securities. The following external investment pools are not SEC-registered: The State Board of Administration (SBA) administers the Florida Prime Investment Pool (formerly known as the Local Government Surplus funds Trust Fund LGIP) and the Fund B Surplus Funds Trust Fund (Fund B), both of which are governed by Chapter 19-7 of the Florida Administrative Code and Chapters 218 and 215 of the Florida Statutes. The Florida Prime Investment Pool is an external investment pool operated in a manner consistent with the SEC s Rule 2a7 of the Investment Company Act of The Fund B is accounted for as a fluctuating net asset value pool. The Fund B is not subject to participant withdrawal requests. Distributions 39
86 NOTES TO THE FINANCIAL STATEMENTS SEPTEMBER 30, 2012 from Fund B, as determined by the SBA, are affected by transferring eligible cash or securities to the Florida Prime Investment Pool, consistent with the pro rata allocation of pool shareholders of record at the creation of Fund B. One hundred percent of such distributions from Fund B are available as liquid balance within the Florida Prime Investment Pool. The investments in the Florida Prime Investment Pool and Fund B are not insured by FDIC or any other governmental agency. Regulatory oversight of the State Board of Administration is provided by three elected officials who are accountable to the electorate: the Governor of the State of Florida, as Chairman; the Chief Financial Officer of Florida, as Treasurer; and the State Comptroller, as Secretary. External oversight of the State Board of Administration is provided by the Investment Advisory Council which reviews the investments made by the staff of the Board of Administration and makes recommendations to the Board regarding investment policy, strategy, and procedures. Audit oversight is provided by the Florida Auditor General s Office. The Florida Local Government Investment Trust (FLGIT) is a local government investment pool developed jointly by the Florida Association of Court Clerks and the Florida Association of Counties. The FLGIT has no regulatory oversight, but has been recognized by an Internal Revenue Service private letter ruling as a tax-exempt organization, has received a Standard and Poor s rating and is governed by a six member Board of Trustees. The share price of this investment represents the fair value of the fund s underlying investments. E. Accounts and Other Receivables Accounts receivable are recorded net of allowances for bad debts. Allowance for uncollectible receivables is based upon historical trends and the periodic aging of receivables. These allowances relate to the enterprise funds and are not significant. Billings to water utility customers are based on metered consumption which is determined at various dates each month. Estimated unbilled consumption at year-end is recognized as revenue in the Water Utilities Fund. Other receivables include low income housing loans to individuals and developers, a loan to the convention center and a contribution receivable from FAU as part of the Scripps project and Fire Rescue ambulatory services. The allowance for uncollectible receivables for Fire Rescue services is based on historic trends and analysis of current economic factors. As of September 30, 2012 there was an allowance of $19.3M for these receivables. F. Inventories and Prepaid Items Inventories consisting primarily of materials and supplies are stated at cost based upon the firstin, first-out method. Purchases of inventories for governmental funds are reported as expenditures in the period purchased, except for the Sheriff, which is accounted for using the consumption method. Inventories for governmental fund types, which use the purchases method, are reported on the governmental funds balance sheet as an asset of the fund with a corresponding amount recorded as non-spendable fund balance. Inventories of proprietary type funds are reported as an expense when consumed in the operations of the fund. Certain payments to vendors reflect costs applicable to future accounting periods and are recorded as prepaid items in both government-wide and fund financial statements. Expenditures for insurance and similar services extending over more than one accounting period are accounted for as expenditures of the period of acquisition. 40
87 NOTES TO THE FINANCIAL STATEMENTS SEPTEMBER 30, 2012 G. Restricted Assets Assets are reported separately as restricted in proprietary funds and the entity-wide statement of net assets when restrictions on asset use change the nature or normal understanding of the availability of the asset. Consistent with this principle, the following assets are reported as restricted assets: 1. Assets that are restricted as to withdrawal or use for other than current operations. 2. Assets that are restricted for expenditure in the acquisition or construction of noncurrent assets. H. Capital Assets Property, plant, and equipment and infrastructure assets (such as roads, sidewalks, bridges, and drainage systems) are reported in the applicable governmental or business-type activities columns of the government-wide financial statements and proprietary fund financial statements. All work in process for the current fiscal year has been capitalized as Construction In Progress as the related projects have not yet been completed. Capital assets are defined as those assets with an initial, individual cost of over $1,000. Contributed capital assets are recorded at their estimated fair value at the time received. The costs of normal maintenance and repairs that do not add to the value of the asset or materially extend asset lives are not capitalized. In addition, for business-type activities and enterprise funds, net interest costs are capitalized on projects during the construction period. Depreciation is calculated using the straight-line method over estimated useful lives as follows: Asset Classification Estimated Useful Life (In Years) Buildings, Utility Plants and Systems Furniture, Fixtures and Equipment 2-15 Improvements Other Than Buildings 5-20 Infrastructure In the governmental fund financial statements, the costs associated with the acquisition or construction of capital assets are shown as capital outlay expenditures. Capital assets are not shown on the governmental fund balance sheets. Goodwill is determined based on the difference between the acquisition price and the fair value of all assets acquired. Amortization of goodwill related to the utility system acquisition is also computed on the straight-line method. The Water Utilities Department has two items of goodwill: 1) the goodwill resulting from the acquisition of the Village of Royal Palm Beach s Utility System is amortized over 30 years which represents the period the bonds issued to fund the acquisition will be outstanding, and 2) the goodwill resulting from the acquisition of the Indian Trail Improvement District Utility System is amortized over 40 years. 41
88 I. Compensated Absences PALM BEACH COUNTY, FLORIDA NOTES TO THE FINANCIAL STATEMENTS SEPTEMBER 30, 2012 In accordance with GASB Statement No. 16, Accounting for Compensated Absences, the County accrues a liability for compensated absences, as well as certain other salary-related costs associated with the payment of compensated absences. Vacation leave is accrued as a liability as the benefits are earned by the employees. Sick leave is also accrued as a liability as the benefits are earned by the employees, but only to the extent that it is probable that the County will compensate the employees for the benefits through cash payments at termination or retirement. Under the accrual basis of accounting used in the government-wide financial statements and the separate proprietary fund financial statements, the entire compensated absences liability (longterm and short-term) is reported when earned as described above. A liability for these amounts is reported in governmental funds only if they have matured, for example, as a result of employee resignation and retirements. J. Deferred Debt Issuance Costs, Bond Discounts, Premiums and Deferred Amounts on Refunding At the government-wide level and in the proprietary funds, expenses incurred in connection with the issuance of long-term debt, as well as bond discounts, premiums and deferred amounts on refunding, are deferred and amortized over the term of the related financing using a method that approximates the effective interest method. For governmental funds, these costs are reported in the period the transaction occurs. K. Self-Insurance The County maintains a Risk Management (Workers Compensation) self-insurance program, a Casualty self-insurance program, and an Employee health self-insurance program which are accounted for as internal service funds. The County has elected to essentially self-insure itself for health benefits to County employees and employees of component units of the County electing to participate in the plan. The plan covers approximately 4,500 participants. The three (3) self-insurance programs are designed to be self-sustaining through actuarially determined premiums established annually to cover expected claims, administration and a margin for unexpected losses or expenses. Claims are recorded as incurred with an estimate added at year-end based on an actuarially determined estimate of incurred but not reported claims. L. Financial Reporting for Government-wide and Proprietary Funds Private-sector standards of accounting and financial reporting issued prior to December 1, 1989, generally are followed in both the government-wide and proprietary fund financial statements to the extent that those standards do not conflict with or contradict guidance of the Government Accounting Standards Board. Governments also have the option of following subsequent privatesector guidance for their business-type activities and enterprise funds, subject to the same limitation. The government has elected not to follow subsequent private-sector guidance. 42
89 NOTES TO THE FINANCIAL STATEMENTS SEPTEMBER 30, 2012 M. Pension and Other Post-Employment Benefits Disclosure The County applies GASB Statement No. 27, Accounting for Pensions by State and Local Government Employers, for the measurement, recognition, and display of pension expenditures or expenses as discussed in a subsequent note. The County applies GASB Statement No. 45, Accounting and Financial Reporting by Employers for Postemployment Benefits Other Than Pensions, for the measurement, recognition, and display of OPEB expenditures or expenses, liabilities and assets as discussed in a subsequent note. N. Elimination of Internal Activity In the government-wide Statement of Activities, interfund activity, such as transfers in and out as well as transfers within the Internal Service Funds and within the Governmental Activities category is eliminated. Interfund activity between governmental and business-type activities is not eliminated. Interfund services provided and used between functions are not eliminated because removing interfund services would distort the functional expenses presented in the Statement of Activities. O. Program Revenues Amounts reported as program revenues include 1) charges to customers or applicants for goods, services, or privileges provided, 2) operating grants and contributions, and 3) capital grants and contributions, including special assessments. Internally dedicated resources are reported as general revenues rather than as program revenues. Likewise, general revenues include all taxes. P. Budgets BOARD OF COUNTY COMMISSIONERS Pursuant to Chapter 129, Florida Statutes, General Budget Policies, the following procedures are followed by the Board of County Commissioners in establishing, adopting and maintaining the operating budget. 1. On or before July 15, the County Administrator, through the Office of Financial Management and Budget (OFMB) submits to the Board of County Commissioners a tentative budget for the fiscal year commencing the following October 1. This is a detailed plan outlining all programs and estimated departmental revenues and expenditures for the upcoming year. 2. Taxpayers are informed of the proposed budget and tentative millage rates through advertising and public hearings which are held to elicit taxpayer comments. 3. The budget is legally adopted through Board of County Commission action for the fiscal year beginning October 1. 43
90 NOTES TO THE FINANCIAL STATEMENTS SEPTEMBER 30, The Board at any time within a fiscal year may amend a budget for that year as follows: a. Appropriations for expenditures in any fund may be decreased and other appropriations in the same fund correspondingly increased by action recorded in the minutes, provided that the total of the appropriations of the fund are not changed. The Board of County Commissioners, however, may establish procedures by which the designated budget officer may authorize certain intradepartmental budget amendments, provided that the total appropriation of the department shall not be changed. b. Appropriations from reserves may be made to increase appropriations by resolution of the Board, but no expenditures shall be directly charged to any reserve. c. A receipt from a source not anticipated in the budget and received for a particular purpose including, but not limited to, grants, donations, gifts or reimbursements for damages may, by resolution of the Board recorded in its minutes, be appropriated and expended for that purpose, in addition to the appropriations and expenditures provided for in the budget. Such receipts and appropriations shall be added to the budget in the proper fund. During fiscal year 2012, supplemental appropriations amounted to a net increase of $346,580,204, or approximately 8.8% of the original budget. 5. It is unlawful for the Board to expend or contract for the expenditures in any fiscal year more than the amount budgeted in each individual fund s budget, and in no case shall the total appropriations of any budget be exceeded. In addition, to comply with the above statutory requirements, the Board of County Commissioners has elected to adopt management controls and approved guidelines, which provide for the budget to be controlled at a detail level greater than the statutory level of control. This control (effective legal level) is maintained at the fund/department level. A separate detailed report providing this information is available for inspection at OFMB. Annual budgets are legally adopted for all governmental and proprietary fund types. Budgetary comparisons presented herein are on a basis consistent with GAAP. CLERK OF THE CIRCUIT COURT Chapter , Florida Statutes, governs the preparation, adoption and administration of the Clerk & Comptroller s (the Clerk) annual budget. The Clerk, as county fee officer, establishes an annual budget for her office, which clearly reflects the revenues available to the office and the functions for which the money is to be expended. The Clerk, functioning in her capacity as Clerk of the Circuit and County Courts and as Clerk of the Board of County Commissioners, prepares her budget in two parts: 1. The budget for funds necessary to perform court-related functions as provided for in Florida Statute 28.36, which details the methodologies used to apportion costs between court-related and non-court-related functions performed by the clerk. 44
91 NOTES TO THE FINANCIAL STATEMENTS SEPTEMBER 30, The budget relating to the requirements of the Clerk as Clerk of the Board of County Commissioners, County Auditor, and Custodian or Treasurer of all county funds and other county related duties. SHERIFF Chapter 30.49, Florida Statutes, governs the preparation, adoption and administration of the Sheriff s annual budget. By May 1 each year, the Sheriff shall certify to the Board a proposed budget of expenditures for performing the duties of his office for the ensuing fiscal year. The Sheriff s budget is legally adopted by Board of County Commission action for the fiscal year beginning October 1. TAX COLLECTOR AND PROPERTY APPRAISER Chapter , Florida Statutes, governs the preparation, adoption and administration of the budgets of the Tax Collector and Property Appraiser. On or before a legally designated date each year, the Tax Collector and the Property Appraiser shall submit to the Florida Department of Revenue a budget for the ensuing fiscal year. A copy of such budget shall be furnished at the same time to the Board of County Commissioners. Final approval of the budgets is given by the Florida Department of Revenue. SUPERVISOR OF ELECTIONS Chapter 129, (sections.02 and.202), Florida Statutes, governs the preparation, adoption and administration of the budget of the Supervisor of Elections. On or before June 1 of each year, the Supervisor of Elections shall submit to the Board of County Commissioners a tentative budget for the ensuing fiscal year. However, the Board of County Commissioners of Palm Beach County, by resolution R , requires the tentative budget to be submitted by May 1 of each year. Q. Encumbrances The County uses encumbrance accounting, under which purchase orders, contracts and other commitments for the expenditure of funds are recorded to reserve that portion of the applicable appropriation. Encumbrances represent the estimated amount of expenditures ultimately to result if unperformed contracts and open purchase orders are completed. Although encumbrances lapse at year-end, it is the County s intention to substantially honor these encumbrances under the authority provided in the subsequent year s budget. Refer to Note 7 for more information. R. Operating versus Non-operating Revenues and Expenses Proprietary funds distinguish operating revenues and expenses from non-operating items. Operating revenues and expenses generally result from providing services and producing and delivering goods in connection with the fund s principal ongoing operations. The principal operating revenues of the County s Enterprise and Internal Service funds are charges to customers for sales and services. Operating revenues for the Enterprise Funds include water and wastewater service fees, as well as airport fees and charges. For the Internal Service funds, 45
92 NOTES TO THE FINANCIAL STATEMENTS SEPTEMBER 30, 2012 operating revenues include charges to other departments for various maintenance, communications and insurance services. Operating expenses for the Enterprise and Internal Service Funds include costs of sales and services, administrative fees, insurance payments and depreciation. All revenues and expenses not meeting this definition are considered nonoperating items. S. Fund Balance Fund balances are reported in classifications based on whether the amounts are non-spendable or spendable. Non-spendable fund balances include amounts that cannot be spent because they are either (a) not in spendable form or (b) legally or contractually required to be maintained intact. Spendable amounts are classified based on the extent to which there are external and/or internal constraints in how the fund balance amounts may be spent. Amounts that are restricted to specific purposes either by constraints (a) placed on the use of resources by creditors, grantors, contributors, or laws or regulations of other governments or (b) imposed by law through constitutional provisions or enabling legislation are classified as restricted fund balances. Amounts that are constrained for specific purposes that are internally imposed by the County s highest level of decision making authority, the Board of County Commissioners (BOCC), are classified as committed fund balances. Formal action in the form of a County Ordinance must be taken by the BOCC prior to the end of the fiscal year. The same formal action must be taken by the BOCC to remove or change the limitations placed on the funds. Amounts that are constrained by the County s intent to be used for specific purposes but are neither restricted nor committed are classified as assigned fund balances. Assignments are made by the County Administrator or his designee. Palm Beach County is a Charter County and operates under a County Manager form of Government (as previously stated in Note 1, Section A, Financial Reporting Entity). As such, the County Administrator is responsible for preparing and managing the County s budget along with the establishment and classification of all its funds. Unassigned fund balance represents fund balance that has not been assigned to other funds and that has not been restricted, committed, or assigned to specific purposes within the general fund. Unassigned fund balance also includes any deficit fund balance of other governmental funds. When both restricted and unrestricted resources are available for use, it is the County s policy to use restricted resources first, then unrestricted resources as they are needed. When unrestricted resources are available for use it is the County s policy to use committed resources first, then assigned resources and then unassigned resources as they are needed. 46
93 NOTES TO THE FINANCIAL STATEMENTS SEPTEMBER 30, 2012 The County has not formally adopted a minimum fund balance policy. T. Net Assets Invested in capital assets, net of related debt is that portion of net assets that relates to the County s capital assets, reduced by debt outstanding used to purchase or construct the capital assets. The related debt is reduced by any unspent proceeds that are outstanding at fiscal yearend. Restricted net assets is that portion of net assets that has been restricted from general use by external parties (creditors, grantors, contributors, or laws or regulations of other governments) or imposed by law through constitutional provisions or enabling legislation. Unrestricted net assets is that portion of net assets that is neither restricted nor invested in capital assets (net of related debt). When both restricted and unrestricted resources are available for use, it is the County s policy to use restricted resources first, then unrestricted resources as they are needed. The entity-wide statement of net assets (government activities) reports $607,934,453 of restricted net assets, of which $183,180,756 is restricted by enabling legislation. U. Property Tax Taxes in Palm Beach County are levied by the Board of County Commissioners for the County. The millage levies are determined on the basis of estimates or revenue needs and the total taxable valuations within the jurisdiction of the Board of County Commissioners. No aggregate ad valorem tax millage (in excess of 10 mills on the dollar) is levied against property of the County as specified in Chapter , Florida Statutes. Each year the total taxable valuation is established by the County Property Appraiser and the list of property assessments is submitted to the State Department of Revenue for approval. County ad valorem taxes are a lien on the property against which they are assessed from January 1 of the year of assessment until paid or barred by operation of law (statute of limitations). Taxes are levied on October 1, become due and payable on November 1 of each year, or as soon thereafter as the assessment roll is opened for collection, and are delinquent on April 1 of the following year. Pursuant to Florida law, the Tax Collector advertises and sells tax certificates on all real property for which there are unpaid taxes. Accordingly, there is no property taxes receivable as of September 30, For the 2010 tax roll year, the assessment roll was opened for collection on November 1, 2011, and discounts for payment prior to April 1, 2012, were determined as follows: 47
94 NOTES TO THE FINANCIAL STATEMENTS SEPTEMBER 30, % if paid in November % if paid in December % if paid in January % if paid in Februrary 2012 V. Interest Costs Interest cost incurred by proprietary funds for the fiscal year ended September 30, 2012 amounted to $15,407,919, of which $516,534 was capitalized. 2. CASH AND INVESTMENTS Additional cash and investment information is provided in Note 1, paragraph D (Summary of Significant Accounting Policies - Cash and Investments). At September 30, 2012 the cash and investments consisted of the following: Bank Balance Carrying Value Investments Deposits in Financial Institutions $ 399,601,957 $ 380,369,365 $ - Cash on hand 373,526 - Internal Investment Pool 1,257,127,565 1,245,657,204 Cash Equivalents 66,487,659 66,487,659 Fund Investments 121, ,204 Total $ 1,704,479,319 $ 1,312,266,067 The carrying value of the internal investment pool includes cash, accrued interest receivable, and investments. 48
95 NOTES TO THE FINANCIAL STATEMENTS SEPTEMBER 30, 2012 Cash and investments are reported in the financial statements as follows: Statement of Net Assets Primary Government Cash, cash equivalents & investments $ 1,057,289,929 Restricted cash, cash equivalents & investments 523,850,841 Statement of Fiduciary Net Assets $ 1,581,140,770 Agency Funds Cash & cash equivalents $ 123,338, ,338,549 $ 1,704,479,319 Maturity in Years Investment Type 2 Years but 5 Years but Fair Value Less Than 2 Years Less Than 5 Years Less Than 9 Years Investments subject to interest rate risk Adjustable Rate Securities $ 334,911,638 $ - $ 315,646,825 $ 19,264,813 Collateralized Mortgage Obligations 275,619,231 19,621, ,994,373 21,003,192 Mortgage Backed Securities 260,776,489 1,689, ,043,066 36,043,630 Debenture Participation Certificates 196,279,332-20,435, ,844,087 Callable Bonds 81,973, ,973,704 Corporate Notes 37,791,985 20,044,240-17,747,745 Florida Local Govt Investment Trust 30,236,785-30,236,785 - Indexed Amortization Notes 15,029,121 15,029, Foreign Government Bonds 12,935,840 12,935, Fund B Surplus Funds Trust Fund (SBA) 81, ,332 1,245,635,457 $ 69,320,660 $ 824,356,294 $ 351,958,503 Other Investments Money Market Mutual Funds 65,237,282 Florida Prime Investment Pool (SBA) 1,393,328 $ 1,312,266,067 Interest Rate Risk Interest rate risk is the risk that changes in interest rates will adversely affect the fair value of an investment. In accordance with the County Investment Policy, the Clerk & Comptroller manages the County s internal investment pool s exposure to declines in fair values by managing overall effective duration appropriate to the risk tolerance in meeting stated objectives. The Policy states that at the time of purchase, the County s investments must have a final maturity or average life of 10 years or less. 49
96 NOTES TO THE FINANCIAL STATEMENTS SEPTEMBER 30, 2012 Credit Risk Credit risk is the risk that an issuer will not fulfill its obligations. Percentage of Total Portfolio Standard & Poor's Investment Rating Service Investments Fair Value U.S Government Sponsored Enterprises (GSE) $696,052, % AA+ U.S. Treasuries & Guaranteed Agencies 468,537, % AA+ Money Market Mutual Funds 65,237, % AAAm Corporate Securities 37,791, % AA+ Florida Local Govt Investment Trust 30,236, % AAAf Foreign Government Bonds 12,935, % A-1 Florida Prime Investment Pool (SBA) 1,393, % AAAm Fund B Surplus Funds Trust Fund (SBA) 81, % Not rated $1,312,266, % Ratings by Moody's or Fitch were no lower than as indicated above by Standard and Poor's. Some securities were not rated by Moody's and Fitch. In accordance with the County s Investment Policy for the internal investment pool, investments in commercial paper and bankers acceptances are limited to ratings of A-1 or P-1 or higher by Standard and Poor s and Moody s respectively. Investments in corporate securities are limited to ratings of AA or higher by Standard and Poor s and Moody s. Policy allows for the timely and appropriate disposal when an investment credit rating falls below a minimum threshold. Corporate securities are limited to no more than 20% of the investment pool s total market value, excluding commercial paper, which is limited to 25% of the total market value. No-load money market mutual funds are allowable if rated in the highest rating category of a Nationally Recognized Statistical Rating Organization (NRSRO). Investments in collateralized mortgage obligations (CMO) are limited to 20% of total value of the County s internal investment pool. Investments in IO (interest only), PO (principal only), inverse floaters, other volatile CMO types, and corporate convertible securities are all prohibited. All CMO issues must pass the Federal Financial Institutions Examination Council (FFIEC) High Risk Security Test on a quarterly basis, or as specified in any Trust Indenture. Custodial Credit Risk- Investments This type of risk would arise in the event of the failure of a custodian of County investments, after which the government would not be able to recover the value of its investments that are in the possession of the third party custodian. 50
97 NOTES TO THE FINANCIAL STATEMENTS SEPTEMBER 30, 2012 To guard against this risk, the County s investment policy for the internal investment pool requires that all securities be insured or registered in the name of the County and held by a third party custodial institution, with capital and surplus stock of at least $500 million and a separate custody account at the Federal Reserve Bank (FED) specifically designated by the FED as restricted for the safekeeping of the member-bank s customer-owned securities only. All securities purchased or sold are transferred delivery versus payment (D.V.P.) or payment versus delivery to ensure that funds or securities are not released until all criteria relating to the specific transactions are met. Concentration Risk Concentration of credit risk is the risk of loss attributed to the magnitude of an investment in a single issuer. Investment Issuer Fair Value Percentage of Total Federal National Mortgage Association (Fannie Mae) $ 432,473, % Small Business Administration 317,376, % Federal Home Loan Mortgage Company (Freddie Mac) 248,550, % Government National Mortgage Association (Ginnie Mae) 151,161, % Invesco AIM Institutional Money Market Fund 48,017, % Other combined- less than 2% per issuer 46,659, % General Electric 37,791, % Florida Local Government Investment Trust (FLGIT) 30,236, % $ 1,312,266, % The County s investment policy for the internal investment pool limits investments in corporate securities to 2% of total pool market value per single issuer at time of purchase. Foreign Currency Risk: Foreign currency risk is the risk that changes in exchange rates will adversely affect the fair value of an investment. There was no exposure to foreign currency risk. The County investment in foreign bonds is denominated in U.S. dollars. 51
98 NOTES TO THE FINANCIAL STATEMENTS SEPTEMBER 30, 2012 COMPONENT UNIT Solid Waste Authority (SWA) Cash and Cash Equivalents: The bank balance and carrying value of the SWA s cash and cash equivalents, including restricted balances, were as follows at September 30, 2012: Bank balance of deposits with financial institutions $ 8,176,122 Carrying value Deposits with financial institutions Petty cash Money market mutual funds Florida Prime Total cash and cash equivalents $ 8,139,541 9, ,180, ,648,644 $ 448,977,884 The deposits with financial institutions were entirely covered by a combination of federal depository insurance and a collateral pool pledged to the State Treasurer of Florida by financial institutions that comply with the requirements of Florida Statutes and have been designated as a qualified public depository by the State Treasurer. Qualified public depositories are required to pledge collateral to the State Treasurer with a fair value equal to a percentage of the average daily balance of all government deposits in excess of any federal deposit insurance. In the event of a default by a qualified public depository, all claims for government deposits would be satisfied by the State Treasurer from the proceeds of federal deposit insurance, pledged collateral of the public depository in default and, if necessary, a pro rata assessment to the other qualified public depositories in the collateral pool. Accordingly, all deposits with financial institutions are considered fully insured in accordance with pronouncements of the Governmental Accounting Standards Board. The money market mutual funds consist of investments with financial institutions in open end, institutional, money market funds complying with Securities and Exchange Commission (SEC) Rule 2a7 and investing only in U.S. Government and Agency obligations and repurchase and reverse repurchase agreements collateralized by U.S. Government and Agency obligations. Rule 2a7 allows SEC registered mutual funds to use amortized cost rather than fair value to report net assets used to compute share prices if certain conditions are met. Those conditions include restrictions on the types of investments held, restrictions on the term-to-maturity of individual investments and the dollar-weighted average of the portfolio, requirements for portfolio diversification, and requirements for divestiture considerations in the event of security downgrades and defaults, and required actions if the fair value of the portfolio deviates from amortized cost by a specified amount. The investment in Florida Prime consists of equity in an external, 2a7-like investment pool managed by the State of Florida that was available to be withdrawn by the SWA on an overnight basis. The fair value of the position in Florida Prime was considered to be the same as the SWA s account balance (amortized cost) in the pool. The money market mutual funds and 52
99 NOTES TO THE FINANCIAL STATEMENTS SEPTEMBER 30, 2012 Florida Prime are classified as cash equivalents in the statements of net assets and statements of cash flows. Cash and cash equivalents at September 30, 2012 include $1,210,000 pledged as collateral for a letter of credit issued for the SWA s workers compensation insurance program. Investments: Florida Statutes and SWA policy authorize investments in Florida Prime and LGIP administered by the State; negotiable direct obligations of or obligations unconditionally guaranteed by the U.S. Government; interest-bearing time deposits or savings accounts in financial institutions located in Florida and organized under federal or Florida laws; obligations of the Federal Farm Credit Banks, the Federal Home Loan Mortgage Corporation, the Federal Home Loan Bank or its district banks; obligations guaranteed by the Government National Mortgage Association; obligations of the Federal National Mortgage Association; SEC registered money market funds with the highest credit quality rating; mutual funds limited to U.S. Government securities; interest rate swaps, interest rate exchange agreements, investment contracts, or contracts providing for payments based on levels of or changes in interest rates, or contracts to exchange cash flows, a series of payments, or to hedge payment rate, spread or similar exposure; and, repurchase agreements fully collateralized by SEC registered money market mutual funds with the highest credit quality ratings. The SWA s bond resolutions authorize the investment of bond proceeds in obligations of certain federal government agencies or obligations guaranteed by those agencies; obligations of the United States Government or obligations guaranteed by the United States Government; guaranteed investment contracts meeting certain restrictions; or certain certificates of deposit, repurchase agreements, and investments that are insured or collateralized and otherwise permitted by Florida law. At September 30, 2012, the fair value of the SWA s investments, including unrestricted and restricted asset balances were as follows: Cash equivalents Money market mutual funds Florida Prime Investments Repurchase agreement Investment in the Local Government Investment Pool (LGIP) Fund B $ 215,180, ,648,644 $ 440,829,193 $ 445,470, ,405 $ 446,394,435 Repurchase Agreement: In conjunction with the issuance of the $599,860,000 Solid Waste Authority of Palm Beach County Refunding Revenue Bonds, Series 2011, the SWA entered into a master repurchase agreement (the Agreement ) with two multi-national financial institutions for an initial purchase price of $598,511,702 with no additional purchases permitted. Eligible securities under the Agreement include cash and bonds or other obligations which, as to principal and interest, constitute direct obligations of, or are unconditionally guaranteed by, the U.S. Government, including obligations of any Federal agency to the extent such obligations are unconditionally guaranteed by the U.S. Government. Repurchase dates and amounts are set forth in the Agreement with a final repurchase date of November 1,
100 NOTES TO THE FINANCIAL STATEMENTS SEPTEMBER 30, 2012 Local Government Investment Pool Fund B: On November 29, 2007 the Board of Trustees of the State Board of Administration (SBA) closed the LGIP to all redemptions by participants due to substantial withdrawals that severely reduced the overall liquidity of the LGIP. The withdrawals were in response to published press reports concerning the exposure of LGIP investments to potential losses from sub-prime mortgage investments. On December 4, 2007 the Board of Trustees approved a restructuring plan for the LGIP and engaged a new investment manager for the LGIP. The restructuring divided the LGIP into two separate pools, the LGIP and Fund B representing approximately 86% of the original LGIP assets. The LGIP was designated as the ongoing fund consisting of only short-term, money market assets of the highest quality and was subsequently re-named Florida Prime. Fund B retained all securities from the original LGIP that had defaulted, were in default or had extended payment terms or potentially elevated credit risk. Fund B is closed to deposits and withdrawals and is generally expected to hold all assets to their ultimate maturity and to distribute funds to participants as they become available. The Fund B investment is recorded at fair value based on the net asset value of the Fund B assets reported by the SBA. At September 30, 2012 the Fund B investments had a net asset value of $924,405, approximating 95% of amortized cost. The ultimate realizable value and the date when the LGIP Fund B investment will be available to the SWA cannot be determined at this time, however, it is the opinion of management based upon consultation with the SBA that the amount of loss, if any, and the limited availability of the funds will not adversely affect the services provided by the SWA. Additional information on the current status of the LGIP may be obtained from the State Board of Administration. Custodial Credit Risk: Custodial credit risk is defined as the risk that the SWA may not recover the securities held by another party in the event of a financial failure. The SWA s investment policy for custodial credit risk requires all investment securities to be held in the SWA s name by a third party safekeeping institution. The SWA s investment in the repurchase agreement is categorized as Category 1 under GASB pronouncements, because the SWA is a direct party to the tri-party agreement and the custodian is not the trust department of or affiliated with the financial institution that is the seller-borrower of the repurchase agreement. All deposits with financial institutions are considered fully insured or collateralized pursuant to the custodial credit risk categories of GASB pronouncements. The investments in money market mutual funds and Florida Prime are considered unclassified pursuant to the custodial credit risk categories of GASB pronouncements. Interest Rate Risk: Interest rate risk is the risk that changes in interest rates will adversely affect the fair value of an investment. The money market mutual funds and Florida Prime have a weighted average maturity of less than 90 days, resulting in minimal interest rate risk. The LGIP Fund B has a weighted average maturity of 4.08 years. Credit Risk: Credit risk is the risk that an issuer will not fulfill its obligations. The SWA s investment policy addresses credit risk by limiting allowable investments to the SBA Florida Prime investment pool, deposits with a financial institution meeting the requirements of a Florida 54
101 NOTES TO THE FINANCIAL STATEMENTS SEPTEMBER 30, 2012 qualified public depository, securities guaranteed by the U.S. Government, or investments that are otherwise fully collateralized or secured. The credit quality rating by a Nationally Recognized Statistical Rating Organization (NRSRO) is also an indication of credit risk. The repurchase agreement and LGIP Fund B do not have a credit quality rating. The credit quality ratings of the investments held at September 30, 2012 are as follows: Fair Credit Quality Ratings Value S&P Moody s Money market mutual funds Florida Prime $ 215,180, ,648,644 AAAm AAAm Aaa Not Rated Concentration of Credit Risk: Concentration of credit risk is defined as the risk of loss attributed to the magnitude of an investment in a single issuer. The SWA s investment policy addresses the concentration of credit risk by limiting the maximum amount that may be invested in certain investments and in any one issuer, except for investments in Florida Prime, U.S. Treasury obligations and money market mutual funds which are not limited. Time and savings deposits are limited to 20% of the portfolio value, but no more than 5% per issuer. U.S. Government Agency and Instrumentality securities are limited to 40% of the portfolio value. Guaranteed investment contracts are limited to the total debt service reserve balance. Interest rate swap and repurchase agreements are generally limited to 50% of the portfolio fair value and must be fully collateralized or otherwise insured. The SWA was in compliance with these limitations at September 30, At September 30, 2012 certain individual investments exceeded 5% of the total investment portfolio (including cash and cash equivalents) as follows: Florida Prime Money market mutual funds Dreyfus Government Fidelity Government Repurchase agreement Fair Value $ 225,648, ,792,712 91,526, ,470,030 Percentage of Total Investment Portfolio 25.2% 13.4% 10.2% 49.8% Foreign Currency Risk: Foreign currency risk is the risk that changes in exchange rates will adversely affect the fair value of an investment. There was no exposure to foreign currency risk in the SWA s investments at September 30,
102 3. RELATED PARTY TRANSACTIONS PALM BEACH COUNTY, FLORIDA NOTES TO THE FINANCIAL STATEMENTS SEPTEMBER 30, 2012 Various departments within the County provide goods, administration, public safety, maintenance and various other services to other operating departments. Charges for these services are determined using direct and indirect cost allocation methods or amounts determined based upon direct negotiations between the related parties. The most significant of these transactions involves the reimbursement of indirect costs in accordance with the indirect cost plan. Accordingly, the reimbursement of these indirect costs in fiscal year 2012 was $17,196, CAPITAL ASSETS A summary of changes in capital assets follows: Primary Government Beginning Ending Balance Additions Deductions Balance Governmental Activities: Non-depreciable assets: Land $ 739,502,035 $ 76,650 $ (40,157) $ 739,538,528 Construction In Progress 517,928,850 89,093,384 (46,605,375) 560,416,859 Total non-depreciable assets 1,257,430,885 89,170,034 (46,645,532) 1,299,955,387 Depreciable assets: Buildings and improvements 881,063,972 21,416,579 (6,796) 902,473,755 Improvements other than buildings 351,004,314 15,329, ,333,703 Equipment 612,244,696 66,019,459 (38,806,858) 639,457,297 Infrastructure 1,340,180,923 7,597,089-1,347,778,012 Total depreciable assets 3,184,493, ,362,516 (38,813,654) 3,256,042,767 Less accumulated depreciation for: Buildings and improvements (317,128,264) (24,207,244) 5,936 (341,329,572) Improvements other than buildings * (189,374,807) (9,596,175) - (198,970,982) Equipment * (418,518,957) (58,136,074) 34,342,435 (442,312,596) Infrastructure (1,017,359,079) (27,607,200) - (1,044,966,279) Total accumulated depreciation (1,942,381,107) (119,546,693) 34,348,371 (2,027,579,429) Total capital assets, being depreciated, net 1,242,112,798 (9,184,177) (4,465,283) 1,228,463,338 Total governmental capital assets, net $ 2,499,543,683 $ 79,985,857 $ (51,110,815) $ 2,528,418,725 * Beginning balance adjusted for miscellaneous reclassification. 56
103 NOTES TO THE FINANCIAL STATEMENTS SEPTEMBER 30, 2012 Beginning Ending Balance Additions Deductions Balance Business-type Activities: Non-depreciable assets: Land $ 114,031,852 $ 870,958 $ - $ 114,902,810 Intangible - easement rights * 1,660, ,660,856 Construction In Progress 30,617,811 47,574,256 (38,553,944) 39,638,123 Total non-depreciable assets 146,310,519 48,445,214 (38,553,944) 156,201,789 Depreciable assets: Buildings and improvements 452,286,343 4,833,068 (1,367,397) 455,752,014 Improvements other than buildings 1,372,833,922 34,734,839 (57,996) 1,407,510,765 Equipment 106,493,675 7,190,926 (2,278,601) 111,406,000 Intangible - easement rights * 13,754, ,754,957 Leasehold interest 12,411, ,411,525 Goodwill 6,915, ,915,903 Total depreciable assets 1,964,696,325 46,758,833 (3,703,994) 2,007,751,164 Less accumulated depreciation for: Buildings and improvements (202,122,148) (17,377,434) 1,367,397 (218,132,185) Improvements other than buildings (549,689,623) (38,720,399) 57,996 (588,352,026) Equipment (79,524,045) (7,516,500) 2,171,014 (84,869,531) Intangible - easement rights (3,503,170) (343,874) - (3,847,044) Leasehold interest (6,630,171) (1,267,747) - (7,897,918) Goodwill (1,096,253) (216,956) - (1,313,209) Total accumulated depreciation (842,565,410) (65,442,910) 3,596,407 (904,411,913) Total capital assets, being depreciated, net 1,122,130,915 (18,684,077) (107,587) 1,103,339,251 Total business-type capital assets, net $ 1,268,441,434 $ 29,761,137 $ (38,661,531) $ 1,259,541,040 * A portion of Intangible - Easement rights was reclassified from a depreciable to a non-depreciable asset category effective October 1, Depreciation expense was charged to functions/programs of the primary government as follows: Governmental activities: General government $ 19,212,003 Public safety 32,946,430 Physical environment 1,572,005 Transportation 37,611,334 Economic environment 364,148 Human services 1,665,485 Culture and recreation 17,804,237 In addition, depreciation on capital assets held by the County's internal service funds is charged to the various functions based on their usage of assets. 8,371,051 Total depreciation expense - governmental activities $ 119,546,693 Business-type Activities: Department of Airports $ 26,933,358 Water Utilities Department 38,509,552 Total depreciation expense - business-type activities $ 65,442,910 57
104 NOTES TO THE FINANCIAL STATEMENTS SEPTEMBER 30, 2012 COMPONENT UNIT Solid Waste Authority A summary of changes in capital assets for the Solid Waste Authority follows: Beginning Ending Balance Additions Deductions Balance Non-depreciable assets: Land $ 50,626,126 $ - $ - $ 50,626,126 Construction In Progress 289,853, ,181,858 (205,398,035) 290,637,077 Total non-depreciable assets 340,479, ,181,858 (205,398,035) 341,263,203 Depreciable assets: Buildings and improvements 340,798, ,442,783 (1,809,210) 538,431,691 Improvements other than buildings 106,463,866 8,004,332 (3,928,619) 110,539,579 Equipment 186,036,514 5,035,600 (4,266,981) 186,805,133 Total depreciable assets 633,298, ,482,715 (10,004,810) 835,776,403 Less accumulated depreciation for: Buildings and improvements (133,473,488) (20,739,903) 1,809,209 (152,404,182) Improvements other than buildings (41,494,107) (5,202,006) 3,928,618 (42,767,495) Equipment (119,754,916) (13,551,405) 3,934,667 (129,371,654) Total accumulated depreciation (294,722,511) (39,493,314) 9,672,494 (324,543,331) Total capital assets, being depreciated, net 338,575, ,989,401 (332,316) 511,233,072 Total component unit capital assets, net $ 679,055,367 $ 379,171,259 $ (205,730,351) $ 852,496, INTERFUND TRANSFERS IN AND OUT Interfund transfers in and out during fiscal year 2012 were as follows: Interfund Transfers In Interfund Transfers Out Amount Governmental Funds: Major Governmental Funds General Fund General Government Capital Projects $ 1,007,142 Law Enforcement Grants Special Revenue Fund 7,451,287 Other Special Revenue Fund 2,774,207 Criminal Justice Capital Projects 2,543,970 Environmental Lands Capital Projects 2,214,748 Fleet Management 7,147,770 Combined Insurance Fund 6,827,701 29,966,825 Fire Rescue Special Revenue Fund General Fund 5,913,947 Other Special Revenue Fund 455,482 Fleet Management 897 Combined Insurance Fund 86,793 6,457,119 58
105 NOTES TO THE FINANCIAL STATEMENTS SEPTEMBER 30, 2012 Interfund Transfers In Interfund Transfers Out Amount Community & Social Development Special Revenue Fund General Fund 12,752,295 General Government Capital Projects 80,000 Water Utilities 100,000 12,932,295 Road Program Capital Projects General Fund 750,000 County Transportation Trust Special Revenue Fund 64, ,000 General Government Capital Projects General Fund 13,370,040 Fire Rescue Special Revenue Fund 243,767 Community & Social Development Special Revenue Fund 2,195,492 Law Enforcement Grants Special Revenue Fund 910 County Transportation Trust Special Revenue Fund 36,576 Library Taxing District Special Revenue Fund 9,937 Palm Tran Special Revenue Fund 63,426 Other Special Revenue Fund 1,171,977 Airports 37,633 Fleet Management 7,611 17,137,369 Nonmajor Governmental Funds Nonmajor Special Revenue Funds Law Enforcement Grants Special Revenue Fund General Fund $ 69,250 Other Special Revenue Fund 73, ,650 County Transportation Trust Special Revenue Fund General Fund 3,883,823 Municipal Service Taxing District Special Revenue Fund Fleet Management 144,996 Combined Insurance Fund 173, ,582 Library Taxing District Special Revenue Fund Libraries Capital Projects 2,200,000 Fleet Management 39,129 Combined Insurance Fund 781,138 3,020,267 Affordable Housing Trust Fund (SHIP) Special Revenue Fund General Fund 141,500 Palm Tran Special Revenue Fund General Fund 16,288,125 Other Special Revenue Fund General Fund 2,882,159 Law Enforcement Grants Special Revenue Fund 192,502 3,074,661 Nonmajor Debt Service Funds General Obligation Bonds Debt Service Funds General Fund 375,659 59
106 NOTES TO THE FINANCIAL STATEMENTS SEPTEMBER 30, 2012 Interfund Transfers In Interfund Transfers Out Amount Revenue Bonds Debt Service Fund General Fund 85,087,390 Road Program Capital Projects 1,029,000 General Government Capital Projects 727,755 Tourist Development Special Revenue Fund 6,608,320 Other Special Revenue Fund 711,371 Criminal Justice Capital Projects 2,000,000 96,163,836 Other Financing Debt Service General Fund 553,281 Revenue Bonds Debt Service Fund 15,988,903 Environmental Lands Capital Projects 27,197 16,569,381 Nonmajor Capital Projects Funds Environmental Lands Capital Projects General Fund 250,000 Tourist Development Special Revenue Fund 2,208,737 Other Special Revenue Fund 693,918 3,152,655 Parks & Recreation Capital Projects General Fund 868,447 General Obligation Bonds Debt Service Funds 65, ,506 Total Nonmajor Governmental Funds $ 144,064,645 Proprietary Funds: Major Enterprise Funds Airports Fleet Management $ 87,553 Combined Insurance Fund 260, ,933 Water Utilities Fleet Management 1,579,655 Combined Insurance Fund 1,041,518 2,621,173 Total Enterprise Funds $ 2,969,106 Internal Service Funds: Fleet Management General Fund $ 610,000 Total Interfund Transfers Primary Government $ 214,951,359 Transfers are used to: (1) move revenues from within the fund which a statute or budget requires them to be collected to a fund from which a statute or budget requires them to be expended; (2) move receipts which are restricted to debt service from the funds where the receipts are collected into the debt service fund, as debt service payments become due; (3) provide matching funds for the County s portion of grant agreements; (4) use and transfer unrestricted revenues collected in the General Fund to finance various programs accounted for in other funds in accordance with budgetary authorizations; (5) provide funding for various capital projects by means of transfers; and (6) reduce fund balances in the internal service funds via transfers to other County departments. 60
107 6. RETIREMENT PLANS FLORIDA RETIREMENT SYSTEM PALM BEACH COUNTY, FLORIDA NOTES TO THE FINANCIAL STATEMENTS SEPTEMBER 30, 2012 Plan Description - The County participates in the Florida Retirement System (FRS), a contributory, cost-sharing, multi-employer, public employee retirement system administered by the Florida Department of Management Services, Division of Retirement. The FRS was created December 1, FRS provides retirement and disability benefits, annual cost-of-living adjustments, and death benefits to plan members and beneficiaries. These benefits are established by Florida Statutes, Chapter 121, and may only be amended by the Florida Legislature. The Division of Retirement issues a publicly available financial report that includes financial statements and required supplementary information for FRS. The report may be obtained by writing to the Florida Division of Retirement, ATTN: Research, Education & Policy Section, P. O. Box 9000, Tallahassee, Florida , calling , or accessing their website at: Beginning July 1, 2002, the FRS became one plan with two primary options, a defined benefit option known as the FRS Pension Plan and an alternative defined contribution option known as the FRS Investment Plan. The two options are described in detail below. Members enrolled in the FRS Pension Plan and actively employed on July 1, 2001, or first enrolled between July 1, 2001 and June 30, 2011, will be vested, or eligible to receive future benefits after 6 years of creditable service. Participants first enrolled on or after July 1, 2011 will be vested, or eligible to receive future benefits after 8 years of creditable service. Benefits are based on age, average final compensation and years-of-service credit. For members initially enrolled in the FRS before July 1, 2011, average final compensation is the average of the five highest fiscal years of salary earned during covered employment. For members initially enrolled in the FRS on or after July 1, 2011, average final compensation is the average of the eight highest fiscal years of salary earned during covered employment. Members are eligible for normal retirement when they have met the minimum requirements established by their membership class. For members initially enrolled in the FRS before July 1, 2011, Regular Class members are eligible for normal retirement if they are vested and age 62 or if they have 30 years of creditable service regardless of age. For members initially enrolled in the FRS on or after July 1, 2011, Regular Class members are eligible for normal retirement if they are vested and age 65 or if they have 33 years of creditable service regardless of age. Early retirement may be taken any time after vesting. However, there is a 5% reduction of benefits for each year prior to normal retirement age or date. The percentage level of employees payroll contribution rates is determined using the frozen entry age actuarial cost method. Beginning July 1, 1998, the FRS implemented the Deferred Retirement Option Program (DROP), which is a program within the FRS Pension Plan that allows members to retire without terminating their employment for up to five years while their retirement benefits accumulate and earn interest compounded monthly at a stated effective annual rate. For members who entered DROP prior to July 1, 2011, the rate is 6.5%. For members who enter DROP on or after July 1, 2011, the rate is 1.3%. Members may participate in DROP when they are vested and have 61
108 NOTES TO THE FINANCIAL STATEMENTS SEPTEMBER 30, 2012 reached their normal retirement date. When the DROP period ends, members must terminate employment. At that time, members will receive their accumulated DROP benefits and begin receiving their monthly retirement benefit. The FRS Investment Plan, formally created as the Public Employee Optional Retirement Program (PEORP), is a participant-directed 401(a) program selected by employees in lieu of participation in the defined benefit option of the Florida Retirement System. Benefits accrue in individual accounts that are participant-directed, portable, and funded by employer/employee contributions. Participants and beneficiaries bear the investment risks that result when they exercise control over investments in their accounts. The Investment Plan offers a diversified mix of low-cost investment options that span the risk-return spectrum and give participants the opportunity to accumulate retirement benefits. Members are vested after completing one year of creditable service. Funding Policy - The contribution requirements are established and may be amended by the Florida Legislature. The County s contributions to FRS for the years ended September 30, 2012, 2011, and 2010 were $59.1 million, $93.5 million, and $100.5 million, respectively, equal to the required contributions for each year. As of the fiscal year ending September 30, 2011, the Solid Waste Authority is considered a Component Unit rather than a part of the Primary Government. As a result, the prior-year contributions have been restated to reflect this change. The following membership classes and rates, which apply to both the FRS Pension Plan and the FRS Investment Plan, were in effect at September 30, 2012: Membership Class Regular Special Risk Judges Legislators Governor/Lieutenant Governor/Cabinet State Attorney/Public Defender County, City, Special District Elected Officers Special Risk Administrative Support IFAS Supplemental Senior Management Deferred Retirement Option Program Employee Contribution Rate 3.00% 3.00% 3.00% 3.00% 3.00% 3.00% 3.00% 3.00% 0.00% 3.00% N/A Employer Contribution Rate 5.18% 14.90% 11.93% 8.53% 8.53% 8.53% 10.23% 5.91% 18.75% 6.30% 5.44% 62
109 NOTES TO THE FINANCIAL STATEMENTS SEPTEMBER 30, 2012 PALM TRAN, INC. DEFINED BENEFIT PLAN Plan Description The Palm Tran, Inc. Amalgamated Transit Union Local 1577 (Palm Tran) pension plan (the Plan) is a mandatory contribution, single-employer, defined benefit retirement program administered by the Pension Resource Center. The Plan provides retirement, disability, and death benefits to plan members and beneficiaries. The Board of Trustees (the Board) of the Palm Tran pension plan has the authority to establish and amend benefit provisions. Palm Tran issues a stand-alone, publicly available financial report that includes financial statements and required supplementary information. The report may be obtained by writing to the plan administrator at Pension Resource Center LLC, 4360 Northlake Blvd., Suite 206, Palm Beach Gardens, Florida or calling or accessing their website at: Since the County has no fiduciary responsibility for this plan, it is not included in these financial statements. Funding Policy The contribution requirements of plan members and Palm Tran, Inc. are established by the Pension Trust Agreement and may be amended by the Board. Plan members are required to contribute 2.5% of their annual covered payroll. Palm Tran, Inc. is required to contribute 15.7% of annual covered payroll. Annual Pension Cost and Net Pension Obligation Per the actuarial valuation, the annual pension cost and net pension obligation as of September 30, 2012 were as follows: Annual required contribution (ARC) $ 11,081,517 Interest on net pension obligation 614,231 Adjustment to ARC (433,289) Annual pension cost 11,262,459 Contributions made (3,964,409) Increase (decrease) in net pension obligation 7,298,050 Net pension obligation beginning of year 8,013,869 Net pension obligation end of year $ 15,311,919 Three-Year Trend Information Fiscal Year Ending Annual Pension Cost (APC) Percentage of APC Contributed Net Pension Obligation 09/30/10 $ 5,769,760 58% $ 2,718,873 09/30/11 8,589, ,013,869 09/30/12 11,262, ,311,919 Funded Status and Funding Progress As of January 1, 2012, the most recent actuarial valuation date, the plan was 64.5% funded. The actuarial accrued liability for benefits was $88.5 million, and the actuarial value of assets was $57.0 million, resulting in an unfunded actuarial accrued liability (UAAL) of $31.5 million. The covered payroll (annual payroll of active 63
110 NOTES TO THE FINANCIAL STATEMENTS SEPTEMBER 30, 2012 employees covered by the plan) was $25.0 million, and the ratio of the UAAL to the covered payroll was 125.8%. The schedule of funding progress, presented as RSI following the notes to the financial statements, presents multiyear trend information about whether the actuarial value of plan assets are increasing or decreasing over time relative to the actuarial accrued liability for benefits. Actuarial Methods and Assumptions In the January 1, 2012 actuarial valuation, the Entry Age Normal actuarial cost method was used. The actuarial assumptions included (a) 8.0% investment rate of return and (b) projected salary increases ranging from 5.0% to 12.5% per year. Both (a) and (b) included an inflation component of 4.0% with no cost-of-living adjustments. The projection of benefits for financial accounting purposes does not explicitly incorporate the potential effects of the 15.7% limitation on Palm Tran s contribution rate disclosed above under Funding Policy. The actuarial value of assets was determined using the 5-year Smoothed Market asset valuation method. The UAAL is being amortized as a level percentage of projected payroll on a closed basis. The remaining amortization period at January 1, 2012 was 30 years. LANTANA FIREFIGHTER S DEFINED BENEFIT/CONTRIBUTION PLAN Plan Description The Lantana Firefighter s Pension Fund (LFPF) is a combined defined benefit and defined contribution pension plan covering Town of Lantana (Town) firefighters employed by Palm Beach County (County). LFPF is governed by a Board of Trustees made up of representatives of the firefighters and the Town. It provides a defined benefit retirement annuity to retiring participants and also provides a defined contribution retirement benefit in the form of share accounts, payable upon retirement, death or disability. LFPF issues a stand-alone, publicly available financial report that includes financial statements and required supplementary information. The County does not perform the investment function or have significant administrative involvement in the plan. The report may be obtained by writing to the plan administrator, Pension Resource Center LLC, at 4360 Northlake Blvd., Suite 206, Palm Beach Gardens, Florida or calling or accessing their website at: Since the County has no fiduciary responsibility for this plan, it is not included in these financial statements. Funding Policy (a) Plan members are required to contribute 10% of their salary to the Plan. Of this, 2% is allocated to the defined benefit portion of the Plan and 8% is allocated to the defined contribution portion. (b) Pursuant to Chapter 175, Florida Statutes, the Town imposes a 1.85% tax on fire insurance premiums paid to insure real or personal property within its corporate limits. 100% of the net proceeds of this 1.85% excise tax are allocated to the defined benefit portion of the Plan. (c) Because the County is ultimately responsible for the actuarial soundness of the Plan, the County must contribute an amount determined by the Trustees, in conjunction with the Plan s actuary, to be sufficient, along with the employees contributions and the proceeds from the insurance tax, described above, to fund the defined benefits under the Plan. The current rate is 69.10% of annual covered payroll. 64
111 NOTES TO THE FINANCIAL STATEMENTS SEPTEMBER 30, 2012 Annual Pension Cost and Net Pension Obligation Per the actuarial valuation, the annual pension cost and net pension obligation as of September 30, 2012 were as follows: Annual required contribution (ARC) $ 1,401,002 Interest on net pension obligation 2,642 Adjustment to ARC (4,138) Annual pension cost 1,399,506 Contributions made (1,386,885) Increase (decrease) in net pension obligation 12,621 Net pension obligation beginning of year 41,505 Net pension obligation end of year $ 54,126 Three-Year Trend Information Fiscal Year Ending Annual Pension Cost (APC) Percentage of APC Contributed Net Pension Obligation 09/30/10 $1,432,225 98% $ 34,505 09/30/11 1,437, ,505 09/30/12 1,399, ,126 Funded Status and Funding Progress As of September 30, 2011, the most recent actuarial valuation date, the plan was 76.7% funded. The actuarial accrued liability for benefits was $27.3 million, and the actuarial value of assets was $20.9 million, resulting in an unfunded actuarial accrued liability (UAAL) of $6.3 million. The covered payroll (annual payroll of active employees covered by the plan) was $2.2 million, and the ratio of the UAAL to the covered payroll was 285.4%. The schedule of funding progress, presented as RSI following the notes to the financial statements, presents multiyear trend information about whether the actuarial value of plan assets are increasing or decreasing over time relative to the actuarial accrued liability for benefits. Actuarial Methods and Assumptions In the September 30, 2011 actuarial valuation, the Individual Entry Age actuarial cost method was used. The actuarial assumptions included (a) a rate of return on the investment of present and future assets of 8.0% per year compounded annually, (b) projected salary increases of 7.0% per year compounded annually, and (c) the assumption that benefits will not increase after retirement. Both (a) and (b) included an inflation component of 5.0%. The actuarial value of assets was determined using the 5-year Smoothed Market asset valuation method. The UAAL is being amortized as a level percentage of projected payroll on a closed basis. The remaining amortization period at September 30, 2011 was 15 years. OTHER PENSION PAYMENTS The County entered into agreements with the City of Lake Worth (City) for law enforcement services, effective October 1, 2008, and fire rescue services, effective October 1, Employees of the City who became County employees had the choice to remain in the appropriate City-sponsored retirement plan or to become a member of the Florida Retirement 65
112 NOTES TO THE FINANCIAL STATEMENTS SEPTEMBER 30, 2012 System (FRS). The County contributes to the City-sponsored plans the equivalent amount that would be required by FRS. The County s contributions for employees who elected to remain with the City-sponsored plans were $227,038 for the year ended September 30, A copy of the City s pension fund financial statements may be obtained by contacting the Plan Administrators for the Lake Worth Pension Funds: Pension Resource Center LLC, at 4360 Northlake Blvd., Suite 206, Palm Beach Gardens, Florida or calling or accessing their website at: Since the County has no fiduciary responsibility for this plan, it is not included in these financial statements. COMPONENT UNIT Solid Waste Authority (SWA) Like the Primary Government, the SWA also participates in the Florida Retirement System (FRS), a contributory, cost-sharing, multi-employer, public employee retirement system administered by the Florida Department of Management Services, Division of Retirement. The contribution requirements for plan members and participating governments are established by State statute. The SWA s contributions to the FRS for the years ended September 30, 2012, 2011 and 2010 were $1,081,074, $2,041,721 and $2,321,416, respectively, and were equal to the required contributions for each year. 7. COMMITMENTS Outstanding Purchase Orders and Contracts Purchase orders and contracts (including construction contracts) had been executed, but goods and services were not received in the amounts shown below as of September 30, 2012: Governmental Activities: Amount Major funds: General Fund $ 1,532,480 Fire Rescue Special Revenue Fund 5,055,270 Community & Social Development Special Revenue Fun 11,177,775 Road Program Capital Projects Fund 64,374,600 General Government Capital Projects Fund 11,449,321 Total major funds 93,589,446 Nonmajor governmental activities 46,683,671 Total governmental activities 140,273,117 Business-type Activities: Airports 13,036,166 Water Utilities 16,995,000 Total business-type activities 30,031,166 Total commitments $ 170,304,283 66
113 NOTES TO THE FINANCIAL STATEMENTS SEPTEMBER 30, 2012 Because the budget authority for these amounts lapses at fiscal year-end, they are not reported as either encumbrances or liabilities in the financial statements. Funds are appropriated at the beginning of each fiscal year to provide for these commitments. Water Utilities On June 16, 2009, the Glades Utility Authority (GUA) was established when the BOCC: A) adopted a Resolution determining that the transfer of certain utility assets to the GUA is in the public interest, as required under Section , Florida Statutes; B) approved an Interlocal Agreement with the Cities of Belle Glade, Pahokee, and South Bay (Cities) for the establishment of the GUA pursuant to Chapter 163, Florida Statutes; and C) approved a Transition Agreement with the Cities. As part of the formation of the GUA, the County agreed to provide a backup pledge on some of the debt which was being acquired and refinanced by the GUA. Through this backup pledge the County has become obligated in some manner for the debt of the GUA. However, the County has no equity interest in the GUA and as such this entity is reported as a Non-Equity Joint Venture of the County. The existing State Revolving Fund loans of the Cities which were assumed by the GUA were restructured for a 30-year term with the first 5 years interest only with an interest rate not exceeding 4.5%. The agreement commits the County as a backup pledge for the restructured debt. The balance of the various State Revolving Fund loans at September 30, 2012 is $9.3 million. In addition, the GUA received a $9.3 million bank loan with level principal and interest payments for a 10-year term with interest at 4.55%. The agreement commits the County as a backup pledge for the debt. The balance of the bank loan at September 30, 2012 is $7.8 million. Palm Tran In September 2012, the County was notified that the Palm Tran/ATU Local 1577 Pension Plan had a funding deficiency. As a result, the County is required to amortize this funding deficiency over three annual payments. The first annual payment of $3,572,649 was paid by September 30, 2012, with the remaining two payments of $3,572,649 each due by the end of September 30, 2013 and September 30, 2014, respectively. Termination Benefits Termination benefits are benefits, other than salaries and wages, which are provided by employers as settlement for involuntary terminations initiated by management, or as an incentive for voluntary terminations initiated by employees. Prior Year Plans: On January 15, 2010 the County offered eligible employees up to eight weeks of severance pay and the right to continue their healthcare insurance at the employee rate for up to three years if they agreed to voluntarily terminate employment by February 26, The liability for the 67
114 NOTES TO THE FINANCIAL STATEMENTS SEPTEMBER 30, 2012 accrued healthcare cost at September 30, 2012 was $73,000 which is estimated to be paid within one year. The healthcare cost benefit was valued using the unadjusted cost of the blended premium. On June 28, 2010 the County offered eligible employees up to eight weeks of severance pay and the right to continue their healthcare insurance at the employee rate for up to three years if they agreed to voluntarily terminate employment by July 30, The liability for the accrued healthcare cost at September 30, 2012 was $268,000 with $267,000 estimated to be paid within one year. The healthcare cost benefit was valued using the unadjusted cost of the blended premium. On March 3, 2011 the County offered eligible employees up to eight weeks of severance pay and the right to continue their healthcare insurance at the employee rate for up to three years if they agreed to voluntarily terminate employment by April 29, The liability for the accrued healthcare cost at September 30, 2012 was $778,500 with $517,000 estimated to be paid within one year. The healthcare cost benefit was valued using the unadjusted cost of the blended premium. County Home The County entered into an inter-local agreement with the Palm Beach County Health Care District (the District) effective July 11, 1995 regarding the Medicaid Match and the County Home and General Care Facility (County Home). The term of the agreement is for 40 years and provides that the County will make a fixed annual payment of $15 million to the District in exchange for the District s agreement to operate and manage the County Home and to pay 100% of the Medicaid Match funding as required by the State for hospital and nursing home care. Max Planck On July 22, 2008, the County entered into an economic development grant agreement with Max Planck Florida Corporation (MPFC) providing funding for approximately $86.9 million for the construction and operation of an approximate 100,000 square foot Biomedical Research Facility in the County. Under the terms of the agreement, a maximum of $60 million will be spent towards the construction costs for the Permanent Facility and $26.9 million towards the reimbursement of operational costs. The term of the agreement is 15 years. The County, MPFC and FAU entered into a sublease agreement to lease a portion of the John D. MacArthur Campus of FAU to MPFC for construction of its permanent Florida facilities. The execution of the FAU sublease is a condition to the disbursement of the grant funds. The current fiscal year expense was $13 million, and as of September 30, 2012 the County has paid $55 million towards this commitment. Tri-County Commuter Rail Authority Pursuant to Chapter 343 of the Florida Statutes, the South Florida Regional Transportation Authority (SFRTA) was created and established as an agency of the State to own, operate, 68
115 NOTES TO THE FINANCIAL STATEMENTS SEPTEMBER 30, 2012 maintain, and manage a transit system in the tri-county area of Miami-Dade, Broward, and Palm Beach Counties. A state-authorized, local option recurring funding source available to the tri-counties is directed to SFRTA to fund its capital, operating, and maintenance expenses if the counties dedicate and transfer annually not less than $2.67 million. In addition, each county shall continue to annually fund the operations of SFRTA in an amount not less than $1.565 million. The total annual commitment for Palm Beach County is $4.235 million. COMPONENT UNIT - Solid Waste Authority (SWA) Contract Commitments: SWA has several uncompleted construction contracts for improvements to the solid waste system. The construction is being funded primarily from existing capital improvement funds and bond proceeds. At September 30, 2012 the uncompleted contracts are summarized as follows: Contract Amount Approved Payments Retainage Payable Remaining Contract Commitment Bond Funds $808,942,594 $323,438,048 $12,934,172 $ 472,570,374 In addition to the construction contract commitments, SWA also had outstanding purchase commitments for various equipment, goods and services totaling approximately $20.6 million at September 30, Interlocal Agreement: SWA entered into an interlocal agreement with Palm Beach County to provide funding for a hazardous materials emergency response team to provide regional hazardous materials investigation and mitigation services through the year ended September 30, The agreement was renewed on October 1, 2007 and again on September 25, 2012; each for an additional five year term, effectively extending the agreement through the fiscal year ending September 30, SWA paid $1,829,741 for SWA is required to pay $1,881,486 under this agreement for the fiscal year ended September 30, The amount due each year can increase up to 3% per year. Lease Commitments: SWA owns approximately 1,600 acres of farmland in western Palm Beach County, which is held as a replacement waste disposal site. SWA has an operating lease expiring in 2014 with the former owner to maintain and continue farming the property. The lease provides for annual rental payments to SWA adjusted each year based on the change in the producer price index for raw cane sugar, provided that the total annual rent shall not exceed $450,000. Rental income from this lease for the year ended September 30, 2012 was approximately $280,000. The carrying value of the land subject to the lease was approximately $8 million at September 30, The lease also provides the option to extend the term for five additional periods of four years (through 2030), each under the same terms and conditions. SWA retains the right to terminate the lease, in part, for areas designated for landfill development by SWA after the initial 69
116 NOTES TO THE FINANCIAL STATEMENTS SEPTEMBER 30, 2012 lease term. Management expects the operating lease to be renewed until the property is utilized for its intended purpose as a replacement waste disposal site. SWA leases the current site of the Delray Beach transfer station from the City of Delray Beach under a 20 year operating lease expiring September 30, 2020 with an option to renew for an additional 20 years under the existing terms. The lease provides for annual rental payments increased by the annual change in the consumer price index. Rent expense for the year ended September 30, 2012 was approximately $137,000. The minimum future rental payments, based on an annual increase of 3 percent, under this operating lease at September 30, 2012 were as follows: Year Ending September 30, Amount $ 141, , , , , ,770 $ 1,255,156 Landfill Closure and Postclosure Care Costs The SWA operated one active landfill site for the year ended September 30, In addition, the SWA is responsible for two landfill sites closed after 1991 and three landfill sites closed prior to State and Federal laws and regulations require the SWA to place a final cover on its operating landfill site when it stops accepting waste and to perform certain maintenance and monitoring functions at that and other landfill sites closed after 1991, for thirty years after closure. Although the majority of closure and postclosure care costs will be paid only near or after the date that the operating landfill stops accepting waste, the SWA reports a portion of these closure and postclosure care costs as an operating expense in each period based on landfill capacity used as of each statement of net assets date. Landfill closure and postclosure care liabilities at September 30, 2012 are as follows: Accrued closure and postclosure care costs $ 35,612,977 Accrued postclosure care for closed landfills 4,705,824 Total Accrued Landfill Closure Costs $ 40,318,801 The $35,612,977 of accrued closure and postclosure care liabilities at September 30, 2012 represents the cumulative cost based on the use of 39.4 percent of the estimated capacity of the operating landfill. The SWA will recognize the remaining estimated cost of closure and postclosure care of approximately $65.2 million for the operating landfill as the remaining 70
117 NOTES TO THE FINANCIAL STATEMENTS SEPTEMBER 30, 2012 estimated capacity is filled. These amounts are based on what it would cost to perform all closure and postclosure care in Based on current demographic information and engineering estimates of landfill consumption, the SWA expects to close the landfill in approximately Actual costs may be higher due to inflation, changes in technology, or changes in regulations. The SWA is required by state laws and regulations to make annual contributions to an escrow account to finance all closure costs and one year of postclosure care for landfills closed after The SWA is in compliance with these requirements, and, at September 30, 2012 assets of $31,587,168 were held for these purposes. These amounts are reported as noncurrent restricted assets on the statement of net assets. The SWA expects that future inflation costs will be paid from interest earnings on these invested amounts and subsequent annual contributions. However, if interest earnings are inadequate or additional closure or postclosure care requirements are determined (due to changes in technology or applicable laws or regulations) these costs may need to be covered by charges to future users of the solid waste system or from future non-ad valorem assessments. At September 30, 2012, the statutorily required escrow account balances were as follows: September 30, Site 2012 Site 7 closure costs $ 21,967,469 Dyer landfill long-term care $ 329,214 22,296,683 State laws and regulations specify that required landfill escrow account balances must be calculated using either the Pay-in or the Balance method, as they are statutorily defined. During 2006 the SWA changed from the Pay-in method to the Balance method. The SWA will be required to continue using the Balance method through the remaining design life of the Site 7 landfill. Although the SWA is not legally required by state or federal laws and regulations to provide funding for the landfill sites closed prior to 1991, the SWA has accepted financial responsibility for these sites. The annual long-term care funding requirements for these sites were not estimated or accrued at September 30, 2012, however, management does not believe that the annual costs are material to the SWA and these costs will be adequately funded through future, annual operating budgets. 8. RISK MANAGEMENT The County maintains various self-insurance programs which are accounted for as internal service funds. Following is a brief description of each of the County s insurance programs. The claims liability reported in each of the funds at September 30, 2012, is actuarially determined based on the requirements of GASB 10, which specifies that a liability for claims be reported if information prior to the issuance of the financial statements indicated that it is probable that a liability has been incurred at the date of the financial statements and the amount of the loss can be reasonably estimated. 71
118 NOTES TO THE FINANCIAL STATEMENTS SEPTEMBER 30, 2012 Property and Liability The County is exposed to various risks of loss related to torts; theft, damage and destruction of assets; errors and omissions; and natural disasters. The County self-funds its Property and Liability exposures up to the amounts of $1,000,000 for Property and $500,000 for Liability. In addition, the County purchases a portfolio of excess insurance policies for both Property and Liability as well as numerous smaller policies for areas that are typically excluded in a standard policy or are specialized in nature. Liability exposures are limited to $200,000 per person and $300,000 per occurrence under Florida s sovereign immunity statute The insurance program covers the Board of County Commissioners, the Supervisor of Elections, and the Tax Collector. In addition, the Property Appraiser participates in a small portion of the program as outlined in the Self Insured Retention Program. Participants in the program make payments to the Property and Liability Insurance Fund, included in the Combined Insurance Fund, based on estimates of the amounts needed to pay prior and current year claims and to establish an additional liability for claims incurred but not reported. The claims liability reported in this fund at September 30, 2012 is $3,626,688. During claim years 2012 and 2011, changes recorded to the claims liability for property and liability insurance were as follows: Beginning of Claims and Balance Fiscal Year Changes in Claim at Fiscal Fiscal Year Liability Estimates Payments Year-End 2011 $6,984,000 ($530,245) ($2,634,584) $3,819, ,819,171 2,042,020 (2,234,503) 3,626,688 Workers Compensation Insurance The County self-funds its workers compensation exposure. The fund is professionally administered by a third party claims administrator. This fund covers all employees of the Board of County Commissioners, the Supervisor of Elections, the Clerk & Comptroller, the Property Appraiser, and the Tax Collector. Although the Sheriff s payroll and losses are reported to the State by the Risk Management Department, the Sheriff manages his own program using a third party administrator. Under the County s Self-Insurance Program, the Workers Compensation Fund provides full coverage pursuant to Florida Statute 440. The County purchases excess coverage for losses above the self-insured retention limit of $1,000,000, for each workers compensation occurrence. Participants in the program make payments to the Workers Compensation Insurance Fund, included in the Combined Insurance Fund, based on estimates of the amounts needed to pay prior and current year claims and to establish an additional liability for claims incurred but not reported. The claims liability reported in this fund at September 30, 2012 is $47,131,013. During claim years 2012 and 2011, changes recorded to the claims liability for workers compensation insurance were as follows: 72
119 NOTES TO THE FINANCIAL STATEMENTS SEPTEMBER 30, 2012 Beginning of Claims and Balance Fiscal Year Changes in Claim at Fiscal Fiscal Year Liability Estimates Payments Year-End 2011 $49,345,000 $5,175,423 ($9,124,448) $45,395, ,395,975 14,787,348 (13,052,310) 47,131,013 Employee Group Health Insurance The County provides health insurance for its employees, retirees, and eligible dependents. The County has a $550,000 specific excess insurance policy to protect the County against catastrophic health claims. The Health Insurance Fund covers all employees of the Board of County Commissioners and the Supervisor of Elections. Participants in the program make payments to the Employee Health Insurance fund, included in the Combined Insurance Fund, based on estimates of amounts needed to pay prior and current year claims and to establish an additional liability for claims incurred but not reported. The claims liability reported in the fund at September 30, 2012 is $3,964,976. During claim years 2012 and 2011, changes recorded to the claims liability for employee health insurance were as follows: Current Year Beginning of Claims and Balance Fiscal Year Changes in Claim at Fiscal Fiscal Year Liability Estimates Payments Year-End 2011 $4,579,182 $55,942,224 ($56,294,161) $4,227, ,227,245 53,517,235 (53,779,504) 3,964,976 SHERIFF The Sheriff s Office maintains a general liability self-insurance program, a workers compensation self-insurance program and a commercially insured employee health insurance program which record current activity in the Sheriff s General fund and an obligation in the government-wide financial statements. The following is a brief description of each of the Sheriff s insurance programs. General Liability Insurance The Sheriff s office is exposed to various risks of loss related to torts; theft, damage and destruction of assets; errors and omissions; and natural disasters. The claims liability reported for general liability at September 30, 2012 is $12,702,551. This amount is based on the requirements of GASB 10 which specifies that a liability for claims be reported if information prior to the issuance of the financial statements indicates that it is probable that a liability has been incurred at the date of the financial statements and the amount of the loss can be reasonably estimated. 73
120 NOTES TO THE FINANCIAL STATEMENTS SEPTEMBER 30, 2012 During claim years 2012 and 2011, changes recorded to the claims liability for general liability were as follows: Beginning of Claims and Balance Fiscal Year Changes in Claim at Fiscal Fiscal Year Liability Estimates Payments Year-End 2011 $12,810,571 $3,828,633 ($3,853,278) $12,785, ,785,926 3,311,072 (3,394,447) 12,702,551 Workers Compensation Insurance The Sheriff s office is self-funded for its workers compensation exposure. The claims liability reported at September 30, 2012 is $22,716,366. This amount is the actuarially determined claims liability based on the requirements of GASB 10 which specifies that a liability for claims be reported if information prior to the issuance of the financial statements indicates that it is probable that a liability has been incurred at the date of the financial statements and the amount of the loss can be reasonably estimated. During claim years 2012 and 2011, changes recorded to the claims liability for workers compensation were as follows: Beginning of Claims and Balance Fiscal Year Changes in Claim at Fiscal Fiscal Year Liability Estimates Payments Year-End 2011 $23,215,313 $3,695,870 ($6,591,550) $20,319, ,319,633 9,407,204 (7,010,471) 22,716,366 Employee Group Health Insurance The Sheriff s office maintains a fully insured program for its employee group health insurance program. CLERK & COMPTROLLER Employee Group Health Insurance The Clerk s office provides health insurance for its employees and eligible dependents. The Clerk s office is self-insured for its health insurance coverage. The health insurance program is accounted for as an internal service fund. During claim years 2012 and 2011, changes recorded to the claims liability for health insurance were as follows: 74
121 NOTES TO THE FINANCIAL STATEMENTS SEPTEMBER 30, 2012 Current Year Beginning of Claims and Balance Fiscal Year Changes in Claim at Fiscal Fiscal Year Liability Estimates Payments Year-End 2011 $806,000 $7,553,113 ($7,617,113) $742, ,000 8,215,654 (8,207,654) 750,000 TAX COLLECTOR Employee Group Health and Dental Insurance The Tax Collector s office provides health and dental insurance to its employees and eligible dependents. The Tax Collector is fully insured for its health and dental coverage. PROPERTY APPRAISER Employee Group Health and Dental Insurance The Property Appraiser s office provides health and dental insurance to its employees and eligible dependents. The Property Appraiser is fully insured for its health and dental coverage. COMPONENT UNIT - Solid Waste Authority (SWA) The SWA is exposed to various risks of loss related to torts; theft, damage and destruction of assets; errors and omissions; injuries to employees; life and health of employees; and natural disasters. The SWA purchases commercial insurance for property damage with coverage up to a maximum of approximately $250 million, subject to various policy sub-limits, generally ranging from $1 million to $100 million and deductibles ranging from $50,000 to $1 million per occurrence. The SWA also purchases commercial insurance for general liability claims with coverage up to $5 million per occurrence and $5 million aggregate, with excess liability coverage of $45 million, all subject to various deductibles up to $50,000 per occurrence. General liability claims are limited by the Florida constitutional doctrine of sovereign immunity to $200,000 per claim and $300,000 per occurrence unless a higher claim is approved by the Florida Legislature. The SWA purchases commercial insurance for workers compensation benefits with a $1,000,000 per occurrence and per employee policy limit, subject to a deductible of $250,000 per occurrence. Settled claims have not exceeded commercial coverage in any of the last three years. Changes in the claims liability amount for workers compensation benefits for the years ended September 30, 2012 and 2011 were as follows: 75
122 NOTES TO THE FINANCIAL STATEMENTS SEPTEMBER 30, 2012 Beginning of Claims and Balance Fiscal Year Changes in Claim at Fiscal Fiscal Year Liability Estimates Payments Year-End 2011 $448,000 $347,973 ($347,973) $448, , ,243 (512,243) 494,000 The SWA purchases health insurance through a commercial health insurance plan. 9. OTHER POST EMPLOYMENT BENEFITS (OPEB) Overview Entities of the Reporting Unit provide the following post-employment benefits to retirees: A. Healthcare Plans: 1. County includes: (a) BOCC (b) Supervisor of Elections (c) Metropolitan Planning Organization 2. Tax Collector 3. Property Appraiser 4. Clerk & Comptroller 5. Sheriff 6. Fire Rescue Union B. Long Term Disability Plan: 1. Fire Rescue Taxing District Healthcare Benefits Provided to Retirees Postretirement Benefits: The amount reported as the postretirement benefit obligation represents the actuarial present value of those estimated future benefits that are attributed by the terms of the plan to employees service rendered to the date of the financial statements, reduced by the actuarial present value of contributions expected to be received in the future from current plan participants. Postretirement benefits include future benefits expected to be paid to or for both of the following: 1. Currently retired or terminated employees and their beneficiaries and dependents. 2. Active employees and their beneficiaries and dependents after retirement from service with participating employers. The postretirement benefit obligation represents the amount that is to be funded by contributions from the plan s participating employers and from existing plan assets. Before an active 76
123 NOTES TO THE FINANCIAL STATEMENTS SEPTEMBER 30, 2012 employee's full eligibility date, the postretirement benefit obligation is the portion of the expected postretirement benefit obligation that is attributed to that employee's service in the County rendered to the valuation date. The actuarial present value of the expected postretirement benefit obligation is determined by an actuary and is the amount that results from applying actuarial assumptions to historical claimscost data to estimate future annual incurred claims costs per participant and to adjust such estimates for the time value of money (through discounts for interest) and the probability of payment (by means of decrements such as those for death, disability, withdrawal, or retirement) between the valuation date and the expected date of payment. Plan Description: The defined benefit post-employment healthcare plans provide medical benefits to eligible retired employees and their dependents. The plans are single employer plans which are administered by the employer for their employees. The Supervisor of Elections and Metropolitan Planning Organization participate in the County plan. The plans do not issue separate standalone financial reports. The Fire Rescue retiree health plan is a defined benefit plan with attributes similar to a defined contribution plan. The County is required, per the Collective Bargaining Agreement, to make contributions equal to 3% of the total current base annual pay plus benefits for the Fire Rescue employees. Since the primary government is not entitled to nor does it have the ability to otherwise access the economic resources received or held by the Fire Rescue retiree health plan; and since Palm Beach County has no reversionary interest in the economic resources received or held by the Fire Rescue retiree health plan and the County is not responsible for custody of the assets of the plan, therefore it is not reported as a fiduciary fund of the County. The plan does not issue a separate standalone financial report. Funding Policy: The contribution requirements of plan members and the employer are established and may be amended by the employer or by the union for Fire Rescue. All entities of the Primary Government are required by Florida Statute to allow their retirees (and eligible dependents) to continue participation in the group insurance plan. Retirees must be offered the same coverage as is offered to active employees at a premium cost of no more than the premium cost applicable to active employees which results in an implicit subsidy as defined by GASB 45. At September 30, 2012 retirees receiving benefits contributed the following monthly premiums: Tax Property Clerk & Fire Rescue County Collector Appraiser Comptroller Sheriff Union Monthly Minimum $ 655 $ 662 $ 385 $ 525 $ 534 $ 147 Monthly Maximum 2,033 2,176 1,605 1,147 2,
124 NOTES TO THE FINANCIAL STATEMENTS SEPTEMBER 30, 2012 In addition to the implicit benefit, two of the plans offer an explicit benefit. The Sheriff and Fire Rescue Plans provide a subsidy that retirees can use to partially or fully offset the cost of health insurance. In accordance with the Fire Rescue Collective Bargaining Agreement, the plan provides a postretirement health insurance benefit. The Retirees must meet retirement eligibility criteria in order to be eligible for the full benefit. For employees who retired before September 27, 2005, the subsidy is a monthly benefit of $75 plus $12 per year of service. Unless otherwise precluded, for employees retiring on or after September 27, 2005, the subsidy is a monthly benefit of $140 plus $17 per year of service. This subsidy is payable for life and is assumed to remain fixed in the future. Employees who retire with at least ten years of service but before attaining normal retirement eligibility are eligible for a reduction to this benefit in the amount of 6% for each year between their age of retirement and age 55. This reduction remains fixed in the future. Under the Sheriff s Plan, for employees who retire in good standing after six years of service and who elect to retain the Sheriff s Office group medical and/or dental coverage, the County provides a subsidy of $16 per month per year of service toward medical and dental coverage for the retiree and eligible family members, based on years of service to the Sheriff. This subsidy ends at the death of the retiree or when the retiree discontinues coverage under the Sheriff s plan. A special subsidy of 90% of medical and dental premiums for employee or employee-plus-one coverage is offered to the Sheriff, Chief Deputy, Deputy Director, Director, and Colonel. A special subsidy of 80% of medical and dental premiums for employee or employee-plus-one coverage is offered to Majors and the Bureau Director. A special subsidy of 100% of medical and dental premiums for employee or employee-plus-one coverage is offered to employees who become disabled in the line of duty and spouses of employees who die in the line of duty. OPEB Cost and Net OPEB Obligation: The annual other post-employment benefit cost is calculated based on the annual required contribution of the employer (ARC), an amount actuarially determined in accordance with the parameters of GASB Statement 45. The ARC represents a level of funding that, if paid on an ongoing basis, is projected to cover the normal cost each year and the amortization of any unfunded actuarial liabilities (or funding excess) over a period not to exceed thirty years. The following table shows the components of the annual OPEB cost for the year, the amount contributed to the plan, and changes in the net OPEB obligation as of fiscal year ended September 30, 2012: 78
125 NOTES TO THE FINANCIAL STATEMENTS SEPTEMBER 30, 2012 Tax Property Clerk & Fire Rescue County Collector Appraiser Comptroller Sheriff Union Annual required contribution (ARC) $ 1,240,000 $ 245,315 $ 23,310 $ 491,917 $ 21,010,000 $ 10,231,000 Interest on net OPEB obligation (18,000) 32,339 6,906 12,880 2,250, ,000 Adjustment to annually required contribution 16,000 (7,445) (1,135) (17,905) (2,000,000) (795,000) Annual OPEB cost 1,238, ,209 29, ,892 21,260,000 10,425,000 Contributions made (1,758,393) - (10,527) (243,747) (4,570,000) (4,446,592) Increase (decrease) in net OPEB obligation (520,393) 270,209 18, ,145 16,690,000 5,978,408 Net OPEB obligationbeginning of year (427,805) 646, , ,966 50,120,000 19,012,821 Net OPEB obligation (asset) - end of year $ (948,198) $ 916,981 $ 156,672 $ 416,111 $ 66,810,000 $ 24,991,229 The annual OPEB cost, the percentage of annual OPEB cost contributed to the plan and the net OPEB obligation for the current and preceding two fiscal years: Fiscal Year Ended Annual OPEB Cost Percentage of Annual OPEB Cost Contributed Net OPEB Obligation Liability (Asset) County 9/30/2010 $ 1,205, % $ 598,206 9/30/2011 1,159, (427,805) 9/30/2012 1,238, (948,198) Tax Collector 9/30/2010 $ 152, % $ 493,357 9/30/ , ,772 9/30/ , ,981 Property Appraiser 9/30/2010 $ 38, % $ 98,471 9/30/ , ,118 9/30/ , ,672 Clerk & Comptroller 9/30/2010 $ 413, % $ 134,482 9/30/ , ,966 9/30/ , ,111 Sheriff 9/30/2010 $ 18,000, % $ 36,000,000 9/30/ ,250, ,120,000 9/30/ ,260, ,810,000 Fire Rescue Union 9/30/2010 $ 12,974, % $ 13,848,359 9/30/2011 9,893, ,012,821 9/30/ ,425, ,991,229 79
126 NOTES TO THE FINANCIAL STATEMENTS SEPTEMBER 30, 2012 Funded Status and Funding Progress: The plans are financed on a pay-as-you-go basis. The funded status of the plans as of the most recent actuarial valuation date was as follows: Tax Property Clerk & Fire Rescue County Collector Appraiser Comptroller Sheriff Union Actuarial accrued liability (AAL) $ 16,267,000 $ 1,546,776 $ 192,396 $ 6,200,857 $ 240,478,000 $ 129,760,000 Actuarial value of plan asset ,359,477 Unfunded actuarial accrued liability (UAAL) $ 16,267,000 $ 1,546,776 $ 192,396 $ 6,200,857 $ 240,478,000 $ 106,400,523 Funded ratio (actuarial value of plan / AAL) 0.0% 0.0% 0.0% 0.0% 0.0% 18.0% Covered payroll (active plan members) $ 241,965,767 $ 12,439,356 $ 11,597,574 $ 31,154,225 $ 257,194,182 $ 138,684,968 UAAL as a percentage of covered payroll 6.7% 12.4% 1.7% 19.9% 93.5% 76.7% Actuarial valuations of an ongoing plan involve estimates of the value of reported amounts and assumptions about the probability of occurrence of events far into the future. Examples include assumptions about future employment, mortality, and the healthcare cost trend. Amounts determined regarding the funded status of the plan and the annual required contributions of the employer are subject to continual revision as actual results are compared with past expectations and new estimates are made about the future. Due to the small number of retirees in the Tax Collector s Plan, it was determined that any implicit subsidy is insignificant and conservatively reported as zero. Actuarial Methods and Assumptions: Projections of benefits for financial reporting purposes are based on the substantive plan (the plan as understood by the employer and plan members) and include the types of benefits provided at the time of each valuation and the historical pattern of sharing of benefit costs between the employer and plan members to that point. The actuarial methods and assumptions used include techniques that are designed to reduce short-term volatility in actuarial accrued liabilities and the actuarial value of assets, consistent with the longterm perspective of the calculations. Significant methods and assumptions were as follows: 80
127 NOTES TO THE FINANCIAL STATEMENTS SEPTEMBER 30, 2012 County Tax Collector Property Appraiser Clerk & Comptroller Sheriff Fire Rescue Union Actuarial valuation date Actuarial cost method Actuarial amortization method 10/1/ /1/ /1/ /1/2011 1/1/ /1/2010 Projected Unit Entry age Entry age Entry age Projected Unit Projected Unit credit actuarial normal normal normal credit actuarial credit actuarial cost method actuarial cost actuarial cost actuarial cost cost method cost method method method method Level percentage of projected payroll on open basis Level percentage of projected payroll on closed basis Level percentage of projected payroll on closed basis Level percentage of projected payroll on open basis Level percentage of projected payroll on open basis Level percentage of projected payroll on open basis Remaining amortization period 30 yrs- Open 30 yrs- Closed 30 yrs- Closed 30 yrs- Open 30 yrs- Open 30 yrs- Open Asset valuation method na na na na na na Actuarial assumptions Investment rate of return 4.2% 5.0% 4.0% 4.0% 4.5% 5.2% Projected salary increases 3.5% 4.0% 4.0% 2.5% 3.5% 3.5% Healthcare inflation rateinitial 11.0% 7.0% 8.0% 8.0% 7.2% 10.0% Healthcare trend rateultimate 5.0% 5.0% 5.0% 4.5% 5.0% 5.0% Long Term Disability Benefits Provided to Retirees Plan Description: The Palm Beach County Fire Rescue Supplemental Disability Plan is a defined benefit plan that provides disability benefits to Firefighters and District Chiefs totally and permanently prevented from rendering useful and efficient service as a Firefighter/District Chief incurred in the line of duty. The plan is a single employer plan which is administered by the Palm Beach County Fire Rescue Department. The plan does not issue a separate standalone financial report. Funding Policy: The contribution requirements of plan members and Palm Beach County are established and may be amended by collective bargaining between Palm Beach County and the Professional Firefighters/Paramedics of Palm Beach County, Local 2928, IAFF, Inc. The plan is funded by the County based on an annually required contribution calculated by an actuary. The earmarked funding, related earnings, expenditures and administrative costs are recorded in a special revenue fund. OPEB Cost and Net OPEB Obligation: The annual other post-employment benefit cost is calculated based on the annual required contribution of the employer (ARC), an amount actuarially determined in accordance with the parameters of GASB Statement 45. The ARC represents a level of funding that, if paid on an ongoing basis, is projected to cover normal cost each year and amortized any unfunded actuarial liabilities (or funding excess) over a period not to exceed thirty years. The following table shows the components of the annual OPEB cost for the current fiscal year, the amount contributed to the plan, and changes in the net OPEB obligation: 81
128 NOTES TO THE FINANCIAL STATEMENTS SEPTEMBER 30, 2012 Annual required contribution $ 765,465 Interest on net OPEB obligation 4,212 Adjustment to annual required contribution (7,549) Annual OPEB cost (expense) 762,128 Contributions made (622,702) Increase in net OPEB obligation 139,426 Net OPEB obligation (asset)- beginning of year 91,165 Net OPEB obligation (asset)- end of year $ 230,591 The annual OPEB cost, the percentage of annual OPEB cost contributed to the plan and the net OPEB obligation for the current and preceding two fiscal years are as follows: Fiscal Year Ended Annual OPEB Cost Percentage of Annual OPEB Cost Contributed Net OPEB Obligation (Asset) 9/30/2010 $ 798, % $ (81,992) 9/30/ , % 91,165 9/30/ , % 230,591 Funded Status and Funding Progress: The plan is financed on a pay-as-you-go basis. The funded status of the plan as of September 30, 2012, was as follows: Actuarial accrued liability (AAL) $ 9,276,012 Actuarial value of plan assets - Unfunded actuarial accrued liability (UAAL) $ 9,276,012 Funded ratio (actuarial value of plan / AAL) 0.0% Covered payroll (active plan members) $ 138,684,968 UAAL as a percentage of covered payroll 6.7% Actuarial valuations of an ongoing plan involve estimates of the value of reported amounts and assumptions about the probability of occurrence of events far into the future. Examples include assumptions about future employment, disability occurrences, and workmen s compensation payments. Amounts determined regarding the funded status of the plan and the annual required contributions of the employer are subject to continual revision as actual results are compared with past expectations and new estimates are made about the future. The schedule of funding progress, presented as required supplementary information following the notes to the financial statements, presents multi-year trend information that shows whether the actuarial value of plan assets is increasing or decreasing over time relative to the actuarial accrued liabilities for benefits. Actuarial Methods and Assumptions: Projections of benefits for financial reporting purposes are based on the substantive plan (the plan as understood by the employer and plan members) and include the types of benefits provided at the time of each valuation and the historical pattern of sharing of benefit costs between the employer and plan members to that point. The actuarial 82
129 NOTES TO THE FINANCIAL STATEMENTS SEPTEMBER 30, 2012 methods and assumptions used include techniques that are designed to reduce short-term volatility in actuarial accrued liabilities and the actuarial value of assets, consistent with the longterm perspective of the calculations. Significant methods and assumptions were as follows: Actuarial valuation date 10/1/2011 Actuarial cost method Projected Unit Credit Actuarial Cost Method Amortization method Level Percentage of Projected Payroll on Open Basis Remaining amortization period 30 years- open Asset valuation method na Actuarial assumptions: Investment rate of return 4.0% Projected salary increases 3.5% Cost of living adjustments None COMPONENT UNIT - Solid Waste Authority (SWA) Plan Description: Effective January 1, 2009, the SWA established a single-employer defined benefit healthcare plan to provide benefits to its eligible retired employees and their beneficiaries (the Plan ). The Plan is administered by the SWA s Board, which also has the authority to establish and amend premiums for and the benefit provisions of the Plan. The Plan is financed on a pay-as-you-go basis and is not administered as a formal qualifying trust. The Plan does not issue a publicly available financial report. Funding Policy: The contribution requirements of Plan members and the SWA are established and may be amended by the SWA s Board. The SWA is required by Florida Statute to allow retirees to buy healthcare coverage at the same group insurance rates that current employees are charged resulting in an implicit healthcare benefit. The State of Florida prohibits the Plan from separately rating retirees and active employees. The Plan therefore charges both groups an equal, blended rate premium. Although both groups are charged the same blended rate premium, GAAP requires the actuarial figures to be calculated using age adjusted premiums approximating claim costs for retirees separate from active employees. The use of age adjusted premiums results in the addition of an implicit rate subsidy into the actuarial accrued liability. Plan members receiving benefits contribute 100% of the monthly premium ranging from a minimum of $624 to a maximum of $2,012. Annual OPEB Cost and Net OPEB Obligation: The annual other postemployment benefit cost is calculated based on the annual required contribution of the employer (ARC), an amount actuarially determined in accordance with the parameters of GASB Statement 45. The ARC represents a level of funding that, if paid on an ongoing basis, is projected to cover the normal cost each year and the amortization of any unfunded actuarial liabilities (or funding excess) over a period not to exceed thirty years. 83
130 NOTES TO THE FINANCIAL STATEMENTS SEPTEMBER 30, 2012 The SWA s annual OPEB cost, the percentage of annual OPEB cost contributed to the plans, and the net OPEB obligation for the year ended September 30, 2012 was as follows: Annual required contribution Interest on net OPEB obligation Adjustment to annual required contribution Annual OPEB cost Contributions made Increase (decrease) in net OPEB obligation Net OPEB obligation, beginning of year Net OPEB obligation, end of year $ 75,000 21,000 (16,000) 80,000 (72,560) 7, ,559 $ 334,999 The year ended September 30, 2008 was the year of implementation of GASB 45 and the SWA elected to implement prospectively. Three year comparative data is as follows: Year Ended September 30, Annual OPEB Cost Actual Employer Contribution Percentage Contributed Net OPEB Obligation $ 80,000 80, ,000 $ 72,560 99,470 59, % 124.3% 32.2% $ 334, , ,029 Funded Status and Funding Progress: The Plan is financed on a pay-as-you-go basis. The latest actuarial valuation was done as of October 1, 2010 and the SWA intends to obtain such valuations every other year in the future. The following schedule of funding progress is based upon available information and presents multi-year trend information about whether the actuarial value of plan assets is increasing or decreasing over time relative to the actuarial accrued liability for benefits: Date of Actuarial Valuation October 1, Actuarial Value of Assets Actuarial Accrued Liability (AAL) Unfunded AAL (UAAL) Funded Ratio Covered Payroll UAAL as a Percentage of Covered Payroll 2010 $ 0 $ 724,000 $ 724, % $22,391, % Actuarial Methods and Assumptions: Projections of benefits for financial reporting purposes are based on the substantive plan (the plan as understood by the employer and the plan members) and include the types of benefits provided at the time of each valuation and the historical pattern of sharing of benefit costs between the employer plan members to that point. The actuarial methods and assumptions used include techniques that are designed to reduce the effects of short-term volatility in actuarial accrued liabilities and the actuarial value of assets, consistent with the long-term perspective of the calculations. 84
131 NOTES TO THE FINANCIAL STATEMENTS SEPTEMBER 30, 2012 The Plan uses the projected unit credit actuarial cost method. The actuarial assumptions include a 6.0% investment rate of return (net of administrative expenses), and an annual healthcare cost trend rate of 10% initially, reduced by decrements to an ultimate rate of 5% after ten years. Both rates include a 3.5% inflation assumption. The actuarial value of assets will be determined using fair value. The UAAL will be amortized as a level percentage of projected payroll on an open basis. The remaining amortization period is 30 years. Actuarial valuations of an ongoing plan involve estimates of the value of reported amounts and assumptions about the probability of occurrence of events far into the future. Actuarially determined amounts are subject to continual revision as actual results are compared to past expectations and new estimates are made about the future. Although the valuation results are based on values the actuarial consultant believes are reasonable assumptions, the valuation result is only an estimate of what future costs may actually be and reflect a long-term perspective. Deviations in any of several factors, such as future interest rate discounts, medical cost inflation, Medicare coverage and changes in marital status, could result in actual costs being greater or less than estimated. Changes in Actuarial Assumptions: Several actuarial assumptions were changed in the October 1, 2010 valuation resulting in a decrease in the AAL of approximately $700,000. These changes include the following: (1) claim costs did not increase at the rates assumed in the prior valuation, (2) there are fewer lives in total, fewer retirees and fewer spouses covered now than there were previously, (3) the trend assumption applicable to assumed administrative expenses was changed, and (4) the assumed participation rate for retirees was reduced based on the census. 10. LEASES Leases Receivable: Enterprise Funds The Department of Airports leases a major portion of its property to airlines, rental car companies and concessionaires. Certain concessionaire leases provide for minimum rentals plus a contingency portion specified as a percentage of the tenants gross revenues. Contingent rental income under such arrangements amounted to $1,964,422 for the year ended September 30, All Department of Airports leases are operating leases. A significant portion of the airlines and rental car companies operating leases usually run for between two to five years and are scheduled to expire after fiscal year 2012 resulting in a decline in minimum future receipts. Minimum future receipts, exclusive of contingent rentals under such leases, are approximately: 85
132 NOTES TO THE FINANCIAL STATEMENTS SEPTEMBER 30, 2012 Year Ended Department of September 30 Airports 2013 $ 38,472, ,910, ,139, ,118, ,198,528 Thereafter 59,856,038 Total $ 184,696,264 A schedule of the carrying value of property held for lease, by major classification, as of September 30, 2012 is as follows: September 30, 2012 Buildings $ 233,291,349 Less: accumulated depreciation (144,221,001) Net Buildings 89,070,348 Land 9,172,040 Total property held for lease $ 98,242,388 Lease Obligations The County has entered into various leases which are classified as operating or capital leases for accounting purposes. Total rent expense for operating leases for the fiscal year ended September 30, 2012 amounted to approximately $5,064,998 comprised of $4,939,517 for Governmental funds, $112,399 for Enterprise Funds, and $13,082 for Internal Service Funds. Operating Leases Future minimum rental payments under non-cancellable operating leases as of September 30, 2012 are as follows: Internal Governmental Enterprise Service Fiscal Year Funds Funds Funds 2013 $ 2,838,809 $ 84,187 $ 7, ,110,132 28,916 3, ,120,842 6,957 1, , , Thereafter 377, Total $ 7,152,605 $ 120,060 $ 12,589 86
133 NOTES TO THE FINANCIAL STATEMENTS SEPTEMBER 30, 2012 Capital Leases Capital leases are those which are determined to have passed substantially all of the risks and benefits of ownership to the lessee. There were no Capital leases in the governmental and proprietary fund types. 11. REFUNDING OF DEBT Advance Refundings: Certain bond issues have been refunded through in-substance defeasance by placing into irrevocable trust funds sufficient monies to meet future principal and interest payments. These funds have been invested in U.S. Government securities and securities backed by the U.S. Government. On June 28, 2012, Palm Beach County issued $147,000,000 Public Improvement Revenue Refunding Bonds, Series 2012 with an effective interest rate of 2.358% to advance refund $50,255,000 of outstanding Public Improvement Revenue and Refunding Bonds, Series 2004 and $22,725,000 of outstanding Public Improvement Revenue Bonds (Biomedical Research Park Project), Series 2004A and $82,625,000 of outstanding Public Improvement Revenue Bonds (Biomedical Research Park Project), Series 2005A. The net proceeds of $174,873,350 (after allowing for $28,470,407 in bond premium and $597,057 in issuance costs) were used to purchase U.S. Government securities which were deposited in an irrevocable trust with an escrow agent to provide for all future debt service payments on the refunded bonds. The reacquisition price exceeded the carrying amount, resulting in an accounting loss of $12,103,093. This amount is being netted against the new debt and amortized over the remaining life of the refunded debt, which is shorter than the life of the new debt issued. The County decreased its aggregate debt service payments by approximately $12,009,869 over a period of thirteen years and incurred an economic gain of approximately $10,458,365 (difference between the present value of the old and new debt service payments). The purpose of the refunding was to take advantage of the unusually low interest rates that were available at this time. The amount of in-substance defeased bonds outstanding, as of September 30, 2012, consists of the following: 87
134 NOTES TO THE FINANCIAL STATEMENTS SEPTEMBER 30, 2012 Bond Issues Amount Governmental Funds: General Obligation Bonds (Library District Improvement Project), 2003 $ 18,025,000 General Obligation Bonds (Recreational and Cultural Facilities), ,730,000 Public Improvement Revenue and Refunding Bonds, ,255,000 Public Improvement Revenue Bonds (Biomedical Rsrch Park Proj), 2004A 22,725,000 Public Improvement Revenue Bonds (Biomedical Rsrch Park Proj), 2005A 82,625,000 General Obligation Bonds (Recreational and Cultural Facilities), ,080, ,440,000 Proprietary Funds: Airport Refunding Revenue Bonds, ,365,000 11,365,000 Total Defeased Bonds Outstanding $ 214,805,000 Current Refundings: On April 17, 2012, Palm Beach County issued $16,189,340 Capital Improvement Revenue Bonds (Four Points and Other Public Buildings Projects), Series 2012 with an effective interest rate of 2.579% to refund the County s $16,140,760 Capital Improvement Bond Anticipation Note (Four Points and Other Public Buildings Projects), Series The net proceeds of $16,140,760 (after allowing for $48,580 in issuance costs) were used to pay the principal on the note. The reacquisition price exceeded the carrying amount, resulting in an accounting loss of $1,757. This amount was netted against the new debt and was expensed during the current fiscal year since the remaining life of the refunded debt did not exceed the end of the current fiscal year. The County increased its aggregate debt service payments by approximately $3,264,361 over a period of fifteen years and incurred an economic gain of approximately $41,415 (difference between the present value of the old and new debt service payments). The purpose of the refunding was to replace the variable rate note near maturity with a fixed rate bond. 88
135 NOTES TO THE FINANCIAL STATEMENTS SEPTEMBER 30, INTERFUND RECEIVABLE AND PAYABLE BALANCES Interfund balances at September 30, 2012 are expected to be repaid within one year. Interfund receivable and payable balances at September 30, 2012 were as follows: Interfund Receivable Fund Interfund Payable Fund Amount Governmental Funds: Major Governmental Funds General Fund Community & Social Development Special Revenue Fund $ 10,224,619 Fleet Management 6,375,910 Combined Insurance Fund 6,335,901 Palm Tran Special Revenue Fund 4,024,345 Law Enforcement Grant Special Revenue Fund 4,822,734 Other Special Revenue Funds 564,983 Airports 137,503 Clerk & Comptroller Insurance Fund 88,505 Water Utilities 7,780 Library Taxing District Special Revenue Fund 3,564 Road Program Capital Projects 605 Municipal Service Taxing District 320 Affordable Housing Trust Fund (SHIP) Special Revenue Fund ,586,991 Fire Rescue Special Revenue Fund General Fund 3,424,734 Combined Insurance Fund 86,793 Fleet Management 897 3,512,424 Community & Social Development Special Revenue Fund General Fund 6,104,745 Affordable Housing Trust Fund (SHIP) Special Revenue Fund 35,461 General Government Capital Projects 816 6,141,022 General Government Capital Projects General Fund 2,229,091 Community & Social Development Special Revenue Fund 647,959 2,877,050 Nonmajor Governmental Funds Nonmajor Special Revenue Funds Law Enforcement Grants Special Revenue Fund General Fund $ 7,821,296 Other Special Revenue Funds 10,972 7,832,268 County Transportation Trust Special Revenue Fund General Fund 556,355 Municipal Service Taxing District Combined Insurance Fund 173,586 Fleet Management 118, ,354 Library Taxing District Special Revenue Fund General Fund 512,820 Combined Insurance Fund 781,138 Fleet Management 34,779 1,328,737 Affordable Housing Trust Fund (SHIP) Special Revenue Fund General Fund 141,500 89
136 NOTES TO THE FINANCIAL STATEMENTS SEPTEMBER 30, 2012 Interfund Receivable Fund Interfund Payable Fund Amount Palm Tran Special Revenue Fund General Fund 3,730,880 Other Special Revenue Funds General Fund 904,920 Environmental Lands Capital Projects Tourist Development Special Revenue Fund 690,230 Other Special Revenue Funds 124, ,574 Street & Drainage Capital Projects General Fund 3,758 Total Nonmajor Governmental Funds $ 15,605,346 Proprietary Funds: Enterprise Funds Airports Combined Insurance Fund $ 260,380 Fleet Management 78,375 Other Special Revenue Funds 8, ,605 Water Utilities Fleet Management 1,391,271 Combined Insurance Fund 1,041,518 General Fund 7,627 Airports 6,379 Community & Social Development Special Revenue Fund 1,079 2,447,874 Total Enterprise Funds $ 2,795,479 Internal Service Funds Fleet Management General Fund $ 1,330,035 County Transportation Trust Special Revenue Fund 499,852 Water Utilities 384,951 Fire Rescue Special Revenue Fund 141,979 Airports 63,535 Palm Tran Special Revenue Fund 55,975 Other Special Revenue Funds 50,277 Municipal Service Taxing District Special Revenue Fund 34,053 Road Program Capital Projects 18,198 Library Taxing District Special Revenue Fund 8,355 Community & Social Development Special Revenue Fund 4,641 Combined Insurance Fund 386 2,592,237 Combined Insurance Fund General Fund 467,412 Palm Tran Special Revenue Fund 145,375 Water Utilities 135,046 Community & Social Development Special Revenue Fund 90,425 Library Taxing District Special Revenue Fund 87,919 County Transportation Trust Special Revenue Fund 77,244 Airports 34,471 Municipal Service Taxing District Special Revenue Fund 24,285 Other Special Revenue Funds 16,910 Fleet Management 14,438 90
137 NOTES TO THE FINANCIAL STATEMENTS SEPTEMBER 30, 2012 Interfund Receivable Fund Interfund Payable Fund Amount Fire Rescue Special Revenue Fund 11,948 Road Program Capital Projects Fund 11,094 Tourist Development Special Revenue Fund 629 Law Enforcement Grants Special Revenue Fund 396 1,117,592 Clerk & Comptroller Insurance Fund General Fund 644,507 Total Internal Service Funds $ 4,354,336 Total Interfund Receivables and Payables Primary Government $ 67,872,648 The outstanding balances between funds result mainly from the time lag between the dates that 1) interfund goods and services are provided or reimbursable expenditures occur, 2) transactions are recorded in the accounting system, and 3) payments between funds are made. Receivables and Payables Between Primary Government and Component Units: Interfund Receivable Primary Government Fund Interfund Payable Component Unit Fund Amount General Fund Solid Waste Authority $ 371,454 Housing Finance Authority 46,763 Combined Insurance Fund Metropolitan Planning Organization 2,089 Fleet Management Solid Waste Authority ,225 Interfund Receivable Component Unit Fund Interfund Payable Primary Government Fund Amount Westgate/Belvedere Homes CRA Other Special Revenue Funds 122,536 Community & Social Development Special Revenue Fund 20,301 Housing Finance Authority General Fund 6,406,976 Metropolitan Planning Organization General Fund 290,496 Solid Waste Authority General Fund 4,875,880 County Transportation Trust Special Revenue Fund 10,339 Other Special Revenue Funds 387 Airports 209 Palm Tran 23 11,727,147 Total Receivables and Payables Between Primary Government and Component Units $ 12,148,372 91
138 13. LONG-TERM DEBT PALM BEACH COUNTY, FLORIDA NOTES TO THE FINANCIAL STATEMENTS SEPTEMBER 30, 2012 Changes in Long-Term Liabilities - The following is a summary of changes in long-term liabilities for the year ended September 30, 2012 for both governmental activities and businesstype activities: Beginning Ending Due within Governmental activities: Balance Additions Reductions Balance One Year Bonds payable: General obligation bonds $ 226,545,000 $ - $ 19,205,000 $ 207,340,000 $ 20,130,000 Non-ad valorem revenue bonds 848,086, ,189, ,999, ,276,168 66,447,133 Face amount of bonds payable 1,074,631, ,189, ,204,444 1,000,616,168 86,577,133 Unamortized bond premiums 35,514,341 28,470,407 11,087,345 52,897,403 - Unamortized loss on bond refinancing (9,612,831) (12,104,850) (1,934,413) (19,783,268) - Net bonds payable 1,100,532, ,554, ,357,376 1,033,730,303 86,577,133 Notes and loans payable 36,128,885 3,561,000 17,115,544 22,574,341 1,487,784 Arbitrage liability 8,656,542 95,917 1,515,139 7,237,320 6,000,690 Compensated absences 124,450,945 46,155,737 40,853, ,753,215 5,629,773 OPEB 70,319,709 23,353,331 29,700 93,643,340 - Net pension obligation 8,055,374 12,661,965 5,351,294 15,366,045 - Termination benefits 2,940,469 36,031 2,014, , ,087 Estimated Self-Insurance Obligation 87,289,950 91,280,533 87,678,889 90,891,594 15,009,838 Governmental activity long-term liabilities $ 1,438,374,656 $ 356,699,411 $ 400,915,989 $ 1,394,158,078 $ 115,439,305 Long-term liabilities other than debt (bonds and loans) are liquidated by the governmental fund incurring the expense. Internal service funds predominantly serve the governmental funds. Accordingly, long-term liabilities for them are included as part of the above totals for governmental activities. At year-end $56,346,406 of internal service funds long-term liabilities are included in the above amounts. Beginning Ending Due within Business-type activities: Balance Additions Reductions Balance One Year Bonds payable: Revenue bonds $ 327,938,000 $ - $ 18,313,000 $ 309,625,000 $ 17,460,000 Unamortized bond premiums 6,484, ,535 5,858,856 - Unamortized loss on bond refinancing (549,865) - (236,396) (313,469) - Net bonds payable 333,872,526-18,702, ,170,387 17,460,000 Arbitrage liability 283, , ,260 - Joint venture liability 1,405,216-1,405, Compensated absences 4,160, , ,670 4,097, ,133 OPEB 151,391 26,208 25, ,997 - Termination benefits 457, , , ,617 Business-type activities long-term liabilities $ 340,330,140 $ 155,446 $ 20,737,933 $ 319,747,653 $ 17,860,750 92
139 NOTES TO THE FINANCIAL STATEMENTS SEPTEMBER 30, 2012 Governmental Activities General Long-Term Debt General long-term debt, including current maturities, at September 30, 2012 consisted of the following: General Obligation Bonds $45,625,000 General Obligation Refunding Bonds, Series 1998 were issued to pay the cost of refunding a portion of the County's General Obligation Bonds, Series 1994 and Series The annual installments range from $3,625,000 to $4,030,000 through December 1, 2014; with an interest rate of 5.500% payable semi-annually on June 1 and December 1 of each year. The bonds are general obligations of the County and are payable from ad valorem revenues. $ 11,480,000 $30,500,000 General Obligation Bonds (Library District Improvement Project), Series 2003 were issued to pay the cost of the land acquisition, design, engineering and constructing of new library facilities and the renovation and rehabilitation of existing library facilities within the County. The remaining annual installment is $1,350,000 due July 1, 2013; with an interest rate of 3.125% payable semi-annually on January 1 and July 1. The bonds are general obligations of the County and are payable from ad valorem revenues. The County advance refunded $18,025,000 of this issue on September 7, $ 1,350,000 $25,000,000 General Obligation Bonds (Recreational and Cultural Facilities), Series 2003 were issued to pay the costs of acquiring, constructing, and improving certain recreational and cultural facilities located within the County including cultural facilities owned by nonprofit corporations with 501(c)(3) status under the Internal Revenue Code, The remaining annual installment is $1,165,000 due July 1, 2013; with interest rate of 3.375% payable semi-annually on January 1 and July 1. The bonds are general obligations of the County and are payable from ad valorem revenues. The County advance refunded $14,730,000 of this issue on October 6, $ 1,165,000 $16,025,000 General Obligation Refunding Bonds (Recreational and Cultural Facilities Program), Series 2005A were issued for paying and defeasing the County's outstanding General Obligation Bonds (Recreational and Cultural Facilities Program), Series 1999A maturing on and after August 1, The annual installments range from $1,465,000 to $1,920,000 through August 1, 2019; with interest rates from 3.500% to 5.000% payable semi-annually on February 1 and August 1 of each year. The bonds are general obligations of the County and are payable from ad valorem revenues. $ 11,815,000 93
140 NOTES TO THE FINANCIAL STATEMENTS SEPTEMBER 30, 2012 $25,000,000 General Obligation Bonds (Recreational and Cultural Facilities), Series 2005 were issued for financing certain recreational and cultural facilities within the County. The annual installments range from $1,080,000 to $1,155,000 through July 1, 2015; with interest rates from 3.375% to 4.000% payable semi-annually on January 1 and July 1 of each year. The bonds are general obligations of the County and are payable from ad valorem revenues. The County advance refunded $15,080,000 of this issue on October 6, $ 3,350,000 $22,335,000 General Obligation Bonds (Library District Improvements), Series 2006 were issued for financing additional library facilities and renovation of existing facilities within the County. The annual installments range from $1,000,000 to $1,665,000 through August 1, 2025; with interest rates from 3.625% to 5.000% payable semi-annually on February 1 and August 1 of each year. The bonds are general obligations of the County and are payable from ad valorem revenues. $ 16,995,000 $50,000,000 General Obligation Bonds (Waterfront Access Projects), Series 2006 were issued for financing the purchase of waterfront access within the County. The annual installments range from $2,120,000 to $3,570,000 through August 1, 2026; with interest rates from 3.700% to 5.000% payable semi-annually on February 1 and August 1 of each year. The bonds are general obligations of the County and are payable from ad valorem revenues. $ 38,700,000 $115,825,000 Taxable General Obligation Refunding Bonds, Series 2006 were issued for paying and defeasing the County's outstanding General Obligation Bonds (Land Acquisition Program), Series 1999B and paying and defeasing the County's outstanding General Obligation Bonds (Land Acquisition Program), Series 2001A. The annual installments range from $7,630,000 to $11,355,000 through June 1, 2020; with interest rates from 5.784% to 5.938% payable semi-annually on June 1 and December 1 of each year. The bonds are general obligations of the County and are payable from ad valorem revenues. $ 75,070,000 $19,530,000 General Obligation Refunding Bonds (Library District Improvement Project), Series 2010 were issued for paying and defeasing the County's outstanding General Obligation Bonds (Library District Improvement Project), Series 2003 maturing on and after July 1, The annual installments range from $245,000 to $2,090,000 through July 1, 2023; with interest rates from 2.000% to 3.000% payable semiannually on January 1 and July 1 of each year. The bonds are general obligations of the County and are payable from ad valorem revenues. $ 18,960,000 94
141 NOTES TO THE FINANCIAL STATEMENTS SEPTEMBER 30, 2012 $28,700,000 General Obligation Refunding Bonds (Recreational and Cultural Facilities), Series 2010 were issued for paying and defeasing a portion of the County's outstanding General Obligation Bonds (Recreational and Cultural Facilities), Series 2003 maturing on and after July 1, 2014 and a portion of its General Obligation Bonds (Recreational and Cultural Facilities), Series 2005 maturing on and after July 1, The annual installments range from $0 to $3,335,000 through July 1, 2025; with interest rates from 4.000% to 5.000% payable semi-annually on January 1 and July 1 of each year. The bonds are general obligations of the County and are payable from ad valorem revenues. $ 28,455,000 Total General Obligation Bonds $ 207,340,000 Non-Ad Valorem Revenue Bonds $233,620,000 Criminal Justice Facilities Revenue Bonds, Series 1990 were issued to pay the cost of the construction of improvements, extensions and additions to the County's jails, courthouses and related justice facilities. The annual installments range from $0 to $19,615,000 through June 1, 2015; with an interest rate of 7.200% payable semiannually on June 1 and December 1 of each year. The bonds are not general obligations of the County and are payable from non-ad valorem revenues. The County advance refunded $120,770,000 of this issue on June 29, 1993 and $33,550,000 on August 21, $ 37,915,000 $32,775,000 Criminal Justice Facilities Revenue Refunding Bonds, Series 1997 were issued to pay the cost of advance refunding a portion of the County's outstanding Criminal Justice Facilities Revenue Bonds, Series The remaining annual installment is $16,785,000 due June 1, 2013; with an interest rate of 5.750% payable semi-annually on June 1 and December 1. The bonds are not general obligations of the County and are payable from non-ad valorem revenues. $ 16,785,000 $18,560,000 Criminal Justice Facilities Revenue Refunding Bonds, Series 2002 were issued to pay the cost of advance refunding a portion of the County's outstanding Criminal Justice Facilities Revenue Bonds, Series The annual installments range from $1,830,000 to $2,015,000 through June 1, 2015; with an interest rate of 5.000% payable semi-annually on June 1 and December 1 of each year. The bonds are not general obligations of the County and are payable from non-ad valorem revenues. $ 5,765,000 95
142 NOTES TO THE FINANCIAL STATEMENTS SEPTEMBER 30, 2012 $6,525,000 Public Improvement Recreation Facilities Revenue Refunding Bonds, Series 2003 were issued to pay the cost of refunding all of the County's outstanding Public Improvement Recreation Facilities Revenue Bonds, Series The annual installments range from $660,000 to $685,000 through July 1, 2014; with interest rates from 3.625% to 4.000% payable semi-annually on January 1 and July 1 of each year. The bonds are not general obligations of the County and are payable from non-ad valorem revenues. $ 1,345,000 $94,300,000 Public Improvement Revenue and Refunding Bonds, Series 2004 were issued to pay the cost of refunding the County's Revenue Refunding Bond Anticipation Note (Light Industrial Complex Project), Series 2002, refunding the County's Airport Centre Revenue Bonds, Series 1992 and paying the costs of acquiring, constructing, and renovating certain capital facilities. The annual installments range from $4,350,000 to $4,895,000 through August 1, 2014; with an interest rate of 5.000% payable semi-annually on February 1 and August 1 of each year. The bonds are not general obligations of the County and are payable from non-ad valorem revenues. The County advance refunded $50,255,000 of this issue on June 28, $ 9,245,000 $81,340,000 Public Improvement Revenue Refunding Bonds (Convention Center Project), Series 2004 were issued to finance the costs of advance refunding the County's Public Improvement Revenue Bonds, Series 2001 (Convention Center Bonds). The annual installments range from $2,665,000 to $2,850,000 through November 1, 2014; with interest rates from 3.000% to 5.000% payable semi-annually on May 1 and November 1 of each year. The bonds are not general obligations of the County and are payable from non-ad valorem revenues. The County advance refunded $64,005,000 of this issue on August 31, $ 8,265,000 $38,895,000 Public Improvement Revenue Bonds (Biomedical Research Park Project), Series 2004A were issued to pay the outstanding principal and interest on the County's Public Improvement Revenue Bond Anticipation Notes (Biomedical Research Park Project), Series 2004B. The annual installments range from $1,720,000 to $1,835,000 through November 1, 2014; with interest rates from 3.200% to 3.500% payable semi-annually on May 1 and November 1 of each year. The bonds are not general obligations of the County and are payable from non-ad valorem revenues. The County advance refunded $22,725,000 of this issue on June 28, $ 5,330,000 96
143 NOTES TO THE FINANCIAL STATEMENTS SEPTEMBER 30, 2012 $24,427,515 Taxable Public Improvement Revenue Bonds (Biomedical Research Park Project), Series 2004B were issued to pay the outstanding principal and interest on the County's Taxable Public Improvement Revenue Bond Anticipation Notes (Biomedical Research Park Project), Series 2004C. The annual installments are $2,442,751 through November 1, 2014; with a variable rate of interest in effect of 0.315% which is calculated on a daily basis payable semi-annually on May 1 and November 1 of each year. The bonds are not general obligations of the County and are payable from non-ad valorem revenues. $ 7,328,253 $17,455,000 Parks and Recreation Facilities Revenue Refunding Bonds, Series 2005 were issued to pay the cost of refunding the County's Parks and Recreation Facilities Revenue Bonds, Series 1996 maturing on and after November 1, The annual installments range from $1,700,000 to $2,000,000 through November 1, 2016; with interest rates from 3.625% to 5.000% payable semi-annually on May 1 and November 1 of each year. The bonds are not general obligations of the County and are payable from non-ad valorem revenues. $ 9,215,000 $13,485,000 Revenue Refunding Bonds (North County Courthouse and Sheriff's Motor Pool Facility Projects), Series 2005 were issued to pay the cost of defeasing a portion of the County's outstanding Revenue Improvement Bonds, Series 1997 (North County Courthouse and Sheriff's Motor Pool Facilities Projects). The annual installments range from $1,295,000 to $1,605,000 through December 1, 2017; with interest rates from 3.300% to 5.000% payable semi-annually on June 1 and December 1 of each year. The bonds are not general obligations of the County and are payable from non-ad valorem revenues. $ 8,645,000 $9,520,000 Public Improvement Revenue Refunding Bonds, Judicial Center Parking Facilities, Series 2005 were issued to pay the cost of refunding the County's Public Improvement Revenue Bonds, Judicial Parking Facilities, Series 1995 maturing on and after November 1, The annual installments range from $990,000 to $1,120,000 through November 1, 2015; with interest rates from 3.750% to 5.000% payable semi-annually on May 1 and November 1 of each year. The bonds are not general obligations of the County and are payable from non-ad valorem revenues. $ 4,210,000 97
144 NOTES TO THE FINANCIAL STATEMENTS SEPTEMBER 30, 2012 $133,935,000 Public Improvement Revenue Bonds (Biomedical Research Park Project), Series 2005A were issued to pay the cost of funding a grant to The Scripps Research Institute to enable Scripps to pay a portion of the cost of acquiring, constructing, improving and equipping the "Permanent Facilities" and paying the outstanding principal and interest due on the County's $20,000,000 Public Improvement Revenue Bond Anticipation Notes, Series The annual installments range from $5,675,000 to $6,255,000 through June 1, 2015; with an interest rate of 5.000% payable semi-annually on June 1 and December 1 of each year. The bonds are not general obligations of the County and are payable from non-ad valorem revenues. The County advance refunded $82,625,000 of this issue on June 28, $ 17,890,000 $20,070,000 Stadium Facilities Revenue Refunding Bonds, Series 2005 were issued to pay the cost of refunding all of the County's outstanding Stadium Facilities Revenue Bonds, Series The annual installments range from $1,775,000 to $2,090,000 through December 1, 2016; with interest rates of 3.250% to 5.000% payable semi-annually on June 1 and December 1 of each year. The bonds are not general obligations of the County and are payable from non-ad valorem revenues. $ 9,590,000 $13,028,760 Public Improvement Revenue Bonds (Florida Atlantic University Laboratory and Research Facility Project), Series 2005 were issued to pay the cost of the design, development and construction of a laboratory and research facility on the Jupiter, Florida Campus of Florida Atlantic University. The annual installments range from $1,578,538 to $1,641,680 through January 1, 2014; with a variable rate of interest in effect of 0.541% which is calculated on a daily basis payable semiannually on January 1 and July 1 of each year. The bonds are not general obligations of the County and are payable from non-ad valorem revenues. $ 3,220,218 $14,685,000 Public Improvement Revenue Bonds (Parking Facilities Expansion Project), Series 2006 were issued to pay the costs of construction related to the expansion of the Judicial Center Parking Garage. The annual installments range from $600,000 to $1,085,000 through December 1, 2026; with interest rates of 4.000% to 5.000% payable semi-annually on June 1 and December 1 of each year. The bonds are not general obligations of the County and are payable from non-ad valorem revenues. $ 12,080,000 98
145 NOTES TO THE FINANCIAL STATEMENTS SEPTEMBER 30, 2012 $2,582,648 Public Improvement Revenue Refunding Bond (Biomedical Research Park Project), Series 2007A was issued to pay the County s outstanding Public Improvement Revenue Note (Biomedical Research Park Infrastructure Project), Series 2006A and Taxable Public Improvement Revenue Note (Biomedical Research Park Infrastructure Project), Series 2006B. The annual installments range from $101,254 to $182,616 through November 1, 2027; with an interest rate of 4.010% payable semi-annually on May 1 and November 1 of each year. The bonds are not general obligations of the County and are payable from non-ad valorem revenues. $ 2,211,597 $5,180,949 Taxable Public Improvement Revenue Refunding Bond (Biomedical Research Park Project), Series 2007B was issued to pay the County s outstanding Public Improvement Revenue Note (Biomedical Research Park Infrastructure Project), Series 2006A and Taxable Public Improvement Revenue Note (Biomedical Research Park Infrastructure Project), Series 2006B. The annual installments range from $182,966 to $411,965 through November 1, 2027; with an interest rate of 5.560% payable semi-annually on May 1 and November 1 of each year. The bonds are not general obligations of the County and are payable from non-ad valorem revenues. $ 4,530,659 $98,080,000 Public Improvement Revenue Bonds (Biomedical Research Park Project), Series 2007C were issued to redeem the County s Public Improvement Revenue Bond Anticipation Notes (Biomedical Research Park Project), Series 2006, to fund a grant to the Scripps Research Institute to enable Scripps to pay a portion of the cost of their permanent facilities, and to pay for the preparation of the Briger Site for development. The annual installments range from $3,620,000 to $7,490,000 through November 1, 2027; with interest rates from 4.250% to 5.000% payable semi-annually on May 1 and November 1 of each year. The bonds are not general obligations of the County and are payable from non-ad valorem revenues. $ 85,045,000 $35,075,000 Public Improvement Revenue Bonds (Law Enforcement Information Technology Project), Series 2008 were issued to pay the cost of law enforcement technology equipment and software. The annual installments range from $6,110,184 to $6,298,675 through February 1, 2014; with an interest rate of 3.038% payable semi-annually on February 1 and August 1 of each year. The bonds are not general obligations of the County and are payable from non-ad valorem revenues. $ 12,408,858 99
146 NOTES TO THE FINANCIAL STATEMENTS SEPTEMBER 30, 2012 $29,476,000 Public Improvement Revenue Refunding Bonds, Series 2008A were issued to refund three variable rate loans with the Sunshine State Governmental Financing Commission. The annual installments range from $1,093,000 to $2,491,000 through December 1, 2020; with an interest rate of 3.497% payable semi-annually on June 1 and December 1 of each year. The bonds are not general obligations of the County and are payable from non-ad valorem revenues. $ 16,684,000 $176,585,000 Public Improvement Revenue Bonds, Series 2008 were issued to pay for additional criminal justice (law enforcement) facilities. The annual installments range from $3,510,000 to $10,730,000 through May 1, 2038; with interest rates from 4.000% to 5.000% payable semiannually on May 1 and November 1 of each year. The bonds are not general obligations of the County and are payable from non-ad valorem revenues. $ 164,790,000 $94,235,000 Public Improvement Revenue Bonds, Series were issued to fund a grant to Max Planck Florida Corporation to establish a biomedical research facility in the County and also to refinance the County s five Series J variable rate loans with the Sunshine State Governmental Financing Commission. The annual installments range from $3,280,000 to $7,295,000 through November 1, 2028; with interest rates from 4.000% to 5.500% payable semi-annually on May 1 and November 1 of each year. The bonds are not general obligations of the County and are payable from non-ad valorem revenues. $ 84,970,000 $11,598,107 Taxable Public Improvement Revenue Bonds (Convention Center Hotel Project), Series 2010 were issued to pay the principal on the County s Taxable Public Improvement Revenue Bond Anticipation Notes (Convention Center Hotel Project), Series The annual installments range from $561,856 to $1,066,262 through November 1, 2024; with an interest rate of 5.484% payable semi-annually on May 1 and November 1 of each year. The bonds are not general obligations of the County and are payable from non-ad valorem revenues. $ 10,264,046 $30,691,407 Revenue Improvement Bond (Ocean Avenue Lantana Bridge and Max Planck Florida Corporation Projects), Series 2011 was issued to finance the costs of demolition and reconstruction of the Ocean Avenue Lantana Bridge and to fund a $15,615,000 Grant to the Max Planck Florida Corporation. The annual installments range from $1,158,312 to $2,032,212 through August 1, 2031; with an interest rate of 3.172% payable semi-annually on February 1 and August 1 of each year. The bonds are not general obligations of the County and are payable from non-ad valorem revenues. $ 29,579,
147 NOTES TO THE FINANCIAL STATEMENTS SEPTEMBER 30, 2012 $62,775,000 Public Improvement Revenue Refunding Bonds (Convention Center Project), Series 2011 were issued to defease and pay at redemption that portion of the County s outstanding $81,340,000 original aggregate principal amount of Public Improvement Revenue Refunding Bonds (Convention Center Project), Series 2004 maturing on November 1, The annual installments range from $0 to $5,560,000 through November 1, 2030; with an interest rate of 5.000% payable semi-annually on May 1 and November 1 of each year. The bonds are not general obligations of the County and are payable from non-ad valorem revenues. $ 62,775,000 $16,189,340 Capital Improvement Revenue Bond (Four Points and Other Public Buildings Projects), Series 2012 was issued to pay the County s Capital Improvement Bond Anticipation Notes, Series The annual installments range from $987,273 to $1,176,435 through March 1, 2027; with an interest rate of 2.520% payable semi-annually on March 1 and September 1 of each year. The bonds are not general obligations of the County and are payable from non-ad valorem revenues. $ 16,189,340 $147,000,000 Public Improvement Revenue Refunding Bonds, Series 2012 were issued to defease and redeem the County's outstanding Public Improvement Revenue and Refunding Bonds, Series 2004 maturing on and after August 1, 2015 and its Public Improvement Revenue Bonds (Biomedical Research Park Project), Series 2004A maturing on and after November 1, 2015 and its Public Improvement Revenue Bonds (Biomedical Research Park Project), Series 2005A maturing on and after June 1, The annual installments range from $0 to $17,395,000 through June 1, 2025; with interest rates from 3.000% to 5.000% payable semi-annually on June 1 and December 1 of each year. The bonds are not general obligations of the County and are payable from non-ad valorem revenues. $ 147,000,000 Total Non-Ad Valorem Revenue Bonds $ 793,276,168 Face Amount of Bonds Payable $1,000,616,168 Unamortized bond premiums 52,897,403 Unamortized loss on bond refinancing (19,783,268) Net General Obligation and Non-Ad Valorem Revenue Bonds $1,033,730,
148 Notes and Loans Payable PALM BEACH COUNTY, FLORIDA NOTES TO THE FINANCIAL STATEMENTS SEPTEMBER 30, 2012 $1,660,000 - HUD Section 108 Loan #1, 2004, payable to the Secretary of Housing and Urban Development due in annual installments ranging from $87,000 to $94,000 through August 1, 2023; with interest rates of 5.080% to 5.970% payable semi-annually on February 1 and August 1 of each year. The loan is a general obligation of the County. The debt service will be paid using the cash flows received by the County from the sub-recipient borrower. In the event the cash flows from the subrecipient are not sufficient to service the HUD loan, the County is obligated to use other resources. $ 964,000 $11,697,676 Public Improvement Revenue Note (Environmentally Sensitive Land Acquisition Project) Series 2008 was issued to pay the cost of the acquisition of environmentally sensitive land in Palm Beach County. The annual installments are $584,884 through August 1, 2028; with a variable rate of interest in effect of 1.074% payable semiannually on February 1 and August 1 of each year. The note is not a general obligation of the County and is payable from non-ad valorem revenues. $ 9,358,141 $1,779,000 - HUD Section 108 Loan. $2,600,000 is authorized leaving $821,000 available for future financing. The HUD Loan was obtained to provide funding for County loans to various borrowers for the Belle Glade Avenue A Revitalization Project. The annual installments range from $35,000 to $101,900 through August 1, 2031; with a variable rate of interest in effect of 0.560% payable quarterly on February 1, May 1, August 1 and November 1 of each year. The loans are general obligations of the County. The debt service will be paid using the cash flows received by the County from the sub-recipient borrowers. In the event the cash flows from the sub-recipients are not sufficient to service the HUD loans, the County is obligated to use other resources. As of September 30, 2012 the outstanding individual loans are as follows: $199,000 - Glades Gas & Electric, 2009 $ 154,000 89,000 - Glades Home Health Care Med Ctr, , ,000 - Muslet Brothers, ,000 21,000 - Building 172, Belle Glade, , ,000 - America s Sound, ,000 $ 1,647,
149 NOTES TO THE FINANCIAL STATEMENTS SEPTEMBER 30, 2012 $10,823,000 - HUD Section 108 Loan. $13,340,000 is authorized leaving $2,517,000 available for future financing. The HUD Loan was obtained to provide funding for County loans to various borrowers for the Community Development Business Loan Program Project. The annual installments range from $70,000 to $604,000 through August 1, 2032; with a variable rate of interest in effect of 0.560% payable quarterly on February 1, May 1, August 1 and November 1 of each year. The loans are general obligations of the County. The debt service will be paid using the cash flows received by the County from the sub-recipient borrowers. In the event the cash flows from the sub-recipients are not sufficient to service the HUD loans, the County is obligated to use other resources. As of September 30, 2012 the outstanding individual loans are as follows: $1,000,000 - The Baron Group, 2009 $ 700,000 57,000 - Kiddie Haven Pre-School, , ,000 - Concrete Services LLC, ,000 5,948,000 - Oxygen Development LLC, ,886, ,000 - Donia Adams Roberts PA, , ,000 - Ameliascapes, , ,000 - F&T of Belle Glade, ,000 1,412,000 - Glades Plaza Enterprises LLC, ,412, ,000 - Doctors Scientific Organica, , ,000 - Schomburg Latin America LLC, , ,000 - Medical Career Institute, , ,000 - A&E Auto Sales, ,000 $ 10,361,000 $252,000 - HUD Section 108 Loan. $2,824,000 is authorized leaving $2,572,000 available for future financing. The HUD Loan was obtained to provide funding for County loans to various borrowers for the Pahokee Downtown Revitalization Project. The annual installments range from $6,000 to $14,000 through August 1, 2031; with a variable rate of interest in effect of 0.560% payable quarterly on February 1, May 1, August 1 and November 1 of each year. The loans are general obligations of the County. The debt service will be paid using the cash flows received by the County from the sub-recipient borrowers. In the event the cash flows from the sub-recipient are not sufficient to service the HUD loans, the County is obligated to use other resources. As of September 30, 2012 the outstanding individual loans are as follows: $152,000 - Circle S Pharmacy, 2010 $ 144, ,000 - Simco, ,000 $ 244,000 Total Notes and Other Loans Payable $ 22,574,
150 NOTES TO THE FINANCIAL STATEMENTS SEPTEMBER 30, 2012 Lines of Credit On May 21, 2009, the County entered into a line of credit agreement with a financial institution to support the issuance of letters of credit to satisfy the debt service reserve funding requirements for several of the County s outstanding bond issues. Principal borrowed on the line of credit is due at maturity on May 20, Interest on the principal balance accrues at a rate equivalent to the one-month LIBOR rate plus 1.500% and is paid quarterly. The County does not anticipate that any draws on the letters of credit will occur. The County will use non-ad valorem revenues to fund the letter of credit fees. As of September 30, 2012, this $33,709,176 line of credit, covering the following outstanding bond issues, had no outstanding balance on the loan payable. $233,620,000 Criminal Justice Facilities Revenue Bonds, Series 1990 $21,029,880 $ 18,560,000 Criminal Justice Facilities Revenue Refunding Bonds, Series ,116,750 $ 81,340,000 Public Improvement Revenue Refunding Bonds (Convention Center Project), Series ,905,609 $ 98,080,000 Public Improvement Revenue Bonds (Biomedical Research Park Project), Series 2007C 7,656,937 $33,709,176 On June 4, 2009, the County entered into a line of credit agreement with a financial institution to support the issuance of standby letters of credit to satisfy the debt service reserve funding requirements for several of the County s outstanding bond issues. Principal borrowed on the line of credit is due at maturity on June 3, Interest on the principal balance accrues at a rate per year equal to the sum of (i) the Prime Rate plus (ii) for the first 30 days such amount is outstanding, 0%; for the 31 st through 60 th day such amount is outstanding, 0.5%; for the 61 st through 90 th day such amount is outstanding, 1.0%; and after the 90 th day, 2.0%. The County does not anticipate that any draws on the letters of credit will occur. The County will use non-ad valorem revenues to fund the letter of credit fees. As of September 30, 2012, this $22,568,948 line of credit, covering the following outstanding bond issues, had no outstanding balance on the loan payable. $ 38,895,000 Public Improvement Revenue Bonds (Biomedical Research Park Project), Series 2004A $ 2,836,625 $133,935,000 Public Improvement Revenue Bonds (Biomedical Research Park Project), Series 2005A 10,816,
151 NOTES TO THE FINANCIAL STATEMENTS SEPTEMBER 30, 2012 $ 94,300,000 Public Improvement Revenue and Refunding Bonds, Series ,762,385 $ 14,685,000 Public Improvement Revenue Bonds (Parking Facilities Expansion Project), Series ,153,300 $22,568,948 Arbitrage Liability Certain County debt obligations are subject to Section 148 of the Internal Revenue Code which requires that interest earned on proceeds from taxexempt debt be rebated to the federal government to the extent that those earnings exceed the interest cost of the related tax-exempt debt. The arbitrage rebate must be calculated and paid to the federal government every five years from the date of issue until the debt matures. The County employs a consultant to make computations on an annual basis. However, since the rebate is cumulative (excess earnings in one year can be offset with deficit earnings in another year), the annually computed estimate may change significantly (increase or decrease) before the actual due date. $ 7,237,320 Compensated absences Compensated absences are liquidated by the governmental fund incurring the expense. General Fund: Board of County Commissioners $ 15,133,157 Sheriff 85,872,982 Tax Collector 1,109,279 Property Appraiser 2,453,356 Supervisor of Elections 244,185 Total General Fund $104,812,959 Special Revenue Funds 23,562,435 Capital Projects Fund 588,717 Internal Service Funds 789,104 $ 129,753,215 OPEB (See note on OPEB) 93,643,340 Net pension obligation (See note on Retirement Plans) 15,366,045 Termination benefits (See note on Commitments) 961,920 Estimated Self-Insurance Obligation (See note on Risk Management) 90,891,594 Total Governmental Activities General Long-Term Debt including current portion $1,394,158,
152 Business-type Activities Long-Term Debt PALM BEACH COUNTY, FLORIDA NOTES TO THE FINANCIAL STATEMENTS SEPTEMBER 30, 2012 Business-type long-term debt, including current portion, at September 30, 2012 consisted of the following: Revenue Bonds $26,785,000 Water and Sewer Revenue Refunding Bonds, Series 2003 were issued to pay for refunding all of the County's outstanding Water and Sewer Revenue Bonds, Series 1993A and Water and Sewer Revenue Refunding Bonds, Series 1993B maturing on and after October 1, The annual installments range from $1,080,000 to $1,120,000 through October 1, 2013; with an interest rate of 5.000% payable semi-annually on April 1 and October 1 of each year. The bonds are not general obligations of the County and are secured by a first lien on and pledge of the net revenues of the County's Water and Sewer system and a first lien on and pledge of the connection charges of the system. $ 2,200,000 $125,850,000 Water and Wastewater Revenue Bonds, Series 2006A were issued to pay a portion of the costs of constructing certain additions and improvements to the County's water and wastewater facilities and acquisition of certain water and wastewater assets from the Village of Royal Palm Beach, Florida. The annual installments range from $2,430,000 to $7,760,000 through October 1, 2036; with interest rates from 4.000% to 5.000% payable semi-annually on April 1 and October 1 of each year. The bonds are not general obligations of the County and are secured by a first lien on and pledge of the net revenues of the County's Water and Wastewater System and a first lien on and pledge of the connection charges of the system. $ 114,930,000 $12,485,000 Water and Sewer Revenue Refunding Bonds, Series 2006B were issued to pay for the refunding of the County's Water and Sewer Revenue Bonds, Series 1998 maturing on and after October 1, The annual installments range from $1,845,000 to $2,245,000 through October 1, 2017; with interest rates from 4.000% to 4.250% payable semi-annually on April 1 and October 1 of each year. The bonds are not general obligations of the County and are secured by a first lien on and pledge of the net revenues of the County's Water and Sewer system and a first lien on and pledge of the connection charges of the system. $ 12,225,
153 NOTES TO THE FINANCIAL STATEMENTS SEPTEMBER 30, 2012 $68,115,000 Water and Sewer Revenue Bonds, Series 2009 (FPL Reclaimed Water Project) were issued to finance the acquisition and construction of additions to the County s Water and Sewer System and to reimburse Florida Power and Light for costs advanced by them. The annual installments range from $0 to $4,225,000 through October 1, 2040; with interest rates from 4.000% to 5.250% payable semi-annually on April 1 and October 1 of each year. The bonds are not general obligations of the County and are secured by a first lien on and pledge of the net revenues of the County's Water and Sewer System and a first lien on and pledge of the connection fees. $ 59,195,000 $60,150,000 Airport System Revenue Refunding Bonds, Series 2002 were issued to refund the Airport System Revenue Bonds, Series 1992 maturing October 1, The annual installments range from $10,995,000 to $12,500,000 through October 1, 2014; with an interest rate of 5.750% payable semi-annually on April 1 and October 1 of each year. The bonds are not general obligations of the County and are payable solely from and secured from the net revenues available for Debt Service and the funds and accounts pledged under the bond resolution. $ 35,140,000 $69,080,000 Airport System Revenue Refunding Bonds, Series 2006A were issued to pay a portion of the costs of constructing certain facilities and improvements to the Airport System. The annual installments range from $0 to $6,055,000 through October 1, 2036; with interest rates from 4.700% to 5.000% payable semi-annually on April 1 and October 1 of each year. The bonds are not general obligations of the County and are payable solely from and secured from the net revenues available for Debt Service and the funds and accounts pledged under the bond resolution. $ 69,080,000 $16,855,000 Airport System Revenue Refunding Bonds, Series 2006B were issued to advance refund a portion of the Airport System Revenue Bonds, Series 2001 and a portion of the Airport System Revenue Bonds, Series The annual installments range from $0 to $3,225,000 through October 1, 2020; with an interest rate of 5.905% payable semiannually on April 1 and October 1 of each year. The bonds are not general obligations of the County and are payable solely from and secured from the net revenues available for Debt Service and the funds and accounts pledged under the bond resolution. $ 16,855,000 Total face value of revenue bonds payable $ 309,625,000 Unamortized bond premiums 5,858,856 Unamortized loss on bond refinancing (313,469) Net Revenue Bonds, Business-Type Activities $ 315,170,387 Arbitrage liability (See explanation in Governmental Activities section) $ 164,
154 NOTES TO THE FINANCIAL STATEMENTS SEPTEMBER 30, 2012 Compensated absences Compensated absences are liquidated by the business type fund incurring the expense. Business-Type Fund Water Utilities Department $ 3,014,837 Department of Airports 1,082,906 $ 4,097,743 OPEB (See note on OPEB) 151,997 Termination benefits (See note on Retirement Plans) 163,266 Total Business-Type Activities Long-Term Debt, including current portion $ 319,747,653 Annual debt service requirements to maturity for governmental activities long-term debt are as follows: Governmental Activities General Long-Term Debt General Obligation Bonds Non-Ad Valorem Revenue Bonds Notes and Loans Payable Year Ending September 30 Principal Interest Principal Interest Principal Interest Total 2013 $ 20,130,000 $ 9,933,856 $ 66,447,134 $ 36,551,303 $ 1,487,783 $ 222,585 $ 134,772, ,010,000 8,950,838 69,035,997 34,225,688 1,500, , ,931, ,025,000 7,920,310 63,041,615 31,049,274 1,501, , ,730, ,845,000 6,938,953 39,887,747 27,820,823 1,502, ,929 95,172, ,790,000 5,992,212 40,537,715 25,957,113 1,502, ,230 93,941, ,405,000 15,416, ,239, ,850,480 6,781, , ,264, ,135,000 2,594, ,750,019 56,805,445 5,830, , ,346, ,156,132 23,609,181 2,466,884 30, ,262, ,450,000 9,876, ,326, ,730, , ,266,500 Total $ 207,340,000 $ 57,746,987 $ 793,276,168 $ 350,282,557 $ 22,574,341 $ 1,794,640 $ 1,433,014,693 Annual debt service requirements to maturity for business-type activities long-term debt are as follows: Business-type Activities Long-Term Debt Revenue Bonds Year Ending September 30 Principal Interest Total 2013 $ 17,460,000 $ 15,234,500 $ 32,694, ,385,000 14,277,824 32,662, ,385,000 13,300,981 31,685, ,550,000 12,601,894 21,151, ,985,000 12,164,483 21,149, ,615,000 54,284,301 95,899, ,215,000 43,252,738 91,467, ,515,000 29,594,825 91,109, ,640,000 12,054,552 90,694, ,875, ,625 8,705,625 Total $ 309,625,000 $ 207,596,723 $ 517,221,
155 NOTES TO THE FINANCIAL STATEMENTS SEPTEMBER 30, 2012 CONDUIT DEBT The County issues Industrial Development Bonds to provide financial assistance to not-for-profit and private-sector entities for the acquisition and construction of industrial and commercial facilities deemed to be in the public interest. The County is not obligated in any manner for repayment of the bonds. Accordingly, the bonds are not reported as liabilities in the accompanying financial statements. During the current reporting period, four series of Industrial Development Bonds were issued with an aggregate par value of $86 million. As of September 30, 2012, there were forty-one series of Industrial Development Bonds outstanding, with an estimated aggregate principal amount payable of $601 million. COMPONENT UNIT Solid Waste Authority (SWA) NOTE PAYABLE On January 9, 2008, the SWA entered into an $80 million Subordinated Improvement Revenue Note, Series 2008 (the Series 2008 Note ) with CitiCapital Municipal Finance to finance costs incurred in connection with the relocation of facilities and improvements to the solid waste system. Interest on the outstanding principal balance of the Series 2008 Note accrues at a rate equivalent to 65% of the one month LIBOR rate plus 82 basis points (approximately 0.96% at September 30, 2012) and is due semi-annually in arrears on April 1 st and October 1 st. The outstanding principal balance on the Series 2008 Note was $64 million at September 30, 2012 and is payable in annual installments of $4 million on October 1 st through maturity on October 1, Borrowings on the Series 2008 Note are payable from and secured by a pledge of the net revenues of the solid waste system and all moneys and amounts held under the SWA s trust indenture, subordinate to the lien and pledge of net revenues and trust amounts for repayment of the SWA s bonds. The Series 2008 Note may be prepaid by the SWA on any principal or interest payment date. REVENUE BONDS PAYABLE Revenue bonds payable by the SWA at September 30, 2012 are summarized as follows: Series 2011 Series 2009 Series 2008B Series 2002B Unamortized premium and discount, net Net revenue bonds payable Less current maturities $ 599,860, ,045, ,565,000 38,734,386 45,742,726 1,074,947,112 (11,150,000) Revenue bonds payable, long-term portion $ 1,063,797,112 Series 2011: $599,860,000 Solid Waste Authority of Palm Beach County Refunding Revenue Bonds, Series 2011 dated October 26, The Series 2011 Bonds were issued for the purpose of providing funds, together with other legally available monies, to refund and retire the SWA s Improvement Revenue Bonds, Series 2010 and to pay the costs of issuance of the Series 2011 Bonds. The proceeds were placed in a defeasance escrow account until January 12, On that date, a portion of the proceeds was transferred to the Debt Service Reserve Account, the portion required for the Cost of Acquisition and Construction of the mass burn facility was transferred to the 2010 Project 109
156 NOTES TO THE FINANCIAL STATEMENTS SEPTEMBER 30, 2012 Construction Fund and the remaining portion of the proceeds, together with a portion of the proceeds of the 2011 Bonds, was used to fully pay the tender price to retire the Series 2010 Bonds. Interest on the Series 2011 Bonds is payable semiannually on April 1 st and October 1 st and principal payments are due on October 1 st, beginning October 1, 2012 with the final payment due on October 1, The debt service requirements and interest rates of the Series 2011 Bonds are as follows: Year Ending September Interest Rate Principal Interest Total 2.00% $ 8,650,000 10,510,000 10,700,000 5,045,000 4,620,000 15,045,000 16,750,000 18,515,000 21,370,000 20,340,000 21,285,000 22,310,000 33,095,000 42,045,000 44,310,000 46,600,000 52,045,000 65,545,000 68,820,000 72,260,000 $ 599,860,000 $ 28,756,800 28,565,200 28,279,850 28,012,275 27,855,650 27,419,000 26,652,900 25,811,275 24,869,900 23,882,900 22,864,025 21,775,900 20,390,775 18,512,275 16,354,881 14,085,094 11,621,931 8,685,144 5,329,000 1,805,000 $ 411,529,775 $ 37,406,800 39,075,200 38,979,850 33,057,275 32,475,650 42,464,000 43,402,900 44,326,275 46,239,900 44,222,900 44,149,025 44,085,900 53,485,775 60,557,275 60,664,881 60,685,094 63,666,931 74,230,144 74,149,000 74,065,000 $1,011,389,775 Series 2009: $261,545,000 Solid Waste Authority of Palm Beach County Improvement Revenue Bonds, Series 2009 dated April 23, The Series 2009 Bonds were issued for the purpose of funding various solid waste system projects, funding a deposit to the Debt Service Reserve Account, purchasing a bond insurance policy on the Series 2009 Bonds, and paying the costs of issuance for the Series 2009 Bonds. Interest on the Series 2009 Bonds is payable semi-annually on April 1 st and October 1 st and principal payments are due on October 1 st, beginning October 1, 2011 with the final payment due on October 1, For marketing purposes, the 2009 bonds maturing on October 1, 2017 through October 1, 2023 were offered with two different coupon rates and prices producing identical yields. The debt service requirements and interest rates of the Series 2009 Bonds are as follows: 110
157 NOTES TO THE FINANCIAL STATEMENTS SEPTEMBER 30, 2012 Year Ending September Interest Rate Principal Interest Total 3.00% $ 2,500,000 $ 13,061,880 $ 15,561, ,695,000 12,983,955 15,678, ,895,000 12,900,105 15,795, ,095,000 12,808,708 15,903, ,650,000 12,698,685 16,348, ,485,000 23,690,000 25,025,000 26,400,000 27,935,000 29,525,000 31,270,000 22,410,000 7,920,000 8,335,000 8,855,000 10,360,000 $ 259,045,000 12,096,635 10,955,991 9,732,879 8,406,410 6,973,166 5,437,318 3,775,306 2,359,650 1,601,400 1,195, , ,950 $ 128,024,338 34,581,635 34,645,991 34,757,879 34,806,410 34,908,166 34,962,318 35,045,306 24,769,650 9,521,400 9,530,025 9,620,275 10,631,950 $ 387,069,338 Series 2008B: $131,565,000 Solid Waste Authority of Palm Beach County Improvement Revenue Bonds, Series 2008B dated November 25, The Series 2008B Bonds were issued for the purpose of funding various solid waste system projects, funding a deposit to the Debt Service Reserve Account, and paying the costs of issuance for the Series 2008B Bonds. Interest on the Series 2008B Bonds is payable semi-annually on April 1 st and October 1 st and principal payments are due on October 1 st, beginning October 1, 2024 with the final payment due on October 1, The debt service requirements and interest rates of the Series 2008B bonds are as follows: 111
158 NOTES TO THE FINANCIAL STATEMENTS SEPTEMBER 30, 2012 Year Ending September Interest Rate Principal Interest Total 5.50% $ ,700,000 27,035,000 28,630,000 30,235,000 34,965,000 $ 131,565,000 $ 7,241,394 7,241,394 7,241,394 7,241,394 7,241,394 7,241,394 7,241,394 7,241,394 7,241,394 7,241,394 7,241,394 7,241,394 6,944,484 5,904,113 4,373,325 2,754, ,534 $ 107,834,722 $ 7,241,394 7,241,394 7,241,394 7,241,394 7,241,394 7,241,394 7,241,394 7,241,394 7,241,394 7,241,394 7,241,394 7,241,394 17,644,484 32,939,113 33,003,325 32,989,538 35,926,534 $ 239,399,722 Series 2002: $30,560,000 Solid Waste Authority of Palm Beach County Refunding Revenue Bonds, Series 2002A and $39,869,386 Revenue Bonds, Series 2002B, both dated November 7, The Series 2002B Bonds include term bonds of $1,135,000 and capital appreciation bonds of $38,734,386. The Series 2002 Bonds were issued for the purpose of currently refunding the Series 1992 bonds due on December 1, 2003 and thereafter, providing $39 million for capital improvements to the solid waste system, and paying the costs of issuance for the Series 2002 Bonds. Net proceeds of approximately $31.3 million from the Series 2002A Bonds plus approximately $740,000 of sinking fund monies were used to purchase U.S. Government securities. Those securities were deposited in an irrevocable trust with an escrow agent to provide sufficient funds to call and retire the remaining $30,530,000 Series 1992 Bonds on December 12, The advance refunding of the Series 1992 Bonds by the SWA reduced its aggregate debt service payments by approximately $1,984,000 over the life of the bonds and produced an economic gain (the difference between the present values of the old and new debt service payments) of approximately $1,162,000. Interest on the Series 2002 Bonds, except for the $38,734,386 Series 2002B capital appreciation bonds, is payable semi-annually on April 1 st and October 1 st and principal payments are due October 1 st. The debt service requirements and interest rates of the remaining Series 2002B Bonds are as follows: Year Ending September Interest Rate Principal Interest Total 4.850% $ 13,769,586 12,961,000 12,003,800 $ 10,585,414 11,394,000 12,006,200 $ 24,355,000 24,355,000 24,010,000 $ 38,734,386 $ 33,985,614 $ 72,720,
159 NOTES TO THE FINANCIAL STATEMENTS SEPTEMBER 30, 2012 Annual Maturities: The aggregate maturities for the outstanding bonds of the SWA, including total interest of $681,374,449 are as follows: Year Ending September Revenue Bonds $ 60,210,074 61,995,549 86,371,349 80,557,377 80,075, ,563, ,841, ,964,466 $ 1,710,578,835 Interest Expense: Total interest costs incurred on all SWA debt for the year ended September 30, 2012 were $51,834,051. For the year ended September 30, 2012, interest costs of $18,677,548 were capitalized on construction in progress and $33,156,503 was expensed. Defeased Bonds: In 2012, the SWA defeased $11,479,972 Refunding Revenue Bonds, Series 1998A, by placing available cash in an irrevocable trust to provide for all future debt service payments on these bonds. The trust account assets and the liability for these defeased bonds are not included in the SWA s financial statements. At September 30, 2012, defeased Series 1998A Bonds totaling $31,689,601 are outstanding. CHANGES IN NONCURRENT LIABILITIES Changes in long-term debt for the year ended September 30, 2012 are summarized as follows: Beginning Balance Additions Reductions Ending Balance Due within One Year Compensated absences OPEB Landfill closure and postclosure care costs Note Payable, Series 2008 Accrued interest payable on capital appreciation bonds Revenue Bonds Series 2011 Series 2009 Series 2008B Series 2004 Series 2002B Series 1998A $ 5,028, ,559 38,534,674 68,000,000 33,915, ,545, ,565,000 33,935,000 38,734,386 14,030,803 $ 2,621,719 7,440 2,106,886-4,029, ,860, $ 2,699, ,759 4,000,000 13,850,377-2,500,000-33,935,000-14,030,803 $4,950, ,999 40,318,801 64,000,000 24,093, ,860, ,045, ,565,000-38,734,386 - $ 369, ,214 4,000,000-8,650,000 2,500, Totals Unamortized premium and discount, net Current maturities $625,616,182 $608,625,287 $71,338,561 1,162,902,908 45,742,726 (15,848,798) $15,848,798 Net long-term debt $ 1,192,796,
160 14. CONTINGENCIES Litigation PALM BEACH COUNTY, FLORIDA NOTES TO THE FINANCIAL STATEMENTS SEPTEMBER 30, 2012 The County is involved in various lawsuits arising in the ordinary course of operations. Where it has been determined that a loss is probable related to these matters a liability has been recorded in our self-insurance obligations. In addition the County is involved with other matters the outcome of which is not presently determinable; it is the opinion of management of the County based upon consultation with legal counsel, that the outcome of these matters would not have a material adverse effect on the financial position of the County. State and Federal Grants Grant monies received and disbursed by the County are for specific purposes and are subject to audit by the grantor agencies. Such audits may result in requests for reimbursements due to disallowed expenditures. Based upon prior experience, management does not believe that such disallowances, if any, would have a material adverse effect on the financial position of the County. Interlocal Agreement On September 22, 1992 the Board of County Commissioners approved an interlocal agreement between the County and the Westgate/Belvedere Homes Community Redevelopment Agency (Agency), whereby the County has agreed to fund any deficiency in the reserve fund of the Agency s Redevelopment Revenue Bonds. The Agency is required to notify the County on or before May 2 nd of each year of any deficiency amount that the Agency expects to exist on the next succeeding November 1 st. At present, the County has not been made aware of any deficiency amount. Bond Guaranty On October 17, 2000 the Board of County Commissioners approved a trust agreement between the County and SunTrust Bank, (the Trustee), whereby the County has agreed to fund any deficiency in the reserve fund of the Palm Beach County, Florida, Industrial Development Revenue Bonds (South Florida Fair project), Series The Trustee is required to notify the County after June 1 st and on or before June 5 th of each year of the deficiency amount, if any, as of such date. At present, the County has not been made aware of any deficiency amount. Letters of credit have been arranged in lieu of debt service reserve surety insurance policies where credit ratings of the insurers declined below the rating required by the bond covenants. Additional information on the letters of credit may be found in the note for long-term debt. COMPONENT UNIT - Solid Waste Authority (SWA) - Environmental Liabilities: SWA, in cooperation with other state and local regulatory agencies, maintains an extensive monitoring program for potential environmental contaminants at each of its sites and facilities. These monitoring programs have not identified any contaminants caused by landfill leachate or other operations of SWA. In the event that any environmental contaminants are identified, SWA may 114
161 NOTES TO THE FINANCIAL STATEMENTS SEPTEMBER 30, 2012 be financially responsible for the environmental assessment and cleanup costs, as well as potential fines imposed by governmental regulatory agencies. 15. PLEDGED REVENUES The County has pledged a portion of future non-ad valorem revenues to repay $803 million in revenue bonds, notes and loans issued between July 1, 1990 and June 28, A ten year history of the pledged revenues is reported in statistical table X. Proceeds from the debt provided financing for capital additions, improvements, and expansion of County facilities, equipment and infrastructure. The bonds are payable solely from available non-ad valorem revenues and are payable through May 1, Total principal and interest remaining to be paid on the bonds is $1.2 billion with annual requirements ranging from $11 million in fiscal year 2034 to $104 million in fiscal year The pledged non-ad valorem revenues, from which the appropriations will be made, have averaged $346 million per year over the last 10 years. Principal and interest paid for the current year and total pledged non-ad valorem revenues were $101 million and $365 million, respectively. The County has pledged future airport revenues net of specified operating expenses, to repay $121 million in airport revenue bonds issued between July 3, 2002 and May 17, Proceeds from the bonds provided financing for the addition, improvements and expansion of the airport facilities, equipment and infrastructure. The bonds are payable solely from the airport net revenues and are payable through October 1, Total principal and interest remaining to be paid on the bonds is $192 million with annual requirements ranging from $6 million in fiscal year 2037 to $17 million in fiscal year Annual principal and interest payments on the bonds are expected to require less than 32% of projected future net revenues. Principal and interest paid for the current year and net operating income before interest expense were $17 million and $30 million, respectively. The County has pledged future water utility revenues net of specified operating expenses, to repay $189 million in water & sewer revenue bonds issued between June 24, 1998 and July 22, Proceeds from the bonds provided financing for the addition, improvements and expansion of the water and sewer facilities, equipment and infrastructure. The bonds are payable solely from the water utility net revenues and are payable through October 1, Total principal and interest remaining to be paid on the bonds is $325 million with annual requirements ranging from $211 thousand in fiscal years 2039 and 2040 to $16 million in fiscal year Annual principal and interest payments on the bonds are expected to require less than 28% of projected future net revenues. Principal and interest paid for the current year and net operating income before interest expense were $16 million and $70 million, respectively. 16. SUBSEQUENT EVENTS On February 27, 2013, the County issued $10,032,000 Public Improvement Revenue Bonds (Unified Messaging System Project), Series 2013 for the purpose of financing the cost of 115
162 NOTES TO THE FINANCIAL STATEMENTS SEPTEMBER 30, 2012 upgrading the communications technology available to County employees by replacing the County s existing telephone systems with a modern unified messaging system. Water Utilities Department Bond Defeasance - On February 27, 2013, the Water Utilities Department (Department) issued the $72,430,000 Series 2013 Refunding Revenue Bonds, proceeds of which were used to partially refund the Series 2006A bond issue through an in-substance defeasance whereby the Department placed, into irrevocable trusts, funds sufficient to meet future principal and interest payments. The funds placed in trust have been invested in securities backed by the United States Government. Outstanding principal of the refunding bonds was $76,260,000. While this transaction resulted in an accounting loss of approximately $10,073,258, the Department will realize an economic gain of approximately $6,086,273 due to lower debt service costs for the new bond issue. Glades Utility Authority Absorption - On March 5, 2013 the acting City Council of the City of South Bay passed a vote ratifying the absorption of the Glades Utility Authority (GUA) by Palm Beach County (County). This represented the final vote needed to move forward with the absorption of the GUA since the absorption was already ratified by Belle Glade and Pahokee. The absorption was deemed to be in the best interest of the GUA s customers. The GUA was facing an uncertain future due to a progressive deterioration of the GUA s financial stability. As a result, the GUA appears to be at risk of not being able to continue as a going concern without substantial financial assistance from external sources. Under the absorption, the GUA customer rates would be frozen for the greater of 10 years or until the rates equal the County s; the Cities of Belle Glade, Pahokee, and South Bay would continue to receive host fees; and the County will commit $25 million over the next 5 years to repair the system. The 10,000 GUA customers will become on-line customers of the Department. Currently the Department bills the GUA monthly as a contractual wholesale water customer for the costs of operating the GUA. The GUA will have $47.4 million in outstanding debt obligations at the time of the absorption which will be assumed by the Department. The County will receive all assets at their carrying value less any adjustment for impairment or reduced service utility from the GUA. The impact on operations cannot be determined but management does not believe it will have a material adverse effect on the Department as a whole. 116


163 Required Supplementary Information The Required Supplementary Information subsection includes the budgetary comparison schedule for Palm Beach County s major funds; the General Fund, the Fire Rescue Special Revenue Fund, and the Community & Social Development Special Revenue Fund. It also includes the schedules of funding progress related to the Palm Tran and Lantana Firefighter s Pension Plans, the Palm Beach County Healthcare Plans, the Fire Rescue Long-Term Disability Plan, and the schedule of funding progress for the Solid Waste Authority s Healthcare Plan (A Component Unit).
164
165 Schedule of Revenues, Expenditures and Changes in Fund Balances - Budget and Actual (Budgetary Basis) General Fund For the fiscal year ended September 30, 2012 (Required Supplementary Information) Variance With Final Budget Original Final Actual Positive Budget Budget Amounts (Negative) Revenues: Taxes (net of discount) $ 656,668,733 $ 656,668,733 $ 634,630,927 $ (22,037,806) Licenses and permits 33,712,289 33,712,289 33,026,711 (685,578) Intergovernmental 92,846,061 94,059,711 98,899,616 4,839,905 Charges for services 101,956, ,428,092 99,241,491 (3,186,601) Fines and forfeitures 1,309,500 1,309,500 1,037,411 (272,089) Investment income 10,532,700 10,532,700 9,995,177 (537,523) Miscellaneous 5,731,322 5,431,322 7,439,302 2,007,980 Less 5% anticipated revenues (45,174,116) (45,174,116) - 45,174,116 Total revenues 857,583, ,968, ,270,635 25,302,404 Expenditures: Current: General government 209,429, ,053, ,374, ,679,356 Public safety 27,172,671 27,909,133 27,288, ,241 Physical environment 11,792,327 11,722,327 11,066, ,923 Transportation 4,235,000 4,235,000 4,235,000 - Economic environment 24,141,038 24,166,588 23,058,293 1,108,295 Human services 48,600,496 50,026,101 47,617,113 2,408,988 Culture and recreation 53,393,287 53,337,382 48,206,402 5,130,980 Capital outlay 193, , , ,106 Total expenditures 378,958, ,844, ,103, ,740,889 Excess of revenues over expenditures 478,625, ,123, ,167, ,043,293 Other financing sources (uses): Transfers in 6,600,794 19,601,497 43,655,910 24,054,413 Transfers out (637,292,737) (642,423,976) (634,744,906) 7,679,070 Total other financing sources (uses) (630,691,943) (622,822,479) (591,088,996) 31,733,483 Net change in fund balances (152,066,930) (178,698,616) 15,078, ,776,776 Fund balances, October 1, ,066, ,698, ,597,867 2,899,251 (Decrease) in nonspendable fund balance - - (241,868) (241,868) Fund balances, September 30, 2012 (budget basis) $ - $ - 196,434,159 $ 196,434,159 Perspective difference between budget basis and GAAP 21,115,863 Fund balances, September 30, 2012 (GAAP) $ 217,550,022 Reconciliation of Budget to GAAP: Net change in Revenues Expenditures Transfers in Transfers out fund balance Board of County Commissioners $ 884,270,635 $ (278,103,479) $ 43,655,910 $ (634,744,906) $ 15,078,160 Sheriff 2,113,470 (462,331,326) 478,212,236 (17,889,890) 104,490 Clerk & Comptroller 46,427,075 (54,519,170) 11,850,286 (1,929,119) 1,829,072 Tax Collector 22,005,302 (22,005,302) Property Appraiser 19,903,317 (19,903,317) Supervisor of Elections 477,564 (7,493,956) 11,944,590 (4,928,198) - Eliminations - - (515,696,197) 515,696,197 - Totals $ 975,197,363 $ (844,356,550) $ 29,966,825 $ (143,795,916) $ 17,011,722 NOTE: The effective legal level of budget control is maintained at the fund/department level. A separate detailed report providing this information is available for inspection at the Office of Financial Management and Budget. Annual budgets are legally adopted for all governmental and proprietary fund types. Budgetary comparisons presented herein are on a basis consistent with GAAP and only include the operations of the Board of County Commissioners since that is what was legally adopted. In accordance with GASB 54, the individual County Constitutional Officers no longer met the definition to be reported as separate special revenue funds of the County and as a result their activities have been combined into the County general fund for GAAP reporting purposes. The above table provides a reconciliation of the amounts between the two schedules. 117
166 Schedule of Revenues, Expenditures and Changes in Fund Balances - Budget and Actual Fire Rescue Special Revenue Fund For the fiscal year ended September 30, 2012 (Required Supplementary Information) Variance With Final Budget Original Final Actual Positive Budget Budget Amounts (Negative) Revenues: Taxes (net of discount) $ 191,164,728 $ 191,171,828 $ 184,661,800 $ (6,510,028) Special assessments 281, , ,653 (10,025) Licenses and permits 4,485 4,485 13,020 8,535 Intergovernmental 322, , , ,749 Charges for services 34,166,152 34,166,152 32,855,370 (1,310,782) Investment income 4,375,455 4,392,306 5,076, ,118 Miscellaneous 99,500 99, , ,441 Less 5% anticipated revenues (11,227,938) (11,227,938) - 11,227,938 Total revenues 219,186, ,290, ,017,942 4,726,946 Expenditures: Current: Public safety 326,336, ,121, ,459, ,662,399 Economic environment 498, , ,098 7,684 Capital outlay 9,178,924 9,178,924 1,398,513 7,780,411 Total expenditures 336,013, ,799, ,348, ,450,494 Excess of revenues over (under) expenditures (116,827,366) (125,508,109) (5,330,669) 120,177,440 Other financing sources (uses): Transfers in 8,009,527 8,097,217 6,457,119 (1,640,098) Transfers out (266,390) (266,390) (243,767) 22,623 Total other financing sources (uses) 7,743,137 7,830,827 6,213,352 (1,617,475) Net change in fund balances (109,084,229) (117,677,282) 882, ,559,965 Fund balances, October 1, ,084, ,677, ,196,849 2,519,567 Increase in nonspendable fund balance , ,696 Fund balances, September 30, 2012 $ - $ - $ 121,208,228 $ 121,208,228 NOTE: The effective legal level of budget control is maintained at the fund/department level. A separate detailed report providing this information is available for inspection at the Office of Financial Management and Budget. Annual budgets are legally adopted for all governmental and proprietary fund types. Budgetary comparisons presented herein are on a basis consistent with GAAP. 118
167 Schedule of Revenues, Expenditures and Changes in Fund Balances - Budget and Actual Community & Social Development Special Revenue Fund For the fiscal year ended September 30, 2012 (Required Supplementary Information) Variance With Final Budget Original Final Actual Positive Budget Budget Amounts (Negative) Revenues: Intergovernmental $ 154,513,707 $ 175,778,758 $ 93,815,427 $ (81,963,331) Charges for services 541, , ,798 63,221 Investment income 714, , ,766 (71,994) Miscellaneous 990,172 1,046,087 1,533, ,514 Less 5% anticipated revenues (2,500) (2,500) - 2,500 Total revenues 156,757, ,065,682 96,583,592 (81,482,090) Expenditures: Current: General government - 128, ,023 Public safety 2,067,910 5,612,988 1,976,029 3,636,959 Physical environment - 503, ,000 Transportation - 145,378 68,088 77,290 Economic environment 122,561, ,412,212 63,496,336 72,915,876 Human services 58,435,764 60,768,865 48,595,612 12,173,253 Capital outlay 252,568 1,393, , ,665 Debt service 892, , , ,386 Total expenditures 184,210, ,859, ,191,204 90,668,452 Excess of revenues over (under) expenditures (27,452,570) (27,793,974) (18,607,612) 9,186,362 Other financing sources (uses): Transfers in 13,979,537 14,353,711 12,932,295 (1,421,416) Transfers out (2,459,882) (5,600,843) (2,195,492) 3,405,351 Issuance of long-term debt 9,040,000 19,471,000 3,561,000 (15,910,000) Total other financing sources (uses) 20,559,655 28,223,868 14,297,803 (13,926,065) Net change in fund balances (6,892,915) 429,894 (4,309,809) (4,739,703) Fund balances, October 1, ,892,915 (429,894) (2,433,088) (2,003,194) Fund balances, September 30, 2012 $ - $ - $ (6,742,897) $ (6,742,897) NOTE: The effective legal level of budget control is maintained at the fund/department level. A separate detailed report providing this information is available for inspection at the Office of Financial Management and Budget. Annual budgets are legally adopted for all governmental and proprietary fund types. Budgetary comparisons presented herein are on a basis consistent with GAAP. 119
168 REQUIRED SUPPLEMENTARY INFORMATION Palm Tran Pension Plan Schedule of Funding Progress Actuarial UAAL as a Actuarial Accrued Unfunded Percentage Actuarial Value of Liability (AAL) AAL Funded Covered of Covered Valuation Assets Entry Age (UAAL) Ratio Payroll Payroll Date (a) (b) (b - a) (a / b) (c) ((b - a) / c) 1/1/10 $ 51,323,623 $ 76,463,660 $ 25,140, % $ 25,386, % 1/1/11 54,522,208 83,602,521 29,080, % 25,497, % 1/1/12 57,037,023 88,489,140 31,452, % 24,999, % Lantana Firefighter's Pension Plan Schedule of Funding Progress Actuarial UAAL as a Actuarial Accrued Unfunded Percentage Actuarial Value of Liability (AAL) AAL Funded Covered of Covered Valuation Assets Entry Age (UAAL) Ratio Payroll Payroll Date (a) (b) (b - a) (a / b) (c) ((b - a) / c) 9/30/09 $ 17,132,902 $ 21,670,754 $ 4,537, % $ 2,384, % 9/30/10 19,301,948 24,669,989 5,368, % 2,155, % 9/30/11 20,943,102 27,289,591 6,346, % 2,223, % 120
169 REQUIRED SUPPLEMENTARY INFORMATION Palm Beach County Primary Government Healthcare Plans Schedule of Funding Progress County Actuarial UAAL as a Actuarial Accrued Unfunded Percentage Actuarial Value of Liability (AAL) AAL Funded Covered of Covered Valuation Assets Entry Age (UAAL) Ratio Payroll Payroll Date (a) (b) (b - a) (a / b) (c) ((b - a) / c) 10/1/2007 $ - $ 14,638,000 $ 14,638, % $ 294,272, % 10/1/ ,760,000 14,760, % 253,793, % 10/1/ ,267,000 16,267, % 241,965, % Tax Collector 10/1/2007-1,533,513 1,533, % 9,879, % 10/1/2009-1,208,095 1,208, % 10,945, % 10/1/2012-1,546,776 1,546, % 12,439, % Property Appraiser 10/1/ , , % 14,237, % 10/1/ , , % 14,286, % 10/1/ , , % 11,597, % Clerk & Comptroller 10/1/2007-5,445,000 5,445, % 35,775, % 10/1/2009-5,202,000 5,202, % 27,581, % 10/1/2011-6,200,857 6,200, % 31,154, % Sheriff 1/1/ ,700, ,700, % 222,956, % 1/1/ ,600, ,600, % 269,750, % 1/1/ ,478, ,478, % 257,194, % Fire Rescue Union 10/1/ ,136, ,661, ,524, % 119,353, % 10/1/ ,359, ,760, ,400, % 138,684, % Palm Beach County Fire Rescue Taxing District Long Term Disability Plan Schedule of Funding Progress Actuarial UAAL as a Actuarial Accrued Unfunded Percentage Actuarial Value of Liability (AAL) AAL Funded Covered of Covered Valuation Assets Entry Age (UAAL) Ratio Payroll Payroll Date (a) (b) (b - a) (a / b) (c) ((b - a) / c) 10/1/2009 $ - $ 10,053,003 $ 10,053, % $ 133,283, % 10/1/ ,172,901 11,172, % 132,643, % 10/1/2011-9,276,012 9,276, % 138,684, % Solid Waste Authority Healthcare Plan - Component Unit Schedule of Funding Progress Actuarial UAAL as a Actuarial Accrued Unfunded Percentage Actuarial Value of Liability (AAL) AAL Funded Covered of Covered Valuation Assets Entry Age (UAAL) Ratio Payroll Payroll Date (a) (b) (b - a) (a / b) (c) ((b - a) / c) 10/1/2007 $ - $ 1,115,000 $ 1,115, % $ 21,614, % 10/1/2008-1,440,000 1,440, % 21,254, % 10/1/ , , % 22,391, % 121
170 122


171 Combining and Individual Fund Statements and Schedules This subsection includes the combining and individual fund statements and schedules for the following: - General Fund by Category - Nonmajor Governmental Funds - Internal Service Funds - Agency Funds
172
173 GENERAL FUND BY CATEGORY General Fund - Board of County Commissioners (BOCC) - To account for the revenues and expenditures of the BOCC portion of the General Fund - which are activities that benefit all County residents. General Fund - Sheriff - To account for for the revenues and expenditures necessary to carry out the duties and obligations of the Sheriff as specified in Section 30.15, Florida Statutes. General Fund - Clerk & Comptroller - To account for all funds received and expended to carry out the duties and responsibilities of the elected office of the Clerk & Comptroller. General Fund - Tax Collector - To account for all funds received and expended to carry out the duties and responsibilities of the elected office of the Tax Collector. General Fund - Property Appraiser - To account for all funds received and expended to carry out the duties and responsibilities of the elected office of the Property Appraiser. General Fund - Supervisor of Elections - To account for all funds received and expended to carry out the duties and responsibilities of the elected office of the Supervisor of Elections. 123
174 Combining Balance Sheet General Fund by Category September 30, 2012 Clerk & Tax BOCC Sheriff Comptroller Collector ASSETS Cash, cash equivalents, and investments $ 133,727,068 $ 65,997,003 $ 20,308,114 $ 42,129,455 Accounts receivable, net 10,189, , ,804 6,578 Due from other county funds 86,841,783 4, ,953 - Due from other governments 7,969,891 2,562, , Due from component unit 418, Inventory 2,657,383 2,976, Other assets 3, ,078-34,603 Loans receivable, noncurrent 6,000, Total assets $ 247,807,128 $ 72,011,970 $ 21,554,851 $ 42,171,248 LIABILITIES Vouchers payable and accrued liabilities $ 9,904,284 $ 21,266,518 $ 3,070,155 $ 837,071 Due to other county funds 15,796,670 26,397,271 2,943,520 31,052,467 Due to other governments 301,863 6,102, ,022 4,558,517 Due to component unit 6,711, ,861,618 Due to individuals - 2, ,000 25,044 Insurance claims payable - 1,834, Deferred revenue 18,325, ,531 Other liabilities 332,456 9,335, ,877 - Total liabilities 51,372,969 64,939,384 7,511,574 42,171,248 FUND BALANCE Non-Spendable Inventory 2,657,383 2,976, Prepaid Items 3,000 52,738-29,393 Spendable Restricted - 3,605,657 14,043,277 - Assigned - 437, Unassigned 193,773, (29,393) Total fund balance 196,434,159 7,072,586 14,043,277 - Total liabilities and fund balance $ 247,807,128 $ 72,011,970 $ 21,554,851 $ 42,171,
175 Eliminate Property Supervisor of Intra-Entity Adjusted Appraiser Elections Total Balances Totals $ 2,359,271 $ 5,177,701 $ 269,698,612 $ - $ 269,698,612-46,626 10,699,960-10,699, ,438,354 (54,851,363) 32,586, ,024,492-11,024, , , ,634,149-5,634,149-43, , , ,000,000-6,000,000 $ 2,359,271 $ 5,267,657 $ 391,172,125 $ (54,851,363) $ 336,320,762 $ 579,320 $ 267,602 $ 35,924,950 $ - $ 35,924,950 1,561,926 4,979,189 82,731,043 (54,851,363) 27,879, ,025 12,435 11,822,672-11,822, ,573,352-11,573, , , ,834,775-1,834,775-8,431 19,170,924-19,170, ,176,751-10,176,751 2,359,271 5,267, ,622,103 (54,851,363) 118,770, ,634,149-5,634,149-43, , , ,648,934-17,648, , ,425 - (43,330) 193,701, ,701, ,550, ,550,022 $ 2,359,271 $ 5,267,657 $ 391,172,125 $ (54,851,363) $ 336,320,
176 Combining Schedule of Revenues, Expenditures, and Changes in Fund Balances General Fund by Category For the fiscal year ended September 30, 2012 Clerk & Tax BOCC Sheriff Comptroller Collector Revenues: Taxes (net of discount) $ 634,630,927 $ - $ - $ - Licenses and permits 33,026, Intergovernmental 98,899,616-34,301,847 - Charges for services 99,241,491 1,628,499 10,550,630 59,433,347 Less - excess fees paid out (37,714,240) Fines and forfeitures 1,037, ,260 1,574,319 - Investment income 9,995, , ,195 Miscellaneous 7,439, , Total revenues 884,270,635 2,113,470 46,427,075 22,005,302 Expenditures: Current: General government 116,374,364 22,417,996 53,274,609 21,655,720 Public safety 27,288, ,800, Physical environment 11,066, Transportation 4,235, Economic environment 23,058, Human services 47,617, Culture and recreation 48,206, Capital outlay 257,011 23,112,548 1,244, ,582 Total expenditures 278,103, ,331,326 54,519,170 22,005,302 Excess of revenues over (under) expenditures 606,167,156 (460,217,856) (8,092,095) - Other financing sources (uses): Transfers in 43,655, ,212,236 11,850,286 - Transfers out (634,744,906) (17,889,890) (1,929,119) - Total other financing sources (uses) (591,088,996) 460,322,346 9,921,167 - Net change in fund balances 15,078, ,490 1,829,072 - Fund balances, October 1, ,597,867 6,968,096 12,214,205 - (Decrease) in nonspendable fund balance (241,868) Fund balances, September 30, 2012 $ 196,434,159 $ 7,072,586 $ 14,043,277 $ - 126
177 Eliminate Property Supervisor of Intra-Entity Adjusted Appraiser Elections Total Balances Totals $ - $ - $ 634,630,927 $ - $ 634,630, ,026,711-33,026, , ,339, ,339,563 21,625, , ,803, ,803,535 (1,731,003) - (39,445,243) - (39,445,243) - - 2,782,990-2,782,990 8,895 15,321 10,432,112-10,432, ,626,768-7,626,768 19,903, , ,197, ,197,363 19,585,044 7,486, ,793, ,793, ,089, ,089, ,066,404-11,066, ,235,000-4,235, ,058,293-23,058, ,617,113-47,617, ,206,402-48,206, ,273 7,832 25,289,807-25,289,807 19,903,317 7,493, ,356, ,356,550 - (7,016,392) 130,840, ,840,813-11,944, ,663,022 (515,696,197) 29,966,825 - (4,928,198) (659,492,113) 515,696,197 (143,795,916) - 7,016,392 (113,829,091) - (113,829,091) ,011,722-17,011, ,780, ,780, (241,868) - (241,868) $ - $ - $ 217,550,022 $ - $ 217,550,
178 Schedule of Revenues, Expenditures and Changes in Fund Balance - Budget and Actual General Fund - BOCC For the fiscal year ended September 30, 2012 Variance With Final Budget Original Final Actual Positive Budget Budget Amounts (Negative) Revenues: Taxes (net of discount) $ 656,668,733 $ 656,668,733 $ 634,630,927 $ (22,037,806) Licenses and permits 33,712,289 33,712,289 33,026,711 (685,578) Intergovernmental 92,846,061 94,059,711 98,899,616 4,839,905 Charges for services 101,956, ,428,092 99,241,491 (3,186,601) Fines and forfeitures 1,309,500 1,309,500 1,037,411 (272,089) Investment income 10,532,700 10,532,700 9,995,177 (537,523) Miscellaneous 5,731,322 5,431,322 7,439,302 2,007,980 Less 5% anticipated revenues (45,174,116) (45,174,116) - 45,174,116 Total revenues 857,583, ,968, ,270,635 25,302,404 Expenditures: Current: General government 209,429, ,053, ,374, ,679,356 Public safety 27,172,671 27,909,133 27,288, ,241 Physical environment 11,792,327 11,722,327 11,066, ,923 Transportation 4,235,000 4,235,000 4,235,000 - Economic environment 24,141,038 24,166,588 23,058,293 1,108,295 Human services 48,600,496 50,026,101 47,617,113 2,408,988 Culture and recreation 53,393,287 53,337,382 48,206,402 5,130,980 Capital outlay 193, , , ,106 Total expenditures 378,958, ,844, ,103, ,740,889 Excess of revenues over (under) expenditures 478,625, ,123, ,167, ,043,293 Other financing sources (uses): Transfers in 6,600,794 19,601,497 43,655,910 24,054,413 Transfers out (637,292,737) (642,423,976) (634,744,906) 7,679,070 Total other financing sources (uses) (630,691,943) (622,822,479) (591,088,996) 31,733,483 Net change in fund balances (152,066,930) (178,698,616) 15,078, ,776,776 Fund balances, October 1, ,066, ,698, ,597,867 2,899,251 (Decrease) in reserves, inventory - - (241,868) (241,868) Fund balances, September 30, 2012 $ - $ - $ 196,434,159 $ 196,434,
179 Schedule of Revenues, Expenditures and Changes in Fund Balance - Budget and Actual General Fund - Sheriff For the fiscal year ended September 30, 2012 Variance With Final Budget Original Final Actual Positive Budget Budget Amounts (Negative) Revenues: Charges for services $ - $ - $ 1,628,499 $ 1,628,499 Fines and forfeitures , ,260 Investment income , ,255 Miscellaneous , ,456 Total revenues - - 2,113,470 2,113,470 Expenditures: Current: General government 23,048,837 23,174,555 22,417, ,559 Public safety 441,604, ,061, ,800,782 16,260,834 Capital outlay 3,308,024 23,720,140 23,112, ,592 Total expenditures 467,960, ,956, ,331,326 17,624,985 Excess of revenues over (under) expenditures (467,960,971) (479,956,311) (460,217,856) 19,738,455 Other financing sources (uses): Transfers in 467,960, ,956, ,212,236 (1,744,075) Transfers out - - (17,889,890) (17,889,890) Total other financing sources (uses) 467,960, ,956, ,322,346 (19,633,965) Net change in fund balances , ,490 Fund balances, October 1, ,968,096 6,968,096 Fund balances, September 30, 2012 $ - $ - $ 7,072,586 $ 7,072,
180 Schedule of Revenues, Expenditures and Changes in Fund Balance - Budget and Actual General Fund - Clerk & Comptroller For the fiscal year ended September 30, 2012 Variance With Final Budget Original Final Actual Positive Budget Budget Amounts (Negative) Revenues: Intergovernmental $ 34,170,148 $ 34,188,698 $ 34,301,847 $ 113,149 Charges for services 8,346,301 10,511,766 10,550,630 38,864 Fines and forfeitures 1,767,921 1,767,921 1,574,319 (193,602) Investment income 12,778 12, (12,509) Miscellaneous Total revenues 44,297,148 46,481,163 46,427,075 (54,088) Expenditures: Current: General government 60,502,852 57,468,731 53,274,609 4,194,122 Capital outlay 1,211,786 1,369,172 1,244, ,611 Total expenditures 61,714,638 58,837,903 54,519,170 4,318,733 Excess of revenues over (under) expenditures (17,417,490) (12,356,740) (8,092,095) 4,264,645 Other financing sources (uses): Transfers in 16,977,615 16,977,615 11,850,286 (5,127,329) Transfers out (5,406,854) (5,406,854) (1,929,119) 3,477,735 Total other financing sources (uses) 11,570,761 11,570,761 9,921,167 (1,649,594) Net change in fund balances (5,846,729) (785,979) 1,829,072 2,615,051 Fund balances, October 1, ,214,205 12,214,205 12,214,205 - Fund balances, September 30, 2012 $ 6,367,476 $ 11,428,226 $ 14,043,277 $ 2,615,
181 Schedule of Revenues, Expenditures and Changes in Fund Balance - Budget and Actual General Fund - Tax Collector For the fiscal year ended September 30, 2012 Variance With Final Budget Original Final Actual Positive Budget Budget Amounts (Negative) Revenues: Charges for services $ 58,998,800 $ 58,998,800 $ 59,433,347 $ 434,547 Less - excess fees paid out (35,190,279) (35,118,306) (37,714,240) (2,595,934) Investment income 65,000 65, , ,195 Total revenues 23,873,521 23,945,494 22,005,302 (1,940,192) Expenditures: Current: General government 23,228,280 23,300,253 21,655,720 1,644,533 Capital outlay 645, , , ,659 Total expenditures 23,873,521 23,945,494 22,005,302 1,940,192 Excess of revenues over (under) expenditures Net change in fund balances Fund balances, October 1, Fund balances, September 30, 2012 $ - $ - $ - $ - 131
182 Schedule of Revenues, Expenditures and Changes in Fund Balance - Budget and Actual General Fund - Property Appraiser For the fiscal year ended September 30, 2012 Variance With Final Budget Original Final Actual Positive Budget Budget Amounts (Negative) Revenues: Charges for services $ 21,572,104 $ 21,572,104 $ 21,625,425 $ 53,321 Less - excess fees paid out - - (1,731,003) (1,731,003) Investment income - - 8,895 8,895 Total revenues 21,572,104 21,572,104 19,903,317 (1,668,787) Expenditures: Current: General government 21,563,254 21,269,254 19,585,044 1,684,210 Capital outlay 8, , ,273 (15,423) Total expenditures 21,572,104 21,572,104 19,903,317 1,668,787 Excess of revenues over (under) expenditures Net change in fund balances Fund balances, October 1, Fund balances, September 30, 2012 $ - $ - $ - $ - 132
183 Schedule of Revenues, Expenditures and Changes in Fund Balance - Budget and Actual General Fund - Supervisor of Elections For the fiscal year ended September 30, 2012 Variance With Final Budget Original Final Actual Positive Budget Budget Amounts (Negative) Revenues: Intergovernmental $ - $ - $ 138,100 $ 138,100 Charges for services 150, , , ,143 Investment income 5,000 5,000 15,321 10,321 Total revenues 155, , , ,564 Expenditures: Current: General government 11,726,160 11,726,160 7,486,124 4,240,036 Capital outlay 441, ,430 7, ,598 Total expenditures 12,167,340 12,099,590 7,493,956 4,605,634 Excess of revenues over (under) expenditures (12,012,340) (11,944,590) (7,016,392) 4,928,198 Other financing sources (uses): Transfers in 12,012,340 11,944,590 11,944,590 - Transfers out - - (4,928,198) (4,928,198) Total other financing sources (uses) 12,012,340 11,944,590 7,016,392 (4,928,198) Net change in fund balances Fund balances, October 1, Fund balances, September 30, 2012 $ - $ - $ - $ - 133
184 134
185 NONMAJOR GOVERNMENTAL FUNDS SPECIAL REVENUE FUNDS Tourist Development - To account for tourist development taxes designated to promote tourism in Palm Beach County. Law Enforcement Grants - To account for revenues to be used for law enforcement grants, including but not limited to the Local Law Enforcement Block Grants, "LLEBG". County Transportation Trust - To account for ad-valorem taxes, gas taxes and other revenues designated for the construction and maintenance of County roads. Municipal Service Taxing District - To account for revenues to be used in the unincorporated areas of the County for services rendered. Library Taxing District - To account for ad-valorem taxes and governmental grant funds designated to operate and maintain the County's public library system. Affordable Housing Trust Fund (SHIP)- To account for intergovernmental revenues and other revenues designated for providing standard, affordable housing for persons of low to moderate income. Palm Tran - To account for activities related to the operation of the County-owned public bus transportation system. Other Special Revenue Fund - To account for all other special revenue funds except those required to be accounted for in other funds. DEBT SERVICE FUNDS General Obligation Bonds - To account for the annual debt service requirements of all general obligation bonds. Revenue Bonds - To account for the annual debt service requirements of non advalorem, non self-supporting revenue bonds. Other Financing - To account for the annual debt service requirements of other financing arrangements. 135
186 NONMAJOR GOVERNMENTAL FUNDS CAPITAL PROJECTS FUNDS Criminal Justice - To account for costs related to the design and construction of courthouses, jails and other physical facilities required for the courts, law enforcement and detention operations. Environmental Lands - To account for costs related to the acquisition of environmentally sensitive ecological sites, and for the design and construction of beach improvements such as sand/beach re-nourishment or dune replacement projects. Fire Rescue - To account for costs related to the design, acquisition and construction of fire stations, training and administrative facilities, and equipment acquisitions for new stations. Libraries - To account for costs related to the design, acquisition and construction of libraries, including library materials. Parks & Recreation - To account for costs related to the design, acquisition and construction or expansion of beach, regional, district and community parks including active and passive recreational facilities and administrative facilities for park operations. Street & Drainage - To account for costs related to the design and construction of neighborhood streets, replacing shell rock (dirt) roads and providing drainage associated with the streets. These improvements are primarily funded by assessments against the benefiting properties. 136
187 137
188 Combining Balance Sheet Nonmajor Governmental Funds September 30, 2012 Municipal Law County Service Tourist Enforcement Transportation Taxing Development Grants Trust District Special Revenue Special Revenue Special Revenue Special Revenue Fund Fund Fund Fund ASSETS Cash, cash equivalents, and investments $ 27,000,391 $ - $ 3,844,998 $ 8,775,243 Accounts receivable, net 164,013-6,585 14,070 Due from other county funds - 7,832, , ,354 Due from other governments - 1,136,238 3,315,203 - Inventory - - 1,999,665 - Other assets 613, Other receivable, noncurrent 2,750, Total assets $ 30,528,040 $ 8,968,506 $ 9,722,806 $ 9,081,667 LIABILITIES Vouchers payable and accrued liabilities $ 2,057,129 $ 115,531 $ 811,060 $ 129,533 Due to other county funds 690,859 4,823, ,096 58,658 Due to other governments 7 197,536 6, Due to component unit ,339 - Due to individuals Deferred and unearned revenue 2,750,000 1,662, ,301 - Other liabilities Total liabilities 5,497,995 6,798,402 1,512, ,258 FUND BALANCE Non-Spendable Inventory - - 1,999,665 - Prepaid items 13, Spendable Restricted for: Debt service Capital projects Library services Tourist development programs 20,852, Grant programs - 2,758, Environmental protection programs Public safety and judicial programs Other services and programs - - 2,714,263 8,893,409 Assigned to: Debt service Capital projects Tourist development programs 4,163, Other services and programs - - 3,496,512 - Unassigned - (588,198) - - Total fund balance 25,030,045 2,170,104 8,210,440 8,893,409 Total liabilities and fund balance $ 30,528,040 $ 8,968,506 $ 9,722,806 $ 9,081,
189 Library Affordable Taxing Housing Trust Palm District Fund (SHIP) Tran Other Special Revenue Special Revenue Special Revenue Special Revenue Total Special Fund Fund Fund Fund Revenue Funds $ 12,958,416 $ 1,508,114 $ 2,000 $ 71,675,674 $ 125,764,836 5,489 19,015 98,828 28, ,552 1,328, ,500 3,730, ,920 14,787, ,438,500 3,735,063 11,625, ,887,312 50,925 3,937, , , ,750,000 $ 14,292,642 $ 1,668,629 $ 9,157,520 $ 76,401,484 $ 159,821,294 $ 671,609 $ 790 $ 2,732,453 $ 1,487,519 $ 8,005,624 99,838 35,683 4,225, ,336 11,287, , , , , , ,938-1, ,938-9,050 2,095,810 2,779,548 9,403, , ,150 9,073,116 5,775,913 29,812, ,887,312 50,925 3,937, , ,520, ,520, ,852,839-1,474,479-27,484,278 31,717, ,769,002 11,769, ,770,231 12,770, ,254,730 25,862, ,163, ,296,405 7,792, (1,802,908) - (2,391,106) 13,520,596 1,474,479 84,404 70,625, ,009,048 $ 14,292,642 $ 1,668,629 $ 9,157,520 $ 76,401,484 $ 159,821, (continued)
190 Combining Balance Sheet Nonmajor Governmental Funds September 30, 2012 General Obligation Revenue Other Criminal Bonds Bonds Financing Total Justice Debt Debt Debt Debt Service Capital Service Service Service Funds Projects ASSETS Cash, cash equivalents, and investments $ 1,141,228 $ 26,087,935 $ 247,103 $ 27,476,266 $ 32,282,209 Accounts receivable, net Due from other county funds Due from other governments ,828 Inventory Other assets Other receivable, noncurrent - 460, ,000 - Total assets $ 1,141,228 $ 26,547,935 $ 247,103 $ 27,936,266 $ 32,286,201 LIABILITIES Vouchers payable and accrued liabilities $ - $ 219,040 $ - $ 219,040 $ 1,032,221 Due to other county funds Due to other governments Due to component unit Due to individuals Deferred and unearned revenue - 460, ,000 - Other liabilities Total liabilities - 679, ,040 1,032,221 FUND BALANCE Non-Spendable Inventory Prepaid items Spendable Restricted for: Debt service 1,141,228 25,868,895-27,010,123 - Capital projects ,253,980 Library services Tourist development programs Grant programs Environmental protection programs Public safety and judicial programs Other services and programs Assigned to: Debt service , ,103 - Capital projects Tourist development programs Other services and programs Unassigned Total fund balance 1,141,228 25,868, ,103 27,257,226 31,253,980 Total liabilities and fund balance $ 1,141,228 $ 26,547,935 $ 247,103 $ 27,936,266 $ 32,286,
191 Environmental Fire Parks & Street & Total Lands Rescue Libraries Recreation Drainage Total Nonmajor Capital Capital Capital Capital Capital Capital Projects Governmental Projects Projects Projects Projects Projects Funds Funds $ 17,566,701 $ 37,769,477 $ 24,374,683 $ 39,130,144 $ 9,635,750 $ 160,758,964 $ 314,000, ,196 6,333,788 6,336,864 6,673, , , ,332 15,605,346 1,140,075 18,170 5,990 69,939-1,238,002 12,863, ,937, , ,210,000 $ 19,521,350 $ 37,788,357 $ 24,380,879 $ 39,202,279 $ 15,973,296 $ 169,152,362 $ 356,909,922 $ 105,660 $ 1,303,285 $ 648,373 $ 680,550 $ 102,264 $ 3,872,353 $ 12,097, ,287, , , , , ,333,788 7,189,056 17,052,970 10, ,000 10, ,928 1,303, , ,550 6,436,052 11,071,409 41,562, ,937, , ,010,123 6,177,315 36,485,072 23,732,506 37,450,286 3,544, ,643, ,643, ,520, ,852, ,717, ,769, ,770, ,862, ,103 12,373, ,071,443 5,992,816 19,437,366 19,437, ,163, ,792, (2,391,106) 18,550,422 36,485,072 23,732,506 38,521,729 9,537, ,080, ,347,227 $ 19,521,350 $ 37,788,357 $ 24,380,879 $ 39,202,279 $ 15,973,296 $ 169,152,362 $ 356,909, (concluded)
192 Combining Statement of Revenues, Expenditures and Changes in Fund Balances Nonmajor Governmental Funds For the fiscal year ended September 30, 2012 Municipal Law County Service Tourist Enforcement Transportation Taxing Development Grants Trust District Special Revenue Special Revenue Special Revenue Special Revenue Fund Fund Fund Fund Revenues: Taxes (net of discount) $ 28,821,659 $ - $ 4,233,192 $ - Special assessments Licenses and permits - - 9,960 11,857,040 Intergovernmental 250,000 7,121,434 16,565,879 16,499 Charges for services 3,132,214-1,002, ,248 Fines and forfeitures - 698,084-6,061 Investment income 552,522 50, , ,058 Miscellaneous 11,950 38,125 2,006, Total revenues 32,768,345 7,908,631 24,014,147 12,995,160 Expenditures: Current: General government - 1,224, Public safety - 228, ,389,577 Physical environment Transportation ,824,620 - Economic environment 20,250, Human services Culture and recreation Capital outlay - 1, ,176 27,456 Debt service Total expenditures 20,250,816 1,454,983 33,427,771 9,417,033 Excess of revenues over (under) expenditures 12,517,529 6,453,648 (9,413,624) 3,578,127 Other financing sources (uses): Transfers in - 142,650 3,883, ,582 Transfers out (8,817,057) (7,644,699) (100,576) - Issuance of refunding debt Premium on refunding debt Payment to escrow agent for refunding Total other financing sources (uses) (8,817,057) (7,502,049) 3,783, ,582 Net change in fund balances 3,700,472 (1,048,401) (5,630,377) 3,896,709 Fund balances, October 1, ,329,573 3,218,505 14,208,276 4,996,700 Increase (decrease) in nonspendable fund balance - - (367,459) - Fund balances, September 30, 2012 $ 25,030,045 $ 2,170,104 $ 8,210,440 $ 8,893,
193 Library Affordable Taxing Housing Trust Palm District Fund (SHIP) Tran Other Special Revenue Special Revenue Special Revenue Special Revenue Total Special Fund Fund Fund Fund Revenue Funds $ 35,767,680 $ - $ 32,039,990 $ 36,096 $ 100,898, ,478,238 12,478,238 27,300-30,548 5,133,285 17,058,133 1,031, ,222 34,566,504 5,949,851 66,295,608 2,778-11,915,931 14,892,245 31,888, , ,132,196 4,422, , ,529 6,260 1,848,018 3,648, , ,285 1,360,493 1,983,019 5,822,314 38,270,014 1,183,036 79,919,726 45,452, ,512, ,115,482 8,340, ,103,264 19,722, ,666,877 12,666, ,078, , ,237,314-6,883, ,527 27,494, , ,720 34,390, ,909,453 40,300,009 3,920,478-14,737,106 3,390,678 22,679, ,311,034 6,883,486 93,815,142 40,335, ,895,924 (41,020) (5,700,450) (13,895,416) 5,117,289 (1,383,917) 3,020, ,500 16,288,125 3,074,661 26,869,608 (9,937) - (63,426) (5,880,355) (22,516,050) ,010, ,500 16,224,699 (2,805,694) 4,353,558 2,969,310 (5,558,950) 2,329,283 2,311,595 2,969,641 10,551,286 7,033,429 (2,227,695) 68,311, ,421, (17,184) 2,904 (381,739) $ 13,520,596 $ 1,474,479 $ 84,404 $ 70,625,571 $ 130,009, (continued)
194 Combining Statement of Revenues, Expenditures and Changes in Fund Balances Nonmajor Governmental Funds For the fiscal year ended September 30, 2012 General Obligation Revenue Other Criminal Bonds Bonds Financing Total Justice Debt Debt Debt Debt Service Capital Service Service Service Funds Projects Revenues: Taxes (net of discount) $ 29,227,809 $ - $ - $ 29,227,809 $ - Special assessments ,503 Licenses and permits Intergovernmental Charges for services Fines and forfeitures Investment income 421, ,466 12,464 1,080,971 1,084,836 Miscellaneous - 119, ,088 - Total revenues 29,649, ,554 12,464 30,428,147 1,418,339 Expenditures: Current: General government Public safety Physical environment Transportation Economic environment Human services Culture and recreation Capital outlay ,131,288 Debt service 30,073, ,977, , ,907, ,898 Total expenditures 30,073, ,977, , ,907,146 14,352,518 Excess of revenues over (under) expenditures (424,568) (100,211,258) (843,173) (101,478,999) (12,934,179) Other financing sources (uses): Transfers in 375,659 96,163,836 16,569, ,108,876 - Transfers out (65,059) (15,988,903) - (16,053,962) (4,543,970) Issuance of refunding debt - 163,189, ,189,340 - Premium on refunding debt - 28,470,407-28,470,407 - Payment to escrow agent for refunding - (174,859,953) (16,140,760) (191,000,713) - Total other financing sources (uses) 310,600 96,974, ,621 ` 97,713,948 (4,543,970) Net change in fund balances (113,968) (3,236,531) (414,552) (3,765,051) (17,478,149) Fund balances, October 1, ,255,196 29,105, ,655 31,022,277 48,732,129 Increase (decrease) in nonspendable fund balance Fund balances, September 30, 2012 $ 1,141,228 $ 25,868,895 $ 247,103 $ 27,257,226 $ 31,253,
195 Environmental Fire Parks & Street & Total Lands Rescue Libraries Recreation Drainage Total Nonmajor Capital Capital Capital Capital Capital Capital Projects Governmental Projects Projects Projects Projects Projects Funds Funds $ - $ - $ - $ 12,643 $ - $ 12,643 $ 130,139,069-1,086, ,161 3,505, ,338 5,996,834 18,475, , ,163 17,421,296 5,039,144-50,000 2,310,702-7,399,846 73,695,733 77, ,370 31,965,888 10, ,170 4,432, , , , , ,331 4,800,809 9,530,310 2,221,844 1,750,000 2, , ,086,304 10,027,706 7,806,576 3,834,103 1,361,483 7,266,959 1,059,679 22,747, ,687, ,340, ,542 1,689, ,886,041 21,608,458 3,657, ,657,773 16,324, , , ,392, ,316-2,316 27,497, , ,066,835 1,148,131-2,214,966 42,514,975 2,854,695 9,003,991 11,500,068 3,917, ,657 42,219,427 64,898, , ,128,044 6,709,010 10,693,490 12,566,903 5,068, ,559 50,356, ,159,725 1,097,566 (6,859,387) (11,205,420) 2,198,784 93,120 (27,609,516) (130,472,432) 3,152, ,506-4,086, ,064,645 (2,241,945) - (2,200,000) - - (8,985,915) (47,555,927) ,189, ,470, (191,000,713) 910,710 - (2,200,000) 933,506 - (4,899,754) 97,167,752 2,008,276 (6,859,387) (13,405,420) 3,132,290 93,120 (32,509,270) (33,304,680) 16,542,146 43,344,459 37,137,926 35,389,439 9,444, ,590, ,033, (381,739) $ 18,550,422 $ 36,485,072 $ 23,732,506 $ 38,521,729 $ 9,537,244 $ 158,080,953 $ 315,347, (concluded)
196 Schedule of Revenues, Expenditures and Changes in Fund Balances - Budget and Actual Tourist Development Special Revenue Fund For the fiscal year ended September 30, 2012 Variance With Final Budget Original Final Actual Positive Budget Budget Amounts (Negative) Revenues: Taxes (net of discount) $ 25,113,870 $ 25,113,870 $ 28,821,659 $ 3,707,789 Intergovernmental 250, , ,000 - Charges for services 3,507,639 3,507,639 3,132,214 (375,425) Investment income 746, , ,522 (193,996) Miscellaneous ,950 11,950 Less 5% anticipated revenues (1,480,901) (1,480,901) - 1,480,901 Total revenues 28,137,126 28,137,126 32,768,345 4,631,219 Expenditures: Current: Economic environment 38,140,275 40,649,641 20,250,816 20,398,825 Total expenditures 38,140,275 40,649,641 20,250,816 20,398,825 Excess of revenues over (under) expenditures (10,003,149) (12,512,515) 12,517,529 25,030,044 Other financing sources (uses): Transfers out (9,038,760) (8,817,057) (8,817,057) - Total other financing sources (uses) (9,038,760) (8,817,057) (8,817,057) - Net change in fund balances (19,041,909) (21,329,572) 3,700,472 25,030,044 Fund balances, October 1, ,041,909 21,329,572 21,329,573 1 Fund balances, September 30, 2012 $ - $ - $ 25,030,045 $ 25,030,
197 Schedule of Revenues, Expenditures and Changes in Fund Balances - Budget and Actual Law Enforcement Grants Special Revenue Fund For the fiscal year ended September 30, 2012 Variance With Final Budget Original Final Actual Positive Budget Budget Amounts (Negative) Revenues: Intergovernmental $ 5,740,301 $ 13,821,308 $ 7,121,434 $ (6,699,874) Fines and forfeitures , ,084 Investment income 69,545 69,545 50,988 (18,557) Miscellaneous 9,410 38,125 38,125 - Total revenues 5,819,256 13,928,978 7,908,631 (6,020,347) Expenditures: Current: General government 3,909,697 4,064,234 1,224,950 2,839,284 Public safety 175, , , ,754 Capital outlay - 1,434 1,432 2 Total expenditures 4,085,538 4,447,023 1,454,983 2,992,040 Excess of revenues over (under) expenditures 1,733,718 9,481,955 6,453,648 (3,028,307) Other financing sources (uses): Transfers in 16, , ,650 (157,899) Transfers out (4,336,128) (13,001,009) (7,644,699) 5,356,310 Total other financing sources (uses) (4,319,378) (12,700,460) (7,502,049) 5,198,411 Net change in fund balances (2,585,660) (3,218,505) (1,048,401) 2,170,104 Fund balances, October 1, ,585,660 3,218,505 3,218,505 - Fund balances, September 30, 2012 $ - $ - $ 2,170,104 $ 2,170,
198 Schedule of Revenues, Expenditures and Changes in Fund Balances - Budget and Actual County Transportation Trust Special Revenue Fund For the fiscal year ended September 30, 2012 Variance With Final Budget Original Final Actual Positive Budget Budget Amounts (Negative) Revenues: Taxes (net of discount) $ 1,000 $ 3,857,227 $ 4,233,192 $ 375,965 Licenses and permits 20,000 20,000 9,960 (10,040) Intergovernmental 17,215,206 17,215,206 16,565,879 (649,327) Charges for services 1,301,000 1,301,000 1,002,102 (298,898) Investment income 343, , ,551 (146,449) Miscellaneous 4,298,730 4,298,730 2,006,463 (2,292,267) Less 5% anticipated revenues (1,026,950) (1,026,950) - 1,026,950 Total revenues 22,151,986 26,008,213 24,014,147 (1,994,066) Expenditures: Current: Public safety (975) Transportation 39,043,218 39,137,689 32,824,620 6,313,069 Capital outlay 3,449,573 3,449, ,176 2,847,397 Total expenditures 42,492,791 42,587,262 33,427,771 9,159,491 Excess of revenues over (under) expenditures (20,340,805) (16,579,049) (9,413,624) 7,165,425 Other financing sources (uses): Transfers in 8,814,358 4,839,953 3,883,823 (956,130) Transfers out (102,056) (102,056) (100,576) 1,480 Total other financing sources (uses) 8,712,302 4,737,897 3,783,247 (954,650) Net change in fund balances (11,628,503) (11,841,152) (5,630,377) 6,210,775 Fund balances, October 1, ,628,503 11,841,152 14,208,276 2,367,124 Increase (decrease) in nonspendable fund balance - - (367,459) (367,459) Fund balances, September 30, 2012 $ - $ - $ 8,210,440 $ 8,210,
199 Schedule of Revenues, Expenditures and Changes in Fund Balances - Budget and Actual Municipal Service Taxing District Special Revenue Fund For the fiscal year ended September 30, 2012 Variance With Final Budget Original Final Actual Positive Budget Budget Amounts (Negative) Revenues: Licenses and permits $ 10,251,500 $ 10,251,500 $ 11,857,040 $ 1,605,540 Intergovernmental ,499 16,499 Charges for services 576, , , ,048 Fines and forfeitures ,061 5,561 Investment income 80,100 80, ,058 91,958 Miscellaneous (66) Less 5% anticipated revenues (545,431) (545,431) - 545,431 Total revenues 10,363,189 10,363,189 12,995,160 2,631,971 Expenditures: Current: Public safety 13,652,244 15,635,786 9,389,577 6,246,209 Capital outlay 30,000 30,000 27,456 2,544 Total expenditures 13,682,244 15,665,786 9,417,033 6,248,753 Excess of revenues over (under) expenditures (3,319,055) (5,302,597) 3,578,127 8,880,724 Other financing sources (uses): Transfers in 26, , ,582 - Transfers out (12,685) (12,685) - 12,685 Total other financing sources (uses) 13, , ,582 12,685 Net change in fund balances (3,305,512) (4,996,700) 3,896,709 8,893,409 Fund balances, October 1, ,305,512 4,996,700 4,996,700 - Fund balances, September 30, 2012 $ - $ - $ 8,893,409 $ 8,893,
200 Schedule of Revenues, Expenditures and Changes in Fund Balances - Budget and Actual Library Taxing District Special Revenue Fund For the fiscal year ended September 30, 2012 Variance With Final Budget Original Final Actual Positive Budget Budget Amounts (Negative) Revenues: Taxes (net of discount) $ 37,208,595 $ 37,208,595 $ 35,767,680 $ (1,440,915) Licenses and permits 25,000 25,000 27,300 2,300 Intergovernmental 1,006,270 1,030,439 1,031, Charges for services 1,150 1,150 2,778 1,628 Fines and forfeitures 450, , , ,708 Investment income 230, , , ,604 Miscellaneous 268, , ,725 (107,298) Less 5% anticipated revenues (1,909,229) (1,909,229) - 1,909,229 Total revenues 37,279,809 37,303,978 38,270, ,036 Expenditures: Current: Culture and recreation 43,491,729 46,827,342 34,390,556 12,436,786 Capital outlay 4,038,252 4,038,252 3,920, ,774 Total expenditures 47,529,981 50,865,594 38,311,034 12,554,560 Excess of revenues over (under) expenditures (10,250,172) (13,561,616) (41,020) 13,520,596 Other financing sources (uses): Transfers in 2,204,350 3,020,267 3,020,267 - Transfers out (9,937) (9,937) (9,937) - Total other financing sources (uses) 2,194,413 3,010,330 3,010,330 - Net change in fund balances (8,055,759) (10,551,286) 2,969,310 13,520,596 Fund balances, October 1, ,055,759 10,551,286 10,551,286 - Fund balances, September 30, 2012 $ - $ - $ 13,520,596 $ 13,520,
201 Schedule of Revenues, Expenditures and Changes in Fund Balances - Budget and Actual Affordable Housing (SHIP) Trust Fund Special Revenue Fund For the fiscal year ended September 30, 2012 Variance With Final Budget Original Final Actual Positive Budget Budget Amounts (Negative) Revenues: Intergovernmental $ - $ 794,222 $ 794,222 $ - Investment income 110, , ,529 17,529 Miscellaneous 40,000 40, , ,285 Total revenues 150, ,222 1,183, ,814 Expenditures: Current: Economic environment 5,009,609 8,119,171 6,883,486 1,235,685 Total expenditures 5,009,609 8,119,171 6,883,486 1,235,685 Excess of revenues over (under) expenditures (4,859,609) (7,174,949) (5,700,450) 1,474,499 Other financing sources (uses): Transfers in 141, , ,500 (20) Total other financing sources (uses) 141, , ,500 (20) Net change in fund balances (4,718,089) (7,033,429) (5,558,950) 1,474,479 Fund balances, October 1, ,718,089 7,033,429 7,033,429 - Fund balances, September 30, 2012 $ - $ - $ 1,474,479 $ 1,474,
202 Schedule of Revenues, Expenditures and Changes in Fund Balances - Budget and Actual Palm Tran Special Revenue Fund For the fiscal year ended September 30, 2012 Variance With Final Budget Original Final Actual Positive Budget Budget Amounts (Negative) Revenues: Taxes (net of discount) $ 26,307,000 $ 31,943,773 $ 32,039,990 $ 96,217 Licenses and permits 35,000 35,000 30,548 (4,452) Intergovernmental 69,131,680 75,441,705 34,566,504 (40,875,201) Charges for services 10,812,286 10,812,286 11,915,931 1,103,645 Investment income 30,000 31,000 6,260 (24,740) Miscellaneous 1,471,915 1,584,316 1,360,493 (223,823) Less 5% anticipated revenues (1,339,909) (1,339,909) - 1,339,909 Total revenues 106,447, ,508,171 79,919,726 (38,588,445) Expenditures: Current: Transportation 89,019,324 95,022,236 79,078,036 15,944,200 Capital outlay 41,651,114 38,451,735 14,737,106 23,714,629 Total expenditures 130,670, ,473,971 93,815,142 39,658,829 Excess of revenues over (under) expenditures (24,222,466) (14,965,800) (13,895,416) 1,070,384 Other financing sources (uses): Transfers in 21,823,149 18,701,559 16,288,125 (2,413,434) Transfers out (63,426) (63,426) (63,426) - Total other financing sources (uses) 21,759,723 18,638,133 16,224,699 (2,413,434) Net change in fund balances (2,462,743) 3,672,333 2,329,283 (1,343,050) Fund balances, October 1, ,462,743 (3,672,333) (2,227,695) 1,444,638 Increase (decrease) in nonspendable fund balance - - (17,184) (17,184) Fund balances, September 30, 2012 $ - $ - $ 84,404 $ 84,
203 Schedule of Revenues, Expenditures and Changes in Fund Balances - Budget and Actual Other Special Revenue Fund For the fiscal year ended September 30, 2012 Variance With Final Budget Original Final Actual Positive Budget Budget Amounts (Negative) Revenues: Taxes (net of discount) $ 36,500 $ 36,500 $ 36,096 $ (404) Special assessments 1,393,550 1,393,550 12,478,238 11,084,688 Licenses and permits 5,293,000 5,293,000 5,133,285 (159,715) Intergovernmental 8,277,925 10,277,532 5,949,851 (4,327,681) Charges for services 13,825,967 14,035,128 14,892, ,117 Fines and forfeitures 3,104,290 3,104,290 3,132,196 27,906 Investment income 1,558,707 1,548,707 1,848, ,311 Miscellaneous 1,005,968 1,027,674 1,983, ,345 Less 5% anticipated revenues (1,250,733) (1,250,733) - 1,250,733 Total revenues 33,245,174 35,465,648 45,452,948 9,987,300 Expenditures: Current: General government 24,030,707 30,995,941 7,115,482 23,880,459 Public safety 15,390,246 19,677,694 10,103,264 9,574,430 Physical environment 31,977,838 35,180,932 12,666,877 22,514,055 Transportation 570, , , ,342 Economic environment 362, , ,527 43,464 Human services 880, , , ,281 Culture and recreation 6,111,070 6,065,125 5,909, ,672 Capital outlay 928,086 6,972,052 3,390,678 3,581,374 Total expenditures 80,250, ,685,736 40,335,659 60,350,077 Excess of revenues over (under) expenditures (47,005,435) (65,220,088) 5,117,289 70,337,377 Other financing sources (uses): Transfers in 3,953,932 3,960,777 3,074,661 (886,116) Transfers out (6,086,334) (7,003,739) (5,880,355) 1,123,384 Total other financing sources (uses) (2,132,402) (3,042,962) (2,805,694) 237,268 Net change in fund balances (49,137,837) (68,263,050) 2,311,595 70,574,645 Fund balances, October 1, ,137,837 68,263,050 68,311,072 48,022 Increase (decrease) in nonspendable fund balance - - 2,904 2,904 Fund balances, September 30, 2012 $ - $ - $ 70,625,571 $ 70,625,
204 Schedule of Revenues, Expenditures and Changes in Fund Balances - Budget and Actual General Obligation Bonds Debt Service Fund For the fiscal year ended September 30, 2012 Variance With Final Budget Original Final Actual Positive Budget Budget Amounts (Negative) Revenues: Taxes (net of discount) $ 30,277,833 $ 30,289,937 $ 29,227,809 $ (1,062,128) Intergovernmental Investment income 180, , , ,163 Less 5% anticipated revenues (1,521,801) (1,521,801) - 1,521,801 Total revenues 28,936,032 28,951,014 29,649, ,115 Expenditures: Debt service 30,077,994 30,524,920 30,073, ,223 Total expenditures 30,077,994 30,524,920 30,073, ,223 Excess of revenues over (under) expenditures (1,141,962) (1,573,906) (424,568) 1,149,338 Other financing sources (uses): Transfers in 375, , ,659 - Transfers out - (56,950) (65,059) (8,109) Total other financing sources (uses) 375, , ,600 (8,109) Net change in fund balances (766,303) (1,255,197) (113,968) 1,141,229 Fund balances, October 1, ,303 1,255,197 1,255,196 (1) Fund balances, September 30, 2012 $ - $ - $ 1,141,228 $ 1,141,
205 Schedule of Revenues, Expenditures and Changes in Fund Balances - Budget and Actual Revenue Bonds Debt Service Fund For the fiscal year ended September 30, 2012 Variance With Final Budget Original Final Actual Positive Budget Budget Amounts (Negative) Revenues: Investment income $ 550,000 $ 550,000 $ 647,466 $ 97,466 Miscellaneous 108, , ,088 10,340 Total revenues 658, , , ,806 Expenditures: Debt service 122,561, ,400, ,977,812 29,423,139 Total expenditures 122,561, ,400, ,977,812 29,423,139 Excess of revenues over (under) expenditures (121,902,810) (129,742,203) (100,211,258) 29,530,945 Other financing sources (uses): Transfers in 98,410,169 99,825,888 96,163,836 (3,662,052) Transfers out - (15,988,903) (15,988,903) - Issuance of refunding debt - 163,189, ,189,340 - Premium (discount) refunding debt - 28,470,407 28,470,407 - Payment to escrow agent for refunding - (174,859,954) (174,859,953) 1 Total other financing sources (uses) 98,410, ,636,778 96,974,727 (3,662,051) Net change in fund balances (23,492,641) (29,105,425) (3,236,531) 25,868,894 Fund balances, October 1, ,492,641 29,105,425 29,105,426 1 Fund balances, September 30, 2012 $ - $ - $ 25,868,895 $ 25,868,
206 Schedule of Revenues, Expenditures and Changes in Fund Balances - Budget and Actual Other Financing Debt Service Fund For the fiscal year ended September 30, 2012 Variance With Final Budget Original Final Actual Positive Budget Budget Amounts (Negative) Revenues: Investment income $ - $ - $ 12,464 $ 12,464 Total revenues ,464 12,464 Expenditures: Debt service 1,367,398 1,151, , ,361 Total expenditures 1,367,398 1,151, , ,361 Excess of revenues over (under) expenditures (1,367,398) (1,151,998) (843,173) 308,825 Other financing sources (uses): Transfers in 640,004 16,631,104 16,569,381 (61,723) Payment to escrow agent for refunding - (16,140,760) (16,140,760) - Total other financing sources (uses) 640, , ,621 (61,723) Net change in fund balances (727,394) (661,654) (414,552) 247,102 Fund balances, October 1, , , ,655 1 Fund balances, September 30, 2012 $ - $ - $ 247,103 $ 247,
207 Schedule of Revenues, Expenditures and Changes in Fund Balances - Budget and Actual Criminal Justice Capital Projects Fund For the fiscal year ended September 30, 2012 Variance With Final Budget Original Final Actual Positive Budget Budget Amounts (Negative) Revenues: Special assessments $ 92,400 $ 92,400 $ 333,503 $ 241,103 Investment income 1,606,000 1,606,000 1,084,836 (521,164) Less 5% anticipated revenues (84,920) (84,920) - 84,920 Total revenues 1,613,480 1,613,480 1,418,339 (195,141) Expenditures: Current: General government Capital outlay 34,747,024 30,377,752 14,131,288 16,246,464 Debt service 264, , ,898 1 Total expenditures 35,011,143 30,598,983 14,352,518 16,246,465 Excess of revenues over (under) expenditures (33,397,663) (28,985,503) (12,934,179) 16,051,324 Other financing sources (uses): Transfers out (20,160,247) (19,746,626) (4,543,970) 15,202,656 Total other financing sources (uses) (20,160,247) (19,746,626) (4,543,970) 15,202,656 Net change in fund balances (53,557,910) (48,732,129) (17,478,149) 31,253,980 Fund balances, October 1, ,557,910 48,732,129 48,732,129 - Fund balances, September 30, 2012 $ - $ - $ 31,253,980 $ 31,253,
208 Schedule of Revenues, Expenditures and Changes in Fund Balances - Budget and Actual Environmental Lands Capital Projects Fund For the fiscal year ended September 30, 2012 Variance With Final Budget Original Final Actual Positive Budget Budget Amounts (Negative) Revenues: Intergovernmental $ 35,535,329 $ 21,286,414 $ 5,039,144 $ (16,247,270) Charges for services 77,030 77,030 77,030 - Fines and forfeitures ,170 10,170 Investment income 543, , ,388 (84,612) Miscellaneous 34,375 8,967,648 2,221,844 (6,745,804) Less 5% anticipated revenues (27,150) (27,150) - 27,150 Total revenues 36,162,584 30,846,942 7,806,576 (23,040,366) Expenditures: Current: Public safety ,542 (196,542) Physical environment 41,059,277 42,859,082 3,657,773 39,201,309 Capital outlay 14,418,114 5,850,731 2,854,695 2,996,036 Total expenditures 55,477,391 48,709,813 6,709,010 42,000,803 Excess of revenues over (under) expenditures (19,314,807) (17,862,871) 1,097,566 18,960,437 Other financing sources (uses): Transfers in 2,751,116 3,657,297 3,152,655 (504,642) Transfers out (2,034,375) (2,336,572) (2,241,945) 94,627 Total other financing sources (uses) 716,741 1,320, ,710 (410,015) Net change in fund balances (18,598,066) (16,542,146) 2,008,276 18,550,422 Fund balances, October 1, ,598,066 16,542,146 16,542,146 - Fund balances, September 30, 2012 $ - $ - $ 18,550,422 $ 18,550,
209 Schedule of Revenues, Expenditures and Changes in Fund Balances - Budget and Actual Fire Rescue Capital Projects Fund For the fiscal year ended September 30, 2012 Variance With Final Budget Original Final Actual Positive Budget Budget Amounts (Negative) Revenues: Special assessments $ 352,000 $ 352,000 $ 1,086,038 $ 734,038 Investment income 1,305,000 1,305, ,065 (306,935) Miscellaneous - - 1,750,000 1,750,000 Less 5% anticipated revenues (82,850) (82,850) - 82,850 Total revenues 1,574,150 1,574,150 3,834,103 2,259,953 Expenditures: Current: Public safety 1,339,929 2,953,681 1,689,499 1,264,182 Capital outlay 43,760,352 41,964,928 9,003,991 32,960,937 Total expenditures 45,100,281 44,918,609 10,693,490 34,225,119 Excess of revenues over (under) expenditures (43,526,131) (43,344,459) (6,859,387) 36,485,072 Net change in fund balances (43,526,131) (43,344,459) (6,859,387) 36,485,072 Fund balances, October 1, ,526,131 43,344,459 43,344,459 - Fund balances, September 30, 2012 $ - $ - $ 36,485,072 $ 36,485,
210 Schedule of Revenues, Expenditures and Changes in Fund Balances - Budget and Actual Libraries Capital Projects Fund For the fiscal year ended September 30, 2012 Variance With Final Budget Original Final Actual Positive Budget Budget Amounts (Negative) Revenues: Special assessments $ 119,900 $ 119,900 $ 534,161 $ 414,261 Intergovernmental - 50,000 50,000 - Investment income 638, , , ,332 Miscellaneous - - 2,990 2,990 Less 5% anticipated revenues (37,895) (37,895) - 37,895 Total revenues 720, ,005 1,361, ,478 Expenditures: Current: Culture and recreation 654,027 1,281,829 1,066, ,994 Capital outlay 40,586,493 34,426,102 11,500,068 22,926,034 Total expenditures 41,240,520 35,707,931 12,566,903 23,141,028 Excess of revenues over (under) expenditures (40,520,515) (34,937,926) (11,205,420) 23,732,506 Other financing sources (uses): Transfers out (2,200,000) (2,200,000) (2,200,000) - Total other financing sources (uses) (2,200,000) (2,200,000) (2,200,000) - Net change in fund balances (42,720,515) (37,137,926) (13,405,420) 23,732,506 Fund balances, October 1, ,720,515 37,137,926 37,137,926 - Fund balances, September 30, 2012 $ - $ - $ 23,732,506 $ 23,732,
211 Schedule of Revenues, Expenditures and Changes in Fund Balances - Budget and Actual Parks & Recreation Capital Projects Fund For the fiscal year ended September 30, 2012 Variance With Final Budget Original Final Actual Positive Budget Budget Amounts (Negative) Revenues: Taxes (net of discount) $ - $ - $ 12,643 $ 12,643 Special assessments 836, ,000 3,505,794 2,669,794 Licenses and permits - 360, ,163 3,163 Intergovernmental 2,452,485 2,981,382 2,310,702 (670,680) Charges for services Investment income 1,172,000 1,172, ,857 (209,143) Miscellaneous 25, , ,460 6,440 Less 5% anticipated revenues (100,400) (100,400) - 100,400 Total revenues 4,385,085 5,354,002 7,266,959 1,912,957 Expenditures: Current: Economic environment - - 2,316 (2,316) Culture and recreation 18,356,212 17,255,616 1,148,131 16,107,485 Capital outlay 25,539,336 24,413,221 3,917,728 20,495,493 Total expenditures 43,895,548 41,668,837 5,068,175 36,600,662 Excess of revenues over (under) expenditures (39,510,463) (36,314,835) 2,198,784 38,513,619 Other financing sources (uses): Transfers in 868, , ,506 8,109 Total other financing sources (uses) 868, , ,506 8,109 Net change in fund balances (38,642,016) (35,389,438) 3,132,290 38,521,728 Fund balances, October 1, ,642,016 35,389,438 35,389,439 1 Fund balances, September 30, 2012 $ - $ - $ 38,521,729 $ 38,521,
212 Schedule of Revenues, Expenditures and Changes in Fund Balances - Budget and Actual Street & Drainage Capital Projects Fund For the fiscal year ended September 30, 2012 Variance With Final Budget Original Final Actual Positive Budget Budget Amounts (Negative) Revenues: Special assessments $ 350,000 $ 350,000 $ 537,338 $ 187,338 Investment income 293, , , ,005 Miscellaneous - 13, (13,670) Less 5% anticipated revenues (32,050) (32,050) - 32,050 Total revenues 611, ,956 1,059, ,723 Expenditures: Current: Transportation 181, , ,902 39,292 Economic environment Capital outlay 9,870,225 9,942, ,657 9,130,433 Total expenditures 10,052,074 10,136, ,559 9,169,725 Excess of revenues over (under) expenditures (9,440,798) (9,511,328) 93,120 9,604,448 Other financing sources (uses): Transfers in - 67,203 - (67,203) Total other financing sources (uses) - 67,203 - (67,203) Net change in fund balances (9,440,798) (9,444,125) 93,120 9,537,245 Fund balances, October 1, ,440,798 9,444,125 9,444,124 (1) Fund balances, September 30, 2012 $ - $ - $ 9,537,244 $ 9,537,
213 Schedule of Revenues, Expenditures and Changes in Fund Balances - Budget and Actual Major Fund - Road Program Capital Projects Fund For the fiscal year ended September 30, 2012 Variance With Final Budget Original Final Actual Positive Budget Budget Amounts (Negative) Revenues: Taxes (net of discount) $ 18,206,000 $ 9,038,000 $ 9,363,976 $ 325,976 Special assessments 21,540,142 21,540,142 12,854,648 (8,685,494) Intergovernmental 47,447,280 36,733,114 18,994,483 (17,738,631) Charges for services 350, , (349,775) Investment income 5,304,000 5,304,000 9,365,609 4,061,609 Miscellaneous 12,696,526 11,322,680 4,391,486 (6,931,194) Less 5% anticipated revenues (2,252,507) (2,252,507) - 2,252,507 Total revenues 103,291,441 82,035,429 54,970,427 (27,065,002) Expenditures: Current: General government 2,122,095 2,122,094 1,354, ,833 Transportation 13,190,849 12,880,875 4,801,643 8,079,232 Economic environment 583, , ,512 Capital outlay 424,298, ,372,897 44,394, ,978,792 Debt service Total expenditures 440,194, ,821,454 50,550, ,271,445 Excess of revenues over (under) expenditures (336,903,181) (352,786,025) 4,420, ,206,443 Other financing sources (uses): Transfers in 814, , ,000 - Transfers out (11,034,417) (4,528,000) (1,029,000) 3,499,000 Total other financing sources (uses) (10,220,417) (3,714,000) (215,000) 3,499,000 Net change in fund balances (347,123,598) (356,500,025) 4,205, ,705,443 Fund balances, October 1, ,123, ,500, ,500,027 2 Fund balances, September 30, 2012 $ - $ - $ 360,705,445 $ 360,705,
214 Schedule of Revenues, Expenditures and Changes in Fund Balances - Budget and Actual Major Fund - General Government Capital Projects Fund For the fiscal year ended September 30, 2012 Variance With Final Budget Original Final Actual Positive Budget Budget Amounts (Negative) Revenues: Taxes (net of discount) $ - $ - $ 800 $ 800 Special assessments 252, , , ,415 Intergovernmental 5,163,376 5,319,507 2,983,554 (2,335,953) Charges for services 2,811,000 2,811, ,573 (1,976,427) Investment income 3,825,316 3,825,316 3,043,436 (781,880) Miscellaneous 1,122,053 1,429, ,505 (847,772) Less 5% anticipated revenues (153,894) (153,894) - 153,894 Total revenues 13,020,411 13,483,766 8,124,843 (5,358,923) Expenditures: Current: General government 73,208,436 72,919,904 23,866,803 49,053,101 Public safety 86, Physical environment 1,341, , , ,488 Transportation 4,825,803 5,148,889 3,695,811 1,453,078 Economic environment 761, , , ,619 Human services 95,976 95, ,855 (10,879) Capital outlay 74,044,586 72,283,104 5,525,628 66,757,476 Debt service 108,653 95,925-95,925 Total expenditures 154,472, ,058,132 33,895, ,162,808 Excess of revenues over (under) expenditures (141,452,234) (138,574,366) (25,770,481) 112,803,885 Other financing sources (uses): Transfers in 15,464,250 18,814,068 17,137,369 (1,676,699) Transfers out (1,607,575) (1,687,788) (1,814,897) (127,109) Total other financing sources (uses) 13,856,675 17,126,280 15,322,472 (1,803,808) Net change in fund balances (127,595,559) (121,448,086) (10,448,009) 111,000,077 Fund balances, October 1, ,595, ,448, ,498,086 2,050,000 Fund balances, September 30, 2012 $ - $ - $ 113,050,077 $ 113,050,
215 INTERNAL SERVICE FUNDS Internal service funds are used to account for the financing of goods or services provided by one department or agency to other departments or agencies of the government and to other government units, on a cost reimbursement basis. Fleet Management - To account for the cost of operations for the repair and maintenance of County owned/leased vehicles and equipment as well as interdepartmental rental of cars, trucks and specialized equipment and automated fuel service. Such costs are billed to user departments at estimated cost of operations including equipment replacement and additions. Combined Insurance Fund - To account for the assessed premiums, claims and administration of the County's Risk Management Department for general, auto and property liability, employee group health, and workers' compensation. Clerk & Comptroller Insurance Fund - To account for the assessed premiums, claims and administration of the Clerk & Comptroller's employee group health insurance program. 165
216 Combining Statement of Net Assets Internal Service Funds September 30, 2012 Combined Clerk & Fleet Insurance Comptroller Management Fund Insurance Fund Total ASSETS Current assets: Cash and cash equivalents $ 17,772,315 $ 71,766,084 $ 2,954,943 $ 92,493,342 Accounts receivable, net 218 2,174,538 24,604 2,199,360 Due from other county funds 2,592,237 1,117, ,507 4,354,336 Due from other governments 183, ,534 Due from component unit 919 2,089-3,008 Inventory 1,536, ,536,811 Other assets 46,192 4,071,750-4,117,942 Total current assets 22,132,226 79,132,053 3,624, ,888,333 Capital assets: Buildings 206, ,558 Improvements other than buildings 512, ,286 Furniture, fixtures and equipment 74,571, ,044-74,835,035 Accumulated depreciation (51,805,030) (223,599) - (52,028,629) Total assets 45,618,031 79,171,498 3,624, ,413,583 LIABILITIES Current liabilities: Vouchers payable and accrued liabilities 1,455,554 2,662,025 3,755 4,121,334 Due to other county funds 8,014,438 8,679,702 88,505 16,782,645 Due to other governments , ,554 Current portion of long-term debt 14,325 20,624-34,949 Insurance claims payable - 12,425, ,000 13,175,063 Total current liabilities 9,484,451 23,922, ,260 34,249,545 Other long-term liabilities 597,394 42,539,000-43,136,394 Total liabilities 10,081,845 66,461, ,260 77,385,939 NET ASSETS Invested in capital assets, net of related debt 23,485,805 39,445-23,525,250 Unrestricted 12,050,381 12,670,219 2,781,794 27,502,394 Total net assets $ 35,536,186 $ 12,709,664 $ 2,781,794 $ 51,027,
217 Combining Statement of Revenues, Expenses, and Changes in Fund Net Assets Internal Service Funds For the fiscal year ended September 30, 2012 Combined Clerk & Fleet Insurance Comptroller Management Fund Insurance Fund Total Operating revenues: Charges for services $ 33,613,541 $ 68,334,824 $ 8,420,854 $ 110,369,219 Total operating revenues 33,613,541 68,334,824 8,420, ,369,219 Operating expenses: Transportation services 23,922, ,922,956 Self-insurance services - 82,940,919 8,215,653 91,156,572 Depreciation and amortization 8,348,059 22,993-8,371,052 Total operating expenses 32,271,015 82,963,912 8,215, ,450,580 Operating income (loss) 1,342,526 (14,629,088) 205,201 (13,081,361) Nonoperating revenues: Investment income 413,413 1,921, ,335,050 Other revenues 1,199,391 2,238,665-3,438,056 Total nonoperating revenues 1,612,804 4,160, ,773,106 Income before capital contributions and transfers 2,955,330 (10,468,812) 205,227 (7,308,255) Capital contributions 15, ,785 Transfers in 610, ,000 Transfers out (9,007,611) (9,171,116) - (18,178,727) Change in net assets (5,426,496) (19,639,928) 205,227 (24,861,197) Net assets, October 1, ,962,682 32,349,592 2,576,567 75,888,841 Net assets, September 30, 2012 $ 35,536,186 $ 12,709,664 $ 2,781,794 $ 51,027,
218 Combining Statement of Cash Flows Internal Service Funds For the fiscal year ended September 30, 2012 Fleet Management Combined Insurance Fund Cash flows from operating activities: Cash received from customers $ 1,190,426 $ 10,219,102 Cash received from other funds for goods and services 32,774,507 57,902,401 Cash payments to vendors for goods and services (17,801,138) (8,798,411) Cash payments to employees for services (4,804,500) (1,892,049) Cash payments to other funds (1,394,776) (1,093,475) Claims paid - (69,146,620) Other receipts 158,762 2,238,781 Net cash provided by (used in) operating activities 10,123,281 (10,570,271) Cash flows from noncapital financing activities: Transfers in 610,000 - Transfers out (1,007,611) (491,800) Net cash (used in) noncapital financing activities (397,611) (491,800) Cash flows from capital and related financing activities: Proceeds from sale of capital assets 1,251, Purchase and construction of capital assets (4,368,527) - Net cash provided by (used in) capital and related financing activities (3,117,065) 631 Cash flows from investing activities: Interest on investments 413,413 1,921,611 Net cash provided by investing activities 413,413 1,921,611 Net increase (decrease) in cash and cash equivalents 7,022,018 (9,139,829) Cash and cash equivalents, October 1, ,750,297 80,905,913 Cash and cash equivalents, September 30, 2012 $ 17,772,315 $ 71,766,084 Reconciliation of operating income to net cash provided by operating activities: Operating income (loss) $ 1,342,526 $ (14,629,088) Adjustments to reconcile operating income to net cash provided by operating activities: Depreciation and amortization 8,348,059 22,993 Miscellaneous revenue 158,762 2,238,781 Change in assets and liabilities: (Increase) decrease in accounts receivable 307 (54,838) (Increase) decrease in due from other county funds 187,984 (201,888) Decrease in due from other governments 162,440 43,727 Decrease in inventory 192,898 - Decrease in other assets - 243,851 (Increase) decrease in due from component unit 660 (321) Increase (decrease) in vouchers payable and accrued liabilities (228,592) 364,180 Increase (decrease) in due to other county funds 1, Increase in due to other governments ,420 (Decrease) in due to individuals - - (Decrease) in current portion of long-term debt (26,262) (11,968) Increase in insurance claims payable - 429,140 Increase (decrease) in other long-term liabilities (16,886) 849,722 Net cash provided by (used in) operating activities $ 10,123,281 $ (10,570,271) Supplemental disclosure of noncash capital and related financing activities: Contribution of capital assets $ 15,785 $ 3,601 Disposal of fully depreciated capital assets $ 3,318,150 $ 36,
219 Clerk & Comptroller Insurance Fund Total $ 1,280,640 $ 12,690,168 6,635,917 97,312,825 (2,810,397) (29,409,946) (86,601) (6,783,150) - (2,488,251) (5,413,109) (74,559,729) - 2,397,543 (393,550) (840,540) - 610,000 - (1,499,411) - (889,411) - 1,252,093 - (4,368,527) - (3,116,434) 26 2,335, ,335,050 (393,524) (2,511,335) 3,348,467 95,004,677 $ 2,954,943 $ 92,493,342 $ 205,201 $ (13,081,361) - 8,371,052-2,397,543 (24,604) (79,135) (479,694) (493,598) - 206, , , ,344 (181) 1, ,503 (103,028) (103,028) - (38,230) 8, , ,836 $ (393,550) $ (840,540) $ - $ 19,386 $ - $ 3,354,
220 170
221 AGENCY FUNDS Agency funds are used to account for assets held by the government as an agent for individuals, private organizations and other governments. Board of County Commissioners - To account for the assets held by the Board as an agent for individuals, organizations or other governments. These funds include: cash bonds, purchasing bid bonds, security deposits, and various payroll liabilities. Sheriff - To account for the assets held by the Sheriff as an agent for individuals, organizations or other governments. These funds include: cash bonds, evidence and suspense. Clerk & Comptroller - To account for the assets held by the Clerk of the Courts as an agent for individuals, organizations and other governments. These funds include: fines and forfeitures, jury and witness, tax deed, registry of court, probate, support and general agency. Tax Collector - To account for the assets held by the Tax Collector as an agent for individuals, organizations or other governments. These funds include: ad-valorem and non ad-valorem tax payments and license and registration payments. 171
222 Combining Statement of Fiduciary Net Assets - Agency Funds September 30, 2012 AGENCY FUNDS Board of County Clerk & Total Commissioners Sheriff Comptroller Tax Collector Agency Funds ASSETS Cash, cash equivalents, and investments $ 6,099,673 $ 960,573 $ 67,078,659 $ 49,199,644 $ 123,338,549 Accounts receivable, net , , , ,264 Due from other governments 61,913 1,394, ,457,523 Other assets Total assets $ 6,162,047 $ 2,917,884 $ 67,238,033 $ 49,303,687 $ 125,621,651 LIABILITIES Vouchers payable and accrued liabilities $ 2,644,289 $ 56,805 $ - $ 894,877 $ 3,595,971 Due to other governments 386, ,579 9,930,015 29,408,155 40,035,833 Due to individuals 2,395,378 2,549,500 57,308,018 19,000,655 81,253,551 Other liabilities 736, ,296 Total liabilities $ 6,162,047 $ 2,917,884 $ 67,238,033 $ 49,303,687 $ 125,621,
223 Combining Statement of Changes in Assets and Liabilities All Agency Funds For the fiscal year ended September 30, 2012 BOARD OF COUNTY COMMISSIONERS ASSETS Balance Balance 10/1/2011 Additions Deductions 9/30/2012 Cash, cash equivalents, and investments $ 6,783,509 $ 51,016,505 $ 51,700,341 $ 6,099,673 Accounts receivable, net 461 3,428 3, Due from other county funds Due from other governments 58,308 61,860 58,255 61,913 Other assets Total assets $ 6,842,278 $ 51,081,793 $ 51,762,024 $ 6,162,047 LIABILITIES Vouchers payable and accrued liabilities $ 4,448,682 $ 42,495,760 $ 44,300,153 $ 2,644,289 Due to other county funds - 76,526 76,526 - Due to other governments 236,317 1,227,966 1,078, ,084 Due to component unit - 181, ,627 - Due to individuals 2,039,206 1,073, ,555 2,395,378 Other liabilities 118,073 12,617,962 11,999, ,296 Total liabilities $ 6,842,278 $ 57,673,568 $ 58,353,799 $ 6,162,
224 Combining Statement of Changes in Assets and Liabilities All Agency Funds For the fiscal year ended September 30, 2012 SHERIFF Balance Balance 10/1/2011 Additions Deductions 9/30/2012 ASSETS Cash, cash equivalents, and investments $ 1,434,748 $ 87,718,162 $ 88,192,337 $ 960,573 Accounts receivable, net 305,192 7,125,121 6,868, ,080 Due from other county funds - 12,285,191 12,285,191 - Due from other governments 1,544,733 44,954,521 45,104,338 1,394,916 Other assets Total assets $ 3,284,998 $ 152,083,802 $ 152,450,916 $ 2,917,884 LIABILITIES Vouchers payable and accrued liabilities $ 92,480 $ 4,500,158 $ 4,535,833 $ 56,805 Due to other county funds - 127,003, ,003,149 - Due to other governments 302,563 1,008, , ,579 Due to component unit Due to individuals 2,889,955 10,097,443 10,437,898 2,549,500 Other liabilities - 43,455,554 43,455,554 - Total liabilities $ 3,284,998 $ 186,064,983 $ 186,432,097 $ 2,917,
225 Combining Statement of Changes in Assets and Liabilities All Agency Funds For the fiscal year ended September 30, 2012 CLERK & COMPTROLLER ASSETS Balance Balance 10/1/2011 Additions Deductions 9/30/2012 Cash, cash equivalents, and investments $ 41,686,810 $ 544,456,457 $ 519,064,608 $ 67,078,659 Accounts receivable, net 75, , , ,374 Due from other county funds Due from other governments Other assets Total assets $ 41,762,794 $ 545,213,998 $ 519,738,759 $ 67,238,033 LIABILITIES Vouchers payable and accrued liabilities $ - $ - $ - $ - Due to other county funds - 25,873,023 25,873,023 - Due to other governments 9,654, ,872, ,596,775 9,930,015 Due to component unit Due to individuals 32,108, ,012, ,813,181 57,308,018 Other liabilities Total liabilities $ 41,762,794 $ 504,758,218 $ 479,282,979 $ 67,238,
226 Combining Statement of Changes in Assets and Liabilities All Agency Funds For the fiscal year ended September 30, 2012 TAX COLLECTOR Balance Balance 10/1/2011 Additions Deductions 9/30/2012 ASSETS Cash, cash equivalents, and investments $ 53,764,902 $ 3,326,757,830 $ 3,331,323,088 $ 49,199,644 Accounts receivable, net 232,429 3,994,140 4,123, ,349 Due from other county funds Due from other governments 1,347 2,222 2, Other assets Total assets $ 53,998,678 $ 3,330,754,192 $ 3,335,449,183 $ 49,303,687 LIABILITIES Vouchers payable and accrued liabilities $ 457,694 $ 894,877 $ 457,694 $ 894,877 Due to other county funds Due to other governments 27,334,863 2,492,670,249 2,490,596,957 29,408,155 Due to component unit Due to individuals 26,206, ,611, ,816,635 19,000,655 Other liabilities Total liabilities $ 53,998,678 $ 3,461,176,295 $ 3,465,871,286 $ 49,303,
227 Combining Statement of Changes in Assets and Liabilities All Agency Funds For the fiscal year ended September 30, 2012 TOTAL AGENCY FUNDS ASSETS Balance Balance 10/1/2011 Additions Deductions 9/30/2012 Cash, cash equivalents, and investments $ 103,669,969 $ 4,009,948,954 $ 3,990,280,374 $ 123,338,549 Accounts receivable, net 614,066 11,880,230 11,669, ,264 Due from other county funds - 12,285,191 12,285,191 - Due from other governments 1,604,388 45,018,603 45,165,468 1,457,523 Other assets Total assets $ 105,888,748 $ 4,079,133,785 $ 4,059,400,882 $ 125,621,651 LIABILITIES Vouchers payable and accrued liabilities $ 4,998,856 $ 47,890,795 $ 49,293,680 $ 3,595,971 Due to other county funds - 152,952, ,952,698 - Due to other governments 37,527,949 2,782,779,478 2,780,271,594 40,035,833 Due to component unit - 181, ,627 - Due to individuals 63,243,870 1,169,794,950 1,151,785,269 81,253,551 Other liabilities 118,073 56,073,516 55,455, ,296 Total liabilities $ 105,888,748 $ 4,209,673,064 $ 4,189,940,161 $ 125,621,
228 178


229 Statistical Section The Statistical Section provides financial statement users with additional historical perspective, context, and detail to assist in using the information in the financial statements, including the accompanying notes, and required supplementary information to assess the County s economic condition. Information is presented in the following five categories: - Financial trends information - Revenue capacity information - Debt capacity information - Demographic & economic information - Operating information
230
231 Statistical Section This part of Palm Beach County ' s Comprehensive Annual Financial Report presents detailed information as a context for understanding what the information in the financial statements, note disclosures, and required supplementary information says about Palm Beach County ' s overall financial health. Contents Page Financial Trends Information 182 These schedules contain trend information to help the reader understand how the County ' s financial performance and well-being have changed over time. Revenue Capacity Information 194 These schedules contain information to help the reader assess the County ' s most significant local revenue source, Property taxes. Debt Capacity Information 203 These schedules present information to help the reader assess the affordability of the County ' s current levels of outstanding debt and the County ' s ability to issue additional debt in the future. Demographic and Economic Information 209 These schedules offer economic and demographic indicators to help the reader understand the environment within which the County ' s financial activities take place. Operating Information 212 These schedules contain service and infrastructure data to help the reader understand how the information in the County ' s financial report relates to the services the County provides and the activities it performs. Sources: Unless otherwise noted, the information in these schedules is derived from the comprehensive annual financial reports for the relevant year. 179
232 180
233 FINANCIAL TRENDS INFORMATION 181
234 TABLE I PALM BEACH COUNTY, FLORIDA Net Assets by Component Last Ten Fiscal Years September 30, 2012 (accrual basis of accounting) Governmental activities Invested in capital assets, net of related debt $ 1,546,566,514 $ 1,489,989,254 $ 1,450,011,423 $ 1,379,604,426 Restricted 607,934, ,555, ,130, ,216,501 Unrestricted 224,565, ,652, ,567, ,300,661 Subtotal governmental activities net assets 2,379,066,633 2,352,197,281 2,350,709,130 2,386,121,588 Business-type activities Invested in capital assets, net of related debt 962,437, ,542,617 1,279,889,595 1,295,978,868 Restricted 80,734,828 80,426, ,822, ,511,960 Unrestricted 286,575, ,844, ,268, ,786,962 Subtotal business-type activities net assets 1,329,747,677 1,281,813,748 1,669,979,893 1,646,277,790 Primary government Invested in capital assets, net of related debt 2,509,004,001 2,446,531,871 2,729,901,018 2,675,583,294 Restricted 688,669, ,982, ,952, ,728,461 Unrestricted 511,141, ,496, ,835, ,087,623 Total primary government net assets $ 3,708,814,310 $ 3,634,011,029 $ 4,020,689,023 $ 4,032,399,
235 $ 1,259,900,977 $ 1,258,858,321 $ 1,149,700,254 $ 1,045,215,024 $ 984,688,856 $ 703,748, ,136, ,922, ,306, ,046, ,662, ,039, ,592, ,170, ,749, ,276, ,909, ,261,900 2,385,630,843 2,374,950,745 2,243,755,485 2,017,538,821 1,829,261,264 1,469,049,334 1,221,939,326 1,086,676, ,165, ,609, ,742, ,501,790 81,853,521 96,296,100 75,198,428 73,553,352 97,185,482 91,070, ,633, ,151, ,449, ,387, ,706, ,202,723 1,560,426,733 1,463,124,256 1,316,813,790 1,195,549,715 1,112,634,361 1,023,775,447 2,481,840,303 2,345,534,704 2,097,865,962 1,906,824,220 1,747,430,858 1,372,250, ,990, ,218, ,504, ,600, ,848, ,110, ,226, ,322, ,198, ,664, ,616, ,464,623 $ 3,946,057,576 $ 3,838,075,001 $ 3,560,569,275 $ 3,213,088,536 $ 2,941,895,625 $ 2,492,824,
236 TABLE II PALM BEACH COUNTY, FLORIDA Changes in Net Assets Last Ten Fiscal Years September 30, 2012 (accrual basis of accounting) Expenses Governmental activities: General government $ 314,666,246 $ 341,822,193 $ 371,148,103 $ 361,226,125 Public safety 759,899, ,484, ,471, ,921,020 Physical environment 29,206,388 28,162,354 43,167,022 31,362,849 Transportation 168,483, ,340, ,220, ,185,218 Economic environment 114,825,751 81,393,923 81,413,581 97,971,339 Human services 97,827, ,147, ,602, ,646,882 Culture & recreation 107,783, ,388, ,116, ,372,592 Interest expense 48,095,197 51,630,978 54,553,591 57,030,394 Total governmental activities expenses 1,640,787,257 1,643,371,098 1,723,692,993 1,674,716,419 Business-type activities: Department of Airports 73,838,549 75,500,620 76,945,438 78,046,101 Water Utilities Department 149,310, ,231, ,430, ,641,769 Solid Waste Authority ,080, ,688,229 Total business-type activities expenses 223,148, ,731, ,456, ,376,099 Total primary government expenses 1,863,936,125 1,866,102,997 2,140,149,631 2,075,092,518 Program Revenues Governmental activities: Fines, fees and charges for services General government 111,559, ,103, ,620, ,047,649 Public safety 117,831, ,387, ,863, ,334,202 Physical environment 8,298,140 6,499,713 17,133,350 10,151,537 Transportation 27,167,174 20,060,113 18,614,170 17,193,688 Economic environment 3,354,941 3,058,264 3,437,443 3,290,607 Human services 3,547,332 3,351,710 3,348,276 3,698,309 Culture & recreation 19,313,804 16,699,485 15,373,433 14,251,315 Operating Grants and Contributions 223,500, ,692, ,400, ,370,724 Capital Grants and Contributions 20,135,358 22,045,772 17,336,040 18,467,156 Total governmental activities program revenue 534,707, ,898, ,128, ,805,187 Business-type activities: Fines, fees and charges for services Department of Airports 77,400,041 78,911,145 76,165,984 75,700,643 Water Utilities Department 157,177, ,312, ,616, ,226,088 Solid Waste Authority ,743, ,946,893 Operating Grants and Contributions - - 1,587,479 2,611,735 Capital Grants and Contributions 30,204,065 22,455,857 29,919,742 39,857,577 Total business-type activities program revenue 264,781, ,679, ,032, ,342,936 Total primary government program revenues 799,489, ,578, ,160, ,148,
237 $ 350,734,704 $ 353,587,607 $ 334,221,067 $ 287,930,665 $ 277,009,468 $ 270,247, ,642, ,701, ,769, ,224, ,227, ,565,298 25,796,346 28,636,570 22,758,674 25,537,612 23,720,500 19,546, ,201, ,132, ,885, ,115, ,520,025 91,633, ,041, ,162,014 70,953,984 56,343,792 50,619,793 43,030, ,164, ,967,046 92,500,262 87,689,004 88,722,328 80,494, ,177, ,260, ,554, ,373,803 94,616,074 88,833,662 49,875,129 49,027,928 46,868,063 40,736,456 36,729,939 34,241,486 1,716,633,868 1,629,475,391 1,444,512,468 1,312,951,266 1,180,166,046 1,062,593,605 71,747,321 66,276,956 65,296,423 66,018,396 58,126,033 57,070, ,812, ,853,464 98,664,387 84,650,247 77,154,525 72,006, ,805, ,484, ,845, ,876, ,239, ,594, ,365, ,614, ,806, ,544, ,519, ,671,123 2,076,999,136 1,967,089,954 1,820,319,106 1,657,496,171 1,466,685,826 1,327,264, ,124, ,000, ,791, ,804, ,143, ,373,676 98,503,611 94,764,762 90,472,783 94,327,833 86,737,955 87,545,979 4,997,300 5,680,770 8,888,175 8,984,143 6,278,825 6,751,335 26,379,224 31,801,521 56,056,281 62,242,662 59,161,311 55,763,950 3,227,522 3,122,003 2,985,295 2,936,974 2,260, ,000 5,897,399 3,140,222 2,884,924 3,136,439 3,613,563 3,313,414 12,332,208 15,254,861 20,951,076 24,344,306 27,575,440 14,161, ,135, ,204, ,338, ,143, ,265, ,721,579 40,630,120 18,202,648 18,860,932 29,908,643 23,246,229 24,043, ,227, ,172, ,229, ,829, ,282, ,068,150 74,338,460 77,478,538 73,656,481 70,695,132 61,474,612 55,350, ,720, ,090,233 97,504,258 91,355,681 91,960,731 83,683, ,947, ,898, ,395, ,923, ,871, ,282,109 9,076,750 30,829,908 71,862,103 46,954,571 17,935,686 6,005,790 59,477,117 57,146,874 86,049,256 51,255,084 45,811,678 44,405, ,560, ,443, ,467, ,184, ,054, ,727, ,787, ,616,195 1,033,697, ,013, ,337, ,795,
238 (Continuations) TABLE II PALM BEACH COUNTY, FLORIDA Changes in Net Assets Last Ten Fiscal Years September 30, 2012 (accrual basis of accounting) Net (Expenses)/Revenue Governmental activities: $ (1,106,079,761) $ (1,147,472,173) $ (1,262,564,973) $ (1,258,911,232) Business-type activities: 41,633,109 30,947,985 71,576,264 74,966,837 Total primary government net expense (1,064,446,652) (1,116,524,188) (1,190,988,709) (1,183,944,395) General Revenues and Other Changes in Net Assets Governmental activities: Taxes levied by the County Ad valorem taxes 824,015, ,684, ,977, ,761,096 Utility service taxes 33,553,838 33,947,339 33,837,191 29,662,838 Local option gas taxes 45,637,158 44,603,467 44,949,024 45,472,637 Tourist development taxes 28,821,660 25,480,495 23,219,185 22,346,492 State shared sales tax-unrestricted 70,206,178 66,826,717 64,268,114 64,658,133 Franchise gross receipts fee 34,955,780 36,350,282 38,512,546 34,149,094 State shared revenue-unrestricted 55,026,652 52,288,454 87,130,547 62,583,579 Investment income 40,425,709 47,432,115 71,620, ,105,777 Other general revenues 3,138,225 2,073,844 3,638,664 8,562,331 Gain on disposal of capital assets - 2,001, Transfers-net (2,831,473) (1,727,842) (1,001,252) 1,100,000 Total governmental activities 1,132,949,113 1,148,960,324 1,227,152,515 1,259,401,977 Business-type activities: Investment income 7,041,371 8,271,098 7,506,002 11,984,220 Other general revenues Gain on disposal of capital assets Transfers-net 2,831,473 1,727,842 1,001,252 (1,100,000) Special items (3,572,024) (4,045,999) (56,381,415) - Total business-type activities 6,300,820 5,952,941 (47,874,161) 10,884,220 Total primary government 1,139,249,933 1,154,913,265 1,179,278,354 1,270,286,197 Change in Net Assets Governmental activities 26,869,352 1,488,151 (35,412,458) 490,745 Business-type activities 47,933,929 36,900,926 23,702,103 85,851,057 Total primary government $ 74,803,281 $ 38,389,077 $ (11,710,355) $ 86,341,
239 $ (1,263,406,848) $ (1,193,303,113) $ (916,282,599) $ (795,122,062) $ (725,883,652) $ (656,525,455) 97,195, ,829, ,660,672 77,639,311 81,534,898 65,056,556 (1,166,211,498) (1,062,473,759) (786,621,927) (717,482,751) (644,348,754) (591,468,899) 897,890, ,719, ,033, ,200, ,326, ,171,572 30,543,325 29,824,203 28,882,670 28,074,005 27,196,819 28,314,364 46,068,630 47,668,148 49,144,912 49,196,637 48,033,683 45,946,096 27,813,718 26,818,069 23,528,567 22,516,374 19,848,215 17,330,095 72,375,458 76,120,744 80,019,101 76,660,073 73,705,133 66,973,342 30,039,809 30,005,367 29,707,735 25,707,598 22,856,094 22,844,936 59,369,923 61,569,609 61,593,434 58,434,994 54,733,943 48,113,623 87,183,609 98,855,421 75,370,005 33,639,043 33,858,058 31,005,054 6,092,958 9,640,268 5,274,520 4,169,936 1,563,777 3,696,464-6,804, ,647,381 9,654,866 (2,528,033) (11,055,000) (199,806) (358,500) 54,656 1,267,032,946 1,324,498,373 1,142,499, ,399, ,763, ,097,583 9,684,500 12,932,755 9,298,155 5,076,237 5,991,610 6,498, , ,493 20,324 3,416, ,906 76,394 (9,654,866) 2,528,033 11,055, , ,500 (54,656) - - (32,214,001) - 225, ,127 15,481,112 (8,396,597) 5,276,043 7,314,016 6,519,916 1,267,140,073 1,339,979,485 1,134,102, ,675, ,077, ,617,499 3,626, ,195, ,216, ,277, ,879, ,572,128 97,302, ,310, ,264,075 82,915,354 88,848,914 71,576,472 $ 100,928,575 $ 277,505,726 $ 347,480,739 $ 271,192,911 $ 250,728,723 $ 223,148,
240 TABLE III PALM BEACH COUNTY, FLORIDA Fund Balances Governmental Funds Last Ten Fiscal Years September 30, 2012 (modified accrual basis of accounting) Pre - GASB Statement No. 54 "Fund Balance Reporting and Governmental Fund Type Definitions" General Fund Reserved $ 2,075,220 $ 2,050,551 $ 1,998,639 $ 2,072,013 $ 2,705,674 Unreserved 167,040, ,812, ,575, ,764, ,802,474 Total general fund $ 169,115,997 $ 180,863,197 $ 220,573,800 $ 242,836,817 $ 221,508,148 All Other Governmental Funds Reserved $ 41,693,047 $ 42,910,572 $ 46,696,097 $ 29,563,773 $ 35,810,097 Unreserved, reported in: Special revenue funds 286,753, ,123, ,245, ,283, ,649,627 Capital project funds 759,316, ,298, ,138, ,294, ,898,355 Total all other governmental funds $ 1,087,762,612 $ 1,243,332,321 $ 1,296,080,217 $ 1,167,141,456 $ 1,262,358,079 Post - GASB Statement No. 54 "Fund Balance Reporting and Governmental Fund Type Definitions" General Fund Nonspendable $ 5,762,610 $ 6,528,628 Spendable: Restricted 17,648,934 15,615,345 Assigned 437,425 - Unassigned 193,701, ,636,195 Total general fund $ 217,550,022 $ 200,780,168 All Other Governmental Funds Nonspendable $ 6,599,801 $ 6,894,353 Spendable: Restricted 708,502, ,335,862 Assigned 199,476, ,848,573 Unassigned (11,011,102) (8,283,268) Total all other governmental funds $ 903,568,080 $ 946,795,520 GASB Statement No. 54 was implemented in fiscal year
241 $ 2,377,934 $ 1,504,296 $ 1,377, ,467, ,241, ,729,927 $ 184,845,873 $ 149,745,971 $ 184,107,802 $ 38,533,591 $ 21,298,817 $ 21,335, ,117, ,168, ,100, ,318, ,838, ,543,322 $ 1,152,969,133 $ 935,305,979 $ 794,978,
242 Table IV PALM BEACH COUNTY, FLORIDA Changes in Fund Balance Governmental Funds Last Ten Fiscal Years September 30, 2012 (modified accrual basis of accounting) Revenues Taxes (See Table V) $ 958,796,572 $ 969,585,795 $ 990,532,379 $ 981,612,885 $ 1,060,648,899 Special assessments 32,282,348 14,264,557 14,280,821 12,800,895 30,766,826 Licenses and permits 50,461,027 50,712,934 51,631,037 45,277,203 14,495,838 Intergovernmental (See Table V) 323,637, ,165, ,852, ,405, ,253,335 Charges for services 259,051, ,016, ,399, ,772, ,170,088 Less - excess fees paid out (39,445,243) (39,568,304) (42,088,065) (45,435,474) (48,986,202) Fines & forfeitures 7,215,209 8,104,263 7,834,661 12,050,681 13,409,495 Investment income 38,090,657 44,264,314 66,901, ,214,081 84,558,686 Miscellaneous 24,492,007 20,006,576 26,792,351 23,927,073 25,256,701 Total revenues 1,654,581,460 1,615,552,245 1,668,136,052 1,656,625,172 1,674,573,666 Expenditures General government 274,355, ,404, ,528, ,345, ,329,730 Public safety 695,133, ,024, ,092, ,356, ,281,284 Physical environment 27,896,485 27,236,858 41,730,420 29,585,239 24,897,201 Transportation 125,192, ,620, ,543, ,347, ,380,373 Economic environment 114,737,668 81,389,450 81,075,787 99,032, ,019,052 Human services 96,774, ,158, ,155, ,393,023 99,860,522 Culture & recreation 90,721, ,116, ,158, ,713, ,653,976 Capital outlay 142,048, ,108, ,202, ,570, ,434,936 Debt service Principal 82,574,228 82,679,150 80,097,501 75,847,513 73,892,468 Interest 48,791,317 53,082,857 56,656,584 54,810,052 48,576,404 Other charges 1,275,884 3,354,054 3,464,706 2,771,849 4,845,829 Total expenditures 1,699,501,423 1,769,175,613 1,846,705,885 1,813,773,743 1,879,171,775 Excess of revenues over (under) expenditures (44,919,963) (153,623,368) (178,569,833) (157,148,571) (204,598,109) Other Financing Sources (Uses) Transfers in 211,372, ,873, ,831, ,338, ,518,983 Transfers out (196,634,999) (202,840,602) (786,720,354) (874,688,943) (790,164,731) Issuance of long-term debt 3,561,000 37,359,407 1,426,000 59,844, ,926,006 Premium (discount) long-term debt ,667 5,446,308 Issuance of refunding debt 163,189,340 91,475,000 31,128,107 51,730,000 53,751,266 Premium (discount) refunding debt 28,470,407 14,763,603 1,114, , ,115 Payment to escrow agent for refunding (191,000,713) (99,819,373) (31,998,005) (47,904,895) (54,185,517) Total other financing sources (uses) 18,957,288 43,811,162 11,782,091 65,103, ,089,430 Net change in fund balances $ (25,962,675) $ (109,812,206) $ (166,787,742) $ (92,044,745) $ 106,491,321 Debt service as a percentage of noncapital expenditures (1) 8.4% 8.5% 8.3% 8.2% 7.5% (1) Debt service percentage = (principal & interest) / (total expenditures - capital outlay capitalized as capital assets) 190
243 $ 1,103,524,951 $ 959,811,851 $ 839,088,219 $ 750,538,352 $ 678,623,758 37,199,384 93,320, ,468,425 96,267,382 92,674,006 18,905,841 27,124,893 23,241,939 18,423,955 15,971, ,178, ,002, ,413, ,072, ,300, ,533, ,197, ,621, ,993, ,568,583 (50,266,917) (40,873,561) (34,996,646) (30,963,646) - 14,905,754 7,655,171 7,368,597 14,451,096 16,926,636 97,232,629 71,586,595 31,087,205 30,482,437 26,711,503 39,679,635 35,124,869 26,262,217 24,668,231 23,233,113 1,744,893,053 1,681,950,600 1,504,555,529 1,312,933,467 1,202,009, ,015, ,838, ,333, ,309, ,733, ,870, ,135, ,830, ,658, ,014,162 26,549,400 21,343,348 23,607,179 21,418,568 18,412, ,592, ,777, ,742, ,418,238 87,911, ,367,439 70,743,624 56,103,756 50,441,054 42,769,728 99,109,754 91,612,500 87,112,369 87,273,324 79,186, ,809, ,390,031 88,698,037 83,478,624 77,340, ,185, ,383, ,918, ,564, ,374,886 88,291,399 62,308,629 51,899,195 47,422,546 43,855,556 49,666,635 45,439,931 37,950,596 34,920,376 34,037, ,931 3,024,010 5,187,643 3,825, ,726 1,896,123,814 1,632,996,883 1,519,383,513 1,324,730,257 1,208,396,424 (151,230,761) 48,953,717 (14,827,984) (11,796,790) (6,386,603) 789,706, ,145, ,070, ,407, ,941,179 (790,338,523) (654,200,798) (550,031,074) (546,159,652) (510,386,523) 78,470, ,504, ,305, ,127,451 55,537, ,966 (48,226) 11,127,960 5,145,225 2,337, ,825,000 76,555,000 94,297, ,550,476 9,606, (121,560,729) (78,935,818) (102,397,730) - 78,400,846 94,665, ,642, ,025,911 59,429,501 $ (72,829,915) $ 143,619,417 $ 251,814,493 $ 105,229,121 $ 53,042, % 7.7% 7.1% 7.3% 7.4% 191
244 TABLE V PALM BEACH COUNTY, FLORIDA Tax and Intergovernmental Revenue by Source Last Ten Fiscal Years September 30, 2012 (modified accrual basis of accouting) (dollars in thousands) County Taxes Tourist Communication Local Total Fiscal Ad valorem Development Local option Utility services Franchise Business County Year Tax Tax Gas tax Tax Tax Fees (3) Tax (3) Taxes 2003 $ 542,172 $ 17,330 $ 45,946 $ 28,314 $ 22,017 $ 22,845 $ - $ 678, ,326 19,848 48,034 27,197 26,277 22, , ,201 22,516 49,197 28,074 28,393 25, , ,033 23,528 49,145 28,883 28,515 29, , ,720 26,818 47,668 29,824 29,490 30,005-1,103, ,891 27,814 46,069 30,543 28,992 29,340-1,060, ,761 22,346 45,473 29,663 26,447-1, , ,978 23,219 44,949 33,837 25,645-1, , ,684 25,481 44,603 33,947 24,126-1, , ,015 33,554 45,637 28,822 24,914 1, ,797 Intergovernmental Revenue State shared State Total Fiscal Sales Revenue State levied Federal Other Other Intergovernmental Year Tax Sharing Fuel taxes Grants (2) Grants (1) Revenue 2003 $ 66,973 $ 22,966 $ 13,242 $ 56,082 $ 28,906 $ 3,131 $ 191, ,705 25,092 14,130 56,910 37,870 3, , ,660 26,206 17,688 94,590 36,434 3, , ,019 27,931 17, ,383 31,023 5, , ,121 26,861 17,405 71,340 26,693 6, , ,375 24,802 16,388 69,728 41,172 6, , ,658 30,508 16,017 68,041 42,400 8, , ,268 55,691 15, ,184 26,522 8, , ,827 56,053 15, ,734 22,733 10, , ,206 57,394 15, ,342 34,740 8, ,637 (1) Other revenue includes: Alcoholic Beverage Licenses, Racing Tax, Insurance Agent County Licenses, Mobile Home licenses, Firefighters Supplemental Comp, and 911 Wireless Fees. (2) The increases in FY's 05, 06, 10, 11 & 12 are the result of FEMA Disaster reimbursements for hurricane damage suffered in Palm Beach County. (3) Effective with FY09, franchise fees are now considered to be "Licenses, Permits and Fees" and are no longer included in this table. Additionally, occupational licenses are now considered to be "Taxes" and are included in this table under the "Local Business Tax" column. Note: Some values may differ from amounts reported in the Entity-wide Statement of Activities. That statement reports revenues using the full accrual method of accounting. 192
245 REVENUE CAPACITY INFORMATION 193
246 TABLE VI PALM BEACH COUNTY, FLORIDA Actual Value and Assessed Value of Taxable Property Last Ten Fiscal Years September 30, 2012 (in thousands of dollars) Fiscal Year Ended Residential Commercial Industrial Other Sept. 30 Property Property Property Property 2003 $ 97,727,796 $ 12,304,621 $ 2,218,902 $ 9,949, ,361,431 13,484,265 2,466,880 10,876, ,838,576 15,432,972 2,935,935 12,790, ,122,863 19,818,634 3,754,689 15,233, ,691,396 20,990,540 4,125,245 16,415, ,730,204 21,856,923 4,408,947 17,058, ,686,709 20,363,548 5,713,502 16,523, ,853,487 17,121,091 4,686,925 15,281, ,927,021 16,264,373 4,548,654 14,861, ,197,808 16,363,470 4,305,761 14,991,121 Source: Notes: Palm Beach County Property Appraiser's Office, Form DR-403V and DRPC_AUTH. Florida State Law requires all property to be assessed at current fair market value. Exemptions for real property include: homestead exemptions, widows/widowers exemption, disability/blind exemption, governmental exemption, institutional exemption, economic development, and other exemptions as allowed by law. Certain prior year amounts in this table have been revised based on additional information received. 194
247 Total Tangible Railroad Total Property Total Property Less: Direct Personal And Just Assessed Total Exempt Total Taxable Tax Property Telegraph Value Value Value Value Rate $ 7,057,718 $ 73,154 $ 129,331,728 $ 114,729,650 $ 16,392,415 $ 98,337, ,171,511 78, ,439, ,430,840 17,469, ,961, ,477,803 70, ,546, ,876,692 18,872, ,004, ,862,551 80, ,872, ,194,149 21,209, ,984, ,023, , ,349, ,826,739 21,816, ,009, ,243, , ,427, ,249,945 30,890, ,359, ,403, , ,794, ,643,979 30,201, ,442, ,341,651 95, ,379, ,555,378 28,865, ,689, ,584,234 99, ,284, ,332,012 28,062, ,269, ,294, , ,255, ,032,623 27,696, ,336,
248 TABLE VII PALM BEACH COUNTY, FLORIDA Direct and Overlapping Property Tax Rates Last Ten Fiscal Years September 30, 2012 (Per $1,000 of Assessed Value) Overlapping RatesDirect Rates Palm South Fiscal Beach Florida Florida Year Debt Total County Water Inland Children's Health Total Ended General Service Direct School Management Navigation Services Care Overlapping Total Sept. 30 Government Fund Rates Board District District Council District Rates Countywide
249 TABLE VIII PALM BEACH COUNTY, FLORIDA Principal Property Tax Payers Current Year and Nine Years Ago September 30, Percentage Percentage Of Total Of Total Total Taxes Total Taxes Taxpayer Tax Rank Levied Tax Rank Levied Florida Power & Light $ 75,124, % $ 21,792, % BellSouth Telecommunications 7,250, ,678, Town Center 6,956, ,998, U.S. Sugar Corporation 5,162, ,846, Gardens Venture LLC 4,584, Breakers Palm Beach Inc. 4,391, ,913, Panthers BRHC LTD 3,448, ,818, Okeelanta Corporation 3,428, ,488, Comcast of Florida/Georgia LLC 3,283, Phillips Point II LLC 2,966, Landry, Lawrence L ,277, TJ Palm Beach Assoc LTD Ptnrs - - 3,011, West Palm Beach CRA Lessor - - 4,363, Total $ 116,596, % $ 65,190, % Total Taxes levied: $ 855,036,629 $ 564,142,933 Source: Palm Beach County, Office of the Tax Collector 197
250 TABLE IX PALM BEACH COUNTY, FLORIDA Property Tax Levies and Collections Last Ten Fiscal Years September 30, 2012 Gross Net Taxes Levied Discounts Taxes Levied Collections of Current Year Levy Collections Total Collections to Date Fiscal Year for the For Early for the Percentage of Subsequent Percentage Ended Sept. 30 Fiscal Year Payment Fiscal Year Amount Net of Levy Year Levy Amount Net of Levy 2003 $ 564,142,933 $ 19,651,559 $ 544,491,374 $ 540,858, % $ 1,313,225 $ 542,171, % ,738,788 22,122, ,615, ,494, , ,326, ,058,996 25,117, ,941, ,361, , ,200, ,870,587 30,533, ,336, ,229, , ,033, ,089,028 33,329, ,759, ,520, ,199, ,719, ,762,735 31,267, ,495, ,209, ,680, ,890, ,906,615 29,693, ,212, ,038, ,722, ,761, ,787,811 30,228, ,558, ,830, ,147, ,977, ,688,271 30,051, ,637, ,742, ,941, ,684, ,036,629 29,541, ,495, ,681, ,333, ,015, Source: Palm Beach County Tax Collector's Office 198
251 199
252 TABLE X PALM BEACH COUNTY, FLORIDA Non-Ad Valorem Revenue Last Ten Fiscal Years September 30, 2012 Fiscal Year Ended Sept Charges for Other Services $ 78,347,467 $ 79,154,771 $ 87,470,077 $ 81,137,945 Half-Cent Sales Tax 70,206,178 66,826,718 64,268,115 64,658,133 Electric Franchise Tax 31,407,084 33,262,458 34,017,118 29,913,714 Utility Service Tax 33,478,695 33,947,339 33,837,191 29,662,838 Communications Service Tax 24,914,036 24,125,967 25,645,070 26,446,677 State Revenue Sharing 24,222,170 22,779,584 21,985,390 22,072,684 Reimburse of Indirect Costs 16,335,055 18,015,373 15,912,878 14,277,742 Interest (3) 14,355,141 14,880,568 26,413,522 57,833,423 Miscellaneous 11,899,272 16,638,345 16,465,716 13,524,257 Parks & Recreation Fees 12,491,427 12,905,162 12,631,848 12,559,968 Licenses & Permits 5,691,190 5,404,452 5,375,253 5,609,587 Available Tourist Development Tax 5,764,332 5,096,099 4,643,837 4,469,298 County Officer's Fees 5,785,694 6,355,787 6,335,079 3,218,454 Animal Regulation Fees 2,976,200 2,779,778 2,751,155 3,107,008 Fines and Forfeitures 1,553,566 1,956,199 1,760,663 2,337,136 Excess Fees - Supervisor of Elections (1) (2) 4,928,198 5,125,239 2,642, ,558 Excess Fees - Sheriff (2) 17,889,890 17,777,509 15,635,667 17,192,263 Excess Fees - Clerk & Comptroller (2) 1,929,119 1,161,931 1,415, ,167 Parking Revenue 326, , , ,503 TOTALS $ 364,501,614 $ 368,557,569 $ 379,580,292 $ 389,722,355 (1) In 2007, the Supervisor of Elections became a separate fiscal entity. (2) Excess fees represent unspent appropriations of the constitutional officers which are required by Florida Statute to be returned to the County at the end of the fiscal year. The excess fees are recorded as 'transfer-in' by the County and 'transfer-out' by the constitutional officers in the fund statements. (3) 2011 data was restated based on new information. Source: Palm Beach County, Office of Financial Management and Budget Note: Non-Ad Valorem Revenues are available revenues of the County other than ad valorem taxation on real and personal property, which are legally available for payment of debt service by the County. See Table XV Debt Coverage. 200
253 $ 49,967,579 $ 47,855,195 $ 37,429,716 $ 31,166,150 $ 30,867,264 $ 29,437,466 72,375,457 76,120,744 80,019,101 76,660,073 73,705,133 66,973,342 25,042,044 25,495,545 25,022,599 20,836,584 17,905,261 17,824,293 30,543,325 29,824,203 28,882,669 28,074,005 27,196,819 28,314,364 28,992,767 29,489,576 28,514,647 28,392,841 26,277,301 22,016,697 24,757,350 26,814,892 27,881,333 26,153,737 25,040,944 22,917,694 13,357,131 12,222,067 11,583,034 11,820,470 9,823,540 9,315,887 34,257,321 38,635,994 28,689,237 12,433,189 12,338,681 11,170,042 23,109,714 34,917,301 45,918,261 27,320,733 16,706,987 13,699,517 12,311,308 10,555,850 11,033,646 9,882,421 9,474,905 9,477,537 5,965,537 6,205,700 6,189,425 6,720,920 6,377,608 3,874,911 5,562,744 5,672,139 5,882,141 5,629,094 4,962,054 4,332,524 2,750,190 2,233,823 2,404,971 2,188,985 4,220,421 5,771,908 2,802,393 2,299,257 2,467,856 2,662,967 2,510,009 2,541,806 1,979,045 2,206,725 2,611,542 1,930,511 8,027,054 8,093,869 1,481, , ,697,452 10,290,391 3,048,686 8,762,824 8,015,401 16,216, ,679 2,785,224 11,295,945 15,255,452 10,879,034 7,472, , , , , , ,934 $ 343,670,165 $ 364,547,194 $ 359,129,133 $ 316,151,835 $ 294,624,887 $ 279,813,
254 DEBT CAPACITY INFORMATION 202
255 TABLE XI PALM BEACH COUNTY, FLORIDA Ratios of Outstanding Debt by Type Last Ten Fiscal Years September 30, 2012 (dollars in thousands, except per capita) Governmental Activities Business-Type Activites (1) Non-Ad General Valorem Total Percentage Fiscal Obligation Revenue Loans Capital Revenue Loans Primary of Personal Per Year Bonds Bonds Payable Leases Bonds Payable Government Income (2) Capita (2) 2003 $ 292,745 $ 379,275 $ 58,893 $ 155 $ 592,020 $ 9,031 $ 1,332, % $ 1, , ,170 71, ,285 1,202 1,348, , , ,471 73, ,425 39,066 1,537, , , ,660 94, ,745 7,654 1,673, , , , , , ,607, , , ,004 75, ,533 80,000 1,868, , , ,052 41, ,943 76,000 2,259, , , ,633 30, ,243 72,000 2,084, , , ,086 36, ,938-1,438,698 N/A 1, , ,276 22, ,625-1,332,815 N/A 998 Note: Details regarding the County's outstanding debt can be found in the notes to the financial statements. Information regarding personal income was not available for FY11 & FY12 (1) Beginning with fiscal year 2011, the Solid Waste Authority is no longer reported as part of the Primary Government. (2) See Table XVI for personal income and population data. 203
256 TABLE XII PALM BEACH COUNTY, FLORIDA Ratios of Net General Bonded Debt Outstanding Last Ten Fiscal Years September 30, 2012 (dollars in thousands, except per capita) Net G.O. Bonds Fiscal General Outstanding as Net Year Obligation Less Net Total Property a Percentage of G.O. Bonds Ended Bonds Restricted G.O. Bonds Assessed Total Property County Outstanding Sept. 30 Outstanding (1) Resources Outstanding Value (2) Assessed Value Population (3) Per Capita 2003 $ 292,745 $ 1,116 $ 291,629 $ 114,729, % 1,211,448 $ , , ,430, % 1,242, ,885 1, , ,876, % 1,265, ,020 7, , ,194, % 1,287, ,515 2, , ,826, % 1,295, ,410 2, , ,249, % 1,294, ,150 1, , ,643, % 1,287, , , ,555, % 1,320, ,545 1, , ,332, % 1,325, ,340 1, , ,032, % 1,335, Note: (1) See Table XI for General Obligation (G.O.) Bonds and Other Debt (2) See Table VI for Total Property Assessed Value prior year amounts have been revised based on additional information received (3) See Table XVI for County Population 204
257 TABLE XIII PALM BEACH COUNTY, FLORIDA Direct and Overlapping Governmental Activities Debt September 30, 2012 (dollars in thousands) Debt Payable from Ad Valorem Taxes Debt Payable from Non-Ad Valorem Revenues Estimated Estimated Estimated Percentage Estimated Percentage Estimated Share of Applicable Share of Applicable Share of Direct & Debt based on Property Overlapping Debt based on Overlapping Overlapping Outstanding Assessed Value Debt Outstanding Population Debt Debt Overlapping debt School District $ 30, % $ 30,650 $ 1,832, % $ 1,832,003 $ 1,862,653 South Florida Water Management District - 100% - 541, % 541, ,668 Municipalities 123,487 40% 49, ,631 54% 212, ,416 Subtotal, overlapping debt $ 154,137 80,045 $ 2,766,302 2,585,692 2,665,737 Direct debt 207, ,851 1,023,191 Total direct and overlapping debt $ 287,385 $ 3,401,543 $ 3,688,928 Note: The following 100% overlapping governments did not have debt outstanding at fiscal year end; Florida Inland Navigation District, Children's Services Council, and the Health Care District. 205
258 TABLE XIV PALM BEACH COUNTY, FLORIDA Legal Debt Margin Information September 30, 2012 The constitution of the State of Florida, Florida Statute , and Palm Beach County set no legal debt limit. 206
259 TABLE XV PALM BEACH COUNTY, FLORIDA Pledged-Revenue Coverage Last Ten Fiscal Years September 30, 2012 (dollars in thousands) Non-Ad Valorem Indebtedness (1) Water Utilities Revenue Bonds (2) Fiscal Year Non-Ad Ended Valorem Gross Debt Service Net Revenue Debt Service Sept. 30 Principal Interest Revenues Coverage Revenues Expenses Available Principal Interest Total Coverage 2003 $ 26,781 $ 21,705 $ 279, $ 87,663 $ 47,583 $ 40,080 $ 8,885 $ 2,652 $ 11, ,002 20, , ,660 51,898 40,762 9,610 1,877 11, ,827 24, , ,155 56,660 37,495 12,317 1,450 13, ,361 32, , ,324 65,524 33,800 10,745 2,898 13, ,993 32, , ,019 73,781 40,238 13,255 3,809 17, ,201 32, , ,929 81,927 40,002 13,955 8,376 22, ,496 40, , ,118 89,241 50,877 14,568 8,377 22, ,601 43, , ,156 90,889 61,267 11,053 10,517 21, ,593 41, , ,222 99,591 59,631 10,036 9,863 19, ,979 38, , , ,798 62,571 6,465 9,263 15, Note: Details regarding the County's outstanding debt can be found in the financial statements. (1) The County has covenanted and agreed that it will not issue any indebtedness or incur any indebtedness payable from or supported by a pledge of non-ad valorem revenues unless the County can show that the total amount of non-ad valorem revenues in each fiscal year in which bonds are outstanding will be greater than 2.00 times the non-self supporting debt service in each such fiscal year. (2) The calculation of gross revenues excludes connection fees and extraordinary gains and the calculation of expenses excludes interest expense, depreciation and extraordinary losses. 207
260 DEMOGRAPHIC AND ECONOMIC INFORMATION 208
261 TABLE XVI PALM BEACH COUNTY, FLORIDA Demographic and Economic Statistics Last Ten Fiscal Years September 30, 2012 Per Capita Personal Personal Civilian Unemployment Year Population Income Income Labor Force Rates ,211,448 $ 54,088,344 $ 44, , % ,242,270 60,761,948 48, , ,265,900 65,286,449 51, , ,287,987 71,720,669 55, , ,295,033 75,585,800 58, , ,294,654 76,712,607 59, , ,287,344 67,866,247 51, , * 1,320,134 69,488,201 52, , ,325,758 N/A N/A 621, ,335,415 N/A N/A 622, Source: Florida Legislature, Office of Economic and Demographic Research Florida Agency for Workforce Innovation, Labor Market Statistics Center, Local Area Unemployment Statistics Program, In cooperation with the U.S. Department of Labor, Bureau of Labor Statistics. Note: Population and income data are per calendar year. Income data is not available for 2011 and Personal Income data and Per Capita Income data is revised annually. Labor Force and Unemployment data are for September of each year. * Population data has been restated to reflect the 2010 Census. 209
262 TABLE XVII PALM BEACH COUNTY, FLORIDA Principal Employers Current Year and Nine Years Ago September 30, Percentage of Percentage of Total County Total County Employees Rank Employment Employees Rank Employment Palm Beach County School Board 21, % 18, % Palm Beach County Government 11, % 9, % Tenet Healthcare Corp 6, % 3, % NextEra Energy (Florida Power & Light) 3, % 2, % G4S (Wackenhut Corp) 3, % - - Hospital Corporation of America (HCA) (1) 2, % 4, % Florida Atlantic University 2, % - - Bethesda Memorial Hospital 2, % 1, % Office Depot 2, % - - Boca Raton Regional Hospital 2, % - - Boca Raton Resort & Club - - 2, % U.S. Sugar Corporation - - 2, % The Breakers Hotel - - 1, % Florida Crystals - - 2, % Total 57, % 47, % Source: Business Development Board of Palm Beach County Notes: (1) Formerly Columbia Palm Beach Health Care System, Inc 210
263 OPERATING INFORMATION 211
264 TABLE XVIII PALM BEACH COUNTY, FLORIDA County Government Employees by Function/Program Last Ten Fiscal Years September 30, 2012 Function/Program General government Facilities Development & Operations Planning, Zoning & Building Clerk & Comptroller (1) Property Appraiser Tax Collector Supervisor of Elections Other Public safety Fire-Rescue 1,511 1,511 1,542 1,473 1,471 1,418 1,298 1,239 1,172 1,114 Sheriff 3,924 3,919 4,011 3,848 3,812 3,615 3,502 3,322 3,210 3,115 Other Physical environment Environmental Resources Management County Cooperative Extension Service Transportation Palm Tran Engineering & Public Works Economic environment Economic Sustainability (4) Other Human services Community services Other Culture & recreation Parks & Recreation County Libraries Internal service funds Information System Services (2) Graphics (3) Fleet Management Risk Management Enterprise funds Airports Water Utilities Total 11,636 11,764 11,976 12,012 12,212 11,923 11,435 11,008 10,734 10,468 (1) amounts have been revised based on additional information received. (2) Effective beginning with FY 2010, ISS is now included in the General Fund under "General government - Other" (3) Effective beginning with FY 2009, Graphics is now included in the General Fund under "General government - Other" (4) Effective FY 2012, Housing & Community Development is now Economic Sustainability Source: Office of Financial Management and Budget 212
265 TABLE XIX PALM BEACH COUNTY, FLORIDA Operating Indicators by Function/Program Ten Fiscal Years September 30, 2012 Function/Program General government Planning, Zoning & Building Code enforcement violations 3,032 2,391 5,703 3,369 3,507 4,464 4,571 2,195 5,073 5,073 Construction plans reviewed 23,272 21,602 21,080 25,332 37,702 65,691 59,288 31,300 42,213 42,213 Permits issued 41,556 35,131 32,867 42,944 53,964 70,751 62,304 30,600 78,379 78,379 Public safety Fire-Rescue Response time 6:32 6:27 6:30 6:36 N/A 6:27 6:23 6:27 6:31 6:31 Fire responses 15,925 15,779 16,067 16,831 20,714 23,536 22,295 24,835 23,065 24,352 Medical responses 98,186 97,353 89,646 87,099 82,199 76,517 74,706 72,691 67,094 64,729 Inspections 29,114 30,073 27,013 27,044 25,475 22,281 20,079 18,630 16,936 15,632 Physical environment Environmental Resource Management Tonnage of artificial reef materials 12,800 18,400 10,000 1,650 3,150 4,900 23,484 35,900 23,300 3,000 Trees and plants planted or arranged 147, ,000 55, ,000 60,000 41,100 54, ,300 20,800 24,400 Cubic yards beach sand (thousands) 1,291 1,366 1,360 1,150 1,050 1,087 1,016 1,000 1,301 1,301 Transportation Palm Tran Passengers (millions) Engineering & Public Works Land development permits issued Lane miles of roads maintained 3,292 3,372 3,432 3,295 3,299 3,431 3,299 3,291 3,193 3,171 Lane miles resurfaced Linear feet of roadway striped (millions) Permits issued for construction of: right-of-ways, drainage and utilities Economic environment Housing & Community Development Single-family new construction Human services Enrollment - Head Start and Early Head Start 2,296 2,705 2,051 2,323 2,158 2,126 2,068 1,958 2,199 1,849 Children with disabilities Meals - Head Start (thousands) Culture & recreation Parks & Recreation Golf rounds played (thousands) County Library Circulation (millions) Cardholders (thousands) Internal service funds Information System Services %CSRs on time - Applications N/A 99% 85% 83% 82% 93% 92% 86% 85% 84% Graphics % timely delivery 99% 99% 99% 99% 99% 98% 99% 99% 99% 99% Risk Management # of employees enrolled in Health ins 4,316 4,316 4,776 5,388 5,297 4,191 4,250 3,900 3,800 3,524 # of employees enrolled in Dental ins 3,830 3,841 3,643 3,295 3,298 3,122 3,125 3,100 2,893 2,893 Enterprise funds Water Utilities Average water dwelling units served (thousands) Average wastewater treated per day (millions of gallons) Airports Total passengers (millions) Operating expense per passenger (prior years restated) $7.19 $7.51 $7.78 $6.74 $5.84 $5.84 $5.41 $5.59 $5.81 $5.98 Operating revenue per passenger (prior years restated) $11.38 $10.83 $10.79 $9.72 $9.43 $9.44 $8.73 $8.23 $8.08 $8.26 N/A = Not available Sources: Office of Financial Management and Budget Department of Airports Note: 2012 data is not yet available. 213
266 TABLE XX PALM BEACH COUNTY, FLORIDA Capital Asset Statistics by Function/Program Last Ten Fiscal Years September 30, 2012 Function/Program Public safety Fire Rescue Fire Stations Transportation Palm Tran Buses Engineering & Public Works County Roads (mileage) 1,282 1,282 1,282 1,288 1,285 1,297 1,294 1,295 1,295 1,361 Traffic Lights 1,192 1,200 1,192 1,289 1,150 1,160 1,120 1,095 1,104 1,045 Culture & recreation Parks & Recreation Developed acres 5,701 5,713 5,702 5,074 5,067 5,134 4,817 4,195 3,798 3,786 Enterprise funds Water Utilities Water mains (miles) 2,152 2,141 2,121 2,126 2,162 2,081 2,064 1,880 1,784 1,666 Storage and repump stations Fire hydrants 16,582 16,353 16,235 16,066 15,866 15,630 14,834 13,396 12,517 12,013 Sewers (miles) 1,165 1,157 1,152 1,145 1,142 1,132 1, Pump stations Source: Office of Financial Management and Budget 214
267

268 Sharon R. Bock Clerk & Comptroller Palm Beach County
C omprehensive Annual. inancial Report. Fiscal Year Ended September 30, 2016 Palm Beach County, Florida
 C omprehensive Annual F inancial Report Fiscal Year Ended September 30, 2016 Palm Beach County, Florida Prepared by the Clerk & Comptroller, Palm Beach County About the Clerk & Comptroller s Office As
Palm Beach County, Florida. Single Audit Report September 30, 2014
 Palm Beach County, Florida Single Audit Report September 30, 2014 SINGLE AUDIT REPORT Fiscal Year Ended September 30, 2014 TABLE OF CONTENTS PAGE Report of Independent Certified Public Accountants... i
PALM BEACH COUNTY, FLORIDA COMPREHENSIVE ANNUAL FINANCIAL REPORT FISCAL YEAR ENDED SEPTEMBER 30, 2004
 COMPREHENSIVE ANNUAL FINANCIAL REPORT FISCAL YEAR ENDED SEPTEMBER 30, 2004 Prepared by: DEPARTMENT OF FINANCE SHARON R. BOCK Clerk & Comptroller Palm Beach County COMPREHENSIVE ANNUAL FINANCIAL REPORT
Palm Beach County, Florida
 Palm Beach County, Florida Comprehensive Annual Financial Report Fiscal Year Ended September 30, 2005 PREPARED BY THE CLERK & COMPTROLLER S OFFICE, PALM BEACH COUNTY About the Clerk & Comptroller s Office
Comprehensive Annual Financial Report
 Comprehensive Annual Financial Report Palm Beach County, Florida Fiscal Year Ended September 30, 2006 Prepared by the Clerk & Comptroller s office, Palm Beach County About the Clerk & Comptroller s Office
COMPREHENSIVE ANNUAL FINANCIAL REPORT CITY OF ORMOND BEACH, FLORIDA FISCAL YEAR ENDED SEPTEMBER 30, 2018
 City of Ormond Beach Florida Photo by Sam West Comprehensive Annual Financial Report Fiscal Year Ended September 30, 2018 COMPREHENSIVE ANNUAL FINANCIAL REPORT FISCAL YEAR ENDED Prepared by: Finance Department
INDEPENDENT AUDITORS' REPORT
 FINANCIAL SECTION This section contains the following subsections: INDEPENDENT AUDITORS REPORT MANAGEMENT S DISCUSSION AND ANALYSIS BASIC FINANCIAL STATEMENTS REQUIRED SUPPLEMENTARY INFORMATION OTHER SUPPLEMENTARY
Marion County Comprehensive Annual Financial Report
 Marion County F L O R I DA 2006 Comprehensive Annual Financial Report Fiscal Year Ended September 30, 2006 MARION COUNTY, FLORIDA COMPREHENSIVE ANNUAL FINANCIAL REPORT For the Year Ended September 30,
Calhoun County, Florida
 Financial Statements September 30, 2014 CALHOUN COUNTY, FLORIDA FINANCIAL STATEMENTS September 30, 2014 BOARD OF COUNTY COMMISSIONERS Marion L. Brown District 1 Darrell McDougald District 2 Lee Shelton
CITY OF NEDERLAND, TEXAS. Comprehensive Annual Financial Report
 Comprehensive Annual Financial Report For the Year Ended September 30, 2014 Prepared by the Finance Department INTRODUCTORY SECTION Comprehensive Annual Financial Report September 30, 2014 Table of Contents
TUNICA COUNTY, MISSISSIPPI AUDITED FINANCIAL STATEMENTS AND SPECIAL REPORTS FOR THE YEAR ENDED SEPTEMBER 30, 2008
 AUDITED FINANCIAL STATEMENTS AND SPECIAL REPORTS FOR THE YEAR ENDED SEPTEMBER 30, 2008 ANNUAL FINANCIAL REPORT Year Ended September 30, 2008 TABLE OF CONTENTS Independent Auditor s Report....1 Management
MADISON COUNTY, FLORIDA ANNUAL FINANCIAL REPORT SEPTEMBER 30, 2017
 MADISON COUNTY, FLORIDA ANNUAL FINANCIAL REPORT SEPTEMBER 30, 2017 MADISON COUNTY, FLORIDA THIS REPORT CONTAINS THE FOLLOWING SECTIONS Madison County, Florida (Government-Wide) Basic Financial Statements,
Marion County, Florida
 Marion County, Florida Comprehensive Annual Financial Report Fiscal Year Ended September 30, 2015 COMPREHENSIVE ANNUAL FINANCIAL REPORT For the Fiscal Year Ended September 30, 2015 Prepared by: Finance
CITY OF LAKE ELMO, MINNESOTA COMPREHENSIVE ANNUAL FINANCIAL REPORT FOR THE FISCAL YEAR ENDED DECEMBER 31, 2017
 COMPREHENSIVE ANNUAL FINANCIAL REPORT FOR THE FISCAL YEAR ENDED DECEMBER 31, 2017 PREPARED BY: FINANCE DEPARTMENT CITY OF LAKE ELMO, MINNESOTA FINANCIAL STATEMENTS For the Fiscal Year Ended December 31,
BAKER COUNTY, FLORIDA FINANCIAL STATEMENTS AND INDEPENDENT AUDITORS REPORT FISCAL YEAR ENDED SEPTEMBER 30, 2017
 BAKER COUNTY, FLORIDA FINANCIAL STATEMENTS AND INDEPENDENT AUDITORS REPORT FISCAL YEAR ENDED SEPTEMBER 30, 2017 BAKER COUNTY, FLORIDA TABLE OF CONTENTS SEPTEMBER 30, 2017 Independent Auditors Report Management
NASSAU COUNTY, FLORIDA
 NASSAU COUNTY, FLORIDA COMPREHENSIVE ANNUAL FINANCIAL REPORT FOR THE FISCAL YEAR ENDED SEPTEMBER 30, 2017 PREPARED BY: John A. Crawford CLERK OF THE CIRCUIT COURT/COMPTROLLER Table of Contents INTRODUCTORY
SALEM CITY CORPORATION FINANCIAL STATEMENTS
 FINANCIAL STATEMENTS FOR THE YEAR ENDED JUNE 30, 2017 Allred Jackson, PC 50 East 2500 North, Suite 200 North Logan, UT 84341 (P) 435.752.6441 (F) 435.752.6451 www.allredjackson.com ii Table of Contents
SALEM CITY CORPORATION FINANCIAL STATEMENTS
 FINANCIAL STATEMENTS FOR THE YEAR ENDED JUNE 30, 2016 ii Table of Contents Introductory Section Page Letter of transmittal... 3 Financial Section Independent Auditors Report... 7 Management Discussion
TOWNS COUNTY, GEORGIA HIAWASSEE, GEORGIA FINANCIAL STATEMENTS WITH SUPPLEMENTAL MATERIAL FOR THE YEAR ENDED
 HIAWASSEE, GEORGIA FINANCIAL STATEMENTS WITH SUPPLEMENTAL MATERIAL FOR THE YEAR ENDED DECEMBER 31, 2016 FINANCIAL STATEMENTS For the Year Ended December 31, 2016 PAGE INDEPENDENT AUDITOR'S REPORT 1-2 MANAGEMENT'S
City of Ann Arbor, Michigan Comprehensive Annual Financial Report
 City of Ann Arbor, Michigan Comprehensive Annual Financial Report Fiscal Year Ended June 30, 2006 COMPREHENSIVE ANNUAL FINANCIAL REPORT County of Washtenaw State of Michigan Fiscal Year Ended June 30,
Palm Beach County, FL Fiscal Year 2017 Budget in Brief
 Palm Beach County, FL Fiscal Year 2017 Budget in Brief Board of County Commissioners: Top row from left to right: Mack Bernard (District 7), Steven L. Abrams (District 4), Hal R. Valeche (District 1),
CITY OF COLEMAN, FLORIDA. Annual Financial Report. September 30, (With Independent Auditors' Report Thereon)
") Annual Financial Report September 30, 2018 (With Independent Auditors' Report Thereon) INTRODUCTORY SECTION This section contains the following subsections: List of City Council and Principal City Officials
Annual Financial Report September 30, 2018 (With Independent Auditors' Report Thereon) INTRODUCTORY SECTION This section contains the following subsections: List of City Council and Principal City Officials
CITY OF LAKE ELMO, MINNESOTA COMPREHENSIVE ANNUAL FINANCIAL REPORT FOR THE FISCAL YEAR ENDED DECEMBER 31, 2016
 COMPREHENSIVE ANNUAL FINANCIAL REPORT FOR THE FISCAL YEAR ENDED DECEMBER 31, 2016 PREPARED BY: FINANCE DEPARTMENT CITY OF LAKE ELMO, MINNESOTA FINANCIAL STATEMENTS For the Fiscal Year Ended December 31,
CITY OF ATWATER, CALIFORNIA ANNUAL FINANCIAL REPORT FOR THE FISCAL YEAR ENDED JUNE 30, 2016
 CITY OF ATWATER, CALIFORNIA ANNUAL FINANCIAL REPORT FOR THE FISCAL YEAR ENDED JUNE 30, 2016 Prepared by: Finance Department This page intentionally left blank. Basic Financial Statements Table of Contents
SALEM CITY CORPORATION FINANCIAL STATEMENTS
 FINANCIAL STATEMENTS FOR THE YEAR ENDED JUNE 30, 2014 TABLE OF CONTENTS Introductory Section: Page Letter of transmittal 3 Financial Section: Independent Auditors Report 7 Management Discussion and Analysis
LEVY COUNTY, FLORIDA AUDIT REPORT SEPTEMBER 30, 2012
 LEVY COUNTY, FLORIDA AUDIT REPORT SEPTEMBER 30, 2012 Levy County, Florida Audit Report September 30, 2012 Table of Contents Page INDEPENDENT AUDITOR S REPORT... i MANAGEMENT S DISCUSSION AND ANALYSIS...
CITY OF ROSEBUD, TEXAS FINANCIAL STATEMENTS AS OF
 FINANCIAL STATEMENTS AS OF SEPTEMBER 30, 2013 TOGETHER WITH INDEPENDENT AUDITORS REPORT THEREON AND SUPPLEMENTARY INFORMATION Prepared by: Donald L. Allman, CPA Certified Public Accountant 205 E. University
HARRISON COUNTY, MISSISSIPPI Audited Financial Statements and Special Reports For the Year Ended September 30, 2014
 Audited Financial Statements and Special Reports TABLE OF CONTENTS FINANCIAL SECTION 1 INDEPENDENT AUDITOR'S REPORT 2 MANAGEMENT'S DISCUSSION AND ANALYSIS 5 FINANCIAL STATEMENTS 13 Statement of Net Position
Marion County. Comprehensive Annual Financial Report
 Marion County F L O R I D A Comprehensive Annual Financial Report F I S C A L Y E A R E N D E D S E P T E M B E R 3 0, 2 0 0 4 MARION COUNTY, FLORIDA COMPREHENSIVE ANNUAL FINANCIAL REPORT For the Year
Palm Beach County, FL Budget in Brief Fiscal Year 2019
 Palm Beach County, FL Budget in Brief Fiscal Year 2019 Board of County Commissioners: Top row from left to right: Robert S. Weinroth (District 4), Hal R. Valeche (District 1), Mary Lou Berger (District
City of Ocoee, Florida COMPREHENSIVE ANNUAL FINANCIAL REPORT. For The Year Ended September 30, 2016
 City of Ocoee, Florida COMPREHENSIVE ANNUAL FINANCIAL REPORT For The Year Ended September 30, 2016 Prepared by: City of Ocoee Finance Department This page intentionally left blank. INTRODUCTORY SECTION
City of Bentonville, Arkansas
 Comprehensive Annual Financial Report For the Year Ended December 31, 2016 Prepared by: Denise Land Finance Director Jake Harper Assistant Finance Director Visit our web site at: www.bentonvillear.com
February 28, Hernando County Board of County Commissioners 20 N. Main Street Brooksville, Florida Ladies and Gentlemen:
 February 28, 2002 Hernando County Board of County Commissioners 20 N. Main Street Brooksville, Florida 34601 Ladies and Gentlemen: The Comprehensive Annual Financial Report of Hernando County, Florida,
CITY OF PAHOKEE, FLORIDA FINANCIAL STATEMENTS WITH INDEPENDENT AUDITOR S REPORT THEREON
 FINANCIAL STATEMENTS WITH INDEPENDENT AUDITOR S REPORT THEREON FISCAL YEAR ENDED SEPTEMBER 30, 2014 FINANCIAL STATEMENTS SEPTEMBER 30, 2014 TABLE OF CONTENTS Pages FINANCIAL SECTION Independent Auditor
CITY OF DEERFIELD BEACH, FLORIDA
 COMPREHENSIVE ANNUAL FINANCIAL REPORT FOR THE FISCAL YEAR ENDED SEPTEMBER 30, 2014 Prepared by the Department of Financial Services Director of Finance, Hugh B. Dunkley Assistant Director of Finance, Sophia
Levy County, Florida. Audit Report. September 30, 2013
 Levy County, Florida Audit Report September 30, 2013 Levy County, Florida Table of Contents September 30, 2013 Page Independent Auditor s Report i Management s Discussion and Analysis iii Basic Financial
CITY OF UNIVERSITY CITY, MISSOURI COMPREHENSIVE ANNUAL FINANCIAL REPORT FOR THE FISCAL YEAR ENDED JUNE 30, 2017
 COMPREHENSIVE ANNUAL FINANCIAL REPORT FOR THE FISCAL YEAR ENDED JUNE 30, 2017 Report prepared and submitted by the Department Of Finance Tina Charumilind Director of Finance Contents Section I - Introductory
COMPREHENSIVE ANNUAL FINANCIAL REPORT. City of Lucas, Texas
 COMPREHENSIVE ANNUAL FINANCIAL REPORT City of Lucas, Texas Home-Rule, Council-Manager Form of Government Interim City Manager Dan Savage Finance Manager Elizabeth Exum COMPREHENSIVE ANNUAL FINANCIAL REPORT
Clay County, Florida. County Audit Report September 30, 2014
 Clay County, Florida County Audit Report September 30, 2014 Clay County, Florida County Audit Report September 30, 2014 Table of Contents Section Financial Report 1 County-Wide 3 Clerk of the Circuit Court
City of Healdsburg. Comprehensive Annual Financial Report Year Ended June 30, Healdsburg Ridge.
 City of Healdsburg California Healdsburg Ridge Comprehensive Annual Financial Report Year Ended June 30, 2011 www.cityofhealdsburg.org CITY OF HEALDSBURG ADMINISTRATION 401 Grove Street Healdsburg,
COMPREHENSIVE ANNUAL FINANCIAL REPORT CITY OF ST. PETE BEACH, FLORIDA FOR THE FISCAL YEAR ENDED SEPTEMBER 30, 2016
 COMPREHENSIVE ANNUAL FINANCIAL REPORT CITY OF ST. PETE BEACH, FLORIDA FOR THE FISCAL YEAR ENDED SEPTEMBER 30, 2016 Prepared by: Finance Department Table of Contents Introductory Section Table of Contents...
RIVIERA BEACH COMMUNITY REDEVELOPMENT AGENCY (A Component Unit of the City of Riviera Beach, Florida)
") RIVIERA BEACH COMMUNITY REDEVELOPMENT AGENCY Audited Financial Statements Fiscal year ended September 30, 2017 HCT Certified Public Accountants & Consultants, LLC 3816 Hollywood Boulevard, Suite 203 Hollywood,
RIVIERA BEACH COMMUNITY REDEVELOPMENT AGENCY Audited Financial Statements Fiscal year ended September 30, 2017 HCT Certified Public Accountants & Consultants, LLC 3816 Hollywood Boulevard, Suite 203 Hollywood,
YEO & YEO CPAs & BUSINESS CONSULTANTS
 , Michigan Comprehensive Annual Financial Report For the Year Ended June 30, 2017 YEO & YEO CPAs & BUSINESS CONSULTANTS Comprehensive Annual Financial Report County of Washtenaw State of Michigan Fiscal
Celebrating 25 Years of Excellence
 Celebrating 25 Years of Excellence Comprehensive Annual Financial Report Fiscal Year Ended June 30, 2017 Chino Hills, California , CALIFORNIA COMPREHENSIVE ANNUAL FINANCIAL REPORT FISCAL YEAR ENDED JUNE
VILLAGE OF KEY BISCAYNE, FLORIDA
 COMPREHENSIVE ANNUAL FINANCIAL REPORT FOR THE FISCAL YEAR ENDED SEPTEMBER 30, 2012 Prepared by: THE FINANCE DEPARTMENT COMPREHENSIVE ANNUAL FINANCIAL REPORT FOR THE FISCAL YEAR ENDED SEPTEMBER 30, 2012
Multnomah County Library District A Component Unit of Multnomah County, Oregon. Financial Statements and Reports of Independent Auditors
 Multnomah County Library District A Component Unit of Multnomah County, Oregon Financial Statements and Reports of Independent Auditors For the Fiscal Year Ended June 30, 2017 Prepared by: Department of
PUTNAM COUNTY FLORIDA
 PUTNAM COUNTY FLORIDA COMPREHENSIVE ANNUAL FINANCIAL REPORT FISCAL YEAR ENDED SEPTEMBER 30, 2011 Introductory Section STATE OF FLORIDA COUNTY OF PUTNAM COUNTY COMPREHENSIVE ANNUAL FINANCIAL REPORT FOR
MADISON COUNTY, FLORIDA ANNUAL FINANCIAL REPORT SEPTEMBER 30, 2015
 MADISON COUNTY, FLORIDA ANNUAL FINANCIAL REPORT SEPTEMBER 30, 2015 MADISON COUNTY, FLORIDA THIS REPORT CONTAINS THE FOLLOWING SECTIONS Madison County, Florida (Government-Wide) Basic Financial Statements,
CITY OF FORNEY, TEXAS
 CITY OF FORNEY, TEXAS COMPREHENSIVE ANNUAL FINANCIAL REPORT FISCAL YEAR ENDED SEPTEMBER 30, 2014 CITY MANAGER BRIAN BROOKS DIRECTOR OF ADMINISTRATIVE SERVICES LEIGH CORSON CITY OF FORNEY, TEXAS COMPREHENSIVE
COMPREHENSIVE ANNUAL FINANCIAL REPORT EST. 1872
 COMPREHENSIVE ANNUAL FINANCIAL REPORT ENNIS TEXAS EST. 1872 City of Ennis, Texas Fiscal Year Ended September 30, 2013 COMPREHENSIVE ANNUAL FINANCIAL REPORT Year Ended September 30, 2013 Issued By Department
Checks. alances. Prepared by the Clerk & Comptroller for the Fiscal Year Ended September 30, 2016
 Checks B alances & Your Guide to County Finances Palm Beach County, Florida Prepared by the Clerk & Comptroller for the Fiscal Year Ended September 30, 2016 Message from Clerk Bock Dear Residents, As your
COMPREHENSIVE ANNUAL FINANCIAL REPORT
 2015 COMPREHENSIVE ANNUAL FINANCIAL REPORT SARASOTA COUNTY, FLORIDA YEAR ENDED SEPTEMBER 30, 2015 COMPREHENSIVE ANNUAL FINANCIAL REPORT FOR FISCAL YEAR ENDED SEPTEMBER 30, 2015 SARASOTA COUNTY SARASOTA,
VILLAGE OF EL PORTAL, FLORIDA BASIC FINANCIAL STATEMENTS FOR THE FISCAL YEAR ENDED SEPTEMBER 30, 2016
 ` VILLAGE OF EL PORTAL, FLORIDA BASIC FINANCIAL STATEMENTS FOR THE FISCAL YEAR ENDED TABLE OF CONTENTS INDEPENDENT AUDITORS REPORT 1-2 PAGE MANAGEMENT S DISCUSSION AND ANALYSIS (Unaudited) 3-11 BASIC FINANCIAL
City of Sioux Center, Iowa
 City of Sioux Center, Iowa Annual Financial Report for the fiscal year ended June 30, 2011 Prepared by: Finance Department Darryl Ten Pas, Finance Director CITY OF SIOUX CENTER, IOWA TABLE OF CONTENTS
VILLAGE OF PALMETTO BAY, FLORIDA TABLE OF CONTENTS
 VILLAGE OF PALMETTO BAY, FLORIDA TABLE OF CONTENTS INTRODUCTORY SECTION Letter of Transmittal... i - iv Elected and Appointed Officials... v Organization Chart... vi Certificate of Achievement for Excellence
VILLAGE OF PALMETTO BAY VILLAGE OF PARKS
 VILLAGE OF PALMETTO BAY VILLAGE OF PARKS COMPREHENSIVE ANNUAL FINANCIAL REPORT FOR THE FISCAL YEAR ENDED SEPTEMBER 30, 2013 VILLAGE OF PALMETTO BAY, FLORIDA TABLE OF CONTENTS INTRODUCTORY SECTION Letter
HEBER-OVERGAARD UNIFIED SCHOOL DISTRICT NO. 6
 HEBER-OVERGAARD UNIFIED SCHOOL DISTRICT NO. 6 Comprehensive Annual Financial Report Fiscal Year Ended June 30, 2012 3375 Buckskin Canyon Road P.O. Box 547 Heber, Arizona 85928 HEBER, ARIZONA COMPREHENSIVE
BUCKEYE ELEMENTARY SCHOOL DISTRICT NO. 33
 BUCKEYE ELEMENTARY SCHOOL DISTRICT NO. 33 Comprehensive Annual Financial Report Fiscal Year Ended June 30, 2016 25555 West Durango Street Buckeye, Arizona 85326 BUCKEYE, ARIZONA COMPREHENSIVE ANNUAL FINANCIAL
TOWN OF SOUTH PALM BEACH, FLORIDA
 COMPREHENSIVE ANNUAL FINANCIAL REPORT FISCAL YEAR ENDED SEPTEMBER 30, 2009 PREPARED BY FINANCE DEPARTMENT TABLE OF CONTENTS Introductory Section Letter of Transmittal... i-iv Organizational Chart...v Certificate
COMPREHENSIVE ANNUAL FINANCIAL REPORT OF THE CHILDREN S SERVICES COUNCIL OF PALM BEACH COUNTY, FLORIDA
 COMPREHENSIVE ANNUAL FINANCIAL REPORT OF THE CHILDREN S SERVICES COUNCIL OF PALM BEACH COUNTY, FLORIDA FOR THE YEAR ENDED SEPTEMBER 30, 2013 Issued By: Gaetana D. Ebbole, Chief Executive Officer Prepared
River Forest Public Library River Forest, Illinois Comprehensive Annual Financial Report For the Year Ended April 30, 2016
 River Forest, Illinois Comprehensive Annual Financial Report For the Year Ended April 30, 2016 Submitted by: Susan Quinn Library Director Table of Contents For the Year Ended April 30, 2016 PART I - INTRODUCTORY
City of Lauderdale Lakes, Florida
 Comprehensive Annual Financial Report For The Year Ended September 30, 2015 Prepared By: City of Lauderdale Lakes, Florida Financial Services Department TABLE OF CONTENTS For the Year Ended September
CITY OF CARSON CITY, MICHIGAN
 , MICHIGAN FINANCIAL STATEMENTS Vredeveld Haefner LLC CPAs and Consultants TABLE OF CONTENTS FINANCIAL SECTION PAGE Independent Auditors Report 1-2 Management s Discussion and Analysis 3-8 Basic Financial
CITY OF BROCKTON, MASSACHUSETTS. Basic Financial Statements, Required Supplementary Information and Additional Information.
 Basic Financial Statements, Required Supplementary Information and Additional Information (With Independent Auditors Report Thereon) Table of Contents Page(s) Independent Auditors Report 1 3 Management
TOWN OF NEW SHOREHAM, RHODE ISLAND FINANCIAL STATEMENTS YEAR ENDED JUNE 30, 2015
 FINANCIAL STATEMENTS YEAR ENDED JUNE 30, 2015 Hague, Sahady & Co., Certified Public Accountants P.C. Committed to Excellence Table of Contents Independent Auditors' Report... 1 Management s Discussion
PARK COUNTY CODY, WYOMING
 CODY, WYOMING Basic Financial Statements June 30, 2017 (With Independent Auditors Report Thereon) TABLE OF CONTENTS INDEPENDENT AUDITORS REPORT... 1-3 BASIC FINANCIAL STATEMENTS: Government-Wide Financial
CITY OF FRIENDSWOOD, TEXAS
 COMPREHENSIVE ANNUAL FINANCIAL REPORT YEAR ENDED SEPTEMBER 30, 2011 Officials Issuing Report: Roger C. Roecker City Manager Cindy S. Edge Director of Administrative Services COMPREHENSIVE ANNUAL FINANCIAL
Town of Wellington, Colorado. Financial Statements and Supplementary Information For the Year Ended December 31, 2017
 , Colorado Financial Statements and Supplementary Information For the Year Ended December 31, 2017 < Contents Independent Auditor s Report 1-2 Management s Discussion and Analysis 3-15 Basic Financial
HENDRY COUNTY, FLORIDA
 HENDRY COUNTY, FLORIDA ANNUAL FINANCIAL REPORT FOR THE FISCAL YEAR ENDED SEPTEMBER 30, 2015 PREPARED BY: BARBARA S. BUTLER CLERK OF THE CIRCUIT COURT STEVE CLARK FINANCE DIRECTOR TABLE OF CONTENTS SECTION
TOWN OF NEW SHOREHAM, RHODE ISLAND FINANCIAL STATEMENTS YEAR ENDED JUNE 30, 2016
 FINANCIAL STATEMENTS YEAR ENDED JUNE 30, 2016 Hague, Sahady & Co., Certified Public Accountants P.C. Committed to Excellence Table of Contents Independent Auditors' Report... 1 Management s Discussion
SUMTER COUNTY, FLORIDA
 SUMTER COUNTY, FLORIDA Comprehensive Annual Financial Report For the Fiscal Year Ended September 30, 2017 Prepared in the office of the Honorable Gloria R. Hayward Clerk of the Circuit Court Finance Department
CITY OF MINNETRISTA, MINNESOTA COMPREHENSIVE ANNUAL FINANCIAL REPORT YEAR ENDED DECEMBER 31, 2013
 , MINNESOTA COMPREHENSIVE ANNUAL FINANCIAL REPORT YEAR ENDED DECEMBER 31, 2013 PREPARED BY THE FINANCE DEPARTMENT OF THE CITY OF MINNETRISTA, MINNESOTA BRIAN GRIMM DIRECTOR OF FINANCE TABLE OF CONTENTS
CITY OF HASTINGS, NEBRASKA FINANCIAL REPORT SEPTEMBER 30, 2014
 FINANCIAL REPORT SEPTEMBER 30, 2014 CONTENTS Page INDEPENDENT AUDITOR'S REPORT 1-3 Management's Discussion and Analysis 4-8 FINANCIAL STATEMENTS Statement of Net Position 9 Statement of Activities 10-11
City of Murphy, Texas
 Comprehensive Annual Financial Report Fiscal Year Ended September 30, 2018 Prepared by: Finance Department This Page Left Intentionally Blank Comprehensive Annual Financial Report For the Fiscal Year Ended
TOWN OF SOUTH PALM BEACH, FLORIDA
 COMPREHENSIVE ANNUAL FINANCIAL REPORT FISCAL YEAR ENDED SEPTEMBER 30, 2010 COMPREHENSIVE ANNUAL FINANCIAL REPORT FISCAL YEAR ENDED SEPTEMBER 30, 2010 PREPARED BY FINANCE DEPARTMENT TABLE OF CONTENTS Introductory
COUNTY OF CALDWELL NORTH CAROLINA
 COUNTY OF CALDWELL NORTH CAROLINA COMPREHENSIVE ANNUAL FINANCIAL REPORT FOR THE YEAR ENDED JUNE 30, 2013 Comprehensive Annual Financial Report For the Year Ended June 30, 2013 Prepared by Finance Department
CITY OF HIALEAH, FLORIDA COMPREHENSIVE ANNUAL FINANCIAL REPORT FISCAL YEAR ENDED SEPTEMBER 30, 2017
 COMPREHENSIVE ANNUAL FINANCIAL REPORT FISCAL YEAR ENDED SEPTEMBER 30, 2017 Prepared by: Finance Department TABLE OF CONTENTS PAGE I. INTRODUCTORY SECTION (UNAUDITED) Letter of Transmittal i-iv Certificate
VILLAGE OF GOLF, FLORIDA COMPREHENSIVE ANNUAL FINANCIAL REPORT FOR THE FISCAL YEAR ENDED SEPTEMBER 30, 2014
 VILLAGE OF GOLF, FLORIDA COMPREHENSIVE ANNUAL FINANCIAL REPORT FOR THE FISCAL YEAR ENDED SEPTEMBER 30, 2014 Prepared by: Finance Department VILLAGE OF GOLF, FLORIDA TABLE OF CONTENTS INTRODUCTORY SECTION
SPRINGVILLE CITY CORPORATION. Financial Statements and Independent Auditors Report. Year Ended June 30, 2017
 Financial Statements and Independent Auditors Report Year Ended June 30, 2017 Financial Statements and Independent Auditors Report Year Ended June 30, 2017 Table of Contents Page FINANCIAL SECTION Report
CITY OF SOUTH PASADENA, FLORIDA
 CITY OF SOUTH PASADENA, FLORIDA Comprehensive Annual Financial Report For The Year Ended September 30, 2016 CITY OF SOUTH PASADENA, FLORIDA Comprehensive Annual Financial Report For The Year Ended September
Comprehensive Annual Financial Report. Fiscal Year Ended June 30, 2017
 Comprehensive Annual Financial Report Fiscal Year Ended June 30, 2017 CITY OF COVINGTON, GEORGIA COMPREHENSIVE ANNUAL FINANCIAL REPORT FOR THE FISCAL YEAR ENDED JUNE 30, 2017 Prepared by: Randy Smith,
Oconee County, Georgia Financial Statements For the Fiscal Year Ended June 30, 2017
 Oconee County, Georgia Financial Statements For the Fiscal Year Ended June 30, 2017 Financial Section: Independent Auditor's Report Management's Discussion and Analysis Oconee County, Georgia Financial
IRON RIVER TOWNSHIP. Financial Report With Supplemental Information Prepared in Accordance with GASB 34 MARCH 31, 2016
 Financial Report With Supplemental Information Prepared in Accordance with GASB 34 1 TABLE OF CONTENTS INDEPENDENT AUDITOR'S REPORT... 4 MANAGEMENT S DISCUSSION AND ANALYSIS... 8 BASIC FINANCIAL STATEMENTS...
VILLAGE OF TEQUESTA, FLORIDA 2017 COMPREHENSIVE ANNUAL FINANCIAL REPORT
 2017 COMPREHENSIVE ANNUAL FINANCIAL REPORT FISCAL YEAR ENDED SEPTEMBER 30, 2017 VILLAGE OF TEQUESTA COUNCIL MEMBERS 2017 From left to right: Council Member Thomas Paterno, Council Member Vince Arena, Mayor
CLERK OF THE CIRCUIT COURT MONROE COUNTY BRANCH OFFICE
 BRANCH OFFICE MARATHON SUB COURTHOUSE 3117 OVERSEAS lllghway MARATHON, FLORlDA 33050 TEL. (305) 289-6027 FAX (305) 289-1745 CLERK OF THE CIRCUIT COURT MONROE COUNTY BRANCH OFFICE MONROE COUNTY COURTHOUSE
ST. CLAIR COUNTY, MICHIGAN
 TABLE OF CONTENTS DECEMBER 31, 2005 Page Number SECTION ONE: INTRODUCTORY SECTION Letter of Transmittal I-1 List of Elected and Appointed Officials I-9 GFOA Certificate of Achievement I-10 Organizational
VILLAGE OF PALMETTO BAY, FLORIDA COMPREHENSIVE ANNUAL FINANCIAL REPORT FOR THE FISCAL YEAR ENDED SEPTEMBER 30, 2015
 VILLAGE OF PALMETTO BAY, FLORIDA COMPREHENSIVE ANNUAL FINANCIAL REPORT FOR THE FISCAL YEAR ENDED SEPTEMBER 30, 2015 VILLAGE OF PALMETTO BAY, FLORIDA TABLE OF CONTENTS INTRODUCTORY SECTION (Unaudited) Letter
TOWN OF BANNER ELK NORTH CAROLINA
 TOWN OF BANNER ELK NORTH CAROLINA AUDITED FINANCIAL STATEMENTS TOWN COUNCIL MEMBERS Gail Draughon Herbert Bud Hahn Brenda Lyerly Robert Tufts TOWN MANAGER Rick Owen TOWN CLERK AND FINANCE OFFICER Steven
CITY OF WOODWARD, OKLAHOMA WOODWARD, OKLAHOMA
 WOODWARD, OKLAHOMA ANNUAL FINANCIAL STATEMENTS AND ACCOMPANYING INDEPENDENT AUDITOR'S REPORT FOR THE YEAR ENDED JUNE 30, 2017 The City of Woodward, Oklahoma Table of Contents Year Ended June 30, 2017 INDEPENDENT
CITY OF PALM BEACH GARDENS, FLORIDA
 The City of Palm Beach Gardens, Florida Comprehensive Annual Financial Report For Fiscal Year Ended September 30, 2017 COMPREHENSIVE ANNUAL FINANCIAL REPORT FOR THE FISCAL YEAR ENDED SEPTEMBER 30, 2017
BEDFORD TOWNSHIP Monroe County, Michigan
 BEDFORD TOWNSHIP Monroe County, Michigan FINANCIAL STATEMENTS For The Year Ended June 30, 2016 BEDFORD TOWNSHIP Monroe County, Michigan FINANCIAL STATEMENTS FOR THE YEAR ENDED JUNE 30, 2016 Bedford Township
CHARTER TOWNSHIP OF YPSILANTI Washtenaw County, Michigan AUDITED FINANCIAL REPORT. For the Fiscal Year Ended December 31, 2014
 Washtenaw County, Michigan AUDITED FINANCIAL REPORT For the Fiscal Year Ended December 31, 2014 PSLZ LLP Certified Public Accountants For the Year Ended December 31, 2014 Table of Contents INTRODUCTORY
Comprehensive Annual Financial Report
 Comprehensive Annual Financial Report Cambrian Commons, Rosemount - Built in 2016 For the Year Ended June 30, 2016 Dakota County Community Development Agency A component unit of Dakota County, Minnesota
CITY OF OAK GROVE, KENTUCKY. Financial Statements and Supplementary Information. For the Year Ended June 30, 2018
 Financial Statements and Supplementary Information For the Year Ended June 30, 2018 Table of Contents Independent Auditor s Report 1-2 Management s Discussion and Analysis 3-8 Basic Financial Statements:
WILMINGTON PUBLIC LIBRARY DISTRICT Wilmington, Illinois Annual Financial Report For the Fiscal Year Ended June 30, 2014
 Wilmington, Illinois Annual Financial Report For the Fiscal Year Ended June 30, 2014 Table of Contents Page Financial Section Independent Auditor s Report 1-3 Management s Discussion and Analysis (unaudited)
VILLAGE OF HARWOOD HEIGHTS, ILLINOIS COMPREHENSIVE ANNUAL FINANCIAL REPORT. For the Year Ended April 30, 2006
 COMPREHENSIVE ANNUAL FINANCIAL REPORT For the Year Ended April 30, 2006 Prepared by: Finance Department TABLE OF CONTENTS Page(s) INTRODUCTORY SECTION Principal Officials... Organizational Chart... Letter
CITY OF EAST GRAND RAPIDS, MICHIGAN FINANCIAL STATEMENTS FOR THE YEAR ENDED JUNE
 , MICHIGAN FINANCIAL STATEMENTS Vredeveld Haefner LLC TABLE OF CONTENTS FINANCIAL SECTION PAGE Independent Auditors Report 1-2 Management s Discussion and Analysis 3-8 Basic Financial Statements Government-wide
CITY OF CAMPBELLSBURG, KENTUCKY
 FINANCIAL STATEMENTS AND SUPPLEMENTARY INFORMATION TABLE OF CONTENTS Report of Independent Auditors... 1 Management Discussion and Analysis... 4 Basic Financial Statements Page Statement of Net Position...
SALT CREEK RURAL PARK DISTRICT PALATINE, ILLINOIS ANNUAL FINANCIAL REPORT FOR THE FISCAL YEAR ENDED APRIL 30, 2017
 PALATINE, ILLINOIS ANNUAL FINANCIAL REPORT FOR THE FISCAL YEAR ENDED APRIL 30, 2017 TABLE OF CONTENTS APRIL 30, 2017 Exhibit Page Independent Auditor's Report 1 Required Supplementary Information Management
FINANCIAL STATEMENTS September 30, 2017 and 2016
 FINANCIAL STATEMENTS CHILDREN'S BOARD OF HILLSBOROUGH COUNTY Tampa, Florida FINANCIAL STATEMENTS CONTENTS INDEPENDENT AUDITOR S REPORT... 1-2 MANAGEMENT S DISCUSSION AND ANALYSIS... 3-11 BASIC FINANCIAL