Poverty and Income Inequality in Scotland: 2013/14 A National Statistics publication for Scotland
|
|
|
- Della Porter
- 5 years ago
- Views:
Transcription
1 Poverty and Income Inequality in Scotland: 2013/14 A National Statistics publication for Scotland EQUALITY, POVERTY AND SOCIAL SECURITY
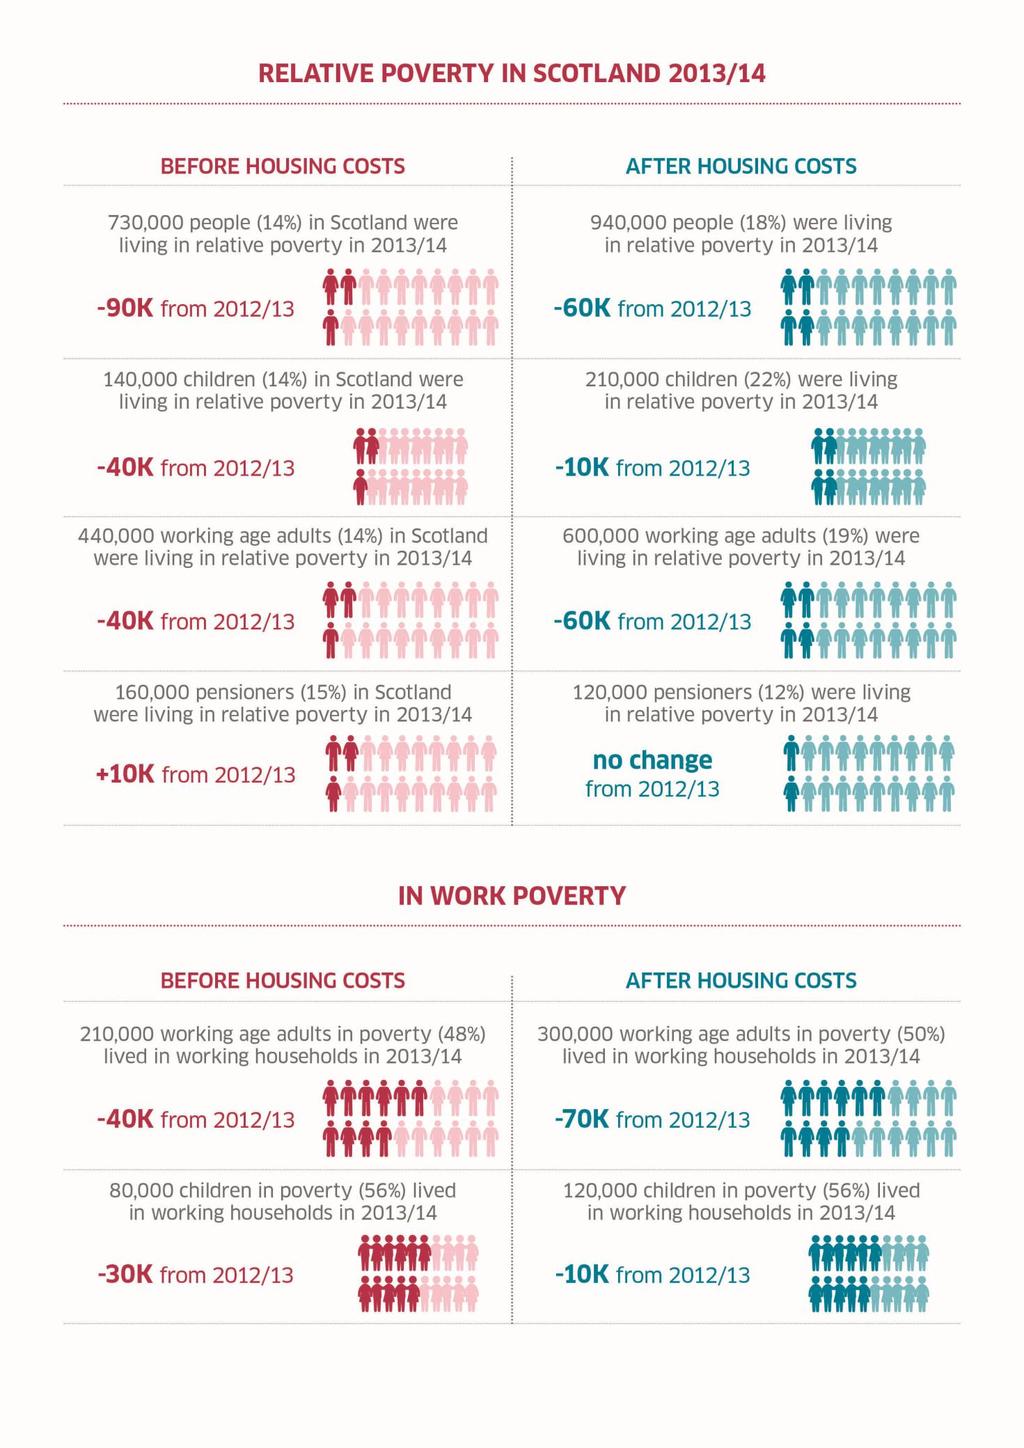
2 This publication presents annual estimates of the percentage and number of people, children, working age adults and pensioners living in low income households in Scotland. The estimates are used to monitor progress towards UK and Scottish Government targets to reduce poverty and income inequality. The data published for the first time here are for the financial year April 2013 to March Poverty in 2013/14 Relative poverty in Scotland, before housing costs, decreased in 2013/14. Rates for children are the lowest since this series started in 1994/95. This reflects more people moving into employment, and increases in hours worked. In particular there was a shift from part-time employment to full-time employment for those on the lowest incomes. However, after housing costs are accounted for poverty in Scotland has not decreased to the same extent. This is particularly true for families with children. This reflects rent values increasing at a faster rate than income, combined with changes to housing benefit eligibility, meaning little improvement in the standard of living. Median income increased in Scotland in 2013/14 and was higher than UK median income. However, inflation continued to grow at a faster pace than earnings and the uprating of most benefits. Therefore increases in income have not necessarily resulted in improvements in people s standard of living, and combined low income and child material deprivation has continued to increase. Key points All individuals: 14 per cent of people in Scotland were living in relative poverty, before housing costs (BHC), in 2013/14, a decrease from 16 per cent the previous year. This equates to 730 thousand people, 90 thousand fewer than in 2012/13. After housing costs (AHC), 18 per cent of people in Scotland were living in relative poverty, a decrease from 19 per cent in 2012/13. This equates to 940 thousand, 60 thousand fewer than in 2012/13. The decrease in 2013/14 continues the downward trend in relative poverty BHC in Scotland seen over the last decade, following the increase in 2012/13. However, the rate of relative poverty AHC, remains above the level in 2010/11. 1
3 Child poverty: 14 per cent of children in Scotland were living in relative poverty BHC in 2013/14, a decrease from 19 per cent the previous year. This equates to 140 thousand children, 40 thousand fewer than in 2012/13. After housing costs, 22 per cent of children in Scotland were living in relative poverty, unchanged from the previous year. This equates to 210 thousand children living in relative poverty AHC, 10 thousand fewer than in 2012/13. The decrease in 2013/14 continues the downward trend in relative child poverty BHC over the last decade, following an increase in 2012/13. The rate of relative child poverty BHC is now at the lowest level since 1994/95. However, there has been no change in the rate of relative child poverty after housing costs. While incomes have increased, standards of living have not necessarily improved. In 2013/14, 13 per cent of children were living in combined low income and material deprivation, an increase from 11 per cent the previous year. This equates to 130 thousand children living in material deprivation, 20 thousand more than the previous year. After housing costs, 14 per cent of children were living in combined low income and material deprivation, an increase from 12 per cent the previous year. This equates to 140 thousand children living in material deprivation, 20 thousand more than the previous year. This increase continues the upward trend in child material deprivation seen over recent years. Working age adult poverty: 14 per cent of working age adults in Scotland were living in relative poverty BHC in 2013/14, a decrease from 15 per cent the previous year. This equates to 440 thousand working age adults living in relative poverty BHC, 40 thousand fewer than in 2012/13. After housing costs, 19 per cent of working age adults in Scotland were living in relative poverty, a decrease from 21 per cent the previous year. This equates to 600 thousand working age adults living in relative poverty AHC, 60 thousand fewer than in 2012/13. The decrease in relative poverty BHC continues the gradual downward trend seen over the recent past, following an increase in working age poverty in 2012/13. Relative working age poverty AHC, although recording a decrease, remains at levels seen in 2009/10. There have been changes to housing benefit eligibility since 2011/12, and rent values increasing faster than income, meaning standard of living has not necessarily improved for working age adults. 2
4 Pensioner poverty: 15 per cent of pensioners in Scotland were living in relative poverty BHC in 2013/14, unchanged from the previous year. This equates to 160 thousand pensioners in Scotland living in relative poverty BHC, 10 thousand more than in 2012/13. After housing costs, 12 per cent of pensioners in Scotland were living in relative poverty, an increase from 11 per cent the previous year. This equates to 120 thousand pensioners were living in relative poverty AHC, the same number as the previous year. In-work poverty: In 2013/14, 48 per cent of working age adults in poverty BHC were living in working households, as were 56 per cent of children in poverty. After housing costs, 50 per cent of working age adults in poverty were living in working households, as were 56 per cent of children. While employment remains the best route out of poverty, employment is no longer a protection against poverty. While in-work poverty for working age adults and children showed a small decrease in 2013/14, the rate of in-work poverty remains at levels seen in recent years. Income Inequality: Median income in Scotland in 2013/14 was 24,000, equivalent to 460 per week. Median income in Scotland has increased in 2013/14, following three years of decreases. In terms of income inequality, the percentage of income received by the lowest 3 income deciles in 2013/14 was 14 per cent, unchanged from 2012/13. There has been very little change in this measure of income inequality since 1998/99. The Gini coefficient, which measures the degree of inequality in the household income distribution, in 2013/14 was 30. This is a decrease from 31 in 2012/13. Income inequality, as measured by the Gini coefficient, has remained at these levels over the last four years. 3
5 Poverty in Scotland - A headline measure: To date, the Scottish Government have focused on poverty before housing costs as the headline measure of poverty in Scotland. This was because these were the measures set in the Child Poverty Act (2010). The way in which housing costs are treated when measuring income has some important implications for poverty analysis and conclusions about the anti-poverty effects of policy reforms. This is because the number of people counted as poor (e.g. with income falling below a threshold) depends crucially on the income concept adopted. This publication presents relative and absolute poverty before and after housing costs, material deprivation before and after housing costs, and inwork poverty before and after housing costs. The Scottish Government will talk with stakeholders over the summer to gather views on which poverty measure should be the headline measure for poverty in Scotland. Please Note: In this publication, all statistics are based on net income. That is, income after taxes and including benefits. Income is calculated at the household level, and reflects the income available to the household after taxes (including council tax) are paid and all benefits and tax credits have been received. Unless otherwise stated, incomes for previous years are in 2013/14 prices (real prices). All figures in this publication are rounded to the nearest 10 thousand individuals or whole percentage point. In some cases calculations based on the unrounded figures do not match those based on the rounded ones. Unless specifically stated, annual changes in the numbers and percentages of people in poverty presented in the body of this report are not statistically significant. Poverty is measured at the household level. If household income is below the poverty threshold, all people within the household are in poverty. This is based on the assumption that income is shared equally across all members of the household, and they have the same standard of living. The estimates presented in this publication are based on a sample survey and are therefore subject to sampling error. Confidence intervals are a measure of sampling error. A 95 per cent confidence interval for an estimate is the range that contains the true figure on average 19 times out of 20 if sampling error were the only source of errors. Many of the changes referred to in this publication are within the width of the confidence limits and caution should be exercised when looking at year on year comparisons, with longer term trends often giving a clearer picture. More information can be found here: Scottish Government - Income and Poverty Statistics - Methodology 4
6 Presentation of key points and definitions Each section starts with a magenta box providing the key facts for that section. Where relevant, additional information is provided in a blue box at the end of each section. This includes important definitions and links to National Indicators relating to poverty and income inequality on Scotland Performs. Changes to statistics 2013/14: This publication includes changes to the statistics compared with previous publications: 1. Personal Independence Payment (PIP): 2013/14 is the first year of data that includes the receipt of PIP. PIP is a benefit to help with the extra costs caused by living with long-term ill health or a disability, for those aged between 16 and 64. The amount of benefit received depends how the condition affects the recipient rather than the condition itself. 2. Pensioners are defined as all those adults above State Pension age. Working age adults are defined as all adults up to the state pension age. Prior to April 2010, women reached the state pension age at 60. Between April 2010 and March 2016 the state pension age for women is increasing to 63 and will then increase to 65 between April 2016 to November At this point the state pension age for men and women will be the same. The changes do not affect the state pension age for men, which remains at 65. Therefore, as with the previous three reports, the age groups covered by the analysis of working age adults and pensioners will change for the 2013/14 report. The pensioner material deprivation statistics will continue to be based on pensioners aged 65 and over. Changes to the publication 2013/14: This publication includes statistics not included in previous publications. Combined low income and child material deprivation and in-work poverty estimates after housing costs have been included in the 2013/14 publication for the first time. 5
7 Contents Key points... 1 Poverty before and after housing costs... 8 Chapter 1: Poverty People in poverty Child poverty Working age adult poverty Pensioner poverty In-work relative poverty Chapter 2: Income Inequality and the distribution of income Income Inequality the Gini coefficient Income distribution Income thresholds Trends in income distributions Chapter 3: Household characteristics and income distribution Household composition Household economic status Annexes Annex 1: Tables Annex 2: Data Sources and Definitions Data sources What does the HBAI measure? Housing Costs Definitions Annex 3: Welfare Reform in 2013/ Annex 4: Where to Find More Information
8 7
9 Poverty before and after housing costs The way in which housing costs are treated when measuring income has some important implications for poverty analysis and conclusions about the anti-poverty effects of policy reforms. This is because the number of people counted as poor (e.g. with income falling below a threshold) depends crucially on the income concept adopted. Housing benefit is included in income. Therefore, when rent values increase faster than income, while poverty before housing costs may decrease, poverty after housing costs may stay the same or increase, reflecting no improvement in standard of living. Within the UK, poverty is measured both before and after housing costs. There are a range measures of poverty, including absolute poverty and material deprivation all to capture different dimensions of living standards. Poverty before and after housing costs Prior to welfare reform, it was recognised that housing benefit in the UK had a positive effect in reducing the link between housing poverty and income poverty. Up to 2011/12, while poverty after housing costs was higher than poverty before housing costs, the difference between the two measures was relatively stable. However, since 2011/12, there has been a divergence between relative poverty before and after housing costs. There have been a number of factors affecting this: Housing benefit reforms: In April 2011, the first reforms to housing benefit were implemented. This is particularly noticeable in 2013/14, which includes the reforms to housing benefit recipients in the social rented sector as well as those in the private rented sector. The key changes to housing benefit were reducing local housing allowance (LHA) for those in private sector rental from the median local rent to the 30th percentile, freezing LHA rates in 2012, before uprating LHA capped by CPI inflation in 2013, removal of the 15 excess, restriction of LHA to the four bedroom rate, extension of the shared accommodation rate from under 25 year olds to under 35 year olds and the bedroom tax for those in the social rented sector. These reforms acted to reduce housing benefit for claimants the reduction dependent on household circumstances. If rents increase and housing benefit continues to cover rent, then standards of living remain constant but poverty BHC may decrease as housing benefit is counted as income. Evidence at the UK level showed the LHA reforms had reduced existing claimants maximum entitlements in given property types, and the majority of the impact fell on tenants rather than landlords. In 2010, across the UK, 55 per cent of tenants were renting a property that cost more than the maximum LHA entitlement, and therefore had to contribute to their own rent. Following the reforms this had increased to 62 per cent (and 68 per cent for new claimants). Reforms had a greater impact on 8
10 those who had higher entitlements to start with. These include claimants in higher rent areas, lone parents, year olds included in the extended scope of the Shared Accommodation Rate (SAR), and those affected by the national LHA caps and the abolition of the five-room rate. Increases in rental values: For households in employment, and so not in receipt of full housing benefit, poverty after housing costs increases if rent increases more quickly than earnings. In Scotland over the period 2010/11 to 2013/14, private sector rents (for a 2 bedroom property) have increased by 9 per cent, while those in social rented sector (registered social landlords only) have increased by 11 per cent. These increases in rental values are significantly higher than increases in gross annual earnings (slightly less than 6 per cent increase over the same period), and most working age benefits have been uprated in line with earnings in recent years. However, it is important to note the level of social rents remains significantly below the level of private rents, so social rents are still helping households to be better off than if they were in the private sector. Little change in mortgage interest rates: Households further up the income distribution are more likely to own their own homes either outright or with a mortgage. Mortgage interest rates have remained flat over the period. As relative poverty measures whether the standard of living for low income households (who are more likely to be in rented accommodation) is keeping pace with middle income households, tenure affects this. Housing costs for those in rental accommodation have been increasing at a faster rate than mortgage interest rates and income, meaning housing costs for low income households have been increasing more quickly than those for middle income households. 9
11 Percentage of Individuals Chapter 1: Poverty 1.1 People in poverty Key points: Relative Poverty before housing costs: 14 per cent of people in Scotland were living in relative poverty BHC, in 2013/14, a decrease from 16 per cent the previous year. In 2013/14, there were 730 thousand people in Scotland living in relative poverty BHC, 90 thousand fewer than in 2012/13. After housing costs are taken into account: 18 per cent of people in Scotland were living in relative poverty, a decrease from 19 per cent in 2012/13. In 2012/13, there were 940 thousand people living in relative poverty AHC, 60 thousand fewer than in 2012/13. Chart 1A Relative Poverty All Individuals After Housing Costs Before Housing Costs Source: HBAI dataset, DWP. See Annex 1 (Tables A1 and A2) for the figures behind these charts. Confidence intervals for relative can be found in Confidence Intervals Surrounding Key Poverty Estimates. 10
12 Percentage of Individuals Relative poverty BHC for all individuals decreased to 14 per cent in 2013/14. The change in the number and percentage of people in relative poverty BHC between 2012/13 and 2013/14 is not statistically significant. Longer term trends often offer a better indication of significant changes. Following a decrease from 18 per cent in 2003/04, poverty rates BHC remained unchanged at 17 per cent from 2004/05 to 2009/10. The level of relative poverty BHC then decreased to 14 per cent over the two years to 2011/12. Following an increase to 16 per cent in 2012/13, the rate of relative poverty BHC for all people in 2013/14 has returned to levels seen in 2011/12. After Housing Costs have been taken into account, 18 per cent of people in Scotland were in relative poverty. The change in the number and percentage of people in relative poverty AHC between 2012/13 and 2013/14 is not statistically significant. Relative poverty AHC had followed a similar trend to relative poverty BHC, remaining relatively unchanged between 2003/04 and 2009/10, followed by a decrease from 19 per cent to 16 over the two years to 2011/12. Relative poverty AHC also decreased in 2013/14, following an increase in 2012/13, but the gap between relative poverty before and after housing costs has widened and is now larger than it has been for more than decade (4 percentage points). Chart 1B Absolute Poverty All Individuals After Housing Costs Before Housing Costs Source: HBAI dataset, DWP. See Annex 1 (Tables A1 and A2) for the figures behind these charts. Confidence intervals for relative and absolute poverty can be found in Confidence Intervals Surrounding Key Poverty Estimates. 11
13 Absolute poverty BHC, a measure of whether the lowest income households are keeping pace with inflation, has decreased to 15 per cent in 2013/14, a 2 percentage point decrease compared with 2012/13. In 2013/14 there were 800 thousand people living in absolute poverty BHC, 80 thousand fewer than the previous year. As absolute poverty is based on the poverty threshold in 2010/11, and incomes have decreased in real terms since then, absolute poverty rates are higher than relative poverty rates. Absolute poverty after housing costs are taken into account has also decreased. In 2013/14, 20 per cent of people in Scotland were in absolute poverty AHC, a 1 percentage point decrease compared with 2012/13. In 2013/14, there were 1.03 million people living in absolute poverty AHC in Scotland, 70 thousand fewer than the previous year. The gap between absolute poverty before and after housing costs has widened to 5 percentage points in 2013/14, an increase from 2 percentage points in 2010/11. Commentary: Relative poverty BHC decreased in 2013/14. This reflects increases in employment in Scotland and particularly increases in hours worked. There was a move into employment with increases in the number of working households in Scotland. For those already in employment, there has been a shift from part-time employment to full-time employment. 2013/14 also saw increases in hourly wages across Scotland, especially for those in lower-paid employment. There was an increase in the personal tax allowance in 2013/14, and increases in working age benefits were largely in line with increases in earnings (but below inflation). These factors have a varying impact on the rate of poverty with some, such as increasing the personal tax allowance, mitigating the impact of others, such as welfare reform implemented over the last three years. The net effect however is a decrease in relative poverty, following a move into employment and increases in hours worked. There was an increase in median income in Scotland in 2013/14 compared with the previous year and most incomes deciles also saw either an increase or no change; the exception being the top decile, which decreased. The largest increases in 2013/14 were for those in the bottom two income deciles. 12
14 The Scottish Government currently uses two main indicators of low-income poverty, both of which reveal slightly different information about changes in poverty over time. These indicators are relative and absolute poverty. Relative poverty: Relative poverty is a measure of whether the incomes of the poorest are increasing in line with middle income households. In this report, individuals are said to be in relative poverty if they are living in households whose equivalised income is below 60 per cent of UK median income in that year. Relative low income rates fall if household income for the poorest households increases faster than median income. In 2013/14, the relative poverty threshold for a couple with no children was an income of 272 per week BHC from all sources (see Annex 2 for further information on income definitions). For a couple with children the threshold would be higher and for a single person (without children) the threshold would be lower. After housing costs, the relative poverty threshold in 2013/14 was 232 per week. Absolute poverty: Absolute poverty is a measure of whether income for the lowest income households are keeping pace with inflation. Individuals are said to be living in absolute poverty if they are living in households whose equivalised income is below 60 per cent of the (inflation adjusted) median income in 2010/11. In 2013/14 the absolute poverty threshold for a couple with no children was an income of 280 per week BHC from all sources (see Annex 2 for further information on income definitions). After housing costs, the absolute poverty threshold in 2013/14 was 242 per week. Scotland Performs: The Scottish Government s National Indicator 35 is to decrease the proportion of individuals living in poverty : This is measured using relative poverty before housing costs. 13
15 1.2 Child poverty Key points: Relative Poverty before housing costs: 14 per cent of children in Scotland were living in relative poverty BHC in 2013/14, a decrease from 19 per cent the previous year. This decrease is statistically significant. In 2013/14, there were 140 thousand children in Scotland living in relative poverty BHC, 40 thousand fewer than in 2012/13. After housing costs are taken into account: After housing costs, 22 per cent of children in Scotland were living in relative poverty, unchanged from the previous year. In 2013/14, there were 210 thousand children living in relative poverty AHC, 10 thousand fewer than in 2012/13. Low Income and Material Deprivation: In 2013/14, 13 per cent of children were living in combined low income BHC and material deprivation, an increase from 11 per cent the previous year. This equates to 130 thousand, 20 thousand more than the previous year. This increase continues the upward trend in child material deprivation seen over recent years. After housing costs, 14 per cent of children in Scotland were living in combined low income AHC and material deprivation, an increase from 12 per cent the previous year. This equates to 140 thousand children, 20 thousand more than the previous year. 14
16 Percentage of Children Chart 2A Relative Poverty - Children After Housing Costs Before Housing Costs Source: HBAI dataset, DWP. See Annex 1 (Table A1) for the figures behind these charts. Notes: 1. A version of these charts showing the Child Poverty Act targets can be found in Annex 1, Chart A1. 2. Confidence intervals for relative child poverty can be found in Confidence Intervals Surrounding Key Poverty Estimates. Relative child poverty BHC decreased to 14 per cent in 2013/14. The change in the number and percentage of children in relative poverty BHC between 2012/13 and 2013/14 is statistically significant. Relative child poverty BHC saw a decreasing trend from 23 per cent in 2003/04 to 15 per cent in 2011/12. Following an increase to 19 per cent in 2012/13, child poverty in Scotland has fallen to 14 per cent in 2013/14. This is the lowest level of child poverty recorded by this series, which started in 1994/95. After Housing Costs have been taken into account, 22 per cent of children in Scotland were in relative poverty. Relative child poverty AHC had followed a similar trend to relative child poverty BHC, showing a decreasing trend from 26 per cent in 2003/04 to 19 per cent in 2011/12. However, following an increase to 22 per cent in 2012/13, relative child poverty AHC has remained at that level and did not see the decrease in the latest year that is seen before housing costs are taken into consideration. Because of this, the gap between relative child poverty before and after housing costs is now 8 percentage points, an increase from 3 percentage points the previous year. 15
17 Percentage of Children Chart 2B Absolute Poverty Children After Housing Costs Before Housing Costs Source: HBAI dataset, DWP. See Annex 1 (Table A2) for the figures behind these charts. Confidence intervals for absolute child poverty can be found in Confidence Intervals Surrounding Key Poverty Estimates. Absolute child poverty BHC has decreased to 16 per cent in 2013/14, a 4 percentage point decrease compared with 2012/13. In 2013/14 there were150 thousand children living in absolute poverty BHC, 50 thousand fewer than the previous year. Absolute child poverty has also decreased after housing costs are taken into account. In 2013/14, 24 per cent of children in Scotland were in absolute poverty AHC, a 1 percentage point decrease compared with 2012/13. In 2013/14, there were 240 thousand children living in absolute poverty AHC in Scotland, 10 thousand fewer than the previous year. As with relative child poverty, the gap between absolute poverty before and after housing costs has widened. In 2013/14, the gap was 8 percentage points, an increase from 5 percentage points in 2012/13. 16
18 Percentage of Children Chart 2C Material deprivation and low income BHC combined and relative poverty before housing costs - Children Child poverty before housing costs Material Deprivation BHC (old indicator) Material Deprivation BHC (new indicator) Source: HBAI dataset, DWP. See Annex 1 (Tables A1 and A3) for the figures behind these charts. Notes: 1. A version of these charts showing the Child Poverty Act targets can be found in Annex 1, Chart A1. 2. Changes in the material deprivation questions in 2010/11 created a break in the series. Data for 2010/11 onwards is not directly comparable with that prior to 2010/11. Further information is available in Annex_2. 17
19 Percentage of Children Chart 2D Material deprivation and low income AHC combined and relative poverty after housing costs - Children Child poverty after housing costs Material Deprivation AHC (old indicator) Material Deprivation AHC (new indicator) Source: HBAI dataset, DWP. See Annex 1 (Tables A1 and A4) for the figures behind these charts. Notes: 1. A version of these charts showing the Child Poverty Act targets can be found in Annex 1, Chart A1. 2. Changes in the material deprivation questions in 2010/11 created a break in the series. Data for 2010/11 onwards is not directly comparable with that prior to 2010/11. Further information is available in Annex_2. In 2013/14, 13 per cent of children in Scotland were living in combined low income BHC and material deprivation. This continues the increasing trend over recent years, with 40 thousand more children living in combined low income BHC and material deprivation than in 2011/ per cent of children in Scotland were living in combined low income AHC and material deprivation. This continues the increasing trend in child material deprivation and low income AHC seen over recent years, with 30 thousand more children living in combined low income AHC and material deprivation than in 2011/12. Commentary: Despite decreases in child poverty before housing costs, poverty after housing costs remains high and there is a trend emerging of increasing material deprivation for those on low incomes. 18
20 Over the last decade, the proportion of children in Scotland living in relative poverty BHC had decreased by 8 percentage points from 23 per cent in 2003/04 to 15 per cent in 2011/12, before increasing to 19 per cent in 2012/13. This has decreased to 14 per cent in 2013/14. Much of the fall in relative child poverty before housing costs in 2013/14 reflects the improved economic circumstances. The latest year has seen increases in employment and a shift from part-time employment to full-time employment. There has also been an increase in lone parent employment rates in Scotland. Employment remains the best route out of poverty, and increases in employment, particularly full-time employment, have increased household income for families with children. While benefits and earnings increased at about the same rate, but below inflation, increases in employment, particularly for families with children, have increased household income. Additionally, the increase in the personal tax allowance increased net income for those in employment (and earning above the threshold). However, despite increases in income, child poverty rates after housing costs have not decreased in 2013/14. Changes to housing benefit and increases in both private sector and social sector rents greater than increases in earnings mean that while incomes increased, there was not necessarily any improvement in standards of living. 19
21 Material Deprivation and Low Income Combined Poverty Indicator: Combined low income and child material deprivation is an additional way of measuring living standards and refers to the inability of households to afford basic goods and activities that are seen as necessities in society. It is a more direct measure of poverty than income alone, as it captures changes in standard of living. Material deprivation is calculated from a suite of questions in the Family Resources Survey about whether people can afford to buy certain items and participate in leisure or social activities. This measure is applied to households with incomes below 70 per cent of UK median income ( 317 per week) to create the 'material deprivation and low income combined' indicator. This indicator aims to provide a measure of children's living standards which, unlike relative and absolute poverty, is not solely based on income. For more detail about this indicator see Annex 2. Child Poverty Act: The 2010 Child Poverty Act, which the UK parliament is required to report on, includes 4 indicators of child poverty. Included in this section are 3 of these indicators at Scotland level: relative poverty BHC, absolute poverty BHC, material deprivation and low income BHC combined. There is also a persistent poverty indicator in the Act. It is expected that statistics to measure this target will be available at the end of Information on the targets for the Child Poverty Act can be found in Annex 1. Scotland Performs: The Scottish Government s National Indicator 36 is to reduce children s deprivation : This is measured using the material deprivation and low income BHC combined poverty indicator. 20
22 Percentage of Working Age Adults 1.3 Working age adult poverty Key points: Relative Poverty before housing costs: 14 per cent of working age adults in Scotland were living in relative poverty BHC in 2013/14, a decrease from 15 per cent the previous year. In 2013/14, there were 440 thousand working age adults in Scotland living in relative poverty BHC, 40 thousand fewer than in 2012/13. After housing costs are taken into account: 19 per cent of working age adults in Scotland were living in relative poverty, a decrease from 21 per cent the previous year. In 2013/14, there were 600 thousand working age adults living in relative poverty AHC, 60 thousand fewer than in 2012/13. Chart 3A - Relative Poverty Working Age Adults After Housing Costs Before Housing Costs Source: HBAI dataset, DWP. These figures are also presented in Annex 1 (Table A1). Confidence intervals for relative working age adult poverty can be found in Confidence Intervals Surrounding Key Poverty Estimates. Relative poverty BHC for working age adults decreased to 14 per cent in 2013/14. The change in the number and percentage of working age adults in relative poverty BHC between 2012/13 and 2013/14 is not statistically significant. The trend for working age adults in relative poverty BHC has been gradually 21
23 Percentage of Working Age Adults decreasing over the last decade with poverty rates before housing costs decreasing from 16 per cent a decade ago to 13 per cent in 2011/12, before increasing again. After Housing Costs have been taken into account, 19 per cent of working age adults in Scotland were in relative poverty. The change in the number and percentage of working age adults in relative poverty AHC between 2012/13 and 2013/14 is not statistically significant. Relative poverty AHC had followed a similar trend to relative poverty BHC, remaining between 17 and 19 per cent between 2003/04, before increasing to 21 per cent in 2012/13. In 2013/14, it has returned to 19 per cent. As with relative poverty for other groups, the gap between poverty rates before and after housing costs has increased in recent years. The gap had been 3 percentage points for the 3 years to 2009/10 before widening to 6 percentage points in 2012/13. The gap decreased to 5 percentage points in 2013/14. Chart 3B - Absolute Poverty Working Age Adults After Housing Costs Before Housing Costs Source: HBAI dataset, DWP. These figures are also presented in Annex 1 (Table A2). Confidence intervals for absolute working age adult poverty can be found in Confidence Intervals Surrounding Key Poverty Estimates. Absolute poverty for working age adults BHC has decreased to 15 per cent in 2013/14, a 1 percentage point decrease compared with 2012/13. In 2013/14 there were 480 thousand working age adults living in absolute poverty BHC, 30 thousand fewer than the previous year. Absolute poverty after housing costs are taken into account has also decreased. In 2013/14, 20 per cent of people in Scotland were in absolute poverty AHC, a 2 percentage point decrease compared with 2012/13. In 2013/14, there were 650 thousand people living in absolute poverty AHC in Scotland, 60 thousand fewer than the previous year. 22
24 The gap between absolute poverty before and after housing costs has been the same as that for relative poverty since 2007/08. The gap had been 3 percentage points for the 3 years to 2009/10 before widening to 6 percentage points in 2012/13. The gap decreased to 5 percentage points in 2013/14. Commentary: The percentage of working age adults in relative poverty BHC has recorded a gradual decrease through the last decade. Over the year to March 2014, there was an increase in the number of adults in employment compared with the previous year and unemployment decreased. There was also an increase in the number of hours worked, with a shift from parttime to full-time employment, and from self-employment, which has a higher risk of poverty, into paid employment. The percentage of those in poverty in part-time employment halved from 16 per cent to 8 per cent. In 2013/14, Scotland also saw increases in hourly pay. For those in employment, earnings increased, particularly for the lowest paid 20 per cent of employees. Combined with increases in the percentage of people living in households where all adults were working full-time, incomes at the bottom of the distribution have increased and poverty has decreased. Employment remains the best route out of poverty, and for those in employment the two key reasons for moving out of poverty are increases in hourly pay and increases in hours worked, both of which have happened in Scotland in 2013/14. For those not in employment, increases in key working age benefits in 2013/14 were largely in line with median earnings, but below inflation. Working age vs. State pension age: Working age adults are defined as all adults up to the state pension age. Prior to April 2010, women reached the state pension age at 60. Between April 2010 and March 2016 the state pension age for women is increasing to 63 and will then increase to 65 between April 2016 to November At this point the state pension age for men and women will be the same. The changes do not affect the state pension age for men, which remains at 65. The impact is to retain more women in the working age adult group, who in previous years would have been classified as pensioners. 23
25 1.4 Pensioner poverty Key points: Relative Poverty before housing costs: 15 per cent of pensioners in Scotland were living in relative poverty BHC in 2013/14, unchanged from the previous year. In 2013/14, there were 160 thousand pensioners in Scotland living in relative poverty BHC, 10 thousand more than in 2012/13. After housing costs are taken into account: 12 per cent of pensioners in Scotland were living in relative poverty AHC, an increase from 11 per cent the previous year. In 2013/14, 120 thousand pensioners were living in relative poverty AHC, the same number as the previous year. Material Deprivation: In 2013/14, 9 per cent of pensioners were living in material deprivation, an increase from 8 per cent the previous year. In 2013/14, there were 80 thousand pensioners in Scotland living in material deprivation, 10 thousand more than the previous year. The majority of pensioners own their own home, so for this reason the preferred measure of low income for pensioners is based on incomes measured AHC. Examining pensioners incomes compared to others after deducting housing costs allows for more meaningful comparisons of income between working age people and pensioners, and the pensioner population over time. 24
26 Percentage of Pensioners Chart 4A Relative Poverty and Material Deprivation - Pensioners 40 After Housing Costs 35 Before Housing Costs 30 Material Deprivation Source: HBAI dataset, DWP. These figures are also presented in Annex 1 (Tables A1 and A5). Confidence intervals for relative pensioner poverty can be found in Confidence Intervals Surrounding Key Poverty Estimates. Notes: 1. Pensioner material deprivation is not solely based on affordability and so should not be compared directly with measures of income-related poverty. 2. Pensioner material deprivation is included for those aged 65 and over only and therefore is not the same population as relative and absolute poverty measures. Relative poverty BHC for pensioners was 15 per cent in 2013/14. The change in the number of pensioners in relative poverty BHC between 2012/13 and 2013/14 is not statistically significant. Pensioner relative poverty BHC decreased from 22 per cent in 2003/04 to a low of 14 per cent in 2011/12 and has remained stable since then. After Housing Costs have been taken into account, 12 per cent of pensioners in Scotland were in relative poverty. The change in the percentage of pensioners in relative poverty AHC between 2012/13 and 2013/14 is not statistically significant. Relative pensioner poverty AHC, having been higher than relative poverty BHC in 2002/03, decreased faster than relative pensioner poverty BHC. Relative pensioner poverty AHC decreased from 25 per cent in 2002/03 to 11 per cent in 2008/09 and has been lower than relative poverty BHC since 2003/04. It has remained stable since 2008/09. Pensioner material deprivation increased to 9 per cent in 2013/14, a 1 percentage point increase on the previous year. Having decreased from 10 per cent in 2009/10 to 7 per cent in 2010/11, there has been a small increase since then to 2013/14, but still below the level seen in 2009/10. 25
27 Percentage of Pensioners Chart 4B - Absolute Poverty Pensioners After Housing Costs Before Housing Costs Source: HBAI dataset, DWP. These figures are also presented in Annex 1 (Table A2). Confidence intervals for absolute pensioner poverty can be found in Confidence Intervals Surrounding Key Poverty Estimates. Absolute pensioner poverty BHC has increased to 17 per cent in 2013/14, a 1 percentage point increase compared with 2012/13. In 2013/14 there were 170 thousand pensioners living in absolute poverty BHC, the same as in 2012/13. Absolute poverty after housing costs are taken into account has also increased. In 2013/14, 14 per cent of pensioners in Scotland were in absolute poverty AHC, a 1 percentage point increase compared with 2012/13. In 2013/14, there were 140 thousand pensioners living in absolute poverty AHC in Scotland, the same as in 2012/13. Unlike for other groups of the population, the gap between absolute poverty before and after housing costs has narrowed in recent years to 3 percentage points in 2013/14, a decrease from 7 percentage points in 2007/08. Between 2004/05 and 2009/10, absolute pensioner poverty AHC was between 5 and 7 percentage points lower than absolute pebsioner poverty BHC. This gap narrowed from 2010/11 onwards. Commentary: Over the last decade, the proportion of pensioners in Scotland in relative poverty BHC has fallen 7 percentage points from 22 per cent in 2003/04 to 15 per cent in 2013/14. However, poverty rates for pensioners have been relatively stable since 2008/09. Households containing pensioners at the lower end of the income distribution generally received a larger proportion of their income from benefits and a smaller proportion from other sources. The Basic State Pension (BSP) increased by
28 per cent and Pension Credit Guarantee Credit increased by 1.9 per cent, larger than increases in other benefits and tax credits but still below the level of RPI inflation in 2013/14 (2.9 per cent). While increases in earnings contributed to the decrease in poverty rates for other groups, pensioner poverty remained unchanged due to the relative importance of BSP and other benefits to pensioner incomes at the bottom of the income distribution. Median income BHC for families with children has decreased every year since 2009/10. While median income BHC for pensioners has also shown decreases over the same period, the decreases have been smaller than that for families with children. Median income for families with children has fallen by 11 per cent since 2009/10, compared with a 5 per cent fall in pensioner median income, meaning in 2013/14 median income for families with children was similar to that for pensioners. State pension age: Pensioners are defined as all those adults above State Pension age. Prior to April 2010, women reached the state pension age at 60. Between April 2010 and March 2016 the state pension age for women is increasing to 63 and will then increase to 65 between April 2016 to November At this point the state pension age for men and women will be the same. The changes do not affect the state pension age for men, which remains at 65. Therefore, as with the previous three reports, the age groups covered by the analysis pensioner poverty will change for the 2013/14 report. The impact is that more women will remain in the working age adult group, who in previous years would have been classified as pensioners. The pensioner material deprivation statistics will continue to be based on pensioners aged 65 and over. 27
29 Pensioner Material Deprivation Indicator: Pensioner material deprivation is an additional way of measuring living standards for pensioners. It focuses on access to specific goods, services and experiences. It is used to explore a broader definition of pensioner poverty and captures both financial and non-financial reasons for being in material deprivation. Pensioner material deprivation captures whether it is health or disability, or if someone is available to help them, that prevents access to goods and services, rather than solely low income. This measure is based on a set of goods, services and experiences, judged using academic research to be the best discriminators of deprivation. Pensioners are asked if they have an item (or access to a service) and to give a reason if they do not have it. Their responses are then used to judge whether or not they are materially deprived. It is similar to the child material deprivation and low income combined indicator (which is presented in Charts 2C and 2D) but has some important differences: Differences in the set of items asked about, e.g. pensioners are not asked if they can afford school trips. Pensioners are presented with a greater variety of reasons for not having a particular item, whereas households with children are simply asked whether they can afford an item they do not have. Pensioners are able to say if they are prevented from having it due to ill health, disability or lack of support from other people. These additions reflect that deprivation can occur because of ill health, disability or social isolation, and not just for financial reasons. The pensioner material deprivation indicator is not combined with household income information to produce a combined indicator, as is done with the child deprivation indicator. This is because for pensioners, the concept of material deprivation is broad and very different from low income, so it is appropriate to present it as a separate measure. For these reasons, pensioner material deprivation cannot be directly compared to the child material deprivation and low income measure. More background on pensioner material deprivation is given in Annex 2, and the following technical note on the DWP website gives further information, including the list of questions which are asked to pensioners: 28
30 Percentage of those in poverty 1.5 In-work relative poverty Key points: In 2013/14, 48 per cent of working age adults in poverty BHC were living in working households, as were 56 per cent of children in poverty. In 2013/14, 50 per cent of working age adults in poverty AHC were living in working households, as were 56 per cent of children in poverty. Chart 5A Percentage of children and working age adults in poverty BHC, living in a household with at least one adult in employment Children Working Age Adults 0 Source: HBAI dataset, DWP. These figures are also presented in Annex 1 (Table A6). 29
31 Percentage of those in poverty Chart 5B Percentage of children and working age adults in poverty AHC, living in a household with at least one adult in employment Children Working Age Adults 0 Source: HBAI dataset, DWP. These figures are also presented in Annex 1 (Table A7). Commentary: In-work poverty BHC in Scotland decreased in 2013/14, with 210 thousand working age adults in in-work poverty BHC - a decrease of 40 thousand compared with 2012/13. Just under half (48 per cent) of working age adults in poverty BHC were living in working households in 2013/14. The number of children living in poverty BHC who were in working households has also decreased in the latest year, with 80 thousand children in Scotland living in working households in 2013/14. There were 30 thousand fewer children in in-work poverty BHC in 2013/14 compared with the previous year, returning to the number seen in 2011/12. However, over half (56 per cent) of children in poverty BHC in Scotland in 2013/14 were living in working households. In-work poverty AHC decreased for working age adults but not for children. In 2013/14, child in-work poverty AHC remained at 56 per cent while working age adult in-work poverty BHC decreased from 56 to 50 per cent. While the overall number of children living in relative poverty BHC has fallen over recent years, a greater proportion were living in working households. The fact that there remain 80 thousand children in in-work poverty BHC despite the overall number dropping means they make up a larger percentage of those in poverty BHC. 30
32 The two key reasons for moving out of in-work poverty are increases in hourly pay and increases in hours worked. In 2013/14, there were increases in hourly pay, particularly for the lowest paid 20 per cent of employees, and a shift from part-time employment to full-time employment, particularly for women. For men there has been a shift from self-employment, which has a higher risk of poverty, to paid employment. In-work poverty: In-work poverty refers to those individuals living in households where at least one member of the household is working (either full or part-time) but where the household income is below the relative poverty threshold. This measure is calculated on income before housing costs and after housing costs. This group contains non-working household members such as children and non-working partners. Chapter 2: Income Inequality and the distribution of income 2.1 Income Inequality the Gini coefficient Key points: The Gini coefficient, which measures the degree of inequality in household income, was 30 in 2013/14. This is a decrease from 31 in 2012/13, mainly due to increases in incomes at the bottom of the distribution and decreases at the top. Income inequality, as measured by the Gini coefficient, has remained largely unchanged over the last four years. The Gini coefficient is a measure of how equally income is distributed across the population. It takes a value between 0 and 100 with 0 representing perfect equality where every person has the same income. The larger the Gini coefficient, the more people towards the top of the income distribution have a greater share of overall income with a value of 100 representing the case where one individual has all the income. In practice, the proportion of overall income going to each individual increases gradually across the income distribution. For Scotland, the Gini coefficient has been between 30 and 34 over the last decade. In 2013/14, the Gini coefficient for Scotland was 30, a 1 percentage point decrease compared with 2012/13. 31
Poverty and income inequality in Scotland:
 A National Statistics Publication for Scotland Poverty and income inequality in Scotland: 2008-09 20 May 2010 This publication presents annual estimates of the proportion and number of children, working
RESTRICTED: STATISTICS
 Households Below Average Income 2008/09 Peter Matejic (DWP) HBAI Publication Private households in United Kingdom Main source DWP Family Resources Survey Measurement of living standards as determined by
Poverty figures for London: 2010/11 Intelligence Update
 Poverty figures for London: 2010/11 Intelligence Update 11-2012 Key points The number of Londoners living in poverty has seen little change. Children, particularly those in workless households, remain
ANNUAL REPORT for the Child Poverty Strategy for Scotland
 ANNUAL REPORT for the Child Poverty Strategy for Scotland 2016 ANNUAL REPORT FOR THE CHILD POVERTY STRATEGY FOR SCOTLAND 2016 1 CONTENTS MINISTERIAL FOREWORD 02 1. INTRODUCTION 04 2. CHILD POVERTY IN SCOTLAND
Poverty Fact Book. Data, Information and Analysis for Leeds. Financial Inclusion Team
 Poverty Fact Book Data, Information and Analysis for Leeds Financial Inclusion Team March 2018 About the Poverty Fact Book The Poverty Fact Book was developed to be a useful document to share widely across
A Minimum Income Standard for London Matt Padley
 A Minimum Income Standard for London 2017 Matt Padley December 2017 About Trust for London Trust for London is the largest independent charitable foundation funding work which tackles poverty and inequality
IFS. Poverty and Inequality in Britain: The Institute for Fiscal Studies. Mike Brewer Alissa Goodman Jonathan Shaw Andrew Shephard
 IFS Poverty and Inequality in Britain: 2005 Mike Brewer Alissa Goodman Jonathan Shaw Andrew Shephard The Institute for Fiscal Studies Commentary No. 99 Poverty and Inequality in Britain: 2005 Mike Brewer
MONITORING POVERTY AND SOCIAL EXCLUSION IN SCOTLAND 2015
 MONITORING POVERTY AND SOCIAL EXCLUSION IN SCOTLAND 2015 This study is the seventh in a series of reports monitoring poverty and social exclusion in Scotland since 2002. The analysis combines evidence
Pensioners Incomes Series: An analysis of trends in Pensioner Incomes: 1994/ /16
 Pensioners Incomes Series: An analysis of trends in Pensioner Incomes: 1994/95-215/16 Annual Financial year 215/16 Published: 16 March 217 United Kingdom This report examines how much money pensioners
Can the changes to LHA achieve their aims in London s housing market?
 Can the changes to LHA achieve their aims in London s housing market? A report by New Policy Institute for Shelter This report was written by New Policy Institute. It was commissioned by Shelter with funding
Table two: A timeline of welfare reform
 Table two: A timeline of welfare reform Reforms Implementation date Client groups affected Child trust funds: abolished May 2010 Young people Mortgage interest support: paid at Bank of England interest
MONITORING POVERTY AND SOCIAL EXCLUSION 2013
 MONITORING POVERTY AND SOCIAL EXCLUSION 213 The latest annual report from the New Policy Institute brings together the most recent data to present a comprehensive picture of poverty in the UK. Key points
Family Resources Survey and related series update. Surveys Branch Department for Work and Pensions
 Family Resources Survey and related series update Surveys Branch Department for Work and Pensions Family Resources Survey Donncha Burke Households Below Average Income John Shale Pensioners Incomes Series
DECEMBER 2006 INFORMING CHANGE. Monitoring poverty and social exclusion in Scotland 2006
 DECEMBER 2006 findings INFORMING CHANGE Monitoring poverty and social exclusion in Scotland 2006 The New Policy Institute has produced its 2006 edition of indicators of poverty and social exclusion in
fact sheet Produced by policy
 Produced by CIH CYMRU Sponsored by North Wales Housing policy What is Welfare Reform? The Welfare Reform Act received royal assent on 8th March 2012. It introduces fundamental changes to the welfare system
Poverty and income inequality
 Poverty and income inequality Jonathan Cribb Public Economics Lectures, Institute for Fiscal Studies 17 th December 2012 Overview The standard of living in the UK Income Inequality The UK income distribution
Detailed calculation of out of London Living wage: method, rationale, data sources and figures for the 2010/11 calculation.
 Detailed calculation of out of London Living wage: method, rationale, data sources and figures for the 2010/11 calculation. by Donald Hirsch The following account of the process involved in setting the
Household disposable income and inequality in the UK: financial year ending 2017
 Statistical bulletin Household disposable income and inequality in the UK: financial year ending 2017 Initial insight into main estimates of household incomes and inequality in the UK, along with analysis
Public economics: Inequality and Poverty
 Public economics: Inequality and Poverty Chris Belfield Overview Measuring living standards Why do we use income? Accounting for inflation and family composition Income Inequality The UK income distribution
Monitoring poverty and social exclusion 2009
 Monitoring poverty and social exclusion 29 December 29 Findings Informing change The New Policy Institute has produced its twelfth annual report of indicators of poverty and social exclusion in the United
Cost of Preferred (or more likely) Option Net cost to business per year (EANCB on 2009 prices) N/A N/A No N/A
 Option Net cost to business per year (EANCB on 2009 prices) N/A N/A No N/A") Impact Assessment (IA) Title: Welfare Reform and Work Bill: Impact Assessment of the Benefit rate freeze Lead department or agency: Department for Work and Pensions Other departments or agencies: Her Majesty's
Impact Assessment (IA) Title: Welfare Reform and Work Bill: Impact Assessment of the Benefit rate freeze Lead department or agency: Department for Work and Pensions Other departments or agencies: Her Majesty's
Living standards during the recession
 Living standards during the recession IFS Briefing Note 117 James Browne 1. Introduction Living standards during the recession James Browne Institute for Fiscal Studies 1 We are used to our incomes rising
MONITORING POVERTY AND SOCIAL EXCLUSION IN NORTHERN IRELAND 2016
 MONITORING POVERTY AND SOCIAL EXCLUSION IN NORTHERN IRELAND 216 This Findings from the New Policy Institute brings together the latest data to show the extent and nature of poverty in. It focuses on the
Publication will no doubt be overshadowed by the ongoing Brexit debate. But it s important not to lose sight of the domestic policy agenda.
 Tomorrow, new statistics on poverty and income inequality will be published. All indications are that levels of poverty and inequality are on the rise in the UK over the longer term, and Scotland is no
Income Poverty. Chris Belfield 16 th July Institute for Fiscal Studies
 Income Poverty Chris Belfield 16 th July 2015 Outline Recent trends in income poverty how has poverty changed since the recession and why? how have different groups been affected? Relationship between
MONITORING POVERTY AND SOCIAL EXCLUSION 2015
 MONITORING POVERTY AND SOCIAL EXCLUSION 2015 This annual review by the New Policy Institute brings together indicators covering poverty, work, education and housing. It looks at changes over the last parliament
Poverty. David Phillips, p, IFS May 21 st, Institute for Fiscal Studies
 Poverty David Phillips, p, IFS May 21 st, 2010 Poverty: the story under Labour After poverty rose between 2004/5 and 2007/8 200,000000 for each of pensioners and children 200,000 for working age adults
Copies can be obtained from the:
 Published by the Stationery Office, Dublin, Ireland. Copies can be obtained from the: Central Statistics Office, Information Section, Skehard Road, Cork, Government Publications Sales Office, Sun Alliance
A NEW POVERTY BENCHMARK FOR BASIC INCOME SCHEMES by ANNIE MILLER
 ABSTRACT A NEW POVERTY BENCHMARK FOR BASIC INCOME SCHEMES by ANNIE MILLER (AnnieMillerBI@gmail.com) The official EU poverty benchmark, defined as 0.6 median household equivalised income, (with two versions
CIH Response to Budget and Future Directions. 30 March 2011 Sam Lister, Policy and Practice Officer, CIH
 CIH Response to Budget and Future Directions 30 March 2011 Sam Lister, Policy and Practice Officer, CIH sam.lister@cih.org Political context The Context Work and Pensions is largest budget more than entire
Economic Standard of Living
 DESIRED OUTCOMES New Zealand is a prosperous society, reflecting the value of both paid and unpaid work. All people have access to adequate incomes and decent, affordable housing that meets their needs.
Household Benefit Cap. Equality impact assessment March 2011
 Household Benefit Cap Equality impact assessment March 2011 Equality impact assessment for household benefits cap Brief outline of the policy or service 1. From 2013 the Government will introduce a cap
Child and working-age poverty in Northern Ireland over the next decade: an update
 Child and working-age poverty in Northern Ireland over the next decade: an update IFS Briefing Note BN144 James Browne Andrew Hood Robert Joyce Child and working-age poverty in Northern Ireland over the
All in it Together? Measuring the Impact of Austerity, Housing Strategy & Welfare Changes on Vulnerable Groups in Social Housing
 Human City HEADLINES Bulletin No. 10 March 2012 All in it Together? Measuring the Impact of Austerity, Housing Strategy & Welfare Changes on Vulnerable Groups in Social Housing SUMMARY This Bulletin is
Welfare Reform - the impact on child poverty
 Welfare Reform - the impact on child poverty Jon Shaw November 2012 www.cpag.org.uk Overview Headline figure: UK child poverty is predicted to rise by 800,000 by 2020/21 Key questions: Why will this happen?
Effects of taxes and benefits on UK household income: financial year ending 2017
 Statistical bulletin Effects of taxes and benefits on UK household income: financial year ending 2017 Analysis of how household incomes in the UK are affected by direct and indirect taxes and benefits
Housing Benefit: Uprating Local Housing Allowance by the Consumer Price Index
 Housing Benefit: Uprating Local Housing Allowance by the Consumer Price Index Determination of Appropriate Maximum Housing Benefit in the Private Rented Sector Equality impact assessment October 2011 Equality
GUIDE TO WELFARE REFORMS
 GUIDE TO WELFARE REFORMS 2010 2017 Since coming to power in 2010, the coalition government has undertaken a radical reform of our welfare system; introducing measures to cut overall welfare expenditure
Economic Standard of Living
 DESIRED OUTCOMES New Zealand is a prosperous society, reflecting the value of both paid and unpaid work. Everybody has access to an adequate income and decent, affordable housing that meets their needs.
APPENDIX 1 DETAILED LIST OF CHANGES & IMPACTS. Housing related changes
 APPENDIX 1 DETAILED LIST OF CHANGES & IMPACTS Housing related changes From April 2011: Cap on Local Housing Allowance (LHA) LHA is the housing benefit for private rented sector (where claim processed after
The cumulative impact of tax and welfare reforms
 The cumulative impact of tax and welfare reforms Jonathan Portes, Aubergine Analysis and King s College London Howard Reed, Landman Economics 2018 Equality and Human Rights Commission First published March
Mitigating the Impacts of Welfare Reform. Rachael McKechnie Social Justice and Regeneration Division, Scottish Government
 Mitigating the Impacts of Welfare Reform Rachael McKechnie Social Justice and Regeneration Division, Scottish Government Purpose Set the context Outline the Scottish Government s overall approach to welfare
Impact on households: distributional analysis to accompany Budget 2018
 Impact on households: distributional analysis to accompany Budget 2018 October 2018 Impact on households: distributional analysis to accompany Budget 2018 October 2018 Crown copyright 2018 This publication
Household Benefit Cap. Equality impact assessment October 2011
 Household Benefit Cap Equality impact assessment October 2011 Equality impact assessment for household benefits cap Brief outline of the policy or service 1. From 2013 the Government will introduce a cap
Living standards, poverty and inequality in the UK: to Andrew Hood Tom Waters
 Living standards, poverty and inequality in the UK: 2017 18 to 2021 22 Andrew Hood Tom Waters Living standards, poverty and inequality in the UK: 2017 18 to 2021 22 Andrew Hood Tom Waters Copy-edited by
Consultation response
 Consultation response Age UK s Response to the Work and Pensions Committee Inquiry into changes to Housing Benefit September 2010 Name: Sally West Email: sally.west@ageuk.org.uk Age UK Astral House, 1268
The Cumulative Impact of Welfare Reform in Hounslow
 The Cumulative Impact of Welfare Reform in Hounslow Contents Executive Summary... 4 The cumulative impact of welfare reform... 4 The impact of individual welfare reforms... 4 The impact of Universal Credit...
IMPACT OF HOUSING BENEFIT REFORMS - November 2010
 IMPACT OF HOUSING BENEFIT REFORMS - November 2010 CIH has secured media coverage of the impact of two aspects of welfare reform during November this document explains CIH s workings and summarises the
POVERTY IN AUSTRALIA: NEW ESTIMATES AND RECENT TRENDS RESEARCH METHODOLOGY FOR THE 2016 REPORT
 POVERTY IN AUSTRALIA: NEW ESTIMATES AND RECENT TRENDS RESEARCH METHODOLOGY FOR THE 2016 REPORT Peter Saunders, Melissa Wong and Bruce Bradbury Social Policy Research Centre University of New South Wales
Benefits Changes Timetable
 Benefits Changes Timetable Date Change Impact October 2008 Employment and Support Allowance (ESA) Introduced ESA replaced Incapacity Benefit (IB) for all new claimants. October 2010 January 2011 Support
Living standards, poverty and inequality in the UK: Jonathan Cribb Agnes Norris Keiller Tom Waters
 Living standards, poverty and inequality in the UK: 2018 Jonathan Cribb Agnes Norris Keiller Tom Waters Living standards, poverty and inequality in the UK: 2018 Jonathan Cribb Agnes Norris Keiller Tom
Tackling Poverty and Deprivation in Dundee. Peter Allan & Derek Miller Building Stronger Communities Group 23 June 2011
 Tackling Poverty and Deprivation in Dundee Peter Allan & Derek Miller Building Stronger Communities Group 23 June 2011 Why is Poverty a Priority in Dundee? Building a successful City Huge scale and impact
Ireland's Income Distribution
 Ireland's Income Distribution Micheál L. Collins Introduction Judged in an international context, Ireland is a high income country. The 2014 United Nations Human Development Report ranks Ireland as having
Welfare Reform Bill 2011
 Welfare Reform Bill 2011 Briefing for 2nd Reading Wednesday 9 th March Summary Shelter supports the principles of the new universal credit, which is the major piece of reform contained in the Welfare Reform
Age, Demographics and Employment
 Key Facts Age, Demographics and Employment This document summarises key facts about demographic change, age, employment, training, retirement, pensions and savings. 1 Demographic change The population
MULTIPLE CUTS FOR THE POOREST FAMILIES
 OXFAM RESEARCH REPORTS APRIL 2014 MULTIPLE CUTS FOR THE POOREST FAMILIES 1.75 million of the poorest families have seen their benefits cut due to welfare reform HANNAH ALDRIDGE & TOM MACINNES New Policy
Universal Credit the impact on Children and Families
 Universal Credit the impact on Children and Families Sam Royston, Poverty and Early Years Policy Adviser, The Children s Society sam.royston@childrenssociety.org.uk Three flavours of welfare reform Cuts
A Briefing from The Children s Society The Distributional Impact of the Benefit Cap
 A Briefing from The Children s Society The Distributional Impact of the Benefit Cap Introduction The Children s Society supports nearly 50,000 children and young people every year through our specialist
BOROUGH OF POOLE COMMUNITIES OVERVIEW AND SCRUTINY 17 MARCH 2015 POVERTY IN POOLE
 AGENDA ITEM 5 BOROUGH OF POOLE COMMUNITIES OVERVIEW AND SCRUTINY 17 MARCH 2015 POVERTY IN POOLE PART OF THE PUBLISHED FORWARD PLAN YES STATUS (Strategic) 1. PURPOSE 1.1 To summarise learning and draw conclusions
Multiple Jeopardy? The impacts of the UK Government s proposed welfare reforms on women in Scotland
 Multiple Jeopardy? The impacts of the UK Government s proposed welfare reforms on women in Scotland An Engender Briefing Paper January 2012 1. Introduction Since the June 2010 emergency budget the UK government
SOCIAL SECURITY (SCOTLAND) BILL [AS AMENDED AT STAGE 2]
![SOCIAL SECURITY (SCOTLAND) BILL [AS AMENDED AT STAGE 2]](/thumbs/79/78984058.jpg "SOCIAL SECURITY (SCOTLAND) BILL [AS AMENDED AT STAGE 2]") SOCIAL SECURITY (SCOTLAND) BILL [AS AMENDED AT STAGE 2] SUPPLEMENTARY FINANCIAL MEMORANDUM INTRODUCTION 1. As required under Rule 9.7.8B of the Parliament s Standing Orders, this Supplementary Financial
SOCIAL SECURITY (SCOTLAND) BILL [AS AMENDED AT STAGE 2] SUPPLEMENTARY FINANCIAL MEMORANDUM INTRODUCTION 1. As required under Rule 9.7.8B of the Parliament s Standing Orders, this Supplementary Financial
Trends in Income Inequality in Ireland
 Trends in Income Inequality in Ireland Brian Nolan CPA, March 06 What Happened to Income Inequality? Key issue: what happened to the income distribution in the economic boom Widely thought that inequality
The 2008 Statistics on Income, Poverty, and Health Insurance Coverage by Gary Burtless THE BROOKINGS INSTITUTION
 The 2008 Statistics on Income, Poverty, and Health Insurance Coverage by Gary Burtless THE BROOKINGS INSTITUTION September 10, 2009 Last year was the first year but it will not be the worst year of a recession.
2013 Benefit Uprating
 2013 Benefit Uprating Standard Note: SN/SG 6512 Last updated: 19 December 2012 Author: Richard Cracknell Section Social and General Statistics This note sets out the main benefit and tax credit rates for
INDICATORS OF POVERTY AND SOCIAL EXCLUSION IN RURAL ENGLAND: 2009
 INDICATORS OF POVERTY AND SOCIAL EXCLUSION IN RURAL ENGLAND: 2009 A Report for the Commission for Rural Communities Guy Palmer The Poverty Site www.poverty.org.uk INDICATORS OF POVERTY AND SOCIAL EXCLUSION
The Impacts of Welfare Reform
 The impact of welfare reform across Britain The Impacts of Welfare Reform Steve Fothergill Centre for Regional Economic and Social Research Sheffield Hallam University Publications Hitting the Poorest
Poverty and Inequality in the UK: 2010
 Poverty and Inequality in the UK: 2010 Robert Joyce Alastair Muriel David Phillips Luke Sibieta Institute for Fiscal Studies Copy-edited by Judith Payne The Institute for Fiscal Studies 7 Ridgmount Street
Incomes and inequality: the last decade and the next parliament
 Incomes and inequality: the last decade and the next parliament IFS Briefing Note BN202 Andrew Hood and Tom Waters Incomes and inequality: the last decade and the next parliament Andrew Hood and Tom Waters
Northern Ireland Northern Ireland Universal Credit Information Booklet
 Northern Ireland Northern Ireland Universal Credit Information Booklet July 2016 September 2016 Issued by: DfC Analytical Services Unit, 1st Floor, Lighthouse Building, 1 Cromac Place, Gasworks Business
Housing and Poverty Dundee Fairness Commission
 Housing and Poverty Dundee Fairness Commission Douglas Robertson Email d.s.robertson@stir.ac.uk Presentation Overview Housing & poverty Housing costs & the experience of poverty Housing & poverty changes
Economic standard of living
 Home Previous Reports Links Downloads Contacts The Social Report 2002 te purongo oranga tangata 2002 Introduction Health Knowledge and Skills Safety and Security Paid Work Human Rights Culture and Identity
The Money Statistics. December.
 The Money Statistics December 2018 Welcome to the December 2018 edition of The Money Statistics, The Money Charity s monthly roundup of statistics about how we use money in the UK. If you have any questions,
Universal Credit The Children s Society key concerns
 Universal Credit The Children s Society key concerns The first trial of Universal Credit starts on 29 April 2013, in parts of Cheshire and greater Manchester, with Ashton-under-Lyne the first job centre
The Impact of Austerity Measures on Households with Children
 Families in an Age of Austerity: January 2012 The Impact of Austerity Measures on Households with Children Analysis by James Browne, Institute for Fiscal Studies Contents Foreword 3 Executive Summary 5
Changes to work and income around state pension age
 Changes to work and income around state pension age Analysis of the English Longitudinal Study of Ageing Authors: Jenny Chanfreau, Matt Barnes and Carl Cullinane Date: December 2013 Prepared for: Age UK
Copies can be obtained from the:
 Published by the Stationery Office, Dublin, Ireland. Copies can be obtained from the: Central Statistics Office, Information Section, Skehard Road, Cork, Government Publications Sales Office, Sun Alliance
The Impacts of Welfare Reform
 The local and regional impact of welfare reform The Impacts of Welfare Reform Steve Fothergill Centre for Regional Economic and Social Research Sheffield Hallam University Publications Hitting the Poorest
The Money Statistics. August
 The Money Statistics August 2018 Welcome to the August 2018 edition of The Money Statistics The Money Charity s monthly round-up of statistics about how we use money in the UK. These were previously published
Calculating a Living Wage for London and the rest of the UK
 BRIEFING Calculating a Living Wage for London and the rest of the UK Conor D Arcy & David Finch November 2017 resolutionfoundation.org info@resolutionfoundation.org +44 (0)203 372 2960 Calculating a Living
Households Below Average Income (HBAI) Quality and Methodology Information Report
 Quality and Methodology Information Report") UK Data Archive Study Number 7196 - Family Resources Survey and Households Below Average Income: Safe Room Access Households Below Average Income (HBAI) Quality and Methodology Information Report 2016/17
UK Data Archive Study Number 7196 - Family Resources Survey and Households Below Average Income: Safe Room Access Households Below Average Income (HBAI) Quality and Methodology Information Report 2016/17
MONITORING POVERTY AND SOCIAL EXCLUSION 2016
 MONITORING POVERTY AND SOCIAL EXCLUSION 2016 This latest annual report from the New Policy Institute brings together the most recent data to present a comprehensive picture of poverty in the UK. Key points
DWP: Our Reform Story Overview slides
 Published: 14 March 2013 Update due: April 2013 DWP: Our Reform Story Overview slides Jacqueline Brown National Partnerships Team SHBVN Inverness Thurs 11 th April 2013 1 What s changing? Social Justice
PENSIONS POLICY INSTITUTE THE PENSIONS LANDSCAPE
 PENSIONS POLICY INSTITUTE THE PENSIONS LANDSCAPE 1 2 The Pensions Landscape Foreword 1 Summary of conclusions 2 Introduction to the UK pension system 4 Chapter 1: Current pensioners incomes 7 Chapter 2:
Housing and Welfare Reform
 Housing and Welfare Reform CIH South East Conference, Brighton 6 th March 2013 Andrew Parfitt Deputy Director of Housing Policy Andrew.parfitt@dwp.gsi.gov.uk Summary of reforms in relation to Housing (1)
Economic Standard of Living
 DESIRED OUTCOMES New Zealand is a prosperous society, reflecting the value of both paid and unpaid work. All people have access to adequate incomes and decent, affordable housing that meets their needs.
Asda Income Tracker. Report: December 2015 Released: January Centre for Economics and Business Research ltd
 Asda Income Tracker Report: December 2015 Released: January 2016 M a k i n g B u s i n e s s S e n s e Centre for Economics and Business Research ltd Unit 1, 4 Bath Street, London EC1V 9DX t 020 7324 2850
BRIEFING. Housing pinched. Understanding which households spend the most on housing costs. Laura Gardiner
 BRIEFING Housing pinched Understanding which households spend the most on housing costs Laura Gardiner August 2014 resolutionfoundation.org info@resolutionfoundation.org +44 (0)203 372 2960 Contents 2
Public economics: Income Inequality
 Public economics: Income Inequality Chris Belfield Overview Measuring living standards Why do we use income? Accounting for inflation and family composition Income Inequality The UK income distribution
The cumulative impact of tax and welfare reforms
 The cumulative impact of tax and welfare reforms Executive summary Jonathan Portes, Aubergine Analysis and King s College London Howard Reed, Landman Economics 2 The cumulative impact of tax and welfare
Report on the Child Poverty Strategy for Scotland
 Report on the Child Poverty Strategy for Scotland 2014-2017 February 2018 A report produced for the Poverty and Inequality Commission Evan Williams, Nick Bailey and Des McNulty Urban Studies, University
What has happened to the income of retired households in the UK over the past 40 years?
 Article What has happened to the income of retired households in the UK over the past 40 years? A closer look at the growth and distribution of income for retired households over the past 40 years. Contact:
Economic Standard of Living
 DESIRED OUTCOMES New Zealand is a prosperous society where all people have access to adequate incomes and enjoy standards of living that mean they can fully participate in society and have choice about
Data Management and Analysis Group. Child Poverty in London Income and Labour Market Indicators
 Data Management and Analysis Group Child Poverty in Income and Labour Market Indicators 60 50 40 30 1995 1996 1997 1998 1999 2000 2001 2002 2003 2004 2005 DMAG Briefing 2006/19 June 2006 Social Exclusion
STATISTICS ON INCOME AND LIVING CONDITIONS (EU-SILC))
)") GENERAL SECRETARIAT OF THE NATIONAL STATISTICAL SERVICE OF GREECE GENERAL DIRECTORATE OF STATISTICAL SURVEYS DIVISION OF POPULATION AND LABOUR MARKET STATISTICS HOUSEHOLDS SURVEYS UNIT STATISTICS ON INCOME
GENERAL SECRETARIAT OF THE NATIONAL STATISTICAL SERVICE OF GREECE GENERAL DIRECTORATE OF STATISTICAL SURVEYS DIVISION OF POPULATION AND LABOUR MARKET STATISTICS HOUSEHOLDS SURVEYS UNIT STATISTICS ON INCOME
People Councils Economy
 People Councils Economy the An assessment of the impact of proposed changes to the UK Benefits System on people, councils and the economy in Scotland. September 2010 The Scottish Local Government Forum
Report of the National Equality Panel: Executive summary
 Report of the National Equality Panel: Executive summary January 2010 The independent National Equality Panel was set up to examine how inequalities in people s economic outcomes such as earnings, incomes
The Gender Earnings Gap: Evidence from the UK
 Fiscal Studies (1996) vol. 17, no. 2, pp. 1-36 The Gender Earnings Gap: Evidence from the UK SUSAN HARKNESS 1 I. INTRODUCTION Rising female labour-force participation has been one of the most striking
Budget and AS welfare cuts. Sam Lister, Policy & Practice Officer, CIH
 Budget and AS welfare cuts Sam Lister, Policy & Practice Officer, CIH Content Summary and observations Net effect: personal incomes Tax credits and family benefits The revised benefits cap Four year benefits
Poverty. Chris Belfield, IFS 15 th July Institute for Fiscal Studies
 Poverty Chris Belfield, IFS 15 th July 2014 Outline Income based measures how has poverty changed since the recession and why? which groups have been affected by recent changes? Non-income based measures
The Money Statistics. April
 The Money Statistics April 2018 Welcome to the April 2018 edition of The Money Statistics The Money Charity s monthly round-up of statistics about how we use money in the UK. These were previously published