The Submission of. William M. Mercer Limited. The Royal Commission on Workers Compensation in British Columbia. Part B: Asset/Liability Study
|
|
|
- Philippa Evans
- 5 years ago
- Views:
Transcription
1 The Submission of William M. Mercer Limited to Workers Compensation Part B: Prepared By: William M. Mercer Limited 161 Bay Street P.O. Box 501 Toronto, Ontario M5J 2S5 June 4, 1998
2 TABLE OF CONTENTS Executive Summary Introduction And Overview A. Scope and Limitations of the Study B. Background C. Funding and Investment Policy Links D. The Concerns of Contributors E. Summary of Key Values F. Utilizing Surplus G. Scenario Risk Analysis Section I: Section II: Section III: Section IV: Section V: Appendix A1-A2 Appendix B1-B2 Appendix C1-C2 Appendix D1-D3 Liabilities A. Considerations for Reform B. Findings Fixed Income A. Considerations for Reform B Discussion C. Findings Equity Content A. Considerations for Reform B. Findings Equity Diversification A. Considerations for Reform B. Efficient Frontier C. Findings Stress Tests on Equity Content Historical Economic Data Future Economic Scenarios Capital Market Assumptions for the Efficient Frontier Charts on Economic Trends
3 EXECUTIVE SUMMARY This report presents the results of the asset/liability study for the Royal Commission on Workers Compensation. The purpose of the study was to assist the Commission consider alternative asset mix strategies which reflect a range of future economic conditions, the size and nature of the liabilities, and the funding position of the system. The study is based on an analytical framework that links the funding and investment policies using value at risk principles. The central theme of this framework is that conservatively (i.e. well) funded systems can adopt higher equity allocations in the asset mix. Achieving a well funded position and adopting higher equity content results in lower expected future costs for contributors, while protecting the benefit security needs of claimants. The study was conducted in the context of financial market conditions at the end of 1997, and considers a likely range of changes that may occur in the future with respect to the level of inflation expectations, real interest rates and economic growth using a scenario risk model. In addition, the impact of some extreme economic conditions was examined to stress test our findings. We also examined the alternative asset mix strategies using the efficient frontier to assess the return to risk characteristics. Our findings are that The system is well funded; The Board can add more equity to the asset mix. This will increase the liabilities on a risk adjusted basis, but lower long-term expected costs; Over the long term, the liability structure will grow with increases in the average covered wage; For claims incurred to a specific date, the duration of the system s real interest rate risk is about equal to a real return bond with a 10-year term to maturity; Page 1
4 Equities will likely protect the system against real interest rate risk and real wage growth over the long-term, although imperfectly; and Additional diversification of equity holdings outside Canada could improve the risk/ return expectations. In this context, the current funding target and investment policy do a very good job, but the mechanism that links funding and investment policy could be fine-tuned. This would improve the transparency of how costs are allocated over time. Within a risk adjusted framework, equity content may be increased, providing lower long-term expected costs while protecting the benefit security needs of workers within the required standards of prudence. Considerations for Revising the Investment Policy Equity content may be increased from 50% currently, to a range varying from 50-70%, provided the appropriate funding target is maintained; The foreign equity component may be increased from 20% currently, to a range varying from 20-40%, depending on the level of equity content; The proportion of U.S. to foreign equity may be reduced from 75% currently, to a range varying from 50-75%; The fixed income portfolio may continue to be invested in nominal bonds with an average term to maturity about equal to the Universe Index; and The cash component may be reduced from 10% currently to 5% or less. The reduction may be invested in real return bonds. Page 2
5 INTRODUCTION AND OVERVIEW A. SCOPE AND LIMITATIONS OF THE STUDY The purpose of this study is to analyze and illustrate the impact of investment policy decisions in a framework that links funding and investment policy. The linkage requires that liabilities be valued using current market interest rates and adjusted for investment policy risk. In this context, we have included estimates of liability values at different discount rates. These estimates are sufficient to indicate the direction and order of magnitude of changes to the balance sheet and annual costs, in response to changes in the interest rate. We have not attempted to achieve the degree of accuracy of a bona fide actuarial valuation of the liabilities. An actuarial valuation would consider experience and demographic factors beyond the scope of our study. For these reasons, our estimates should not be used for purposes other than this report. To the extent that the Board wishes to adopt the approaches described in this report, we recommend that our estimates be verified by an actuarial valuation. B. BACKGROUND The Board (WCB) administers the Accident Fund (the Fund) maintained to pay compensation, outlays, and expenses (referred to in aggregate as benefits) to workers and their dependants in accordance with the terms of the Act (the Act). The WCB is responsible for: monitoring the Fund s financial condition, periodically valuing the assets and liabilities of the Fund, establishing investment policy, and establishing funding policy. The major investment policy decisions include the portions of the Fund invested in equities and fixed income securities, for the equity portion, the amounts to be invested in Canadian and foreign securities, and for the foreign portion, the amounts to be invested in U.S. and non-north American equity, for the fixed income portion, the economic structure (real or nominal) and term structure (duration), and the role of speciality asset classes. The funding policy consists of determining the level of annual assessments needed to: capitalize the value of future benefits in respect of injuries that occur during the year, ensure there are sufficient funds to provide for benefits incurred in prior years, and Page 3
6 provide for additional benefits imposed by special circumstances, including legislative change, with the costs being recognized over a period of one or more years. The annual cost is determined by: the benefits paid (which in turn are governed by the Act), experienced rates of injury, recovery, and longevity, the economic environment, in particular, prevailing levels of inflation, salary growth, interest rates, and capital market returns, the Fund s investment performance, and the pattern of cost allocations to annual time periods determined by the funding policy. The benefits paid to workers are not directly affected by the system s financial condition and the performance of the Fund s investments. C. FUNDING AND INVESTMENT POLICY LINKS The scenario risk study is based on a proposed framework that links funding and investment on a risk adjusted basis. This framework is not currently used by the WCB, but could be implemented along the lines described in this report. One of the benefits would be to increase the transparency of the allocation of costs among different generations of contributors. The link between the funding and investment policies may be described by reference to the following amounts: The Economic Liability The economic value of the liabilities at a particular point in time, is the present value of expected future benefits using the market yield on a Government of Canada bond with a term structure (i.e. duration) and economic structure (i.e. real or nominal) comparable to the liabilities. This yield is referred to as the economic discount rate. We have estimated the current economic discount rate to be about 3.8%. Page 4
7 The Funding Target The funding target is the amount that the Fund should have at any point in time, consisting of the economic liability plus a reserve (risk margin) for investment policy risk. The funding target is also referred to as the risk adjusted liability. Because experience and the rate of return earned on investments is uncertain, the Fund s assets will rarely be at this target level. We have estimated the investment risk margin to be 35% of the economic liability, times the proportion of the fund invested in equities. If the investment policy contains no equity content, the funding target is equal to the economic liability. If the investment policy allocates 100% of the Fund to equities, the funding target is 135% of the economic liability. The Economic Assessment The economic value of the annual assessment for expected future benefits relating to injuries incurred during the year is calculated in the same way as the economic liability described above. The Expected Annual Cost The expected annual cost consists of: the economic assessment, plus interest at the economic discount rate (plus expected inflation) on the funding target, less the expected investment policy return on the funding target. The expected annual cost is therefore determined primarily by: the current market yield (economic discount rate) the investment policy risk margin (used to determine the funding target) the expected return from the investment policy asset mix Page 5
8 The Current Annual Cost The current annual cost consists of: the expected annual cost, plus the expected return on, and amortization of, the difference between the market value of assets and the funding target, plus amortization of the risk margin on the economic assessment reduced by benefits expected to be paid during the year (this amount is referred to as the maturity cost ). The current annual cost is equal to the expected annual cost if: assets are equal to the funding target, and benefits paid are equal to economic assessment (i.e. the system is mature ). D. THE CONCERNS OF CONTRIBUTORS The funding policy assigns cost (i.e. the capitalized value of future benefits) to the year an injury is incurred. To the extent this is achieved, the allocation of costs relative to the risks borne by different generations of contributors is equitable. In this context, the implications of conservative and aggressive investment policies are reviewed as follows. A conservative investment policy minimizes the risk of future deficits by investing in fixed income assets which closely track (i.e. match) the Fund s economic liabilities. The Fund may be maintained about equal to the economic liabilities without exposing future generations of contributors to the risk of funding an investment loss on funds contributed for injuries incurred in past years. At the same time, the long-run costs of the plan are likely to be high, as the investment returns on fixed income assets will be relatively low in most economic environments. An aggressive investment strategy, consisting of significant equity content, provides poor tracking of the economic liabilities in the short term. If the Fund is maintained close to the economic liability value, investment losses that emerge will need to be funded by future generations of contributors. This can be remedied by maintaining the Fund at a sufficient level so that the emergence of a deficit has a very low probability. An aggressive investment policy with significant equity content together with a higher funding target can provide reasonable protection against the Fund falling below the economic liability. A high equity content investment policy is economically attractive to the extent that the additional investment returns exceed the cost of maintaining a higher funding target and are available to provide lower long-term costs. E. A SUMMARY OF KEY ASSET AND LIABILITY VALUES AT DECEMBER 31, 1997 The financial position of assets and liabilities recorded in the (draft) Actuarial Report as at December 31, 1997 was determined using actuarial assumptions and methods that anticipate future long-term average market condition. This approach is widely used and has the advantages of: Page 6
9 producing consistent results over multi-year periods, and stable annual costs The assumptions and methods typically do not change dramatically from year to year when the average market approach is used. A scenario risk analysis depends on asset and liability values that vary directly with current financial market conditions. This approach is more appropriate for asset/liability management. The marked to market liability values for this study were derived from the reported financial data using estimation techniques. A comparison of the reported and derived values is as follows: $Millions at December 31, 1997 Liability Valuation Method Reported Average Market Derived Current Market (Economic) 50% Equity Risk Risk Adjusted Funding Target 70% Equity Risk Discount Rate 3% 3.8% 3.8% 3.8% Investment Risk Margin Implicit Nil 17.5% 24.5% Liabilities $6,192 $5,792 $6,806 $7,211 Asset Valuation Method Smoothed Market Value Current Market Value Assets $6,270* $7,386 Funding Excess (i.e. Surplus) 1997 Assessment** (Expected Annual Cost) $78 $1,594 $580 $175 $971 $927 $832 $782 * Note 1 Realized and unrealized capital gains are smoothed over 5 years. **Note 2 Represents the long-term expectation, prior to the expected investment return on, and the amortization of the current funding excess, and the risk margin on changes to the liability. Page 7
10 F. UTILIZING SURPLUS The table on page 7 indicates that the term surplus needs to be treated with some caution. The measurement of surplus depends on the methods and assumptions used to value assets and liabilities. In this report, we use the term surplus (or deficit) to mean the difference between the market value of assets and the risk adjusted liabilities (i.e. funding target). Recall that surplus and deficits will emerge because experience and investment returns are uncertain, and hence the market value of assets will rarely be equal to the funding target. However, the risk margin included in the funding target will ensure that the market value of assets will almost always exceed the economic liability value. The following figures illustrate how surplus may be utilized: $Millions Investment Policy 100% Fixed Income 70% Equity Liability (Risk Adjusted) 5,792 7,211 Assets (at MV) 7,386 7,386 Surplus 1, Annual Costs Expected Annual Cost Amortization of Surplus over 15 Years (163) _(18)_ Current Annual Cost for next 15 Years Theoretical Assets Value after 15 Years 5,792 7,211 Current Annual Cost After 15 Years The first column assumes that the investment policy is revised to 100% fixed income assets that match the term and economic structure of the claim obligations. In this case, there is no requirement for a risk margin and the funding target is set equal to the economic liability, resulting in a surplus of $1,594 million. The surplus could be amortized over 15 years in equal instalments of principal and interest (at 7%), to reduce the ongoing annual cost to $764 million. Page 8
11 A 70% equity investment policy achieves the same annual cost over the next 15 years but in a different manner. With equities, the surplus is reduced because a risk margin is included in the liabilities. However, the expected annual cost ($782 million) is lower than for the 100% fixed income policy because additional investment returns on the fund are anticipated. Although (in theory) both investment policies produce the same annual cost for the next 15 years, the position of the system will be very different once current surplus has been fully amortized. After 15 years, in theory, the assets would be equal to the funding target under both approaches, and annual costs will no longer be reduced by the amortization of surplus. After 15 years, the Fund would be substantially less, and the annual costs higher, for the 100% fixed income policy. If the future generation of contributors wished to add equities to the asset mix, an additional levy would be needed to bring the assets up to the appropriate funding target. In summary, assets in excess of the economic liabilities represent capital that can be: used to fund additional benefits refunded to the current generation of contributors, or deployed as risk capital to cover equity risk The decision on how surplus is utilized has a material consequence on the financial position and ongoing costs of the system that will eventually be ceded to future generations of stakeholders. Page 9
12 G. SCENARIO RISK ANALYSIS This study utilizes an approach called scenario risk analysis. The purpose of a scenario risk analysis is to estimate the impact of changes in the economic environment on the balance sheet position and ongoing costs of the system. We are primarily concerned with changes in three macroeconomic factors: real interest rates, expected inflation, and economic growth. Graphs showing the historical trends for these factors for the period are provided in Appendix D. Historical data for these factors, and related historical capital market returns for T- Bills, long Canada bonds, and Canadian and foreign equities are shown in Appendix A. The historical trends and data include estimated yields and returns for Canadian real return bonds before they became available to investors at the end of The estimates for the period from were derived using Mercer s interest rate model. Appendix B illustrates typical future scenarios for the next 10 years. These scenarios are typically used to project assets and liabilities on a year by year basis into the future. Projections can model the dynamics of demographic and economic change; for example, the impact of changes in average age, and average benefit levels as new claims based on higher salaries enter the system. Scenario risk analysis, the approach used in this study, provides a simpler alternative to projection studies. This is achieved by limiting the study to current point in time estimates of the liabilities and assets. The information provided by scenario risk analysis is particularly relevant for two key investment decisions: the allocation between fixed income and equities (Section III), and fixed income policy (Section II) Page 10
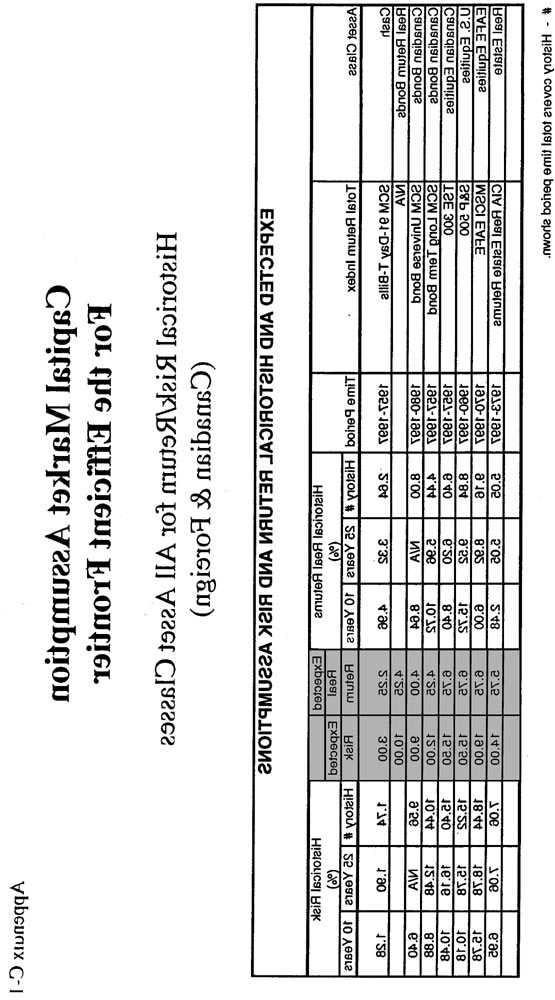
13 The scenario risk model considers all 9 combinations of the following real interest rates and inflation environments: RRB Yield Expected Inflation Low 3.00% 0.50% Current 4.15% 1.90% High 4.75% 3.50% This would cover most of the scenarios shown in Appendix B. We also assume that economic growth varies inversely with real interest rates as follows: RRB Yield Real GDP Per Employed 3.00% 2.40% 4.15% 1.00% 4.75% 0.25% Section V considers some more extreme conditions (stress test) consisting of higher inflation and the combination of lower real interest rates with low economic growth. We have analyzed the current investment policy and five alternative mixes (Mixes 1-5) using the fixed income yield curve at December 31, 1997 as illustrated below: Summary of Alternative Asset Mixes EXPECTED CURRENT TOTAL YIELD RETURN ASSET MIXES CURVE CURRENT CURRENT MIX MIX MIX MIX MIX DEC. 31, 1997 SCENARIO POLICY % T-BILLS 4.06% 10% 45% 5% 5% 5% 5% 5.35% SCM-SHORT 5.42% 0% 0% 0% 0% 0% 0% 5.65% SCM-UNIVERSE 5.73% 40% 0% 40% 40% 30% 20% 6.05% SCM-LONG 6.14% 0% 0% 0% 0% 0% 0% 4.15% RRB 6.14% 0% 55% 55% 5% 5% 5% REAL ESTATE 7.53% 5% 0% 0% 5% 5% 5% EQUITY 8.58% 45% 0% 0% 45% 55% 65% TOTAL 100% 100% 100% 100% 100% 100% EXPECTED TOTAL RETURN 6.93% 5.21% 5.87% 7.04% 7.32% 7.61% T-BILLS = Treasury Bills SCM-SHORT= ScotiaCapital Markets Short Bond Index SCM-UNIVERSE= ScotiaCapital Markets Bond Universe Index SCM-LONG= ScotiaCapital Markets Long Bond Index RRB = Real Return Bond Diversification in foreign equities is considered in Section IV. For this purpose, we have used traditional mean/variance analysis (i.e. the efficient frontier). Page 11
14 SECTION I. LIABILITIES A. Considerations for Reform Liability values that reflect economic and risk adjusted costs improve the transparency of cost allocations over time. B. Findings 1. The economic structure (i.e. real or nominal) and term structure (duration) of the liabilities is approximately matched by a real return bond having a 10-year term to maturity. In November, 1997, the Government of Canada began issuing real return bonds (RRBs). There are now 2 issues outstanding, with the first issue maturing on December 31, 2021 and the second issue maturing on December 1, RRBs have an annual coupon rate of 4.25% applied to a principal amount that changes with the Consumer Price Index (CPI). The coupon is payable semi-annually on June 1 and December 1. The real yield on RRBs constitutes a market-related discount rate for valuing inflation protected obligations such as claims because the stream of future coupons and the principal at maturity are indexed to inflation. The Worker s Compensation liability has about the same sensitively to changes in real yields as an RRB with a 10-year term to maturity. On December 31, 1997, the real yield on RRBs maturing in 2021 and 2026 was about 4.15%. The estimated real yield for an RRB with a 10-year term to maturity was obtained by subtracting the yield differential between long and mid-term nominal bonds (i.e. about 0.40% on December 31, 1997) and annualizing. This resulted in an annualized real discount rate of 3.80% as at December 31, Page 12
15 A similar approach was followed for determining the appropriate real discount rate for valuing liabilities in other scenarios. The following chart shows economic liabilities based on market related real discount rates for various RRB yield and inflation environments. Although claims are indexed to inflation, the economic liabilities are determined by the real yields available on RRBs, not expected inflation. Economic Liabilities at December 31, ,403 Economic Liabilities ($000,000's) 8,000 7,000 6,000 5,000 4,000 3,000 2,000 1,000-6,403 6, % 5,792 5,792 5, % 5, % 5,508 5, % 1.90% 3.50% Expected Inflation (%) RRB (%) 2. The reserve for equity risk is about 35% times the proportion of the fund invested in equities. The annual standard deviation of the balance sheet position (surplus or deficit) of the system, assuming 100% investment in Canadian equities was estimated as follows: The volatility of the liabilities is assumed to be about equal to a 10-year term real return bond. The standard deviation of real returns is estimated to be 7.5%. The standard deviation of real equity returns is estimated to be 15.5% A first approximation for the standard deviation of the surplus (or deficit) position is 17.2% (i.e. the square root of [ ]). This estimate could be fine-tuned further to include the impact of correlation between equity and liability returns, and the diversification effect of investing in foreign equities. Both factors would tend to reduce balance sheet volatility. On the other hand, some conservatism appears appropriate because standard deviations are time varying (i.e. uncertain) and 10-year term real return bonds is not actually available for investment. On this basis, we are using this first approximation for the study. A typical value at risk approach establishes a risk margin equal to 2 times the balance sheet standard deviation, or about 35% (i.e. 2 x 17.2% rounded up). Maintaining a 35% margin reduces the probability of Page 13
16 a deficit to 2.5%, or about 1 year in 40. The margin for an investment policy with less than 100% equity investments is reduced proportionally, as shown in the following table: Equity Content Risk Margin 100% 35% 70% 24.5% 60% 21.0% 50% 17.5% Nil Nil Risk adjusted liabilities are determined by both the real yield environment and the equity content of the investment policy as shown on the following graph: Risk Adjusted Liabilities at December 31, ,972 8,000 7,523 6,806 7,211 6,472 6,858 Risk-Adjusted Liabilities ($000,000's) 7,000 6,000 5,000 4,000 3,000 2,000 1,000-6, % 5, % RRB (%) 5, % Nil 50% 70% Equity Content (%) Page 14
17 SECTION II. FIXED INCOME A. Considerations For Reform In the absence of 10-year term real return bonds, practical fixed income strategies may incorporate T-Bills, nominal bonds and year term real return bonds. Investment in nominal bonds rather than T-Bills provides a trade-off between higher expected returns and exposure to inflation risk. B. Discussion This part of the study considers two 100% fixed income strategies (i.e. Mixes 1 and 2). We do not suggest or anticipate that the Fund will be invested in 100% fixed income securities. Rather, the purpose of this approach is to identify strategies that minimize risk by matching the term (i.e. duration) and economic (i.e. real vs. nominal) structure of the liabilities. This will provide information on the economic cost of minimizing investment risk as well as guidance for structuring the fixed income portion of the investment policy. When equities are considered in Section III, we use the concept of substituting equities for the various fixed income components of Mix 2. Page 15
18 C. Findings Our findings are summarized as follows: 1. The economic structure (i.e. real or nominal) and term structure (duration) would be approximately matched with a real return bond having a 10-year term to maturity. A reasonable proxy consists of 45% T-Bills and 55% RRBs having a year term to maturity. The following graph illustrates that the surplus position of a 45% T-Bill/55% RRB policy is sensitive to real yields, but independent of inflation expectations. This T-Bill/RRB combination is considered to be a matching asset to the term and economic structure of the liabilities. Balance Sheet Position Mix 1-45% T-Bills / 55% RRB Surplus ($000,000's) 2,400 2,200 2,000 1,800 1,600 1,400 1,200 1, (200) (400) (600) 1,801 1,801 1, % 1,594 1,594 1, % 1, % 1,523 1, % 1.90% 3.50% Expected Inflation (%) RRB (%) Page 16
19 2. A reasonable alternative fixed income strategy consists of 5% T-Bills 40% Scotia Capital Market Universe Bonds (SCMU) 55% RRB s Historically, T-Bills have provided lower returns than nominal bonds and therefore impose an opportunity cost. This can be mitigated by allocating 40% to bonds having an average term to maturity of about 9-10-years. The addition of nominal bonds creates an exposure to inflation risk as indicated by the following surplus profile: Balance Sheet Position Mix 2-5% T-Bills / 40% SMU / 55% RRB 2,050 1,710 Surplus ($000,000's) 2,400 2,200 2,000 1,800 1,600 1,400 1,200 1, (200) (400) (600) 2, % 1, % 1,285 1,594 1, % 1,109 1, % 1.90% 3.50% Expected Inflation (%) RRB (%) Adding nominal bonds to the asset mix worsens the balance sheet position as inflation expectation rise, and improves the balance sheet position if we experience further declines in the level of inflation expectations. A perspective on historical inflation expectations is provided in Appendix D. Page 17
20 3. The economic compensation for exposure to inflation risk is the higher expected returns on nominal bonds compared to T-Bills. The impact of higher expected returns is illustrated by comparing the expected (long -term) annual costs for Mix 1 (45% T-Bill/55% RRB) and Mix 2 (5% T-Bill, 40% SCMU bonds/55% RRBs) policies as shown on the following graphs: Expected Annual Cost - Mix 1 1,040 1,040 Expected Annual Cost ($000,000's) 1,100 1,050 1, , % 1.90% 3.50% Expected Inflation (%) % 4.15% 4.75% RRB (%) Expected Annual Cost - Mix , , Expected Annual Cost ($000,000's) 1, % 1.90% 3.50% Expected Inflation (%) % 4.15% 4.75% RRB (%) Page 18
21 SECTION III. EQUITY CONTENT A. Considerations for Reform The system is well funded, Equity content may increased from 50% currently, to up to 70% of the fund, provided the appropriate funding target is maintained, Higher equity content will reduce the expected long-term costs of the system, especially in lower real interest rate environments. B. Findings 1. The current funding target is sufficient for equity content up to about 70% of the fund. In its 1997 annual report, the WCB has committed to a funding target of % of the current liabilities (i.e. discounted at 3%). This compares to the risk adjusted framework used for this study as follows: WCB Current Liability/ Funding Target $Millions at December 31, 1997 Risk Adjusted Funding Target 6,192 5,792 (No Equity) 6,811 (110%) 6,806 (50% Equity) 7,120 (115%) 7,211 (70% Equity) As shown, the WCB s funding targets are very similar to the risk adjusted funding targets developed in this report. By this criteria, the system is conservatively funded. Page 19
22 2. A reasonable approach for determining a 50% equity content policy is to substitute equities for RRBs. Equities are generally considered to be a real asset class, and therefore should cover the real interest rate risk inherent in the liability structure. In particular, equities should protect the balance sheet against a reduction in long-term real interest rates, but it will do so imperfectly, particularly in the short term. Asset Mix 3 is obtained by substituting 50% equities for RRBs in Mix 2. Mix 3 is very similar to the Current Policy and has a very similar surplus profile as the economic environmental changes as shown below: Balance Sheet Risk - Mix 3 Surplus ($000,000's) 2,400 2,200 2,000 1,800 1,600 1,400 1,200 1, (200) (400) (600) 1,399 1, % 1, % RRB (%) % % 1.90% 3.50% Expected Inflation (%) Balance Sheet Risk - Current Policy Surplus ($000,000's) 2,400 2,200 2,000 1,800 1,600 1,400 1,200 1, (200) (400) (600) 984 1,324 1, % 4.15% RRB (%) % % 1.90% 3.50% Expected Inflation (%) Page 20
23 As expected, Mix 3 and the Current Policy also have very similar expected (long-term) annual cost profiles as shown below: Expected Annual Cost - Mix 3 1,100 1,050 Expected Annual Cost ($000,000's) 1, % 1.90% 3.50% Expected Inflation (%) % 4.15% 4.75% RRB (%) Expected Annual Cost - Current Policy 1,100 Expected Annual Cost ($000,000's) 1,050 1, % 1.90% 3.50% Expected Inflation (%) % 4.15% 4.75% RRB (%) Page 21
24 3. Equity content in excess of 50% may be achieved by reducing the allocation to SCM Universe bonds. Given the exposure to real interest rate risk inherent in the liabilities, it would appear reasonable to retain some investments in RRBs. It is recognized that the total market for RRBs in Canada is about $11 billion. As a practical matter, the allocation to RRBs is probably limited to 10% or less of the Fund. A reasonable approach to achieve equity content in excess of 50% of the Fund would be to substitute equities for nominal bonds. This has the advantage of reducing the exposure to inflation risk posed by nominal bonds. Although equities are also adversely affected by inflation, the risk is over shorter time horizons. Over the long term, equities have provided a good hedge against inflation. Page 22
25 Mixes 4 and 5 have 60% and 70% equity content, respectively. The surplus profiles are shown below. The lower surplus for Mix 5 is due, for the most part, to the higher risk margin added to the liabilities as equity content increases. Balance Sheet Risk - Mix 4 (60% Equity) Surplus ($000,000's) 2,400 2,200 2,000 1,800 1,600 1,400 1,200 1, (200) (400) (600) 1,366 1, % 1, % % 100 (120) 0.50% 1.90% 3.50% Expected Inflation (%) RRB (%) Balance Sheet Risk - Mix 5 (70% Equity) Surplus ($000,000's) 2,400 2,200 2,000 1,800 1,600 1,400 1,200 1, (200) (400) (600) 1,163 1,333 1, % % (294) (2) 4.75% (148) 0.50% 1.90% 3.50% Expected Inflation (%) RRB (%) Page 23
26 The advantage of higher equity content is the lower expected costs as illustrated below. Expected Annual Cost (60% Equity) 1,100 1,050 Expected Annual Cost ($000,000's) 1, % 1.90% 3.50% Expected Inflation (%) % 4.15% 4.75% RRB (%) Expected Annual Cost (70% Equity) 1,100 1,050 Expected Annual Cost ($000,000's) 1, % 1.90% 3.50% Expected Inflation (%) % 4.15% 4.75% RRB (%) Page 24
27 SECTION IV. EQUITY DIVERSIFICATION A. Considerations for Reform The allocation to foreign equities may be increased from 20% of the total fund to an amount varying between 20% and 40% The proportion of U.S. equities to the total foreign allocation may be revised from 75% currently, to an amount varying between 50 and 65% B. Efficient Frontier Analysis The equity portfolio of the fund stands to derive considerable benefit from diversification into global markets. We have used mean/variance optimization to identify efficient portfolios of Canadian, U.S. and non-north American equities. This type of analysis requires the following expectational inputs (i.e. capital market assumption) for each asset class: rates of return, standard deviations of return volatility, and correlations of returns for all possible pairings of the asset classes. A summary of the inputs and historical data is provided in Appendix B. Using these inputs, the optimization model identifies a set of efficient portfolios (i.e. the efficient frontier) that optimize the trade-off between return and volatility. Conceptually, the portfolios comprising the efficient frontier either: maximize the expected return for a fixed level of volatility, or minimize volatility for a given level of return. The Sharpe ratio represents the excess return over T-Bills, per unit of risk. Portfolios with high Sharpe ratios provide the most attractive return to risk trade-offs. The efficient frontier and statistics for the current and alternative asset mix policies are shown below. Page 25
28 Efficient Frontier No Foreign Risk Premium Mix 3 Expected Real Return Current IPP Mix 4 Mix Mix 1 Mix Risk (Standard Deviation) No Risk Premium Current Mix Mix Mix Mix Mix Asset Classes IPP Day T-Bills SCM Universe Bonds SCM Long Term Bonds Real Return Bonds Canadian Equity U.S. Equity EAFE Equity Real Estate Expected Return Standard Deviation Sharpe Ratio Total Fixed Income Total Equity Note: Maximum real estate is 5%. Page 26
29 C. Findings Our findings are as follows: 1. The current policy provides an efficient return to risk trade-off. Additional equity content will enhance the expected real return within an acceptable level of risk. The Sharpe ratio for the current policy is.34. Alternative mixes with higher equity content, and substantial foreign diversification achieve, at most, a.01 improvement in the Sharpe ratio, to.35. Thus the primary reason for increasing equity content is to enhance the expected return. An additional 10% equity content would enhance the expected return by about %. The related increase in volatility is acceptable in the context of the system s conservative funding target. 2. Diversifying 20-40% (Mixes 3-5) of the total fund into foreign equities provides attractive return to risk trade-offs, along with the higher return expectations. One approach for choosing the total equity content is to assume the Canadian, U.S. and EAFE equity all have equal return expectations. In this manner, foreign content would be based solely on risk and correlation characteristics. Our study indicated that the optimum foreign content on this basis depends on total equity content as follows: Total Equity Content Optimal Foreign Equity (% of Total Fund) 50% 21% 60% 27% 70% 34% A somewhat higher foreign content is justifiable if foreign equities are expected to outperform Canadian stocks. For example, a higher foreign equity content may be justified if risk premiums over Canadian equity (1% for U.S., 1.5% for EAFE) are expected. This suggests increasing the upper end of the range somewhat, to say, 40%. Page 27
30 Efficient Frontier Foreign Risk Premium (U.S. = 1%, EAFE = 1.5%) Mix 3 Expected Real Return Current IPP Mix 4 Mix Mix 1 Mix Risk (Standard Deviation) US Risk Premium = 1%, EAFE Risk Premium = 1.5% Current Mix Mix Mix Mix Mix Asset Classes IPP Day T-Bills SCM Universe Bonds SCM Long Term Bonds Real Return Bonds Canadian Equity U.S. Equity EAFE Equity Real Estate Expected Return Standard Deviation Sharpe Ratio Total Fixed Income Total Equity Note: Maximum real estate is 5%. Page 28
31 3. The proportion of U.S. to total foreign equities may vary from 50%-75%. The proportion of U.S. equity to total foreign (i.e. U.S. + EAFE) using various approaches is summarized below: Market Capitalization 50% Efficient Frontier No risk premium Risk premium* 1% for U.S., 1.5% EAFE 52-62% 54-60% * over the expected real return for Canadian equities Given the broader set of North American investment opportunities available in the U.S., a reasonable upper limit would be 75%. 4. Specialty Asset Classes We have continued to include a 5% allocation to real estate, consistent with the current policy, and confirmed by the efficient frontier analysis. Current real estate holdings are less than 2% of the Fund. Efficient frontier analysis generally indicates that the return to risk profile of the fund can be enhanced by small allocations to small cap and emerging market equities and commodity linked securities. These asset classes (including real estate) typically provide either: higher expected returns (with commensurate higher risk), and/or lower total fund volatility due to their diversification properties. Since the performance of these asset classes displays some trending behaviour, allocations are typically made on a strategic basis, rather than being specifically included in the policy asset mix benchmark. This allows a more effective response as specific asset classes move in and out of favour. Typically, allocations (including real estate) to these asset classes in aggregate may vary between 0 to 15% of the fund. As a practical matter, even small allocations necessitate a commitment for the time and resources needed to provide the focused analytical and oversight activities relating to these asset classes. Page 29
32 SECTION V. STRESS TESTS ON EQUITY CONTENT So far, our analysis has considered economic environments within the following ranges: Expected Inflation % Real Interest Rates % Economic Growth % Recall that economic growth varied inversely with real interest rates. This means that equities do well when real interests decline. We now introduce some adverse scenarios that consider: high inflation and deflation, and the combination of low real interest rates and no economic growth. Page 30
33 Equities are expected to perform poorly in all these environments. We now compare the balance sheet profiles of Mix 5 (70% equity) and the Current Policy (50% equity): Balance Sheet Risk - Mix 5 (70% Equity) Surplus ($000,000's) (200) (400) (600) (800) (1,000) (1,200) (1,400) (1,600) (1,800) 2.50% (1,265) (1,676) (183) (661) 4.15% RRB (%) 175 (1,701) (155) (610) 5.25% (335) -1.00% 1.90% 6.00% Expected Inflation (%) Balance Sheet Risk - Current Policy (50% Equity) Surplus ($000,000's) (200) (400) (600) (800) (1,000) (1,200) (1,400) (1,600) (1,800) (1,327) (505) (503) 2.50% % 580 (135) % 268 (385) -1.00% 1.90% 6.00% Expected Inflation (%) RRB (%) Page 31
34 As expected, the 70% equity policy has a higher downside risk compared to the Current Policy, given the sensitivity of equity prices to adverse economic conditions. As a matter of interest, the combination of 1% deflation, 2.50% real interest rates, and no economic growth (the lower left hand corner) is similar to the Japanese economy during the 1990 s. The impact of adverse economic conditions on a 70% equity policy would depend on how long they persist. If public policy response is successful at stimulating a recovery within a short period (say 2-4 years), the amortization mechanism of the funding policy would likely be sufficient for the system to cope. On the other hand, persistent adverse conditions over longer periods (as appears to be the case in Japan) would expose the system to much more pressure if the equity content is 70%, compared to the Current Policy. How well did the risk margin protect the system? Let s review the worst case scenario in the lower left hand corner for Mix 5. We have assumed that benefits are not reduced Consumer Prices are falling 1% a year (i.e. 1% deflation). The balance sheet position is: $Millions Assets at Market Value $7,467 Risk Adjusted Liability $9,168 Deficit $1,701 However, the economic liabilities are $7,364 ( ). There are still sufficient assets to provide all accrued obligations but annual costs will rise to replenish the risk margin that was depleted. It is recognized that claim experience may also worsen during economic dislocation. We have not attempted to include this in our analysis. With this background, some of the considerations for determining the appropriate equity content include: Equities provide higher investment returns, and lower costs under most economic environments, and especially over longer time horizons. Equities are also good long-term hedges against inflation and real wage growth (i.e. see Appendix A-1). Both factors are sources of liability growth over time. The volatility of equity return may adversely affect annual costs and benefit security. However, the greater volatility risk can be mitigated by setting appropriate risk margins (funding targets) and amortization periods within the funding policy, Page 32
35 Higher equity content does expose the system to greater risk of loss during extreme economic environments, even though the probability of such occurrences is remote, and the risk margin appears to provide adequate protection for the system. The trade-offs involved in determining the appropriate equity content will vary with the risk tolerances of the stakeholders. Page 33
36 Page 34
37 Page 35
38 Page 36
39 Page 37
40 Page 38
41 Page 39
42 Page 40
43 Page 41
44 Page 42
Implementing Portable Alpha Strategies in Institutional Portfolios
 Expected Return Investment Strategies Implementing Portable Alpha Strategies in Institutional Portfolios Interest in portable alpha strategies among institutional investors has grown in recent years as
Pension Fund Master Trust. Statement of Investment Policies and Procedures. June 24, 2016
 APPENDIX C Pension Fund Master Trust Statement of Investment Policies and Procedures June 24, 2016 Revised June 24, 2016 1 Table of Contents Preamble 3 Plan Description...4 Type of Pension Plan Nature
TESTIMONY. Manitoba Public Insurance 2017/18 GRA. Valter Viola President, Holland Park
 TESTIMONY Manitoba Public Insurance 2017/18 GRA Valter Viola President, Holland Park vviola@hollandparkrisk.com 416 819 2307 1. OVERVIEW 2. REMEDIES SYMPTOMS VS PROBLEMS 3 TERMINOLOGY 4 TRUTHS AND CONSEQUENCES
C.1. Capital Markets Research Group Asset-Liability Study Results. December 2016
 December 2016 2016 Asset-Liability Study Results Capital Markets Research Group Scope of the Project Asset/Liability Study Phase 1 Review MCERA s current investment program. Strategic allocation to broad
ASSET LIABILITY STUDY BASED ON FINANCIAL RESULTS AS AT DECEMBER 31, 2014
 ASSET LIABILITY STUDY BASED ON FINANCIAL RESULTS AS AT DECEMBER 31, 2014 June 15, 2015 Prepared by: Eckler Ltd. 3107, des Hôtels Avenue, suite 13 Quebec City, Quebec G1W 4W5 1. Executive summary This document
NOVA SCOTIA TEACHERS' PENSION FUND
 Consolidated Financial Statements of NOVA SCOTIA TEACHERS' PENSION FUND Consolidated Financial Statements Financial Statements Consolidated Statement of Net Assets Available for Benefits and Accrued Pension
August Asset/Liability Study Texas Municipal Retirement System
 August 2016 Asset/Liability Study Texas Municipal Retirement System Table of Contents ACKNOWLEDGEMENTS... PAGE 2 INTRODUCTION... PAGE 3 CURRENT STATUS... PAGE 7 DETERMINISTIC ANALYSIS... PAGE 8 DETERMINISTIC
GN47: Stochastic Modelling of Economic Risks in Life Insurance
 GN47: Stochastic Modelling of Economic Risks in Life Insurance Classification Recommended Practice MEMBERS ARE REMINDED THAT THEY MUST ALWAYS COMPLY WITH THE PROFESSIONAL CONDUCT STANDARDS (PCS) AND THAT
APPENDIX A. Financial Statements. City of Toronto Sinking Funds December 31, 2016
 APPENDIX A Financial Statements City of Toronto Sinking Funds December 31, 2016 DRAFT July @@, 2017 Independent Auditor s Report To the Members of Council of City of Toronto We have audited the accompanying
The benefits of core-satellite investing
 The benefits of core-satellite investing Contents 1 Core-satellite: A powerful investment approach 3 The key benefits of indexing the portfolio s core 6 Core-satellite methodology Core-satellite: A powerful
NATIONWIDE ASSET ALLOCATION INVESTMENT PROCESS
 Nationwide Funds A Nationwide White Paper NATIONWIDE ASSET ALLOCATION INVESTMENT PROCESS May 2017 INTRODUCTION In the market decline of 2008, the S&P 500 Index lost more than 37%, numerous equity strategies
Lazard Insights. The Art and Science of Volatility Prediction. Introduction. Summary. Stephen Marra, CFA, Director, Portfolio Manager/Analyst
 Lazard Insights The Art and Science of Volatility Prediction Stephen Marra, CFA, Director, Portfolio Manager/Analyst Summary Statistical properties of volatility make this variable forecastable to some
Portfolio Rebalancing:
 Portfolio Rebalancing: A Guide For Institutional Investors May 2012 PREPARED BY Nat Kellogg, CFA Associate Director of Research Eric Przybylinski, CAIA Senior Research Analyst Abstract Failure to rebalance
Pension Fund Master Trust
 Pension Fund Master Trust (legal name University of Toronto Master Trust ) Statement of Investment Policies and Procedures May 25, 2017 To request an official copy of this policy, contact: The Office of
CANADIAN FORCES PENSION PLAN ACCOUNT
 CANADIAN FORCES PENSION PLAN ACCOUNT AUDITORS REPORT To the Minister of National Defence We have audited the Balance Sheet of the Public Sector Pension Investment Board Canadian Forces Pension Plan Account
Public Utilities Board (PUB) 2019 GRA Information Requests on Intervener Evidence October 10, 2018
 2019 GRA Information Requests on Intervener Evidence October 10, 2018") Public Utilities Board (PUB) 2019 GRA Information Requests on Intervener Evidence October 10, 2018 Page 1 of 29 PUB (CAC) 1-1 Document: PUB Approved Issue No.: The Role of the DCAT and Interest Rate Forecasting
Public Utilities Board (PUB) 2019 GRA Information Requests on Intervener Evidence October 10, 2018 Page 1 of 29 PUB (CAC) 1-1 Document: PUB Approved Issue No.: The Role of the DCAT and Interest Rate Forecasting
Retirement. Optimal Asset Allocation in Retirement: A Downside Risk Perspective. JUne W. Van Harlow, Ph.D., CFA Director of Research ABSTRACT
 Putnam Institute JUne 2011 Optimal Asset Allocation in : A Downside Perspective W. Van Harlow, Ph.D., CFA Director of Research ABSTRACT Once an individual has retired, asset allocation becomes a critical
Workplace Safety and Insurance Board
 Workplace Safety and Insurance Board 2015 Sufficiency Report to Stakeholders Workplace Safety and Insurance Board Commission de la sécurité professionnelle et de l assurance contre les accidents du travail
Stochastic Analysis Of Long Term Multiple-Decrement Contracts
 Stochastic Analysis Of Long Term Multiple-Decrement Contracts Matthew Clark, FSA, MAAA and Chad Runchey, FSA, MAAA Ernst & Young LLP January 2008 Table of Contents Executive Summary...3 Introduction...6
Pension Fund Mastter Trust Statement of Investment Polic cies and Procedures June 2,
 Pension Fund Master Trustt Statement of Investment Policies and Procedures June 2, 2014 1 Table of Contents Preamble 3 Plan Description...4 Type of Pension Plan Nature of Plan Liabilities Investment Policies
Report on Pension Plans Registered in British Columbia AUGUST 2017
 Report on Pension Plans Registered in British Columbia AUGUST 2017 FINANCIAL INSTITUTIONS COMMISSION 2800, 555 WEST HASTINGS STREET VANCOUVER, B.C. V6B 4N6 WWW.FIC.GOV.BC.CA RECEPTION: 604 660 3555 TOLL
University of Toronto. Pension Plans. Annual Financial Report
 University of Toronto Pension Plans Annual Financial Report For the Year Ended June 30, 2006 Table of Contents Introduction...3 The University of Toronto Pension Plan ( RPP )...4 University of Toronto
APPENDIX A. Financial Statements. City of Toronto Sinking Funds December 31, 2014
 APPENDIX A Financial Statements City of Toronto Sinking Funds December 31, 2014 1 July [XX], 2015 Independent Auditor s Report To the Members of Council of City of Toronto We have audited the accompanying
Condensed Interim Consolidated Financial Statements of. Canada Pension Plan Investment Board
 Condensed Interim Consolidated Financial Statements of Canada Pension Plan Investment Board December 31, 2017 Condensed Interim Consolidated Balance Sheet December 31, 2017 December 31, 2017 March 31,
University of Toronto Pension Plan. Annual Financial Report. For the Year Ended June 30, 2017
 University of Toronto Pension Plan Annual Financial Report For the Year Ended June 30, 2017 University of Toronto Pension Plan 1 Ten-year Review (Canadian $ millions) 2017 2016 2015 2014 2013 2012 2011
Simon Fraser University Pension Plan for Administrative/Union Staff
 Actuarial Report on the Simon Fraser University Pension Plan for Administrative/Union Staff as at 31 December 2010 Vancouver, B.C. September 13, 2011 Contents Highlights and Actuarial Opinion... 1 Appendix
5000 PUBLIC PERSONAL INJURY COMPENSATION PLANS
 5000 PUBLIC PERSONAL INJURY COMPENSATION PLANS Page 5001 TABLE OF CONTENTS 5000 PUBLIC PERSONAL INJURY COMPENSATION PLANS 5001 5100 Scope... 5003 5200 Extension of scope... 5004 5300 General... 5005 5310
ACTUARIAL GUIDANCE NOTE AGN 7 DYNAMIC SOLVENCY TESTING
 ACTUARIAL GUIDANCE NOTE AGN 7 DYNAMIC SOLVENCY TESTING Introduction.....2 Part I Requirements. 2 1. Scope..2 2. Investigation...2 3. Method...3 3.1 Current Financial Position....3 3.2 Dynamic Solvency
The Case for TD Low Volatility Equities
 The Case for TD Low Volatility Equities By: Jean Masson, Ph.D., Managing Director April 05 Most investors like generating returns but dislike taking risks, which leads to a natural assumption that competition
NOVA SCOTIA TEACHERS' PENSION PLAN
 Financial Statements of NOVA SCOTIA TEACHERS' PENSION PLAN KPMG LLP Telephone (902) 492-6000 Chartered Accountants Fax (902) 429-1307 Purdy's Wharf Tower One Internet www.kpmg.ca 1959 Upper Water Street,
CFA Level III - LOS Changes
 CFA Level III - LOS Changes 2016-2017 Ethics Ethics Ethics Ethics Ethics Ethics Ethics Ethics Topic LOS Level III - 2016 (332 LOS) LOS Level III - 2017 (337 LOS) Compared 1.1.a 1.1.b 1.2.a 1.2.b 2.3.a
University of Toronto Pension Plan. Annual Financial Report. For the Year Ended June 30, 2016
 University of Toronto Pension Plan Annual Financial Report For the Year Ended June 30, 2016 University of Toronto Pension Plan 1 Eleven-year Review (Canadian $ millions) 2016 2015 2014 2013 2012 2011 2010
Subject CA1 Actuarial Risk Management
 Institute of Actuaries of India Subject CA1 Actuarial Risk Management For 2018 Examinations Subject CA1 Actuarial Risk Management Syllabus Aim The aim of the Actuarial Risk Management subject is that upon
Reviewing Common Investment Terms
 BMO NESBITT BURNS Reviewing Common Investment Terms Having a firm understanding of common financial terms helps ensure that you stay well informed about your portfolio s progress and positioning. This
Two paths, one destination
 NEW THINKING Two paths, one destination Helping to decide whether to de-risk internally or fully transfer pension risk Fixed income yields rose during the second half of 2017, and rate-rise expectations
2014 Semi-Annual Management Report of Fund Performance
 (the Fund ) For the period ended March 31, 2014 Manager: BMO Investments Inc. (the Manager ) Portfolio manager: BMO Asset Management Inc., Toronto, Ontario (the portfolio manager ) 2014 Semi-Annual Management
Looking Ahead PROJECTING ONTARIO S PENSION BENEFITS GUARANTEE FUND
 Looking Ahead PROJECTING ONTARIO S PENSION BENEFITS GUARANTEE FUND The Pension Benefits Guarantee Fund (PBGF) is governed by the Ontario Pension Benefits Act ( the Act ) and regulations made under the
RBC Dominion Securities Inc. Client Risk Profile Questionnaire (CAD)
") Client Risk Profile Questionnaire (CAD) Introduction Preamble To work with you effectively in identifying and implementing an appropriate investment strategy, it is essential that we clearly understand
Client Risk Profile Questionnaire (CAD) Introduction Preamble To work with you effectively in identifying and implementing an appropriate investment strategy, it is essential that we clearly understand
5000 Public Personal Injury Compensation Plans
 5000 Public Personal Injury Compensation Plans Page 5001 Table of Contents 5000 Public Personal Injury Compensation Plans.5001 5100 Scope... 5003 5200 Valuation for Financial Reporting Purposes... 5004
eastsussex.gov.uk Investment Strategy Statement
 eastsussex.gov.uk Investment Strategy Statement September 2018 Introduction and background This is the Investment Strategy Statement ( ISS ) of the East Sussex Pension Fund ( the Fund ), which is administered
Destinations INVESTOR GUIDE. Multi-asset class solutions to meet a range of investor needs. Dynamic portfolios constructed from mutual funds
 multi-asset class, dynamic portfolios are designed to deliver consistent returns over the long-term and help individuals stay invested. Risk-based portfolios INVESTOR GUIDE Income-focused portfolios CONSERVATIVE
PUBLIC SERVICE SUPERANNUATION PLAN
 Financial Statements of PUBLIC SERVICE SUPERANNUATION PLAN 2016-2017 Nova Scotia Public Service Superannuation Plan Annual Report 20 KPMG LLP Telephone (902) 492-6000 Suite 1500 Purdy s Wharf Tower 1 Fax
REVISED PENSION PLAN OF QUEEN S UNIVERSITY
 Fund Financial Statements of REVISED PENSION PLAN OF QUEEN S UNIVERSITY Fund Financial Statements Page Independent Auditors' Report 1 Statement of Net Assets Available for Benefits 3 Statement of Changes
FUNDS TM. Currency Funds: White Paper. Special Case International Bond Funds. The Authority on Currencies. Merk Investments LLC Research February 2012
 White Paper Merk Investments LLC Research February 2012 Currency Funds: Special Case International Bond Funds FUNDS TM The Authority on Currencies Currency Funds May Help Mitigate Interest and Credit Risk
Note 22: Employee Compensation Pension and Other Employee Future Benefits
 Note 22: Employee Compensation Pension and Other Employee Future Benefits Pension and Other Employee Future Benefit Plans We sponsor a number of arrangements globally, with the largest of such arrangements
Financial Statements. To the Minister of Public Safety
 ROYAL CANADIAN MOUNTED POLICE PENSION PLAN ACCOUNT Financial Statements INDEPENDENT AUDITORS REPORT To the Minister of Public Safety Report on the Financial Statements We have audited the accompanying
Canada Post Corporation Registered Pension Plan Financial Statements
 Canada Post Corporation Registered Pension Plan 2013 Financial Statements Table of Contents Management s Responsibility for Financial Reporting... 1 Actuaries Opinion... 2 Independent Auditors Report...
First Quarter Results
 First Quarter 2018 Results Here to help When an injury or illness happens on the job, we move quickly to provide wage-loss benefits, medical coverage and help getting back to work. We cover over five million
APPENDIX A. Financial Statements. City of Toronto Sinking Funds December 31, 2011
 APPENDIX A Financial Statements City of Toronto Sinking Funds December 31, 2011 July [x], 2012 Independent Auditor s Report To the Chair of the City of Toronto Sinking Funds Committee We have audited the
Financialfacts. London Life participating life insurance. Accountability Strength Performance
 2013 Financialfacts London Life participating life insurance Accountability Strength Performance This guide provides key financial facts about the management, strength and performance of the London Life
John and Margaret Boomer
 Retirement Lifestyle Plan Includes Insurance and Estate - Using Projected Returns John and Margaret Boomer Prepared by : Sample Report June 06, 2012 Table Of Contents IMPORTANT DISCLOSURE INFORMATION 1-9
INSURANCE. Life Insurance. as an. Asset Class
 INSURANCE Life Insurance as an Asset Class 16 FORUM JUNE / JULY 2013 Permanent life insurance has always been an exceptional estate planning tool, but as Wayne Miller and Sally Murdock report, it has additional
Certification Examination Detailed Content Outline
 Certification Examination Detailed Content Outline Certification Examination Detailed Content Outline Percentage of Exam I. FUNDAMENTALS 15% A. Statistics and Methods 5% 1. Basic statistical measures (e.g.,
Why Evolution Private Managed Accounts?
 Advisor Guide Why Evolution Private Managed Accounts? Be empowered by an innovative solution tailor-made for your clients. Experience holistic wealth management customized to meet your clients needs today
Series A, Advisor Series, Advisor T5 Series, Series T, Series T5, Series T8, Series H, Series D, Series F, Series FT5, Series I and Series O units
 RBC FUNDS AND RBC PRIVATE POOLS SIMPLIFIED PROSPECTUS Series A, Advisor Series, Advisor T5 Series, Series T, Series T5, Series T8, Series H, Series D, Series F, Series FT5, Series I and Series O units
Management s Responsibility for Financial Reporting
 ONTARIO TEACHERS PENSION PLAN 2009 ANNUAL REPORT 69 Management s Responsibility for Financial Reporting The consolidated financial statements of the Ontario Teachers Pension Plan have been prepared by
2015 Financialfacts. London Life participating life insurance ACCOUNTABILITY STRENGTH PERFORMANCE
 2015 Financialfacts London Life participating life insurance ACCOUNTABILITY STRENGTH PERFORMANCE This guide provides key financial facts about the management, strength and performance of the London Life
2017 Capital Market Assumptions and Strategic Asset Allocations
 2017 Capital Market Assumptions and Strategic Asset Allocations Tracie McMillion, CFA Head of Global Asset Allocation Chris Haverland, CFA Global Asset Allocation Strategist Stuart Freeman, CFA Co-Head
Operating and Endowment Fund
 Operating and Endowment Fund Statement of Investment Objectives, Policies and Governance (MAPP 2.26) Revised November 2017 TABLE OF CONTENTS Section 1 Purpose and Background 1.1 Introduction... 1 1.2 Description
FACILITY ASSOCIATION RESIDUAL MARKET SEGMENT
 Financial Statements of FACILITY ASSOCIATION Deloitte & Touche LLP Brookfield Place 181 Bay Street Suite 1400 Toronto ON M5J 2V1 Canada Tel: 416-601-6150 Fax: 416-601-6151 www.deloitte.ca Auditors Report
Norfolk Mutual Insurance Company. Financial Statements December 31, 2016
 Financial Statements December 31, 2016 Index to Financial Statements December 31, 2016 MANAGEMENT'S RESPONSIBILITY FOR FINANCIAL REPORTING 1 Page INDEPENDENT AUDITORS' REPORT 2 FINANCIAL STATEMENTS Statement
Asset Liability Management for Defined Benefit Plans. May 22, 2014
 Asset Liability Management for Defined Benefit Plans May 22, 2014 Introduction The most important strategic investment decision for a pension plan is asset allocation A research study by Brinson, Hood,
Asset Liability Modelling (ALM) Approaches, Techniques, Trends In the Pension Practice
 Approaches, Techniques, Trends In the Pension Practice") Asset Liability Modelling (ALM) Approaches, Techniques, Trends In the Pension Practice Chris Brisebois, FSA, FCIA, CFA CIA Investment Seminar Agenda 2 Background ALM in a pension fund context Modeling
Asset Liability Modelling (ALM) Approaches, Techniques, Trends In the Pension Practice Chris Brisebois, FSA, FCIA, CFA CIA Investment Seminar Agenda 2 Background ALM in a pension fund context Modeling
INTERACTIVE BROKERS CANADA INC. (a wholly-owned subsidiary of IBG LLC)
") Financial statements of INTERACTIVE BROKERS CANADA INC. (a wholly-owned subsidiary of IBG LLC) December 31, 2016 and December 31, 2015 Table of contents Independent Auditor s report... 1 Statements of
Financial statements of INTERACTIVE BROKERS CANADA INC. (a wholly-owned subsidiary of IBG LLC) December 31, 2016 and December 31, 2015 Table of contents Independent Auditor s report... 1 Statements of
Liability Driven Investing: Best Practice, Buzzword or Baby with a Future?
 Liability Driven Investing: Best Practice, Buzzword or Baby with a Future? October 16, 2007 Society of Actuaries 2007 Annual Meeting Damon Williams, Vice President Phillips, Hager & North Investment Management
Alberta Heritage Savings Trust Fund. SECOND QUARTER UPDATE For the six months ended September 30, 2008
 Alberta Heritage Savings Trust Fund SECOND QUARTER UPDATE For the six months ended September 30, 2008 Alberta Finance and Enterprise Alberta Heritage Savings Trust Fund September 30, 2008 C O N T E N T
This session will use polling.
 This session will use polling. Access via: VCIA s Conference App or www.vcia.cnf.io 3 OR 2 1 Go to the Polling Icon on the VCIA App Go to www.vcia.cnf.io Click on the session you would like to join. 1.
ASSET ALLOCATION AND THE EQUITY RISK PREMIUM
 ASSET ALLOCATION AND THE EQUITY RISK PREMIUM Canada Pension Plan Seminar on Demographic, Economic and Investment Perspectives for Canada May 2, 2003 Zainul Ali, Vice President Strategic Research & Risk
RESOLUTION AUTHORIZES THE ADOPTION OF A PENSION FUNDING POLICY FOR THE DELAWARE RIVER AND BAY AUTHORITY EMPLOYEES RETIREMENT PLAN
 10940. RESOLUTION 15-07 - AUTHORIZES THE ADOPTION OF A PENSION FUNDING POLICY FOR THE DELAWARE RIVER AND BAY AUTHORITY EMPLOYEES RETIREMENT PLAN WHEREAS, The Delaware River and Bay Authority ( the Authority
Federal Home Loan Bank of Des Moines. A Case for Diversifying the Right-Hand Side of the Balance Sheet
 Federal Home Loan Bank of Des Moines A Case for Diversifying the Right-Hand Side of the Balance Sheet 1 Agenda 1. YIELD CURVE FUNDING STRATEGIES 2. BUILDING A CASE FOR FUNDING DIVERSIFICATION 3. BLENDED
HSBC World Index Portfolios
 HSBC World Index Portfolios A range of multi-asset passive portfolios World Index. One World. One Investment For professional clients only December 2012 We understand your business is changing The advisory
STATEMENT OF INVESTMENT POLICIES, STANDARDS AND PROCEDURES FOR ASSETS MANAGED BY THE PUBLIC SECTOR PENSION INVESTMENT BOARD
 STATEMENT OF INVESTMENT POLICIES, STANDARDS AND PROCEDURES FOR ASSETS MANAGED BY THE PUBLIC SECTOR PENSION INVESTMENT BOARD As approved by the Board of Directors on November 10, 2017 TABLE OF CONTENTS
Evaluating the Selection Process for Determining the Going Concern Discount Rate
 By: Kendra Kaake, Senior Investment Strategist, ASA, ACIA, FRM MARCH, 2013 Evaluating the Selection Process for Determining the Going Concern Discount Rate The Going Concern Issue The going concern valuation
Overview of Asset/Liability Process. City of Jacksonville Police & Fire Pension Fund
 Overview of Asset/Liability Process City of Jacksonville Police & Fire Pension Fund February 9, 2018 Overview of the Asset/Liability Study An asset/liability study incorporates all facets of the asset
Direxion/Wilshire Dynamic Asset Allocation Models Asset Management Tools Designed to Enhance Investment Flexibility
 Daniel D. O Neill, President and Chief Investment Officer Direxion/Wilshire Dynamic Asset Allocation Models Asset Management Tools Designed to Enhance Investment Flexibility Executive Summary At Direxion
METROPOLITAN TORONTO PENSION PLAN REPORT ON THE ACTUARIAL VALUATION FOR FUNDING PURPOSES AS AT DECEMBER 31, 2016 APRIL 2017
 GM21.6 Attachment 1 Attachment 1 REPORT ON THE ACTUARIAL VALUATION FOR FUNDING PURPOSES AS AT DECEMBER 31, 2016 APRIL 2017 Financial Services Commission of Ontario Registration Number: 0351577 Canada Revenue
May 13, DB Pension Plan Funding: Sustainability Requires a New Model
 May 13, 2014 ACPM CONTACT INFORMATION Mr. Bryan Hocking Chief Executive Officer Association of Canadian Pension Management 1255 Bay Street, Suite 304 Toronto ON M5R 2A9 Tel: 416-964-1260 ext. 225 Fax:
INTERACTIVE BROKERS CANADA INC. (a wholly-owned subsidiary of IBG LLC)
") Financial statements of INTERACTIVE BROKERS CANADA INC. (a wholly-owned subsidiary of IBG LLC) December 31, 2017 and December 31, 2016 Table of contents Independent Auditor s Report... 1 Statements of
Financial statements of INTERACTIVE BROKERS CANADA INC. (a wholly-owned subsidiary of IBG LLC) December 31, 2017 and December 31, 2016 Table of contents Independent Auditor s Report... 1 Statements of
DIVERSIFIED EQUITY FUND REVIEW
 DIVERSIFIED EQUITY FUND REVIEW Small Cap Equities JOINT PENSION BOARD PRINCIPLES CHOICE FAIRNESS LIQUIDITY WELL INFORMED DECISIONS Adding small cap equities doesn t increase or reduce the choice available
Financial Statements of FACILITY ASSOCIATION ONTARIO RISK SHARING POOL
 Financial Statements of FACILITY ASSOCIATION Table of Contents October 31, 2017 Independent Auditor s Report 1 Appointed Actuary s Report 3 Statement of Financial Position 4 Statement of Operations 5 Statement
DURATION MATCHING DISCUSSION PAPER
 0 RATE APPLICATION 0 0 0 DURATION MATCHING DISCUSSION PAPER In the most recent PUB Order / from December 0, it was ordered that: MPI shall submit a discussion paper of the duration matching of its claims
CFA Level III - LOS Changes
 CFA Level III - LOS Changes 2017-2018 Ethics Ethics Ethics Ethics Ethics Ethics Ethics Topic LOS Level III - 2017 (337 LOS) LOS Level III - 2018 (340 LOS) Compared 1.1.a 1.1.b 1.2.a 1.2.b 2.3.a 2.3.b 2.4.a
Sustainable Spending for Retirement
 What s Different About Retirement? RETIREMENT BEGINS WITH A PLAN TM Sustainable Spending for Retirement Presented by: Wade Pfau, Ph.D., CFA Reduced earnings capacity Visible spending constraint Heightened
February 11, Review of Alberta Automobile Insurance Experience. as of June 30, 2004
 February 11, 2005 Review of Alberta Automobile Insurance Experience as of June 30, 2004 Contents 1. Introduction and Executive Summary...1 Data and Reliances...2 Limitations...3 2. Summary of Findings...4
Sprott 2017 Flow- Through L.P. Interim Report to Unitholders
 Sprott 2017 Flow- Through L.P. Interim Report to Unitholders JUNE 30 2017 Sprott 2017 Flow-Through L.P. June 30, 2017 Table of Contents Interim Management Report of Fund Performance 3 Unaudited Interim
Andrew Falde s Strategy Set Theory Updated 2/19/2016
 Andrew Falde s Strategy Set Theory Updated 2/19/2016 Core Concept The following ideas revolve around one core concept: Intelligent combinations of simple strategies should be more effective than elaborate
March 2007 KYRGYZ REPUBLIC: JOINT BANK-FUND DEBT SUSTAINABILITY ANALYSIS
 March 27 KYRGYZ REPUBLIC: JOINT BANK-FUND DEBT SUSTAINABILITY ANALYSIS The staff s debt sustainability analysis (DSA) suggests that the Kyrgyz Republic s external debt continues to pose a heavy burden,
20% 20% Conservative Moderate Balanced Growth Aggressive
 The Global View Tactical Asset Allocation series offers five risk-based model portfolios specifically designed for the Retirement Account (PCRA), which is a self-directed brokerage account option offered
Community Trust Company Basel III Pillar 3 Disclosures December 31, 2017
 Community Trust Company Basel III Pillar 3 Disclosures December 31, 2017 Basel III Pillar 3 Disclosures Page 1 of 18 Contents Part 1 - Scope of Application... 3 Basis of preparation... 3 Significant subsidiaries...
Exchange Traded Fund Strategies
 Exchange Traded Fund Strategies 221 W. 6 th Street, Suite 1210 Austin, Texas 78701 Phone 512.477.3110 Fax 512.472.1046 Teresa Finney Senior Vice President, Investments Richard A. Funk, CFP First Vice President,
Technical Guide. Issue: forecasting a successful outcome with cash flow modelling. To us there are no foreign markets. TM
 Technical Guide To us there are no foreign markets. TM The are a unique investment solution, providing a powerful tool for managing volatility and risk that can complement any wealth strategy. Our volatility-led
PUBLIC SERVICE PENSION PLAN ACCOUNT
 FINANCIAL STATEMENTS Independent Auditors Report To the President of the Treasury Board Report on the Financial Statements We have audited the accompanying financial statements of the Public Sector Pension
Quarterly Report to Shareholders. Second Quarter Results
 Quarterly Report to Shareholders Second Quarter Results For the period ended, 2017 E1138(6/17)-6/17 Quarterly Report to Shareholders For cautionary notes regarding forward-looking information and non-ifrs
First Quarter Report 2011
 First Quarter Report 2011 REPORT TO MEMBERS CENTRAL 1 REPORTS STRONG RESULTS FOR FIRST QUARTER OF 2011 First quarter highlights compared to the same period last year: Central s Profit for the period of
Debt Management Strategy
 Debt Management Strategy 2003 2004 Debt Management Strategy 2003 2004 Department of Finance Canada Ministère des Finances Canada Her Majesty the Queen in Right of Canada (2003) All rights reserved All
Diversified Growth Funds IIES 2017
 Diversified Growth Funds IIES 2017 Agenda Background Overview of Diversified Growth Funds (DGFs) DGF Example & Comparison Appendix 1 Background A Challenging Environment Has Led to New Investor Realities
FUNDAMENTALS OF THE BOND MARKET
 FUNDAMENTALS OF THE BOND MARKET Bonds are an important component of any balanced portfolio. To most they represent a conservative investment vehicle. However, investors purchase bonds for a variety of
The purpose of this paper is to briefly review some key tools used in the. The Basics of Performance Reporting An Investor s Guide
 Briefing The Basics of Performance Reporting An Investor s Guide Performance reporting is a critical part of any investment program. Accurate, timely information can help investors better evaluate the
Fact Sheet User Guide
 Fact Sheet User Guide The User Guide describes how each section of the Fact Sheet is relevant to your investment options research and offers some tips on ways to use these features to help you better analyze
LDI Risk Management Metrics
 LDI Risk Management Metrics Introduction Corporations that sponsor defined benefit pension plans have increasingly been considering liability-driven investment (LDI) strategies as an approach to manage