VILLAGE OF. Illinois. Financial Planning & Reporting Process. Planning. Reporting. Annual Budget. Monthly Treasurer's Report
|
|
|
- Prosper Dalton
- 5 years ago
- Views:
Transcription


 Prepared By: Finance Department Presented:")
1 VILLAGE OF Illinois Financial Planning & Reporting Process Planning Planning Planning Reporting Reporting Reporting Multi-Year Financial Forecast Multi-Year Capital Plan Annual Budget Monthly Treasurer's Report Annual Financial Report (Audit) Popular Annual Financial Report Multi-Year Financial Forecast Fiscal Years (May 1, 2014 April 30, 2020) Prepared By: Finance Department Presented: November 18, 2013
2 This page intentionally left blank ii P a g e
3 Table of Contents TABLE OF CONTENTS... 3 FORECAST OVERVIEW... 5 Purpose... 5 Document Overview... 5 Forecast Structure... 5 Forecast Process... 7 Key Assumptions... 8 MAJOR REVENUES Major Revenues Summary Sales Tax Home Rule Sales Tax Property Taxes Income Tax Use Tax Utility Taxes Water & Sewer Fees Motor Fuel Tax MAJOR EXPENDITURES Full-Time Salaries Pensions Health Insurance Liability & Workers Compensation Insurance Debt Service Dispatching Services Legal Fuel Vehicles & Equipment Water Supply FINANCIAL FORECASTS Risk Management Fund Equipment Replacement Fund GO Debt Service Fund General Capital Projects Fund General Fund Water & Sewer Funds 11, 12, Motor Fuel Tax Fund DEBT FORECAST Summary Year Forecast Year Forecast CAPITAL FUNDING FORECAST Summary Year Forecast Year Forecast P a g e
4 This page intentionally left blank 4 P a g e
5 Forecast Overview Purpose The Village of Round Lake Beach Multi-Year Financial Forecast (Forecast) is herein presented for the period May 1, 2014 through April 30, The purpose of the Forecast is to promote discussion and analysis regarding the impact of financial trends on the Village s strategic and capital planning processes. The Forecast is intended to be used as one of the many tools to assist Village leaders in the strategic planning process. The Forecast is prepared and discussed prior to the Annual Budget Process and updated with approved budget figures and presented as an appendix to the Annual Budget, as such the Forecast does not include all of the detail on revenues and expenditures otherwise found in the Annual Budget Document. Document Overview The Forecast document includes the following sections; Forecast Overview This section provides background information on the purpose and methodologies used in the Forecast. Readers can also find detailed information on the funds and assumptions included in the Forecast. Major Revenues This section provides detail on forecasts for major revenues. Major Expenditures This section provides detail on forecasts of major expenditures. Financial Forecasts This section provides forecasted revenue and expenditure statements for all funds included in the forecast. Debt Forecast This section includes information on the Village s current and anticipated General Obligation Debt. Capital Funding Forecast This section provides information regarding available funding for future capital projects. Forecast Structure The Forecast is presented for the Village s two main operating and related funds (General and Water & Sewer) and the Motor Fuel Tax Fund. Forecasts are presented individually for the General Fund and related funds due to the nature of shared resources used to support the activities contained in the funds. The Motor Fuel Tax Fund is included due to the relationship to funding capital and infrastructure programs, but does not share resources with the General Fund group or Water & Sewer Funds. The following graphic depicts those funds included in the Multi-Year Financial forecast. 5 P a g e


6 General & Related Funds General Fund - 01 Risk Management Fund - 26 Equipment Replacement Fund - 27 Debt Service Fund - 70 General Capital Fund - 85 Water & Sewer Funds Water & Sewer Operating Fund - 11 Water Capital Fund - 12 Sewer Capital Fund - 13 Motor Fuel Tax Fund Motor Fuel Tax Fund - 21 The Forecast is generally presented on a cash basis except where noted. Certain forecasts are presented with 5-years of history including the current budget, preliminary upcoming budget year and then forecasted 5-years out to give the reader historical perspective when reviewing projections. Major revenues are displayed in 3 scenarios, a conservative model, a baseline model and an aggressive model to show the range of potential changes in revenues. Major expenses are shown using only one model as they are more predictable and less influenced by outside factors. Many Village revenue streams are influenced by national and regional economic factors, and thus it is important for the readers of the Forecast to understand the figures are based on a range of assumptions and used to shape strategic financial and capital planning discussions. The Forecast takes into account all available economic data available at the time of creation including but not limited to National, Regional and Local economic indicators such as commodity prices, economic reports, legislative changes, employment and housing statistics and local economic activity. 6 P a g e
7 Forecast Process The Financial Forecast is one part of the Village s strategic planning process. More information on this process can be found in the Financial Planning & Reporting Cycle section of the Annual Budget document. The Forecast is key to outlining the parameters for the upcoming budget preparation process. The forecasting process begins in October by updating current year end projections. A Forecast is then presented and discussed with the Village Board. Feedback from the discussion is then incorporated into the Forecast and brought back to the Board for further discussion if needed. Following the preparation of the budget, the Forecast is updated with approved budget figures as the starting point and presented as an appendix to the Annual Budget document. Presenting the Forecast with the Budget Document allows readers to understand the adjustments made to balance the budget from the initial Forecast projections. The graphic below outlines the forecasting process. October MYFF Updated with year-end projections and presented to the Mayor and Village Board November Feedback is incorporated into the MYFF If needed, the updated MYFF is presented to the Mayor and Village Board December - January Preparation of the Annual Budget Proposed budget incorporated into the MYFF February Proposed budget and MYFF discussed in Mayor & Trustee meetings March Final Budget approval Final Budget figures incporporated into MYFF and presented in the appendix of the formal Budget 7 P a g e
8 Key Assumptions Inflation Factors The Village uses the Consumer Price Index for All Urban Consumers as reported by the U.S. Department of Labor, Bureau of Labor Statistics as the base for inflationary increases. Rolling averages are used to smooth the effects of large fluctuations in sales tax, home rule sales tax and use tax. The averaging also reflects the lag between current conditions and the timing of the impact on the Village revenue stream. CY2010 CY2011 CY2012 CY2013 CY2014 CY2015 CY2016 CY2017 CY2018 CY2019 CY2020 *Consumer Price Index - All Urban Consumers (USDL Bureau of Labor Statistics) Base CPI (Tax Cap) 1.50% 3.00% 1.70% 2.00% 2.00% 3.00% 3.00% 3.00% 3.00% 3.00% 3.00% 3-Year Rolling 1.43% 2.40% 2.07% 2.23% 1.90% 2.33% 2.67% 3.00% 3.00% 3.00% 3.00% 5-Year Rolling 2.18% 2.28% 1.80% 2.18% 2.04% 2.34% 2.34% 2.60% 2.80% 3.00% 3.00% Equalized Assessed Valuation Equalized Assessed Valuation (EAV) is the basis for the Village s property tax levy. The tax levy lags the fiscal year by 2 years. Therefore, the tax year 2013 levy will be collected in. The following chart depicts projected EAV by tax and fiscal year. Tax Year Fiscal Year * ** %Change 3.25% -0.11% 0.53% -9.13% % -7.00% 0.00% 1.00% 2.00% 3.00% 3.00% EAV 442,120, ,613, ,957, ,430,435 $343,483,979 $319,440,100 $319,440,100 $322,634,501 $329,087,192 $338,959,807 $349,128, ,000, ,000, ,000, ,000, ,000, ,000, ,000, ,000, ,000,000 Equalized Assessed Valuation * ** *Includes $17,921,187 of recovered TIF EAV **Includes $14,180,342 of receovered TIF EAV 8 P a g e
9 Personnel Personnel costs account for a large majority of Village operating expenses. For purposes of forecasting personnel costs the following assumptions are used; Current staffing levels remain throughout the forecast period Fraternal Order of Police (FOP) employees retire following the 25th year of service Illinois Municipal Retirement Fund (IMRF) employees retire following the 30th year of service A cost of living increase of 2.5% throughout the forecast period No change in part-time personnel The following chart depicts full time positions for the forecast period. Department/Division/Position Budget Administration/Civic Center Economic Development Finance Police Administration Patrol Investigations/SOU Public Works Total Full Time Employees % Change -3.03% -7.29% -2.25% -1.15% -3.49% 0.00% 0.00% 0.00% 0.00% 0.00% 0.00% Vs % % % % % % % % % % % Budget Economic Development Finance Police Public Works Administration/Civic Center 9 P a g e
10 Major Revenues Major Revenues Summary The Village maintains a diverse revenue base to protect itself from fluctuations in any one major revenue source. Major revenues account for the main funding mechanism for the General Fund (01), Water & sewer Funds (11, 12, 13), Motor Fuel Tax Fund (21), Risk Management Fund (26), Equipment Replacement Fund (27), Debt Service Fund (70), and General Capital Fund (85). The Village prioritizes the use of unrestricted major revenue resources to ensure essential operations and debt service obligations can be met prior to funding capital. More information on major revenues can be found in the Major Revenues section of the Village s Annual Budget document. Further Detail on funding and expenditures for capital projects can be found in the Village s Multi-Year Capital Plan. Major revenue sources include; Sales Taxes Home Rule Sales Taxes Property Taxes Income and Use Taxes Utility Taxes Amusement Tax Motor Fuel Tax Water Charges & Fees Sewer Charges & Fees In addition to these revenues, the Village also receives revenue from Interest Income, other Intergovernmental Revenues, Licensing & Permits, Charges for Service, and Fines & Penalties. Major general revenues (non-water & Sewer) are forecasted using three models, conservative, baseline and aggressive. The Baseline model is intended to reflect inflationary growth, the Conservative model is intended to reflect projections missing inflationary growth estimates by a given percentage based on historical volatility, and the aggressive model reflects growth above inflation by a given percentage. The models also reflect known non-inflationary factors that may impact the particular revenue stream. Water & Sewer revenues are forecasted based on historical averages and codified rate adjustments. The Following charts summarize the forecast for all major general revenues using the three different scenarios. 10 P a g e
11 Historical Data Conservative Model Sales Tax $3,108,023 $3,102,401 $3,321,053 $3,443,645 $3,453,605 $3,330,000 $3,341,000 $3,453,000 $3,646,000 $3,857,000 $3,896,000 $3,935,000 HR Sales Tax $1,086,898 $1,074,314 $1,153,875 $1,195,397 $1,203,832 $1,155,000 $1,158,927 $1,197,635 $1,264,703 $1,338,055 $1,351,436 $1,364,950 Property Tax $2,213,890 $2,347,661 $2,402,378 $2,410,688 $2,411,187 $2,411,258 $2,428,136 $2,452,418 $2,501,466 $2,551,495 $2,602,525 $2,654,576 Income Tax $2,277,287 $1,994,423 $2,001,151 $2,387,157 $2,665,846 $2,535,750 $2,535,750 $2,561,108 $2,586,719 $2,612,586 $2,638,712 $2,665,099 Use Tax $349,217 $309,103 $356,288 $411,422 $448,787 $464,888 $467,677 $471,418 $476,132 $480,894 $485,703 $490,560 Utility Tax-Phone $753,911 $852,943 $755,045 $716,459 $703,800 $624,006 $592,806 $569,093 $557,712 $546,557 $535,626 $524,914 Utility Tax-Electric $581,115 $550,660 $603,141 $568,739 $570,000 $550,000 $539,000 $528,220 $517,656 $507,302 $497,156 $487,213 Utility Tax-Natural Gas $383,428 $270,095 $266,183 $290,985 $264,000 $300,000 $294,000 $288,120 $282,358 $276,710 $271,176 $265,753 Amusement Tax $231,817 $253,761 $232,681 $250,090 $243,250 $265,000 $265,000 $265,000 $265,000 $265,000 $265,000 $265,000 Total Major Revenues $10,985,586 $10,755,361 $11,091,795 $11,674,582 $11,964,307 $11,635,901 $11,622,296 $11,786,012 $12,097,745 $12,435,601 $12,543,335 $12,653,064 % Change from Prior Year -2.10% 3.13% 5.25% 2.48% -2.74% -0.12% 1.41% 2.64% 2.79% 0.87% 0.87% Historical Data Baseline Model Sales Tax $3,108,023 $3,102,401 $3,321,053 $3,443,645 $3,453,605 $3,330,000 $3,408,000 $3,590,000 $3,863,000 $4,164,000 $4,289,000 $4,418,000 HR Sales Tax $1,086,898 $1,074,314 $1,153,875 $1,195,397 $1,203,832 $1,155,000 $1,182,027 $1,245,147 $1,339,778 $1,444,281 $1,487,610 $1,532,238 Property Tax $2,213,890 $2,347,661 $2,402,378 $2,410,688 $2,411,187 $2,411,258 $2,452,249 $2,501,294 $2,576,333 $2,653,623 $2,733,231 $2,815,228 Income Tax $2,277,287 $1,994,423 $2,001,151 $2,387,157 $2,665,846 $2,535,750 $2,586,465 $2,664,059 $2,743,981 $2,826,300 $2,911,089 $2,998,422 Use Tax $349,217 $309,103 $356,288 $411,422 $448,787 $464,888 $476,975 $490,330 $505,040 $520,191 $535,797 $551,871 Utility Tax-Phone $753,911 $852,943 $755,045 $716,459 $703,800 $624,006 $605,286 $593,180 $593,180 $593,180 $593,180 $593,180 Utility Tax-Electric $581,115 $550,660 $603,141 $568,739 $570,000 $550,000 $550,000 $550,000 $550,000 $550,000 $550,000 $550,000 Utility Tax-Natural Gas $383,428 $270,095 $266,183 $290,985 $264,000 $300,000 $300,000 $300,000 $300,000 $300,000 $300,000 $300,000 Amusement Tax $231,817 $253,761 $232,681 $250,090 $243,250 $265,000 $270,300 $275,706 $281,220 $286,845 $292,581 $298,433 Total Major Revenues $10,985,586 $10,755,361 $11,091,795 $11,674,582 $11,964,307 $11,635,901 $11,831,301 $12,209,716 $12,752,532 $13,338,420 $13,692,488 $14,057,372 % Change from Prior Year -2.10% 3.13% 5.25% 2.48% -2.74% 1.68% 3.20% 4.45% 4.59% 2.65% 2.66% Historical Data Aggressive Model Sales Tax $3,108,023 $3,102,401 $3,321,053 $3,443,645 $3,453,605 $3,330,000 $3,475,000 $3,730,000 $4,088,000 $4,489,000 $4,713,000 $4,949,000 HR Sales Tax $1,086,898 $1,074,314 $1,153,875 $1,195,397 $1,203,832 $1,155,000 $1,205,127 $1,293,583 $1,417,767 $1,556,709 $1,634,544 $1,716,271 Property Tax $2,213,890 $2,347,661 $2,402,378 $2,410,688 $2,411,187 $2,411,258 $2,476,361 $2,550,652 $2,652,678 $2,758,786 $2,869,137 $2,983,902 Income Tax $2,277,287 $1,994,423 $2,001,151 $2,387,157 $2,665,846 $2,535,750 $2,637,180 $2,769,039 $2,907,491 $3,052,865 $3,205,509 $3,365,784 Use Tax $349,217 $309,103 $356,288 $411,422 $448,787 $464,888 $486,272 $509,613 $535,094 $561,849 $589,941 $619,438 Utility Tax-Phone $753,911 $852,943 $755,045 $716,459 $703,800 $624,006 $617,766 $617,766 $630,121 $642,724 $655,578 $668,690 Utility Tax-Electric $581,115 $550,660 $603,141 $568,739 $570,000 $550,000 $561,000 $572,220 $583,664 $595,338 $607,244 $619,389 Utility Tax-Natural Gas $383,428 $270,095 $266,183 $290,985 $264,000 $300,000 $306,000 $312,120 $318,362 $324,730 $331,224 $337,849 Amusement Tax $231,817 $253,761 $232,681 $250,090 $243,250 $265,000 $275,600 $286,624 $298,089 $310,013 $322,413 $335,310 Total Major Revenues $10,985,586 $10,755,361 $11,091,795 $11,674,582 $11,964,307 $11,635,901 $12,040,307 $12,641,618 $13,431,268 $14,292,012 $14,928,591 $15,595,633 % Change from Prior Year -2.10% 3.13% 5.25% 2.48% -2.74% 3.48% 4.99% 6.25% 6.41% 4.45% 4.47% 11 P a g e

12 12 P a g e
13 Sales Tax Sales tax projections assume inflationary increases based on a 5-year rolling average. Over the last 5 fiscal years ( ), sales tax has grown an average of 1.94%. The spread between the Baseline model and the conservative and aggressive models is +/-2%. Non-inflationary factors impacting sales taxes are; Lake County transportation project in a major commercial corridor is expected to result in a contraction of 3% in that will carry through. Following completion of the project, revitalization of vacant retail space is anticipated to add 3% in and 5% in and. The following charts depict the sales tax growth estimates and revenue derived over the forecast period. Inflation Factor (5-Year smoothing) Inflation 2.56% 2.18% 2.28% 1.80% 2.18% 2.04% 2.34% 2.34% 2.60% 2.80% 3.00% 3.00% Un-Inflation Adjusted Assumption (1) Conservative -2% -2.00% 1.00% 3.00% 3.00% -2.00% -2.00% Baseline 0.00% 3.00% 5.00% 5.00% 0.00% 0.00% Aggressive +2% 2.00% 5.00% 7.00% 7.00% 2.00% 2.00% Inflation Adjusted Assumption Conservative -2% 0.34% 3.34% 5.60% 5.80% 1.00% 1.00% Baseline/ -1.13% -0.18% 7.05% 3.69% 0.29% -3.58% 2.34% 5.34% 7.60% 7.80% 3.00% 3.00% Aggressive +2% 4.34% 7.34% 9.60% 9.80% 5.00% 5.00% Revenue Forecast - XX Conservative 3,341,000 3,453,000 3,646,000 3,857,000 3,896,000 3,935,000 Baseline/ 3,108,023 3,102,401 3,321,053 3,443,645 3,453,605 3,330,000 3,408,000 3,590,000 3,863,000 4,164,000 4,289,000 4,418,000 Aggressive 3,475,000 3,730,000 4,088,000 4,489,000 4,713,000 4,949,000 Conservative Baseline/ Aggressive Linear (Baseline/) 5,100,000 4,925,000 4,750,000 4,575,000 4,400,000 4,225,000 4,050,000 3,875,000 3,700,000 3,525,000 3,350,000 3,175,000 3,000, P a g e
14 Home Rule Sales Tax Due to the similarity the same factors that impact sales taxes also impact home rule sales taxes. Home Rule Sales Taxes are projected to follow the same pattern as Sales Taxes through the forecast period. The following charts depict the Home Rule Sales tax growth estimates and revenue derived over the forecast period. Inflation Factor (5-Year smoothing) Inflation 2.56% 2.18% 2.28% 1.80% 2.18% 2.04% 2.34% 2.34% 2.60% 2.80% 3.00% 3.00% Un-Inflation Adjusted Assumption (1) Conservative -2% -2.00% 1.00% 3.00% 3.00% -2.00% -2.00% Baseline 0.00% 3.00% 5.00% 5.00% 0.00% 0.00% Aggressive +2% 2.00% 5.00% 7.00% 7.00% 2.00% 2.00% Inflation Adjusted Assumption Conservative -2% 0.34% 3.34% 5.60% 5.80% 1.00% 1.00% Baseline/ -1.35% -1.16% 7.41% 3.60% 0.71% -4.06% 2.34% 5.34% 7.60% 7.80% 3.00% 3.00% Aggressive +2% 4.34% 7.34% 9.60% 9.80% 5.00% 5.00% Revenue Forecast - XX Conservative 1,158,927 1,197,635 1,264,703 1,338,055 1,351,436 1,364,950 Baseline/ 1,086,898 1,074,314 1,153,875 1,195,397 1,203,832 1,155,000 1,182,027 1,245,147 1,339,778 1,444,281 1,487,610 1,532,238 Aggressive 1,205,127 1,293,583 1,417,767 1,556,709 1,634,544 1,716,271 Conservative Baseline/ Aggressive Linear (Baseline/) 1,975,000 1,900,000 1,825,000 1,750,000 1,675,000 1,600,000 1,525,000 1,450,000 1,375,000 1,300,000 1,225,000 1,150,000 1,075,000 1,000,000 Conservative 1,158,927 1,197,635 1,264,703 1,338,055 1,351,436 1,364,950 Baseline/ 1,086,898 1,074,314 1,153,875 1,195,397 1,203,832 1,155,000 1,182,027 1,245,147 1,339,778 1,444,281 1,487,610 1,532,238 Aggressive 1,205,127 1,293,583 1,417,767 1,556,709 1,634,544 1,716, P a g e
15 Property Taxes The Forecast period assumption is based on a 1.7% increase in and a 2% and 3% increase in and respectively as EAV begins to slowly increase. thru assumes a CPI of 3% which represents the anticipated tax cap under the Property Tax Extension Limitation Law (PTELL). The spread between the conservative and aggressive models is 2%. The Following charts depict the assumptions and impact on property tax revenue throughout the forecast period. Inflation Factor (2-Year lag "Tax Cap") Inflation 2.50% 4.10% 0.10% 2.70% 1.50% 3.00% 1.70% 2.00% 2.00% 3.00% 3.00% 3.00% Forecast Assumptions Conservative -1% 0.70% 1.00% 2.00% 2.00% 2.00% 2.00% Baseline/ 7.34% 6.04% 2.33% 0.35% 0.02% 0.00% 1.70% 2.00% 3.00% 3.00% 3.00% 3.00% Aggressive +1% 2.70% 3.00% 4.00% 4.00% 4.00% 4.00% Revenue Forecast Conservative 2,428,136 2,452,418 2,501,466 2,551,495 2,602,525 2,654,576 Baseline/ 2,213,890 2,347,661 2,402,378 2,410,688 2,411,187 2,411,258 2,452,249 2,501,294 2,576,333 2,653,623 2,733,231 2,815,228 Aggressive 2,476,361 2,550,652 2,652,678 2,758,786 2,869,137 2,983,902 Conservative Baseline/ Aggressive Linear (Baseline/) 3,200,000 3,080,000 2,960,000 2,840,000 2,720,000 2,600,000 2,480,000 2,360,000 2,240,000 2,120,000 2,000, P a g e
16 Income Tax It is expected Income tax will grow at the rate of inflation throughout the forecast period. To provide for the lag in income tax revenue receipts, the forecast assumes a 2 year lag from inflation. The spread between the conservative and aggressive models is 4%. The charts below depict the assumptions and receipts anticipated for the forecast period. Inflation Factor Inflation 0.10% 2.70% 1.50% 3.00% 1.70% 2.00% 2.00% 3.00% 3.00% 3.00% 3.00% 3.00% Un-Inflation Adjusted Assumption Conservative -2% -2.00% -2.00% -2.00% -2.00% -2.00% -2.00% Baseline 0.00% 0.00% 0.00% 0.00% 0.00% 0.00% Aggressive +2% 2.00% 2.00% 2.00% 2.00% 2.00% 2.00% Inflation Adjusted Assumption Conservative -2% 0.00% 1.00% 1.00% 1.00% 1.00% 1.00% Baseline/ -6.53% % 0.34% 19.29% 11.67% -4.88% 2.00% 3.00% 3.00% 3.00% 3.00% 3.00% Aggressive +2% 4.00% 5.00% 5.00% 5.00% 5.00% 5.00% Revenue Forecast Conservative 2,535,750 2,561,108 2,586,719 2,612,586 2,638,712 2,665,099 Baseline/ 2,277,287 1,994,423 2,001,151 2,387,157 2,665,846 2,535,750 2,586,465 2,664,059 2,743,981 2,826,300 2,911,089 2,998,422 Aggressive 2,637,180 2,769,039 2,907,491 3,052,865 3,205,509 3,365,784 Conservative Baseline/ Aggressive Linear (Baseline/) 3,400,000 3,275,000 3,150,000 3,025,000 2,900,000 2,775,000 2,650,000 2,525,000 2,400,000 2,275,000 2,150,000 2,025,000 1,900, P a g e
17 Use Tax Use taxes have increased an average of 5% annually since 2009 and are projected to increase at the rate of inflation throughout the forecast period. The Charts below depict the assumptions and receipts anticipated for the forecast period. Inflation Factor (5-Year smoothing) Inflation 2.28% 1.80% 2.18% 2.04% 2.34% 2.34% 2.60% 2.80% 3.00% 3.00% 3.00% 3.00% Un-Inflation Adjusted Conservative -2.00% -2.00% -2.00% -2.00% -2.00% -2.00% Baseline 0.00% 0.00% 0.00% 0.00% 0.00% 0.00% Aggressive 2.00% 2.00% 2.00% 2.00% 2.00% 2.00% Inflation Adjusted Conservative 0.60% 0.80% 1.00% 1.00% 1.00% 1.00% Baseline/ -1.15% % 15.27% 15.47% 9.08% 3.59% 2.60% 2.80% 3.00% 3.00% 3.00% 3.00% Aggressive 4.60% 4.80% 5.00% 5.00% 5.00% 5.00% Revenue Forecast Conservative 467, , , , , ,560 Baseline/ 349, , , , , , , , , , , ,871 Aggressive 486, , , , , ,438 Conservative Baseline/ Aggressive Linear (Baseline/) 625, , , , , , , , , , , , , , P a g e
18 Utility Taxes Combined, these taxes are the third largest revenue source for the Village. Since excise taxes are usage based, inflation is not used to forecast Utility Taxes. The Village is unlikely to add a large number of users and usage tends to remain consistent form year to year, the electric tax is anticipated to remain flat throughout the forecast period. At 5% of gross receipts, the natural gas tax fluctuates with the price of natural gas which is impacted by the economic principles of supply and demand. Natural gas prices have dropped in recent years from historical averages and therefore the natural gas assumption is flat throughout the forecast period. Over the forecast period, telecommunications tax is expected to drop by 3% and 2% in and respectively, followed by a 0% increase in the reaming years. Electric Tax is expected to remain flat throughout the forecast period as it is usage based. The spread between conservative and aggressive models is 4% for all utility taxes. The charts below depict the assumptions and revenue derived from utility taxes. Utility Tax Telecommunications Utility Tax -Phone Forecast Assumptions Conservative -5.00% -4.00% -2.00% -2.00% -2.00% -2.00% Baseline/ -4.00% 13.14% % -5.11% -2.93% -0.30% -3.00% -2.00% 0.00% 0.00% 0.00% 0.00% Aggressive -1.00% 0.00% 2.00% 2.00% 2.00% 2.00% Revenue Forecast Conservative 592, , , , , ,914 Baseline/ 753, , , , , , , , , , , ,180 Aggressive 617, , , , , ,690 Conservative Baseline/ Aggressive Linear (Baseline/) 885, , , , , , , , , , , , P a g e
19 Utility Tax Electric Utility Tax-Electric Forecast Assumptions Conservative -2.00% -2.00% -2.00% -2.00% -2.00% -2.00% Baseline/ -4.38% -5.24% 9.53% -5.70% 0.22% 0.88% 0.00% 0.00% 0.00% 0.00% 0.00% 0.00% Aggressive 2.00% 2.00% 2.00% 2.00% 2.00% 2.00% Revenue Forecast Conservative 539, , , , , ,213 Baseline/ 581, , , , , , , , , , , ,000 Aggressive 561, , , , , ,389 Conservative Baseline/ Aggressive Linear (Baseline/) 650, , , , , , , , ,000 Utility Tax Natural Gas (Includes Excise and Use Tax) Utility Tax-Natural Gas Forecast Assumptions Conservative -2.00% -2.00% -2.00% -2.00% -2.00% -2.00% Baseline/ 12.86% % -1.45% 9.32% -9.27% 4.17% 0.00% 0.00% 0.00% 0.00% 0.00% 0.00% Aggressive 2.00% 2.00% 2.00% 2.00% 2.00% 2.00% Revenue Forecast Conservative 294, , , , , ,753 Baseline/ 383, , , , , , , , , , , ,000 Aggressive 306, , , , , ,849 Conservative Baseline/ Aggressive Linear (Baseline/) 395, , , , , , , , , , , , , , P a g e
20 Amusement Tax Since 2009, Amusement Taxes have increased an average of 1.5% annually. The forecast projects a modest 2% increase throughout the forecast period. The Charts below depict the assumptions and receipts anticipated for the forecast period. Forecast Assumptions Conservative 0.00% 0.00% 0.00% 0.00% 0.00% 0.00% Baseline/ 1.31% 9.47% -8.31% 7.48% -2.74% 3.19% 2.00% 2.00% 2.00% 2.00% 2.00% 2.00% Aggressive 4.00% 4.00% 4.00% 4.00% 4.00% 4.00% Revenue Forecast Conservative 265, , , , , ,000 Baseline/ 231, , , , , , , , , , , ,433 Aggressive 275, , , , , ,310 Conservative Baseline/ Aggressive Linear (Baseline/) 375, , , , , , , , , , , , , , , P a g e
21 Water & Sewer Fees Fees for Village water and sewer services are established by ordinance. The forecast assumes no change in the fees or fee structure. Water & Sewer fees consist of variable and fixed charges and fees. The factors influencing the amount of revenue derived is either amount of consumption or number of households. The forecast assumes no change in the number of households or consumption over the forecast period. The Village also sells wholesale water to the Village of Round Lake Heights. The forecast assumes this arrangement stops in as Round Lake Heights becomes able to source its own potable water without reliance on the Village. Assumption Water Consumption Gallons Sold (Excluding RL Heights) Prior 2yr. Avg. 535, , , , , , ,000 Rate 5/1-8/31 33% $5.98 $6.16 $6.34 $6.53 $6.73 $6.93 $7.14 Rate 9/1-4/30 66% $6.16 $6.34 $6.53 $6.73 $6.93 $7.14 $7.35 Water Rate (Combined) $6.04 $6.22 $6.40 $6.60 $6.79 $7.00 $7.21 Percent Inc/(Dec) 0.99% 3.00% 3.00% 3.00% 3.00% 3.00% 3.00% Water Revenue $3,263,840 $3,326,202 $3,425,070 $3,529,235 $3,635,165 $3,744,626 $3,855,852 Customer Fees Customer Accounts Prior 2yr. Avg. 8,275 8,275 8,275 8,275 8,275 8,275 8,275 Customer Fee $5.00/month $5.00 $5.00 $5.00 $5.00 $5.00 $5.00 $5.00 Customer Fee Revenue $496,500 $496,500 $496,500 $496,500 $496,500 $496,500 $496,500 Sewer Fees (Sewer Capital) Sewer Accounts Prior 2yr. Avg. 7,780 7,780 7,780 7,780 7,780 7,780 7,780 Sewer Fee $4.00/month $4.00 $4.00 $4.00 $4.00 $4.00 $4.00 $4.00 Sewer Fee Revenue $373,440 $373,440 $373,440 $373,440 $373,440 $373,440 $373,440 Outside Sales (RL Heights) Gallons Sold Prior 2yr. Avg. 62,200 57,000 57, CLCJAWA $2.65 $2.56 $2.66 $2.65 $2.67 $2.84 $2.94 Transmission $1.13 $1.13 $1.13 $1.13 $1.13 $1.13 $1.13 Total Rate $3.78 $3.69 $3.79 $3.78 $3.80 $3.97 $4.07 Water Sales Revenue $235,116 $210,330 $216,030 $0 $0 $0 $0 21 P a g e
22 Motor Fuel Tax The Village, like all municipalities in Illinois, receives a share of the 19 cent per gallon State Motor Fuel Tax. Roughly 25% of the tax received by the State is distributed to municipalities based on population. The tax must be used for the maintenance of the Village s transportation system. The Village utilizes MFT funds to support the debt service on the Series 2009 bonds, which were used for resurfacing, and the annual pay-as-you-go road program. Forecast Assumptions Conservative -2.00% -2.00% -2.00% -2.00% -2.00% -2.00% Baseline/ -6.12% -4.83% 1.35% 4.31% 2.16% -5.41% 0.00% 0.00% 0.00% 0.00% 0.00% 0.00% Aggressive 2.00% 2.00% 2.00% 2.00% 2.00% 2.00% Revenue Forecast Conservative 648, , , , , ,525 Baseline/ 681, , , , , , , , , , , ,110 Aggressive 675, , , , , ,643 Conservative Baseline/ Aggressive Linear (Baseline/) 850, , , , , , , , , , , P a g e
23 Major Expenditures Full-Time Salaries For purposes of forecasting salaries for full-time employees the following assumptions are made; Fraternal Order of Police participants retire after 25 years of service Illinois Municipal Retirement Fund participants retire after 30 years of service Cost of living increase of 2.5% throughout the forecast period Step increases are 3% throughout the forecast period Based on those assumptions the following schedule depicts the overall change in full-time salaries throughout the forecast period. Fund/Department General Fund Administration $164,283 $165,459 $166,470 $162,166 $166,255 $165,770 $154,500 $159,000 $164,000 $168,500 $173,500 $179,000 Police Administration $400,355 $409,000 $421,000 $434,000 $447,000 $460,500 $474,000 Police Patrol $2,288,500 $2,481,000 $2,567,000 $2,654,500 $2,742,500 $2,832,000 $2,924,500 Police Investigations/SOU $659,135 $679,500 $700,000 $721,000 $742,500 $765,000 $787,500 Total Police $3,177,615 $3,313,895 $3,335,795 $3,341,802 $3,303,483 $3,347,990 $3,569,500 $3,688,000 $3,809,500 $3,932,000 $4,057,500 $4,186,000 Economic Development $226,590 $245,006 $297,516 $302,684 $307,049 $292,060 $304,000 $313,000 $322,500 $332,000 $342,000 $352,500 Public Works $651,587 $668,106 $604,707 $561,350 $547,000 $538,330 $552,000 $568,500 $585,500 $603,000 $621,000 $640,000 Finance $75,871 $79,352 $74,672 $74,721 $88,775 $105,115 $107,000 $110,500 $113,500 $117,000 $120,500 $124,000 Total General Fund $4,295,946 $4,471,818 $4,479,160 $4,442,723 $4,412,562 $4,449,265 $4,687,000 $4,839,000 $4,995,000 $5,152,500 $5,314,500 $5,481,500 % Change 4.34% 4.09% 0.16% -0.81% -0.68% 0.83% 5.34% 3.24% 3.22% 3.15% 3.14% 3.14% Water & Sewer Fund Administration $110,324 $114,970 $102,198 $115,450 $117,700 $123,520 $111,000 $114,500 $118,000 $121,500 $125,000 $128,500 Public Works $617,193 $630,723 $517,496 $510,631 $554,500 $576,280 $583,500 $601,000 $619,000 $637,500 $656,500 $676,000 Finance $236,856 $247,550 $228,641 $229,905 $179,500 $164,015 $166,000 $171,000 $176,000 $181,000 $186,500 $192,000 Total Water & Sewer Fund $964,373 $993,243 $848,335 $855,986 $851,700 $863,815 $860,500 $886,500 $913,000 $940,000 $968,000 $996,500 Total Full-Time Salaries by Department - All Funds Administration $274,607 $280,429 $268,668 $277,616 $283,955 $289,290 $265,500 $273,500 $282,000 $290,000 $298,500 $307,500 Police Administration $0 $0 $0 $0 $0 $400,355 $409,000 $421,000 $434,000 $447,000 $460,500 $474,000 Police Patrol $0 $0 $0 $0 $0 $2,288,500 $2,481,000 $2,567,000 $2,654,500 $2,742,500 $2,832,000 $2,924,500 Police Investigations/SOU $0 $0 $0 $0 $0 $659,135 $679,500 $700,000 $721,000 $742,500 $765,000 $787,500 Total Police $3,177,615 $3,313,895 $3,335,795 $3,341,802 $3,303,483 $3,347,990 $3,569,500 $3,688,000 $3,809,500 $3,932,000 $4,057,500 $4,186,000 Economic Development $226,590 $245,006 $297,516 $302,684 $307,049 $292,060 $304,000 $313,000 $322,500 $332,000 $342,000 $352,500 Public Works $1,268,780 $1,298,829 $1,122,203 $1,071,981 $1,101,500 $1,114,610 $1,135,500 $1,169,500 $1,204,500 $1,240,500 $1,277,500 $1,316,000 Finance $312,727 $326,902 $303,313 $304,626 $268,275 $269,130 $273,000 $281,500 $289,500 $298,000 $307,000 $316,000 Total Gen and W&S Funds $5,260,319 $5,465,061 $5,327,495 $5,298,709 $5,264,262 $5,313,080 $5,547,500 $5,725,500 $5,908,000 $6,092,500 $6,282,500 $6,478,000 $ Change $225,567 $204,742 -$137,566 -$28,786 -$34,447 $48,818 $234,420 $178,000 $182,500 $184,500 $190,000 $195,500 % Change 4.48% 3.89% -2.52% -0.54% -0.65% 0.93% 4.41% 3.21% 3.19% 3.12% 3.12% 3.11% SS/Medicare Expenses Administration $13,850 $12,908 $13,284 $13,702 $14,078 $14,496 $14,955 Village Board $2,210 $2,210 $2,210 $2,210 $2,210 $2,210 $2,210 Mayor $1,530 $1,530 $1,530 $1,530 $1,530 $1,530 $1,530 Boards & Commissions $205 $205 $205 $205 $205 $205 $205 Clerk's Office $375 $375 $375 $375 $375 $375 $375 Police Administration $12,800 $13,076 $13,460 $13,876 $14,291 $14,723 $15,155 Police Patrol $44,900 $48,677 $50,364 $52,081 $53,807 $55,563 $57,378 Police Investigations/SOU $9,950 $10,257 $10,567 $10,884 $11,208 $11,548 $11,888 Total Police $67,650 $72,126 $74,520 $76,975 $79,451 $81,986 $84,583 Economic Development $26,050 $27,115 $27,918 $28,765 $29,612 $30,504 $31,441 Public Works $43,900 $45,015 $46,360 $47,747 $49,174 $50,642 $52,191 Finance $10,230 $10,413 $10,754 $11,046 $11,387 $11,727 $12,068 Total General Fund $166,000 $171,897 $177,157 $182,555 $188,022 $193,676 $199, P a g e
24 Pensions Employees of the Village participate in 1 of 2 pension systems, downstate police pension or Illinois Municipal Retirement Fund (IMRF). Benefit levels for both programs are determined by the Illinois General Assembly. The Village annually levy s a property tax for both programs. The forecast assumes no change in pension laws or benefit levels. The Following chart depicts the assumptions used for the forecast period Plan IMRF Chg % 5.54% 17.38% 6.26% 14.40% 10.00% 5.00% 3.00% 3.00% 3.00% 3.00% 3.00% IMRF Effective Rate 11.43% 11.93% 12.29% 12.66% 13.04% 13.43% 13.83% General Fund Wage Base $1,314,420 $1,335,173 $1,378,015 $1,421,939 $1,466,344 $1,512,073 $1,559,126 W&S Fund Wage Base $863,098 $859,470 $887,047 $915,322 $943,906 $973,343 $1,003,632 General Fund IMRF Expense $150,238 $159,286 $169,329 $179,968 $191,156 $203,031 $215,629 W&S Fund IMRF Expense $98,652 $102,535 $108,999 $115,848 $123,050 $130,694 $138,804 Police Pension 13.90% 9.94% 18.24% 8.16% 7.03% -9.73% 10.00% 10.00% 10.00% 10.00% 10.00% 10.00% Total Police Pension $685,150 $753,235 $890,599 $963,253 $1,030,951 $930,665 $1,023,732 $1,126,105 $1,238,715 $1,362,587 $1,498,845 $1,648,730 Health Insurance The Village offers a comprehensive benefits package to all full time employees that includes health, dental and life insurance coverage. For purposes of forecasting, it is assumed coverage elections remain the same and vacant positions assume full family coverage Assumption 6.78% -4.99% 4.71% 7.39% -1.34% -0.63% 10.00% 10.00% 7.00% 7.00% 7.00% 7.00% Total Health Insurance $1,102,105 $1,045,435 $1,078,445 $1,148,830 $1,136,265 $1,157,380 $1,273,118 $1,400,430 $1,498,460 $1,603,352 $1,715,587 $1,835,678 Full Time Positions Per FT Position $11,132 $10,890 $12,117 $13,205 $13,212 $13,944 $15,526 $17,078 $18,274 $19,553 $20,922 $22,386 General Fund FT Positions W&S Fund FT Positions Civic Center Fund FT Positions General Fund Expense $926,380 $1,016,476 $1,118,124 $1,196,392 $1,280,140 $1,369,750 $1,465,632 W&S Fund Expense $231,000 $237,545 $261,300 $279,591 $299,162 $320,103 $342,511 Civic Center Fund FT Positions $4,590 $19,097 $21,006 $22,477 $24,050 $25,734 $27,535 Liability & Workers Compensation Insurance The Village utilizes a self-insured retention plan for liability and workers compensation insurance. Insurance costs are accounted for in the Risk Management Fund (26) and funded from a property tax levy for the general government share (75%) and a transfer from the Water & Sewer operating fund for the Water & Sewer share (25%). For purposes of forecasting, it is assumed the Village remains with this type of coverage with no changes in limits or deductibles. 24 P a g e
25 Assumption % 74.22% % 40.20% % 13.87% 5.00% 5.00% 5.00% 5.00% 5.00% 5.00% Liability Premium $196,947 $206,794 $217,134 $227,991 $239,390 $251,360 $263,928 Claims Expense $134,676 $234,635 $182,951 $256,504 $194,920 $25,000 $25,000 $25,000 $25,000 $25,000 $25,000 $25,000 Total Liability Insurance $134,676 $234,635 $182,951 $256,504 $194,920 $221,947 $231,794 $242,134 $252,991 $264,390 $276,360 $288,928 Assumption % 81.41% % % 39.26% % 5.00% 5.00% 5.00% 5.00% 5.00% 5.00% Work Comp Premium $98,462 $103,385 $108,554 $113,982 $119,681 $125,665 $131,948 Claims Expense $167,938 $304,662 $51,177 $192,773 $268,458 $100,000 $150,000 $200,000 $200,000 $200,000 $200,000 $200,000 Total Workers Compensation Insurance $167,938 $304,662 $51,177 $192,773 $268,458 $198,462 $253,385 $308,554 $313,982 $319,681 $325,665 $331,948 Total Expenditure $302,614 $539,297 $234,127 $449,277 $463,378 $420,409 $485,179 $550,688 $566,973 $584,071 $602,025 $620,876 General Fund Portion 75% $325,000 $363,885 $413,016 $425,230 $438,054 $451,519 $465,657 W&S Fund Portion 25% $97,500 $121,295 $137,672 $141,743 $146,018 $150,506 $155,219 Debt Service The village utilizes bond funding for capital projects. Bond issuance is essential to ensure the timing and completion of capital projects. Fund General Fund 1994 Sales Tax Note Rollins Crossing $250,000 $300,000 $300,000 $300,000 $300,000 $300,000 $300, & Hook LLC Sales Tax Sharing Agreement $30,000 $30,000 Amusement Tax Rebate $80,000 $80,000 $80,000 $80,000 $80,000 $80,000 $80,000 TI#1 Debt Service Fund Series 2003 Refunding $559,880 $0 $0 $0 $0 $0 Debt Service Fund Series 2004 $255,888 $253,208 Series 2004a $182,000 Series 2006 $291,310 $289,255 $291,993 $289,315 $291,430 $293,130 $294,310 Series 2010 RZ Bonds $261,963 $259,088 $260,650 $256,425 $256,810 $251,140 $250,268 Series 2011 Refunding $451,226 $455,425 $451,675 $452,800 $451,850 $450,600 $450,200 Series 2012 Refunding $156,141 $342,173 $592,473 $592,673 $592,673 $597,473 $596,973 Series A (Future Capital) $0 $0 $0 $0 $0 $0 $450,000 Motor Fuel Tax Fund Series 2009 BAB Bonds $349,175 $346,113 $342,313 $342,188 $336,025 $334,625 $332,750 Total Debt Service $1,947,702 $1,945,261 $1,939,103 $1,933,400 $1,928,788 $1,926,968 $2,374,500 Water & Sewer IEPA Loan $169,650 $169,650 $169,650 $169,650 $169,650 $169,650 $169,650 Dispatching Services The Village currently participates in an intergovernmental cooperative for dispatching services. For purposes of forecasting, it is assumed the Village will maintain this arrangement throughout the forecast period Assumption 17.88% -3.77% -5.22% 8.88% 4.79% -2.23% 3.00% 3.00% 3.00% 3.00% 3.00% 3.00% CENCOM 491, , , , , , , , , , , , P a g e
26 Legal The Village utilizes an outside firm for legal and local adjudication functions. The following chart depicts the annual change in legal expenses throughout the forecast period Assumption 25.45% 14.59% % % % 13.90% 3.00% 3.00% 3.00% 3.00% 3.00% 3.00% Legal Expense 317, , , , , , , , , , , ,810 Fuel The Village maintains a large fleet of vehicles primarily for the Police and Public Works functions. The following chart depicts the annual change in fuel expenses throughout the forecast period. The Village utilizes bulk service for fuel in addition to a sales account with a local station. Consumption is assumed to remain constant throughout the forecast period. The forecast is based on an assumed retail price with a 15% bulk fuel purchase discount. Department Average Consumption Retail Price Assumption $3.75 $3.75 $3.75 $3.75 $3.75 $3.75 $3.75 Rate at Bulk Discout (15%) $3.19 $3.19 $3.19 $3.19 $3.19 $3.19 $ Fuel (General Fund) 47,700 $139,588 $117,755 $140,802 $152,355 $155,100 $159,600 $152,044 $152,044 $152,044 $152,044 $152,044 $152,044 Fuel Water & Sewer Fund 9, ,600 $30,281 $30,281 $30,281 $30,281 $30,281 $30,281 Vehicles & Equipment Vehicle & Equipment replacement costs are accounted for in the Equipment Replacement Fund (27) and funded from sales tax for the general government share and a transfer from the Water & Sewer operating fund for the Water & Sewer share. Funding is based on a 5-year rolling average to eliminate large year to year increases or decreases. The Following chart depicts the general government and water & sewer required funding throughout the forecast period. More information on vehicle & equipment replacement can be found in the Village s Long-Term Capital Plan. 26 P a g e
27 Scheduled Replacement Expense Administration Vehicles $0 $0 $27,181 $0 $0 $0 $0 Economic Development Vehicles $0 $30,900 $0 $0 $0 $0 $35,822 Lease $7,560 $7,524 $7,524 $7,524 $0 $0 $0 Police Department Vehicles $97,950 $198,394 $194,206 $159,538 $82,162 $217,431 $229,994 Lease $41,340 $33,690 $33,690 $0 $0 $0 $0 Public Works Heavy Equipment $13,350 $26,491 $67,266 $49,107 $0 $0 $0 Other Equipment $0 $18,538 $36,796 $0 $27,012 $0 $8,159 Vehicles $94,305 $208,529 $184,834 $283,148 $403,121 $341,214 $410,983 Lease $84,150 $25,800 $0 $0 $0 $0 $0 Finance/IT IT Equipment $200,000 $100,000 $50,000 $50,000 $50,000 $50,000 $25,000 Total Expenditures 538, ,866 $601,498 $549,317 $562,296 $608,645 $709,957 Funding Requirement (5-Year Rolling Average) Administration $5,436 $5,436 $6,686 $6,686 $6,686 $6,686 Economic Development $6,180 $7,164 $7,164 $7,164 $14,993 $14,993 Police Department $170,346 $176,666 $191,831 $178,418 $190,560 $197,486 Public Works $329,211 $362,328 $348,739 $336,268 $280,197 $277,530 Finance/IT $60,000 $45,000 $40,000 $35,000 $30,000 $25,000 General Fund Administration 50% $2,718 $2,718 $3,343 $3,343 $3,343 $3,343 Economic Development 100% $6,180 $7,164 $7,164 $7,164 $14,993 $14,993 Police Department 100% $170,346 $176,666 $191,831 $178,418 $190,560 $197,486 Public Works 50% $164,606 $181,164 $174,369 $168,134 $140,098 $138,765 Finance/IT 50% $30,000 $22,500 $20,000 $17,500 $15,000 $12,500 Existing Leases $54,114 $41,214 $7,524 $0 $0 $0 Total Funding Requirement $571,850 $427,964 $431,427 $404,231 $374,559 $363,994 $367,087 Water & Sewer Fund Administration 50% $2,718 $2,718 $3,343 $3,343 $3,343 $3,343 Public Works 50% $164,606 $181,164 $174,369 $168,134 $140,098 $138,765 Finance/IT 50% $30,000 $22,500 $20,000 $17,500 $15,000 $12,500 Existing Leases $12,900 $0 $0 $0 $0 $0 Total Funding Requirement $125,070 $210,224 $206,382 $197,712 $188,977 $158,441 $154,608 Fund Balance Projection Beginning Balance - 158, , , , , ,556 Revenues (Funding) 696, , , , , , ,695 Expenditures 538, , , , , , ,957 Ending Balance 158, , , , , ,556 (37,706) 27 P a g e
28 Water Supply The Village purchases Lake Michigan water from the Central Lake County Joint Action Water Agency (CLCJAWA). CLC JAWA produces a multi-year capital plan that includes projected rates. The forecast assumes continued participation in CLCJAWA and half of any rate decreases forecasted in CLCJAWA s multi-year capital plan. Assumption Water Consumption Expense Gallons Purchased (1,000's) Prior 2yr. Avg. 715, , , , , , ,000 Supply Rate CLCJAWA Forecast $2.56 $2.66 $2.65 $2.67 $2.84 $2.94 $2.94 Percent Inc/(Dec) -3.40% 3.91% -0.38% 0.75% 6.37% 3.52% 0.00% Water Supply Expense $1,830,400 $1,901,900 $1,894,750 $1,756,860 $1,868,720 $1,934,520 $1,934, P a g e
29 Financial Forecasts Risk Management Fund - 26 Increase Factor Required Major Revenues See Detail $325,000 $363,885 $413,016 $425,230 $438,054 $451,519 $465,657 Interest Income 2% Annually $0 $0 $0 $0 $0 $0 $0 Claims Reimbursements $5,000 $0 $0 $0 $0 $0 $0 Recurring Revenues $5,000 $0 $0 $0 $0 $0 $0 Transfer In W&S to 26 See Detail $97,500 $121,295 $137,672 $141,743 $146,018 $150,506 $155,219 Transfers $97,500 $121,295 $137,672 $141,743 $146,018 $150,506 $155,219 Total Revenues $427,500 $485,179 $550,688 $566,973 $584,071 $602,025 $620,876 Liability Insurance See Detail $196,947 $206,794 $217,134 $227,991 $239,390 $251,360 $263,928 Liability Claims Expense See Detail $25,000 $25,000 $25,000 $25,000 $25,000 $25,000 $25,000 Work Comp Insurance See Detail $98,462 $103,385 $108,554 $113,982 $119,681 $125,665 $131,948 Work Comp Claims Expense See Detail $100,000 $150,000 $200,000 $200,000 $200,000 $200,000 $200,000 Total Major Expenditures $420,409 $485,179 $550,688 $566,973 $584,071 $602,025 $620,876 Operating Variance $7,091 $0 $0 $0 $0 $0 $0 Fund Balance 4/30 $7,091 $7,091 $7,091 $7,091 $7,091 $7,091 $7, P a g e
30 Equipment Replacement Fund - 27 Increase Factor Required Major Revenues See Detail $571,850 $421,174 $424,637 $396,360 $366,688 $356,123 $359,216 Interest Income 2% Annually $0 $0 $0 $0 $0 $0 $0 Recurring Revenues $0 $0 $0 $0 $0 $0 $0 Other Income 0% Annually $0 $0 $0 $0 $0 $0 $0 Non-Recurring Revenues $0 $0 $0 $0 $0 $0 $0 Transfer In W&S to 27 2% Annually $125,070 $210,224 $206,382 $197,712 $188,977 $158,441 $154,608 Transfers $125,070 $210,224 $206,382 $197,712 $188,977 $158,441 $154,608 Total Revenues $696,920 $631,398 $631,019 $594,073 $555,665 $514,565 $513,824 Administration See Detail $0 $0 $27,181 $0 $0 $0 $0 Finance See Detail $200,000 $100,000 $50,000 $50,000 $50,000 $50,000 $25,000 Economic Development See Detail $7,560 $38,424 $7,524 $7,524 $0 $0 $35,822 Police See Detail $139,290 $232,084 $193,947 $159,538 $82,162 $217,431 $229,994 Public Works See Detail $191,805 $279,358 $288,896 $332,255 $430,133 $341,214 $419,142 Total Major Expenditures $538,655 $649,866 $567,549 $549,317 $562,296 $608,645 $709,957 Other Expenditures 0% Annually $0 $0 $0 $0 $0 $0 $0 Total Other Expenditures $0 $0 $0 $0 $0 $0 $0 Total Expenditures $538,655 $649,866 $567,549 $549,317 $562,296 $608,645 $709,957 Operating Variance $158,265 ($18,468) $63,470 $44,756 ($6,631) ($94,080) ($196,133) Fund Balance 4/30 $158,265 $139,797 $203,267 $248,023 $241,392 $147,312 ($48,821) 30 P a g e
31 GO Debt Service Fund - 70 Increase Factor Required Major Revenues See Detail $1,075,000 $1,553,042 $1,552,001 $1,548,028 $1,551,326 $1,553,040 $1,997,516 Interest Income 2% Annually $1,000 $1,020 $1,040 $1,061 $1,082 $1,104 $1, RZ Bonds Rebate 0% Annually $49,717 $48,674 $47,426 $45,892 $44,217 $42,159 $40,027 Other Recurring Income 0% Annually $0 $0 $0 $0 $0 $0 $0 Recurring Revenues $50,717 $49,694 $48,466 $46,953 $45,299 $43,263 $41,153 Transfer In (Series 2009 MFT) See Detail $349,175 $346,113 $342,313 $342,188 $336,025 $334,625 $332,750 Transfers $349,175 $346,113 $342,313 $342,188 $336,025 $334,625 $332,750 Total Revenues $1,474,892 $1,948,848 $1,942,780 $1,937,169 $1,932,651 $1,930,927 $2,371,419 Series 2004 See Detail $255,888 $253,208 $0 $0 $0 $0 $0 Series 2004a See Detail $182,000 $0 $0 $0 $0 $0 $0 Series 2006 See Detail $291,310 $289,255 $291,993 $289,315 $291,430 $293,130 $294,310 Series 2010 RZ Bonds See Detail $261,963 $259,088 $260,650 $256,425 $256,810 $251,140 $248,828 Series 2011 Refunding See Detail $451,226 $455,425 $451,675 $452,800 $451,850 $450,600 $450,200 Series 2012 Refunding See Detail $156,141 $342,173 $592,473 $592,673 $592,673 $597,473 $591,273 Series 2009 BAB Bonds (MFT) See Detail $349,175 $346,113 $342,313 $342,188 $336,025 $334,625 $332,750 Series A $5m $0 $0 $0 $0 $0 $450,000 Total Major Expenditures $1,947,702 $1,945,261 $1,939,103 $1,933,400 $1,928,788 $1,926,968 $2,367,360 Professional Services 2.5% Annually $3,500 $3,588 $3,677 $3,769 $3,863 $3,960 $4,059 Total Other Expenditures $3,500 $3,588 $3,677 $3,769 $3,863 $3,960 $4,059 Total Expenditures $1,951,202 $1,948,848 $1,942,780 $1,937,169 $1,932,651 $1,930,927 $2,371,419 Operating Variance ($476,309) $0 $0 $0 $0 $0 $0 Fund Balance $2,325,541 $2,325,541 $2,325,541 $2,325,541 $2,325,541 $2,325,541 $2,325, P a g e
32 General Capital Projects Fund - 85 Increase Factor Allocated Major Revenues See Detail $250,000 $500,000 $850,000 $850,000 $850,000 $850,000 $850,000 Interest Income 2% Annually $200 $204 $208 $212 $216 $221 $225 Charges for Service 0% Annually $104,220 $104,220 $104,220 $104,220 $104,220 $104,220 $104,220 Recurring Revenues $104,420 $104,424 $104,428 $104,432 $104,436 $104,441 $104,445 Contributions & Grants 0% Annually $152,935 $75,000 $75,000 $75,000 $75,000 $75,000 $75,000 Other Income 0% Annually $0 $0 $0 $0 $0 $0 $0 Non-Recurring Revenues $152,935 $75,000 $75,000 $75,000 $75,000 $75,000 $75,000 Transfer In (General Fund Excess) $0 $0 $0 $0 $0 $0 $0 Transfers $0 $0 $0 $0 $0 $0 $0 Bond Proceeds Series A 15 yr. GO Issue $5,000,000 Bond Proceeds Series B 15 yr. GO Issue Bond Proceeds Series C 15 yr. GO Issue Bond Proceeds $0 $0 $0 $0 $0 $5,000,000 $0 Total Revenues $507,355 $679,424 $1,029,428 $1,029,432 $1,029,436 $6,029,441 $1,029,445 Sealcoating (PW Lot) 0% Annually $15,000 $15,000 $15,000 $15,000 $15,000 $15,000 $15,000 (1) Sidewalk & Curb Repair 0% Annually $0 $25,000 $25,000 $25,000 $25,000 $25,000 $25,000 (1) Crack Sealing 0% Annually $0 $40,000 $40,000 $40,000 $40,000 $40,000 $40,000 (1) Patching 0% Annually $0 $110,000 $110,000 $110,000 $110,000 $110,000 $110,000 (1) Pavement Marking 0% Annually $0 $25,000 $25,000 $25,000 $25,000 $25,000 $25,000 Engineering $25,000 Unallocated Transportation & Drainage Systems $520,350 $405,000 $750,000 $750,000 $750,000 $5,750,000 $750,000 Total Transportation & Drainage $560,350 $620,000 $965,000 $965,000 $965,000 $5,965,000 $965,000 Facilities $0 $0 $0 $0 $0 $0 $0 Property Purchase $163,000 $50,000 $50,000 $50,000 $50,000 $50,000 $50,000 Total Property & Facilities $163,000 $50,000 $50,000 $50,000 $50,000 $50,000 $50,000 Total Expenditures $723,350 $670,000 $1,015,000 $1,015,000 $1,015,000 $6,015,000 $1,015,000 Operating Variance ($215,995) $9,424 $14,428 $14,432 $14,436 $14,441 $14,445 Fund Balance 4/30 $495,656 $505,080 $519,508 $533,940 $548,376 $562,817 $577,262 (1) Starting in, road maintenance activities moved from MFT to General Capital Fund ($200,000) 32 P a g e
33 General Fund - 01 Conservative Model Conservative Model Increase Factor Major Revenues - General Fund See Allocation $8,734,171 $8,784,195 $8,546,358 $8,878,127 $9,229,533 $9,332,653 $8,980,676 Interest Income 2% Annually $10,000 $10,200 $10,404 $10,612 $10,824 $11,041 $11,262 Intergovernmental Revenue 0% Annually $10,000 $10,000 $10,000 $10,000 $10,000 $10,000 $10,000 Licenses & Permits 0% Annually $497,700 $497,700 $497,700 $497,700 $497,700 $497,700 $497,700 Charges for Service 0% Annually $84,300 $84,300 $84,300 $84,300 $84,300 $84,300 $84,300 Fines 0% Annually $433,000 $433,000 $433,000 $433,000 $433,000 $433,000 $433,000 Other Recurring Income 0% Annually $127,700 $127,700 $127,700 $127,700 $127,700 $127,700 $127,700 Recurring Revenues $1,162,700 $1,162,900 $1,163,104 $1,163,312 $1,163,524 $1,163,741 $1,163,962 Other Non-Recurring Income 0% Annually $5,000 $5,000 $5,000 $5,000 $5,000 $5,000 $5,000 Non-Recurring Revenues $5,000 $5,000 $5,000 $5,000 $5,000 $5,000 $5,000 Total Revenues $9,901,871 $9,952,095 $9,714,462 $10,046,439 $10,398,057 $10,501,394 $10,149,637 FT Salaries See Detail $4,449,265 $4,687,000 $4,839,000 $4,995,000 $5,152,500 $5,314,500 $5,481,500 FICA (SS/MED) See Detail $166,000 $171,897 $177,157 $182,555 $188,022 $193,676 $199,558 Health Insurance See Detail $926,380 $1,016,476 $1,118,124 $1,196,392 $1,280,140 $1,369,750 $1,465,632 Pension-IMRF See Detail $150,238 $159,286 $169,329 $179,968 $191,156 $203,031 $215,629 Pension-Police Pension See Detail $930,665 $1,023,732 $1,126,105 $1,238,715 $1,362,587 $1,498,845 $1,648,730 Legal See Detail $200,000 $206,000 $212,180 $218,545 $225,102 $231,855 $238,810 Fuel See Detail $159,600 $152,044 $152,044 $152,044 $152,044 $152,044 $152,044 CenCom See Detail $500,000 $515,000 $530,450 $546,364 $562,754 $579,637 $597,026 Debt Service See Detail $360,000 $410,000 $380,000 $380,000 $380,000 $380,000 $380,000 Total Major Expenditures $7,842,148 $8,341,435 $8,704,388 $9,089,583 $9,494,304 $9,923,337 $10,378,930 Other Salaries & Benefits 2.5% Annually $320,000 $328,000 $336,200 $344,605 $353,220 $362,051 $371,102 (1) Operating Supplies/Expenses 2.5% Annually $565,375 $794,509 $814,372 $834,731 $855,600 $876,990 $898,914 Contractual Services 2.5% Annually $451,975 $463,274 $474,856 $486,728 $498,896 $511,368 $524,152 Professional Services 2.5% Annually $334,050 $342,401 $350,961 $359,735 $368,729 $377,947 $387,396 Utilities 2.5% Annually $107,760 $110,454 $113,215 $116,046 $118,947 $121,921 $124,969 Minor Capital Outlay 0% Annually $1,200 $1,200 $1,200 $1,200 $1,200 $1,200 $1,200 Total Other Expenditures $1,780,360 $2,039,839 $2,090,805 $2,143,045 $2,196,591 $2,251,476 $2,307,733 Total Expenditures $9,622,508 $10,381,274 $10,795,193 $11,232,629 $11,690,895 $12,174,813 $12,686,663 Operating Variance $279,363 ($429,179) ($1,080,731) ($1,186,190) ($1,292,838) ($1,673,419) ($2,537,025) One-Time Transfers $0 $0 $0 $0 $0 $0 $0 Unassigned Fund Balance 4/30 $8,035,837 $7,606,658 $6,525,927 $5,339,737 $4,046,899 $2,373,480 ($163,545) % of Revenues 81.15% 76.43% 67.18% 53.15% 38.92% 22.60% -1.61% 33 P a g e
34 Baseline Model Baseline Model Increase Factor Major Revenues - General Fund See Allocation $8,734,171 $8,993,201 $8,970,062 $9,532,914 $10,132,352 $10,481,807 $10,384,983 Interest Income 2% Annually $10,000 $10,200 $10,404 $10,612 $10,824 $11,041 $11,262 Intergovernmental Revenue 0% Annually $10,000 $10,000 $10,000 $10,000 $10,000 $10,000 $10,000 Licenses & Permits 0% Annually $497,700 $497,700 $497,700 $497,700 $497,700 $497,700 $497,700 Charges for Service 0% Annually $84,300 $84,300 $84,300 $84,300 $84,300 $84,300 $84,300 Fines 0% Annually $433,000 $433,000 $433,000 $433,000 $433,000 $433,000 $433,000 Other Recurring Income 0% Annually $127,700 $127,700 $127,700 $127,700 $127,700 $127,700 $127,700 Recurring Revenues $1,162,700 $1,162,900 $1,163,104 $1,163,312 $1,163,524 $1,163,741 $1,163,962 Other Non-Recurring Income 0% Annually $5,000 $5,000 $5,000 $5,000 $5,000 $5,000 $5,000 Non-Recurring Revenues $5,000 $5,000 $5,000 $5,000 $5,000 $5,000 $5,000 Total Revenues $9,901,871 $10,161,101 $10,138,166 $10,701,226 $11,300,876 $11,650,548 $11,553,945 FT Salaries See Detail $4,449,265 $4,687,000 $4,839,000 $4,995,000 $5,152,500 $5,314,500 $5,481,500 FICA (SS/MED) See Detail $166,000 $171,897 $177,157 $182,555 $188,022 $193,676 $199,558 Health Insurance See Detail $926,380 $1,016,476 $1,118,124 $1,196,392 $1,280,140 $1,369,750 $1,465,632 Pension-IMRF See Detail $150,238 $159,286 $169,329 $179,968 $191,156 $203,031 $215,629 Pension-Police Pension See Detail $930,665 $1,023,732 $1,126,105 $1,238,715 $1,362,587 $1,498,845 $1,648,730 Legal See Detail $200,000 $206,000 $212,180 $218,545 $225,102 $231,855 $238,810 Fuel See Detail $159,600 $152,044 $152,044 $152,044 $152,044 $152,044 $152,044 CenCom See Detail $500,000 $515,000 $530,450 $546,364 $562,754 $579,637 $597,026 Debt Service See Detail $360,000 $410,000 $380,000 $380,000 $380,000 $380,000 $380,000 Total Major Expenditures $7,842,148 $8,341,435 $8,704,388 $9,089,583 $9,494,304 $9,923,337 $10,378,930 Other Salaries & Benefits 2.5% Annually $320,000 $328,000 $336,200 $344,605 $353,220 $362,051 $371,102 (1) Operating Supplies/Expenses 2.5% Annually $565,375 $794,509 $814,372 $834,731 $855,600 $876,990 $898,914 Contractual Services 2.5% Annually $451,975 $463,274 $474,856 $486,728 $498,896 $511,368 $524,152 Professional Services 2.5% Annually $334,050 $342,401 $350,961 $359,735 $368,729 $377,947 $387,396 Utilities 2.5% Annually $107,760 $110,454 $113,215 $116,046 $118,947 $121,921 $124,969 Minor Capital Outlay 0% Annually $1,200 $1,200 $1,200 $1,200 $1,200 $1,200 $1,200 Total Other Expenditures $1,780,360 $2,039,839 $2,090,805 $2,143,045 $2,196,591 $2,251,476 $2,307,733 Total Expenditures $9,622,508 $10,381,274 $10,795,193 $11,232,629 $11,690,895 $12,174,813 $12,686,663 Operating Variance $279,363 ($220,173) ($657,027) ($531,403) ($390,019) ($524,265) ($1,132,718) One-Time Transfers $0 $0 $0 $0 $0 $0 $0 Unassigned Fund Balance 4/30 $8,035,837 $7,815,664 $7,158,637 $6,627,234 $6,237,215 $5,712,950 $4,580,232 % of Revenues 81.15% 76.92% 70.61% 61.93% 55.19% 49.04% 39.64% 34 P a g e
35 Aggressive Model Aggressive Model Increase Factor Major Revenues - General Fund See Allocation $8,734,171 $9,202,206 $9,401,964 $10,211,650 $11,085,944 $11,717,909 $11,923,245 Interest Income 2% Annually $10,000 $10,200 $10,404 $10,612 $10,824 $11,041 $11,262 Intergovernmental Revenue 0% Annually $10,000 $10,000 $10,000 $10,000 $10,000 $10,000 $10,000 Licenses & Permits 0% Annually $497,700 $497,700 $497,700 $497,700 $497,700 $497,700 $497,700 Charges for Service 0% Annually $84,300 $84,300 $84,300 $84,300 $84,300 $84,300 $84,300 Fines 0% Annually $433,000 $433,000 $433,000 $433,000 $433,000 $433,000 $433,000 Other Recurring Income 0% Annually $127,700 $127,700 $127,700 $127,700 $127,700 $127,700 $127,700 Recurring Revenues $1,162,700 $1,162,900 $1,163,104 $1,163,312 $1,163,524 $1,163,741 $1,163,962 Other Non-Recurring Income 0% Annually $5,000 $5,000 $5,000 $5,000 $5,000 $5,000 $5,000 Non-Recurring Revenues $5,000 $5,000 $5,000 $5,000 $5,000 $5,000 $5,000 Total Revenues $9,901,871 $10,370,106 $10,570,068 $11,379,962 $12,254,468 $12,886,650 $13,092,206 FT Salaries See Detail $4,449,265 $4,687,000 $4,839,000 $4,995,000 $5,152,500 $5,314,500 $5,481,500 FICA (SS/MED) See Detail $166,000 $171,897 $177,157 $182,555 $188,022 $193,676 $199,558 Health Insurance See Detail $926,380 $1,016,476 $1,118,124 $1,196,392 $1,280,140 $1,369,750 $1,465,632 Pension-IMRF See Detail $150,238 $159,286 $169,329 $179,968 $191,156 $203,031 $215,629 Pension-Police Pension See Detail $930,665 $1,023,732 $1,126,105 $1,238,715 $1,362,587 $1,498,845 $1,648,730 Legal See Detail $200,000 $206,000 $212,180 $218,545 $225,102 $231,855 $238,810 Fuel See Detail $159,600 $152,044 $152,044 $152,044 $152,044 $152,044 $152,044 CenCom See Detail $500,000 $515,000 $530,450 $546,364 $562,754 $579,637 $597,026 Debt Service See Detail $360,000 $410,000 $380,000 $380,000 $380,000 $380,000 $380,000 Total Major Expenditures $7,842,148 $8,341,435 $8,704,388 $9,089,583 $9,494,304 $9,923,337 $10,378,930 Other Salaries & Benefits 2.5% Annually $320,000 $328,000 $336,200 $344,605 $353,220 $362,051 $371,102 (1) Operating Supplies/Expenses 2.5% Annually $565,375 $794,509 $814,372 $834,731 $855,600 $876,990 $898,914 Contractual Services 2.5% Annually $451,975 $463,274 $474,856 $486,728 $498,896 $511,368 $524,152 Professional Services 2.5% Annually $334,050 $342,401 $350,961 $359,735 $368,729 $377,947 $387,396 Utilities 2.5% Annually $107,760 $110,454 $113,215 $116,046 $118,947 $121,921 $124,969 Minor Capital Outlay 0% Annually $1,200 $1,200 $1,200 $1,200 $1,200 $1,200 $1,200 Total Other Expenditures $1,780,360 $2,039,839 $2,090,805 $2,143,045 $2,196,591 $2,251,476 $2,307,733 Total Expenditures $9,622,508 $10,381,274 $10,795,193 $11,232,629 $11,690,895 $12,174,813 $12,686,663 Operating Variance $279,363 ($11,168) ($225,125) $147,333 $563,573 $711,837 $405,544 One-Time Transfers $0 $0 $0 $0 $0 $0 $0 Unassigned Fund Balance 4/30 $8,035,837 $8,024,669 $7,799,544 $7,946,877 $8,510,450 $9,222,287 $9,627,831 % of Revenues 81.15% 77.38% 73.79% 69.83% 69.45% 71.56% 73.54% 35 P a g e
36 Water & Sewer Funds 11, 12, 13 Increase Factor Water Charges See Detail $3,263,840 $3,326,202 $3,425,070 $3,529,235 $3,635,165 $3,744,626 $3,855,852 Customer Fee 0% Annually $496,500 $496,500 $496,500 $496,500 $496,500 $496,500 $496,500 Sewer Fee 0% Annually $373,440 $373,440 $373,440 $373,440 $373,440 $373,440 $373,440 Water Sales-Other Communities 0% Annually $235,116 $210,330 $216,030 $0 $0 $0 $0 Total Major Revenues See Detail $4,368,896 $4,406,472 $4,511,040 $4,399,175 $4,505,105 $4,614,566 $4,725,792 Interest Income 2% Annually $1,000 $1,020 $1,040 $1,061 $1,082 $1,104 $1,126 Fines 0% Annually $240,000 $240,000 $240,000 $240,000 $240,000 $240,000 $240,000 Charges for Service 0% Annually $36,943 $36,943 $36,943 $36,943 $36,943 $36,943 $36,943 Recurring Revenues $277,943 $277,963 $277,983 $278,004 $278,025 $278,047 $278,069 Contributions & Grants 0% Annually $75,000 $0 $0 $0 $0 $0 $0 Use of Reserves $715,000 $715,000 $0 $0 $0 $0 $0 Non-Recurring Revenues $790,000 $715,000 $0 $0 $0 $0 $0 Total Revenues $5,436,839 $5,399,435 $4,789,023 $4,677,179 $4,783,130 $4,892,613 $5,003,861 FT Salaries See Detail $863,815 $860,500 $886,500 $913,000 $940,000 $968,000 $996,500 FICA (SS/MED) See Detail $66,082 $65,828 $67,817 $69,845 $71,910 $74,052 $76,232 Health Insurance See Detail $231,000 $237,545 $261,300 $279,591 $299,162 $320,103 $342,511 Pension-IMRF See Detail $98,652 $102,535 $108,999 $115,848 $123,050 $130,694 $138,804 Purchase of Water See Detail $1,830,400 $1,901,900 $1,894,750 $1,756,860 $1,868,720 $1,934,520 $1,934,520 Liability & WC Insurance See Detail $97,500 $121,295 $137,672 $141,743 $146,018 $150,506 $155,219 Equipment Replacement See Detail $125,070 $210,224 $206,382 $197,712 $188,977 $158,441 $154,608 Debt Service See Detail $169,650 $169,650 $169,650 $169,650 $169,650 $169,650 $169,650 Debt Service - Future Issue See Detail Total Major Expenditures $3,482,169 $3,669,477 $3,733,071 $3,644,249 $3,807,487 $3,905,967 $3,968,043 Other Salaries & Benefits 2.5% Annually $45,800 $46,945 $48,119 $49,322 $50,555 $51,818 $53,114 Operating Supplies/Expenses 2.5% Annually $229,390 $235,125 $241,003 $247,028 $253,204 $259,534 $266,022 Contractual Services 2.5% Annually $252,555 $258,869 $265,341 $271,974 $278,773 $285,743 $292,886 Professional Services 2.5% Annually $88,810 $91,030 $93,306 $95,639 $98,030 $100,480 $102,992 Utilities 2.5% Annually $105,700 $108,343 $111,051 $113,827 $116,673 $119,590 $122,580 Minor Capital Outlay 2.5% Annually $82,870 $84,942 $87,065 $89,242 $91,473 $93,760 $96,104 Sewer Televising Program 0% Annually $100,000 $100,000 $100,000 $100,000 $100,000 $100,000 $100,000 Capital Outlay -Sewer (13) 0% Annually $273,440 $273,440 $273,440 $273,440 $273,440 $273,440 $273,440 Capital Outlay - Water (12) 0% Annually $1,125,000 $915,000 $200,000 $200,000 $200,000 $200,000 $200,000 Total Other Expenditures $2,303,565 $2,113,693 $1,419,324 $1,440,472 $1,462,147 $1,484,365 $1,507,138 Total Expenditures $5,785,734 $5,783,170 $5,152,395 $5,084,720 $5,269,634 $5,390,332 $5,475,182 Operating Variance ($348,895) ($383,735) ($363,372) ($407,542) ($486,504) ($497,719) ($471,320) 36 P a g e
37 Motor Fuel Tax Fund - 21 Conservative Model Conservative Model Increase Factor Motor Fuel Tax Allotment See Detail $662,110 $648,868 $635,890 $623,173 $610,709 $598,495 $586,525 Total Major Revenues See Detail $662,110 $648,868 $635,890 $623,173 $610,709 $598,495 $586,525 Interest Income 2% Annually $0 $1,000 $1,020 $1,040 $1,061 $1,082 $1,104 Recurring Revenues $0 $1,000 $1,020 $1,040 $1,061 $1,082 $1,104 Contributions & Grants 0% Annually $212,295 $0 $0 $0 $0 $0 $0 BAB Credit 0% Annually $46,960 $44,140 $41,060 $37,515 $33,608 $29,618 $29,618 Non-Recurring Revenues $259,255 $44,140 $41,060 $37,515 $33,608 $29,618 $29,618 Total Revenues $921,365 $694,008 $677,970 $661,728 $645,378 $629,195 $617,247 Debt Service See Detail $349,175 $346,113 $342,313 $342,188 $336,025 $334,625 $334,626 Total Major Expenditures $349,175 $346,113 $342,313 $342,188 $336,025 $334,625 $334,626 (1) Operating Supplies/Expenses 2.5% Annually $222,930 $0 $0 $0 $0 $0 $0 Professional Services 2.5% Annually $22,500 $45,000 $45,000 $45,000 $45,000 $45,000 $45,000 (2) Capital Outlay 0% Annually $629,500 $300,000 $300,000 $300,000 $300,000 $300,000 $300,000 Total Other Expenditures $874,930 $345,000 $345,000 $345,000 $345,000 $345,000 $345,000 Total Expenditures $1,224,105 $691,113 $687,313 $687,188 $681,025 $679,625 $679,626 Operating Variance ($302,740) $2,895 ($9,342) ($25,459) ($35,647) ($50,430) ($62,379) * Budget includes planned drawdown of $302,740 due to the timing of capital projects (1) Starting in, road maintenance materials moved from MFT fund to General Fund ($225,000) (2) Starting in, road maintenance activities moved from MFT to General Capital Fund ($200,000) 37 P a g e
38 Baseline Model Baseline Model Increase Factor Motor Fuel Tax Allotment See Detail $662,110 $662,110 $662,110 $662,110 $662,110 $662,110 $662,110 Total Major Revenues See Detail $662,110 $662,110 $662,110 $662,110 $662,110 $662,110 $662,110 Interest Income 2% Annually $0 $1,000 $1,020 $1,040 $1,061 $1,082 $1,104 Recurring Revenues $0 $1,000 $1,020 $1,040 $1,061 $1,082 $1,104 Contributions & Grants 0% Annually $212,295 $0 $0 $0 $0 $0 $0 BAB Credit 0% Annually $46,960 $44,140 $41,060 $37,515 $33,608 $29,618 $29,618 Non-Recurring Revenues $259,255 $44,140 $41,060 $37,515 $33,608 $29,618 $29,618 Total Revenues $921,365 $707,250 $704,190 $700,665 $696,779 $692,810 $692,832 Debt Service See Detail $349,175 $346,113 $342,313 $342,188 $336,025 $334,625 $334,626 Total Major Expenditures $349,175 $346,113 $342,313 $342,188 $336,025 $334,625 $334,626 (1) Operating Supplies/Expenses 2.5% Annually $222,930 $0 $0 $0 $0 $0 $0 Professional Services 2.5% Annually $22,500 $45,000 $45,000 $45,000 $45,000 $45,000 $45,000 (2) Capital Outlay 0% Annually $629,500 $300,000 $300,000 $300,000 $300,000 $300,000 $300,000 Total Other Expenditures $874,930 $345,000 $345,000 $345,000 $345,000 $345,000 $345,000 Total Expenditures $1,224,105 $691,113 $687,313 $687,188 $681,025 $679,625 $679,626 Operating Variance ($302,740) $16,138 $16,878 $13,478 $15,754 $13,185 $13,206 * Budget includes planned drawdown of $302,740 due to the timing of capital projects (1) Starting in, road maintenance materials moved from MFT fund to General Fund ($225,000) (2) Starting in, road maintenance activities moved from MFT to General Capital Fund ($200,000) 38 P a g e
39 Aggressive Model Aggressive Model Increase Factor Motor Fuel Tax Allotment See Detail $662,110 $675,352 $688,859 $702,636 $716,689 $731,023 $745,643 Total Major Revenues See Detail $662,110 $675,352 $688,859 $702,636 $716,689 $731,023 $745,643 Interest Income 2% Annually $0 $1,000 $1,020 $1,040 $1,061 $1,082 $1,104 Recurring Revenues $0 $1,000 $1,020 $1,040 $1,061 $1,082 $1,104 Contributions & Grants 0% Annually $212,295 $0 $0 $0 $0 $0 $0 BAB Credit 0% Annually $46,960 $44,140 $41,060 $37,515 $33,608 $29,618 $29,618 Non-Recurring Revenues $259,255 $44,140 $41,060 $37,515 $33,608 $29,618 $29,618 Total Revenues $921,365 $720,492 $730,939 $741,192 $751,358 $761,723 $776,365 Debt Service See Detail $349,175 $346,113 $342,313 $342,188 $336,025 $334,625 $334,626 Total Major Expenditures $349,175 $346,113 $342,313 $342,188 $336,025 $334,625 $334,626 (1) Operating Supplies/Expenses 2.5% Annually $222,930 $0 $0 $0 $0 $0 $0 Professional Services 2.5% Annually $22,500 $45,000 $45,000 $45,000 $45,000 $45,000 $45,000 (2) Capital Outlay 0% Annually $629,500 $300,000 $300,000 $300,000 $300,000 $300,000 $300,000 Total Other Expenditures $874,930 $345,000 $345,000 $345,000 $345,000 $345,000 $345,000 Total Expenditures $1,224,105 $691,113 $687,313 $687,188 $681,025 $679,625 $679,626 Operating Variance ($302,740) $29,380 $43,627 $54,004 $70,333 $82,098 $96,739 * Budget includes planned drawdown of $302,740 due to the timing of capital projects (1) Starting in, road maintenance materials moved from MFT fund to General Fund ($225,000) (2) Starting in, road maintenance activities moved from MFT to General Capital Fund ($200,000) 39 P a g e
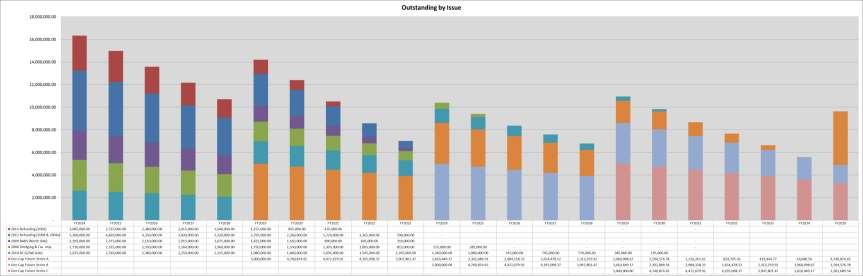
40 Debt Forecast Summary The Village currently has four outstanding General Obligation debt issues. The Village utilizes debt to fund major capital projects that cannot otherwise be financed through traditional revenue streams. The Village plans to utilize future debt to fund major capital reconstruction projects primarily in the South and Southwest section of the Village. Infrastructure in these areas in some instances is in need of major reconstruction to be brought up to modern standards and included in a regular maintenance plan. As part of the Village s overall capital plan, the Village s long-term debt plan provides for the lowering of the overall debt burden while providing funding for infrastructure improvements. The Village plans to utilize General Obligation debt to fund $5m for infrastructure every 5 years by issuing 15 year GO bonds every 5 th year. In addition to the pay-as-go portion of capital spending, this financing mechanism is the basis for funding the Multi- Year Capital Plan. More information regarding the Village s capital plans can be found in the Multi-Year Capital Plan document. The Forecast assumes 3.5% interest and a 15 year term with equal debt service payments for the future issues. The Following charts depict the Village s anticipated debt issuances and burden over the next 5 and 20 years. 5-Year Forecast Total G.O. Debt Service Obligations Fiscal Gross of Credit Year Balance 4/30 Principal Interest Total P&I ,325, ,345, , ,948, ,975, ,350, , ,945, ,590, ,385, , ,939, ,170, ,420, , ,933, ,710, ,460, , ,928, ,205, ,505, , ,926, ,390, ,814, , ,358, P a g e
41 20-Year Forecast Total G.O. Debt Service Obligations Fiscal Gross of Credit Year Balance 4/30 Principal Interest Total P&I ,325, ,345, , ,948, ,975, ,350, , ,945, ,590, ,385, , ,939, ,170, ,420, , ,933, ,710, ,460, , ,928, ,205, ,505, , ,926, ,390, ,814, , ,358, ,517, ,873, , ,353, ,575, ,942, , ,355, ,017, ,557, , ,898, ,405, ,612, , ,896, ,408, , , ,394, ,371, ,036, , ,394, ,594, , , ,092, ,791, , , ,087, ,955, , , ,087, ,833, ,122, , ,515, ,673, ,160, , ,509, ,674, , , ,302, ,640, ,033, , ,302, ,585, ,055, , ,287, ,638, , , ,302, P a g e

42 42 P a g e
Financial Planning & Reporting Process
 Financial Planning & Reporting Process Planning Planning Planning Reporting Reporting Reporting Multi-Year Financial Forecast Multi-Year Capital Plan Annual Monthly Treasurer's Report Annual Financial
VILLAGE OF. Financial Status Report. Quarter Ended July 31, Kristina M. Kovarik Mayor Patrick Muetz - Administrator Andy Harris - Clerk
 VILLAGE OF Financial Status Report Quarter Ended July 31, 2018 Kristina M. Kovarik Mayor Patrick Muetz - Administrator Andy Harris - Clerk Jeanne Balmes Trustee Greg Garner Trustee Thomas Hood Trustee
Village of University Park, Illinois. Financial Report April 30, 2008
 Financial Report April 30, 2008 Table of Contents Financial Section Independent Auditor s Report 1 2 Required Supplemental Information Management Discussion and Analysis (MD&A) 3 12 Basic Financial Statements
Strategic Plan of Work & Projections. Development of the Plan of Work
 Strategic Plan of Work & Projections The Strategic Plan of Work & Projections portion of this document provides a narrative discussion of the County s longterm planning process and links the policy making
SPECIAL CITY COUNCIL MEETING
 SPECIAL CITY COUNCIL MEETING Tuesday, November 5, 2013 6:15 p.m. CITY OF EVANSTON, ILLINOIS Room 2404 Lorraine H. Morton Civic Center 2100 Ridge Avenue, Evanston, IL ORDER OF BUSINESS I. Roll Call- Begin
Village of University Park, Illinois
 Financial Report April 30, 2007 McGladrey & Pullen, LLP is a member firm of RSM International an affiliation of separate and independent legal entities. Table of Contents Financial Section Independent
Village of Carpentersville Fund Financial Performance Summary As of January 31, 2017 YTD
 To: From: Subject: Memorandum J Mark Rooney, Village Manager Hitesh Desai, Finance Director Katrina Hanna, Assistant Finance Director December 2016 Monthly Staff and Financial Report Date: February 21,
BUDGET FOOTNOTES GENERAL FUND REVENUES
 1. Property Tax: ($2,740,000) - In accordance with statutory requirements, each November, the Village Board considers and approves a property tax levy ordinance which directs DuPage County to collect a
BUDGET AND APPROPRIATION ORDINANCE FISCAL YEAR ORDINANCE NO.
 BUDGET AND APPROPRIATION ORDINANCE FISCAL YEAR 2018-2019 ORDINANCE NO. AN ORDINANCE ADOPTING THE COMBINED ANNUAL BUDGET AND APPROPRIATION OF FUNDS FOR THE VILLAGE OF RIVERDALE, COOK COUNTY, ILLINOIS FOR
Village of University Park, Illinois
 Financial Report April 30, 2006 McGladrey & Pullen, LLP is a member firm of RSM International an affiliation of separate and independent legal entities. Table of Contents Financial Section Independent
Village of Volo, Illinois
 Village of Volo, Illinois Annual Financial Report For the Year Ended April 30, 2014 Wolf & Company LLP Certified Public Accountants Table of Contents INDEPENDENT AUDITOR'S REPORT 1-2 PAGE MANAGEMENT S
VILLAGE OF FOREST PARK, ILLINOIS. ANNUAL FINANCIAL REPORT Year Ended April 30, 2013
 ANNUAL FINANCIAL REPORT ANNUAL FINANCIAL REPORT CONTENTS Independent Auditor s Report... 1 REQUIRED SUPPLEMENTARY INFORMATION: Management s Discussion and Analysis... 3 BASIC FINANCIAL STATEMENTS: Government-wide
MAJOR REVENUE SOURCES - GENERAL FUND
 Introduction The City of Geneva has developed a diverse base of revenues to fund its operational and capital needs. The purpose of this section is to describe the major revenue sources and trends and how
Memorandum. Village of Carpentersville Fund Financial Performance Summary As of August 31, Fund Number Revenue Expenditure Net
 Memorandum To: J Mark Rooney, Village Manager From: Hitesh Desai, Finance Director Katrina Hanna, Assistant Finance Director Subject: August 2017 Monthly Staff and Financial Report Date: September 22,
BUDGET FOOTNOTES GENERAL FUND REVENUES
 1. Property Tax: ($2,888,000) - In accordance with statutory requirements, each November, the Village Board considers and approves a property tax levy ordinance which directs DuPage County to collect a
SYCAMORE CITY COUNCIL AGENDA January 22, 2019
 SYCAMORE CITY COUNCIL AGENDA January 22, 2019 CITY COUNCIL COMMITTEE MEETINGS No Meetings Scheduled REGULAR CITY COUNCIL MEETING 7:00 P.M. 1. CALL TO ORDER AND ROLL CALL 2. INVOCATION 3. PLEDGE OF ALLEGIANCE
VILLAGE OF DOLTON, ILLINOIS ANNUAL FINANCIAL REPORT
 VILLAGE OF DOLTON, ILLINOIS ANNUAL FINANCIAL REPORT FOR THE FISCAL YEAR ENDED APRIL 30, 2017 TABLE OF CONTENTS FINANCIAL SECTION PAGE INDEPENDENT AUDITORS' REPORT... 1-2 MANAGEMENT S DISCUSSION AND ANALYSIS...
VILLAGE OF ELMWOOD PARK, ILLINOIS. ANNUAL FINANCIAL REPORT Year Ended April 30, 2016
 ANNUAL FINANCIAL REPORT Year Ended April 30, 2016 ANNUAL FINANCIAL REPORT Year Ended April 30, 2016 TABLE OF CONTENTS FINANCIAL SECTION... Page Independent Auditor s Report... 1 Required Supplementary
ORDINANCE NO. BE IT ORDAINED by the President and the Board of Trustees of the Village of Mundelein, Lake County, Illinois:
 ORDINANCE NO. Annual Appropriation Ordinance of the Village of Mundelein, Lake County, Illinois for the Fiscal Year beginning May 1, 2013 and ending April 30, 2014. BE IT ORDAINED by the President and
Chicago s Budget CENTER FOR TAX AND BUDGET ACCOUNTABILITY. Presented by: Ralph Martire Executive Director
 CENTER FOR TAX AND BUDGET ACCOUNTABILITY 70 E. Lake Street! Suite 1700! Chicago, Illinois 60601! direct: 312.332.1049! Email: rmartire@ctbaonline.org Chicago s Budget Presented by: Ralph Martire Executive
Village of Buffalo Grove. FY Five Year General Fund Operating Forecast
 Village of Buffalo Grove FY 2014-2018 Five Year General Fund Operating Forecast VILLAGE OF BUFFALO GROVE Purpose: The goal of the Five-Year Operating Forecast is to evaluate the Village s ability to meet
Quarterly Budget Report
 City of Chicago Quarterly Report 2 nd Quarter Mayor Rahm Emanuel Quarterly Report-2 nd Quarter Content and Purpose This quarterly report presents an overview of the City s operating revenues and expenditures
Village of Chicago Ridge, Illinois
 Comprehensive Annual Financial Report Year Ended Comprehensive Annual Financial Report Year Ended Contents Introductory Section List of Elected and Appointed Officials... i Organization Chart... ii Financial
VILLAGE OF DOLTON, ILLINOIS ANNUAL FINANCIAL REPORT
 VILLAGE OF DOLTON, ILLINOIS ANNUAL FINANCIAL REPORT FOR THE FISCAL YEAR ENDED APRIL 30, 2016 V IL LAG E OF D O L T O N, ILLIN O IS TABLE OF CONTENTS FINANCIAL SECTION PAGE INDEPENDENT AUDITORS' R E P O
JO DAVIESS COUNTY, ILLINOIS FY2015 ANNUAL BUDGET TAX LEVY ORDINANCE APPROPRIATIONS ORDINANCE
 JO DAVIESS COUNTY, ILLINOIS ANNUAL BUDGET TAX LEVY ORDINANCE APPROPRIATIONS ORDINANCE Approved November 18, TABLE OF CONTENTS SUMMARY OF BUDGET...1-34 BUDGET PREPARATION SCHEDULE...35 ORGANIZATIONAL CHART...36
VILLAGE OF ELMWOOD PARK, ILLINOIS. ANNUAL FINANCIAL REPORT Year Ended April 30, 2013
 ANNUAL FINANCIAL REPORT Year Ended April 30, 2013 ANNUAL FINANCIAL REPORT Year ended April 30, 2013 CONTENTS FINANCIAL SECTION: Independent Auditor s Report... 1 REQUIRED SUPPLEMENTARY INFORMATION: Management
Quarterly Budget Report
 City of Chicago Quarterly Budget Report 1st & 2nd Quarters 2016 Mayor Rahm Emanuel Content and Purpose This report presents an overview of the City s operating revenues and expenditures for the first and
Water Services Rate Study
 Report on the Water Services Rate Study Town of Telluride, Colorado Project No. 72447 August 2013 Water Services Rate Study prepared for Town of Telluride, Colorado August 2013 Project No. 72447 prepared
VILLAGE OF ISLAND LAKE, ILLINOIS
 G R A 44 N. Walkup Ave. Crystal Lake, IL 60014 T: 815-459-0700 GRA-CPA.COM Accounting Auditing Consulting VILLAGE OF ISLAND LAKE, ILLINOIS ANNUAL FINANCIAL REPORT WITH SUPPLEMENTARY INFORMATION YEAR ENDED
FY 2009 Annual Financial Report Multi-Purpose Long Form
 FY 2009 Annual Financial Report Multi-Purpose Long Form CC Copy - 12/30/2009 10:37:27AM DO NOT SEND THIS PAPER COPY - THIS IS YOUR COPY. MAKE SURE YOU HAVE CLICKED THE SUBMIT BUTTON IN THE COMPTROLLER
City of Oregon Oregon, Illinois
 City of Oregon Oregon, Illinois Annual Financial Report April 30, 2018 Year Ended April 30, 2018 Table of Contents Independent Auditor s Report 1-2 Management Discussion and Analysis 3-8 Basic Financial
Board of Education Meeting Monday, November 14, 2011
 Board of Education Meeting Monday, November 14, 2011 Equalized Assesses Valuation (EAV) New Property (Construction) Property Tax Extension Limitation Law (PTELL) Consumer Price Index (CPI) Tax Rates What
CITY OF FREEPORT, ILLINOIS ANNUAL FINANCIAL REPORT
 ANNUAL FINANCIAL REPORT FOR THE FISCAL YEAR ENDED APRIL 30, 2017 TABLE OF CONTENTS FINANCIAL SECTION PAGE INDEPENDENT AUDITORS' REPORT... 1-3 MANAGEMENT S DISCUSSION AND ANALYSIS... MD&A 1-11 BASIC FINANCIAL
Financial Management Plan for the Palatine Public Library District
 March 2, 2018 Financial Management Plan for the Ehlers Advisors: John Piemonte Municipal Advisor jpiemonte@ehlers-inc.com Jessica Cook Senior Financial Specialist jcook@ehlers-inc.com Anthony Kalina Financial
DuPage County, Illinois Statement of Financing Sources, Expenditures and Transfers All Funds 1. FY2016 Actual
 Statement of Financing Sources, Expenditures and Transfers All Funds FY205 Actual FY206 Actual FY207 Original Budget Approved Revenue/Sources Property Taxes $ 48,757,498 $ 48,874,403 $ 48,70,650 $ 48,88,00
G R A CITY OF MARENGO, ILLINOIS. Accounting Auditing Consulting. N. Walkup Ave. Crystal Lake, IL T: GRA-CPA.COM
 G R A 44 N. Walkup Ave. Crystal Lake, IL 60014 T: 815-459-0700 GRA-CPA.COM Accounting Auditing Consulting CITY OF MARENGO, ILLINOIS Annual Financial Report For the CONTENTS Independent Auditors' Report
Five Year General Fund Operating Forecast
 Village of Buffalo Grove Five Year General Fund Operating Forecast FY 2015-2019 VILLAGE OF BUFFALO GROVE Purpose The goal of the Five-Year Operating Forecast is to assess the Village s ability over the
COMPREHENSIVE ANNUAL FINANCIAL REPORT
 Village of Park Forest, Illinois COMPREHENSIVE ANNUAL FINANCIAL REPORT Fiscal Year Ended June 30, 2017 COMPREHENSIVE ANNUAL FINANCIAL REPORT OF THE VILLAGE OF PARK FOREST, ILLINOIS As of and for the Year
School District Property Tax Information. Donna Oberg Todd Latham Geneva Community Unit School District #304
 School District Property Tax Information Donna Oberg Todd Latham Geneva Community Unit School District #304 Tax Levy General Information Tax Levy The amount of dollars in each operating fund a school district
Quarterly Budget Report
 City of Chicago Quarterly Report 1st Quarter Mayor Rahm Emanuel Quarterly Report-1st Quarter Content and Purpose This quarterly report presents an overview of the City s operating revenues and expenditures
City of Oak Forest, Illinois
 City of Oak Forest, Illinois Comprehensive Annual Financial Report For the Fiscal Year Ended April 30, 2015 Prepared by: Finance Department Colleen Julian Finance Director COMPREHENSIVE ANNUAL FINANCIAL
Village of Skokie, Illinois. Comprehensive Annual Financial Report
 Village of Skokie, Illinois Comprehensive Annual Financial Report Year Ending April 30, 2011 COMPREHENSIVE ANNUAL FINANCIAL REPORT For the Year Ended April 30, 2011 Prepared by the Finance Department Robert
FY 2017 Annual Financial Report
 STATE OF ILLINOIS COMPTROLLER SUSANA A. MENDOZA DO NOT SEND THIS PAPER COPY - THIS IS YOUR COPY. MAKE SURE YOU HAVE CLICKED THE SUBMIT BUTTON IN THE COMPTROLLER CONNECT PROGRAM. THIS WILL PROVIDE THE COMPTROLLER'S
Water and Sewer Rate Study
 Water and Sewer Rate Study Presentation to the Village Board April 26, 2016 Presented by: Eric Callocchia Manager Contents 1 2 3 4 5 6 7 8 Rate Study Background and Purpose Projected Expenses Projected
510 Green Bay Road, Winnetka, Illinois Administration and Finance (847) or
 or") October 20, 2016 Village President Members of the Village Council, and Village Manager It is our privilege to present for your review and consideration the proposed 2017 Annual Budget and Capital Improvement
October 20, 2016 Village President Members of the Village Council, and Village Manager It is our privilege to present for your review and consideration the proposed 2017 Annual Budget and Capital Improvement
TOWN OF ORO VALLEY WATER UTILITY COMMISSION WATER RATES ANALYSIS REPORT OCTOBER 7, 2009
 TOWN OF ORO VALLEY WATER UTILITY COMMISSION WATER RATES ANALYSIS REPORT OCTOBER 7, 2009 EXECUTIVE SUMMARY The functions and duties of the Oro Valley Water Utility Commission include reviewing and developing
Village of Skokie. Fiscal Year 2012 (FY12) Budget Presentation. April 6, 2011
 Budget Presentation. April 6, 2011") Village of Skokie Fiscal Year 2012 (FY12) Budget Presentation April 6, 2011 FY12 Proposed Budget Village Continues to Navigate Challenging Economic Times Tradition of careful financial management Controlled
Village of Skokie Fiscal Year 2012 (FY12) Budget Presentation April 6, 2011 FY12 Proposed Budget Village Continues to Navigate Challenging Economic Times Tradition of careful financial management Controlled
INTRODUCTORY SECTION. Principal Officials... Organizational Chart... Certificate of Achievement for Excellence in Financial Reporting...
 TABLE OF CONTENTS Page(s) INTRODUCTORY SECTION Principal Officials... Organizational Chart... Certificate of Achievement for Excellence in Financial Reporting... Letter of Transmittal... i ii iii iv-ix
City of North Chicago, Illinois
 Annual Financial Report Year Ended Annual Financial Report Table of Contents For the Year Ended Page INDEPENDENT AUDITORS' REPORT 1-3 MANAGEMENT'S DISCUSSION AND ANALYSIS (UNAUDITED) 4-12 BASIC FINANCIAL
FY 2016 Annual Financial Report
 STATE OF ILLINOIS COMPTROLLER SUSANA A. MENDOZA DO NOT SEND THIS PAPER COPY - THIS IS YOUR COPY. MAKE SURE YOU HAVE CLICKED THE SUBMIT BUTTON IN THE COMPTROLLER CONNECT PROGRAM. THIS WILL PROVIDE THE COMPTROLLER'S
FY 2015 Annual Financial Report
 STATE OF ILLINOIS COMPTROLLER LESLIE GEISSLER MUNGER DO NOT SEND THIS PAPER COPY - THIS IS YOUR COPY. MAKE SURE YOU HAVE CLICKED THE SUBMIT BUTTON IN THE COMPTROLLER CONNECT PROGRAM. THIS WILL PROVIDE
Ad Valorem Taxes. Description of Revenue Source. Revenue Assumptions
 Ad Valorem Taxes Ad Valorem Taxes are taxes paid on real and personal property located within the Village s corporate limits. Taxes for real and personal property, excluding motor vehicles, are levied
VILLAGE OF CARPENTERSVILLE Carpentersville, Illinois
 Carpentersville, Illinois FINANCIAL STATEMENTS Including Independent Auditors' Report For the Year Ended TABLE OF CONTENTS Independent Auditors' Report Management's Discussion and Analysis i -ii iii -
This page intentionally left blank
 FINANCIAL POLICIES This section contains the financial policies which guide the operations of the Village. From time to time, new policies or changes to existing policies are recommended by the Finance
Submitted herewith is the adopted operating budget for fiscal year
 To the Residents of Pasadena: Submitted herewith is the adopted operating budget for fiscal year 2009-2010. The economic uncertainty which has plagued our nation for much of the past year had a negative
FY 2016 Annual Financial Report
 STATE OF ILLINOIS COMPTROLLER SUSANA A. MENDOZA DO NOT SEND THIS PAPER COPY - THIS IS YOUR COPY. MAKE SURE YOU HAVE CLICKED THE SUBMIT BUTTON IN THE COMPTROLLER CONNECT PROGRAM. THIS WILL PROVIDE THE COMPTROLLER'S
Village of Oak Park, IL Department of Finance. Quarterly Finance and Performance Report 2016, 1st Quarter
 Village of Oak Park, IL Department of Finance Quarterly Finance and Performance Report 2016, 1st Quarter May, 2016 Table of Contents Section 1: Introduction... 3 Section 2: 1 st Quarter Financial Report
Town Council/School Committee. Initial Budget Hearing. December 20, 2012
 Town Council/School Committee Initial Budget Hearing December 20, 2012 Goals to be Accomplished Provide general information relative to South Kingstown s Budget Development and Adoption Process. Provide
VILLAGE OF RICHMOND, ILLINOIS ANNUAL FINANCIAL REPORT
 VILLAGE OF RICHMOND, ILLINOIS ANNUAL FINANCIAL REPORT FOR THE FISCAL YEAR ENDED APRIL 30, 2015 VILLAGE OF RICHMOND TABLE OF CONTENTS APRIL 30, 2015 PAGE INDEPENDENT AUDITOR S REPORT 1 REQUIRED SUPPLEMENTARY
VILLAGE OF HAWTHORN WOODS, ILLINOIS COMPREHENSIVE ANNUAL FINANCIAL REPORT
 VILLAGE OF HAWTHORN WOODS, ILLINOIS COMPREHENSIVE ANNUAL FINANCIAL REPORT FOR THE YEAR ENDED DECEMBER 31, 2013 COMPREHENSIVE ANNUAL FINANCIAL REPORT For the Year Ended December 31, 2013 Prepared By The
The Village has had Village. age of. repair. were were 10,000 9,000. 8,000 Gallons 7,000 6,000 5,000 4, Even with the.
 VILLAGE OF BUFFALO GROVE TO: Dane C. Bragg, Village Manager FROM: Scott D. Anderson, Finance Director DATE: September 14, 2011 RE: Water Fund 20 Year Pro Forma / Rate Recommendations History of Water and
G R A CITY OF MARENGO, ILLINOIS. Accounting Auditing Consulting. N. Walkup Ave. Crystal Lake, IL T: GRA-CPA.COM
 G R A 44 N. Walkup Ave. Crystal Lake, IL 60014 T: 815-459-0700 GRA-CPA.COM Accounting Auditing Consulting CITY OF MARENGO, ILLINOIS Annual Financial Report For the CONTENTS Independent Auditors' Report
CITY OF ROCK FALLS, ILLINOIS
 ANNUAL FINANCIAL REPORT For the Year Ended April 30, 2018 TABLE OF CONTENTS Page(s) FINANCIAL SECTION INDEPENDENT AUDITOR S REPORT... 1-3 GENERAL PURPOSE EXTERNAL FINANCIAL STATEMENTS Basic Financial Statements
Executive Summary Operating Budget and Forecast
 The 2014 Budget Discussion Document presents the proposed 2014 operating budget, 2015-2016 forecasts and the 2014 Capital Budget for the Town of Oakville. The document represents the outcome of the 2014
VILLAGE OF HARWOOD HEIGHTS, ILLINOIS COMPREHENSIVE ANNUAL FINANCIAL REPORT. For the Year Ended April 30, 2006
 COMPREHENSIVE ANNUAL FINANCIAL REPORT For the Year Ended April 30, 2006 Prepared by: Finance Department TABLE OF CONTENTS Page(s) INTRODUCTORY SECTION Principal Officials... Organizational Chart... Letter
Village of Kenilworth Fiscal Year 2019 Adopted Budget
 F Village of Kenilworth Fiscal Year 2019 Adopted FY 16 Delta FY18B v. FY19P 23 GENERAL FUND Total General Operating Revenues: 4,793,044 4,514,062 4,429,149 3,993,544 4,584,330 4,491,415 62,266 Administration
Table of Contents. Transmittal... i Introduction Executive Overview...1 Organization Chart...7. Community Profile...8. GFOA Budget Award...
 Table of Contents Transmittal... i Introduction Executive Overview...1 Organization Chart...7 Community Profile...8 GFOA Budget Award...18 Budget Calendar...19 How to use this document...20 General Fund
City of Ocala. Fiscal Year Proposed General & Ancillary Funds Budget - Summary. Ocala is a great place to live, play, and prosper
 City of Ocala Fiscal Year 217-218 Proposed General & Ancillary Funds Budget - Summary Ocala is a great place to live, play, and prosper TABLE OF CONTENTS Fiscal Year 217-218 General Fund and Ancillary
FY2018 BUDGET SUMMARY
 FY2018 BUDGET SUMMARY FY2018 Champaign County Budget Revenue $131,443,548 Expenditure $129,690,091 The budget was developed by the County s elected officials and department heads with oversight and review
BUDGET DOCUMENTS DRAFT FISCAL YEAR 2020 CELEBRATING 150 YEARS OF EXCELLENCE IN LOCAL GOVERNMENT GLENCOE VILLAGE OF GLENCOE
 VILLAGE OF GLENCOE DRAFT BUDGET DOCUMENTS FISCAL YEAR 2020 MARCH, 209 FEBRUARY 29, 2020 GLENCOE SESQUICENTENNIAL CELEBRATING 50 YEARS OF EXCELLENCE IN LOCAL GOVERNMENT 869-209 DRAFT BUDGET GUIDE Welcome
DUPAGE COUNTY PROPOSED FY2012 FINANCIAL PLAN: Analysis and Recommendations
 DUPAGE COUNTY PROPOSED FY2012 FINANCIAL PLAN: Analysis and Recommendations October 21, 2011 Table of Contents EXECUTIVE SUMMARY... 2 CIVIC FEDERATION POSITION... 4 ISSUES THE CIVIC FEDERATION SUPPORTS...
FY 2016 Annual Financial Report
 STATE OF ILLINOIS COMPTROLLER SUSANA A. MENDOZA DO NOT SEND THIS PAPER COPY - THIS IS YOUR COPY. MAKE SURE YOU HAVE CLICKED THE SUBMIT BUTTON IN THE COMPTROLLER CONNECT PROGRAM. THIS WILL PROVIDE THE COMPTROLLER'S
The City of Sierra Madre
 The City of Sierra Madre Comprehensive Water and Wastewater Cost of Service Study Report / December 24, 2018 24640 Jefferson Avenue Suite 207 Murrieta, CA 92562 Phone 951.698.0145 www.raftelis.com December
Village of Frankfort FY Budget
 Village of Frankfort FY 2013-2014 Budget Adopted April 29, 2013 MAYOR Jim Holland VILLAGE CLERK Robert J. Kennedy VILLAGE TRUSTEES Kevin Egan Mike Stevens Cynthia Corso Heath Richard Trevarthan Todd S.
VALLEY VIEW SCHOOLS DISTRICT 365U Tax Levy Information
 VALLEY VIEW SCHOOLS DISTRICT 365U 2015 Tax Levy Information Where do we get our funding? Local resources - $184.8 million (73%) mainly comprised of property taxes and user fees State funding - $51.9 million
PEOTONE CUSD 207U 2018 Tax Levy Information
 PEOTONE CUSD 207U 2018 Tax Levy Information Sources of Funding (2017 Receipts) Local Sources of Funding: $17.10 million (85.63%) State Funding: $2.22 million (11.14%) Excludes the on-behalf payment for
CITY OF GALVA, ILLINOIS ANNUAL FINANCIAL REPORT FOR THE YEAR ENDED APRIL 30, 2015
 ANNUAL FINANCIAL REPORT FOR THE YEAR ENDED APRIL 30, 2015 TABLE OF CONTENTS APRIL 30, 2015 Page Independent Auditors' Report... 1, 2 Basic Financial Statements: Government Wide Statements: Statement of
$1,082, , 2017 are as follows: Contracts are below budget by $18,014 (due to new budget amendment passed in May).
.") CITY OF SACO, MAINE Finance 300 Main Street Saco, Maine 04072 Cheryl Fournier, Finance & HR Director Telephone: (207) 282-1032 Email: cheryl.fournier@sacomaine.org Facebook: /sacomaine Twitter: @sacomaine
CITY OF SACO, MAINE Finance 300 Main Street Saco, Maine 04072 Cheryl Fournier, Finance & HR Director Telephone: (207) 282-1032 Email: cheryl.fournier@sacomaine.org Facebook: /sacomaine Twitter: @sacomaine
Village of Sauk Village, Illinois
 Village of Sauk Village, Illinois Annual Financial Report Year Ended ANNUAL FINANCIAL REPORT Year Ended TABLE OF CONTENTS Page Table of Contents i - iii Independent Auditors Report 1-4 Basic Financial
Fiscal Analysis of the City of Palo Alto 2030 Comprehensive Plan
 Draft Report Fiscal Analysis of the City of Palo Alto 2030 Comprehensive Plan Prepared for: City of Palo Alto Prepared by: Economic & Planning Systems, Inc. February 17, 2017 EPS #151010 Table of Contents
VILLAGE OF BRADLEY, ILLINOIS ANNUAL FINANCIAL REPORT
 ANNUAL FINANCIAL REPORT FOR THE FISCAL YEAR ENDED APRIL 30, 2017 TABLE OF CONTENTS INTRODUCTORY SECTION PAGE List of Principal Officials... i FINANCIAL SECTION INDEPENDENT AUDITORS' REPORT... 1-2 MANAGEMENT
SALT CREEK RURAL PARK DISTRICT PALATINE, ILLINOIS ANNUAL FINANCIAL REPORT FOR THE FISCAL YEAR ENDED APRIL 30, 2018
 PALATINE, ILLINOIS ANNUAL FINANCIAL REPORT FOR THE FISCAL YEAR ENDED APRIL 30, 2018 TABLE OF CONTENTS APRIL 30, 2018 Exhibit Page Independent Auditor's Report 1 Required Supplementary Information Management
AGENDA COMMITTEE OF THE WHOLE September 20, :30pm
 1) Proposed Budget FY2017 2) Street Program 2017 Part IV 3) 911 Fund Balance Policy 4) Entry Marker Design AGENDA COMMITTEE OF THE WHOLE September 20, 2016 7:30pm Committee-of-the-Whole Meeting September
2014 BUDGET EXECUTIVE SUMMARY
 2014 BUDGET EXECUTIVE SUMMARY The Village of Streamwood s 2014 Operating and Capital Improvements Budget represents the culmination of efforts by the Village President, Board of Trustees, and staff to
CITY OF MOMENCE, ILLINOIS ANNUAL FINANCIAL REPORT. For the Year Ended April 30, 2012
 ANNUAL FINANCIAL REPORT For the Year Ended April 30, 2012 Certified Public Accountants & Advisors TABLE OF CONTENTS Page(s) INDEPENDENT AUDITOR S REPORT... 1-2 GENERAL PURPOSE EXTERNAL FINANCIAL STATEMENTS
CITY OF VILLA GROVE Villa Grove, Illinois ANNUAL FINANCIAL REPORT. For the Year Ended April 30, 2016
 CITY OF VILLA GROVE Villa Grove, Illinois ANNUAL FINANCIAL REPORT For the Year Ended April 30, 2016 CITY OF VILLA GROVE TABLE OF CONTENTS INDEPENDENT AUDITOR S REPORT... 1-2 MANAGEMENT S DISCUSSION AND
Funding Sources. Total Revenues
 Funding Sources The City s revenues come from a wide variety of sources. Revenues and expenses are categorized according to the State of Florida Uniform Accounting System chart of accounts. These standard
VILLAGE OF RANTOUL & PEER COMMUNITIES TAX AND FEE REVENUE COMPARISONS
 VILLAGE OF RANTOUL & PEER COMMUNITIES TAX AND FEE REVENUE COMPARISONS INTRODUCTION RANTOUL VS. COMPARISON CITIES 1. Bloomington 2. Champaign 3. Danville 4. Mahomet 5. Normal 6. Paxton 7. Rantoul 8. Urbana
VILLAGE OF BELLWOOD, ILLINOIS. ANNUAL FINANCIAL REPORT Year Ended December 31, 2008
 l ANNUAL FINANCIAL REPORT Year Ended December 31, 2008 Prepared by: Department of Finance Roy F. McCampbell Controller DECEMBER 31,2008 CONTENTS INTRODUCTORY SECTION: Officers and Officials...... I FINANCIAL
VILLAGE OF CARPENTERSVILLE Carpentersville, Illinois
 Carpentersville, Illinois FINANCIAL STATEMENTS Including Independent Auditors' Report As of and for the Year Ended April 30, 2012 TABLE OF CONTENTS As of and for the Year Ended April 30, 2012 Independent
City of North Chicago, Illinois
 Annual Financial Report Year Ended Annual Financial Report Table of Contents For the Year Ended Page INDEPENDENT AUDITORS' REPORT 1-3 MANAGEMENT'S DISCUSSION AND ANALYSIS (UNAUDITED) 4-13 BASIC FINANCIAL
CITY OF CHARLESTON, ILLINOIS. FINANCIAL STATEMENTS For the Year Ended April 30, 2015
 FINANCIAL STATEMENTS For the Year Ended April 30, 2015 TABLE OF CONTENTS Page No. INDEPENDENT AUDITOR'S REPORT... 1 INDEPENDENT AUDITOR'S REPORT ON INTERNAL CONTROL OVER FINANCIAL REPORTING AND ON COMPLIANCE
City of Oak Forest, Illinois
 City of Oak Forest, Illinois Comprehensive Annual Financial Report For the Fiscal Year Ended April 30, 2017 Prepared by: Finance Department Colleen Julian Finance Director COMPREHENSIVE ANNUAL FINANCIAL
Strategic Planning Saturday, February 24, :00 a.m. Village Hall
 Strategic Planning Saturday, February 24, 2018 8:00 a.m. Village Hall Strategic Planning Saturday, February 24, 2018 8:00 a.m. Village Hall Agenda 1. Six Month Financial Results 2. Current Year Trends,
3 YEAR BUDGET FORECAST
 3 YEAR BUDGET FORECAST City of Fairview Heights, IL FISCAL YEARS: 2014 2015 2015 2016 2016-2017 Report Date: 6/20/2013 07/03/2013 Page 1 of 16 Revenue Forecast The City of Fairview Heights is a fiscally
OVERVIEW OF BUDGETED RESOURCES
 OVERVIEW OF BUDGETED RESOURCES O V E R V I E W O F B U D G E T E D R E S O U R C E S SUMMARY OF MAJOR REVENUES, EXPENDITURES AND OTHER FINANCING SOURCES/USES Budgeted July 1, 2012 through June 30, 2013
Third Quarter Financial Report Fiscal Year and. Mid-Term Budget Update - Fiscal Year June 15, 2015
 Third Quarter Financial Report Fiscal Year 2014-15 and Mid-Term Budget Update - Fiscal Year 2015-16 June 15, 2015 1 Overview Economic Environment Fiscal Year 2014-2015 Third Quarter Financial Report Fiscal
PINELLAS SUNCOAST TRANSIT AUTHORITY KEY BUDGET ASSUMPTIONS FOR FISCAL YEAR 2016
 PINELLAS SUNCOAST TRANSIT AUTHORITY KEY BUDGET ASSUMPTIONS FOR FISCAL YEAR 2016 PSTA Budget Forecasting Summary Item Assumption Amount Source 3 Yr. Avg. FY2016 FY2017 FY2018 FY2019 FY2020 Revenues FY15
CITY OF FLORA Flora, Illinois. ANNUAL FINANCIAL REPORT Year Ended April 30, 2015
 Flora, Illinois ANNUAL FINANCIAL REPORT Year Ended April 30, 2015 TABLE OF CONTENTS PAGE BASIC FINANCIAL STATEMENTS Independent Auditors Report... 1 Statement of Net Position... 4 Statement of Activities...
FY 2015 Annual Financial Report
 STATE OF ILLINOIS COMPTROLLER LESLIE GEISSLER MUNGER DO NOT SEND THIS PAPER COPY - THIS IS YOUR COPY. MAKE SURE YOU HAVE CLICKED THE SUBMIT BUTTON IN THE COMPTROLLER CONNECT PROGRAM. THIS WILL PROVIDE