Why so low for so long? A long-term view of real interest rates
|
|
|
- Angelina Riley
- 5 years ago
- Views:
Transcription


1 Why so low for so long? A long-term view of real interest rates Claudio Borio, Piti Disyatat, and Phurichai Rungcharoenkitkul Bank of Finland/CEPR Conference, Demographics and the Macroeconomy, Helsinki, The views presented here are the authors and do not necessarily reflect those of the Bank for International Settlements, Bank of Finland and the Bank of Thailand
2 Background: declining real rates
3 Standard explanations Real equilibrium interest rates have declined as desired savings may have increased Increasing working-age population Increased longevity Higher income inequality (the rich have lower MPC) Global savings glut (coming from EMEs) desired investments may have declined Lower productivity Cheaper capital (lowers investment outlays) Higher risk premium
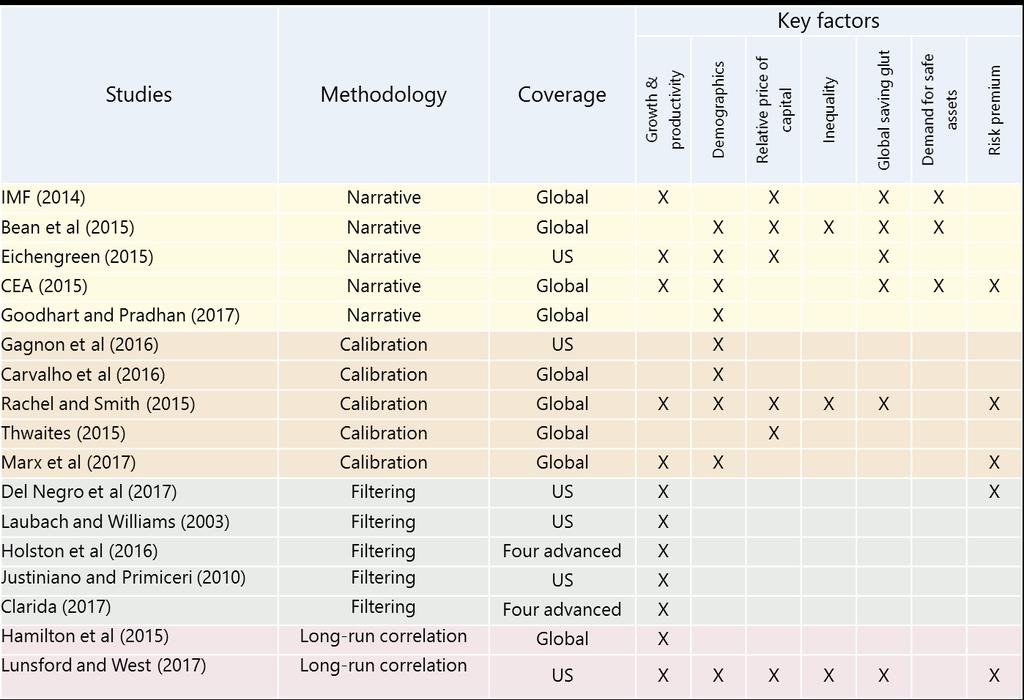
4 Literature overview
5 This paper Two key questions (in sequence): Are there (stable) relationships between real interest rates and (observed) saving-investment factors? Does monetary policy have lasting effects on real rates? Data: 19 advanced economies from Long-term (main) and short term real interest rates SI-factors: GDP/TFP growth; dependency ratios; longevity; population growth; inequality; relative price of capital Key findings: No stable and correctly signed relationship wrt SI-factors Evidence that MP (regimes and global anchors) matter
6 Methodological issues Measurement issue: equilibrium rate and eg inflation expectations are unobserved! Under the conventional framework: Real rates follow: rr tt = rr XX tt ; ββ + rr tt MMMM where XX tt captures S-I factors and rr tt MMMM is monetary policy rr tt MMMM ~II 0 with no variation < business cycle frequencies Long-run relationship between XX tt and rr tt Inflation expectations: From rolling AR process for inflation Robustness wrt REH, short rates Criteria: correct signs and parameter stability


7 A first glance at the data
8 Representative results Baseline specification Table 5 (1) Full sample (2) Gold standard (3) Interwar (4) Postwar (5) Pre Volcker (6) Post Volcker GDP growth (+) 0.09** (0.04) (0.02) (0.05) (0.07) (0.07) (0.05) Population growth (+/-) 0.83* ** (0.39) (0.50) (0.36) (0.28) (0.28) (0.71) Dependency ratio (+) *** 0.03 (0.02) (0.02) (0.09) (0.02) (0.02) (0.07) Life expectancy (-) *** ** 0.47*** 0.32*** (0.03) (0.05) (0.24) (0.09) (0.13) (0.09) Relative price of capital (+) ** * 0.01 (0.02) (0.03) (0.05) (0.01) (0.03) (0.03) Income inequality (-) 0.10* *** (0.05) (0.05) (0.30) (0.05) (0.21) (0.15) Constant *** * 42.48*** 31.18*** (2.97) (2.61) (21.61) (7.79) (11.80) (7.95) Adj. R sq N Country fixed effects yes yes yes yes yes yes Robust standard errors in parentheses based on country clusters; ***/**/* denotes results significant at the 1/5/10% level. Full sample, ; Gold standard, ; Interwar, ; Postwar, ; Pre-Volcker, ; Post-Volcker, Sources: Authors calculations
9 Robustness The findings remain the same if we: Use short-term rates instead of long-term Use Holston-Laubach-Williams filtered natural rates Estimate steady-state from a dynamic specification 5-year or 10-year non-overlapping averages of the data Use bivariate specifications Distinguish between global and country specific S-I factors Impose REH and estimate with GMM Add volatility, skewness and kurtosis of GDP & inlfation Retirement age interactions with demographic variables Use the savers ratio
10 Is there a role for monetary factors? Monetary policy may have longer run effects Eg Neely and Rapach (2008); Rapach & Wohar (2005) MP can have long lasting effects if inflation insensitive to the output gaps Interesting case: Gold standards period Global monetary policy anchor countries? Financially integration -> interest rates anchored by dominant countries Variables: MP regime indicators Global MP anchor: UK up to WWI and US thereafter Clean short real rates from S-I factors and use residual
11 Monetary regimes International monetary policy regimes Table 9 Countries 1870s 1880s 1890s 1900s 1910s 1920s 1930s 1940s 1950s 1960s 1970s 1980s 1990s 2000s 2010s Australia 1852 Austria 1892 Belgium 1878 Canada 1854 Denmark 1872 Finland 1877 France 1878 Germany 1871 Italy 1884 Japan 1897 Netherlands 1875 New Zealand 1821 Norway 1875 Portugal 1854 Spain Sweden 1873 Switzerland 1878 United Kingdom 1821 United States 1879 Gold standard/silver/bimetallic 1 Wars Interwar (between GS and BW) Post-Bretton Woods (between BW and IT) No GS/paper Interwar gold standard Bretton Woods (between BW and IT) Inflation targeting/de facto/price stability 1 The year when a country joins the classical gold standard is noted in the table. In the empirical analysis, we do not distinguish between metallic regimes. Source: BIS, Benati (2008), Meissner (2005), authors calculations.
12 Monetary regimes results Real interest rates and monetary policy regimes Table 10 (1) Regimes (2) Regimes & base (3) Regimes & base & time Paper 1.74** 5.80*** 4.25*** (0.78) (0.45) (0.53) Interwar gold standard 3.81*** 7.34*** 4.40* (0.60) (1.71) (2.42) Interwar non-gs ** 0.29 (0.73) (0.62) (0.68) Bretton Woods 2.07*** 3.74*** 1.55* (0.69) (1.03) (0.81) Post-Bretton Woods 2.08*** 1.83*** 6.03*** (0.54) (0.47) (1.59) Inflation targeting 1.05*** 1.25*** 0.80 (0.42) (0.50) (0.55) Constant 3.76*** 10.17** 5.67 (0.33) (3.53) (3.65) Adj. R sq N Country fixed effects yes yes yes Time fixed effects no no Yes S-I factors no yes yes Robust standard errors in parentheses based on country clusters; ***/**/* denotes results significant at the 1/5/10% level. Monetary policy regimes are country-specific, with regime dummies defined relative to the preceding regime in chronological order. Sources: authors calculations.
13 Global MP anchor results Global monetary policy and real interest rates in the rest of the world Tabl Global MP G: GDP growth G: pop. growth G: dependency r. G: life exp. G: capital price G: inequality C: GDP growth C: pop. growth C: dependency r. C: life exp. C: capital price C: inequality Constant Dependent variable: real long-term interest rate Full sample GS Pre WWII Post WWII 0.29*** ** 0.30*** (0.04) (0.07) (0.14) (0.06) ** 0.04 (0.04) (0.03) (0.04) (0.08) -1.60** (0.58) (1.64) (1.61) (0.54) (0.04) (0.12) (0.19) (0.04) -0.13* * (0.05) (0.12) (0.28) (0.1) -0.10*** *** (0.02) (0.08) (0.07) (0.04) -0.19* *** (0.10) (0.23) (0.31) (0.14) -0.08* * (0.04) (0.02) (0.07) (0.03) (0.61) (0.28) (0.52) (0.40) (0.01) (0.07) (0.09) (0.02) ** (0.07) (0.06) (0.17) (0.09) *** (0.01) (0.01) (0.05) (0.01) * ** (0.11) (0.03) (0.19) (0.07) (6.94) (16.14) (31.66) (7.46) Observations Adj. R Standard errors in parentheses; * p<0.1, ** p<0.05, *** p<0.01. The G: above indicates the global component while C: indicates cou specific components of the relevant variables. Global savings and investments factors calculated as the weighted cross-country averag each factor based on real GDP at purchasing power parity. The global real long-term interest rate similarly constructed but we exclude th and the UK from the calculation.
14 Conclusions We find little support that standard S-I factors help explain long-term real interest rate movements Monetary policy (regimes and global anchors) may have more lasting effects on real interest rates Premature to conclude that currently low interest rates driven by exogenous S-I factors
15 Appendix
16 Bivariate results Bivariate panel regressions Table 4 (1) Full sample (2) Gold standard (3) Interwar (4) Postwar (5) Pre Volcker (6) Post Volcker Marginal product of capital (+) *** *** 0.57** 0.32 GDP growth (+) 0.09** ** * TFP growth (+) *** Population growth (+/-) ** 1.25*** 0.64*** 1.30** Dependency ratio (+) 0.03*** ** 0.04** 0.13** 0.03 Life expectancy (-) 0.04*** 0.11*** 0.43*** 0.15*** 0.33* 0.35*** Relative price of capital (+) ** 0.07* 0.07*** Inequality (-) ** 0.28** 0.61*** 0.33*** Robust standard errors in parentheses based on country clusters; ***/**/* denote results significant at the 1/5/10% level, respectively. Significant coefficients with signs consistent with saving-investment theory are highlighted in green. Other significant coefficients are highlighted in red. Full sample, ; Gold standard, ; Interwar: , Postwar: , Pre-Volcker: , Post-Volcker: Sources: Authors calculations
17 Parameter stability Time-varying coefficients of the baseline regression Graph 3 GDP growth Dependency ratio Life expectancy Relative price of capital Inequality Dashed lines indicate two-standard error bands and the shaded area in green the correct coefficient sign. Data during the two wars are dropped from the estimation samples. Smaller sub-samples around war periods are partly responsible for an increase in standard errors. Sources: Author s calculations.
18 Dynamics Dynamic fixed effects panel specification Table 6 (1) (2) (3) (4) (5) (6) Full sample Gold standard Interwar Postwar Pre Volcker Post Volcker Long-run coefficients GDP growth (+) 0.19*** ** * (0.07) (0.33) (0.08) (0.19) (0.14) (0.15) Population growth (+/-) *** (0.48) (0.58) (0.81) (0.73) (0.59) (0.95) Dependency ratio (+) ** 0.05* 0.24*** 0.06 (0.02) (0.04) (0.06) (0.03) (0.04) (0.10) Life expectancy (-) 0.05** 0.27** ** 0.54*** 0.38** (0.02) (0.11) (0.08) (0.10) (0.20) (0.18) Relative price of capital (+) *** 0.06* ** 0.04 (0.01) (0.02) (0.03) (0.02) (0.03) (0.02) Income inequality (-) 0.08** 0.20*** ** Short-run coefficients (0.04) (0.07) (0.15) (0.10) (0.22) (0.21) Adjustment parameter 0.32*** 0.28*** 0.69*** 0.31*** 0.54*** 0.42*** (0.04) (0.08) (0.14) (0.05) (0.08) (0.04) Constant *** 16.28*** (1.01) (3.19) (5.38) (2.88) (10.62) (6.04) Adj. R sq N Country fixed effects yes yes yes yes yes yes Differences yes yes yes yes yes yes Robust standard errors in parentheses based on country clusters; ***/**/* denotes results significant at the 1/5/10% level. Full sample, ; Gold standard, ; Interwar, ; Postwar, ; Pre-Volcker, ; Post-Volcker, Differences: lagged differences from t to t-2 of all variables included in the regressions. Sources: Authors calculations.
19 Global vs country-specific effects Global versus country-specific determinants Table 7 Global component: (1) Full sample (2) Gold standard (3) Interwar (4) Postwar (5) Pre Volcker (6) Post Volcker GDP growth (+) * 0.14*** 0.21*** 0.14* (0.03) (0.02) (0.06) (0.04) (0.06) (0.07) Population growth (+/-) 1.43*** ** 1.25*** 17.65** (0.36) (1.14) (1.57) (0.18) (0.24) (7.60) Dependency ratio (+) *** 0.83*** 0.08*** 0.24*** (0.03) (0.09) (0.22) (0.02) (0.06) (0.16) Life expectancy (-) *** 0.30** -0.50* 0.63 (0.05) (0.09) (0.58) (0.13) (0.25) (0.36) Relative price of capital (+) 0.09*** ** 0.14*** (0.03) (0.02) (0.13) (0.04) (0.07) (0.07) Income inequality (-) 0.15* ** 1.02*** -2.96*** -0.95*** Country specific component: (0.08) (0.12) (0.66) (0.08) (0.54) (0.25) GDP growth (+) 0.08* (0.04) (0.02) (0.07) (0.05) (0.05) (0.06) Population growth (+/-) (0.41) (0.14) (0.34) (0.22) (0.29) (0.64) Dependency ratio (+) *** (0.02) (0.02) (0.15) (0.02) (0.04) (0.07) Life expectancy (-) ** 0.58 (0.07) (0.05) (0.12) (0.11) (0.19) (0.40) Relative price of capital (+) *** * 0.02 (0.01) (0.02) (0.03) (0.01) (0.02) (0.02) Income inequality (-) * (0.07) (0.02) (0.24) (0.08) (0.11) (0.13) Constant ** *** * 41.77* (6.09) (13.06) (59.31) (9.43) (21.87) (29.43) Adj. R sq N Country fixed effects yes yes yes yes yes yes Robust standard errors in parentheses based on country clusters; ***/**/* denotes results significant at the 1/5/10% level. Full sample, ; Gold standard, ; Interwar, ; Postwar, ; Pre-Volcker, ; Post-Volcker, Global components calculated as the averages of each variable based on real GDP at purchasing power parity. Sources: Authors calculations.
20 LW rates Filtered natural rates and saving/investment determinants Table 8 Long-run coefficients US UK r* z r* z GDP growth (+) 0.39*** 0.32*** (0.05) (0.12) Population growth (+/-) -1.28*** -2.07*** (0.41) (0.71) (0.29) (0.17) Dependency ratio (+) -0.08** * (0.03) (0.05) (0.02) (0.01) Life expectancy (-) -0.09* (0.05) (0.08) (0.06) (0.04) Relative price of capital (+) * 2.02 (3.90) (6.48) (2.70) (1.62) Income inequality (-) Short-run coefficients (0.14) (0.24) (0.08) (0.05) Adjustment parameter -0.48*** -0.32*** -0.28*** -0.44*** (0.06) (0.06) (0.04) (0.06) Constant (5.13) (5.16) (2.11) (1.99) Adj. R sq N Differences yes yes yes yes The specification is equivalent to the dynamic fixed-effects panel specification in 2.3, but without the country fixed-effects term and the country index suppressed; ***/**/* denotes results significant at the 1/5/10% level. Full sample, Differences: lagged differences from t to t-2 of all variables included in the regressions. Sources: Authors calculations.
21 Global anchor Global monetary policy and global real interest rates Global MP G: GDP growth G: pop. growth G: dependency r. G: life exp. G: capital price G: inequality Constant Trend Full sample Dependent variable: global real long-term interest rate excl. US & UK No linear trend GS Pre WWII Post WWII Full sample Linear trend included GS Pre WWII 0.22*** *** 0.31*** 0.16** *** (0.06) (0.13) (0.10) (0.08) (0.06) (0.10) (0.08) 0.12** ** (0.05) (0.04) (0.07) (0.07) (0.05) (0.03) (0.05) -1.24*** 1.57*** *** 3.10*** 0.59 (0.28) (0.55) (0.68) (0.33) (0.29) (0.51) (0.55) 0.17*** *** 0.14*** 0.16*** (0.03) (0.13) (0.15) (0.03) (0.03) (0.10) (0.15) 0.12*** -0.31* 0.72*** 0.26** 0.42*** *** (0.05) (0.13) (0.18) (0.10) (0.11) (0.13) (0.14) -0.08*** 0.07* *** -0.14*** 0.07** -0.17*** (0.03) (0.04) (0.06) (0.04) (0.03) (0.03) (0.06) 0.20** -0.25*** 0.54*** -0.90*** *** (0.10) (0.09) (0.15) (0.12) (0.10) (0.09) (0.16) *** *** ** *** 23.92* 5.35 (5.66) (18.00) (21.62) (8.72) (5.80) (13.69) (22.14) -0.11*** -0.19*** -0.36*** (0.04) (0.04) (0.06) Observations Adj. R Standard errors in parentheses; * p<0.1, ** p<0.05, *** p<0.01. The G: above indicates the global component while C: indicates count components of the relevant variables. Global savings and investments factors calculated as the weighted cross-country averages of e based on real GDP at purchasing power parity. The global real long-term interest rate similarly constructed but we exclude the US and the U calculation.
22 5-year averages Baseline specification using 5-year averages Table B.2.1 (1) Full sample (2) Gold standard (3) Interwar (4) Postwar (5) Pre Volcker (6) Post Volcker GDP growth (+) (0.08) (0.10) (0.25) (0.11) (0.05) (0.10) Population growth (+/-) * (0.68) (1.50) (0.77) (0.64) (0.45) (0.89) Dependency ratio (+) * * -0.16*** (0.02) (0.02) (0.17) (0.02) (0.03) (0.04) Life expectancy (-) * 0.26** 0.62*** -0.30* (0.05) (0.11) (0.26) (0.10) (0.07) (0.14) Relative price of capital (+) *** (0.02) (0.05) (0.11) (0.01) (0.03) (0.06) Income inequality (-) *** (0.11) (0.11) (0.37) (0.07) (0.26) (0.25) Constant * * *** 39.11*** (4.76) (6.31) (18.96) (6.91) (9.31) (10.73) Adj. R sq N Country fixed effects yes yes yes yes yes yes Robust standard errors in parentheses based on country clusters; ***/**/* denotes results significant at the 1/5/10% level. Full sample, ; Gold standard, ; Interwar, ; Postwar, ; Pre-Volcker, ; Post-Volcker, Sources: Authors calculations
23 Short-term rates Baseline specification using short-term interest rates Table B.3.1 (1) Full sample (2) Gold standard (3) Interwar (4) Postwar (5) Pre Volcker (6) Post Volcker GDP growth (+) -0.17** ** (0.06) (0.15) (0.07) (0.11) (0.11) (0.06) Population growth (+/-) -1.14** (0.49) (0.67) (0.72) (0.50) (0.31) (1.30) Dependency ratio (+) *** (0.02) (0.04) (0.10) (0.04) (0.04) (0.10) Life expectancy (-) ** 0.51* 0.27* 0.24* -0.67*** (0.04) (0.10) (0.24) (0.14) (0.12) (0.13) Relative price of capital (+) *** * 0.04 (0.02) (0.04) (0.04) (0.02) (0.02) (0.05) Income inequality (-) *** (0.07) (0.21) (0.54) (0.10) (0.20) (0.22) Constant ** *** 65.67*** (4.62) (6.97) (24.87) (13.32) (9.61) (14.48) Adj. R sq N Country fixed effects yes yes yes yes yes yes Robust standard errors in parentheses based on country clusters; ***/**/* denotes results significant at the 1/5/10% level. Full sample, ; Gold standard, ; Interwar, ; Postwar, ; Pre-Volcker, ; Post-Volcker, Sources: Authors calculations
24 Fundamental risk Baseline specification augmented by fundamental risk measures Table B.9.1 (1) Full sample (2) Gold standard (3) Interwar (4) Postwar (5) Pre Volcker (6) Post Volcker GDP growth (+) * * (0.04) (0.01) (0.07) (0.05) (0.05) (0.05) Population growth (+/-) -1.04*** * (0.30) (0.33) (0.51) (0.41) (0.23) (0.69) Dependency ratio (+) 0.05*** 0.17** *** 0.17*** (0.01) (0.06) (0.04) (0.02) (0.02) (0.07) Life expectancy (-) 0.05* -0.13*** 0.25** 0.26** 0.32*** -0.28*** (0.03) (0.03) (0.09) (0.08) (0.09) (0.09) Relative price of capital (+) *** *** (0.01) (0.03) (0.03) (0.01) (0.02) (0.03) Income inequality (-) *** -0.33** GDP growth volatility (-) (0.07) (0.04) (0.24) (0.07) (0.12) (0.15) (0.32) Inflation volatility (-) 0.22 (0.13) GDP growth skewness (+) 0.15 (0.47) Inflation skewness (+) -1.53*** (0.37) GDP growth kurtosis (-) (0.24) Inflation kurtosis (-) 0.11 (0.20) -0.82*** (0.22) 0.22 (0.12) -0.53** (0.19) (0.27) (0.15) 0.59** (0.20) (0.78) 1.48*** (0.28) 2.82 (1.88) -2.20*** (0.61) (0.45) 0.42 (0.43) (0.45) 0.09 (0.12) 0.25 (0.47) -1.69*** (0.39) 0.00 (0.23) 0.36** 0.14 (0.43) -0.68*** (0.12) 0.27 (0.69) -1.25*** (0.18) (0.34) 0.74 (0.63) 0.05 (0.12) 0.66 (0.40) (0.37) 0.31** Constant ** *** 25.02** (0.15) 0.22 (0.13) (0.13) (0.10) (2.94) (4.04) (10.33) (7.95) (6.86) (9.68) Adj. R sq N Country fixed effects Yes Yes Yes Yes Yes Yes Robust standard errors in parentheses based on country clusters; ***/**/* denotes results significant at the 1/5/10% level. Full sample, ; Gold standard, ; Interwar, ; Postwar, ; Pre-Volcker, ; Post-Volcker, Sources: Authors calculations
UNIVERSITY OF CALIFORNIA Economics 134 DEPARTMENT OF ECONOMICS Spring 2018 Professor Christina Romer LECTURE 24
 UNIVERSITY OF CALIFORNIA Economics 134 DEPARTMENT OF ECONOMICS Spring 2018 Professor Christina Romer LECTURE 24 I. OVERVIEW A. Framework B. Topics POLICY RESPONSES TO FINANCIAL CRISES APRIL 23, 2018 II.
Swedish Lessons: How Important are ICT and R&D to Economic Growth? Paper prepared for the 34 th IARIW General Conference, Dresden, Aug 21-27, 2016
 Swedish Lessons: How Important are ICT and R&D to Economic Growth? Paper prepared for the 34 th IARIW General Conference, Dresden, Aug 21-27, 2016 Harald Edquist, Ericsson Research Magnus Henrekson, Research
Demographic Trends and the Real Interest Rate
 Demographic Trends and the Real Interest Rate Noëmie Lisack Rana Sajedi Gregory Thwaites Bank of England November 2017 This does not represent the views of the Bank of England 1 / 43 Disclaimer This does
on Inequality Monetary Policy, Macroprudential Regulation and Inequality Zurich, 3-4 October 2016
 The Effects of Monetary Policy Shocks on Inequality Davide Furceri, Prakash Loungani and Aleksandra Zdzienicka International Monetary Fund Monetary Policy, Macroprudential Regulation and Inequality Zurich,
BIS Working Papers. Why so low for so long? A long-term view of real interest rates? No 685. Monetary and Economic Department
 BIS Working Papers No 68 Why so low for so long? A long-term view of real interest rates? by Claudio Borio, Piti Disyatat, Mikael Juselius and Phurichai Rungcharoenkitkul Monetary and Economic Department
Online Appendix for Offshore Activities and Financial vs Operational Hedging
 Online Appendix for Offshore Activities and Financial vs Operational Hedging (not for publication) Gerard Hoberg a and S. Katie Moon b a Marshall School of Business, University of Southern California,
Internet Appendix: Government Debt and Corporate Leverage: International Evidence
 Internet Appendix: Government Debt and Corporate Leverage: International Evidence Irem Demirci, Jennifer Huang, and Clemens Sialm September 3, 2018 1 Table A1: Variable Definitions This table details the
Table 1. The Demand for International Reserves: Benchmark Specification (Constant, Log GNP, Import Share, Export Variability)
") Table 1. The Demand for International Reserves: Benchmark Specification (Constant, Log GNP, Import Share, Export Variability) Import Export Period Constant Log GNP Share Variability Total -3.87 1.0 1.94-0.03
Table 1. The Demand for International Reserves: Benchmark Specification (Constant, Log GNP, Import Share, Export Variability) Import Export Period Constant Log GNP Share Variability Total -3.87 1.0 1.94-0.03
WHAT DOES THE HOUSE PRICE-TO-
 WHAT DOES THE HOUSE PRICE-TO- INCOME RATIO TELL US ABOUT THE HOUSING AFFORDABILITY: A THEORY AND INTERNATIONAL EVIDENCE (THIS VERSION: AUG 2016) Charles Ka Yui LEUNG City University of Hong Kong Edward
IMPLICATIONS OF LOW PRODUCTIVITY GROWTH FOR DEBT SUSTAINABILITY
 IMPLICATIONS OF LOW PRODUCTIVITY GROWTH FOR DEBT SUSTAINABILITY Neil R. Mehrotra Brown University Peterson Institute for International Economics November 9th, 2017 1 / 13 PUBLIC DEBT AND PRODUCTIVITY GROWTH
Cyclical Convergence and Divergence in the Euro Area
 Cyclical Convergence and Divergence in the Euro Area Presentation by Val Koromzay, Director for Country Studies, OECD to the Brussels Forum, April 2004 1 1 I. Introduction: Why is the issue important?
Economics Program Working Paper Series
 Economics Program Working Paper Series Projecting Economic Growth with Growth Accounting Techniques: The Conference Board Global Economic Outlook 2012 Sources and Methods Vivian Chen Ben Cheng Gad Levanon
Tax Burden, Tax Mix and Economic Growth in OECD Countries
 Tax Burden, Tax Mix and Economic Growth in OECD Countries PAOLA PROFETA RICCARDO PUGLISI SIMONA SCABROSETTI June 30, 2015 FIRST DRAFT, PLEASE DO NOT QUOTE WITHOUT THE AUTHORS PERMISSION Abstract Focusing
How Do Labor and Capital Share Private Sector Economic Gains in an Age of Globalization?
 1 How Do Labor and Capital Share Private Sector Economic Gains in an Age of Globalization? Erica Owen Texas A&M Quan Li Texas A&M IPES November 15, 214 Rich vs. Poor (1% vs. 99%) 2 3 Motivation Literature
The Long-Run Determinants of Inequality: What Can We Learn From Top Income Data?
 The Long-Run Determinants of Inequality: What Can We Learn From Top Income Data? Jesper Roine, Jonas Vlachos and Daniel Waldenström (paper at: www.anst.uu.se/danwa175 ) XXIV International Conference of
The Velocity of Money and Nominal Interest Rates: Evidence from Developed and Latin-American Countries
 The Velocity of Money and Nominal Interest Rates: Evidence from Developed and Latin-American Countries Petr Duczynski Abstract This study examines the behavior of the velocity of money in developed and
Bank of Canada Triennial Central Bank Survey of Foreign Exchange and Over-the-Counter (OTC) Derivatives Markets Turnover for April, 2010 and Amounts
 Derivatives Markets Turnover for April, 2010 and Amounts") Bank of Canada Triennial Central Bank Survey of Foreign Exchange and Over-the-Counter (OTC) Derivatives Markets Turnover for April, 2010 and Amounts Outstanding as at June 30, 2010 December 20, 2010 Table
Bank of Canada Triennial Central Bank Survey of Foreign Exchange and Over-the-Counter (OTC) Derivatives Markets Turnover for April, 2010 and Amounts Outstanding as at June 30, 2010 December 20, 2010 Table
Business cycle volatility and country zize :evidence for a sample of OECD countries. Abstract
 Business cycle volatility and country zize :evidence for a sample of OECD countries Davide Furceri University of Palermo Georgios Karras Uniersity of Illinois at Chicago Abstract The main purpose of this
Regulatory Arbitrage in Action: Evidence from Banking Flows and Macroprudential Policy
 Regulatory Arbitrage in Action: Evidence from Banking Flows and Macroprudential Policy Dennis Reinhardt and Rhiannon Sowerbutts Bank of England April 2016 Central Bank of Iceland, Systemic Risk Centre
Does One Law Fit All? Cross-Country Evidence on Okun s Law
 Does One Law Fit All? Cross-Country Evidence on Okun s Law Laurence Ball Johns Hopkins University Global Labor Markets Workshop Paris, September 1-2, 2016 1 What the paper does and why Provides estimates
EBA ESTIMATES: ANALYSIS OF 2017 CURRENT ACCOUNTS AND REAL EFFECTIVE EXCHANGE RATES 1
 EBA ESTIMATES: ANALYSIS OF 2017 CURRENT ACCOUNTS AND REAL EFFECTIVE EXCHANGE RATES 1 Introduction The attached tables contain estimates from the External Balance Assessment (EBA) analysis of 2017 current
Table 1: Foreign exchange turnover: Summary of surveys Billions of U.S. dollars. Number of business days
 Table 1: Foreign exchange turnover: Summary of surveys Billions of U.S. dollars Total turnover Number of business days Average daily turnover change 1983 103.2 20 5.2 1986 191.2 20 9.6 84.6 1989 299.9
Constraints on Exchange Rate Flexibility in Transition Economies: a Meta-Regression Analysis of Exchange Rate Pass-Through
 Constraints on Exchange Rate Flexibility in Transition Economies: a Meta-Regression Analysis of Exchange Rate Pass-Through Igor Velickovski & Geoffrey Pugh Applied Economics 43 (27), 2011 National Bank
Internet Appendix to accompany Currency Momentum Strategies. by Lukas Menkhoff Lucio Sarno Maik Schmeling Andreas Schrimpf
 Internet Appendix to accompany Currency Momentum Strategies by Lukas Menkhoff Lucio Sarno Maik Schmeling Andreas Schrimpf 1 Table A.1 Descriptive statistics: Individual currencies. This table shows descriptive
When Credit Bites Back: Leverage, Business Cycles, and Crises
 When Credit Bites Back: Leverage, Business Cycles, and Crises Òscar Jordà *, Moritz Schularick and Alan M. Taylor *Federal Reserve Bank of San Francisco and U.C. Davis, Free University of Berlin, and University
EFFECT OF GENERAL UNCERTAINTY ON EARLY AND LATE VENTURE- CAPITAL INVESTMENTS: A CROSS-COUNTRY STUDY. Rajeev K. Goel* Illinois State University
 DRAFT EFFECT OF GENERAL UNCERTAINTY ON EARLY AND LATE VENTURE- CAPITAL INVESTMENTS: A CROSS-COUNTRY STUDY Rajeev K. Goel* Illinois State University Iftekhar Hasan New Jersey Institute of Technology and
Credit Booms Gone Bust
 Credit Booms Gone Bust Monetary Policy, Leverage Cycles and Financial Crises, 1870 2008 Moritz Schularick (Free University of Berlin) Alan M. Taylor (UC Davis & Morgan Stanley) Federal Reserve Bank of
New in 2013: Greater emphasis on capital flows Refinements to EBA methodology Individual country assessments
 As in 212: Stock-take: multilaterally consistent assessment of external sector policies of the largest economies Feeds into Article IVs Draws on External Balance Assessment (EBA) methodology/other Identifies
Capital flows to Emerging Markets
 Capital flows to Emerging Markets Determinants of capital flows Emerging market versus developed market business cycles Global Imbalances Rebalance capital flows Capital flows to Emerging Markets Facts
THE RISE AND FALL OF THE NATURAL INTEREST RATE
 THE RISE AND FALL OF THE NATURAL INTEREST RATE Gabriele Fiorentini Università di Firenze Alessandro Galesi Banco de España Gabriel Pérez-Quirós European Central Bank Enrique Sentana CEMFI ESCB Research
Exchange Rates in the Long Run
 Exchange Rates in the Long Run What determines exchange rates? Supply + Demand!» Flow models: Demand & supply of FX to purchase goods and services» Stock models, or asset models Demand & supply of available
Optimal fiscal policy
 Optimal fiscal policy Jasper Lukkezen Coen Teulings Overview Aim Optimal policy rule for fiscal policy How? Four building blocks: 1. Linear VAR model 2. Augmented by linearized equation for debt dynamics
The attached tables are organized in four sections. As with the 2015 External Sector Report, these correspond to four sets of estimates: 2
 EBA ESTIMATES: ANALYSIS OF 2015 CURRENT ACCOUNTS AND REAL EFFECTIVE EXCHANGE RATES Introduction The attached tables contain estimates from the External Balance Assessment (EBA) analysis of 2015 current
Bank of Canada Triennial Central Bank Survey of Foreign Exchange and Over-the-Counter (OTC) Derivatives Markets
 Derivatives Markets") Bank of Canada Triennial Central Bank Survey of Foreign Exchange and Over-the-Counter (OTC) Derivatives Markets Turnover for, and Amounts Outstanding as at June 30, March, 2005 Turnover data for, Table
Bank of Canada Triennial Central Bank Survey of Foreign Exchange and Over-the-Counter (OTC) Derivatives Markets Turnover for, and Amounts Outstanding as at June 30, March, 2005 Turnover data for, Table
PENSIONS IN OECD COUNTRIES: INDICATORS AND DEVELOPMENTS
 PENSIONS IN OECD COUNTRIES: INDICATORS AND DEVELOPMENTS Marius Lüske Directorate for Employment, Labour and Social Affairs, OECD Lisbon, 28.09.2018 Marius.LUSKE@oecd.org www.oecd.org/els OUTLINE Talk based
Fiscal Policy in Japan
 Fiscal Policy in Japan - Issues and Future Directions- June 10th, 2015 Ministry of Finance General Government Gross Debt and Financial Balances (International Comparison) (%) 240 210 General Government
2014 EBA: Individual Country Estimates
 2014 EBA: Individual Country Estimates Introduction The tables in this package contain the estimates from the EBA analysis of current accounts and real exchange rates implemented in Spring 2014. These
Methodology Calculating the insurance gap
 Methodology Calculating the insurance gap Insurance penetration Methodology 3 Insurance Insurance Penetration Rank Rank Rank penetration penetration difference 2018 2012 change 2018 report 2012 report
The age-structure inflation puzzle
 The age-structure inflation puzzle Mikael Juselius - Előd Takáts Bank of Finland - Bank for International Settlements October 12-13, 2017 Bank of Finland - CEPR conference The views expressed in this presentation
Trust and Fertility Dynamics. Arnstein Aassve, Università Bocconi Francesco C. Billari, University of Oxford Léa Pessin, Universitat Pompeu Fabra
 Trust and Fertility Dynamics Arnstein Aassve, Università Bocconi Francesco C. Billari, University of Oxford Léa Pessin, Universitat Pompeu Fabra 1 Background Fertility rates across OECD countries differ
The Socialist Federal Republic of Yugoslavia takes part in some of the work of the OECD (agreement of 28th October 1961).
.") I 1 Pursuant to article 1 of the Convention signed in Paris on 14th December 1960, and which came into force on 30th September 1961, the Organisation for Economic Co-operation and Development (OECD) shall
I 1 Pursuant to article 1 of the Convention signed in Paris on 14th December 1960, and which came into force on 30th September 1961, the Organisation for Economic Co-operation and Development (OECD) shall
The Outlook for the U.S. Economy and the Policies of the New President
 The Outlook for the U.S. Economy and the Policies of the New President Jason Furman Senior Fellow, PIIE SNS/SHOF Finance Panel Stockholm June 12, 2017 Peterson Institute for International Economics 1750
Bank of Canada Triennial Central Bank Surveys of Foreign Exchange and Over-the-Counter (OTC) Derivatives Markets Turnover for April, 2007 and Amounts
 Derivatives Markets Turnover for April, 2007 and Amounts") Bank of Canada Triennial Central Bank Surveys of Foreign Exchange and Over-the-Counter (OTC) Derivatives Markets Turnover for April, 2007 and Amounts Outstanding as at June 30, 2007 January 4, 2008 Table
Bank of Canada Triennial Central Bank Surveys of Foreign Exchange and Over-the-Counter (OTC) Derivatives Markets Turnover for April, 2007 and Amounts Outstanding as at June 30, 2007 January 4, 2008 Table
Empirical appendix of Public Expenditure Distribution, Voting, and Growth
 Empirical appendix of Public Expenditure Distribution, Voting, and Growth Lorenzo Burlon August 11, 2014 In this note we report the empirical exercises we conducted to motivate the theoretical insights
The Bilateral J-Curve: Sweden versus her 17 Major Trading Partners
 Bahmani-Oskooee and Ratha, International Journal of Applied Economics, 4(1), March 2007, 1-13 1 The Bilateral J-Curve: Sweden versus her 17 Major Trading Partners Mohsen Bahmani-Oskooee and Artatrana Ratha
2013 Pilot EBA: Individual Country Estimates
 1 2013 Pilot EBA: Individual Country Estimates Introduction The tables in this package contain the estimates from the EBA analysis of current accounts and real exchange rates implemented in Spring 2013.
Appendix. Table S1: Construct Validity Tests for StateHist
 Appendix Table S1: Construct Validity Tests for StateHist (5) (6) Roads Water Hospitals Doctors Mort5 LifeExp GDP/cap 60 4.24 6.72** 0.53* 0.67** 24.37** 6.97** (2.73) (1.59) (0.22) (0.09) (4.72) (0.85)
THE ROLE OF EXCHANGE RATES IN MONETARY POLICY RULE: THE CASE OF INFLATION TARGETING COUNTRIES
 THE ROLE OF EXCHANGE RATES IN MONETARY POLICY RULE: THE CASE OF INFLATION TARGETING COUNTRIES Mahir Binici Central Bank of Turkey Istiklal Cad. No:10 Ulus, Ankara/Turkey E-mail: mahir.binici@tcmb.gov.tr
Aviation Economics & Finance
 Aviation Economics & Finance Professor David Gillen (University of British Columbia )& Professor Tuba Toru-Delibasi (Bahcesehir University) Istanbul Technical University Air Transportation Management M.Sc.
Welcome to: International Finance
 Welcome to: International Finance Introduction & International Monetary System Reading: Chapter 1 (p1-3) & Chapter 2 Why is International Finance Important? ٣ Why is International Finance Important? In
Supplemental Table I. WTO impact by industry
 Supplemental Table I. WTO impact by industry This table presents the influence of WTO accessions on each three-digit NAICS code based industry for the manufacturing sector. The WTO impact is estimated
education (captured by the school leaving age), household income (measured on a ten-point
, household income (measured on a ten-point") A Web-Appendix A.1 Information on data sources Individual level responses on benefit morale, tax morale, age, sex, marital status, children, education (captured by the school leaving age), household income
A Web-Appendix A.1 Information on data sources Individual level responses on benefit morale, tax morale, age, sex, marital status, children, education (captured by the school leaving age), household income
Global financial cycles and risk premia
 1/20 Global financial cycles and risk premia Òscar Jordà Moritz Schularick Alan M. Taylor Felix Ward IMF 18th Jacques Polak Annual Research Conference 2 3 November 2017 Federal Reserve Bank of San Francisco;
Currency Undervaluation: A Time-Tested Policy for Growth
 Currency Undervaluation: A Time-Tested Policy for Growth 12 Study the past, if you would divine the future. Confucius, Analects of Confucius Currency valuation matters for growth. The evidence offered
Financial Development and the Liquidity of Cross- Listed Stocks; The Case of ADR's
 Utah State University DigitalCommons@USU All Graduate Plan B and other Reports Graduate Studies 5-2017 Financial Development and the Liquidity of Cross- Listed Stocks; The Case of ADR's Jed DeCamp Follow
Anti-Money Laundering Compliance Issues
 Anti-Money Laundering Compliance Issues 4th Annual Continuing Professional Development Event November 12, 2015 Presented by: Victoria Stuart Peter Moffatt 1 Introduction Compliance regime for reporting
LONG-TERM PROJECTIONS OF PUBLIC PENSION EXPENDITURE
 7. FINANCES OF RETIREMENT-INCOME SYSTEMS LONG-TERM PROJECTIONS OF PUBLIC PENSION EXPENDITURE Key results Public spending on pensions has been on the rise in most OECD countries for the past decades, as
San Francisco Retiree Health Care Trust Fund Education Materials on Public Equity
 M E K E T A I N V E S T M E N T G R O U P 5796 ARMADA DRIVE SUITE 110 CARLSBAD CA 92008 760 795 3450 fax 760 795 3445 www.meketagroup.com The Global Equity Opportunity Set MSCI All Country World 1 Index
RECENT EVOLUTION AND OUTLOOK OF THE MEXICAN ECONOMY BANCO DE MÉXICO OCTOBER 2003
 OCTOBER 23 RECENT EVOLUTION AND OUTLOOK OF THE MEXICAN ECONOMY BANCO DE MÉXICO 2 RECENT DEVELOPMENTS OUTLOOK MEDIUM-TERM CHALLENGES 3 RECENT DEVELOPMENTS In tandem with the global economic cycle, the Mexican
High Idiosyncratic Volatility and Low Returns. Andrew Ang Columbia University and NBER. Q Group October 2007, Scottsdale AZ
 High Idiosyncratic Volatility and Low Returns Andrew Ang Columbia University and NBER Q Group October 2007, Scottsdale AZ Monday October 15, 2007 References The Cross-Section of Volatility and Expected
Appendix A Gravity Model Assessment of the Impact of WTO Accession on Russian Trade
 Appendix A Gravity Model Assessment of the Impact of WTO Accession on Russian Trade To assess the quantitative impact of WTO accession on Russian trade, we draw on estimates for merchandise trade between
Carry. Ralph S.J. Koijen, London Business School and NBER
 Carry Ralph S.J. Koijen, London Business School and NBER Tobias J. Moskowitz, Chicago Booth and NBER Lasse H. Pedersen, NYU, CBS, AQR Capital Management, CEPR, NBER Evert B. Vrugt, VU University, PGO IM
Index. bad employment performance 69 baseline bias 297 8
 Index affirmative action 6 analytical variables 31 annual data 35 6 anti-discrimination laws 6 Australia employment level 3 men s employment 5 women s employment 5 Austria employment change 3 men s employment
Approach to Employment Injury (EI) compensation benefits in the EU and OECD
 compensation benefits in the EU and OECD") Approach to (EI) compensation benefits in the EU and OECD The benefits of protection can be divided in three main groups. The cash benefits include disability pensions, survivor's pensions and other short-
Approach to (EI) compensation benefits in the EU and OECD The benefits of protection can be divided in three main groups. The cash benefits include disability pensions, survivor's pensions and other short-
INDICATORS OF FINANCIAL DISTRESS IN MATURE ECONOMIES
 B INDICATORS OF FINANCIAL DISTRESS IN MATURE ECONOMIES This special feature analyses the indicator properties of macroeconomic variables and aggregated financial statements from the banking sector in providing
Poverty and Poverty Reduction: Relationship between alternative measures of social spending and poverty rates across countries.
 Poverty and Poverty Reduction: Relationship between alternative measures of social spending and poverty rates across countries Koen Caminada Invited Guest Lecture Central University of Finance and Economics,
Conditional convergence: how long is the long-run? Paul Ormerod. Volterra Consulting. April Abstract
 Conditional convergence: how long is the long-run? Paul Ormerod Volterra Consulting April 2003 pormerod@volterra.co.uk Abstract Mainstream theories of economic growth predict that countries across the
Progress towards Strong, Sustainable and Balanced Growth. Figure 1: Recovery from Financial Crisis (100 = First Quarter of Real GDP Contraction)
") Progress towards Strong, Sustainable and Balanced Growth Figure 1: Recovery from Financial Crisis (100 = First Quarter of Real GDP Contraction) Source: OECD May 2014 Forecast, Haver Analytics, Rogoff and
Progress towards Strong, Sustainable and Balanced Growth Figure 1: Recovery from Financial Crisis (100 = First Quarter of Real GDP Contraction) Source: OECD May 2014 Forecast, Haver Analytics, Rogoff and
This presentation. Downward wage rigidity in EU countries. Based on recent papers on wage rigidity in European countries:
 Downward wage rigidity in EU countries OECD - DELSA seminar, Paris, October 2010 Philip Du Caju This presentation Based on recent papers on wage rigidity in European countries: Babecký J., Ph. Du Caju,
Growth in OECD Unit Labour Costs slows to 0.4% in the third quarter of 2016
 Growth in OECD Unit Labour Costs slows to.4% in the third quarter of 26 Growth in unit labour costs (ULCs) in the OECD area slowed to.4% in the third quarter of 26 (compared with.6% in the previous quarter)
Filling the gap: open economy considerations for more reliable potential output estimates
 Filling the gap: open economy considerations for more reliable potential output estimates Zsolt Darvas* Bruegel, Corvinus University of Budapest and Hungarian Academy of Sciences UN DESA Expert Group Meeting
Statistical annex. Sources and definitions
 Statistical annex Sources and definitions Most of the statistics shown in these tables can be found as well in several other (paper or electronic) publications or references, as follows: the annual edition
Mind the Gap: Disentangling Credit and Liquidity in Risk Spreads *
 Internet Appendix to Mind the Gap: Disentangling Credit and Liquidity in Risk Spreads * This internet appendix contains results for the manuscript, Mind the Gap: Disentangling Credit and Liquidity in Risk
Enhancing Productivity. Philippe Aghion
 Enhancing Productivity Philippe Aghion Basic questions How to enhance productivity growth in advanced and in emerging market economies? Technological waves and differences in their diffusion patterns across
Why Are Interest Rates So Low? The Role of Demographic Change
 Why Are Interest Rates So Low? The Role of Demographic Change Noëmie Lisack Rana Sajedi Gregory Thwaites Bank of England April 2017 1 / 31 Disclaimer This does not represent the views of the Bank of England
Low employment among the 50+ population in Hungary
 Low employment among the + population in Hungary The role of incentives, health and cognitive capacities Janos Divenyi (Central European University) and Gabor Kezdi (Central European University and IE-CRSHAS)
Exploring differences in financial literacy across countries: the role of individual characteristics, experience, and institutions
 Exploring differences in financial literacy across countries: the role of individual characteristics, experience, and institutions Andrej Cupák National Bank of Slovakia Pirmin Fessler Oesterreichische
Public Pension Spending Trends and Outlook in Emerging Europe. Benedict Clements Fiscal Affairs Department International Monetary Fund March 2013
 Public Pension Spending Trends and Outlook in Emerging Europe Benedict Clements Fiscal Affairs Department International Monetary Fund March 13 Plan of Presentation I. Trends and drivers of public pension
Inflation Regimes and Monetary Policy Surprises in the EU
 Inflation Regimes and Monetary Policy Surprises in the EU Tatjana Dahlhaus Danilo Leiva-Leon November 7, VERY PRELIMINARY AND INCOMPLETE Abstract This paper assesses the effect of monetary policy during
Demographics and Secular Stagnation Hypothesis in Europe
 Demographics and Secular Stagnation Hypothesis in Europe Carlo Favero (Bocconi University, IGIER) Vincenzo Galasso (Bocconi University, IGIER, CEPR & CESIfo) Growth in Europe?, Marseille, September 2015
Fiscal Policies for Innovation and Growth
 Fiscal Policies for Innovation and Growth CARLOS MULAS-GRANADOS INTERNATIONAL MONETARY FUND ECFIN WORKSHOP JANUARY 24TH, 2016 1 Outline Growth: Three a state of alert pillars of innovation: a role for
CARRY TRADE: THE GAINS OF DIVERSIFICATION
 CARRY TRADE: THE GAINS OF DIVERSIFICATION Craig Burnside Duke University Martin Eichenbaum Northwestern University Sergio Rebelo Northwestern University Abstract Market participants routinely take advantage
Day of the Week Effects: Recent Evidence from Nineteen Stock Markets
 Day of the Week Effects: Recent Evidence from Nineteen Stock Markets Aslı Bayar a* and Özgür Berk Kan b a Department of Management Çankaya University Öğretmenler Cad. 06530 Balgat, Ankara Turkey abayar@cankaya.edu.tr
Road Map to this Lecture
 Economic Growth 1 Road Map to this Lecture 1. Steady State dynamics: 1. Output per capita 2. Capital accumulation 3. Depreciation 4. Steady State 2. The Golden Rule: maximizing welfare 3. Total Factor
DATA FOR R&D SPILLOVER PROJECT
 DATA FOR R&D SPILLOVER PROJECT Data have been gathered for two groups of countries. These roughly correspond to the set of industrial countries used in Coe and Helpman (1995), for which R&D data exist
Table 1. Statutory tax rates on capital income.
 Table 1. Statutory tax rates on capital income. Tax rate on retained corporate income (%) 1 Top personal tax rate on interest income (%) 2 1985 1999 Change 1985-99 1985 1998 Change 1985-98 Small Countries
紅石國際教育中心. Red Rock Institute & Publishing
 紅石國際教育中心 Red Rock Institute & Publishing Phillips Curve LRAS Inflation. B.. A C PL1 PL2 AD AD AD1 Unemployment Real GDP RDP2 FE RGDP1 The Short-Run Phillips Curve illustrates the Trade-off between Inflation
Distribution Capital and the Short and Long Run Import Demand Elasticity M.J. Crucini and J.S. Davis
 Distribution Capital and the Short and Long Run Import Demand Elasticity M.J. Crucini and J.S. Davis Discussant: Andrea Rao Board of Governors of the Federal Reserve System CD (2012): Motivation The trade
Identifying Banking Crises
 Identifying Banking Crises Matthew Baron (Cornell) Emil Verner (Princeton & MIT Sloan) Wei Xiong (Princeton) April 10, 2018 Consequences of banking crises Consequences are severe, according to Reinhart
The OECD s Society at a Glance Simon Chapple OECD ELS/SPD Villa Vigoni, Italy, 9-11 th March 2011
 The OECD s Society at a Glance 2 Simon Chapple OECD ELS/SPD Villa Vigoni, Italy, 9- th March 2 Reconceptualisation for 2: Internal reasons OECD growth from 3 to 34 countries Other major economies (e.g.
THE FUTURE OF HEALTH SPENDING
 THE FUTURE OF HEALTH SPENDING Joint OECD and ESRI workshop on Long-term prospect of the world economies up to 2060 and its policy implications OECD, Paris 31 Jan 2014 Joaquim OLIVEIRA MARTINS OECD, Public
Aging, the Future of Work and Sustainability of Pension System
 Aging, the Future of Work and Sustainability of Pension System WKÖ & Salzburg Global Seminar Event Dénes Kucsera Agenda Austria Vienna, Austria November 5, 2015 Introduction Increasing pressure on the
A prolonged period of low real interest rates? 1
 A prolonged period of low real interest rates? 1 Olivier J Blanchard, Davide Furceri and Andrea Pescatori International Monetary Fund From a peak of about 5% in 1986, the world real interest rate fell
Reporting practices for domestic and total debt securities
 Last updated: 27 November 2017 Reporting practices for domestic and total debt securities While the BIS debt securities statistics are in principle harmonised with the recommendations in the Handbook on
DFA Global Equity Portfolio (Class F) Quarterly Performance Report Q2 2014
 Quarterly Performance Report Q2 2014") DFA Global Equity Portfolio (Class F) Quarterly Performance Report Q2 2014 This presentation has been prepared by Dimensional Fund Advisors Canada ULC ( DFA Canada ), manager of the Dimensional Funds.
DFA Global Equity Portfolio (Class F) Quarterly Performance Report Q2 2014 This presentation has been prepared by Dimensional Fund Advisors Canada ULC ( DFA Canada ), manager of the Dimensional Funds.
Performance Budgeting (PB) in OECD Countries
 in OECD Countries") Performance Budgeting (PB) in OECD Countries Teresa Curristine, Budgeting and Public Expenditures Division, Public Governance Directorate, OECD 6 th Annual Meeting of Latin American Senior Budget Officials
Performance Budgeting (PB) in OECD Countries Teresa Curristine, Budgeting and Public Expenditures Division, Public Governance Directorate, OECD 6 th Annual Meeting of Latin American Senior Budget Officials
Market Overview As of 1/31/2019
 Asset Class Leadership Periodic Table Worst Best 78.51 58.21 41.45 37.21 34.47 27.45 26.46 20.58 19.69 29.09 27.58 2 18.88 16.71 15.51 15.12 15.06 11.15 7.84 7.28 4.98 2.64 2.11 0.39-2.91-5.50-13.71 20.14
WORKING DRAFT Last Modified 4/10/2012 3:27:03 PM Central Standard Time Printed. Long-term capitalism. Icare Santiago presentation April 2012
 WORKING DRAFT Last Modified 4/10/2012 3:27:03 PM Central Standard Time Printed Long-term capitalism Icare Santiago presentation April 2012 Five mega-trends reshaping the global economy The great rebalancing
Monetary policy regimes and exchange rate fluctuations
 Seðlabanki Íslands Monetary policy regimes and exchange rate fluctuations The views are of the author and do not necessarily reflect those of the Central Bank of Iceland Thórarinn G. Pétursson Central
Macroeconomic Theory and Policy
 ECO 209Y Macroeconomic Theory and Policy Lecture 3: Aggregate Expenditure and Equilibrium Income Gustavo Indart Slide 1 Assumptions We will assume that: There is no depreciation There are no indirect taxes