AGENDA BOARD OF FIRE AND POLICE PENSION COMMISSIONERS. May 5, :45 a.m. or immediately after the Governance Committee NEW LOCATION
|
|
|
- Scarlett Dixon
- 5 years ago
- Views:
Transcription
1 AGENDA BOARD OF FIRE AND POLICE PENSION COMMISSIONERS May 5, :45 a.m. or immediately after the Governance Committee NEW LOCATION Los Angeles Fire and Police Pensions Building 701 East Third Street, Suite 401 Los Angeles, CA Commissioner Diannitto will participate telephonically from 4612 El Reposo Drive, Los Angeles, CA An opportunity for the public to address the Board or Committee about any item on today s agenda for which there has been no previous opportunity for public comment will be provided before or during consideration of the item. Members of the public who wish to speak on any item on today s agenda are requested to complete a speaker card for each item they wish to address, and present the completed card(s) to the commission executive assistant. Speaker cards are available at the commission executive assistant s desk. In compliance with Government Code Section , non-exempt writings that are distributed to a majority or all of the Board or applicable Committee of the Board in advance of their meetings may be viewed at the office of the Los Angeles Fire and Police Pension System (LAFPP), located at 701 East 3 nd Street, 2 th Floor, Los Angeles, California 90013, or by clicking on LAFPP s website at or at the scheduled meeting. Non-exempt writings that are distributed to the Board or Committee at a scheduled meeting may be viewed at that meeting. In addition, if you would like a copy of any record related to an item on the agenda, please contact the commission executive assistant, at (213) or by at rhonda.ketay@lafpp.com. Sign language interpreters, communication access real-time transcription, assistive listening devices, or other auxiliary aids and/or services may be provided upon request. To ensure availability, you are advised to make your request at least 72 hours prior to the meeting you wish to attend. Due to difficulties in securing sign language interpreters, five or more business days notice is strongly recommended. For additional information, please contact the Department of Fire and Police Pensions, (213) voice or (213) TDD. A. COMMITTEE REPORTS 1. AUDIT COMMITTEE RECOMMENDATION OF AN EXTERNAL FINANCIAL AUDITOR AND POSSIBLE BOARD ACTION B. ITEMS FOR BOARD ACTION 1. APPROVAL OF RETROACTIVE INCREASE TO THE MAXIMUM RETIRED SWORN NON-MEDICARE HEALTH SUBSIDY FOR FISCAL YEAR AND POSSIBLE BOARD ACTION 2. CONTINUATION OF MAXIMUM RETIRED SWORN NON-MEDICARE HEALTH SUBSIDY FOR FISCAL YEAR WITH SUPPLEMENTAL REPORT AND POSSIBLE BOARD ACTION
2 3. PROPOSED LEGISLATION FOR FIREFIGHTER CANCER REGISTRY ACT OF 2016 AND POSSIBLE BOARD ACTION 4. DISCUSSION ON THE ANNUAL BOARD EDUCATIONAL OFF-SITE MEETING AND POSSIBLE BOARD ACTION 5. CONTINUATION OF ASSET ALLOCATION ANALYSIS AND POSSIBLE BOARD ACTION C. REPORTS TO THE BOARD 1. PRESENTATION BY BRANDES INVESTMENT PARTNERS INTERNATIONAL EQUITY MANAGER 2. PRESENTATION BY FISHER ASSET MANAGEMENT INTERNATIONAL EQUITY MANAGER 3. Has any Board Member made any expenditure to influence State legislative or administrative action? 4. Miscellaneous correspondence from money managers, consultants, etc. Received and Filed. 5. General Manager s Report a. Benefits Actions approved by General Manager on April 21, 2015 b. Other business relating to Department operations D. COMMITTEE CALENDAR 1. Audit Committee Last met: 04/21/16; next meeting: 07/21/16 2. Benefits Committee Last met: 10/01/15; next meeting: 08/18/16 3. Governance Committee Last met: 01/07/16; next meeting: 05/05/16 E. CONSENT ITEMS 1. APPROVAL OF TRAVEL AUTHORITY (NAVARRO) NATIONAL CONFERENCE ON PUBLIC EMPLOYEE RETIREMENT SYSTEMS (NCPERS), 2016 ANNUAL CONFERENCE AND EXHIBITION 2. Findings of Fact a. Lance C. Smith Tier 5 b. Edward J. Jones Tier 2 c. Dee-Ann Bernard - DC of Larkin W. Bernard Tier 2 May 5,
3 3. Approval of Minutes a. Minutes of the Regular Board meeting of September 3, 2015 F. CONSIDERATION OF FUTURE AGENDA ITEMS G. GENERAL PUBLIC COMMENT ON MATTERS WITHIN THE BOARD S JURISDICTION H. CLOSED SESSION 1. CLOSED SESSION PURSUANT TO SUBDIVISIONS (a) AND (d)(1) OF GOVERNMENT CODE SECTION TO CONFER WITH LEGAL COUNSEL REGARDING PENDING LITIGATION, IN THE FOLLOWING CASE: The City of Los Angeles v. Bankrate, Inc, et al. (Case No. 9:14 cv dmm (S.D. Fla.) May 5,
4 DEPARTMENT OF FIRE AND POLICE PENSIONS 701 E. 3rd Street, Suite 200 Los Angeles, CA (213) REPORT TO THE BOARD OF FIRE AND POLICE PENSION COMMISSIONERS DATE: MAY 5, 2016 ITEM: A.1 FROM: AUDIT COMMITTEE RUBEN NAVARRO, CHAIR CORINNE TAPIA, VICE CHAIR GEORGE ALIANO BRIAN PENDLETON SUBJECT: AUDIT COMMITTEE RECOMMENDATION OF AN EXTERNAL FINANCIAL AUDITOR AND POSSIBLE BOARD ACTION RECOMMENDATIONS That the Board: 1. Adopt the Audit Committee s recommendation to select Simpson & Simpson Certified Public Accountants as the external financial auditor for a three-year term covering fiscal years June 30, 2016, 2017, and 2018; 2. Authorize the General Manager to negotiate terms and conditions of the contract with Simpson & Simpson Certified Public Accountants, including the thirty-day termination clause contained in the Standard Provisions for City Contracts; and, 3. Authorize the President of the Board, on behalf of the Board, to execute the contract, subject to City Attorney approval as to form. DISCUSSION On January 7, 2016, the Board authorized the search for an independent accounting firm to perform the audit of our financial statements for the three fiscal years ending June 30, 2016, 2017, and On February 29, 2016, the Request for Proposal (RFP) was released by posting on the City s Business Assistance Virtual Network (LABAVN); placing an advertisement in Pensions and Investments; and posting on LAFPP s website. Five accounting firms responded to the RFP: Brown Armstrong Accountancy Corporation Crowe Horwath LLP Macias Gini and O Connell LLP Simpson & Simpson Certified Public Accountants Vasquez & Company LLP
5 Staff conducted a preliminary review of the proposals to determine the firm s compliance with the mandatory requirements and to evaluate these firms on the following technical qualifications: Expertise and Experience include: firm s start date; size of firm, particularly the governmental audit staff; the quality of audit personnel and quality of management support available for technical consultation; and recent past experience on similar or comparable government audit engagements with over $5 billion in assets. Audit Approach includes: adequacy of proposed segmentation of audit engagement; appropriateness of staffing (hours and level) for each audit segment; adequacy of sampling techniques; and adequacy of analytical procedures in evaluating internal control and auditing investments. Staff scored each of the five firms on the above technical qualifications and narrowed the field to three firms: Brown Armstrong Accountancy Corporation; Crowe Horwath LLP; and Simpson & Simpson Certified Public Accountants. Information on each finalist is provided on the attached summary matrix. Regarding the firms that were eliminated as finalists, reasons for elimination included: Macias Gini and O Connell LLP was eliminated as a finalist because of higher fees. Vasquez & Company LLP was eliminated as a finalist because the firm did not have comparable public pension fund experience. The Audit Committee heard 10-minute presentations from the three finalists on April 21, In addition to the mandatory and technical qualifications, the Audit Committee evaluated the proposed fees as related to the audit scope and services proposed. After considering the presentations, finalists responses to Committee questions, and information in the summary matrix, the Committee selected Simpson & Simpson Certified Public Accountants for recommendation to the full Board. BUDGET Financial Statements audit fees are included in the Administrative Expense of the Annual Budget. POLICY Under the provisions of the State of California Government Code Sections , all California Public Retirement Systems are required to furnish audited financial statements to the State Controller annually. This report was prepared by: Erin J. Kenney Departmental Audit Manager Internal Audit Section RPC:EJK:CD Attachment: Department of Fire and Police Pensions Finalist Matrix Board Report Page 2 May 5, 2016
6 DEPARTMENT OF FIRE AND POLICE PENSIONS REQUEST FOR PROPOSAL ANNUAL FINANCIAL AUDIT SERVICES Fiscal Years Ending June 30, 2016, 2017, and 2018 FINALIST MATRIX Name of Accounting Firm Brown Armstrong Accountancy Corporation Crowe Horwath LLP Simpson & Simpson Certified Public Accountants Address of Local Office 260 S. Los Robles Avenue, Suite Ventura Boulevard, Ninth Floor 633 W. 5 th Street, Suite 3320 Pasadena CA Sherman Oaks CA Los Angeles CA Years in Operation 42 years (since 1974) 72 years (since 1942) 40 years (since 1976) Gov t &/or Pension Clients 70 Pg. 8 states 1,100 benefit plans. The number of government and/or pension clients is not specified. Besides references, names of government and/or pension clients are not listed. Gov t Pension Clients with at least $5 billion in plan assets Composition of Engagement Audit Team & estimated audit hours Los Angeles Fire and Police Pension System LA City Employees Retirement System LA County Employees Retirement Assn. Contra Costa County Employees Retirement Assn. San Diego County Employees Retirement Assn. Engagement Partner Technical Review Partner Engagement Manager Engagement Senior and staff California State Teachers Retirement System Tennessee Valley Authority Retirement System Partner Manager Senior Staff Staff LADWP Employees Retirement System LAFPP Los Angeles Unified School District Southern California Edison Employee Benefit Plans Engagement Partner Quality Control Partner IT Principal Manager Senior Auditor Staff Auditor 20 Audit Approach Fee Schedule: FY June 30, 2016 FY June 30, 2017 FY June 30, hours Audit procedures include audit planning; document understanding of internal control system; review applicable laws/regulations and test for compliance; IT review; field work; draft and finalize required reports. $77,750 80,000 82, hours Risk based approach that emphasizes the understanding, corroborating and testing of internal controls to assess risk within the organization. $79,900 81,498 - CPI capped at 2% per year 83,128 - CPI capped at 2% per year 840 hours Audit procedures include pre-engagement planning; internal control evaluation; audit testing on investment-related activity, participant data, contribution data, benefit payments, expenditures and liabilities; draft and finalized required reports. $82,000 82,000 82,000 Total 3-year Audit Fees Comments $240,000 Brown Armstrong is a certified Small Business Enterprise (SBE). $244,526 Crowe Horwath indicates it actively seeks out minority, women, and disadvantaged owned and small businesses as subcontractors. $246,000 Simpson & Simpson is a certified Women/Minority Business Enterprise (WMBE).
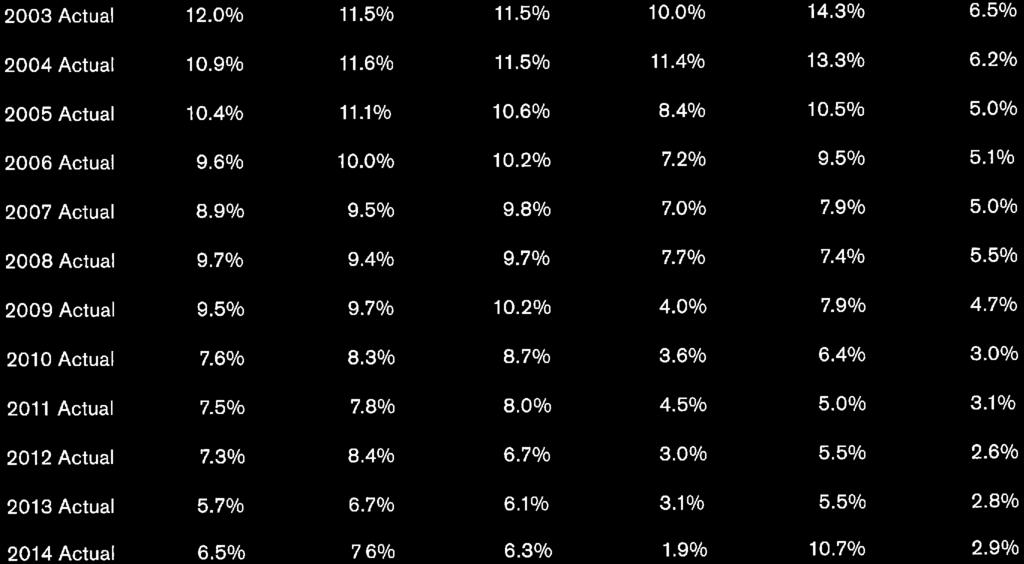
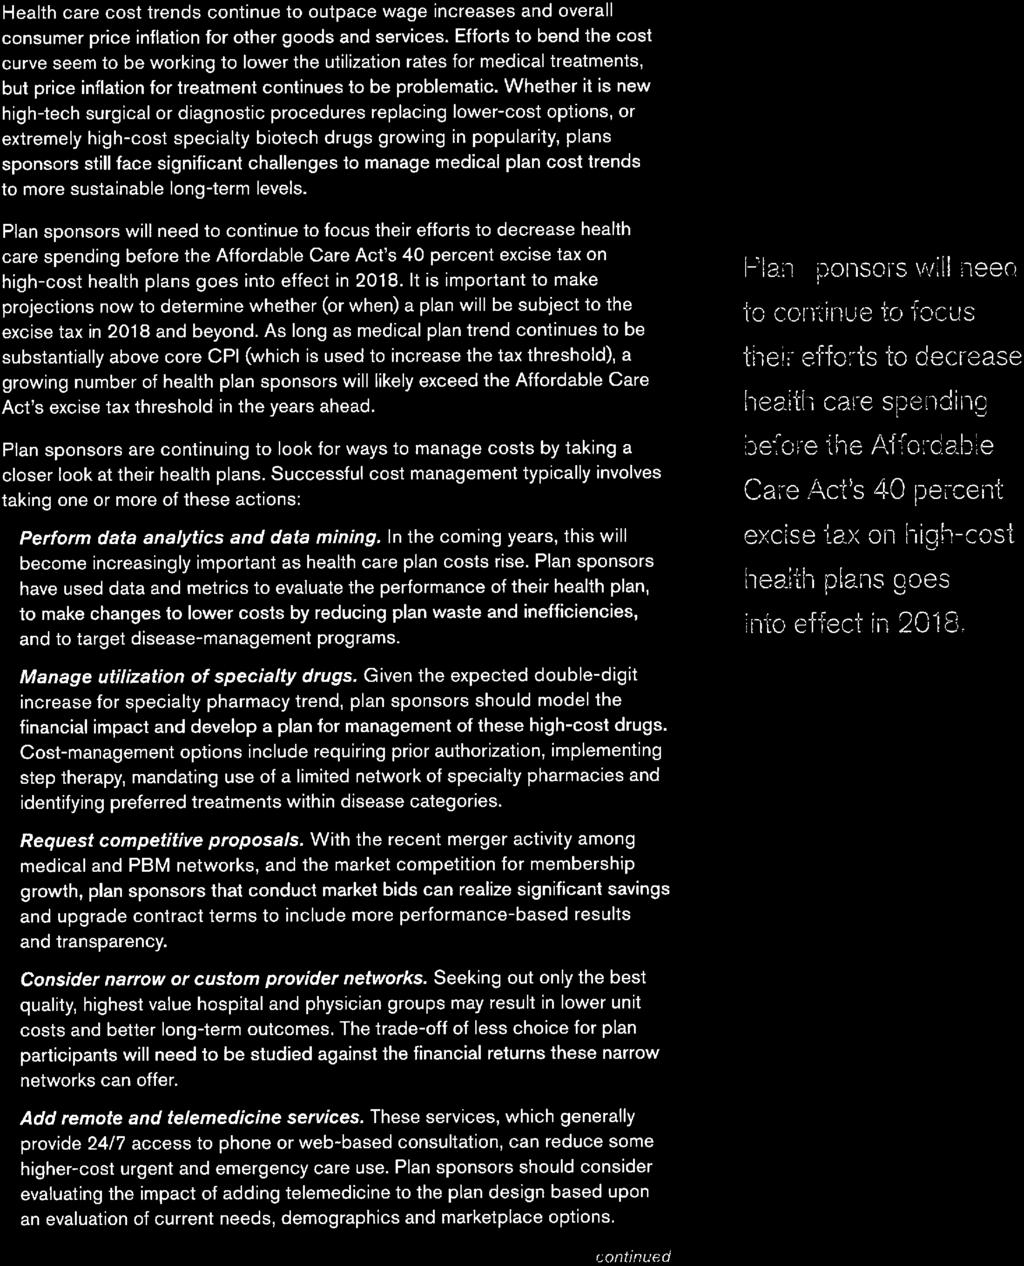
7 DEPARTMENT OF FIRE AND POLICE PENSIONS 701 E. 3rd Street, Suite 200 Los Angeles, CA (213) REPORT TO THE BOARD OF FIRE AND POLICE PENSION COMMISSIONERS DATE: MAY 5, 2016 ITEM: B.1 FROM: RAYMOND P. CIRANNA, GENERAL MANAGER SUBJECT: APPROVAL OF RETROACTIVE INCREASE TO THE MAXIMUM RETIRED SWORN NON-MEDICARE HEALTH SUBSIDY FOR FISCAL YEAR AND POSSIBLE BOARD ACTION RECOMMENDATION That the Board approve an additional 0.25% retroactive increase to the maximum retired sworn non-medicare health subsidy for a total increase of 7.00%, to $1, per month, effective July 1, BACKGROUND Beginning in 2006, Administrative Code Section (e) grants the Board the authority to raise the maximum retired sworn non-medicare health subsidy ( retiree subsidy ) on an annual basis. The Board may raise the retiree subsidy up to a maximum of the lesser of 7% or the Boardapproved actuarial assumed rate for medical inflation for pre-65 health benefits for the fiscal year. Pursuant to the City Council s adoption of this new formula, the Board has annually increased the retiree subsidy by the maximum amount allowable pursuant to its discretion described above. DISCUSSION Following the Board s consideration of the retiree subsidy increase for FY at its meeting on April 21, 2016, staff consulted with the Plan actuary, Segal, regarding various questions that were raised concerning the actuarial assumed rate for medical inflation ( medical trend rate ). During the process of reviewing staff s draft report for the FY subsidy increase, Segal noted that the medical trend rate referenced in the staff report was incorrect. They advised that the appropriate medical trend rate for determining the FY maximum subsidy increase is 6.75% rather than the 6.50% included in the report. Segal explained this is due to the fact that the medical trend rates shown in the Health Care Premium Cost Trend Rates valuation report table are applied to calculate the premiums for the following year (see Attachment 1). In other words, when determining the medical trend rate to be used by the Board for increasing the retiree subsidy each year, one must look at the trend rate listed in this table for the prior fiscal year. The table below shows the medical trend rates as referenced by staff each year when recommending retiree subsidy increases, as well as the medical trend rates that Segal has advised should have been referenced.
8 Trend Rate Cited in Retiree Subsidy Board Report Appropriate Trend Rate as Clarified by Segal Approved Maximum Subsidy Maximum % Increase Allowed Under Ad Code Fiscal Year* Actual % Change Difference % 12.00% $ % 7.00% 0% % 9.00% $ % 7.00% 0% % 9.00% $ % 7.00% 0% % 9.00% $1, % 7.00% 0% % 10.00% $1, % 7.00% 0% % 9.00% $1, % 7.00% 0% % 8.50% $1, % 7.00% 0% % 8.00% $1, % 7.00% 0% % 7.00% $1, % 6.75% 0.25% * FY was excluded as the Plan had a different actuary at that time (GRS). Based on this clarification from Segal, staff has determined that the appropriate medical trend rate that should have been referenced when the Board approved the FY subsidy increase is 7.00%, rather than 6.75% as originally reported (Attachment 2). Therefore, the Board has the authority to raise the retiree subsidy by an additional 0.25%, for a total of 7.00%, from the FY maximum of $1, up to a maximum of $1, per month. This represents an increase of $3.36 per month over the maximum retiree subsidy that was previously approved by the Board on May 7, 2015 (i.e., $1,435.13). Based on the medical trend rate clarification from Segal, staff recommends that the maximum non- Medicare subsidy be increased by an additional 0.25%, the maximum allowable under the Board s discretion, retroactive to July 1, 2015 (Attachment 3). As reported to the Board last year when the 6.75% increase was adopted, Staff analyzed the percentage of premiums paid through payroll deduction on average by members who currently receive a subsidy and will be affected by an increase to the maximum non-medicare health subsidy. Prior to the adopted increase, these members paid on average 6.04% of their medical plan premium through pension check deduction. Based on the 6.75% increase, the average payroll deduction for these members was expected to increase to 7.24% of the plan premium. The additional 0.25% increase to the maximum subsidy is expected to further mitigate the premium increases experienced by members during the current fiscal year. Staff will work with Segal to clarify the information in the medical trend rate table in the valuation in order to make the table more easily relatable to the retiree subsidy increase formula. Segal has estimated the impact on the employer contribution rate determined in the June 30, 2015 valuation if the Board were to adjust the retiree subsidy using the medical trend assumption of 7.0% instead of 6.75%. They conclude that the change has an immaterial impact on the employer contribution rates. In particular, the total employer contribution rate originally calculated at 11.83% of payroll (assuming payment on July 15, 2016) would increase by about 0.02% of payroll. BUDGET Staff used the March 31, 2016 pension roll as the basis to project the impact of an additional 0.25% increase to the maximum non-medicare health subsidy. The cost data has been annualized to make it more easily-related to the budget. Board Report Page 2 May 5, 2016
9 The current annualized cost of health subsidy payments from the March 31, 2016 pension roll is approximately $104.8 million. With an additional 0.25% increase to the maximum non-medicare health subsidy, the annualized cost of health subsidy payments is expected to increase by approximately $70,000 to $104.9 million. This represents an increase of 0.07% in actual health subsidy payments. There are sufficient funds in the health subsidy budget for Fiscal Year ($108 million) to fund the retroactive subsidy increase. Should the Board approve this recommendation, staff will work to expeditiously process the retroactive subsidy reimbursements due to affected members. POLICY No policy changes as recommended. This report was prepared by: Joseph Salazar, Assistant General Manager Pensions Division RPC:JS Attachments: 1. Health Care Premium Cost Trend Rates table June 30, 2014 valuation 2. May 7, 2015 Board Report increasing retiree subsidy by 6.75% 3. Board Resolution for a 7.00% increase in the maximum retired non-medicare health subsidy, effective July 1, 2015 Board Report Page 3 May 5, 2016
10 ATTACHMENT 1 Excerpt from June 30, 2014 Health Valuation ATTACHMENT 1 Health Care Premium Cost Trend Rates: Trends to be applied in following fiscal years, to all health plans. Trend is to be applied to premium for shown fiscal year to calculate next fiscal year's projected premium. First Fiscal Year (July 1, 2014 through June 30, 2015). The fiscal year trend rates are the following: Trend (applied to calculate following year premium) Fiscal Year Non-Medicare Medicare % 7.00% % 6.75% % 6.50% % 6.25% % 6.00% % 5.75% % 5.50% % 5.25% 2022 and later 5.00% 5.00% Dental Premium Trend 5.00% for all years Medicare Part B Premium 5.00% for all years Trend
11 ATTACHMENT 2 DEPARTMENT OF FIRE AND POLICE PENSIONS 360 East Second Street, Suite 400 Los Angeles, CA (213) REPORT TO THE BOARD OF FIRE AND POLICE PENSION COMMISSIONERS DATE: MAY 7, 2015 ITEM: B.2 FROM: RAYMOND P. CIRANNA, GENERAL MANAGER SUBJECT: MAXIMUM RETIRED SWORN NON-MEDICARE HEALTH SUBSIDY FOR FISCAL YEAR AND POSSIBLE BOARD ACTION RECOMMENDATION That the Board increase the maximum retired sworn non-medicare health subsidy by 6.75%, to $1, per month, effective July 1, BACKGROUND Los Angeles Administrative Code (LAAC) Section (e) states in part, The Board is authorized to make discretionary changes, on an annual basis beginning in 2006, to the maximum monthly subsidy, so long as no increase exceeds the lesser of a 7% increase or the actuarial assumed rate for medical inflation for pre-65 health benefits established by the Board for the applicable fiscal year. Any change made by the Board that exceeds this limitation must be submitted for Council review accompanied by an actuarial report. Any increase that is not acted upon by the Council within 45 days after receipt of the report to Council for consideration of the increase shall be deemed approved. Should the Council reject the subsidy set by the Board, the Council shall determine the amount, if any, by which the subsidy shall be increased and shall adopt this increase by resolution. In contrast, the subsidies for members in Medicare plans, qualified surviving spouse/domestic partner health subsidies, retiree dental subsidies, and Medicare Part B reimbursements are governed by other LAAC provisions and determined at the end of each calendar year for the following year. The actuarial assumed rate for medical inflation for pre-65 health benefits ( Medical Trend Rate ) approved by the Board for Fiscal Year is 6.75%. Therefore, the Board has the authority to raise the retiree subsidy by up to 6.75%, from the current maximum of $1, up to a maximum of $1, per month. Per the City Charter, retiree subsidy increases were previously tied to increases for active sworn employees or retired civilians. Because of delays in contract negotiations for active employees, the
12 ATTACHMENT 2 retiree subsidy increases were often years late, causing a hardship to many retirees. A Charter amendment was passed in March 2005 which gave authority to the City Council and Mayor, via ordinance, to determine a more efficient way to provide timely retiree subsidies. The ordinance language proposed by the City was to provide the Board authority to increase the retiree subsidy by a maximum of 7%. The CAO advised that requests to exceed this maximum would require the accompaniment of an actuarial study on the cost of the proposed change to be presented to the City Council. Though it was noted that the Los Angeles City Employees Retirement System (LACERS) Board does not have such a limit, the City was adamant about imposing the 7% restriction for Fire and Police retirees, arguing that history demonstrated 7% was adequate and that the appeal mechanism to City Council could be used if necessary. This method was eventually codified in Ordinance 177,630, which became effective on June 19, DISCUSSION Premium Changes Effective July 1, 2015, premium changes will take effect for plans offered by the Los Angeles Firemen s Relief Association (LAFRA) and Los Angeles Police Relief Association (LAPRA). Combined, these two organizations provide health insurance to 97.9% of all LAFPP retired members enrolled in a Board-approved health plan. Health plans offered by the United Firefighters of Los Angeles City (UFLAC) and by LAFPP operate on a calendar year basis with premiums changing every January 1 st. There are currently 136 retired members enrolled in UFLAC health plans and 44 retired members enrolled in LAFPP health plans, representing 1.6% and 0.51% of the enrolled retiree population respectively. The average 2015 premium increase weighted by population for retired members in all LAFPPapproved plans was 6.53%. Plan Provider Medical Plan Avg Increase Percentage of LAFPP Retirees Enrolled LAFRA Fire Medical PPO 6.92% 24.12% Kaiser 3.82% 3.42% Blue Cross PPO 6.73% 48.70% LAPRA CA Care HMO 9.46% 8.82% Kaiser 3.47% 12.84% UFLAC Prudent Buyer PPO 9.15% 1.00% CA Care HMO 9.41% 0.60% Blue Cross PPO 4.89% 0.16% LAFPP (LACERS Subgroup)* Blue Cross HMO 8.21% 0.02% Kaiser 6.46% 0.22% UnitedHealthcare 2.43% 0.11%
13 Total monthly premiums for all enrollees in LAFPP health plans on the April 30, 2015 pension roll were approximately $8,884,000, or $106,608,000 annually. Staff anticipates annual premiums will increase to approximately $113,472,000 with the premium increases effective July 1, Effect of Changes to the Maximum Retired Sworn Non-Medicare Health Subsidy The maximum non-medicare health subsidy affects two groups of LAFPP retirees: ATTACHMENT 2 1. Retirees who are not yet eligible for Medicare, or eligible for Medicare Part B only. 2. Retirees who are enrolled in both Medicare Parts A and B and who carry one or more dependents (e.g., a spouse or domestic partner) on their health plan. The non-medicare health subsidy is used in the formula that determines how much retirees enrolled in Medicare Parts A and B (group #2 above) receive toward subsidizing the cost of covering their dependents. Based on member health plan enrollment and subsidy eligibility as of the April 30, 2015 pension roll, staff has calculated the effect on member out-of-pocket costs, or premium deductions, should the Board increase the maximum non-medicare health subsidy by 6.75%. The tables below summarize the results of this analysis by grouping retired members into bands according to the dollar impact on their monthly premium deductions. Change in Retired Members Deductions Retired Members Affected Effect on Retired Members Deductions Retired Members Affected -$100 to -$ $50 to -$ $0 2,436 Deduction Decrease 281 No Deduction Change 2,436 Deduction Increase 5,829 $0.01 to $50 5,213 $50.01 to $ $ to $ $ to $ The 11 members who will experience the largest deduction increases ($ each) are enrolled in LAPRA s Blue Cross PPO plan. They consist of retired members who are either ineligible for a subsidy or have a frozen subsidy, and one who has only 11 years of service. Deductions for this group would be the same for any subsidy increase in the maximum non-medicare retiree subsidy up to 6.75%.
14 Those retired members who will experience deduction increases of $ to $ are in LAPRA s Blue Cross PPO and HMO plans and LAFRA s Fire Medical PPO and Kaiser plans. Of these 65 retirees, 30 are ineligible for a subsidy at this time. Three have frozen health subsidies, and the remaining 32 have less than 25 years of service. Those who will experience deduction increases between $0.01 and $ come from each of the LAFRA and LAPRA plans. All LAFPP-approved health plans have some members who will experience no deduction increase. Those experiencing deduction decreases consist primarily of members enrolled in LAFRA and LAPRA plans that experienced no premium changes or small premium changes, as well as LAFPP and UFLAC plan members. As LAFPP and UFLAC change health plan premiums on January 1 st rather than July 1 st, deduction decreases are to be expected for these plans. Deductions tend to increase for these plans when their premiums change on January 1 st of each year. Staff has performed a more detailed analysis (Attachment 1) of the affected members with the following coverage levels in plans offered by LAFRA and LAPRA: Member only, non-medicare Two-Party, both non-medicare Family, all non-medicare Two-Party, Member with Medicare Parts A&B&D, Spouse non-medicare Two-Party, Member and Spouse, both with Medicare Parts A&B&D Together, these five coverage levels offered through LAFRA and LAPRA cover just under 86% of retired members affected by changes in the non-medicare health subsidy. Staff has analyzed the change in deductions for members who have 25+ years of service from 2005 to the present. The year 2005 was selected as a starting point as that was the year immediately prior to the Board being granted the discretion to set the maximum non-medicare health subsidy. Staff analyzed the percentage of the premium paid through payroll deduction on average by members who currently receive a subsidy and will be affected by an increase to the maximum non-medicare health subsidy. These members pay on average 6.04% of their plan premium through pension check deduction. Assuming a 6.75% increase to the maximum non-medicare health subsidy, the average payroll deduction for these members will increase to 7.24% of the plan premium. Included in these calculations are members enrolled under all scenarios shown in Attachment 1, affected members who have less than 25 years of service, and members enrolled in affected plans that are not listed in Attachment 1. BUDGET ATTACHMENT 2 Staff used the April 30, 2015 pension roll as the basis to project the impact of a 6.75% increase to the maximum non-medicare health subsidy. The cost data has been annualized to make it more easily-related to the budget.
15 The current annualized cost of health subsidy payments from the April 30, 2015 pension roll is $97 million. With a 6.75% increase to the maximum non-medicare health subsidy, the annualized cost of health subsidy payments is expected to increase by approximately $4.8 million to $101.8 million. This represents an increase of 4.94% in actual health subsidy payments. The proposed health subsidy budget for Fiscal Year is $108 million. It should be noted that the above illustration does not factor in any potential changes to the retired member Medicare health subsidy or surviving spouse/domestic partner health subsidy that may occur effective January 1, SUMMARY Staff recommends that the maximum non-medicare subsidy be increased by 6.75%, the maximum allowable under the Board s discretion (Attachment 2), for the following reasons: In 2015, 83.26% of retired members are enrolled in health plans that will have experienced an average increase greater than or roughly equal to the under-65 actuarial medical trend rate of 6.75% for fiscal year With an increase of 6.75% to the maximum non-medicare health subsidy, 69.43% of retired members will still experience increased out-of-pocket costs. Retired members, on average, will be paying a slightly larger percentage of their plan premiums through payroll deduction, even with the recommended 6.75% increase. The proposed maximum non-medicare health subsidy of $1, is still below LACERS maximum health subsidy of $1, for the 2015 plan year. POLICY No policy changes as recommended. ATTACHMENT 2 This report was prepared by: Anthony R. Torres, Manager Medical & Dental Benefits Section RC:JS:ART Attachment 1 Historical Deductions and Impact of Subsidy Increases in Selected Health Plan Options Attachment 2 Board Resolution for a 6.75% increase in the maximum retired non-medicare health subsidy
16 ATTACHMENT 1 HISTORICAL DEDUCTIONS AND IMPACT OF SUBSIDY INCREASES IN SELECTED HEALTH PLAN OPTIONS ATTACHMENT 2 EFFECTIVE DATE 7/1/2005 7/1/2006 7/1/2007 7/1/2008 7/1/2009 7/1/2010 7/1/2011 7/1/2012 7/1/2013 7/1/ /01/15 MAXIMUM NON MEDICARE SUBSIDY $ $ $ $ $ $1, $1, $1, $1, $1, $1, LAFRA Fire Medical PPO Retirees Enrolled 7/1/2005 7/1/2006 7/1/2007 7/1/2008 7/1/2009 7/1/2010 7/1/2011 7/1/2012 7/1/2013 7/1/ /01/15 As of 4/30/2015 Single Party Non Medicare Premium $ $ $ $ $ $ $ $ $1, $1, $1, Single Party Deduction $0.00 $0.00 $0.00 $0.00 $0.00 $0.00 $0.00 $0.00 $0.00 $0.00 $0.00 Deduction as % of Premium 0.00% 0.00% 0.00% 0.00% 0.00% 0.00% 0.00% 0.00% 0.00% 0.00% 0.00% 63 Two Party Non Medicare Premium $ $ $ $ $1, $1, $1, $1, $1, $1, $1, Two Party Deduction $ $ $ $96.45 $ $ $72.72 $77.81 $58.21 $62.28 $83.04 Deduction as % of Premium 16.64% 15.53% 12.25% 9.72% 9.72% 9.72% 6.21% 6.21% 4.43% 4.43% 5.47% 289 Family Non Medicare Premium $1, $1, $1, $1, $1, $1, $1, $1, $1, $1, $1, Family Deduction $ $ $ $ $ $ $ $ $ $ $ Deduction as % of Premium 30.58% 29.65% 26.92% 24.85% 24.85% 24.85% 21.93% 21.93% 20.44% 20.44% 21.31% 165 Premium for Member Medicare A&B&D, Spouse Non Medicare $ $ $ $ $ $ $ $ $ $ $ Deduction $17.41 $36.13 $2.60 $0.00 $0.00 $0.00 $0.00 $57.90 $52.49 $47.06 $55.40 Deduction as % of Premium 2.79% 5.84% 0.41% 0.00% 0.00% 0.00% 0.00% 7.18% 6.32% 5.30% 5.83% 193 Premium for Member and Spouse, Both Medicare A&B&D $ $ $ $ $ $ $ $ $ $ $ Deduction $17.41 $36.13 $2.60 $ $ $ $ $57.90 $52.49 $47.06 $55.40 Deduction as % of Premium 2.79% 6.21% 0.43% 0.00% 0.00% 0.00% 0.00% 7.64% 6.73% 5.64% 6.20% 861 LAFRA Kaiser Retirees Enrolled 7/1/2005 7/1/2006 7/1/2007 7/1/2008 7/1/2009 7/1/2010 7/1/2011 7/1/2012 7/1/2013 7/1/ /01/15 As of 4/30/2015 Single Party Non Medicare Premium $ $ $ $ $ $ $ $ $ $ $ Single Party Deduction $0.00 $0.00 $0.00 $0.00 $0.00 $0.00 $0.00 $0.00 $0.00 $0.00 $0.00 Deduction as % of Premium 0.00% 0.00% 0.00% 0.00% 0.00% 0.00% 0.00% 0.00% 0.00% 0.00% 0.00% 8 Two Party Non Medicare Premium $ $ $ $ $ $1, $1, $1, $1, $1, $1, Two Party Deduction $6.56 $15.96 $0.00 $0.00 $0.00 $0.00 $0.00 $0.00 $0.00 $0.00 $0.00 Deduction as % of Premium 0.88% 2.00% 0.00% 0.00% 0.00% 0.00% 0.00% 0.00% 0.00% 0.00% 0.00% 53 Family Non Medicare Premium $ $1, $1, $1, $1, $1, $1, $1, $1, $1, $1, Family Deduction $ $ $ $ $ $ $ $ $ $ $ Deduction as % of Premium 21.43% 22.33% 18.04% 16.50% 19.08% 20.18% 16.58% 17.57% 12.28% 8.25% 11.68% 21 Premium for Member Medicare A&B&D, Spouse Non Medicare $ $ $ $ $ $ $ $ $ $ $1, Deduction $6.56 $37.17 $0.00 $0.00 $0.00 $0.00 $0.00 $0.00 $0.00 $0.00 $0.00 Deduction as % of Premium 0.93% 5.05% 0.00% 0.00% 0.00% 0.00% 0.00% 0.00% 0.00% 0.00% 0.00% 26 Premium for Member and Spouse, Both Medicare A&B&D $ $ $ $ $ $ $ $ $ $ $ Deduction $0.00 $21.21 $0.00 $0.00 $0.00 $0.00 $0.00 $0.00 $0.00 $0.00 $0.00 Deduction as % of Premium 0.00% 3.15% 0.00% 0.00% 0.00% 0.00% 0.00% 0.00% 0.00% 0.00% 0.00% 110
17 ATTACHMENT 1 HISTORICAL DEDUCTIONS AND IMPACT OF SUBSIDY INCREASES IN SELECTED HEALTH PLAN OPTIONS ATTACHMENT 2 EFFECTIVE DATE 7/1/2005 7/1/2006 7/1/2007 7/1/2008 7/1/2009 7/1/2010 7/1/2011 7/1/2012 7/1/2013 7/1/ /01/15 MAXIMUM NON MEDICARE SUBSIDY $ $ $ $ $ $1, $1, $1, $1, $1, $1, LAPRA BC PPO Retirees Enrolled 7/1/2005 7/1/2006 7/1/2007 7/1/2008 7/1/2009 7/1/2010 7/1/2011 7/1/2012 7/1/2013 7/1/ /01/15 As of 4/30/2015 Single Party Non Medicare Premium $ $ $ $ $ $ $ $ $ $ $ Single Party Deduction $0.00 $0.00 $0.00 $0.00 $0.00 $0.00 $0.00 $0.00 $0.00 $0.00 $0.00 Deduction as % of Premium 0.00% 0.00% 0.00% 0.00% 0.00% 0.00% 0.00% 0.00% 0.00% 0.00% 0.00% 419 Two Party Non Medicare Premium $1, $1, $1, $1, $1, $1, $1, $1, $1, $1, $1, Two Party Deduction $ $ $ $ $ $ $ $ $ $ $ Deduction as % of Premium 32.97% 31.62% 31.15% 30.54% 30.01% 29.59% 29.14% 27.67% 24.14% 16.53% 17.42% 292 Family Non Medicare Premium $1, $1, $1, $1, $1, $1, $1, $1, $1, $1, $2, Family Deduction $ $ $ $ $ $ $ $ $ $ $ Deduction as % of Premium 38.10% 36.65% 36.06% 35.46% 34.99% 34.52% 34.21% 32.84% 29.57% 26.82% 28.61% 186 Premium for Member Medicare A&B&D, Spouse Non Medicare $ $ $ $ $1, $1, $1, $1, $1, $1, $1, Deduction $ $ $ $ $ $ $ $ $ $ $ Deduction as % of Premium 27.16% 24.43% 24.41% 24.04% 24.04% 25.60% 26.13% 24.45% 20.55% 9.55% 9.93% 400 Premium for Member and Spouse, Both Medicare A&B&D $ $ $ $ $ $ $ $ $1, $ $1, Deduction $ $4.50 $ $ $ $63.86 $98.36 $ $92.77 $ $20.82 Deduction as % of Premium 0.00% 0.76% 0.00% 0.00% 0.00% 7.32% 10.13% 10.43% 9.18% 4.31% 2.07% 1429 LAPRA CA Care HMO Retirees Enrolled 7/1/2005 7/1/2006 7/1/2007 7/1/2008 7/1/2009 7/1/2010 7/1/2011 7/1/2012 7/1/2013 7/1/ /01/15 As of 4/30/2015 Single Party Non Medicare Premium $ $ $ $ $ $ $ $ $ $ $ Single Party Deduction $0.00 $0.00 $0.00 $0.00 $0.00 $0.00 $0.00 $0.00 $0.00 $0.00 $0.00 Deduction as % of Premium 0.00% 0.00% 0.00% 0.00% 0.00% 0.00% 0.00% 0.00% 0.00% 0.00% 0.00% 70 Two Party Non Medicare Premium $ $ $ $ $ $ $ $1, $1, $1, $1, Two Party Deduction $0.00 $0.00 $0.00 $0.00 $0.00 $0.00 $0.00 $0.00 $0.00 $0.00 $0.00 Deduction as % of Premium 0.00% 0.00% 0.00% 0.00% 0.00% 0.00% 0.00% 0.00% 0.00% 0.00% 0.00% 129 Family Non Medicare Premium $ $ $ $ $ $1, $1, $1, $1, $1, $1, Family Deduction $0.00 $0.00 $0.00 $0.00 $0.12 $73.65 $75.57 $61.94 $95.91 $ $ Deduction as % of Premium 0.00% 0.00% 0.00% 0.00% 0.01% 6.70% 6.44% 5.01% 7.09% 7.00% 9.27% 94 Premium for Member Medicare A&B&D, Spouse Non Medicare $ $ $ $ $ $ $ $ $ $1, $1, Deduction $0.00 $0.00 $0.00 $0.00 $0.00 $0.00 $0.00 $0.00 $3.27 $0.00 $0.00 Deduction as % of Premium 0.00% 0.00% 0.00% 0.00% 0.00% 0.00% 0.00% 0.00% 0.33% 0.00% 0.00% 126 Premium for Member and Spouse, Both Medicare A&B&D $ $ $ $ $ $ $ $ $ $ $ Deduction $0.00 $0.00 $0.00 $0.00 $0.00 $0.00 $0.00 $0.00 $3.27 $0.00 $0.00 Deduction as % of Premium 0.00% 0.00% 0.00% 0.00% 0.00% 0.00% 0.00% 0.00% 0.35% 0.00% 0.00% 180
18 ATTACHMENT 1 HISTORICAL DEDUCTIONS AND IMPACT OF SUBSIDY INCREASES IN SELECTED HEALTH PLAN OPTIONS ATTACHMENT 2 EFFECTIVE DATE 7/1/2005 7/1/2006 7/1/2007 7/1/2008 7/1/2009 7/1/2010 7/1/2011 7/1/2012 7/1/2013 7/1/ /01/15 MAXIMUM NON MEDICARE SUBSIDY $ $ $ $ $ $1, $1, $1, $1, $1, $1, LAPRA Kaiser Retirees Enrolled 7/1/2005 7/1/2006 7/1/2007 7/1/2008 7/1/2009 7/1/2010 7/1/2011 7/1/2012 7/1/2013 7/1/ /01/15 As of 4/30/2015 Single Party Non Medicare Premium* $ $ $ $ $ $ $ $ $ $ $ Single Party Deduction $0.00 $0.00 $0.00 $0.00 $0.00 $0.00 $0.00 $0.00 $0.00 $0.00 $0.00 Deduction as % of Premium 0.00% 0.00% 0.00% 0.00% 0.00% 0.00% 0.00% 0.00% 0.00% 0.00% 0.00% 88 Two Party Non Medicare Premium* $ $ $ $ $ $ $ $1, $1, $1, $1, Two Party Deduction $0.00 $0.00 $0.00 $0.00 $0.00 $0.00 $0.00 $0.00 $0.00 $0.00 $0.00 Deduction as % of Premium 0.00% 0.00% 0.00% 0.00% 0.00% 0.00% 0.00% 0.00% 0.00% 0.00% 0.00% 154 Family Non Medicare Premium* $ $ $ $ $ $1, $1, $1, $1, $1, $1, Family Deduction $0.00 $0.00 $0.00 $0.00 $0.00 $0.00 $0.00 $28.41 $0.00 $6.96 $0.00 Deduction as % of Premium 0.00% 0.00% 0.00% 0.00% 0.00% 0.00% 0.00% 2.36% 0.00% 0.52% 0.00% 80 Premium for Member Medicare A&B&D, Spouse Non Medicare* $ $ $ $ $ $ $ $ $ $ $ Deduction $0.00 $0.00 $0.00 $0.00 $0.00 $0.00 $0.00 $0.00 $0.00 $0.00 $0.00 Deduction as % of Premium 0.00% 0.00% 0.00% 0.00% 0.00% 0.00% 0.00% 0.00% 0.00% 0.00% 0.00% 115 Premium for Member and Spouse, Both Medicare A&B&D* $ $ $ $ $ $ $ $ $ $ $ Deduction $ $ $ $ $ $ $ $ $ $ $ Deduction as % of Premium 0.00% 0.00% 0.00% 0.00% 0.00% 0.00% 0.00% 0.00% 0.00% 0.00% 0.00% 383
19 ATTACHMENT 3 HEALTH SUBSIDIES/REIMBURSEMENTS FOR PENSIONERS RESOLUTION NO. WHEREAS, retired members of the Fire and Police Pension Plan, Tiers 1, 2, 3, 4, 5 and 6, have had paid, on their behalf, a health insurance premium subsidy, or have received a reimbursement, in accordance with the provisions of Article 10, Division 4, Chapters 11.5 and 20 of the Administrative Code; and WHEREAS, the Board of Fire and Police Pension Commissioners has been granted the authority under Section (e) of the Administrative Code to increase or decrease the maximum monthly amount of the health insurance subsidy in accordance with the authority conferred in subsections (e) of Sections 1330, 1428, 1518, 1618 and 1718 of the Charter and subsection (e) of of the Administrative Code; and WHEREAS, at its May 7, 2015 meeting, the Board originally adopted an increase of 6.75%, setting the maximum monthly health insurance premium subsidy at $1,435.13, and staff has since been advised by the Plan actuary that the medical trend rate referenced for the increase was incorrect; and WHEREAS, the pre-65 actuarial assumed medical trend rate for the fiscal year as adopted by the Board in the plan s June 30, 2014 actuarial valuation is 7.00%; RESOLVED, that the maximum monthly health insurance premium subsidy as described in Section (e) of the Administrative Code shall be $1,438.49, payable on behalf of the members and their eligible dependents (as such term is defined in the Board approved health insurance plans) or received as a reimbursement; and RESOLVED, that retired members of age 60 and above with 10 or more years of service who retired with an effective date prior to July 1, 1998, and retired members of age 55 and above with 10 or more years of service who retired with an effective date of July 1, 1998 or after, who do not qualify for Part A of Medicare, shall have paid to their respective approved health insurance carriers a monthly health insurance subsidy, or paid directly to the member as a reimbursement, an amount not to exceed $ for each whole year of service; said subsidy to apply first to that portion of the premium applicable to the retired member with any remainder to be applied to the dependent(s) of said member; and RESOLVED, that retired members who do qualify for federally funded Part A of Medicare shall have paid to their respective approved health insurance carriers, on their behalf, a subsidy as provided in Section (c) and in addition shall have paid to said insurance carriers, on behalf of their eligible dependents, a subsidy equal to the amount payable on behalf of the dependents of a retired member in the same plan with the same years of service who does not qualify for Parts A or B of Medicare or qualifies for Part B but not Part A and has their Medicare Part B and D benefits included in their Board-approved health plan, whichever subsidy amount is greater, providing such subsidy, both member and dependent portions combined, does not exceed the highest subsidy for a retired member of Tiers 1, 2, 3, 4, 5 and 6 with a like number of years of service and who does not qualify for federally funded Part A of Medicare; and RESOLVED, that subsidies paid on behalf of retired members, the dependents of retired members, and qualified surviving spouses/domestic partners who are eligible to enroll in
20 ATTACHMENT 3 Health Subsidies/Reimbursements for Pensioners, continued Page 2 Medicare Parts A and B or Medicare Part B but not Part A shall be subject to the limits described in Board Operating Policy 8.2, and RESOLVED, the health insurance premium subsidy provided herein shall be applied against the June 30, 2015 and subsequent monthly health insurance premiums or at the earliest month thereafter which is administratively feasible, and shall remain in effect until modified or cancelled by subsequent action of the Board; and RESOLVED, that the General Manager of the Department of Fire and Police Pensions be authorized to cause demands to be drawn upon the funds of the Fire and Police Tiers 1, 2, 3, 4, 5 and 6 General Pension Funds to be paid to the service organizations through which health insurance is provided for subsidy payments applying the health insurance premiums to said eligible members in advance of or after the effective date of enrollment or change in coverage, or directly to the member in the case of a reimbursement; providing such subsidy payments have been verified against records kept by the Department of Fire and Police Pensions and found to be correct and proper and that individual subsidy amounts are within the limits set forth in the Los Angeles City Administrative Code. I HEREBY CERTIFY that the foregoing Resolution was adopted by the Board of Fire and Police Pension Commissioners at its regular meeting held May 5, Raymond P. Ciranna General Manager
21 DEPARTMENT OF FIRE AND POLICE PENSIONS 701 E 3rd Street, Suite 200 Los Angeles, CA (213) REPORT TO THE BOARD OF FIRE AND POLICE PENSION COMMISSIONERS DATE: MAY 5, 2016 ITEM: B.2 FROM: RAYMOND P. CIRANNA, GENERAL MANAGER SUBJECT: MAXIMUM RETIRED SWORN NON-MEDICARE HEALTH SUBSIDY FOR FISCAL YEAR AND POSSIBLE BOARD ACTION RECOMMENDATION That the Board increase the maximum retired sworn non-medicare health subsidy by 6.75%, to $1, per month, effective July 1, BACKGROUND Los Angeles Administrative Code (LAAC) Section (e) states in part, The Board is authorized to make discretionary changes, on an annual basis beginning in 2006, to the maximum monthly subsidy, so long as no increase exceeds the lesser of a 7% increase or the actuarial assumed rate for medical inflation for pre-65 health benefits established by the Board for the applicable fiscal year. Any change made by the Board that exceeds this limitation must be submitted for Council review accompanied by an actuarial report. Any increase that is not acted upon by the Council within 45 days after receipt of the report to Council for consideration of the increase shall be deemed approved. Should the Council reject the subsidy set by the Board, the Council shall determine the amount, if any, by which the subsidy shall be increased and shall adopt this increase by resolution. In contrast, the subsidies for members in Medicare plans, qualified surviving spouse/domestic partner health subsidies, retiree dental subsidies, and Medicare Part B reimbursements are governed by other LAAC provisions and determined at the end of each calendar year for the following year. Following the first presentation of this item at the April 21, 2016 Board meeting, staff consulted with the Plan actuary, Segal, regarding various questions that were raised concerning the actuarial assumed rate for medical inflation ( medical trend rate ). During the process of reviewing staff s draft report for the FY subsidy increase, Segal noted that the medical trend rate referenced in the staff report was incorrect. They advised that the appropriate medical trend rate for determining the FY maximum subsidy increase is 6.75% rather than the 6.50% included in the original report. Segal explained this is due to the fact that the medical trend rates
22 shown in the Health Care Premium Cost Trend Rates valuation report table are applied to calculate the premiums for the following year. The actuarial assumed rate for medical inflation for pre-65 health benefits ( Medical Trend Rate ) approved by the Board for Fiscal Year , as clarified by the Plan actuary (Segal), is 6.75%. Therefore, the Board has the authority to raise the retiree subsidy by up to 6.75%, from the revised current maximum of $1, up to a maximum of $1, per month. Medical Trend Rate Trend is a forecast of per capita claims cost increases that takes into account various factors, including price inflation, utilization, government-mandated benefits, and new treatments, therapies and technology. Although there is usually a high correlation between a trend rate and the actual cost increase assessed by a health insurer, trend and the net annual change in plan costs are not the same. Changes in the costs to plan sponsors can be significantly different from projected claims cost trends, reflecting such diverse factors as group demographics, changes in plan design, administrative fees, reinsurance premiums and changes in participant contributions. The long term medical trend model is typically used to select medical trend assumptions for retiree medical valuations to present liabilities disclosed under the appropriate accounting standards, or to determine contributions under a funding policy. Beginning with the June 30, 2007 valuation, Segal, our current Plan actuary, has recommended that the health care trend assumptions used in the health valuation be reviewed annually due to the volatility and constant innovations present in the healthcare marketplace. These recommended assumptions are presented to the Board each year (usually in late September/early October) prior to the completion of the annual actuarial valuation. In developing its recommendations, each year Segal publishes a set of health care trend assumptions based on the latest research and information available (Attachment 1). This research is then utilized by Segal s health actuaries to develop the health care related assumptions that are adopted by the Board. The medical trend rate for FY of 6.75%, as adopted by the Board in September 2015, is on par with other major consulting firms as illustrated in the table below. The Board will again review the health care related assumptions, including the medical trend rate, in September FIRM / SYSTEM 2016 MEDICAL TREND RATE PwC Health Research Institute 6.5% Aon Hewitt 5.7% Los Angeles County Employees Retirement 6.4% Association (LACERA) Milliman as actuary Per the City Charter, retiree subsidy increases were previously tied to increases for active sworn employees or retired civilians. Because of delays in contract negotiations for active employees, the retiree subsidy increases were often years late, causing a hardship to many retirees. A Charter amendment was passed in March 2005 which gave authority to the City Council and Mayor, via ordinance, to determine a more efficient way to provide timely retiree subsidies. The ordinance ultimately adopted by the City Council provides the Board authority to increase the retiree subsidy by a maximum of 7%. Any subsidy increase made by the Board that exceeds this limitation (i.e., lesser of 7% or medical trend rate) must be submitted to the City Council for review accompanied by an actuarial report. Should the Council reject the subsidy increase set by the Board Report Page 2 May 5, 2016
23 Board, the Council shall determine the amount, if any, by which the subsidy shall be increased and shall adopt this increase by resolution. DISCUSSION Premium Changes Effective July 1, 2016, premium changes will take effect for plans offered by the Los Angeles Firemen s Relief Association (LAFRA) and Los Angeles Police Relief Association (LAPRA). Combined, these two organizations provide health insurance to 97.84% of all LAFPP retired members enrolled in a Board-approved health plan. Health plans offered by the United Firefighters of Los Angeles City (UFLAC) and by LAFPP (i.e., through our subgroup agreement with LACERS) operate on a calendar year basis with premiums changing every January 1 st. There are currently 142 retired members enrolled in UFLAC health plans and 44 retired members enrolled in LAFPP health plans, representing 1.64% and 0.51% of the enrolled retiree population respectively. The average 2016 premium change weighted by population for retired members in all LAFPPapproved plans was 4.91%. Plan Provider Medical Plan Avg Change Percentage of LAFPP Retirees Enrolled LAFRA Fire Medical PPO 1.89% 24.05% Kaiser 2.67% 3.35% Blue Cross PPO 8.57% 49.20% LAPRA CA Care HMO 19.31% 8.37% Kaiser* % 12.87% UFLAC Prudent Buyer PPO 4.47% 0.99% CA Care HMO 4.92% 0.65% Blue Cross PPO -5.66% 0.14% LAFPP (LACERS Subgroup) Blue Cross HMO 9.35% 0.02% Kaiser -3.49% 0.24% UnitedHealthcare 2.90% 0.10% * LAPRA s Kaiser premiums have been finalized and updated since the prior report on April 21, Total monthly premiums for all enrollees in Board-approved health plans on the March 31, 2016 pension roll were approximately $9,530,000, or $114,360,000 annually. Staff anticipates annual premiums will increase to approximately $119,975,000 with the premium increases effective July 1, Effect of Changes to the Maximum Retired Sworn Non-Medicare Health Subsidy The maximum non-medicare health subsidy affects two groups of LAFPP retirees: Board Report Page 3 May 5, 2016
24 1. Retirees who are not yet eligible for Medicare, or eligible for Medicare Part B only. 2. Retirees who are enrolled in both Medicare Parts A and B and who carry one or more dependents (e.g., a spouse/domestic partner or child) on their health plan. The non-medicare health subsidy is used in the formula that determines how much retirees enrolled in Medicare Parts A and B (group #2 above) receive toward subsidizing the cost of covering their dependents. Based on member health plan enrollment and subsidy eligibility as of the March 31, 2016 pension roll, staff has calculated the effect on member out-of-pocket costs, or premium deductions, should the Board increase the maximum non-medicare health subsidy by 6.75%. The tables below summarize the results of this analysis by grouping retired members into bands according to the dollar impact on their monthly premium deductions. Change in Retired Members Deductions Retired Members Affected Effect on Retired Members Deductions Retired Members Affected -$ $100 to -$ $50 to -$ Deduction Decrease 574 No Deduction Change 2,379 Deduction Increase 5,689 $0 2,379 $0.01 to $50 4,097 $50.01 to $ $ to $ $ LAPRA s Kaiser Medical Plan premiums are expected to decrease by an average of 11.88% for FY , and their copays for emergency room ($50/visit increasing to $150/visit) and office visits ($10/visit increasing to $15/visit) will increase. Prescription drug copays will also increase for FY with generic drug copays increasing by $5 and brand names doubling in cost from $15 to $30. It should be noted that LAPRA s Blue Cross PPO and HMO Medical Plans will also experience across-the-board cost sharing increases for annual deductibles, out-of-pocket maximums, emergency room and office visits, and prescription drug copays. These increases, however, are still generally lower than the copays for the LACERS Blue Cross PPO Medical Plan. LAFRA is in the middle of implementing a consistent structure to their premiums. As a result, some Fire Medical PPO premiums have greatly increased. Surviving spouses, for example, will Board Report Page 4 May 5, 2016
25 have their premiums increased to match their retired member counterparts. According to LAFRA s health consultant, Bradawn Inc., LAFRA has done outreach to the surviving spouses that are expected to have large increases. With the proposed subsidy increase of 6.75%, the 186 members in the LAFPP and UFLAC plans will experience either no deduction change or a slight reduction as their health plan premiums are revised on January 1 st rather than July 1 st. Staff has performed a more detailed analysis (Attachment 2) of the affected members with the following coverage levels in plans offered by LAFRA and LAPRA: Member only, non-medicare Two-Party, both non-medicare Family, all non-medicare Two-Party, Member with Medicare Parts A&B&D, Spouse non-medicare Two-Party, Member and Spouse, both with Medicare Parts A&B&D Together, these five coverage levels offered through LAFRA and LAPRA cover 76% of retired members affected by changes in the non-medicare health subsidy. Staff has analyzed the change in deductions for members who have 25+ years of service from 2005 to the present. The year 2005 was selected as a starting point as that was the year immediately prior to the Board being granted the discretion to set the maximum non-medicare health subsidy. Staff analyzed the percentage of the premium paid through payroll deduction on average by members who currently receive a subsidy and will be affected by an increase to the maximum non-medicare health subsidy. These members pay on average 9.47% of their plan premium through pension check deduction. Assuming a 6.75% increase to the maximum non-medicare health subsidy, the average payroll deduction for these members will increase to 10.21% of the plan premium. Included in these calculations are members enrolled under all scenarios shown in Attachment 2, affected members who have less than 25 years of service, and members enrolled in affected plans that are not listed in Attachment 2. BUDGET Staff used the March 31, 2016 pension roll as the basis to project the impact of a 6.75% increase to the maximum non-medicare health subsidy. The cost data has been annualized to make it more easily-related to the budget. The current annualized cost of all health subsidy payments from the March 31, 2016 pension roll is $104.9 million. With a 6.75% increase to the maximum non-medicare health subsidy, the annualized cost of health subsidy payments is expected to increase by approximately $3.5 million to $108.4 million. This represents an increase of 3.34% in actual health subsidy payments. The proposed health subsidy budget for Fiscal Year is $113 million. It should be noted that the above illustration does not factor in any potential changes to the retired member Medicare health subsidy or surviving spouse/domestic partner health subsidy that may occur effective January 1, Board Report Page 5 May 5, 2016
26 SUMMARY Staff recommends that the maximum non-medicare subsidy be increased by 6.75%, the maximum allowable under the Board s discretion (Attachment 3), for the following reasons: In 2016, 42.12% of retired members are enrolled in health plans that will have experienced an average increase greater than or roughly equal to the under-65 actuarial medical trend rate of 6.75% for fiscal year With an increase of 6.75% to the maximum non-medicare health subsidy, 66.18% of retired members will still experience increased out-of-pocket costs from July 1 to December 31, This figure may decrease if there is a Medicare subsidy increase effective January 1, 2017, as 68.9% of retired members belong to a Medicare plan. Retired members, on average, will be paying a slightly larger percentage of their plan premiums through payroll deduction, even with the recommended 6.75% increase. The proposed maximum non-medicare health subsidy of $1, is still below LACERS maximum health subsidy of $1, for the 2016 plan year. POLICY No policy changes as recommended. This report was prepared by: Kyle Susswain, Manager Medical & Dental Benefits Section RPC:JS:KS Attachments: Segal Health Plan Cost Trend Survey 2. Historical Deductions and Impact of Subsidy Increases in Selected Health Plan Options 3. Board Resolution for a 6.75% increase in the maximum retired non-medicare health subsidy Board Report Page 6 May 5, 2016


27


28


29


30


31


32


33


34


35

36
37 ATTACHMENT 2 HISTORICAL DEDUCTIONS AND IMPACT OF SUBSIDY INCREASES IN SELECTED HEALTH PLAN OPTIONS EFFECTIVE DATE 7/1/2005 7/1/2006 7/1/2007 7/1/2008 7/1/2009 7/1/2010 7/1/2011 7/1/2012 7/1/2013 7/1/ /01/15 07/01/16 MAXIMUM NON MEDICARE SUBSIDY $ $ $ $ $ $1, $1, $1, $1, $1, $1, $1, LAFRA Fire Medical PPO Retirees Enrolled 7/1/2005 7/1/2006 7/1/2007 7/1/2008 7/1/2009 7/1/2010 7/1/2011 7/1/2012 7/1/2013 7/1/ /01/15 07/01/16 As of 3/31/2016 Single Party Non Medicare Premium $ $ $ $ $ $ $ $ $1, $1, $1, $ Single Party Deduction $0.00 $0.00 $0.00 $0.00 $0.00 $0.00 $0.00 $0.00 $0.00 $0.00 $0.00 $0.00 Deduction as % of Premium 0.00% 0.00% 0.00% 0.00% 0.00% 0.00% 0.00% 0.00% 0.00% 0.00% 0.00% 0.00% 69 Two Party Non Medicare Premium $ $ $ $ $1, $1, $1, $1, $1, $1, $1, $1, Two Party Deduction $ $ $ $96.45 $ $ $72.72 $77.81 $58.21 $62.28 $79.68 $0.00 Deduction as % of Premium 16.64% 15.53% 12.25% 9.72% 9.72% 9.72% 6.21% 6.21% 4.43% 4.43% 5.25% 0.00% 303 Family Non Medicare Premium $1, $1, $1, $1, $1, $1, $1, $1, $1, $1, $1, $1, Family Deduction $ $ $ $ $ $ $ $ $ $ $ $ Deduction as % of Premium 30.58% 29.65% 26.92% 24.85% 24.85% 24.85% 21.93% 21.93% 20.44% 20.44% 21.12% 17.84% 165 Premium for Member Medicare A&B&D, Spouse Non Medicare $ $ $ $ $ $ $ $ $ $ $ $1, Deduction $17.41 $36.13 $2.60 $0.00 $0.00 $0.00 $0.00 $57.90 $52.49 $47.06 $90.94 $ Deduction as % of Premium 2.79% 5.84% 0.41% 0.00% 0.00% 0.00% 0.00% 7.18% 6.32% 5.30% 9.57% 10.37% 143 Premium for Member and Spouse, Both Medicare A&B&D $ $ $ $ $ $ $ $ $ $ $ $ Deduction $17.41 $36.13 $2.60 $0.00 $0.00 $0.00 $0.00 $57.90 $52.49 $47.06 $90.94 $ Deduction as % of Premium 2.79% 6.21% 0.43% 0.00% 0.00% 0.00% 0.00% 7.64% 6.73% 5.64% 10.18% 13.80% 884 LAFRA Kaiser Retirees Enrolled 7/1/2005 7/1/2006 7/1/2007 7/1/2008 7/1/2009 7/1/2010 7/1/2011 7/1/2012 7/1/2013 7/1/ /01/15 07/01/16 As of 3/31/2016 Single Party Non Medicare Premium $ $ $ $ $ $ $ $ $ $ $ $ Single Party Deduction $0.00 $0.00 $0.00 $0.00 $0.00 $0.00 $0.00 $0.00 $0.00 $0.00 $0.00 $0.00 Deduction as % of Premium 0.00% 0.00% 0.00% 0.00% 0.00% 0.00% 0.00% 0.00% 0.00% 0.00% 0.00% 0.00% 10 Two Party Non Medicare Premium $ $ $ $ $ $1, $1, $1, $1, $1, $1, $1, Two Party Deduction $6.56 $15.96 $0.00 $0.00 $0.00 $0.00 $0.00 $0.00 $0.00 $0.00 $0.00 $0.00 Deduction as % of Premium 0.88% 2.00% 0.00% 0.00% 0.00% 0.00% 0.00% 0.00% 0.00% 0.00% 0.00% 0.00% 46 Family Non Medicare Premium $ $1, $1, $1, $1, $1, $1, $1, $1, $1, $1, $1, Family Deduction $ $ $ $ $ $ $ $ $ $ $ $ Deduction as % of Premium 21.43% 22.33% 18.04% 16.50% 19.08% 20.18% 16.58% 17.57% 12.28% 8.25% 11.47% 10.66% 24 Premium for Member Medicare A&B&D, Spouse Non Medicare $ $ $ $ $ $ $ $ $ $ $1, $1, Deduction $6.56 $37.17 $0.00 $0.00 $0.00 $0.00 $0.00 $0.00 $0.00 $0.00 $0.00 $0.00 Deduction as % of Premium 0.93% 5.05% 0.00% 0.00% 0.00% 0.00% 0.00% 0.00% 0.00% 0.00% 0.00% 0.00% 24 Premium for Member and Spouse, Both Medicare A&B&D $ $ $ $ $ $ $ $ $ $ $ $ Deduction $0.00 $21.21 $0.00 $0.00 $0.00 $0.00 $0.00 $0.00 $0.00 $0.00 $0.00 $0.00 Deduction as % of Premium 0.00% 3.15% 0.00% 0.00% 0.00% 0.00% 0.00% 0.00% 0.00% 0.00% 0.00% 0.00% 110
38 ATTACHMENT 2 HISTORICAL DEDUCTIONS AND IMPACT OF SUBSIDY INCREASES IN SELECTED HEALTH PLAN OPTIONS EFFECTIVE DATE 7/1/2005 7/1/2006 7/1/2007 7/1/2008 7/1/2009 7/1/2010 7/1/2011 7/1/2012 7/1/2013 7/1/ /01/15 07/01/16 MAXIMUM NON MEDICARE SUBSIDY $ $ $ $ $ $1, $1, $1, $1, $1, $1, $1, LAPRA BC PPO Retirees Enrolled 7/1/2005 7/1/2006 7/1/2007 7/1/2008 7/1/2009 7/1/2010 7/1/2011 7/1/2012 7/1/2013 7/1/ /01/15 07/01/16 As of 3/31/2016 Single Party Non Medicare Premium $ $ $ $ $ $ $ $ $ $ $ $ Single Party Deduction $0.00 $0.00 $0.00 $0.00 $0.00 $0.00 $0.00 $0.00 $0.00 $0.00 $0.00 $0.00 Deduction as % of Premium 0.00% 0.00% 0.00% 0.00% 0.00% 0.00% 0.00% 0.00% 0.00% 0.00% 0.00% 0.00% 435 Two Party Non Medicare Premium $1, $1, $1, $1, $1, $1, $1, $1, $1, $1, $1, $1, Two Party Deduction $ $ $ $ $ $ $ $ $ $ $ $ Deduction as % of Premium 32.97% 31.62% 31.15% 30.54% 30.01% 29.59% 29.14% 27.67% 24.14% 16.53% 17.22% 18.53% 276 Family Non Medicare Premium $1, $1, $1, $1, $1, $1, $1, $1, $1, $1, $2, $2, Family Deduction $ $ $ $ $ $ $ $ $ $ $ $ Deduction as % of Premium 38.10% 36.65% 36.06% 35.46% 34.99% 34.52% 34.21% 32.84% 29.57% 26.82% 28.45% 30.48% 186 Premium for Member Medicare A&B&D, Spouse Non Medicare $ $ $ $ $1, $1, $1, $1, $1, $1, $1, $1, Deduction $ $ $ $ $ $ $ $ $ $ $ $ Deduction as % of Premium 27.16% 24.43% 24.41% 24.04% 24.04% 25.60% 26.13% 24.45% 20.55% 9.55% 12.28% 16.41% 402 Premium for Member and Spouse, Both Medicare A&B&D $ $ $ $ $ $ $ $ $1, $ $1, $1, Deduction $0.00 $4.50 $0.00 $0.00 $0.00 $63.86 $98.36 $ $92.77 $39.97 $56.36 $86.71 Deduction as % of Premium 0.00% 0.76% 0.00% 0.00% 0.00% 7.32% 10.13% 10.43% 9.18% 4.31% 5.59% 7.73% 1494 LAPRA CA Care HMO Retirees Enrolled 7/1/2005 7/1/2006 7/1/2007 7/1/2008 7/1/2009 7/1/2010 7/1/2011 7/1/2012 7/1/2013 7/1/ /01/15 07/01/16 As of 3/31/2016 Single Party Non Medicare Premium $ $ $ $ $ $ $ $ $ $ $ $ Single Party Deduction $0.00 $0.00 $0.00 $0.00 $0.00 $0.00 $0.00 $0.00 $0.00 $0.00 $0.00 $0.00 Deduction as % of Premium 0.00% 0.00% 0.00% 0.00% 0.00% 0.00% 0.00% 0.00% 0.00% 0.00% 0.00% 0.00% 61 Two Party Non Medicare Premium $ $ $ $ $ $ $ $1, $1, $1, $1, $1, Two Party Deduction $0.00 $0.00 $0.00 $0.00 $0.00 $0.00 $0.00 $0.00 $0.00 $0.00 $0.00 $18.63 Deduction as % of Premium 0.00% 0.00% 0.00% 0.00% 0.00% 0.00% 0.00% 0.00% 0.00% 0.00% 0.00% 1.20% 133 Family Non Medicare Premium $ $ $ $ $ $1, $1, $1, $1, $1, $1, $1, Family Deduction $0.00 $0.00 $0.00 $0.00 $0.12 $73.65 $75.57 $61.94 $95.91 $ $ $ Deduction as % of Premium 0.00% 0.00% 0.00% 0.00% 0.01% 6.70% 6.44% 5.01% 7.09% 7.00% 9.06% 15.39% 79 Premium for Member Medicare A&B&D, Spouse Non Medicare $ $ $ $ $ $ $ $ $ $1, $1, $1, Deduction $0.00 $0.00 $0.00 $0.00 $0.00 $0.00 $0.00 $0.00 $3.27 $0.00 $0.00 $ Deduction as % of Premium 0.00% 0.00% 0.00% 0.00% 0.00% 0.00% 0.00% 0.00% 0.33% 0.00% 0.00% 9.01% 106 Premium for Member and Spouse, Both Medicare A&B&D $ $ $ $ $ $ $ $ $ $ $ $1, Deduction $0.00 $0.00 $0.00 $0.00 $0.00 $0.00 $0.00 $0.00 $3.27 $0.00 $0.00 $ Deduction as % of Premium 0.00% 0.00% 0.00% 0.00% 0.00% 0.00% 0.00% 0.00% 0.35% 0.00% 0.00% 9.93% 182
39 ATTACHMENT 2 HISTORICAL DEDUCTIONS AND IMPACT OF SUBSIDY INCREASES IN SELECTED HEALTH PLAN OPTIONS EFFECTIVE DATE 7/1/2005 7/1/2006 7/1/2007 7/1/2008 7/1/2009 7/1/2010 7/1/2011 7/1/2012 7/1/2013 7/1/ /01/15 07/01/16 MAXIMUM NON MEDICARE SUBSIDY $ $ $ $ $ $1, $1, $1, $1, $1, $1, $1, LAPRA Kaiser Retirees Enrolled 7/1/2005 7/1/2006 7/1/2007 7/1/2008 7/1/2009 7/1/2010 7/1/2011 7/1/2012 7/1/2013 7/1/ /01/15 07/01/16 As of 3/31/2016 Single Party Non Medicare Premium $ $ $ $ $ $ $ $ $ $ $ $ Single Party Deduction $0.00 $0.00 $0.00 $0.00 $0.00 $0.00 $0.00 $0.00 $0.00 $0.00 $0.00 $0.00 Deduction as % of Premium 0.00% 0.00% 0.00% 0.00% 0.00% 0.00% 0.00% 0.00% 0.00% 0.00% 0.00% 0.00% 92 Two Party Non Medicare Premium $ $ $ $ $ $ $ $1, $1, $1, $1, $1, Two Party Deduction $0.00 $0.00 $0.00 $0.00 $0.00 $0.00 $0.00 $0.00 $0.00 $0.00 $0.00 $0.00 Deduction as % of Premium 0.00% 0.00% 0.00% 0.00% 0.00% 0.00% 0.00% 0.00% 0.00% 0.00% 0.00% 0.00% 145 Family Non Medicare Premium $ $ $ $ $ $1, $1, $1, $1, $1, $1, $1, Family Deduction $0.00 $0.00 $0.00 $0.00 $0.00 $0.00 $0.00 $28.41 $0.00 $6.96 $0.00 $0.00 Deduction as % of Premium 0.00% 0.00% 0.00% 0.00% 0.00% 0.00% 0.00% 2.36% 0.00% 0.52% 0.00% 0.00% 92 Premium for Member Medicare A&B&D, Spouse Non Medicare $ $ $ $ $ $ $ $ $ $ $ $ Deduction $0.00 $0.00 $0.00 $0.00 $0.00 $0.00 $0.00 $0.00 $0.00 $0.00 $0.00 $0.00 Deduction as % of Premium 0.00% 0.00% 0.00% 0.00% 0.00% 0.00% 0.00% 0.00% 0.00% 0.00% 0.00% 0.00% 107 Premium for Member and Spouse, Both Medicare A&B&D $ $ $ $ $ $ $ $ $ $ $ $ Deduction $0.00 $0.00 $0.00 $0.00 $0.00 $0.00 $0.00 $0.00 $0.00 $0.00 $0.00 $0.00 Deduction as % of Premium 0.00% 0.00% 0.00% 0.00% 0.00% 0.00% 0.00% 0.00% 0.00% 0.00% 0.00% 0.00% 382
40 ATTACHMENT 3 HEALTH SUBSIDIES/REIMBURSEMENTS FOR PENSIONERS RESOLUTION NO. WHEREAS, retired members of the Fire and Police Pension Plan, Tiers 1, 2, 3, 4, 5 and 6, have had paid, on their behalf, a health insurance premium subsidy, or have received a reimbursement, in accordance with the provisions of Article 10, Division 4, Chapters 11.5 and 20 of the Administrative Code; and WHEREAS, the Board of Fire and Police Pension Commissioners has been granted the authority under Section (e) of the Administrative Code to increase or decrease the maximum monthly amount of the health insurance subsidy in accordance with the authority conferred in subsections (e) of Sections 1330, 1428, 1518, 1618 and 1718 of the Charter and subsection (e) of of the Administrative Code; and WHEREAS, the pre-65 actuarial assumed medical trend rate for the fiscal year as adopted by the Board in the plan s most recent actuarial valuation is 6.75%; and WHEREAS, the pre-65 actuarial assumed medical trend rate for the fiscal year as adopted by the Board in the plan s most recent actuarial valuation is less than 7%; RESOLVED, that the maximum monthly health insurance premium subsidy as described in Section (e) of the Administrative Code shall be $1,535.59, payable on behalf of the members and their eligible dependents (as such term is defined in the Board approved health insurance plans) or received as a reimbursement; and RESOLVED, that retired members of age 60 and above with 10 or more years of service who retired with an effective date prior to July 1, 1998, and retired members of age 55 and above with 10 or more years of service who retired with an effective date of July 1, 1998 or after, who do not qualify for Part A of Medicare, shall have paid to their respective approved health insurance carriers a monthly health insurance subsidy, or paid directly to the member as a reimbursement, an amount not to exceed $ for each whole year of service; said subsidy to apply first to that portion of the premium applicable to the retired member with any remainder to be applied to the dependent(s) of said member; and RESOLVED, that retired members who do qualify for federally funded Part A of Medicare shall have paid to their respective approved health insurance carriers, on their behalf, a subsidy as provided in Section (c) and in addition shall have paid to said insurance carriers, on behalf of their eligible dependents, a subsidy equal to the amount payable on behalf of the dependents of a retired member in the same plan with the same years of service who does not qualify for Parts A or B of Medicare or qualifies for Part B but not Part A and has their Medicare Part B and D benefits included in their Board-approved health plan, whichever subsidy amount is greater, providing such subsidy, both member and dependent portions combined, does not exceed the highest subsidy for a retired member of Tiers 1, 2, 3, 4, 5 and 6 with a like number of years of service and who does not qualify for federally funded Part A of Medicare; and RESOLVED, that subsidies paid on behalf of retired members, the dependents of retired members, and qualified surviving spouses/domestic partners who are eligible to enroll in
41 ATTACHMENT 3 Health Subsidies/Reimbursements for Pensioners, continued Page 2 Medicare Parts A and B or Medicare Part B but not Part A shall be subject to the limits described in Board Operating Policy 8.2, and RESOLVED, the health insurance premium subsidy provided herein shall be applied against the June 30, 2016 and subsequent monthly health insurance premiums or at the earliest month thereafter which is administratively feasible, and shall remain in effect until modified or cancelled by subsequent action of the Board; and RESOLVED, that the General Manager of the Department of Fire and Police Pensions be authorized to cause demands to be drawn upon the funds of the Fire and Police Tiers 1, 2, 3, 4, 5 and 6 General Pension Funds to be paid to the service organizations through which health insurance is provided for subsidy payments applying the health insurance premiums to said eligible members in advance of or after the effective date of enrollment or change in coverage, or directly to the member in the case of a reimbursement; providing such subsidy payments have been verified against records kept by the Department of Fire and Police Pensions and found to be correct and proper and that individual subsidy amounts are within the limits set forth in the Los Angeles City Administrative Code. I HEREBY CERTIFY that the foregoing Resolution was adopted by the Board of Fire and Police Pension Commissioners at its regular meeting held May 5, Raymond P. Ciranna General Manager
42 DEPARTMENT OF FIRE AND POLICE PENSIONS 701 E. 3rd Street, Suite 200 Los Angeles, CA (213) REPORT TO THE BOARD OF FIRE AND POLICE PENSION COMMISSIONERS DATE: MAY 5, 2016 ITEM: B.3 FROM: SUBJECT: RAYMOND P. CIRANNA, GENERAL MANAGER PROPOSED LEGISLATION FOR FIREFIGHTER CANCER REGISTRY ACT OF 2016 AND POSSIBLE BOARD ACTION RECOMMENDATION That the Board: 1) Endorse the legislation, H.R. 4625: Firefighter Cancer Registry Act of 2016; and 2) Direct the General Manager to communicate the Board s endorsement to the Office of the Chief Legislative Analyst (CLA). DISCUSSION On February 25, 2016, U.S. Representatives Bill Pascrell (D-NJ) and Richard Hanna (R-NY) introduced a bill in Congress, H.R known as the Firefighter Cancer Registry Act of The bill would require the Secretary of Health and Human Services to develop a voluntary patient registry to collect data on cancer incidences among firefighters. Since the 1990s, studies have indicated a strong link between firefighting and an increased risk of developing several major cancers. These studies identified the most common cancers among firefighters, such as testicular cancer, stomach cancer, multiple myeloma, and brain cancer, among others. In 2014, the National Institute of Occupational Safety and Health (NIOSH) conducted a study over several years which included approximately 30,000 firefighters. The results revealed that firefighters were at risk of being diagnosed with cancer, and potential links between exposure to fire incidents and increased risk for lung cancer and leukemia, among others. Past studies on cancer incidences among firefighters have been limited by the availability and the standardization of important epidemiological data. Presently, many states nationwide maintain registries that collect information regarding cancer diagnoses. These registries help further research related to assessing cancer incidence among firefighters. The Firefighter Cancer Registry Act of 2016 would create a special purpose national cancer registry to provide researchers and public health agencies with more direct and comprehensive access to the specific set of information they need to conduct more robust, focused, and epidemiologically rigorous research on cancer incidence among firefighters. Additionally, a national cancer registry would better inform firefighters of future precautions to take and develop more sophisticated safety protocols to lower cancer risks.
43 H.R is a bi-partisan legislation supported by the International Association of Fire Fighters (IAFF) and the International Association of Fire Chiefs, among other state associations in support of firefighters. Additionally, Mayor Garcetti recently spoke at the IAFF 2016 Legislative Conference in Washington, DC in support of H.R As of February 26, 2016, H.R was referred to the Subcommittee on Health. The CLA is responsible for monitoring pending Federal and State legislation through the Bill Track system, and oversees City sponsorship or opposition to such legislation. If this recommendation is approved, Staff will submit a Bill Response Report and will communicate the Board s endorsement of this legislation to the CLA. Staff will continue to monitor this item and will update the Board as needed. BUDGET No impact at this time. POLICY No policy changes recommended at this time. This report was prepared by: Barbara Nobregas Management Analyst II Communications & Education Section RPC:JS:GM:CT:BHN Board Report Page 2 May 5, 2016

44 DEPARTMENT OF FIRE AND POLICE PENSIONS 701 E. 3 rd Street, Suite 200 Los Angeles, CA (213) REPORT TO THE BOARD OF FIRE AND POLICE PENSION COMMISSIONERS DATE: MAY 5, 2016 ITEM: B.4 FROM: RAYMOND P. CIRANNA, GENERAL MANAGER SUBJECT: DISCUSSION ON THE ANNUAL BOARD EDUCATIONAL OFF-SITE MEETING AND POSSIBLE BOARD ACTION RECOMMENDATION That the Board approve Wednesday, February 22, 2017 as the date for the 2017 Board Educational Off-Site Meeting and confirm The California Endowment as the venue. DISCUSSION The 2016 Board Educational Off-Site Meeting was held as a full-day session on March 3, 2016 at The California Endowment. A total of 90 people attended the event, including Board members, staff, representatives from the Los Angeles City Employees Retirement System (LACERS), Water and Power Employees Retirement Plan (WPERP) and other City Departments, professional speakers/presenters, representatives of active and retired associations, and interested members of the public. The educational topics included information, updates, and overviews of National Pension issues, Asset Allocation, Healthcare Trends, Retirement Trends, and Real Estate Strategies. Staff solicited feedback from Board members and other attendees to gauge the quality of the presentations and to provide feedback necessary to make this event more valuable in the future. Respondents were asked to rate their satisfaction from 1 to 5 for each topic and the overall program, and to provide comments. Overall, the respondents scores were high with the Board members rating the highest score to Asset Allocation Education with a rating of 4.58 out of Offsite Meeting - Evaluation by Topic Board Members Staff Guests 0.00 Legislative Update Asset Allocation Healthcare Trends Retirement Revolution Overview of Real Estate Strategies Overall Program Overall
45 Suggestions from Board members for future Offsite Meeting topics included additional Actuary information, an overview of the Disability process and information regarding how cases are managed, and a request for case studies on three Private Equity partnerships we have invested in. Positive comments were given to Townsend for the way they delivered their segment and a suggestion was made for the next meeting to have an Investment Portfolio overview be delivered in a similar format to Townsend. Staff believes there is value to continuing the off-site education meetings. As such, staff has reserved February 22, 2017 with The California Endowment for the 2017 Board Educational Offsite Meeting. It should be noted that February 22, 2017 is a Wednesday, and was the only available date close to the end of February or beginning of March, which has been the preferred time frame for the past several years. Based on feedback through the evaluations, it is expected that the 2017 Offsite Meeting duration will be similar to this year whereby the meeting convenes at 8:00 a.m. and adjourns at approximately 2:00 p.m. However, the topics and exact duration will be determined later this calendar year between the Board President and General Manager, taking into account feedback from the evaluation forms, the need to educate the Board on upcoming issues, and through the results of the annual Board Member Self-Assessment Survey. Staff will also continue refining internal processes to reduce the amount of administrative work necessary to facilitate the meeting. For example, this year staff utilized Eventbrite.com, an online system that automates the logistics of the meeting registration and electronic distribution of materials. BUDGET The California Endowment does not charge for the use of the facility. However, we do pay for refreshments and food during the event, which totaled $2, We also paid $3,250 for speakers for the Healthcare Trends and Retirement Revolution presentations. As such, the total cost for the 2016 Off-Site Meeting was $6, Sufficient funds were included in the Budget and are also included in the Budget for this event. POLICY There is no policy change associated with this request. This report was prepared by: Jennifer Shimatsu, Management Assistant Administrative Operations Division RPC:WSR:JMS Board Report Page 2 May 5, 2016


46 May 5, 2016 Asset Allocation Analysis Los Angeles Fire and Police Pension System
47 Introduction April 26,
48 Asset Allocation Introduction We are here today to formally start the asset allocation discussion This will be a multi-step process that includes Broad Asset Allocation Target (Today) Active/Passive Discussion (Next Meeting) Equity Structure Discussion (early June) Fixed Income Structure Discussion (mid-to-late June) Today we will first discuss the asset classes being used and follow with looking at alternate target allocations for the portfolio Today s objective: work toward selecting a new Target Allocation (or confirming the existing one) Based on today s discussion this may require us coming back with additional model output before final selection 3
49 Asset Allocation Introduction The single most important investment decision made by a Board is selecting an asset allocation The selected asset allocation is the key driver of long-term total fund 1) return, 2) volatility/downside risk, 3) liquidity, and 4) fees Establishing, and periodically reviewing, an asset allocation policy is essential to setting a framework for achieving short- and longterm investment goals 4
50 Investment Decision Process US Equity (X%) Structure Study Large Cap (X%) Manager X ($) Manager Decisions Small Cap (X%) Manager Y ($) 100% Total Plan Assets vs. Plan Liabilities A/L Study Total Plan Assets (100%) AA Study International Equity (X%) Structure Study Developed (X%) Manager X ($) Manager Decisions Emerging (X%) Manager Y ($) 100% Fixed Income (X%) Structure Study Investment Grade (X%) Manager X ($) Manager Decisions High Yield (X%) Manager Y ($) Funding Ratio 100% 100% 100% Today Following Meetings 5
51 Structure Analysis Looking Forward Some of the items that we will review in the structure analysis include: Active vs. passive structure Passive implementation market weighted vs. enhanced indexing, vs. smart beta Active implementation Manager weights, manager guidelines Style structure value/core/growth Size structure micro/small/mid/large/mega Region structure US/developed/emerging Sector structure Treasury/Corporate/MBS/High Yield/Bank Loans Benchmark selection Fees 6


52 Sample Structure Analysis Output Market Capitalization Analysis Fee Analysis Style Analysis Active/Passive Analysis Excess Returns are performed relative to the Russell 2000 Index Assumed Annual Management Fee: 75.0(bp) Peak Population: % 25 th Percentile Median 75 th Percentile US Small Cap Value Equity 3.61% 1.21% -1.22% 6.0% 4.0% 2.0% 0.0% -2.0% -4.0% -6.0% Jan-04 Jul-04 Jan-05 Jul-05 Jan-06 Jul-06 Jan-07 Jul-07 Jan-08 Jul-08 Jan-09 Jul-09 Jan-10 Jul-10 Jan-11 Jul-11 Jan-12 Jul-12 Jan-13 Jul-13 Jan-14 Jul-14 25th Percentile Median 75th Percentile 7
53 Asset/Liability Study Review April 26,
54 Asset/Liability Study Review Introduction Asset/Liability Studies are the only standard analysis that fully link all three aspects of a Plan s key financial drivers Investment Policy, Contribution Policy, and Benefit Policy Fully strategic in nature Define strategic backdrop of the investment policy Gold standard for assessing the health of a pension plan (or prefunded long-term financial commitment) Investment Policy Asset Liability Analysis Contribution Policy Benefit Policy 9
55 Asset/Liability Study Review Portfolios Asset Class Conservative Portfolio Portfolio 1 Current LAFPP Target Portfolio 2 Aggressive Portfolio Broad US Equity 0% 21% 29% 29% 40% Broad International Equity 0% 14% 21% 20% 40% Fixed Income 100% 25% 14% 6% 0% High Yield Fixed Income 0% 5% 3% 5% 0% TIPS 0% 5% 5% 5% 0% Unconstrained Fixed Income 0% 4% 2% 2% 0% Real Estate 0% 10% 10% 15% 0% Private Equity 0% 10% 10% 12% 20% Commodities 0% 5% 5% 5% 0% Cash Equivalents 0% 1% 1% 1% 0% Total Equity 0% 45% 60% 61% 100% Expected Return 3.50% 6.46% 6.98% 7.34% 8.10% Expected Risk 6.00% 11.38% 13.42% 14.47% 18.36% RVK Liquidity Metric Optimal Risk/Return Range
56 Asset/Liability Study Review Summary As of June 30, 2014 (the date of the most recent actuarial valuation) the System was 88% funded (on a market value basis) The present funding level is unquestionably a strong financial position relative to most other public pension plans Projected Market Funded Ratio 100% 90% 80% 70% 60% 50% 40% 30% 20% 10% 0% 88% 88% 89% 90% 91% 92% 93% 93% 94% 95% 96% 96% 96% 97% 97% 97% 98% 98% 99% 99% 99% For the Plan Year Ending 11
57 Asset/Liability Study Review Summary The study suggests that continued diversification in the investment of System assets is desirable The Current Target maintains funding levels while managing maximum drawdowns and expected contributions Targeting a higher expected return and risk leads to higher expected funded ratios but more asset volatility Targeting a lower expected return and risk increases contributions and likely leads to a material deterioration of funding levels 20 Years Probability of Full Probability of < 88% Probability of < 50% Maximum 1 Year Funding in 2034 (Current) Funding in 2034 Funding in 2034 Investment Loss Conservative Portfolio 0% 99% 17% -18% Portfolio 1 29% 59% 9% -33% Current LAFPP Target 36% 54% 11% -38% Portfolio 2 40% 50% 10% -41% Aggressive Portfolio 45% 46% 14% -50% Market Funded Ratio in Year 20 Cumulative Employer Payout Ratios 20 Years Contributions in Year 20 (Billions) Year 20 Years 1 to 20 50th 5th 95th 50th 5th 95th Median Peak Trough Conservative Portfolio 58% 45% 77% $24.3 $31.6 $ % 13% 5% Portfolio 1 80% 47% 168% $17.0 $29.6 $6.0 7% 13% 4% Current LAFPP Target 85% 45% 206% $16.1 $30.8 $5.2 7% 13% 3% Portfolio 2 88% 44% 233% $15.5 $30.8 $4.9 7% 14% 3% Aggressive Portfolio 93% 39% 328% $15.0 $33.3 $4.1 6% 16% 2% 12
58 Asset/Liability Study Review Summary Payout ratios (benefit payments / market value of assets) are projected to remain muted, even at peak levels Implies the liquidity demands of the benefit policy will not restrict investment opportunities 20% Projected Payout Ratio Current LAFPP Target 5th Percentile 15% 10% 25th Percentile Median 5% 75th Percentile 95th Percentile 0% For the Plan Year Ending 13
59 Asset Class Review April 26,

60 Diversification Matters Higher Risk S&P 500 Index Barclays US Agg Index 15
61 US Equity Includes large/mid-cap, small-cap, and micro-cap stocks/equities listed on US exchanges Role of Equity is to provide capital appreciation (asset growth) Stocks have traditionally outperformed bonds over long periods although with much higher levels of volatility Longer-term horizon of Plan favors equities Market Cap Size Representative Index % of Market #of Companies Capitalization Range Active Fees (25 th 75 th percentile)* LAFPP Active Fee** Large/Mid Russell 1000/S&P 500 ~90% ~1,000 $3.4B bps 18 bps Small Russell 2000 ~9% ~2,000 $177M - $3.4B bps 48 bps Micro Russell Micro-Cap <2% ~2,000 $30M - $177M bps 110 bps Index Max Drawdown Worst Calendar Year Best Calendar Year S&P % (Sep 29 Jun 32) -43% (1931) 54% (1933) Russell % (Jun 07 Feb 09) -34% (2008) 47% (2003) Russell Micro-Cap -59% (Jun 07 Feb 09) -40% (2008) 66% (2003) *Based on evestment for average LAFPP active mandate size for separate account. **Weighted average LAFPP active management fee for asset class, excludes passive mandates. 16
62 Non-US Equity Includes investments in Developed, Emerging, and Frontier Markets Non-U.S. Equity investments increase the opportunity set for capital appreciation as well provide diversification to U.S. investments Market Cap Style Representative Index % of Market #of Constituents Median Market Cap Active Fees (25 th 75 th percentile)* LAFPP Active Fee** Developed MSCI ACW Ex US ~80% 6,140 $597M bps 41 bps Emerging MSCI Emerging Markets ~20% 2,714 $324M bps 63 bps Frontier MSCI Frontier <1% 333 $142M - - Index Max Drawdown Worst Calendar Year Best Calendar Year MSCI ACW Ex Us -56% (Nov 07 Feb 09) -43% ( 2008) 69% (1986) MSCI Emerging Markets -61% (Nov 07 Feb 09) -53% (2008) 79% (2009) MSCI Frontier Markets -66% (Mar 08 Feb 09) -54% (2008) 72% (2005) MSCI ACWI ex US Regional Weights Middle East 1% United Kingdom 14% Europe ex UK Japan 17% pacific ex Japan 8% EM Middle East and Africa 2% North America 6% EM Latin America 2% EM Europe 1% EM Asia 15% 33% 0% 5% 10% 15% 20% 25% 30% 35% *Based on evestment for average LAFPP active mandate size for separate account. **Weighted average LAFPP active management fee for asset class, excludes passive mandates. 17
63 Fixed Income Fixed Income can play various roles in an asset allocation: Capital Preservation: lower volatility compared to other assets classes Yield: traditionally larger income component relative to capital appreciation supports cash flow needs Diversification: low correlation to other asset classes Liquidity to meet cash flow needs Style Representative Index Active Fees (25 th 75 th percentile)* LAFPP Active Fee** Core/Core + Barclays US Aggregate bps 10 bps Barclays US Aggregate Bond Index Weights US Treasurys Gov't Related 8% Agency MBS 29% 36% Index Max Drawdown Worst Calendar Year Best Calendar Year ABS CMBS 1% 2% Barclays US Aggregate -13% (Aug 79 Feb 80) -3% (1994) 32% (1982) Investment Grade Corporate 24% 0% 5% 10% 15% 20% 25% 30% 35% 40% *Based on evestment for average LAFPP active mandate size for separate account. **Weighted average LAFPP active management fee for asset class, excludes passive mandates. 18
64 TIPS TIPS are inflation-adjusting fixed income securities issued by the US Treasury that are linked to CPI Provide inflation protection and real yield to portfolio as well as diversification given tie to inflation Approximately $1.2 trillion of U.S. TIPS are outstanding Style Index Active Fees (25 th 75 th percentile)* LAFPP Active Fee** TIPS Barclays US Treasury: US TIPS bps 39 bps*** Index Max Drawdown Worst Calendar Year Best Calendar Year Barclays US Treasury: US TIPS -12% (Mar 08 Oct 08) -9% (2013) 17% (2002) *Based on evestment for average LAFPP active mandate size for separate account. **Weighted average LAFPP active management fee for asset class, excludes passive mandates. ***LAFPP s manager for the TIPS mandate is Bridgewater Portable Alpha US TIPS. 19
65 High Yield Fixed Income Non-investment grade fixed income primarily within US Corporates (Credit) Ratings Ba/BB and below Speculative, highly speculative, in default Emerging market debt, bank loans, and ABS also potential options within strategies Increased yields over core fixed income Increased volatility with higher risk of default rates Style Index Active Fees (25 th 75 th percentile)* LAFPP Active Fee** High Yield Barclays US Corporate HY bps 39 bps Index Max Drawdown Worst Calendar Year Best Calendar Year Barclays US Corporate HY -33% (Jun 07 Nov 08) -26% (2008) 58% (2009) *Based on evestment for average LAFPP active mandate size for separate account. **Weighted average LAFPP active management fee for asset class, excludes passive mandates. 20
66 Unconstrained Fixed Income Fixed income funds that invest in fixed income securities but that are not subject to (or have a wider range of) benchmark constraints ( benchmark agnostic ) Sector limits, duration limits, quality limits Allows the manager the ability to tactically adjust its exposures Objective is to obtain attractive risk-adjusted returns with lower correlations with traditional fixed income funds and benchmarks Additionally, protection against interest rate increases Style Index Active Fees (25 th 75 th percentile)* LAFPP Active Fee** Unconstrained 3 Mo LIBOR + 3% bps 26 bps *Based on evestment for average LAFPP active mandate size for separate account. **Weighted average LAFPP active management fee for asset class, excludes passive mandates. 21
67 Real Estate Multiple ways to invest in real estate with multiple focuses: REITs, private funds, direct, debt Core, value add, opportunistic, etc. Real estate provides many benefits including: Inflation hedge Growth in value and rents tied to inflation Diversification Low correlation to other asset classes Income Returns Liquidity can be an issue in severe market downturns Private real estate closed end vehicle performance is judged on an IRR basis Style Index Max Drawdown Worst Calendar Year Best Calendar Year Core NCREIF Fund ODCE -38% (Sep 07 Dec 09) -30% ( 2009) 21% (2005) REITs MSCI World Real Estate -67% (Jun 07 Feb 09) -46% (2008) 41% (2006) Townsend, the plan s Real Estate Consultant, can provide information on real estate investment fees. 22
68 Private Equity Investments made up of privately held businesses that do not trade on an exchange, are illiquid, and have a long investment horizon Examples include Buyout, Venture Capital, Distressed, Special Situations, etc.. Investments are long-term, typically 10 years or more, with limited ability to liquidate before the termination of a partnership Private Equity investments can generate significant value by enhancing returns and improving diversification RVK currently estimates that the private equity asset class will return a premium of nearly 300 basis points over public market returns in the longer-term Observed volatility (quarterly market value fluctuations) of the asset class has been lower than large cap equity markets The potential for higher returns is accompanied by tradeoffs including: Lower liquidity and transparency Increased portfolio complexity Cash flow uncertainty Higher fees Private equity lacks a traditional benchmark, hence the absence of an index listed Private equity fund performance is judged on an IRR basis Portfolio Advisors, the plan s Private Equity Consultant, can provide information on private equity fees. 23
69 Commodities A basic good used in commerce as an input in the production of other goods and services Includes basic goods such as energy, livestock, grains, and metals, and more Correlated historically with inflation and uncorrelated with equities and fixed income Often accessed through derivatives/futures, can also be invested in through equity if commodity related companies Investment Type Representative Index LAFPP Structure LAFPP Managers Active Fees (25 th 75 th percentile)* LAFPP Active Fee** Public Securities S&P Global Natural Resources Index 60% Derivative Based Bloomberg Commodity Index 20% Private Equity S&P Global Natural Resources Index (IRR Basis) Kleinwort Benson Mellon Gresham Goldman Sachs bps 40 bps bps 38 bps 20% Portfolio Advisors*** - - Index S&P Global Natural Resources Index Bloomberg Commodity Index Max Drawdown Worst Calendar Year Best Calendar Year -49% (Jun 08 Feb 09) -38% (2008) 42% (2007) -66% (Jul 08 Present) -36% (2008) 32% (2000) *Based on evestment for average LAFPP active mandate size for separate account. **Weighted average LAFPP active management fee for asset class, excludes passive mandates. 24 ***Portfolio Advisors, the plan s Private Equity Consultant, can provide information on the private commodities investment fees.
70 Asset Allocation Inputs (Capital Markets Assumptions) April 26,
71 Capital Markets Assumptions CM Assumptions The Drivers of Asset Allocation Capital Market (CM) Assumptions are forward-looking estimates of the behavior of asset classes (i.e., groups of closely related investment opportunities) CM Assumptions are long-term (greater than 10 years) Examples of CM Assumptions include U.S. stocks, Emerging Market stocks, Real Estate, U.S. bonds, etc. CM Assumptions sets include: Expected Return Expected Standard Deviation (Risk) Expected Correlations 26
72 2016 Capital Market Assumptions Return & Risk Asset Class Return (Arithmetic) 2016 Standard Deviation Return (Compound) Broad US Equity 7.05% 17.80% 5.60% Broad International Equity 8.85% 20.60% 6.95% Fixed Income 3.50% 6.00% 3.33% TIPS 4.00% 6.25% 3.81% High Yield 6.50% 15.00% 5.46% Unconstrained 5.00% 12.00% 4.32% Real Estate 7.34% 13.15% 6.54% Private Equity 10.25% 25.50% 7.41% Commodities 6.00% 19.75% 4.21% Cash Equivalents 2.25% 3.00% 2.21% Correlation Cash Equivalents Fixed Income TIPS High Yield Fixed Income Unconstrained Fixed Income Broad US Equity Broad International Equity Cash Equivalents Fixed Income TIPS High Yield Fixed Income Unconstrained Fixed Income Broad US Equity Broad International Equity Core Real Estate Private Equity Commodities Core Real Estate Private Equity Commodities Correlation greater than 0.50 Correlation between 0.00 and 0.50 Correlation less than
73 Asset Allocation Study Results April 26,
74 Asset Allocation Output Efficient Allocations We constrain the model to take into account reasonable minimum or maximum allocations to each asset class or groups of asset classes. Mix Current LAFPP Mix Min Max A Target B Broad US Equity Broad International Equity Fixed Income TIPS High Yield Fixed Income Unconstrained Fixed Income Real Estate Private Equity Commodities Cash Equivalents Total Capital Appreciation Capital Preservation Alpha Inflation Expected Return Risk (Standard Deviation) Return (Compound) Return/Risk Ratio RVK Exp Eq Beta (LCUS Eq = 1) RVK Liquidity Metric (T-Bills = 100) This illustrates the tradeoff between return and risk; additional return can only be achieved by undertaking additional risk. 29 Range of possible optimal allocations given the selected asset classes and constraints.
75 Asset Allocation Output Efficient Allocations Mix Current LAFPP Mix Min Max A Target B Broad US Equity Broad International Equity Fixed Income TIPS High Yield Fixed Income Unconstrained Fixed Income Real Estate Private Equity Commodities Cash Equivalents Total Capital Appreciation Capital Preservation Alpha Inflation Expected Return Risk (Standard Deviation) Return (Compound) Return/Risk Ratio RVK Exp Eq Beta (LCUS Eq = 1) RVK Liquidity Metric (T-Bills = 100)
76 Asset Allocation Output Efficient Frontier Return (Annualized, %) Mix A 7 Mix B Current LAFPP Target Risk (Annualized Standard Deviation, %) 31
77 Asset Allocation Output Monte Carlo A 1 st percentile event, something similar to that of the Financial Crisis in 2008, could produce a return of negative ~25-30% with the given portfolio mixes over the 1-year period. 1 Year Mix A Current LAFPP Target 1st Percentile th Percentile th Percentile th Percentile th Percentile th Percentile th Percentile Mix B Probability that the given allocation achieves a 7.5% return over 10 years, which is the Assumed Actuarial Rate of Return. 10 Years Mix A Current LAFPP Target Target 0% Target 7% Target 7.25% Target 7.5% Target 7.75% Target 8% Mix B 32
78 Asset Allocation Next Steps Follow this discussion with additional information based on comments and feedback from today to make decisions (if any) on a new Target Allocation Conduct Active/Passive education and discussion once Target Allocation is agreed upon Analyze asset class structures This will include factors such as active/passive splits, capitalization splits (for example, large vs. small vs. micro), developed vs. emerging splits Update Investment Policies (if necessary) Fill any new mandates (if necessary) 33


79 Appendix 34
80 Real Estate Strategies Differences in Risk Tolerance and Investment Options Typical Fund Structure Debt Limitations Fees Charged Expected Returns Return Volatility Core Real Estate Core-Plus Real Estate Value-Added Opportunistic Open-End, Perpetual Life Closed-End, 7-10 Year Fund Life Open-Ended, Perpetual Life Closed-End, 7-10 Year Fund Life Closed-End, 7-10 Year Fund Life Typically < 40% Typically 50-60% Up to 65% Often Greater than 65% Asset Management Fees (Few Charge Incentive Fees) Gross: 7%-9% Net: 6%-8% Asset Management + Incentive Fees Gross: 10%-12% Net: 8%-10% Asset Management + Incentive Fees Gross: 13%-15% Net: 11-13% Asset Management + Incentive Fees Gross 18%-20% Net: 14-16% Low Low-Moderate Moderate High Liquidity Moderate Low (Closed-Ended) Moderate (Open-Ended) Typical Strategy Buy and Hold; Maximize Operating Income + Minimal Value-Add Components Core Strategy + Buy at Discount + Convert to Core Through Moderate Value-Added Activities Low Buy at Discount + Convert to Core Through Moderate Value-Added Components + Minimal Development Low Buy at Discount + Substantial Value-Added Components + Development 35
81 Private Equity Strategies Differences in Risk Tolerance and Investment Options Venture Capital Buyouts Growth Equity Mezzanine Distressed Debt Turnarounds / Special Situations Security Owned Equity Equity Equity Debt notes with equity warrants Debt, often converting to equity Debt or Equity Typical Hold Period 5-7+ years 4-6 years 3-7 years 1-3 years 0-7 years 3-6 years Exit Method IPO or M&A M&A IPO or M&A Repayment Open market sales, M&A, Recapitalization M&A, Recapitalization Return Potential High Moderate Moderate to High Low Low to Moderate Moderate Use of Leverage No Yes No No No Yes Current Income Potential None Limited Limited Good Good Limited 36
82 2016 Capital Market Assumptions Asset Class Return (Arithmetic) Change (2016 vs. 2015) Standard Deviation Return (Compound) Return (Arithmetic) Standard Deviation Return (Compound) Return (Arithmetic) Standard Deviation Return (Compound) Global Equity 7.80% 18.35% 6.27% 7.90% 18.35% 6.37% 0.10% 0.00% 0.10% Large/Mid Cap US Equity 7.00% 17.75% 5.56% 7.00% 17.75% 5.56% 0.00% 0.00% 0.00% Small Cap US Equity 7.50% 21.25% 5.46% 7.75% 21.25% 5.71% 0.25% 0.00% 0.25% Broad US Equity 7.05% 17.80% 5.60% 7.05% 17.80% 5.60% 0.00% 0.00% 0.00% Dev'd Large/Mid Cap Int'l Equity 8.00% 19.00% 6.37% 8.25% 19.00% 6.62% 0.25% 0.00% 0.25% Dev'd Small Cap Int'l Equity 8.50% 23.00% 6.14% 8.50% 23.00% 6.14% 0.00% 0.00% 0.00% Emerging Markets Equity 10.50% 29.00% 6.88% 11.00% 29.00% 7.40% 0.50% 0.00% 0.51% Broad International Equity 8.60% 20.60% 6.70% 8.85% 20.60% 6.95% 0.25% 0.00% 0.25% Intermediate Duration Fixed Income 3.50% 6.00% 3.33% 3.50% 6.00% 3.33% 0.00% 0.00% 0.00% Non-US Dev'd Sovereign Fixed Income UH 2.50% 10.50% 1.97% 2.25% 10.50% 1.72% -0.25% 0.00% -0.25% Emerging Markets Debt Local Currency 6.25% 12.50% 5.52% 6.75% 12.50% 6.03% 0.50% 0.00% 0.50% Emerging Markets Debt Hard Currency 5.25% 12.50% 4.52% 5.75% 12.50% 5.02% 0.50% 0.00% 0.50% TIPS 4.00% 6.25% 3.81% 4.00% 6.25% 3.81% 0.00% 0.00% 0.00% Low Duration Fixed Income 2.50% 3.50% 2.44% 2.50% 3.50% 2.44% 0.00% 0.00% 0.00% Long Duration Fixed Income 4.00% 11.50% 3.37% 4.25% 11.50% 3.62% 0.25% 0.00% 0.25% High Yield 6.00% 15.00% 4.95% 6.50% 15.00% 5.46% 0.50% 0.00% 0.50% Core Real Estate 6.75% 12.50% 6.03% 6.50% 12.50% 5.77% -0.25% 0.00% -0.25% Global REITs 6.50% 18.50% 4.93% 6.50% 19.00% 4.84% 0.00% 0.50% -0.08% Diversified Hedge Funds 6.50% 9.50% 6.08% 6.50% 9.50% 6.08% 0.00% 0.00% 0.00% GTAA 6.50% 10.00% 6.03% 6.50% 10.00% 6.03% 0.00% 0.00% 0.00% Private Equity 10.50% 26.00% 7.56% 10.25% 25.50% 7.41% -0.25% -0.50% -0.15% Commodities 6.50% 19.75% 4.71% 6.00% 19.75% 4.21% -0.50% 0.00% -0.51% Diversified Inflation Strategies 5.65% 11.45% 5.03% 5.50% 11.60% 4.87% -0.15% 0.15% -0.17% Cash Equivalents 2.25% 3.00% 2.21% 2.25% 3.00% 2.21% 0.00% 0.00% 0.00% US Inflation 2.50% 3.00% 2.46% 2.50% 3.00% 2.46% 0.00% 0.00% 0.00% 37


83 2016 Capital Market Assumptions Correlations US Inflation Cash Equivalents Int. Duration Fixed Income Non-US Dev'd Fixed Income UH TIPS Low Duration Fixed Income Long Duration Fixed Income High Yield Fixed Income Emerging Markets Debt Hard Emerging Markets Debt Local Large/Mid Cap US Equity Small Cap US Equity Broad US Equity Dev'd Large/Mid Int'l Equity Dev'd Small Int'l Equity Emerging Markets Equity Broad International Equity Global Equity Core Real Estate Global REITs MLPs Diversified Hedge Funds GTAA Private Equity Commodities Diversified Inflation Strategies US Inflation Cash Equivalents Int. Duration Fixed Income Non-US Dev'd Fixed Income UH TIPS Low Duration Fixed Income Long Duration Fixed Income High Yield Fixed Income Emerging Markets Debt Hard Emerging Markets Debt Local Large/Mid Cap US Equity Small Cap US Equity Broad US Equity Dev'd Large/Mid Int'l Equity Dev'd Small Int'l Equity Emerging Markets Equity Broad International Equity Global Equity Core Real Estate Global REITs MLPs Diversified Hedge Funds GTAA Private Equity Commodities Diversified Inflation Strategies Correlation greater than 0.50 Correlation between 0.00 and 0.50 Correlation less than
84 Asset Allocation Output Monte Carlo Percentile Returns 1 Year Mix A Current LAFPP Target 1st Percentile th Percentile th Percentile th Percentile th Percentile th Percentile th Percentile Years st Percentile th Percentile th Percentile th Percentile th Percentile th Percentile th Percentile Years st Percentile th Percentile th Percentile th Percentile th Percentile th Percentile th Percentile Years st Percentile th Percentile th Percentile th Percentile th Percentile th Percentile th Percentile Mix B 39
85 Asset Allocation Output Monte Carlo Return Target Probability 1 Year Mix A Current LAFPP Target Target 0% Target 7% Target 7.25% Target 7.5% Target 7.75% Target 8% Years Target 0% Target 7% Target 7.25% Target 7.5% Target 7.75% Target 8% Years Target 0% Target 7% Target 7.25% Target 7.5% Target 7.75% Target 8% Years Target 0% Target 7% Target 7.25% Target 7.5% Target 7.75% Target 8% Mix B 40


86

87 INTERNATIONAL EQUITY Los Angeles Fire and Police Pension Trust Brent V. Woods, CFA Chief Executive Officer Lawrence Taylor Institutional Portfolio Manager FOR INSTITUTIONAL ONE-ON-ONE USE ONLY May 5, 2016
88 Los Angeles Fire and Police Pensions and Brandes Investment Partners Graham & Dodd value firm founded in 1974 Served LAFPP as manager of International Equity since 1998 Annualized performance since inception net of fees 7.56% vs 4.46% for MS All Countries World ex US Index. 3 years: 5.45% vs 0.76* Portfolio Market Value: $890.4 million; net capital contributed: -$146.9 million* Brandes is purpose-built to ensure consistent application of our proven process Team-based investment decision-making 100% employee owned Sole focus is value investing *As of March 31, 2016 FOR INSTITUTIONAL ONE-ON-ONE USE ONLY 2

89 The Brandes DNA 100-YEAR VISION $27.0 billion total AUM* Total Inst./Private Client Assets $21.7B Total SMA Division Assets $5.3B ŸHeadquarters: San Diego, CA Ÿ317 employees Ÿ100% employee owned Origin Graham-and-Dodd value investing Active, fundamental analysis Purpose Help clients build wealth and pursue investment goals Independence enables us to be client-centric and strong fiduciaries Pursue alpha for competitive results over the long term Endurance Value approach has an evidence-based track record Potentially undervalued securities require time to pursue alpha Must avoid fads and be different than benchmark to beat it Philosophy Market is not efficient: human behavior distorts security prices Fundamental analysis can help identify undervalued securities Margin of safety: key to pursuing alpha and managing risk Process Style purity and repeatable process for equity and fixed income 3-part global process: analysis, valuation and construction Team work: separating analysis from decision-making *AS OF MARCH 31, 2016 Separately Managed Accounts (SMA) are offered through the firm s SMA Division. The SMA Division encompasses the firm s Separately Managed Account business (subadvisory wrap-fee business with brokerage firms). Non-SMA assets include institutional accounts, pooled investment vehicles, and high net worth accounts outside of SMA ( wrap-fee ) programs. Margin of safety: The margin of safety for any security is defined as the discount of its current market price to what we believe is the intrinsic value of that security. Alpha: A measure of performance on a risk-adjusted basis. It takes the volatility (price risk) of a mutual fund and compares its risk-adjusted performance to a benchmark index. The excess return of the fund relative to the return of the benchmark index is a fund's alpha. Source: Investopedia.com FOR INSTITUTIONAL ONE-ON-ONE USE ONLY FOUNDED
90 International Large-Cap Investment Committee International Large-Cap Investment Committee Committee Member Title Years with Firm Years Industry Experience Jeffrey Germain, CFA Director - Investments Group Amelia Maccoun Morris, CFA Director - Investments Group Shingo Omura, CFA Director - Investments Group Luiz Sauerbronn Director - Investments Group Brent V. Woods, CFA Chief Executive Officer As of March 31, 2016 AS OF APRIL 2016 FOR INSTITUTIONAL ONE-ON-ONE USE ONLY 4


91 How Brandes Works PORTFOLIO Analysis 25 analysts 8 global sector teams Search for value Produce a research report that recommends a company valuation Valuation 7 investment committees Seasoned professionals Value each business in conjunction with the analyst Construction Committees make investment decisions for an entire strategy Aim to build portfolios with high margin of safety Client portfolio management and trading implement portfolio decisions at the client level AS OF MARCH 31, 2016 Margin of safety: The margin of safety for any security is defined as the discount of its market price to what the firm believes is the intrinsic value of that security. FOR INSTITUTIONAL ONE-ON-ONE USE ONLY 5
92 Analysis & Valuation Objective: Estimate a Company s Value Typical Targets Attractive valuation characteristics Sufficient financial history Identifying Undervalued Companies Proven ability to generate free cash flow Adequate liquidity Record of growing shareholder wealth Bias for conservative capitalization structures Focus on Underlying Business Value Sustainable profits Brand strength Downside risks Determining Value of the Business Competitive advantage Market position Barriers to entry Differentiated product or service Governance issues Regulatory/policy environment Intrinsic Values Assessed/Updated by Analysts *Intrinsic Value: The actual value of a company or an asset based on an underlying perception of its true value. FOR INSTITUTIONAL ONE-ON-ONE USE ONLY 6


93 Margin of Safety BUY BUY This is a hypothetical illustration of value investing concepts. It does not represent the performance of any specific security. It assumes intrinsic value changes over time. Actual results will vary. No investment strategy can assure a profit or protect against loss.*intrinsic value: In general terms it is understood to be that value which is justified by the facts, e.g., the assets, earnings, dividends, definite prospects, as distinct, let us say, from market quotations established by artificial manipulation or distorted by psychological excess Security Analysis, 1934, page 17. **The margin of safety for any security is defined as the discount of its market price to what the firm believes is the intrinsic value of that security. FOR INSTITUTIONAL ONE-ON-ONE USE ONLY 7
94 Allocation Factors MODERATE ALLOCATION HIGH ALLOCATION AGGRESSIVE ALLOCATION Margin of Safety/Potential Return* LOW / NO ALLOCATION PASS / SELL MODERATE ALLOCATION LOW / NO ALLOCATION HIGH ALLOCATION MODERATE ALLOCATION Correlated risks Liquidity Other Factors Diversification guidelines Unfavorable Other Factors Favorable Range of intrinsic value estimates** *The margin of safety for any security is defined as the discount of its market price to what the firm believes is the intrinsic value of that security. **Intrinsic value estimates can change over time. FOR INSTITUTIONAL ONE-ON-ONE USE ONLY 8
95 Equity Sell Discipline Investment Committee Decision Full sale when a security s price reaches estimate of intrinsic value Full or partial sale may occur if our estimated intrinsic value declines, making the margin of safety unattractive Partial or full sale may occur to free up cash for other securities with estimated higher margin of safety Average Annual Portfolio Turnover Typically = 20-40% Margin of safety: The margin of safety for any security is defined as the discount of its current market price to what we believe is the intrinsic value of that security. FOR INSTITUTIONAL ONE-ON-ONE USE ONLY 9
96 Portfolio Performance* vs. Index 400% 350% 300% 250% 200% 150% 100% 50% 0% -50% L.A. Fire and Police Pension Trust MSCI All Country World ex US Index Results * Account % MSCI ACWXUS % MSCI EAFE % Trailing 3 Months: Year: Years: Years: Account Value: $890,378,957 Net Capital: ($146,902,971) 7 Years: Years: Years: From Inception: Inception Date: 8/3/98 As of March 31, 2016 *Cumulative total return since inception - net of management fees. All figures one year and above are annualized. All performance is historical and is not a guarantee of future results. Indices are unmanaged and are not available for direct investment. International and emerging markets investing is subject to certain risks such as currency fluctuation and social and political changes; such risks may result in greater share price volatility. FOR INSTITUTIONAL ONE-ON-ONE USE ONLY 10
97 Portfolio Performance Yearly Returns* By Calendar Year L.A. Fire and Police MSCI All Country World ex US Index MSCI EAFE Index (partial year) *Net of management fees. All performance is historical and is not a guarantee of future results. Indices are unmanaged and are not available for direct investment. International and emerging markets investing is subject to certain risks such as currency fluctuation and social and political changes; such risks may result in greater share price volatility. FOR INSTITUTIONAL ONE-ON-ONE USE ONLY 11
98 Value Has Been Out of Favor Recently Rolling 3-Year Annualized Relative Returns 15% Above Zero: Value Outperformed 10% 5% -321bps at 3/31/2016 0% -5% -10% Mar-77 Mar-78 Mar-79 Mar-80 Mar-81 Mar months Below Zero: Value Underperformed Mar-83 Mar-84 Mar-85 Mar-86 Mar-87 Mar months Mar-89 Mar-90 Mar-91 Mar-92 Mar-93 Mar-94 Mar-95 Mar-96 Mar-97 Mar-98 8 months Mar-99 Mar-00 3-Year Period Ending Mar-01 Mar-02 Mar-03 Mar-04 Mar-05 Mar-06 Mar-07 Mar months Mar-09 Mar-10 Mar-11 Mar-12 Mar-13 Mar months Mar-15 Mar-16 MSCI EAFE VALUE INDEX LESS MSCI EAFE GROWTH INDEX; AS OF MARCH 31, 2016 Source: MSCI via FactSet. Past performance is not a guarantee of future results. Rolling periods represent a series of overlapping, smaller time periods within a single, longer-time period. For example, over a 20-year period, there is one 20-year period, eleven 10-year rolling periods, sixteen 5-year rolling periods, and so forth. The inception date for the MSCI EAFE Growth and Value Indexes is December 8, Data prior to this date is the result of back-testing performed by MSCI. There are frequently material differences between back-tested performance and actual results. Please see supplemental performance information in disclosure slide at end of this presentation. FOR INSTITUTIONAL ONE-ON-ONE USE ONLY 12
99 Equity Markets Annual Performance for 2015 M SCI World M SCI EAFE M SCI EM M SCI ACWI M SCI ACWIxUS Russell 1000 Russell 2000 Russell 2500 M SCI ACWIxUS small M SCI ACWIxUS Smid M SCI J a p a n M SCI Europe 11.1% 3.1% 4.1% 5.7% 6.5% 4.2% 8.1% 4.0% 1.6% -1.3% -1.4% -0.2% -1.3% -4.8% -5.7% -11.3% -6.3% -10.1% -3.8% -7.5% -5.5% -4.1% Value Index Growth Index -9.6% -18.6% Value Relative to Growth MSCI World MSCI EAFE MSCI EM MSCI ACWI MSCI ACWIxUS Russell 1000 Russell 2000 Russell 2500 MSCI ACWIxUS small MSCI ACWIxUS Smid* MSCI Japan MSCI Europe -7.9% -9.8% -7.2% -7.8% -8.8% -9.5% -6.1% -5.3% -7.8% -8.3% 3.0% -13.6% AS OF DECEMBER 31, 2015 Source: Factset, MSCI. *Smid Small-Mid Index. International and emerging markets investing is subject to certain risks such as currency fluctuation and social and political changes; such risks may result in greater share price volatility. Past performance is not a guarantee of future results. Please note that all indices are unmanaged and are not available for direct investment. See full index definitions located at the end of the presentation. FOR INSTITUTIONAL ONE-ON-ONE USE ONLY 13
100 Country Exposure Top 3 MSCI AC World Ex-US (gross) Countries not in Portfolio Canada 6.6% Germany 6.6% Australia 5.1% Regional Weightings 3/31/2016 3/31/2015 Change Europe 57.0% 54.7% +2.3% Latin America 9.7% 8.5% +1.2% Asia 27.6% 30.3% -2.7% Market Weightings 3/31/2016 3/31/2015 Change Developed Markets 73.5% 75.8% -2.3% Emerging Markets 20.8% 17.7% +3.1% Cash 5.7% 6.5% -0.8% Total number of countries in Portfolio: 15 No exposure to countries that represent 35.8% of benchmark As of March 31, 2016 Portfolio allocations are subject to change at any time. FOR INSTITUTIONAL ONE-ON-ONE USE ONLY 14
101 Europe Among its Least Expensive Ever vs. U.S. MSCI Europe Index CAPE Divided by S&P 500 Index CAPE WHY INTERNATIONAL EQUITIES? Mar-79 Mar-82 Mar-85 Mar-88 Mar-91 Mar-94 Mar-97 Mar-00 Mar-03 Mar-06 Mar-09 Mar-12 Mar-15 MARCH 31, 1979 MARCH 31, 2016 Source: Morgan Stanley, MSCI, S&P, various national sources; Shiller P/E defined as inflation adjusted price to 10Y average EPS from continuing operations. CAPE (cyclically-adjusted P/E) attempts to show the relationship between price and multi-year average company earnings in order to better estimate long-term earnings power. This valuation measure seeks to smooth out earnings fluctuations caused by business cycles while also reflecting the long-term effects of inflation. In this chart, a reading above 1.0 indicates that prices for Europe stocks are more expensive than U.S. stocks in relation to their underlying long-term company earnings. A reading below 1.0 indicates U.S. stocks are more expensive on a long-term price/earnings basis. Past performance is not a guarantee of future results. FOR INSTITUTIONAL ONE-ON-ONE USE ONLY 15
102 Profits Revert to Mean? U.S. and Europe Corporate Profits vs. 10-Year Moving Average 80% 60% U.S. Europe Profits vs. 10-Year Average 40% 20% 0% -20% -40% -60% Dec-79 Dec-80 Dec-81 Dec-82 Dec-83 Dec-84 Dec-85 Dec-86 Dec-87 Dec-88 Dec-89 Dec-90 Dec-91 Dec-92 Dec-93 Dec-94 Dec-95 Dec-96 Dec-97 Dec-98 Dec-99 Dec-00 Dec-01 Dec-02 Dec-03 Dec-04 Dec-05 Dec-06 Dec-07 Dec-08 Dec-09 Dec-10 Dec-11 Dec-12 Dec-13 Dec-14 Dec-15 MARCH 31, 1980 DECEMBER 31, 2015 Source: SG Cross Asset Research/Equity Quant, MSCI; Start date is the earliest data is available. U.S. and Europe companies represented by those in S&P500 Index and MSCI Europe Index, respectively. A value at the 0% line would indicate that the profits were at the 10 yr. moving average. FOR INSTITUTIONAL ONE-ON-ONE USE ONLY 16
103 Emerging Markets Valuations Near Prior Crisis Levels Price-to-Book Time Series of MSCI Emerging Markets Index 4.0x 3.5x MSCI Emerging Markets Index P/B 3.0x 2.5x 2.0x 1.5x 1.0x 0.5x Mar-96 Mar-97 Asian Crisis Mar-98 Mar-99 Mar-00 Latin America Crisis Mar-01 Mar-02 Mar-03 Gulf War Mar-04 Mar-05 Mar-06 Mar-07 Global Financial Crisis Mar-08 Mar-09 Mar-10 Mar-11 Mar-12 Mar-13 Mar-14 Current (3/31/2016) Mar-15 Mar-16 MSCI EM INDEX P/B: DECEMBER 31, 1995 TO MARCH 31, 2016 Source: MSCI. Past performance is not a guarantee of future results. Please note that all indices are unmanaged and are not available for direct investment. FOR INSTITUTIONAL ONE-ON-ONE USE ONLY 17
104 Sector Exposure Largest Sector Weighting Increases 3/31/2016 3/31/2015 Change Consumer Discretionary 13.9% 12.2% +1.7% Industrials 7.3% 5.7% +1.6% Health Care 13.8% 12.7% +1.1% Largest Sector Weighting Decreases 3/31/2016 3/31/2015 Change Financials 18.8% 24.4% -5.6% Utilities 4.3% 4.5% -0.2% Consumer Staples 9.4% 9.5% -0.1% As of March 31, 2016 Portfolio allocations are subject to change at any time. FOR INSTITUTIONAL ONE-ON-ONE USE ONLY 18
105 Attractive Valuations in European Oil Mean Industry Valuations Relative to Market 1.5x 1.4x 1.3x 1.2x 1.1x 1.0x 0.9x 0.8x 0.7x 0.6x >1.0 = premium <1.0 = discount Industry Valuation Relative to Market* 0.5x Dec-89 Dec-90 Dec-91 Dec-92 Dec-93 Dec-94 Dec-95 Dec-96 Dec-97 Dec-98 Dec-99 Dec-00 Dec-01 Dec-02 Dec-03 Dec-04 Dec-05 Dec-06 Dec-07 Dec-08 Dec-09 Dec-10 Dec-11 Dec-12 Dec-13 Dec-14 Dec-15 JANUARY 31, 1990 TO DECEMBER 31, 2015 Source: Worldscope via FactSet. Market defined as the top 25% of companies in developed Europe based on market cap, after exclusion of securities with free float market cap <US$100 million. As of 31 December 2015, this generally included all companies with market caps in excess of US$500 million. Past performance is not a guarantee of future results. *Valuations measure based on earnings yield, average earnings over trailing four years divided by price. FOR INSTITUTIONAL ONE-ON-ONE USE ONLY 19
106 Best Value Potential: Integrated Oils Least Leverage, Strong Returns on Capital, Discounted Valuation OIL & GAS Interest Coverage (EBITDA/Interest Expense) 25x 20x 15x 10x 5x 0x Integrated Oils Refiners Services Exploration & Production TTM Interest Coverage 2016E Interest Coverage Return on Capital Historical Median Price-to-Book vs. Historical Average Drillers Storage & Transport 14% 12% 10% 8% 6% 4% 2% 0% Return on Capital (%) Least Levered Most Levered -62% -19% -52% -34% -66% -15% DECEMBER 31, 2015 Source: CapitalIQ. Median of 10 largest companies within each industry by Enterprise Value (Market Cap + Net Debt) as of 12/31/2015. Interest Coverage: EBITDA/Interest Expense. There is no assurance that a forecast will be accurate. Because of the many variables involved, an investor should not rely on forecasts without realizing their limitations. FOR INSTITUTIONAL ONE-ON-ONE USE ONLY 20
107 Top Ten Holdings. Company % Country Industry GlaxoSmithKline Plc 3.86% United Kingdom Pharmaceuticals Wm. Morrison Supermkts Plc 3.30% United Kingdom Food & Staples Retailing Engie SA 3.02% France Multi-Utilities Sanofi SA 2.77% France Pharmaceuticals Hyundai Mobis Co Ltd 2.70% South Korea Auto Components ENI S.p.A. 2.55% Italy Oil, Gas & Consum. Fuel Nissan Motor Co., Ltd. 2.55% Japan Automobiles Lukoil 2.53% Russia Oil, Gas & Consum. Fuel Tesco Plc 2.50% United Kingdom Food & Staples Retailing BP Plc 2.50% United Kingdom Oil, Gas & Consum. Fuel Top 10 as % of Portfolio 28.28% Total Number of Companies: 55 As of March 31, 2016 Portfolio allocations are subject to change at any time. FOR INSTITUTIONAL ONE-ON-ONE USE ONLY 21
108 Fundamentals Fundamental Information as of March 31, 2016 Portfolio allocations are subject to change at any time. Price/Book, Price/Earnings, Price/Cash Flow and Dividend Yield for each security provided by Bloomberg, L.P. Please note that Bloomberg does not provide negative numbers in the data feed. Index fundamentals are calculated from holdings data as provided by the relevant index or by Thomson Reuters Worldscope, excluding negative numbers for consistency. Thus, index fundamentals calculated by Brandes may differ from those computed and published by index providers. FOR INSTITUTIONAL ONE-ON-ONE USE ONLY 22
109 Brandes Believes Price matters to long-term returns Share prices frequently do not reflect the long-term value of businesses Comfortable with a contrarian view The ability to be different from the benchmark provides opportunities for outperformance The value of independence As a 100% employee-owned firm, Brandes is able to think long-term in our investment decisions, our business and our client relationships Teamwork Our investment committee structure allows for diverse perspectives and inputs Patience is critical A long-term perspective may help investors look beyond short-term market fluctuations, giving their portfolios the potential to grow over time. FOR INSTITUTIONAL ONE-ON-ONE USE ONLY 23
110 APPENDIX FOR INSTITUTIONAL ONE-ON-ONE USE ONLY

 United States Fixed Income Global Balanced Asia Pacific (ex-japan) Equity U.S. Small-Mid Cap Value Equity Core Plus Fixed Income Global Equity Canadian Equity U.")
111 Brandes at-a-glance Year Firm Founded: 1974 Total Assets Under Management: Total Institutional/Private Client Assets * : Total SMA Division Assets ** : Investment Style: Headquarters Located: Other Offices: Total Employees Worldwide: 317 Investment Professionals: Ownership: $27.0 billion $21.7 billion $5.3 billion Graham & Dodd, bottom-up value San Diego, California Dublin, Ireland Milwaukee, Wisconsin Singapore Toronto, Canada 52, including 25 security analysts 100% employee owned, 26 limited partners Global International (Non-U.S.) United States Fixed Income Global Balanced Asia Pacific (ex-japan) Equity U.S. Small-Mid Cap Value Equity Core Plus Fixed Income Global Equity Canadian Equity U.S. Small Cap Value Equity Corporate Focus Fixed Income Global Equity Income Emerging Markets Equity U.S. Value Equity Enhanced Income Global Small-Mid Cap Equity Global Opportunities Value Global Small Cap Equity Emerging Markets Opportunities Emerging Markets Value Equity European Equity International Equity International Small-Mid Cap Equity International Small Cap Equity Japan Equity AS OF MARCH 31, 2016 *Assets include institutional accounts, pooled investment vehicles, and high net worth accounts outside of SMA ( wrap-fee ) programs. **The SMA Division encompasses the firm s Separately Managed Account business (subadvisory wrap-fee business with brokerage firms). Also includes UMA ( unified managed account ) assets. FOR INSTITUTIONAL ONE-ON-ONE USE ONLY 25
112 Assets by Strategy Global Equity Global Balanced AS OF MARCH 31, 2016 *Assets include institutional accounts, pooled investment vehicles, and high net worth accounts outside of SMA ( wrap-fee ) programs. **The SMA Division encompasses the firm s Separately Managed Account business (subadvisory wrap-fee business with brokerage firms). Also includes UMA ( unified managed account ) assets. FOR INSTITUTIONAL ONE-ON-ONE USE ONLY Inst./PC * SMA ** Inst./PC * SMA ** United States ($ Mill) ($ Mill) ($ Mill) ($ Mill) U.S. Small-Mid Cap Value Equity Global Equity 4,716 1,974 U.S. Small Cap Value Equity Global Equity Income 2 0 U.S. Value Equity Global Opportunities Value Global Small Cap Equity Global Small-Mid Cap Equity International Equity (Non-U.S.) Inst./PC * SMA ** Inst./PC * SMA ** Fixed Income ($ Mill) ($ Mill) ($ Mill) ($ Mill) Asia Pacific (ex-japan) Equity 20 0 Core Plus Fixed Income Canadian Equity 21 0 Corporate Focus Fixed Income Emerging Markets Equity 2,283 0 Enhanced Income 2 90 Emerging Markets Opportunities Equity 4 32 Emerging Markets Value Equity 2,355 0 European Equity International Equity 7,312 2,251 International Small Cap Equity 1,720 0 International Small-Mid Cap Equity 89 0 Japan Equity 720 0


113 International Large-Cap Investment Committee Jeffrey Germain, CFA Experience Current Responsibilities: Senior Analyst on the Basic Materials Research Team; member of the International Large-Cap Investment Committee. Relevant experience began in 2001 Joined Brandes Investment Partners in 2001 Prior Career Highlights Financial Analyst with Harcourt CFO of Golf Destinations Director, Investments Group Limited partner of the firm s parent company Amelia Maccoun Morris, CFA Director, Investments Group Limited partner of the firm s parent company Experience Current Responsibilities: Director, Investments Group, overseeing and directing equity research activities in the consumer sector, and covering the European retail and telecommunications services industries; member of the International Large-Cap Investment Committee. Relevant experience began in 1986 Joined Brandes Investment Partners in 1998 Prior Career Highlights Member of the Emerging Markets Investment Committee with Brandes Investment Partners Member of the Investment Oversight Committee with Brandes Investment Partners Member of the Brandes Institute Advisory Board Shingo Omura, CFA Director, Investments Group Limited partner of the firm s parent company Experience Current Responsibilities: Senior Analyst and leader of the Health Care Research Team, with a primary emphasis on pharmaceutical companies; member of the International Large-Cap Investment Committee; Primary Product Coordinator for the Japan Equity strategy; member of the Corporate Governance Committee. Relevant experience began in 2001 Joined Brandes Investment Partners in 2005 Prior Career Highlights Sell-Side Research Analyst (as a member of both the Basic Materials and Utilities Teams) in Japan Education BS in business administration with a concentration in finance from the University of North Carolina at Chapel Hill AS OF FEBRUARY 2016 FOR INSTITUTIONAL ONE-ON-ONE USE ONLY Education MBA from the University of Chicago Booth School of Business Degree in economics (Phi Beta Kappa and cum laude) from the University of California, Davis Education MBA from the Haas School of Business at the University of California, Berkeley BA in economics from Keio University in Tokyo, Japan 27


114 International Large-Cap Investment Committee Luiz G. Sauerbronn Director, Investments Group Limited partner of the firm s parent company Experience Current Responsibilities: Director, Investments Group and a Senior Analyst on the Industrials Research Team; member of the International Large-Cap and Small- Cap Investment Committees; member of the Corporate Governance Committee. Relevant experience began in 1995 Joined Brandes Investment Partners in 2001 Prior Career Highlights Summer Associate with J.P. Morgan Manager of Mergers and Acquisitions Advisory Team with Banco Brascan (part of Brookfield Asset Management) in Brazil Trainee with Royal Dutch Shell Experience Brent V. Woods, CFA Chief Executive Officer Limited partner of the firm s parent company Current Responsibilities: Chief Executive Officer, leading the firm s Senior Management Team, which is responsible for day-to-day operations and long-term strategic direction; member of the International Large-Cap Investment Committee. Relevant experience began in 1995 Joined Brandes Investment Partners in 1995 Prior Career Highlights Managing Director, Investments Group with Brandes Investment Partners, responsible for the firm s securities research efforts and oversight of the product investment committees Education MBA from the Haas School of Business at the University of California, Berkeley BS in economics from the Federal University of Rio de Janeiro Education JD (cum laude) from Harvard Law School Master s in international studies from St. John s College at Cambridge University, England AB (Phi Beta Kappa) from Princeton University AS OF FEBRUARY 2016 FOR INSTITUTIONAL ONE-ON-ONE USE ONLY 28


115 Active, Fundamental Risk Management Organizational Level Investment Oversight Committee: monitors exposures across multiple strategies Conservative business management of the firm Team approach Co-investment Screening Level Seeks to find compelling areas and avoid expensive ones using global insights Security Level Intrinsic value estimate* considers a spectrum of risks Company-level risks Business, balance sheet, corporate governance and regulatory risk Macro-level risks Sensitivity to economic or specific cycles and events Foreign exchange Portfolio Level Margin of safety** is primary risk control Further considerations Correlation risk Liquidity Diversification Intrinsic value estimates *Intrinsic value estimates can change over time. **The margin of safety for any security is defined as the discount of its market price to what the firm believes is the intrinsic value of that security. Diversification does not assure a profit or protect against loss in a declining market. FOR INSTITUTIONAL ONE-ON-ONE USE ONLY 29
116 Investment Committees International Large-Cap Investment Committee Major Strategies: International, Europe, Japan Committee Members: Jeffrey Germain, CFA Amelia Maccoun Morris, CFA Shingo Omura, CFA Luiz Sauerbronn Brent Woods, CFA Product Coordinators: Andrew Nugent, CFA; Shingo Omura, CFA; Luiz Sauerbronn Small-Cap Investment Committee Major Strategies: Global Small Cap, International Small Cap, U.S. Small Cap, Canadian Equity Committee Members: Ralph Birchmeier, CFA Yingbin Chen, CFA Mark Costa, CFA Luiz Sauerbronn Product Coordinators: Mark Costa, CFA; Jennifer Martin Fixed Income Investment Committee Major Strategies: Core, Core Plus, Corporate Focus, Enhanced Income Committee Members: Timothy Doyle, CFA David Gilson, CFA Chuck Gramling, CFA AS OF FEBRUARY 2016 FOR INSTITUTIONAL ONE-ON-ONE USE ONLY All-Cap Investment Committee Major Strategies: Global Opportunities Committee Members: Ralph Birchmeier, CFA Charles Brandes, CFA Michael Hutchens. CFA Kenneth Little, CFA Gerardo Zamorano, CFA Product Coordinators: Jennifer Martin; Andrew Nugent, CFA Global Large-Cap Investment Committee Major Strategies: Global, Global Equity Income, U.S. Value, Global Balanced Committee Members: Brent Fredberg Ted Kim, CFA Kenneth Little, CFA Brian Matthews, CFA Product Coordinators: Kenneth Little, CFA; Andrew Nugent, CFA Investment Oversight Committee Committee Members: Charles Brandes, CFA; Jeffrey Busby, CFA; Glenn Carlson, CFA; Jeff Meyer, CFA; Ian Sunder, CFA Small-Mid Cap Investment Committee Major Strategies: Global Small-Mid Cap, International Small-Mid Cap, U.S. Small-Mid Cap Committee Members: Chris Duncan, CFA Michael Hutchens. CFA Greg Rippel, CFA Product Coordinators: Chris Duncan, CFA; Jennifer Martin Emerging Markets Investment Committee Major Strategies: Emerging Markets, Emerging Markets Value, Asia Pacific (ex-japan) Committee Members: Mauricio Abadia Douglas Edman, CFA Christopher Garrett, CFA Louis Lau, CFA Gerardo Zamorano, CFA Product Coordinators: Christopher Garrett, CFA; Louis Lau, CFA; Jennifer Martin 30
117 Research Teams Basic Materials Team Leader: Kenneth Little, CFA Chemicals Containers & Packaging Energy Equip. & Svcs. Metals & Mining Oil & Gas Paper & Forest Products Research Associates: Michael Funk, Jim Harrison, Alexander Sobrado Consumer Products AS OF FEBRUARY 2016 Amy Minning, CFA Jeffrey Germain, CFA Chris Duncan, CFA Jeffrey Germain, CFA Douglas Edman, CFA Chris Duncan, CFA Jeffrey Germain, CFA Team Leader: Amelia Maccoun Morris, CFA Beverages Casinos & Gaming Distributors Food & Drug Retailing, Internet & Catalog Retail, Multiline Retail, Specialty Retail Luxury Goods Food Products Hotels, Resorts & Cruise Lines Household Durables Jonathan Menor, CFA Greg Rippel, CFA Greg Rippel, CFA Greg Rippel, CFA (Global, X- Europe) Amelia Morris, CFA (Europe) Amelia Maccoun Morris, CFA Chris Duncan, CFA (Developed Markets) Jonn Menor (Emerging Markets) Greg Rippel, CFA Brent Fredberg FOR INSTITUTIONAL ONE-ON-ONE USE ONLY Consumer Products (Continued) Team Leader: Amelia Morris, CFA Household Products Leisure Facilities Leisure Equipment & Products Personal Products Restaurants Textiles & Apparel Tobacco Research Associates: Brian Boyd, Patrick Voigt Financial Institutions Jonathan Menor, CFA Greg Rippel, CFA Greg Rippel, CFA Jonathan Menor, CFA Jonathan Menor, CFA Greg Rippel, CFA Jonathan Menor, CFA Team Leader: Ralph Birchmeier, CFA Banking Insurance Real Estate Bryan Barrett, CFA (Trust Banks, US Thrifts) Michael Hutchens, CFA (Global including US Money Center Banks, Japan, Brazil, Europe) Louis Lau, CFA (Including Emerging Markets, Europe) Ralph Birchmeier, CFA (US Regional Banks, Peripheral Europe) Anita Krishnamoorthy, CFA (Asia-ex) Bryan Barrett, CFA (US) Ralph Birchmeier, CFA (Global) Anita Krishnamoorthy, CFA (Asia-ex) Bryan Barrett, CFA (US) Louis Lau, CFA (EM) Ralph Birchmeier, CFA (RoW) Anita Krishnamoorthy, CFA (Asia-ex) Financial Institutions (continued) Team Leader: Ralph Birchmeier, CFA Diversified Financials Healthcare Team Leader: Shingo Omura, CFA Biotechnology Health Care Equipment & Supplies Health Care Providers & Services Pharmaceuticals Research Associates: Julia Leung Industrials Team Leader: Ted Kim, CFA Air Freight & Logistics Airlines Automobiles Auto Components Continued on next page Bryan Barrett, CFA (Exchanges) Louis Lau, CFA Michael Hutchens, CFA Ralph Birchmeier, CFA (Holding Companies) Anita Krishnamoorthy, CFA (Asia Conglomerates) Research Associates: Brett Dorendorf, Bradley McMullin, Travis Mahoney, Rebecca Ludford 31 Shingo Omura, CFA Semanti Datta Shingo Omura, CFA Semanti Datta Shingo Omura, CFA Shingo Omura, CFA Steven Leonard, CFA Steven Leonard, CFA Ted Kim, CFA Ted Kim, CFA
118 Research Teams (Cont.) Industrials (Continued) Technology Telecommunications Team Leader: Ted Kim, CFA Building Products Environmental Services Trading Companies & Distribution Machinery: Industrial/ Engineering Heavy Trucks Construction & Farm Marine Road & Rail Transportation Infrastructure Construction & Engineering Mark Costa, CFA Luiz Sauerbronn Steven Leonard, CFA Ted Kim, CFA Mark Costa, CFA Ted Kim, CFA Ted Kim, CFA Steven Leonard, CFA Bryan Barrett, CFA Steven Leonard, CFA Steven Leonard, CFA Steven Leonard, CFA Luiz Sauerbronn Team Leader: Brent Fredberg Commercial Services & Supplies Communications Equipment Computers & Peripherals Electronic Equipment & Instruments Internet Software & Svcs. IT Consulting & Services Office Electronics Semiconductor Equip. & Semiconductors Software Brent Fredberg Mark Robertson, CFA Yingbin Chen, CFA Yingbin Chen, CFA Brent Fredberg Brent Fredberg Mark Robertson, CFA Yingbin Chen, CFA Brent Fredberg Yingbin Chen, CFA Brent Fredberg Mark Robertson, CFA Yingbin Chen, CFA Brent Fredberg Research Associates: Thomas Bender, Edmond Chen, CFA, Michael Zhang Team Leader: Gerardo Zamorano, CFA Diversified & Wireless Telecomm Media Utilities Team Leader: Kenneth Little, CFA Electric, Gas, Water & Multi-Utilities Amelia Maccoun Morris, CFA (Europe) Brian Matthews, CFA (Asia, Canada, EMEA) Gerardo Zamorano, CFA (US, Latam, EMEA) Brian Matthews, CFA (Global) Research Associates: J.T. Adlard, Corey Leung Mauricio Abadia Luiz Sauerbronn (Latin America) Research Associate: Michael Funk, Alexander Sobrado Construction Materials Luiz Sauerbronn Electrical Components & Equipment Bryan Barrett, CFA Heavy Electrical Equip. Steven Leonard, CFA Industrial Conglomerates Mark Costa, CFA Aerospace & Defense Mark Costa, CFA Research Associates: Andrew Anderson, Brett Dorendorf, John Harris, AS OF FEBRUARY 2016 FOR INSTITUTIONAL ONE-ON-ONE USE ONLY 32
119 Industry Exposure Top 3 MSCI AC World Ex-US (gross) Industries not in Portfolio Chemicals 3.2% Food Products 3.0% Beverages 2.4% Largest Industry Weighting Increases 3/31/2016 3/31/2015 Change Electrical Equipment 1.7% 0.0% +1.7% Communications Equip. 1.6% 0.0% +1.6% Textiles, Apparel & Lux. Goods 1.4% 0.0% +1.4% Total number of industries in Portfolio: 26 Largest Industry Weighting Decreases 3/31/2016 3/31/2015 Change Insurance 5.5% 9.2% -3.7% Banks 8.5% 11.9% -3.4% Automobiles 5.7% 6.8% -1.1% No exposure to industries that represent 37.3% of benchmark As of March 31, 2016 Portfolio allocations are subject to change at any time. FOR INSTITUTIONAL ONE-ON-ONE USE ONLY 33
120 Summary of Portfolio Changes Trailing Twelve Months as of March 31, 2016 New Issuers Company Industry Country Credit Suisse Group Capital Markets Switzerland Ericsson (L.M.) Telephone Multi-Utilities France Publicis Goupe Media France Schneider Electric Electrical Equipment France The Swatch Group Textiles, Apparel & Luxury Goods Switzerland Complete Sale of Positions Company Industry Country Intesa Sanpaolo Spa Multi-Utilities France Koninklijke Ahold Food & Staples Retailing Netherlands NKSJ Holdings Inc. Insurance Japan FOR INSTITUTIONAL ONE-ON-ONE USE ONLY 34
.")
121 Brandes Is Value International Large-Cap Value Equity Universe Brandes International Equity Value Metrics (Higher = More Value Tilt) Growth Metrics (Lower = More Value Tilt) AS OF DECEMBER 31, 2015 Sources: Style Research, evestment Alliance (ea). Blue floating bars represent distribution of managers in the universe (an aggregation of ea s ACWI ex-us Large Cap Value Equity and EAFE Large Cap Value Equity universes) relative to the MSCI EAFE Index. A bar s light blue area represents the middle 50% with middle line equal to the median manager; dark blue areas represent the top and bottom 20%; the top and bottom 5% is eliminated to remove outliers. Y-axis: zero represents the Index; as a general rule <-0.5 or >0.5 indicates tilt exists but is not significant, <-1 or >+1 is significant, <-2 or >+2 is very significant. The portfolio characteristics shown relate to a single account as of date noted, deemed by Brandes to be generally representative of the strategy. Not every account will have these exact characteristics. The actual characteristics with respect to any particular account will vary based on a number of factors including but not limited to: (i) the size of the account; (ii) investment restrictions applicable to the account, if any; and (iii) market exigencies at the time of investment. Past performance is not a guarantee of future results. FOR INSTITUTIONAL ONE-ON-ONE USE ONLY 35
122 Valuations of Value Stocks Globally Cheapest Decile of Stocks by P/B: Relative to Market Average P/B of Value Stocks Relative to the Universe 0.46x 0.44x 0.42x 0.40x 0.38x 0.36x 0.34x 0.32x Range (+/-1 Standard Deviation) Average Relative Valuation December x International International Small Cap Global All Cap Global Micro Cap Emerging Markets JANUARY 1990 TO DECEMBER 2015 Source: Worldscope via Clarifi, Metis Global Partners as of 12/31/2015. Dataset includes the largest 50% of companies by market cap globally that are divided into deciles based on price-to-book ratios. Valuations based on P/B; value stocks defined as the cheapest 10% of the universe on a P/B basis and are relative to the market as defined: International represents the largest 10% of companies in countries outside the U.S.; emerging markets represent the largest 10% of companies in emerging and frontier countries; global all cap represents the largest 25% of companies globally; international small cap represents non-u.s. companies rankings in the 11 th 25 th percentile based on USD market capitalization; and global micro cap represents companies in the 26 th 50 th percentile globally. Standard deviation calculated based on monthly P/B valuation of the cheapest decile relative to the market. FOR INSTITUTIONAL ONE-ON-ONE USE ONLY 36
123 Selective Approach to EM Allocation Allocation to Emerging Markets in Brandes International Equity, and P/B Valuation Premium/Discount of MSCI Emerging Markets relative to MSCI EAFE 50% Brandes International Equity % in EM (Right Hand Scale) MSCI EM vs. MSCI EAFE P/B Premium/Discount (Left Hand Scale) 25% P/B Premium / Discount 40% 30% 20% 10% 0% -10% -20% 20% 15% 10% 5% % Allocation to Emerging Markets -30% Mar-06 Sep-06 Mar-07 Sep-07 Mar-08 Sep-08 Mar-09 Sep-09 Mar-10 Sep-10 Mar-11 Sep-11 Mar-12 Sep-12 Mar-13 Sep-13 Mar-14 Sep-14 Mar-15 Sep-15 Mar-16 0% MARCH 31, 2006 TO MARCH 31, 2016 Source: Brandes Investment Partners and MSCI via FactSet. The portfolio characteristics shown relate to the respective single accounts as of date noted, deemed by Brandes to be generally representative of the strategy. Not every account will have these exact characteristics. The actual characteristics with respect to any particular account will vary based on a number of factors including but not limited to: (i) the size of the account; (ii) investment restrictions applicable to the account, if any; and (iii) market exigencies at the time of investment. Diversification guidelines for Brandes Global and International are generally 30% maximum in emerging markets at time of purchase FOR INSTITUTIONAL ONE-ON-ONE USE ONLY 37
124 Being Different in Europe Select Differentials vs. Benchmark 9.3% Key Overweights % of portfolio as of 3/31/2016 Key Underweights % of portfolio as of 3/31/ % 6.3% 4.0% 4.0% 3.0% 2.6% 2.9% 0.9% 1.1% 0.0% 0.0% Food & Staples Retailing Oil Gas & Consumable Fuels Multi-Utilities Chemicals Food Products Banks Brandes International Equity MSCI EAFE Index Source: MSCI via FactSet, Brandes Investment Partners. The portfolio characteristics shown above are deemed by Brandes to be generally representative of the strategy as of the date noted above. Not every account will have these exact characteristics. The actual characteristics with respect to any particular account will vary based on a number of factors including but not limited to: (i) the size of the account; (ii) investment restrictions applicable to the account, if any; and (iii) market exigencies at the time of investment. Brandes reserves the right to modify its current investment strategies and techniques based on changing market dynamics or client needs. It should not be assumed that any of the securities transactions or holdings discussed were or will prove to be profitable, or that the investment recommendations or decisions we make in the future will be profitable or will equal the investment performance of the securities discussed herein. FOR INSTITUTIONAL ONE-ON-ONE USE ONLY 38

125 Higher Prices Drove Increased Capex AS OF DECEMBER 31, 2015 Source: Citigroup, EIA, Bloomberg. FOR INSTITUTIONAL ONE-ON-ONE USE ONLY 39

126 Capex Spending is Now Being Cut AS OF DECEMBER 31, 2015 Source: JPMorgan. FOR INSTITUTIONAL ONE-ON-ONE USE ONLY 40
127 Attractive Valuations in UK Food Retail Mean Industry Valuations Relative to Market 3.0x 2.5x >1.0 = premium Industry Valuation Relative to Market* 2.0x 1.5x 1.0x 0.5x <1.0 = discount 0.0x Jun-89 Jun-90 Jun-91 Jun-92 Jun-93 Jun-94 Jun-95 Jun-96 Jun-97 Jun-98 Jun-99 Jun-00 Jun-01 Jun-02 Jun-03 Jun-04 Jun-05 Jun-06 Jun-07 Jun-08 Jun-09 Jun-10 Jun-11 Jun-12 Jun-13 Jun-14 Jun-15 JANUARY 31, 1990 TO JUNE 30, 2015 Source: Worldscope via FactSet. Market defined as the top 25% of companies in developed Europe based on market cap, after exclusion of securities with free float market cap <US$100 million. As of 30 June 2015, this generally included all companies with market caps in excess of US$500 million. Past performance is not a guarantee of future results. *Valuations measure based on earnings yield, average earnings over trailing four years divided by price. FOR INSTITUTIONAL ONE-ON-ONE USE ONLY 41
128 Real Estate Value Implies Pay Very Little For Underlying Operating Business UK FOOD & STAPLES RETAILING Real Estate Adjusted Enterprise Value 38.1 GBP Billions Morrison Sainsbury Tesco AS OF MARCH 31, 2016 Source: Company filings, Bloomberg, CapitalIQ The securities identified and described do not represent all of the securities purchases, sold, or recommended for client accounts. The viewer should not assume that an investment in the securities identified was or will be profitable. FOR INSTITUTIONAL ONE-ON-ONE USE ONLY 42
129 Being Different In Japan Select Differentials vs. Benchmark Key Overweights % of portfolio as of 12/31/2015 Key Underweights % of portfolio as of 12/31/ % 5.7% 4.4% 2.6% 1.4% 1.6% 0.7% 1.3% 1.1% 0.0% 0.0% 0.0% Japanese Pharma Japanese Autos Japanese Insurance Japanese REITs & Real Estate Mgmt. Japanese Materials Japanese Industrials Source: MSCI via FactSet, Brandes Investment Partners. The portfolio characteristics shown above are deemed by Brandes to be generally representative of the strategy as of the date noted above. Not every account will have these exact characteristics. The actual characteristics with respect to any particular account will vary based on a number of factors including but not limited to: (i) the size of the account; (ii) investment restrictions applicable to the account, if any; and (iii) market exigencies at the time of investment. Brandes reserves the right to modify its current investment strategies and techniques based on changing market dynamics or client needs. It should not be assumed that any of the securities transactions or holdings discussed were or will prove to be profitable, or that the investment recommendations or decisions we make in the future will be profitable or will equal the investment performance of the securities discussed herein. FOR INSTITUTIONAL ONE-ON-ONE USE ONLY Brandes International Equity MSCI EAFE Index 43
130 Japan Valuations & Allocations Japan P/B Relative to MSCI EAFE and Japan Active Weight in Brandes International Equity 1.6x 1.4x 1.2x December 2010: 11% active weight = 1.5x benchmark weight 30% 20% 10% Japan Relative P/B 1.0x 0.8x 0.6x 0.4x Brandes International Equity (RHS) Japan vs. EAFE Relative P/B (LHS) 0% -10% -20% -30% -40% 0.2x -50% 0.0x -60% Mar-90 Mar-91 Mar-92 Mar-93 Mar-94 Mar-95 Mar-96 Mar-97 Mar-98 Mar-99 Mar-00 Mar-01 Mar-02 Mar-03 Mar-04 Mar-05 Mar-06 Mar-07 Mar-08 Mar-09 Mar-10 Mar-11 Mar-12 Mar-13 Mar-14 Mar-15 Mar-16 Japan Active Weight DECEMBER 31, 1990 MARCH 31, 2016 Source: FactSet, MSCI, Brandes Investment Partners. Past performance is not a guarantee of future results. Please note that all indices are unmanaged and are not available for direct investment. Japan represented by MSCI Japan Index. Japan active weight defined as: allocation to Japan in Brandes International Equity strategy minus allocation to Japan in MSCI EAFE Index. The portfolio characteristics shown relate to a single account as of date noted, deemed by Brandes to be generally representative of the strategy noted. Not every account will have these exact characteristics. The actual characteristics with respect to any particular account will vary based on a number of factors including but not limited to: (i) the size of the account; (ii) investment restrictions applicable to the account, if any; and (iii) market exigencies at the time of investment. Data is updated on a quarterly basis. FOR INSTITUTIONAL ONE-ON-ONE USE ONLY 44
131 KEY PERFORMANCE FACTORS* International Equity Strategy Trailing 12 Months Ended March 31, 2016 Positive Factors: Holdings in the following industries: Pharmaceuticals (Taisho, Daiichi Sankyo) Food & Staples Retailing (Wm. Morrison) Water Utilities (SABESP) Holdings in the following countries: Japan (Sompo, MS&AD) Austria (Erste Bank) Lack of exposure to Germany Negative Factors: Holdings in the following industries: Commercial Services & Supplies (G4S, Dai Nippon Printing) Capital Markets (Credit Suisse) Oil Gas & Consumable Fuels (BP, Lukoil) Holdings in the following countries: United Kingdom Switzerland *Relative to the index. The MSCI EAFE (Europe, Australasia, Far East) Index with net dividends measures equity market performance of developed markets in Europe, Australasia, and the Far East. MSCI has not approved, reviewed or produced this report, makes no express or implied warranties or representations and is not liable whatsoever for any data in the report. You may not redistribute the MSCI data or use it as a basis for other indices or investment products. The information provided in this material should not be considered a recommendation to purchase or sell any particular security. It should not be assumed that any security transactions, holdings, or sectors discussed were or will be profitable, or that the investment recommendations or decisions we make in the future will be profitable or will equal the investment performance discussed herein. Strategies discussed herein are subject to change at any time by the investment manager in its discretion due to market conditions or opportunities. International and emerging markets investing is subject to certain risks such as currency fluctuation and social and political changes; such risks may result in greater share price volatility. The foregoing reflects the thoughts and opinions of Brandes Investment Partners exclusively and is subject to change without notice. FOR INSTITUTIONAL ONE-ON-ONE USE ONLY 45

132 Your Portfolio Management Team Experience Lawrence Taylor Institutional Portfolio Manager Current Responsibilities - Works with institutional clients and their consultants to provide insights and interpretation of the firm s portfolio strategies and investment philosophy, and coordinates with Investment Committees to ensure that we accommodate client-specific guidelines and consider existing portfolio allocations when implementing investment decisions Relevant experience began in 1993 Joined Brandes Investment Partners in 1995 Prior Career Highlights - Associate Portfolio Manager / Analyst with Brandes Investment Partners - Investment Analyst with San Diego City Employees Retirement System Education BA from the University of California, San Diego Institutional Portfolio Management Members Sam Arredondo - Portfolio Analyst Emily Garcia Supervisor, Portfolio Analyst Christopher Garrett - Chief Executive Officer, Brandes Asia Claudia Vazquez Portfolio Analyst Christopher Garrett - Chief Executive Officer, Brandes Asia AS OF DECEMBER 31, 2015 FOR REGISTERED REPRESENTATIVE USE ONLY. Michael Israel - Director, Institutional Group, Institutional Portfolio Manager and Product Manager Shingo Omura Director, Investments Group John Otis - Institutional Portfolio Manager Rhonda Berger Director, Institutional Portfolio Manager Marsha Riley - Director, Mutual Fund Sales & Portfolio Management Clifford Schireson Director, Institutional Services Ian Sunder - President, Brandes Investment Partners (Europe) Lawrence Taylor - Institutional Portfolio Manager 46
133 Performance Table Relating to Rolling Three- Year Annualized Returns MSCI EAFE Value Index versus MSCI EAFE Growth Index Rolling Three-Year Annualized Returns Period ending MSCI EAFE Value Index MSCI EAFE Growth Index Period ending MSCI EAFE Value Index MSCI EAFE Growth Index Period ending MSCI EAFE Value Index MSCI EAFE Growth Index 3/31/ % 7.61% 3/31/ % 14.12% 3/31/ % 12.59% 3/31/ % 14.82% 3/31/ % 0.22% 3/31/ % 6.84% 3/31/ % 7.97% 3/31/ % 18.85% 3/31/ % 37.25% 3/31/ % 47.94% 3/31/ % 48.08% 3/31/ % 25.17% 3/31/ % -1.24% 3/31/ % -2.26% 3/31/ % -7.19% 3/31/ % 1.41% 3/31/ % 5.46% 3/31/ % 10.32% 3/31/ % 11.13% 3/31/ % 5.14% 3/31/ % 9.16% 3/31/ % 7.37% 3/31/ % 18.75% 3/31/ % -4.11% 3/31/ % -9.38% 3/31/ % % 3/31/ % 1.39% 3/31/ % 8.63% 3/31/ % 27.17% 3/31/ % 17.55% 3/31/ % 14.35% 3/31/ % % 3/31/ % -5.70% 3/31/ % -2.52% 3/31/ % 17.74% 3/31/ % 6.47% 3/31/ % 7.22% 3/31/ % 8.96% 3/31/ % 3.80% Past performance is not a guarantee of future results. FOR INSTITUTIONAL ONE-ON-ONE USE ONLY 47
134 Outperformance in Down Years Cumulative Brandes International Equity Strategy (%) % 0% 7.44% 3.61% MSCI EAFE Index (%) Downside Capture* (%) % -4.90% -0.81% -1.17% Annual Return -10% -20% -30% % % % % Brandes International Equity (Gross) MSCI EAFE Index %-15.94% % % % -40% % -50% Annual Returns for All of Benchmark s Down Years Since Composite Inception * Downside capture is calculated by dividing the portfolio s return by the benchmark index s return.. Source: Brandes Investment Partners and MSCI as of 12/31/2015. Net of management fees. Please see the accompanying International Equity composite performance pages. International and emerging markets investing is subject to certain risks such as currency fluctuation and social and political changes; such risks may result in greater share price volatility. Past performance is not a guarantee of future results. Please note that all indices are unmanaged and are not available for direct investment. FOR INSTITUTIONAL ONE-ON-ONE USE ONLY 48
135 L.A. Fire and Police Pension Trust PORTFOLIO SUMMARY Brandes International Equity Portfolio as of 03/31/16 (Reporting Currency - USD) Fundamental Summary MKT CAP (MIL) PRICE/BOOK PRICE/EARN PRICE/CF % LT DEBT/EQUITY % YLD % ROE Portfolio Equity Averages: 35, MSCI AC World Ex-US (gross) Averages: 46, Industry Summary % Aerospace & Defense 1.64 Auto Components 2.70 Automobiles 5.71 Banks 8.51 Building Products 1.89 Capital Markets 3.20 Commercial Services & Supplies 2.12 Communications Equipment 1.57 Construction Materials 3.44 Diversified Financial Services 1.54 Diversified Telecom Svcs Electric Utilities 0.43 Electrical Equipment 1.67 Food & Staples Retailing 9.42 Insurance 5.54 Media 1.34 Metals & Mining 1.91 Multi-Utilities 3.02 Multiline Retail 1.71 Oil Gas & Consumable Fuels Pharmaceuticals Specialty Retail 1.06 Tech. Hardware, Storage & Perip Textiles, Apparel & Luxury Goods 1.36 Water Utilities 0.86 Wireless Telecom Svcs Capitalization Summary % Large Cap (> 5.0 Billion) Medium Cap ( Billion) 4.11 Small Cap (0-1.5 Billion) 0.00 Country Summary % Austria 1.33 Brazil 7.76 China 1.03 France Hong Kong 1.54 Ireland 3.23 Italy 4.32 Japan Mexico 1.91 Netherlands 1.65 Russia 4.15 South Korea BRANDES INVESTMENT PARTNERS 49
136 L.A. Fire and Police Pension Trust PORTFOLIO SUMMARY Brandes International Equity Portfolio as of 03/31/16 (Reporting Currency - USD) Country Summary % Sweden 1.57 Switzerland 5.23 United Kingdom Regional Summary % Developed Markets Emerging Markets Asia Europe Latin America 9.68 Asset Allocation Summary % Equity Cash BRANDES INVESTMENT PARTNERS 50
137 L.A. Fire and Police Pension Trust PORTFOLIO APPRAISAL Brandes International Equity Portfolio as of 03/31/16 (Reporting Currency - USD) QUANTITY SECURITY UNIT COST TOTAL COST MARKET PRICE MARKET VALUE % OF ASSETS EQUITY COMMON STOCKS: 2,657,309 Aegon NV ORD ,143, ,627, ,659 Banco Santander Brasil SA ADR ,555, ,076, ,574,209 Barclays Plc ORD ,148, ,863, ,401,568 BP Plc ORD ,858, ,156, ,100 Canon, Inc. ORD ,156, ,001, ,593 Carrefour SA ORD ,197, ,985, ,330,324 Cemex SA Part. Cert. ADR ,641, ,964, ,140,403 Centrais Eletricas Bras ADR ,083, ,809, ,500 China Mobile Ltd ORD ,004, ,166, ,127,600 CIA Saneamento Basico ORD SABESP ,910, ,615, ,260 Compagnie de Saint-Gobain ORD ,237, ,726, ,056,114 Credit Suisse Group AG ORD ,178, ,007, ,641 CRH PLC ORD ,892, ,527, ,000 Dai Nippon Printing ORD ,886, ,446, ,600 Daiichi Sankyo Company, Ltd ORD ,379, ,360, ,560 Embraer SA ADR ,656, ,539, ,723,444 Engie SA ORD ,627, ,768, ,493,059 ENI S.p.A. ORD ,166, ,611, ,387,200 Ericsson (L.M.) Telephone ORD ,176, ,929, ,640 Erste Group Bank AG ORD ,239, ,802, ,330,000 First Pacific Co., Ltd. ORD ,204, ,682, ,142,515 G4S PLC ORD ,104, ,350, ,684,052 GlaxoSmithKline Plc ORD ,527, ,184, ,392 Hana Financial Group Inc ORD ,918, ,811, ,600 Honda Motor Company ORD ,112, ,431, ,046,340 HSBC Holdings PLC (GBP) ORD ,860, ,764, BRANDES INVESTMENT PARTNERS 51
138 L.A. Fire and Police Pension Trust PORTFOLIO APPRAISAL Brandes International Equity Portfolio as of 03/31/16 (Reporting Currency - USD) QUANTITY SECURITY UNIT COST TOTAL COST MARKET PRICE MARKET VALUE % OF ASSETS 109,651 Hyundai Mobis Co Ltd ORD ,270, ,974, ,029,303 J Sainsbury PLC ORD ,574, ,004, ,730,860 Kingfisher Plc ORD ,301, ,373, ,925 Lukoil PJSC RTS ORD ,302, ,055, ,600 Lukoil PJSC Sponsored ADR ,188, ,391, ,590,166 Marks & Spencer Group PLC ORD ,846, ,125, ,200 Mitsubishi Tanabe Pharma ORD ,663, ,651, ,727,200 Mitsubishi UFJ Financial Grp ORD ,584, ,653, ,300 MS&AD Insurance Grp Hldg ORD ,109, ,288, ,437,400 Nissan Motor Co., Ltd. ORD ,646, ,584, ,418 Orange SA ORD ,867, ,083, ,269,148 Petroleo Bras A Pref Shrs ADR ,414, ,279, ,463,800 Petroleo Bras A Pref Shrs ORD ,393, ,794, ,048 Posco ORD ,760, ,970, ,388 Publicis Groupe ORD ,964, ,902, ,456 Renault ORD ,675, ,607, ,582 Sanofi ORD ,297, ,576, ,010 Schneider Electric SE ORD ,375, ,799, ,246,000 Sumitomo Mitsui Trust Hldgs ORD ,004, ,450, ,460,007 Surgutneftegas RTS Pref ORD ,700, ,346, ,049 Swiss Re AG ORD ,823, ,037, ,600 Taisho Pharmaceutical Hldgs ORD ,436, ,141, ,000 Takeda Pharma Co Ltd ORD ,440, ,210, ,864,886 Telecom Italia Svings Shs ORD ,948, ,663, ,264 Telefonica Brasil SA Pfd ADR ,223, ,911, ,400 Telefonica Brasil SA Pfd ORD ,920, ,242, ,047,331 Tesco Plc ORD ,331, ,189, ,700 The Swatch Group Bearer Shs ORD ,404, ,024, BRANDES INVESTMENT PARTNERS 52
139 L.A. Fire and Police Pension Trust PORTFOLIO APPRAISAL Brandes International Equity Portfolio as of 03/31/16 (Reporting Currency - USD) QUANTITY SECURITY UNIT COST TOTAL COST MARKET PRICE MARKET VALUE % OF ASSETS 14,858 The Swatch Group Reg Shs ORD , ,004, ,296 Tim Participacoes SA ADR ,415, ,517, ,200 Tim Participacoes SA ORD ,390, ,035, ,940 UBS Group AG ORD ,067, ,325, ,519 Willis Towers Watson PLC ,437, ,131, ,254,236 Wm. Morrison Supermkts Plc ORD ,907, ,291, Total Common Stocks 964,473, ,854, Total Equity 964,473, ,854, CASH Cash 50,479, ,479, Total Portfolio 1,014,953, ,333, Accrued Income 4,045, Total Portfolio including Accruals 890,378, BRANDES INVESTMENT PARTNERS 53
140 Disclosures The Barclays U.S. Aggregate Bond Index is a broad-based benchmark that measures the investment-grade, U.S. dollar-denominated, fixed-rate taxable bond market. This index is a total return index which reflects the price changes and interest of each bond in the index. The Barclays U.S. Treasury Index is an unmanaged index consisting of U.S. dollar-denominated, fixed-rate, publicly issued bonds. The index is a total return index which reflects the price changes and interest of each bond in the index. The MSCI All Country World Index with net dividends measures equity market performance of developed and emerging markets. The MSCI All Country World ex-u.s. Index with gross dividends measures equity market performance of developed and emerging markets excluding the United States. The MSCI EAFE (Europe, Australasia, Far East) Index with net dividends measures equity market performance of developed markets in Europe, Australasia, and the Far East. The MSCI EAFE (Europe, Australasia, Far East) Growth Index with gross dividends measures equity market performance of developed markets excluding the United States and Canada. The attributes for growth index construction are long-term forward earnings per share (EPS) growth rate, short-term forward EPS growth rate, current internal growth rate, long-term historical EPS growth trend, and long-term historical sales per share growth trend. The MSCI EAFE (Europe, Australasia, Far East) Value Index with net dividends measures equity market performance of developed markets excluding the United States and Canada. The attributes for value index construction are book value-to-price ratio, 12-months forward earnings-to-price ratio, and dividend yield. The MSCI Emerging Markets Index with gross dividends measures equity market performance of emerging markets. The MSCI World Index with net dividends measures equity market performance of developed markets. The S&P 500 Index with gross dividends measures equity performance of 500 leading companies in industries of the U.S. economy. The TOPIX Index with gross dividends is calculated based on the performance of all domestic common stocks listed on the Tokyo Stock Exchange First Section. The total returns for the index prior to 12/31/1998 are not available; therefore returns are derived by combining the price index returns and corresponding month-end yields (the source of this index information is FT Interactive Data Corporation). From 12/31/1998 to present time, the returns for the TOPIX index are calculated on a total return basis. The MSCI Japan Index with net dividends measures equity market performance in Japan. The MSCI Europe Index with net dividends measures equity market performance of developed markets in Europe. The MSCI information may only be used for your internal use, may not be reproduced or redisseminated in any form and may not be used as a basis for or a component of any financial instruments or products or indices. None of the MSCI information is intended to constitute investment advice or a recommendation to make (or refrain from making) any kind of investment decision and may not be relied on as such. Historical data and analysis should not be taken as an indication or guarantee of any future performance analysis, forecast or prediction. The MSCI information is provided on an as is basis and the user of this information assumes the entire risk of any use made of this information. MSCI, each of its affiliates and each other person involved in or related to compiling, computing or creating any MSCI information (collectively, the MSCI Parties ) expressly disclaims all warranties (including, without limitation, any warranties of originality, accuracy, completeness, timeliness, non-infringement, merchantability and fitness for a particular purpose) with respect to this information. Without limiting any of the foregoing, in no event shall any MSCI Party have any liability for any direct, indirect, special, incidental, punitive, consequential (including, without limitation, lost profits) or any other damages. ( FOR INSTITUTIONAL ONE-ON-ONE USE ONLY 54
141 Correlation: A statistical measure of how two securities move in relation to each other. Price/Book: Price per share divided by book value per share. Price/CF: Price per share divided by cash flow per share. Price/Earnings: Price per share divided by earnings per share. Yield: Annual income from the investment (dividend, interest, etc.) divided by the current market price of the investment. ROE (Return on Equity): Earnings per share divided by equity value per share The information provided in this material should not be considered a recommendation to purchase or sell any particular security. It should not be assumed that any security transactions, holdings, or sectors discussed were or will be profitable, or that the investment recommendations or decisions we make in the future will be profitable or will equal the investment performance discussed herein. Portfolio holdings and allocations are subject to change at any time and should not be considered a recommendation to buy or sell particular securities. Strategies discussed herein are subject to change at any time by the investment manager in its discretion due to market conditions or opportunities. Indices are unmanaged and are not available for direct investment. Market conditions may impact performance. The performance results presented were achieved in particular market conditions which may not be repeated. Moreover, the current market volatility and uncertain regulatory environment may have a negative impact on future performance. International and emerging markets investing is subject to certain risks such as currency fluctuation and social and political changes; such risks may result in greater share price volatility. Stocks of small companies usually experience more volatility than mid and large sized companies. Unlike bonds issued or guaranteed by the U.S. government or its agencies, stocks and other bonds are not backed by the full faith and credit of the United States. Stock and bond prices will experience market fluctuations. Please note that the value of government securities and bonds in general have an inverse relationship to interest rates. Bonds carry the risk of default, or the risk that an issuer will be unable to make income or principal payment. There is no assurance that private guarantors or insurers will meet their obligations. The credit quality of the investments in the portfolio is no guarantee of the safety or stability of the portfolio. Investments in Asset Backed and Mortgage Backed Securities include additional risks that investors should be aware of such as credit risk, prepayment risk, possible illiquidity and default, as well as increased susceptibility to adverse economic developments. International and emerging markets investing is subject to certain risks such as currency fluctuation and social and political changes; such risks may result in greater share price volatility. The foregoing reflects the thoughts and opinions of Brandes Investment Partners exclusively and is subject to change without notice. Brandes Investment Partners is a registered trademark of Brandes Investment Partners, L.P. in the United States and Canada. VALUE SPECIALISTS SINCE 1974 CALL BRANDES.COM El Camino Real, Suite 600 P.O. Box San Diego, California FOR INSTITUTIONAL ONE-ON-ONE USE ONLY 55

142
143
144


145


146
147


148

149


150


151
152
153
154


155


156


157


158


159


160


161


162


163


164


165


166


167


168


169


170


171


172

173


174


175


176

177
178 DEPARTMENT OF FIRE AND POLICE PENSIONS 701 E. 3 rd Street, Suite 200 Los Angeles, CA (213) REPORT TO THE BOARD OF FIRE AND POLICE PENSION COMMISSIONERS DATE: MAY 5, 2016 ITEM: E.1 FROM: RAYMOND P. CIRANNA, GENERAL MANAGER SUBJECT: APPROVAL OF TRAVEL AUTHORITY (NAVARRO) NATIONAL CONFERENCE ON PUBLIC EMPLOYEE RETIREMENT SYSTEMS (NCPERS), 2016 ANNUAL CONFERENCE & EXHIBITION RECOMMENDATION That the Board approve Commissioner Ruben Navarro s request to attend the NCPERS, 2016 Annual Conference & Exhibition on May 15 18, 2016 in San Diego, CA (May 15 th is a travel day). DISCUSSION Commissioner Navarro expressed interest in participating in the following conference: BUDGET Conference: 2016 Annual Conference & Exhibition Sponsor: National Conference on Public Employee Retirement Systems Dates: May 16 18, 2016 Location: San Diego, CA Mode of transportation: Personal Vehicle Sufficient funds are available in the Fiscal Year Travel Account. Listed below is an estimated cost to travel for Commissioner Navarro. POLICY Registration $1, Hotel Per Diem Incidentals (mileage, parking) TOTAL $2, If approved by the Board, the proposed expenditures would be within the Board s Travel and Education Policy. All information regarding the conference is contained in the attached agenda. This report was prepared by: Evangelina Masud, Executive Administrative Assistant Administrative Operations Division RPC:WSR:EM Attachment - Conference agenda

179 SUNDAY, MAY Annual Conference & Exhibition (ACE) 2:00 PM 6:00 PM REGISTRATION 4:00 PM 6:00 PM EXHIBITION OPENS Hilton San Diego Bayfront San Diego, CA FINAL AGENDA 4:00 PM 6:00 PM WELCOMING RECEPTION Sponsored by Robbins Geller Rudman & Dowd LLP MONDAY, MAY 16 6:30 AM 7:45 AM BREAKFAST Sponsored by William Blair Investment Management 6:30 AM 2:00 PM REGISTRATION 8:00 AM 1:30 PM EXHIBITION 8:00 AM 10:30 AM FIRST GENERAL SESSION 8:30 am GASB Update: What NCPERS Members Need to Know David Vaudt, Governmental Accounting Standards Board 9:00 am Panel on Pension Obligation Bonds Greg Smith, COPERA Jim Link, PFM Girard Miller, OCERS 9:45 am Federal Regulatory Update Anthony Roda, Williams & Jensen Robert Gauss, Ice Miller 10:15 am Pension Reforms and Economic Volatility Michael Kahn, NCPERS *Agenda subject to change. Descriptions for breakout sessions can be found on the NCPERS Annual Conference app. Agenda revised 4/15/2016.
SPECIAL AGENDA BOARD OF FIRE AND POLICE PENSION COMMISSIONERS. April 4, :45 a.m. or as soon thereafter as the Board recesses its regular meeting
 SPECIAL AGENDA BOARD OF FIRE AND POLICE PENSION COMMISSIONERS April 4, 2019 8:45 a.m. or as soon thereafter as the Board recesses its regular meeting Sam Diannitto Boardroom Los Angeles Fire and Police
AGENDA BOARD OF FIRE AND POLICE PENSION COMMISSIONERS. December 1, :30 a.m.
 AGENDA BOARD OF FIRE AND POLICE PENSION COMMISSIONERS December 1, 2016 8:30 a.m. Sam Diannitto Boardroom Los Angeles Fire and Police Pensions Building 701 East Third Street, Suite 400 Los Angeles, CA 90013
AGENDA BOARD OF FIRE AND POLICE PENSION COMMISSIONERS. May 3, :30 a.m.
 AGENDA BOARD OF FIRE AND POLICE PENSION COMMISSIONERS May 3, 2018 8:30 a.m. Sam Diannitto Boardroom Los Angeles Fire and Police Pensions Building 701 East 3rd Street, Suite 400 Los Angeles, CA 90013 An
AGENDA BOARD OF FIRE AND POLICE PENSION COMMISSIONERS. September 3, :30 a.m.
 AGENDA BOARD OF FIRE AND POLICE PENSION COMMISSIONERS September 3, 2015 8:30 a.m. Los Angeles Times Building 202 W. First Street, Suite 500 Los Angeles, CA 90012 Commissioner Diannitto will participate
SPECIAL AGENDA BOARD OF FIRE AND POLICE PENSION COMMISSIONERS
 SPECIAL AGENDA BOARD OF FIRE AND POLICE PENSION COMMISSIONERS Wednesday, JULY 2, 2014 8:30 a.m. Los Angeles Times Building 202 W. First Street, Suite 500 Los Angeles, CA 90012 Commissioner Diannitto will
AGENDA BOARD OF FIRE AND POLICE PENSION COMMISSIONERS. January 4, :30 a.m.
 AGENDA BOARD OF FIRE AND POLICE PENSION COMMISSIONERS January 4, 2018 8:30 a.m. Sam Diannitto Boardroom Los Angeles Fire and Police Pensions Building 701 East 3rd Street, Suite 400 Los Angeles, CA 90013
AGENDA BOARD OF FIRE AND POLICE PENSION COMMISSIONERS. March 16, :30 a.m.
 AGENDA BOARD OF FIRE AND POLICE PENSION COMMISSIONERS March 16, 2017 8:30 a.m. Sam Diannitto Boardroom Los Angeles Fire and Police Pensions Building 701 East 3rd Street, Suite 400 Los Angeles, CA 90013
Perspectives RETIRED/ DROP MEMBER NEWSLETTER
 Update on Retiree Health Plans 4 2018 COLA is 3.6% 7 2018 Pension Payment Schedule 8 ension Perspectives RETIRED/ DROP MEMBER NEWSLETTER LOS ANGELES FIRE & POLICE PENSIONS JUNE 2018 Non-Medicare Subsidy
AD HOC EMERGING INVESTMENT MANAGER COMMITTEE. AGENDA Board of Fire and Police Pension Commissioners
 AD HOC EMERGING INVESTMENT MANAGER COMMITTEE AGENDA Board of Fire and Police Pension Commissioners George Aliano Carl Cade Emanuel Pleitez Belinda Vega FEBRUARY 6, 2014 8:45 a.m. or Immediately Following
LOS ANGELES FIRE AND POLICE PENSION SYSTEM FINANCIAL STATEMENTS JUNE 30, 2015 AND 2014
 LOS ANGELES FIRE AND POLICE PENSION SYSTEM FINANCIAL STATEMENTS JUNE 30, 2015 AND 2014 LOS ANGELES FIRE AND POLICE PENSION SYSTEM TABLE OF CONTENTS Independent Auditor s Report... 1 Management s Discussion
General Manager s Message
 pension perspectives Retired/DROP Member Newsletter General Manager s Message Several exciting things are going on here at LAFPP! We have started the replacement of our existing pension administration
Proposed New Tiers of Benefit for New Entrants (Pension Plan and Retiree Medical Plan) Copyright 2010
 Copyright 2010") LOS ANGELES CITY EMPLOYEES RETIREMENT SYSTEM Proposed New Tiers of Benefit for New Entrants (Pension Plan and Retiree Medical Plan) Copyright 2010 THE SEGAL COMPANY, INC. THE PARENT OF THE SEGAL COMPANY
LOS ANGELES CITY EMPLOYEES RETIREMENT SYSTEM Proposed New Tiers of Benefit for New Entrants (Pension Plan and Retiree Medical Plan) Copyright 2010 THE SEGAL COMPANY, INC. THE PARENT OF THE SEGAL COMPANY
HEALTH CARE REFORM. Meeting the Needs of Retirees and the Requirements of the New Law
 HEALTH CARE REFORM Meeting the Needs of Retirees and the Requirements of the New Law Thomas M. Morrison, Jr. Senior Vice President Robert D. Mitchell Consultant Copyright 2010 by The Segal Group, Inc.,
REQUEST FOR PROPOSALS - #MDB2018 HEALTH CONSULTING SERVICES
 REQUEST FOR PROPOSALS - #MDB2018 Release Date: January 23, 2018 Proposal Due Date: RFP Administrator: All questions must be e-mailed to the RFP Administrator no later than: Official RFP Notices/Addendums
FIRE & POLICE PENSION PLAN TIER 2 (FORMERLY ARTICLE XVIII)
") FIRE & POLICE PENSION PLAN TIER 2 (FORMERLY ARTICLE XVIII) SUMMARY PLAN DESCRIPTION CITY OF LOS ANGELES Department of Fire and Police Pensions 360 East Second Street, Suite 400 Los Angeles, California
FIRE & POLICE PENSION PLAN TIER 2 (FORMERLY ARTICLE XVIII) SUMMARY PLAN DESCRIPTION CITY OF LOS ANGELES Department of Fire and Police Pensions 360 East Second Street, Suite 400 Los Angeles, California
SUMMARY PLAN DESCRIPTION. A Guide to LACERS Tier 1 Benefits
 SUMMARY PLAN DESCRIPTION A Guide to LACERS Tier 1 Benefits Los Angeles City Employees Retirement System (LACERS) Summary Plan Description Tier 1: For City employees who became Members of LACERS on or
STRATEGIC PLAN
 3 LOS ANGELES FIRE AND POLICE PENSIONS Three-Year 2015-18 STRATEGIC PLAN To Serve Those Who Protect Board of Fire and Police Pension Commissioners Fiscal Year 2015-16 Robert von Voigt President Elected
LOS ANGELES POLICE RELIEF ASSOCIATION, INC. HEALTH CARE BENEFITS ELIGIBILITY BOOKLET FOR ACTIVE MEMBERS
 LOS ANGELES POLICE RELIEF ASSOCIATION, INC. HEALTH CARE BENEFITS ELIGIBILITY BOOKLET FOR ACTIVE MEMBERS Updated as of April 1, 2017 TABLE OF CONTENTS 1. INTRODUCTION... 1 2. ACTIVE MEMBER ELIGIBILITY...
Newsletter for Retired Members of Los Angeles Fire & Police Pensions. General Manager s Message
 February 2011 Newsletter for Retired Members of Los Angeles Fire & Police Pensions General Manager s Message After several months of careful planning and testing, LAFPP has successfully transitioned to
Members of the Joint Labor-Management Benefits Committee
 CITY OF LOS ANGELES JOINT LABOR-MANAGEMENT BENEFITS COMMITTEE Date: June 6, 2013 To: From: Subject: Members of the Joint Labor-Management Benefits Committee Staff FLEX Medical Request for Proposal Results
Tier 3 Chart. Annual compensation earnable during Member s last 36 months or any other Compensation Active Member Benefits Retirement Formulas
 Tier 3 Chart RETIREMENT BENEFITS Type of Plan Defined benefit plan for eligible Members hired on or after February 21, 2016. Member Contribution Members contribute at a rate of 11%. Rate Note: No part
LOS ANGELES COUNTY OTHER POSTEMPLOYMENT BENEFITS PROGRAM ACTUARIAL VALUATION
 LOS ANGELES COUNTY OTHER POSTEMPLOYMENT BENEFITS PROGRAM ACTUARIAL VALUATION July 1, 2014 Prepared By: Robert L. Schmidt, FSA, EA, MAAA Fellow, Society of Actuaries Enrolled Actuary Member, American Academy
HEALTH SERVICE SYSTEM OTHER EMPLOYEE BENEFIT TRUST FUND CITY AND COUNTY OF SAN FRANCISCO. Financial Statements. June 30, 2016 and 2015
 Financial Statements (With Independent Auditors Report Thereon) TABLE OF CONTENTS Page Independent Auditors Report 1 Management s Discussion and Analysis 3 Basic Financial Statements: Statements of Net
Joint Labor-Management Benefits Committee COMMITTEE REPORT 16-03
 Joint Labor-Management Benefits Committee COMMITTEE REPORT 16-03 Date: January 14, 2016 To: From: Subject: Joint Labor-Management Benefits Committee Staff Affordable Care Act 2016 Tax Reporting, Annual
City of Los Angeles Fire and Police Pension Plan
 City of Los Angeles Fire and Police Pension Plan Actuarial Valuation and Review Of Retirement and Other Postemployment Benefits (OPEB) as of June 30, 2017 This report has been prepared at the request of
LOS ANGELES POLICE RELIEF ASSOCIATION, INC. HEALTH CARE BENEFITS ELIGIBILITY BOOKLET FOR RETIRED MEMBERS
 LOS ANGELES POLICE RELIEF ASSOCIATION, INC. HEALTH CARE BENEFITS ELIGIBILITY BOOKLET FOR RETIRED MEMBERS Updated as of April 1, 2017 TABLE OF CONTENTS 1. INTRODUCTION...1 2. RETIRED MEMBER ELIGIBILITY...2
County of Sonoma. Distributed to JLMBC on December 7, 2011
 County of Sonoma Actuarial Valuation and Review of Other Postemployment Benefits (OPEB) as of June 30, 2011 In accordance with GASB Statements No. 43 and No. 45 Copyright 2011 by The Segal Group, Inc.,
January 1, 2015 to December 31, 2015 Plan Benefits, Rates and Contribution
 City Hall, Room 244 1 Dr. Carlton B. Goodlett Place San Francisco, CA 94102 RE: January 1, 2015 to December 31, 2015 Plan Benefits, Rates and Contribution Honorable Members of the : This letter serves
To: Administration and Finance Committee Date: March 26, 2014
 To: Administration and Finance Committee Date: March 26, 2014 From: Kathy Casenave, Director of Finance Reviewed by: SUBJECT: OPEB ACTUARIAL VALUATION Summary of Issues: The Government Accounting Standards
DEPARTMENT OF FIRE AND POLICE PENSIONS 701 E. 3rd Street, Suite 200 Los Angeles, CA (213)
") DEPARTMENT OF FIRE AND POLICE PENSIONS 701 E. 3rd Street, Suite 200 Los Angeles, CA 90013 (213) 279-3000 REPORT TO THE BOARD OF FIRE AND POLICE PENSION COMMISSIONERS DATE: OCTOBER 19, 2017 ITEM: A.1 FROM:
DEPARTMENT OF FIRE AND POLICE PENSIONS 701 E. 3rd Street, Suite 200 Los Angeles, CA 90013 (213) 279-3000 REPORT TO THE BOARD OF FIRE AND POLICE PENSION COMMISSIONERS DATE: OCTOBER 19, 2017 ITEM: A.1 FROM:
City of Los Angeles Department of Water and Power
 City of Los Angeles Department of Water and Power Actuarial Valuation and Review of Other Postemployment Benefits (OPEB) as of June 30, 2017 In accordance with GASB Statement No. 45 This report has been
California Public Employees Retirement System 888 CalPERS 888 Employer Account Management Division
 Employer Account Management Division Dear Member, You are being provided with the background, explanation, and instructions for the Reciprocal Self-Certification Form (PERS-EAMD 801). Reciprocity among
DEPARTMENT OF FIRE AND POLICE PENSIONS 701 E. 3rd Street, Suite 200 Los Angeles, CA (213)
") DEPARTMENT OF FIRE AND POLICE PENSIONS 701 E. 3rd Street, Suite 200 Los Angeles, CA 90013 (213) 279-3000 REPORT TO THE BOARD OF FIRE AND POLICE PENSION COMMISSIONERS DATE: JANUARY 18, 2018 ITEM: A.2 FROM:
DEPARTMENT OF FIRE AND POLICE PENSIONS 701 E. 3rd Street, Suite 200 Los Angeles, CA 90013 (213) 279-3000 REPORT TO THE BOARD OF FIRE AND POLICE PENSION COMMISSIONERS DATE: JANUARY 18, 2018 ITEM: A.2 FROM:
GASB 45 Actuarial Valuation of Postemployment Benefits Other than Pensions for TriMet. As of January 1, Prepared by:
 GASB 45 Actuarial Valuation of Postemployment Benefits Other than Pensions for TriMet As of January 1, 2016 Prepared by: Nina M. Lantz, FSA, EA, MAAA Principal and Consulting Actuary William H. Clark-Shim,
PENSION REFORM: LACERS TIER II. Presented by Miguel A. Santana City Administrative Officer City of Los Angeles September 25, 2012
 PENSION REFORM: LACERS TIER II Presented by Miguel A. Santana City Administrative Officer City of Los Angeles September 25, 2012 City Goals Sustainable Pension Plan Reduce City s Mid and Long Term Budgetary
Health Reform Update. Board of County Commissioners Study Session June 30, 2015
 Health Reform Update Board of County Commissioners Study Session June 30, 2015 Agenda Health Reform Impact Timeline Health Reform Compliance Status Play or Pay Compliance for 2016 2018 Cadillac Tax Update
IMPLEMENTING GASB STATEMENT NO. 75 ACCOUNTING AND FINANCIAL REPORTING FOR POSTEMPLOYMENT BENEFITS OTHER THAN PENSIONS
 IMPLEMENTING GASB STATEMENT NO. 75 ACCOUNTING AND FINANCIAL REPORTING FOR POSTEMPLOYMENT BENEFITS OTHER THAN PENSIONS A CCMA WHITE PAPER FOR CALIFORNIA LOCAL GOVERNMENTS Issued February 2018 PUBLISHED
GASB 45 Actuarial Valuation of Postemployment Benefits Other than Pensions for TriMet. As of January 1, Prepared by:
 GASB 45 Actuarial Valuation of Postemployment Benefits Other than Pensions for TriMet As of January 1, 2014 Prepared by: Nina M. Lantz, ASA, EA, MAAA Principal and Consulting Actuary William H. Clark-Shim,
Los Angeles Unified School District Health & Welfare Benefits Program Update
 Los Angeles Unified School District Health & Welfare Benefits Program Update Presentation to the Committee of the Whole September 25, 2008 David R. Holmquist Chief Operating Officer Gregory Kildare Chief
COUNTY OF SACRAMENTO CALIFORNIA
 COUNTY OF SACRAMENTO CALIFORNIA Attachment VA For the Agenda of: June 6, 2011 To: From: Subject: Supervisorial District(s): Board of Supervisors County Executive Approve The Retiree Medical And Dental
California Public Employees Retirement System 888 CalPERS 888 Employer Account Management Division
 California Public Employees Retirement System P.O. Box 942709 Sacramento, CA 94229-2709 888 CalPERS (or 888-225-7377) TTY: (877) 249-7442 Fax: (916) 795-4166 www.calpers.ca.gov Employer Account Management
Oxnard Union High School District
 GASB Nos. 74 & 75 ACTUARIAL VALUATION Fiscal Year Ending June 30, 2018 (Measured at June 30, 2018) Oxnard Union High School District Nyhart Actuary & Employee Benefits 530 B Street, Ste. 900, San Diego,
Joint Labor-Management Benefits Committee (JLMBC) COMMITTEE REPORT 18-31
 COMMITTEE REPORT 18-31") Joint Labor-Management Benefits Committee (JLMBC) COMMITTEE REPORT 18-31 Date: May 31, 2018 To: From: Subject: Joint Labor-Management Benefits Committee Staff Adoption of LAwell Civilian Benefits Program
Joint Labor-Management Benefits Committee (JLMBC) COMMITTEE REPORT 18-31 Date: May 31, 2018 To: From: Subject: Joint Labor-Management Benefits Committee Staff Adoption of LAwell Civilian Benefits Program
MINUTES OF THE BOARD OF FIRE AND POLICE PENSION COMMISSIONERS MEETING OF JUNE 14,2007
 MINUTES OF THE BOARD OF FIRE AND POLICE PENSION COMMISSIONERS MEETING OF JUNE 14,2007 The Board of Fire and Police Pension Commissioners of the City of Los Angeles met in Room 800, 360 East Second Street,
Retirement Systems 150 Frank H. Ogawa Plaza Oakland, California AGENDA
 All persons wishing to address the Board must complete a speaker's card, stating their name and the agenda item (including "Open Forum") they wish to address. The Board may take action on items not on
Amendment No. 1 to Agreement No for Services to Conduct Annual Audits of Financial Statements and Perform Related Services KPMG LLP
 LA _ Los Angeles "W Department of Fl Water & Power RESOLUTION NO. BOARD LETTER APPROVAL AfLjEFFERY L. PELTOLA ' Chief Financial Officer General Manager DATE: December 20, 2016 SUBJECT: Amendment No. 1
TRANSBAY JOINT POWERS AUTHORITY
 STAFF REPORT FOR CALENDAR ITEM NO. : 12 FOR THE MEETING OF: December 8, 2011 TRANSBAY JOINT POWERS AUTHORITY BRIEF DESCRIPTION: Approve the following resolutions to remove Local Government Services (LGS)
To: Board of Directors Date: April 13, 2016
 To: Board of Directors Date: April 13, 2016 From: Erick Cheung, Director of Finance Reviewed by: SUBJECT: OPEB Actuarial Valuation SUMMMARY OF ISSUES: The Government Accounting Standards Board (GASB) issued
Joint Labor Management Benefits Committee
 Joint Labor-Management Benefits Committee COMMITTEE REPORT 17-03 Date: January 5, 2017 To: From: Subject: Joint Labor Management Benefits Committee Staff Employee Benefits Trust Fund External Auditor Review
Honorable Mayor and Members of the City Council. Submitted by: David Abel, Acting Director of Human Resources
 Office of the City Manager CONSENT CALENDAR January 22, 2013 To: From: Honorable Mayor and Members of the City Council Christine Daniel, City Manager Submitted by: David Abel, Acting Director of Human
County of Sonoma. THE SEGAL GROUP, INC., THE PARENT OF THE SEGAL COMPANY All Rights Reserved
 County of Sonoma Actuarial Valuation and Review of Other Postemployment Benefits (OPEB) as of June 30, 2009 In accordance with GASB Statements No. 43 and No. 45 Copyright 2009 THE SEGAL GROUP, INC., THE
August 31, 2017 PRIVATE
 August 31, 2017 PRIVATE Mr. Doug Smith Vice Chancellor of Administrative Services San Jose/Evergreen Community College District 40 S. Market Street, 6th Floor San Jose, CA 95113-2367 Re: OPEB Actuarial
BOARD OF SUPERVISORS BUSINESS MEETING ACTION ITEM. Resolution for Personal Property Tax Relief (PPTR) for Tax Year 2016
 for Tax Year 2016") BOARD OF SUPERVISORS BUSINESS MEETING ACTION ITEM Date of Meeting: March 1, 2016 #4 SUBJECT: ELECTION DISTRICT: Resolution for Personal Property Tax Relief (PPTR) for Tax Year 2016 Countywide CRITICAL
BOARD OF SUPERVISORS BUSINESS MEETING ACTION ITEM Date of Meeting: March 1, 2016 #4 SUBJECT: ELECTION DISTRICT: Resolution for Personal Property Tax Relief (PPTR) for Tax Year 2016 Countywide CRITICAL
SAN RAFAEL CITY COUNCIL AGENDA REPORT COMPENSATION FOR THE ELECTED CITY CLERK AND ELECTED PART- TIME CITY ATTORNEY
 Agenda Item No: 7.i Meeting Date: June 18, 2018 SAN RAFAEL CITY COUNCIL AGENDA REPORT Department: Human Resources Prepared by: Stacey Peterson, HR Director City Manager Approval: TOPIC: SUBJECT: COMPENSATION
CITY OF SIGNAL HILL Cherry Avenue Signal Hill, CA 90755
 CITY OF SIGNAL HILL 2175 Cherry Avenue Signal Hill, CA 90755 November 20, 2012 AGENDA ITEM TO: FROM: SUBJECT: HONORABLE MAYOR AND MEMBERS OF THE CITY COUNCIL CHARLIE HONEYCUTT DEPUTY CITY MANAGER INTRODUCTION
You are being provided with the background, explanation, and instructions for the Reciprocal Self-Certification Form (PERS-CASD 801).
.") California Public Employees Retirement System P.O. Box 942709 Sacramento, CA 94229-2709 888 CalPERS (or 888-225-7377) TTY: (877) 249-7442 Fax: (916) 795-4166 www.calpers.ca.gov Employer Account Management
California Public Employees Retirement System P.O. Box 942709 Sacramento, CA 94229-2709 888 CalPERS (or 888-225-7377) TTY: (877) 249-7442 Fax: (916) 795-4166 www.calpers.ca.gov Employer Account Management
CITY OF ST. CLAIR SHORES RETIREE HEALTH CARE PLANS
 CITY OF ST. CLAIR SHORES RETIREE HEALTH CARE PLANS ACTUARIAL VALUATION REPORT AS OF JUNE 30, 2016 TABLE OF CONTENTS Section A B C D E Page Number -- 1-2 1 2-4 1-2 1-9 1-2 3-4 1 2-6 7 8-12 13 Cover Letter
Los Angeles County Employees Retirement Association
 Milliman Actuarial Valuation Los Angeles County Employees Retirement Association 2016 Investigation of Experience for Retirement Benefit Assumptions December 2016 Board Meeting Prepared by: Mark C. Olleman,
September 10, 2015 PRIVATE
 530 B Street, Suite 900 San Diego, CA 92101-8002 (p) 619-239-0831 (f ) 619-239-0807 www.nyhart.com September 10, 2015 PRIVATE Mr. Doug Smith Vice Chancellor of Administrative Services San Jose/Evergreen
Honorable Mayor and Members of the City Council. Submitted by: David W. Hodgkins, Director of Human Resources
 Office of the City Manager To: From: Honorable Mayor and Members of the City Council Christine Daniel, City Manager Submitted by: David W. Hodgkins, Director of Human Resources Subject: Health Plan Rate
San Francisco Health Service System
 San Francisco Health Service System Health Service Board Rates & Benefits Kaiser Permanente Senior Advantage HMO Plan Renewal for Medicare Retirees June 11, 2015 Prepared by: Aon Hewitt Health & Benefits
Postemployment Health Insurance -- Sensitivity Tests Sensitivity Analysis RETIREE PREMIUM RATE DEVELOPMENT
 CITY OF TYLER RETIREE HEALTH CARE PLAN ACTUARIAL VALUATION REPORT AS OF DECEMBER 31, 2011 TABLE OF CONTENTS Section A B C D E F G Page Number -- 1-2 1-2 3 4-5 6 7 1 2 3 1 2-3 1-2 1-4 1 2 1 2-10 11-13 Cover
JlH. fli^. fri. tfe. ! i I rati Inti. fife c. SS oe:d MICHAEL N. FEUER CITY ATTORNEY REPORT RE:
 mu JlH m m 5 s a A* fi aa a 11111 i? fli^. fri tfe. «s w- P 'J 7 ^ A i! i I rati Inti fife Vv c m V w b>' SS oe:d MICHAEL N. FEUER CITY ATTORNEY REPORT RE: REPORT NO. R 1 5-0 3 0 4 DEC 4 2015 DRAFT ORDINANCE
California Public Employees Pension Reform Act of 2013 ( PEPRA ) FREQUENTLY ASKED QUESTIONS
 FREQUENTLY ASKED QUESTIONS") California Public Employees Pension Reform Act of 2013 ( PEPRA ) FREQUENTLY ASKED QUESTIONS Recent news about the enactment of new pension laws as a result of the California Public Employees Pension Reform
California Public Employees Pension Reform Act of 2013 ( PEPRA ) FREQUENTLY ASKED QUESTIONS Recent news about the enactment of new pension laws as a result of the California Public Employees Pension Reform
PUBLIC NOTICE. Valley International Preparatory High School Board of Directors Special Board Meeting Wednesday, September 12, 2018 at 6:45 PM
 PUBLIC NOTICE Valley International Preparatory High School Board of Directors Special Board Meeting Wednesday, September 12, 2018 at 6:45 PM LOCATION Congregational Church of the Chimes 14115 Magnolia
The Water and Power Employees Retirement Plan of the City of Los Angeles
 The Water and Power Employees Retirement Plan of the City of Los Angeles Governmental Accounting Standards (GAS) 74 Actuarial Valuation for the Death Benefit Fund as of June 30, 2017 Family Death Benefit
MINUTES OF THE BOARD OF FIRE AND POLICE PENSION COMMISSIONERS SPECIAL BOARD MEETING OF DECEMBER 19, 2017
 MINUTES OF THE BOARD OF FIRE AND POLICE PENSION COMMISSIONERS SPECIAL BOARD MEETING OF DECEMBER 19, 2017 The Board of Fire and Police Pension Commissioners of the City of Los Angeles met in the LAFPP Sam
LETTER OF AGREEMENT BETWEEN GLADWIN COUNTY and POLICE OFFICERS ASSOCIATION OF MICHIGAN DEPUTIES UNIT
 LETTER OF AGREEMENT BETWEEN GLADWIN COUNTY and POLICE OFFICERS ASSOCIATION OF MICHIGAN DEPUTIES UNIT This Amendment Agreement is made and entered into this day of, 2010, between the County of Gladwin ("Employer")
AGENDA EBMUD EMPLOYEES RETIREMENT SYSTEM January 17, 2013 Training Resource Center (TRC1) 8:30 a.m.
 8:30 a.m.") AGENDA EBMUD EMPLOYEES RETIREMENT SYSTEM January 17, 2013 Training Resource Center (TRC1) 8:30 a.m. ROLL CALL: PUBLIC COMMENT: The Retirement Board is limited by State Law to providing a brief response,
AGENDA EBMUD EMPLOYEES RETIREMENT SYSTEM January 17, 2013 Training Resource Center (TRC1) 8:30 a.m. ROLL CALL: PUBLIC COMMENT: The Retirement Board is limited by State Law to providing a brief response,
General Manager s Message
 pension perspectives ACTIVE/DROP Member Newsletter General Manager s Message It has now been two years since I was appointed General Manager for LAFPP. I am very proud of and thankful for all of staff
ARTICLE 20. EMPLOYEE BENEFITS
 ARTICLE 20. EMPLOYEE BENEFITS 20A. Group Insurance Benefits for Eligible Unit Members 20A.1 Group Plan Coverage The District shall provide all eligible¹ Contract, Regular and Temporary unit members and
SAN RAFAEL CITY COUNCIL AGENDA REPORT COMPENSATION FOR THE ELECTED CITY CLERK AND ELECTED PART-TIME CITY ATTORNEY
 Agenda Item No: 6.e Meeting Date: September 19, 2016 Department: Management Services SAN RAFAEL CITY COUNCIL AGENDA REPORT Prepared by: Stacey Peterson, HR Director City Manager Approval: TOPIC: SUBJECT:
CITY OF CHICAGO. Retiree Health Plan Review Preliminary Projections
 CITY OF CHICAGO Retiree Health Plan Review Preliminary Projections May 13, 2011 Disclosure The information presented in this highlights summary was prepared to assist the Retiree Health Benefit Commission
PRIVATE. August 7, Ms. Katie White Director of Fiscal Services MiraCosta Community College (MS #6) One Barnard Drive Oceanside, CA 92056
 One Barnard Drive Oceanside, CA 92056") 530 B Street, Suite 900 San Diego, CA 92101-4404 (p) 619-239-0831 (f ) 619-239-0807 www.nyhart.com August 7, 2015 PRIVATE Ms. Katie White Director of Fiscal Services MiraCosta Community College (MS #6)
530 B Street, Suite 900 San Diego, CA 92101-4404 (p) 619-239-0831 (f ) 619-239-0807 www.nyhart.com August 7, 2015 PRIVATE Ms. Katie White Director of Fiscal Services MiraCosta Community College (MS #6)
VENTURA COUNTY EMPLOYEES RETIREMENT ASSOCIATION (VCERA) REQUEST FOR PROPOSAL FOR ACTUARIAL AUDIT SERVICES
 REQUEST FOR PROPOSAL FOR ACTUARIAL AUDIT SERVICES") VENTURA COUNTY EMPLOYEES RETIREMENT ASSOCIATION (VCERA) REQUEST FOR PROPOSAL FOR ACTUARIAL AUDIT SERVICES Issued April 3, 2017 PROPOSAL SUBMISSION DEADLINE: May 5, 2017 Ventura County Employees Retirement
VENTURA COUNTY EMPLOYEES RETIREMENT ASSOCIATION (VCERA) REQUEST FOR PROPOSAL FOR ACTUARIAL AUDIT SERVICES Issued April 3, 2017 PROPOSAL SUBMISSION DEADLINE: May 5, 2017 Ventura County Employees Retirement
Proposed New Tiers of Benefit for New Entrants Based on Proposals from the City (Pension Plan and Retiree Medical Plan) Copyright 2011
 Copyright 2011") LOS ANGELES CITY EMPLOYEES RETIREMENT SYSTEM Proposed New Tiers of Benefit for New Entrants Based on Proposals from the City (Pension Plan and Retiree Medical Plan) Copyright 2011 THE SEGAL COMPANY, INC.
LOS ANGELES CITY EMPLOYEES RETIREMENT SYSTEM Proposed New Tiers of Benefit for New Entrants Based on Proposals from the City (Pension Plan and Retiree Medical Plan) Copyright 2011 THE SEGAL COMPANY, INC.
BOARD OF TRUSTEES Agenda Item Description
 BOARD OF TRUSTEES Agenda Item Description BOARD MEETING DATE: 5/12/2016 SUBJECT: Acceptance of Napa Valley Community College District Governmental Accounting Standards Board (GASB) Actuarial Valuation
AGENDA ITEM 1 I Consent Item. California Employer s Retiree Benefit Trust Program (CERBT) funding for Other Post-Employment Benefits Funding (OPEB)
 funding for Other Post-Employment Benefits Funding (OPEB)") AGENDA ITEM 1 I Consent Item MEMORANDUM DATE: March 1, 2018 TO: FROM: SUBJECT: El Dorado County Transit Authority Julie Petersen, Finance Manager California Employer s Retiree Benefit Trust Program (CERBT)
AGENDA ITEM 1 I Consent Item MEMORANDUM DATE: March 1, 2018 TO: FROM: SUBJECT: El Dorado County Transit Authority Julie Petersen, Finance Manager California Employer s Retiree Benefit Trust Program (CERBT)
MEMORANDUM. Current Plan (For eligible retirees hired prior to 1/1/2009 and retired prior to 7/1/2016)
") 100 Montgomery Street Suite 500 San Francisco, CA 94104-4308 T 415.263.8200 www.segalco.com MEMORANDUM To: From: Marcia Chadbourne County of Sonoma Dave Bergerson, FCA, ASA, MAAA Thomas Bergman, ASA, MAAA
100 Montgomery Street Suite 500 San Francisco, CA 94104-4308 T 415.263.8200 www.segalco.com MEMORANDUM To: From: Marcia Chadbourne County of Sonoma Dave Bergerson, FCA, ASA, MAAA Thomas Bergman, ASA, MAAA
Alameda County Employees Retirement Association
 Alameda County Employees Retirement Association Governmental Accounting Standards Board (GASB) 74 Actuarial Valuation and Review of the Benefits Provided by the Supplemental Retiree Benefits Reserve Other
ORANGE COUNTY EMPLOYEES RETIREMENT SYSTEM MEMORANDUM. DATE: June 3, Audit Oversight Committee Members
 ORANGE COUNTY EMPLOYEES RETIREMENT SYSTEM MEMORANDUM DATE: June 3, 2015 TO: FROM: SUBJECT: Audit Oversight Committee Members Brenda Shott, Assistant CEO, Finance and Internal Operations Tracy Bowman, Director
Postemployment Health Insurance -- Sensitivity Tests Sensitivity Analysis RETIREE PREMIUM RATE DEVELOPMENT
 CITY OF TYLER RETIREE HEALTH CARE PLAN ACTUARIAL VALUATION REPORT AS OF DECEMBER 31, 2013 TABLE OF CONTENTS Section A B C D E F G Page Number -- 1-2 1 2 3-4 5 6 1 2 1 2 1-2 1-4 1 2 Cover Letter EXECUTIVE
Postemployment Benefits Other Than Pension Actuarial Valuation July 1, September 2008
 Postemployment Benefits Other Than Pension Actuarial Valuation July 1, 2007 September 2008 Submitted by: Aon Consulting 270 Davidson Avenue Somerset, NJ 08873 Mr. Frederick J. Beaver Director State of
Supporting Documentation Dependent Verification
 Supporting Documentation Dependent Verification CalPERS is required under the Affordable Care Act (ACA) to report to the IRS who is enrolled in their health plans. As such, CalPERS requires the employer
CITY OF ALBANY CITY COUNCIL AGENDA STAFF REPORT
 CITY OF ALBANY CITY COUNCIL AGENDA STAFF REPORT Agenda Date: January 21, 2014 Reviewed by: PL SUBJECT: REPORT BY: Presentation of Survey Results Requested By City Council - Council Salary and Benefits
Reducing Pension And Retiree Health Benefit Costs
 Reducing Pension And Retiree Health Benefit Costs Thursday, October 1, 2015 General Session; 4:15 5:30 p.m. Jack W. Hughes, Liebert Cassidy Whitmore DISCLAIMER: These materials are not offered as or intended
Alameda County Employees Retirement Association
 Alameda County Employees Retirement Association GASB Statement No. 43 (OPEB) and non-opeb Actuarial Valuation of the Benefits Provided by the Supplemental Retiree, Including Sufficiency of Funds, as of
New Mexico Retiree Health Care Authority
 New Mexico Retiree Health Care Authority Actuarial Valuation and Review of Other Postemployment Benefits (OPEB) as of June 30, 2016 In accordance with GASB Statement No. 43 This report has been prepared
Proposed New Tier of Benefit for New Entrants Based on Union Proposal (Pension Plan and Retiree Medical Plan) Copyright 2011
 Copyright 2011") LOS ANGELES CITY EMPLOYEES RETIREMENT SYSTEM Proposed New Tier of Benefit for New Entrants Based on Union Proposal (Pension Plan and Retiree Medical Plan) Copyright 2011 THE SEGAL COMPANY, INC. THE PARENT
LOS ANGELES CITY EMPLOYEES RETIREMENT SYSTEM Proposed New Tier of Benefit for New Entrants Based on Union Proposal (Pension Plan and Retiree Medical Plan) Copyright 2011 THE SEGAL COMPANY, INC. THE PARENT
CITY OF LOS ANGELES JOINT LABOR-MANAGEMENT BENEFITS COMMITTEE
 CITY OF LOS ANGELES JOINT LABOR-MANAGEMENT BENEFITS COMMITTEE PROPOSED MINUTES SPECIAL MEETING MAY 23, 2017 9:00 A.M. CITY HALL, 200 NORTH SPRING STREET, ROOM 1050 Present: Committee Members Regular: Wendy
RULES AND REGULATIONS IMPLEMENTING THE EQUAL BENEFITS ORDINANCE
 CITY OF LOS ANGELES RULES AND REGULATIONS IMPLEMENTING THE EQUAL BENEFITS ORDINANCE EFFECTIVE JUNE 27, 2016 Department of Public Works Bureau of Contract Administration Office of Contract Compliance 1149
THE AFFORDABLE CARE ACT: 2014 AND BEYOND
 THE AFFORDABLE CARE ACT: 2014 AND BEYOND October 28, 2013 Howard Van Mersbergen, Vice President of Employee Benefits, Christian Schools International Julie Sessions, Principal, Mercer Patient Protection
REQUEST FOR PROPOSALS FOR PROFESSIONAL AUDITING SERVICES. Submission Deadline JANUARY 1, 2018
 ` REQUEST FOR PROPOSALS FOR PROFESSIONAL AUDITING SERVICES Submission Deadline JANUARY 1, 2018 City of Pine City 315 Main St S., Ste 100 Pine City, Minnesota 55063 Matthew Van Steenwyk, City Treasurer
Ross Valley Fire Department
 Ross Valley Fire Department Actuarial Valuation of Other Post-Employment Benefit Programs as of July 1, 2011 July 2012 800.541.4591 www.brsrisk.com Table of Contents A. Executive Summary... 1 B. Requirements
Scott G. Miller, City of Beverly Hills Chief Financial Officer / Director Administrative Services
 Scott G. Miller, City of Beverly Hills Chief Financial Officer / Director Administrative Services 1 Implement Short, Mid and Long-Term Structural Changes to Reduce Employee Benefit Costs 2 Program 1: Tied
Report to Board of Administration
 Report to Board of Administration Agenda of: JULY 11, 2017 From: Thomas Moutes, General Manager ITEM: III-A SUBJECT: ECONOMIC ASSUMPTIONS REVIEW AND POSSIBLE BOARD ACTION Recommendations: That the Board
March 11, Ms. Kim McCord Executive Director, Fiscal Services South Orange County CCD Marguerite Parkway Mission Viejo, CA 92692
 Page 1 of 26 450 B Street, Suite 750 San Diego, CA 92101-8002 (p) 619-239-0831 (f ) 619-239-0807 www.nyhart.com March 11, 2015 Ms. Kim McCord Executive Director, Fiscal Services South Orange County CCD
Los Angeles County Employees Retirement Association. ACTUARIAL VALUATION June 30, 2003
 ACTUARIAL VALUATION June 30, 2003 By Karen I. Steffen Fellow, Society of Actuaries Member, American Academy of Actuaries and Nick J. Collier Associate, Society of Actuaries Member, American Academy of
The Water and Power Employees Retirement Plan of the City of Los Angeles ACTUARIAL EXPERIENCE STUDY
 The Water and Power Employees Retirement Plan of the City of Los Angeles ACTUARIAL EXPERIENCE STUDY Analysis of Actuarial Experience During the Period July 1, 2012 through June 30, 2015 Copyright 2016
SAN FRANCISCO CITY AND COUNTY EMPLOYEES RETIREMENT SYSTEM
 SAN FRANCISCO CITY AND COUNTY EMPLOYEES RETIREMENT SYSTEM Financial Statements and Required Supplementary Information (With Independent Auditor s Report Thereon) SAN FRANCISCO CITY AND COUNTY EMPLOYEES