Statistics Sierra Leone
|
|
|
- Reynard Patterson
- 5 years ago
- Views:
Transcription
1 Statistics Sierra Leone SEPTEMBER, 2013
2 Page Table of Contents.... List of Tables.... List of Figures.. Acknowledgements.... Executive Summary.... i iii iii iv v Background Aims and Objectives Justification Questionnaires Data Collection Sample Achieved Data Processing Basic General Information of Respondents Region/Locality Distribution of Charcoal Establishments Sex of Respondents Age of Respondents Religion of Respondents Marital Status Nationality of Respondents Educational Level Main Source of Income Charcoal Business Information Ownership Status Length of time in the Business Persons Engaged in Charcoal Business Financial Resources of Charcoal Businesses Price and Weight in kg per bag of charcoal Bags Sold Revenue and Expenditure
3 2.5 Loans and Savings Source of Loan Amount and Repayment of Loan Why not obtain Loans Savings Financial Assistance
4 Table Age of Respondents by Data Collection City.. 7 Table Number of Persons Engaged by Region. 13 Table Quantity Sold.. 14 Table Price and Weight in kg per bag of charcoal 14 Table Revenue and Expenditure in Million of Leones 15 Page Figure 1.1 Source of Energy For Cooking by year and Locality 2 Figure Distribution of Charcoal Establishments by Region.. 6 Figure Sex of Respondents by Data Collection Center 7 Figure Religion of Respondent by Region Figure Marital Status Figure Nationality of Respondents... 9 Figure Educational Level of Respondents.. 9 Figure Main Source of Income Figure 2.2.1a Self-Ownership.. 11 Figure 2.2.1b Other Ownership Figure 2.2.2a Year of Commencement of Operations. 12 Figure 2.2.2b Length of Experience of Respondents. 12 Figure Percentage Distribution of Persons Engaged by Region 13 Figure 2.5.1a Obtained Loans Figure 2.5.1b Source of Loans.. 16 Figure Amount and Repayment of Loan 17 Figure Why not obtain Loans. 17 Figure Have Savings with OSUSU Group 18 Figure Amount of Savings. 18 Figure Savings Outside OSUSU Group and Access to such Savings. 19 Figure Received Financial Assistance.. 19 Figure Expected Role of the Government... 20
5 This Charcoal Survey is the first to be conducted by Statistics Sierra Leone (SSL) so as to obtain pertinent information on charcoal sales, employment and other information in the country. Charcoal form part of the major source of energy for cooking in many urban households. The charcoal product is part of the forestry output included in the computation of the gross domestic product (GDP), which is a key development indicator used to assess the performance of the economy. This was conducted under the Statistics Act 2002, which makes it mandatory for all business establishments operating in Sierra Leone to respond to Statistics Sierra Leone s data requests. The Act also stipulates that the content of individual returns received would be kept confidential and used only for statistical purposes. The aim of this charcoal survey is to provide basic statistics (such as price, ownership status, employment, and expenditures) of charcoal businesses operating in the urban cities. This survey report has been compiled by a dedicated Team of Statisticians and data collectors and supervisors under my Supervision. SSL Management therefore acknowledges the immense contribution which the following people made towards the conduct of the survey: Abu Bakarr Turay, Director of Economic Statistics Division; Isata M. Allieu-Keikura, Statistician, Agriculture Statistics Section and Martha K. Koroma, Assistant Statistician, Agriculture Statistics, Statistics Sierra Leone (SSL) We also wish to thank our Data Collectors, Supervisors and our valued respondents who took part in the data collection exercise. We are also grateful to Government for funding this exercise. Finally, we thank God for everything we have been able to accomplish with this survey. Mohamed King Koroma Statistician General
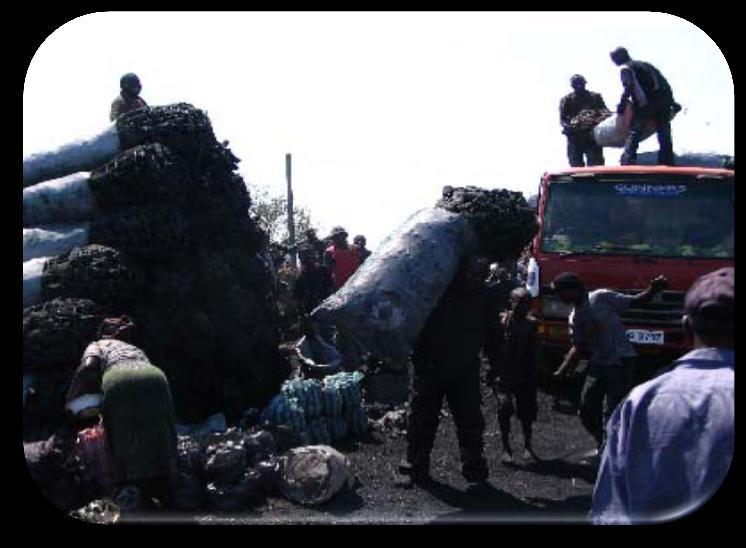
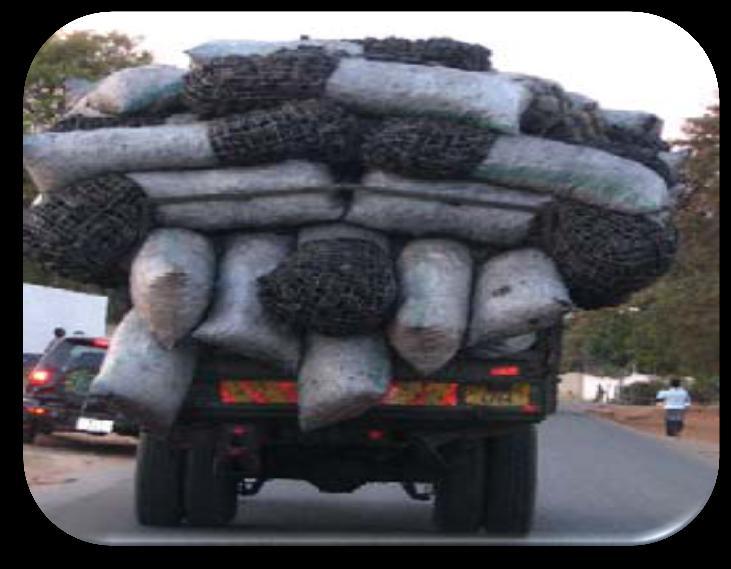
6 Many surveys and even the 2004 Population and Housing census have revealed that the majority of Sierra Leonean households depend on traditional fuels (charcoal /fuel wood) to meet their daily energy needs for cooking and kerosene for lighting for many decades. After the civil war, which ended in 2002, people in the rural area have engaged in extensive charcoal and fuel wood production in response to the increasing demand in the urban centers. Today, there is no district among the 12 districts of the country, where charcoal production is not a lucrative business. At the National level, 87 percent and 7 percent of the households use wood and charcoal respectively as the principal sources of energy for cooking in The pattern of fuel use for cooking is similar at the provincial and district levels. Between the 1985 and 2004 censuses, there were insignificant drops in the uses of Kerosene and Electricity for cooking at national level. However, charcoal use increased from 1 percent in 1985 to 7 percent in By locality, the proportion of households using charcoal as a sources of fuel for cooking increased from 0.9 percent in 1985 to 9% in 2004 in the rural area, whereas in the urban areas, the proportion of households using charcoal as a main source energy for cooking increase significantly from 3.5% in 1985 to 34.2% in This significant increase in the use of charcoal in the urban areas as main energy source for cooking coincided with a decline in the generation and supply of electricity in the country. These statistics show that charcoal and fuel wood constitute an important component of energy production and consumption in the country. However, a major gap in the monitoring of the contribution of these products to the gross domestic product (GDP) is the absence of comprehensive data on them. Although the production of such items is on the increase, especially as economic activities expand, in mining and other sectors of the economy, data is at best scanty and in most cases not available at all. This survey therefore collects basic information on the sale of these commodities in the urban cities of Freetown, Bo, Kenema and Makeni that guides policy to direct and control charcoal production and consummating in the country. Such information is useful to policy maker as they look for possible ways of expanding sources of energy for households. This Charcoal survey targeted a sample size of 135 charcoal selling centers selected from a list of 431 charcoal centers in the country. The survey was a nationwide survey, covering the regional cities of Freetown, Bo, Kenema and Makeni. This was conducted under the Statistics Act 2002, which makes it mandatory for all business establishments operating in Sierra Leone to respond to Statistics Sierra Leone s data requests. The Act also stipulates
7 that the content of individual returns received would be kept confidential and used only for statistical purposes. An invitation letter signed by the Statistician General of SSL was enclosed with all questionnaires to encourage business owners/executives to provide the relevant data relating to their businesses and to assure them of the confidentiality of the data collected. The survey was designed such that Charcoal Establishments were visited several times so as to get the requested data from these establishments. Out of the targeted 135 charcoal establishments, 120 (88.9%) charcoal establishments were successfully interviewed. The non-responses (11.1%) were largely due to delay in retrieving the questionnaires as well as outright refusal to provide the relevant information. This charcoal survey covered only the sales aspect of the charcoal production; it did not therefore include actual production of charcoal that is going on all over the country as such an activity would usually be covered in a household-based survey. The survey covered only charcoal businesses operating the regional cities of Freetown, Bo, Kenema and Makeni. The district and other urban towns were not covered. The data is therefore representative at national and regional levels and not at district level That 88.4% of respondents were females, which means that only 11.6% were male respondents for this survey. That majority of persons in the charcoal business (96.2%) are Sierra Leoneans, compared with only 3.9% that are Foreign Nationals. This means that Sierra Leoneans are mainly in control of the charcoal trade in the country-from the production, transportation, distribution and sale of charcoal all around the country. That 61.9% of persons in the charcoal business have never being to school, followed by 22.0% with primary education level and 14.5% with secondary education level. This means that charcoal business is an important source of income for those who never went to school in this country, as 80.5% of them believe that charcoal business is the main source of income;
8 That 88.9% of respondents owned their charcoal businesses; of 11.1% (48 persons) who indicated that they were not owners of the business, 51.8% of such businesses were owned by the neighbours, 20.6% were owned by the parents or guardian while 27.6% were owned by other persons including brothers/sisters and friends. That about 821 persons were engaged in charcoal business in the regional cities of Western Area (Freetown), Southern Region (Bo), Eastern Region (Kenema) and Northern Region (Makeni). Out of this number, 79.7% were women, while 66.1% were children below 18 years of age. This underlines the important contribution of women and children to household income around the country. That the average price per bag (rice bag) is lower in the Eastern Region (Le 10,200 per bag) than any of the other regions; the average price is highest in the Western Area (Le 18,993 per bag), followed by Northern Region (Le 14,500 per bag) and the Southern Region (Le 13,700 per bag). That a rice bag of charcoal is heavier in the Northern Region weighing 27kg compared with 20kg in the Eastern region and Western Area and 22kg at the National Level. That the charcoal trade generated an average of Le 22,990 million in 2012 as income, compared with Le 13,876 million expended in the same period; this means that there is an annual operating profit of Le 9,114 million; the data also shows the East spends only 24.4% of their revenue to cover the cost of supplying the charcoal to the local market, compared with 65.9% of revenue spent in the Western Area. That only 49 (11.4%) of Charcoal Businesses obtained loan from any sources in the past 12 months; and that only 6.1% of the 49 Charcoal Businesses that have obtained loans, have obtained loans from formal banks in the last in the past 12 months. That charcoal business that did not obtain loan from any source pointed out they did not obtain loan because they thought that the interest rate was too high (31.9%); while 10.7% pointed out the normal problem of lack of collateral to secure the loan. That 47.2% of respondents have savings accrued from charcoal business; this means that more than half 52.8% do not have savings at all, which underlines the hand-to-
9 mouth nature of charcoal business in the country; and that 65% of those respondents who have savings saved less than Le 500,000; while only 2.5% have saved Le 3,000,000 or more. Charcoal production is still done at the household, informal level; as a result there is no regulatory framework in place to regulate charcoal production, distribution and sales in the country, which is affecting the environmental aspect of our economy. There is therefore need to establish a legal regulatory framework spelling out the coordination mechanism among various stakeholders in the charcoal industry. There is also need to support charcoal businesses as part of the small-and-medium scale enterprise development in the country since such business have been found to be an important source of income to many households. There is need to extend the charcoal survey to cover district and other big urban settlements in the country.
10 This section contains the background, objectives, justification and data collection and processing procedures of the survey Sierra Leone has suffered many years of bad governance and corruption; which resulted into low growth and widespread poverty, especially among the rural populations in the country. The situation was exacerbated by the 10-year civil conflict which destroyed both economic and social infrastructures in the country. This in turn affected the ability of the state to provide basic services to the population, a situation that continued till the end of the war in The Sierra Leone economy is recording significant progress since the end of the war in 2002, which is measured by the impressive gross domestic product (GDP) figures reported by Statistics Sierra Leone. With a population of a little over 5 million and with huge deposits of minerals, Sierra Leone is country of great potentials for growth and development. The economic activities measured by the country s Gross Domestic product (GDP) have been expanding since 2002 with an average growth rate 6.0 recorded between 2002 and 2012 due mainly to progress made in the Agriculture sector over the years. The discovery and commencement of mining of iron ore in the North, has added new impetus to the government development effort as the economy is projected to grow by 51% in real terms in 2012 on account of the exports of this ore starting with The Sierra Leone Government adapted decentralization in 2004 as a strategy of reaching out to the many rural populations with services such as health, education, electricity and water supply, and many other amenities. Electricity supply has notably been a major problem for both urban and rural populations in the country and it has taken the government many years to provide such a key amenity to the people. The absence of the electricity from the national grid, the population turned to many sauces of energy for cooking and lighting in their various homes. Surveys after surveys have revealed that the majority of Sierra Leonean households depend on traditional fuels (charcoal /fuel wood) to meet their daily energy needs for cooking and kerosene for lighting for many decades. After the civil war, which ended in 2002, people in the rural area have engaged in extensive charcoal and fuel wood production in response to the increasing demand in the urban centers. Today,
11 Percent (%) there is no district among the 12 districts of the country, where charcoal production is not a lucrative business. Charcoal/fuel wood are potentially renewable forest products and are commonly called the poor man s fuel. It is also a vital energy source for the urban poor and occupies one of the largest industries. Charcoal/fuel wood Low-income households have a higher per capita income. Charcoal/fuel wood accounts of about three-quarters of the total household energy expenditure, in Sierra Leone. Nevertheless electricity is the main source of energy among more affluent households (those in low and medium-density areas); but these households also use charcoal in significant amounts: the difference in expenditure on charcoal/ fuel wood between low-income and high-income household s is indeed very small, It s greatest use is for home and outdoor recreational cooking Rural Urban Charcoal Firewood Year and Energy Source for Cooking Source: 2004 Population and Housing Census-Housing Monograph The energy sources available in Sierra Leone are electricity, gas, kerosene, charcoal and wood. At the National level, 87% and 7% of the households use wood and charcoal respectively as the principal sources of energy for cooking in The pattern of fuel use for cooking is similar at the provincial and district levels. Between the 1985 and 2004 censuses, there were insignificant drops in the uses of Kerosene and Electricity for cooking at national level. However, charcoal use increased from 1% in 1985 to 7% in By locality, Figure 1 shows that the proportion of households using charcoal as a source of fuel for cooking increased from 0.9% in 1985 to 9% in 2004 in the rural area, whereas in the urban areas, the proportion of households using charcoal as a main source energy for cooking increase significantly from 3.5% in 1985 to 34.2% in This significant increase in the use of charcoal in the urban areas as main energy source for cooking coincided with a decline in the generation and supply of electricity in the country.
12 The main vegetation cover used by the households to produce charcoal in the study countries is obtained from miombo woodlands, which are dry tropical woodlands. The harvesting of miombo woodlands and other forest vegetation types is essential for the livelihood of the rural dwellers (employment, income, consumption goods and services). The harvesting is stimulated by the purchasing power of urban dwellers. This can be seen in the growth in fuel, wood and charcoal consumption substituting electricity and gas as alternative sources of energy, and the increased use of wood based products for building houses. The major consequence charcoal production has is deforestation, which in turn leads to soil erosion, which constitutes an environmental threat in the country and many other sources of livelihood and human counties. The aim of this exercise will provide basic statistics (such as price, ownership status, employment, and expenditures) of charcoal business operating in the urban cities. Specific objectives include: To obtain basic statistics such as ownership status, age of respondents and educational level of respondents in the charcoal business; To determine the scale and economic value of the charcoal industry in urban cities; Quantify the employment contribution of charcoal businesses in the country; To identify the sources of loans and amount of savings that accrue from charcoal businesses. One of the targets of the Millennium Development Goals (MDG) target 9 indicators is to reduce the proportion of population using solid fuel. In Sierra Leone, according to the 2004 Population and Housing Census Report, most households use wood (88%), charcoal (7%) and kerosene 4% for cooking. The pattern of distribution is similar in the regions except for Western Area where 30% of households use charcoal and 15% use kerosene, nationwide. At the urban/rural level, 74% of households in the urban and 97% of households in the rural use wood. However,
13 another 16% and 8% use charcoal and kerosene respectively in the urban area. Solid fuel comprises wood and charcoal in this analysis; hence most Sierra Leoneans (96%) use solid fuel for cooking. These statistics show that charcoal and fuel wood constitute an important component of energy production and consumption in the country. However, a major gap in the monitoring of the contribution of these products to the gross domestic product (GDP) is the absence of comprehensive data on them. Although the production of such items is on the increase, especially as economic activities expand, in mining and other sectors of the economy, data is at best scanty and in most cases not available at all. This survey therefore collects basic information on the sale of these commodities in the urban cities of Freetown, Bo, Kenema and Makeni that guides policy to direct and control charcoal production and consummating in the country. Such information is useful to policy maker as they look for possible ways of expanding sources of energy for households. The questionnaire was developed through a consultative process, wherein stakeholders were invited to make meaningful input to the proposed questions designed to capture employment information. Some form of pre-testing was done in order to finalize the instrument. A structure questionnaire was used to train Data Collectors to collect the information from retailers of charcoal and fuel wood in the data collection centers all over the country. The questionnaire captured information such as: Basic characteristics of the business and the business owners; Characteristics of workers of the business; Income and expenditure of the business; Savings and loans of charcoal businesses. The Charcoal survey targeted a sample size of 135 charcoal selling centers selected from a list of 431 charcoal centers in the country. The survey was a nationwide survey, covering the regional cities of Freetown, Bo, Kenema and Makeni. This was conducted under the Statistics Act 2002, which makes it mandatory for all business
14 establishments operating in Sierra Leone to respond to Statistics Sierra Leone s data requests. The Act also stipulates that the content of individual returns received would be kept confidential and used only for statistical purposes. An invitation letter signed by the Statistician General of SSL was enclosed with all questionnaires to encourage business owners/executives to provide the relevant data relating to their businesses and to assure them of the confidentiality of the data collected. Training of enumerators was conducted for two days; and total number of 43 Data collectors and 3 supervisors were recruited and trained for the data collection exercise. The survey was designed such that Charcoal Establishments were visited several times so as to get the requested data from these establishments. The Coordinators of the Survey monitored the data collection exercise on a daily basis in Freetown as well as in the Provinces through telephone and other means to assist Enumerators to do their work effectively and diligently. In addition, visits were made to some establishments in Freetown and in the Provinces to validate the data collected in each of these centers. Out of the targeted 135 charcoal establishments, 120 (88.9%) charcoal establishments were successfully interviewed. The non-responses (11.1%) were largely due to delay in retrieving the questionnaires as well as outright refusal to provide the relevant information. Data capturing for the Charcoal Survey started immediately the data collection was completed in June Data entry was done within five days after the data collection. The employment data entry centre was centralized at the Statistics Sierra Leone Office headquarters and the information in completed questionnaires was manually scrutinized, edited and coded before sending them for entry. Computer editing was also done as a way of validating the data as the software provided automatic data checks for acceptable values for the variables and checks between different components of the questionnaires.
15 Percent (%) This section presents and analyses the data obtained from the charcoal survey. This section presents the findings of the survey and highlights key issues for policy formulation. The survey collected general information on the individuals and/or establishments operating in charcoal businesses in the country. The information collected rages from name and locality of business, registration status as well as organization status of the establishments canvassed in the survey, sex of respondents, age, ethnicity and marital status of respondents. The survey collected information from the regional cities of Freetown in the Western Area, Bo (in the Southern Region), Makeni (in the Northern Region), and Kenema (in the Eastern Region); and the distribution is shown in Figure Eastern Northern Southern Western Area Region The data in Figure shows that majority of charcoal selling centers (57.3%) are in Western Area, followed by the Northern Region with 16.9% and Southern Region 13.5%. This shows that Freetown, the capital city has the largest market for charcoal since it is the largest single urban settlement in the country.
16 Percent (%) The charcoal survey collected data on the sex of respondents and the responses are shown in Figure Kenema Makeni Bo Freetown National Data Collection City Male Female The results in Figure show that 88.4% of respondents were females, which means that only 11.6% were male respondents for this survey. At data collection city level, no male respondent was interviewed in Bo, while only 6.8% of the respondents in Makeni were males and 8.1% of respondents were males in Freetown. However about half (47.2%) of respondents in Kenema were males. In general, females more females were involved in charcoal trading than males in all the data collection cities. The survey collected data on the age of respondents measured as age in completed years, and the result is shown in Table Data Collection City Minimum Mean Maximum Kenema Makeni Bo Freetown National Table shows that the minimum age of respondent was 22 years, while the maximum age was 85 years at the national level; on average respondents were around 42 years old. This means that charcoal businesses are mainly being run by adults, and that children may only be playing a supportive role.

17 Percent (%) Percent (%) Respondents were asked to provide information on their religion, and the results are shown in Figure Christian Muslim 0.0 Kenema Makeni Bo Freetown National Data Collection Center The data in Figure shows that 73.3% of respondents were Muslims compared with 26.7% Christians, which is very similar to the 2004 Population and Housing Census estimates. This national picture is reflected in all the regions of the country, except in Bo, where the proportion is very close to each other, with half of the respondents being in one region or the other. The data collected on the marital status of respondents is shown in Figure Married Single Separated Divorced Widowed Marital Status Figure shows that majority of respondents operating in the charcoal business are married people, mostly females trying to make ends meet for their families.


18 Percent (%) The survey collected data on the nationality of respondents, and the responses are shown in Figure Sierra Leonean Other Nationals 96.1 The data in Figure shown that majority of persons in the charcoal business (96.2%) are Sierra Leoneans, compared with only 3.9% that are Foreign Nationals. This means that Sierra Leoneans are mainly in control of the charcoal trade in the country-from the production, transportation, distribution and sale of charcoal all around the country. The Survey collected information on the level of education of persons in the charcoal business and the responses are shown in Figure Never being to school Primary Secondary Other(specify) Educational Level
19 Figure shows that 61.9% of persons in the charcoal business have never being to school, followed by 22.0% with education level and 14.5% with secondary education level. This means that charcoal business is an important source of income for those who never went to school in this country. Information was collected on whether or not charcoal business was the main source of income to the household; this is shown in Figure Yes No 80.5 Figure shows that 80.5% of respondents believe that charcoal business was the main source of income; this underscores the important role of charcoal not only as a source of cooking but also as a sources of income for household. The survey obtained information relevant information on the nature of charcoal business being run in the country including ownership status, year of commencement of operations, and number of persons engaged in such businesses. The information obtained on ownership status of the charcoal business is shown in Figure and Figure 2.2.1b.
 who are not owners of such businesses, although they are playing a key role in the running of the business. 60.0 50.0 51.8 40.0 30.0 20.0 10.0 20.6 27.6 0.")
20 Percent (%) 11.1 Yes No 88.9 Figure shows that 88.9% of respondents own their charcoal businesses, which means that only 11.1% (48 persons) who are not owners of such businesses, although they are playing a key role in the running of the business Parent/Guardian Neighbour Other Ownership Status Of the 48 persons who indicated that they were not owners of the business, 51.8% of such businesses were owner by the neighbours, 20.6% were owned by the parent or guardian while 27.6% were owned by other persons including brothers/sisters and friends.

21 Percent (%) Percent (%) The survey asked for the year the business was established and the length of time respondents have spent doing the same business, the responses are shown in Figure 2.2.2a and figure 2.2.2b Year of Establishment Figure shows that most of charcoal businesses (61.6%) commenced operations between 2001 and 2010, followed by 25.2% established between 2011 and This shows that most charcoal businesses were established after relative peace was experienced throughout the country Less than one year 1-2 years 3-4 years 5+ years Year of Experience Figure 2.2.2b shows that most charcoal business operators (33.6%) have sent at least 5 years doing the business; this is followed by those who have spent between 3-4 year (29.9%) and those who have spent between 1-2 years (27.1%). This means that most respondents have spent at least 3 years on doing charcoal business in the country.
 Children Eastern 39 69 108 63.9 35 73 108 67.6 Northern 29 175 204 85.8 58 146 204 71.6 Southern 23 117 140 83.6 43 97 140 69.")
22 The survey collected information on the number of persons working in the charcoal business including children; and the information is shown in Table Region Male Female Total % Children % Adult Total Female (<18 years) Children Eastern Northern Southern Western Area National Table shows that about 821 persons were engaged in charcoal business in the regional cities of Western Area (Freetown), Southern Region (Bo), Eastern Region (Kenema) and Northern Region (Makeni). Of this number, 79.7% were women, while 66.1% were children below 18 years of age. This underlines the important contribution of women and children to household income around the country. Figure shows that at the national level 79.7% of persons engaged in Charcoal Business are female; the Northern Region however has the highest proportion of 85.8% followed by the Southern Region 83.6% and Western Area 79.4%. This underscores the important role of charcoal business as a source of income to many of the women around the country. In addition, 66.1% of the persons engaged in charcoal business are children below 18 years at the national level, while in the Northern Region the proportion is higher at 71.6% followed by the Southern Region 69.3%; which also underlines the widespread child labour activities in such an informal business environment.
23 The survey collected data on the financial resources including revenue and expenses of charcoal businesses in the country. The survey collected data on the price and weight of each bag of charcoal bought and sold and the information is shown in Table Region Price per Bag of Charcoal (Le) Minimum Mean Maximum Average weight per bag (kg) Eastern 8,000 10,200 15, Northern 12,000 14,867 17, Southern 9,000 13,700 16, Western Area 15,000 18,993 29, Total 8,000 15,724 29, Table shows that the price per bag (rice bag) is lower in the Eastern Region than any of the other regions. It also shows that the price of bag of charcoal is more expensive in the Western Area followed by the Northern region than in the other regions, possibly due to the population in Freetown as well as the lack of reliable power supply in the city that could have been used as alternative source for cooking. In the Northern in the surge in the population as a result of iron ore mining may have contributed to the high price of charcoal in the region. Table further shows that a rice bag of charcoal is heavier in the Northern Region weighing 27kg compared with 20kg in the Eastern region and Western Area and 22kg at the National Level. The Survey collected data on the amount of bags sold per day and the information is presented in Table
24 Region Quantity Sold Minimum Mean Maximum Eastern Northern Southern Western Area Total Table shows that on average, a higher quantity of charcoal 12 (27kg bags) were sold in the Northern Region than even in the Western Area by a single business. This could be due to the increased demand for charcoal in the region resulting from the surge in the population as result of booming iron ore mining activities. Sales/revenue is an important component of business activities, as it represents the income that an establishment receives from the direct sale of its goods or service. It is what the establishments use to meet running cost, pay the wage bill, and where possible plough back the profit into the business. For this survey, SMEs were asked questions bordering on sale/revenue and their views on the business profitability status. The survey collected data on the revenue and expenditure of the charcoal businesses operating in the country; and the results are displayed in Table Region Total Annual Total Annual Exp/Rev Ratio Revenue Expenditure Eastern 1, Northern 3,690 2, Southern 1, Western Area 16,700 11, Total 22,990 13, Table shows that the charcoal trade generated an average of Le 22,990 million annually as income, compared with Le 13,876 million expended annually. This means that there is an annual operating profit of Le 9,114 million. The data also shows that Eastern region spends only 24.4% of their revenue to cover the cost of supplying the
25 Percent (%) charcoal to the local market, compared with 65.9% of revenue spent in the Western Area. The survey collected information on additional sources of income such as access to loans and savings. The data collected on loans and source of loans is shown in Figure and Figure 2.5.1b Yes No Option Figure shows that only 49 (11.4%) of Charcoal Businesses obtained loan in from any sources in the past 12 months.
26 Figure 2.5.1b shows that only 6.1% of the 49 Charcoal Businesses, who have obtained loans, have obtained loan from formal banks in the last 12 months. This is not surprising given the fact that commercial banks will normally loan only formal businesses that have accounts with them. 85.7% has obtained loans from Microfinance Institutions and 8.2% has obtained loans from other sources including relatives and friends. The survey collected information on the amount and repayment status of loans obtained and the results are shown in Figure Figure shows that more than half of the respondents (51%) obtained loan amount of less than Le 500,000; while no respondent obtained loan amount of Le 2,000,000 and above. This underscores the small and informal nature of charcoal business in the country. On the other hand, 65.3% of those who took loans have repaid all of it in the last 12 months. The survey asked respondent that have not obtained loans to provide the main reason why they have not access loans to run their charcoal businesses; and the responses are presented in Figure

27 Percent (%) The need for collateral Don't think willl be given anyway Interest rate is too high Business is too small Other Option Figure show charcoal business did not get loan from any source pointed out they did not obtain loan because they thought that the interest rate was too high (31.9%); 26.4% thought because the business was small; 23.3% thought they will not be given anyway, while 10.7% pointed out the normal problem of lack of collateral to secure the loan. The Charcoal survey collected some information on savings either held in a bank or group or at home as the case may be. Figure shows that 47.2% of respondents have savings accrued from charcoal business; this means that more than half 52.8% do not have savings at all, which underlines the hand-to-mouth nature of charcoal business in the country.
28 Figure2.6.2 shows that 65% of those respondents who have savings saved less than Le 500,000; while only 2.5% have saved Le 3,000,000. The data in Figure shows that only 4.9% of charcoal businesses who agreed to have saved, have savings in a bank; while 36.2% have savings at home. 49.7% have no savings at all. In addition, of those charcoal businesses that have savings, 27.2% of them do not have access to such savings at any point in time. This is limited access to savings underscores the traditional nature of savings which undermines the key role of savings in business development and expansion. The Charcoal Survey asked respondents whether or not they have received any financial assistance from the government or other development partners and the results are shown in Figures and 2.7.2
29 Figure shows that only 10.1% of charcoal businesses have received financial assistance in the form of Loans and other support to carry out their business. Figure shows that 83.6% of the charcoal business interviewed expect government to provide micro-finance loans to aid them in their business; while only 13.3% expect government to reduce council taxes on charcoal. This may be due to the fact that either the tax is small or that some charcoal businesses actually do not pay taxes due to the informal nature of such businesses.
30 Charcoal production is still done at the household, informal level; as a result there is no regulatory framework in place to regulate charcoal production, distribution and sales in the country, which is affecting the environmental aspect of our economy. There is therefore need to establish a legal regulatory framework spelling out the coordination mechanism among various stakeholders in the charcoal industry. There is also need to support charcoal businesses as part of the small-and-medium scale enterprise development in the country since such business have been found to be an important source of income to many households.
31 1 REGION.2 DISTRICT.. 3. CITY.. 4. STREET ADDRESS. 5. RESPONDENT NAME... GREETINGS, my name is.. I am working for the Statistics Sierra Leone; we are conducting a Survey on Charcoal consumption in the regional cities of Freetown, Bo, Kenema and Makeni. You are one of the people that have been selected for this survey. The main purpose of this survey is to collect information on charcoal consumption, including the number of persons involved, price per bag, access to finance and other socio-economic information. This information is useful for energy planning in the country only; therefore, any information you give will be treated with utmost confidence and your name will not be mentioned in any way. We hope that you will participate in this survey. Your views are important. Signature of interviewer:...
32 NO. Question and Filters Coding Categories Skip To Name of Respondent Sex Male 1 Female 2 Age (in completed years) Religion Ethnicity Marital Status Nationality Christian 1 Muslim 2 Mende 1 Limba 2 Temne 3 Krio 4 Loko 5 Kono 6 Fullah 7 Other (specify) 8 Married 1 Single 2 Separated 3 Divorced 4 Widowed 5 Sierra Leonean 1 Guinean 2 Other (Specify) 3 What is your level of education Never being to school 1 Primary 2 Secondary 3 Vocational Training Institution 4 University 5 Other (specify) 6 Is this the main source of your income? Yes 1 No 2
33 No. Questions and Filters Coding Categories Skip To Are you a the owner of this charcoal business If no, who is the owner? Are you paid for selling this charcoal/fuel wood When did this business start Yes 1 No 2 Parent/Guardian Neighbour Other Yes 1 No 2 Year----- Q13 How many people working for this business Number (male) Number (female).. Are your family members involved in this business Number (Children<18) Number (Adult 18+).. How many children and adults involved in this business? How long have you been doing this business? What is you main sources of supplied for charcoal? Would you like to change business when given the opportunity Less than one year year years 3 5+year 4 Lorry from rural areas 1 From Neighbour in the city 2 I buy from rural areas for myself 3 I produce charcoal myself 4 Other 5 Yes 1 No 2
34 No. Questions and Filters Coding Categories Skip To What is the price per bag (weight ) of charcoal in Leones Actual price Less than 10, Price How many bags do you sell per day Actual Quantity Less than Quantity What is the average amount of sales per day Actual sales Less than and above 5 Amount Do you realize any profit Yes, small 1 Yes, good 2 No, not at all 3 What is the cost per bag (weights..) What is the total cost per week Have you contracted any loan for this business from any financial institution? Less than 5, Amount (Le). Yes 1 No 2 Q30
35 No. Questions and Filters Coding Categories Skip To Which institution? What was the amount of the Loan? Have you repaid the loan now? What was the main reason that made you not to access loans from your any financial institution Do you currently have savings with the OSUS Group? What is the minimum member savings in this group per week? Do you currently have savings outside the OSUSU group? Formal Banks 1 Microfinance institution 2 Money lender 3 Relative/friends 4 Other 5 Less than and above 5 Yes, all of it 1 Yes, most of it 2 Yes, little of it 3 No, not at all 4 The need for collateral 1 Don t think will be given anyway 2 Interest rate is too high 3 Business is too small 4 Other 5 Less than and above 5 Yes 1 No 2 Q33 Yes, in a Bank 1 Yes, at home 2 Yes, in other Osusu 3 Yes, with my relative/friends 4 No, not at all 5 Q35
36 No. Questions and Filters Coding Categories Skip To Do you have access to this savings at any point in time Have you ever received financial assistance/support from any of the Microfinance Institutions or government? What do you want the government to do for you? Yes 1 No 2 Yes 1 No 2 Reduce council taxes on charcoal 1 Provide micro loans to charcoal business 2 Other 3
UNFPA SSL EU November 2006
 UNFPA SSL EU November 2006 i FOREWORD Government and other Stakeholders have been eagerly awaiting this report. The long interval between the 1985 and the 2004 population censuses has been mainly attributed
CONSUMER PRICE INDEX JULY 2018 PRESS RELEASE
 CONSUMER PRICE INDEX JULY 2018 PRESS RELEASE Released: 21 st August, 2018 @ 12: 00 noon Contact Persons: Abu Bakarr Turay Director, Economic Statistics Division Statistics Sierra Leone Mobile: +23276690948
Sierra Leone 2014 Labor Force Survey. Basic Information Document
 Sierra Leone 2014 Labor Force Survey Basic Information Document ACRONYMS GIZ ILO LFS SSL Deutsche Gesellschaft für Internationale Zusammenarbeit International Labour Organization Labor Force Survey Statistics
TIME USE SURVEY MONGOLIA
 TIME USE SURVEY MONGOLIA NSO Mongolia CONTENT Country context Time use survey - Introduction Objectives Sampling and survey design Data collection Data processing 1 3 Territory: 1.5 million km 2 (19 th
Statistics Sierra Leone. SIERRA LEONE CONSUMER PRICE INDEX (CPI) REPORT 2012 Economic Statistics Division
 REPORT 2012 Economic Statistics Division") Statistics Sierra Leone SIERRA LEONE CONSUMER PRICE INDEX (CPI) REPORT 2012 Economic Statistics Division September 2013 Statistics Sierra Leone SIERRA LEONE CONSUMER PRICE INDEX REPORT 2012 ECONOMIC STATISTICS
Statistics Sierra Leone SIERRA LEONE CONSUMER PRICE INDEX (CPI) REPORT 2012 Economic Statistics Division September 2013 Statistics Sierra Leone SIERRA LEONE CONSUMER PRICE INDEX REPORT 2012 ECONOMIC STATISTICS
NOVEMBER 22, : MONTHLY INFLATION RATE INCREASES SIGNIFICANTLY
 CONSUMER PRICE INDEX (CPI) November, 2016: PRESS RELEASE Released on Thursday December 22, 2016 at 1:00 pm NOVEMBER 2016 MONTHLY INFLATION RATE INCREASES SIGNIFICANTLY The national monthly CPI (2008=100)
STEP 7. Before starting Step 7, you will have
 STEP 7 Gap analysis Handing out mosquito nets in Bubulo village, Uganda Photo credit: Geoff Sayer/Oxfam Step 7 completes the gap-analysis strand. It should produce a final estimate of the total shortfall
Women s economic empowerment in the changing world of work:
 Women s economic empowerment in the changing world of work: Reflections from South Asia Jayati Ghosh For UN-ESCAP Bangkok 23 February 2017 Gender discrimination has been crucial for growth in Asian region,
(Submitted by the Central Statistical Office, Salisbury, Rhodesia and
 a. CAS/2. WP/4 ECONOMIC COMMISSION FOE AFRICA CONFERENCE OP AFRICAN STATISTICIANS SECOND CONFERENCE JUUE, 1961 TUNIS, TUNISIA Provisional Agenda Item No, 5(a) FEH3HATI0N OP RHOEBSIA AND NYASALAND FIVE
An Investigation of Determinants and Constraints of Urban Employment in Shone Town, Ethiopia
 An Investigation of Determinants and Constraints of Urban Employment in Shone Town, Ethiopia Mamo Esayas Ambe Department of Economics, Wolaita Sodo University, P.o.Box 138, Wolaita Sodo, Ethiopia Abstract
The national monthly CPI (2008=100) increased from per cent in September, 2017 to per cent
 increased from per cent in September, 2017 to per cent") CONSUMER PRICE INDEX (CPI) October, 2017: PRESS RELEASE Released on Monday November 21, 2017 at 1:00 pm OCTOBER 2017 MONTHLY INFLATION RATE INCREASES SLIGHTLY The national monthly CPI (2008=100) increased
CONSUMER PRICE INDEX (CPI) October, 2017: PRESS RELEASE Released on Monday November 21, 2017 at 1:00 pm OCTOBER 2017 MONTHLY INFLATION RATE INCREASES SLIGHTLY The national monthly CPI (2008=100) increased
Survey on the Living Standards of Working Poor Families with Children in Hong Kong
 Survey on the Living Standards of Working Poor Families with Children in Hong Kong Oxfam Hong Kong Policy 21 Limited October 2013 Table of Contents Chapter 1 Introduction... 8 1.1 Background... 8 1.2 Survey
Sources: Surveys: Sri Lanka Consumer Finance and Socio-Economic Surveys (CFSES) 1953, 1963, 1973, 1979 and 1982
 1953, 1963, 1973, 1979 and 1982") Sri Lanka Sources: Paukert 1973, Table 6 p.104-105 Jain 1975 Cromwell 1977, Table 1 Lecaillon et al. 1984, Table 4 p. 26-27 UN 1985 Bhalla 1988 Fields 1989 Datt 1994 World Bank Poverty Monitoring Database
Sri Lanka Sources: Paukert 1973, Table 6 p.104-105 Jain 1975 Cromwell 1977, Table 1 Lecaillon et al. 1984, Table 4 p. 26-27 UN 1985 Bhalla 1988 Fields 1989 Datt 1994 World Bank Poverty Monitoring Database
PROJECT INFORMATION DOCUMENT (PID) IDENTIFICATION/CONCEPT STAGE
 IDENTIFICATION/CONCEPT STAGE") Public Disclosure Authorized Public Disclosure Authorized Public Disclosure Authorized Public Disclosure Authorized Project Name Region Country Sector(s) Theme(s) Lending Instrument Project ID Borrower
Public Disclosure Authorized Public Disclosure Authorized Public Disclosure Authorized Public Disclosure Authorized Project Name Region Country Sector(s) Theme(s) Lending Instrument Project ID Borrower
The Status of Women in the Middle East and North Africa (SWMENA) Project
 Project") The Status of Women in the Middle East and North Africa (SWMENA) Project Focus on Yemen Paid Work and Control of Earnings & Assets Topic Brief A project by the International Foundation for Electoral Systems
The Status of Women in the Middle East and North Africa (SWMENA) Project Focus on Yemen Paid Work and Control of Earnings & Assets Topic Brief A project by the International Foundation for Electoral Systems
Expanding Financial Inclusion in Africa. SILC Meeting, Photo By Henry Tenenbaum, May 2016
 Expanding Financial Inclusion in Africa SILC Meeting, Photo By Henry Tenenbaum, May 2016 SILC Financial Diaries: Case Study Low-Income, High-Variation Household October 2016 Authors This case study was
SECTION- III RESULTS. Married Widowed Divorced Total
 SECTION- III RESULTS The results of this survey are based on the data of 18890 sample households enumerated during four quarters of the year from July, 2001 to June, 2002. In order to facilitate computation
The national monthly CPI (2008=100) increased from per cent in November, 2017 to per cent
 increased from per cent in November, 2017 to per cent") CONSUMER PRICE INDEX (CPI) December, 2017: PRESS RELEASE Released on Monday January 17, 2017 at 1:00 pm DECEMBER 2017 MONTHLY INFLATION RATE INCREASES SIGHTLY The national monthly CPI (2008=100) increased
CONSUMER PRICE INDEX (CPI) December, 2017: PRESS RELEASE Released on Monday January 17, 2017 at 1:00 pm DECEMBER 2017 MONTHLY INFLATION RATE INCREASES SIGHTLY The national monthly CPI (2008=100) increased
REPUBLIC OF ZAMBIA CENTRAL STATISTICAL OFFICE PRELIMINARY RESULTS OF THE 2012 LABOUR FORCE SURVEY
 REPUBLIC OF ZAMBIA CENTRAL STATISTICAL OFFICE PRELIMINARY RESULTS OF THE 2012 LABOUR FORCE SURVEY This report presents preliminary results of the 2012 Labour Force Survey. The results presented herein
Montana State University MESA Program POTENTIAL PARTICIPANT APPLICATION FORM
 Montana State University MESA Program POTENTIAL PARTICIPANT APPLICATION FORM Date: / / To ensure you qualify for the Matched Education Savings Account (MESA) Program, please read the MESA Frequently Asked
CENTRAL STATISTICAL AGENCY URBAN EMPLOYMENT - UNEMPLOYMENT SURVEY
 CENTRAL STATISTICAL AGENCY URBAN EMPLOYMENT - UNEMPLOYMENT SURVEY - 2011 105 Keftegna/Wereda/ 109 Name of 101 Kill 102 Zone 103 Wereda 104 Town K/Ketema 106 Kebele 107 Enumeration Area code 108 Household
Evaluation of the Direct Community Contact Campaign (DCC) on the Re-Denomination of the Cedi-June 2007
 on the Re-Denomination of the Cedi-June 2007") Evaluation of the Direct Community Contact Campaign (DCC) on the Re-Denomination of the Cedi-June 2007 A Study Undertaken by the Research Department of the National Commission for Civic Education (NCCE)
Evaluation of the Direct Community Contact Campaign (DCC) on the Re-Denomination of the Cedi-June 2007 A Study Undertaken by the Research Department of the National Commission for Civic Education (NCCE)
2000 HOUSING AND POPULATION CENSUS
 Ministry of Finance and Economic Development CENTRAL STATISTICS OFFICE 2000 HOUSING AND POPULATION CENSUS REPUBLIC OF MAURITIUS ANALYSIS REPORT VOLUME VIII - ECONOMIC ACTIVITY CHARACTERISTICS June 2005
2011 Annual Socio- Economic Report
 2011 Annual Socio- Economic Report This abstract contains the Nigerian Unemployment Report 2011 National Bureau of Statistics Page 1 Introduction Employment Statistics is a section under the General Household
Women and Men in the Informal Economy: A Statistical Brief
 Women and Men in the Informal Economy: A Statistical Brief Florence Bonnet, Joann Vanek and Martha Chen January 2019 Women and Men in the Informal Economy: A Statistical Brief Publication date: January,
Survey on Income and Living Conditions (SILC)
") An Phríomh-Oifig Staidrimh Central Statistics Office 15 August 2013 Poverty and deprivation rates of the elderly in Ireland, SILC 2004, 2009, 2010 revised and 2011 At risk of poverty rate Deprivation rate
An Phríomh-Oifig Staidrimh Central Statistics Office 15 August 2013 Poverty and deprivation rates of the elderly in Ireland, SILC 2004, 2009, 2010 revised and 2011 At risk of poverty rate Deprivation rate
BANGLADESH. QUICKSIGHTS REPORT FOURTH ANNUAL FII TRACKER SURVEY Fieldwork completed in September December 2016
 QUICKSIGHTS REPORT FOURTH ANNUAL FII TRACKER SURVEY Fieldwork completed in September 016 December 016 Key definitions Access Access to a bank account or mobile money account means an individual can use
41% of Palauan women are engaged in paid employment
 Palau 2013/2014 HIES Gender profile Executive Summary 34% 18% 56% of Palauan households have a female household head is the average regular cash pay gap for Palauan women in professional jobs of internet
Copies can be obtained from the:
 Published by the Stationery Office, Dublin, Ireland. Copies can be obtained from the: Central Statistics Office, Information Section, Skehard Road, Cork, Government Publications Sales Office, Sun Alliance
PRESS RELEASE 2012 LABOUR FORCE SURVEY 10 APRIL 2012
 PRESS RELEASE 2012 LABOUR FORCE SURVEY 10 APRIL 2012 =========================================================== 1. The Namibia Statistics Agency is pleased to release the results of the 2012 Labour Force
Proposal for Belgian Trust Fund for Poverty and Social Impact Analysis (Joint UNDP World Bank Project)
") Proposal for Belgian Trust Fund for Poverty and Social Impact Analysis (Joint UNDP World Bank Project) Name of Proposal: Agricultural Policy in Sierra Leone Government Unit Responsible for Project: Economic
Proposal for Belgian Trust Fund for Poverty and Social Impact Analysis (Joint UNDP World Bank Project) Name of Proposal: Agricultural Policy in Sierra Leone Government Unit Responsible for Project: Economic
SOMALILAND OPINION SURVEY - HARGEISA DISTRICT - FIELDWORK : SEPTEMBER 28 OCTOBER 8, 2011
 SOMALILAND OPINION SURVEY - HARGEISA DISTRICT - FIELDWORK : SEPTEMBER 28 OCTOBER 8, 2011 Acronyms Legend UDUB United People s Democratic Party KULMIYE Peace, Unity and Development Party UCID Justice and
Lecture 19: Trends in Death and Birth Rates Slide 1 Rise and fall in the growth rate of India is the result of systematic changes in death and birth
 Lecture 19: Trends in Death and Birth Rates Slide 1 Rise and fall in the growth rate of India is the result of systematic changes in death and birth rates from high levels to moderate levels. In the beginning
2004 ZANZIBAR BUSINESS CENSUS
 REVOLUTIONARY GOVERNMENT OF ZANZIBAR OFFICE OF CHIEF GOVERNMENT STATISTICIAN 2004 ZANZIBAR BUSINESS CENSUS VOLUME II COMPARISON BETWEEN 2001 CENTRAL REGISTER OF ESTABLISHMENTS AND 2004 ZANZIBAR BUSINESS
The 2004 Canada Survey of Giving, Volunteering, and Participating: NEWFOUNDLAND AND LABRADOR
 The 2004 Canada Survey of Giving, Volunteering, and Participating: NEWFOUNDLAND AND LABRADOR DONATING: Donations Types of organizations supported Donor characteristics: - Age - Education level Donation
A Study On Socio-Economic Condition Of Self Help Group Members At Village Warishpur, West Bengal
 A Study On Socio-Economic Condition Of Self Help Group Members At Village Warishpur, West Bengal Badsha Pal M.A. in Geography, NET Qualified, Assistant Teacher of Aurangabad High School (H.S.), West Bengal
Home Study Quiz 2017 ARMS 3
 Enumerator Name: Home Study Quiz 2017 ARMS 3 The following quiz relates directly to the questionnaire sections common to all questionnaire versions unless otherwise specified. Reference the 2017 ARMS Phase
CENSUS OF POPULATION, 1981
 CENSUS OF POPULATION, 1981 KEY TO ABBREVIATIONS USED IN THE COMPUTER PRINTOUTS FOR SMALL AREA STATISTICS CENTRAL STATISTICS OFFICE 1 AREAS FOR WHICH SMALL AREA STATISTICS AREA AVAILABLE A printout is available
Frequently asked questions (FAQs)
") Frequently asked questions (FAQs) New poverty estimates 1. What is behind the new poverty estimates being released today? The World Bank has recalculated the number of people living in extreme poverty
Frequently asked questions (FAQs) New poverty estimates 1. What is behind the new poverty estimates being released today? The World Bank has recalculated the number of people living in extreme poverty
Day 1, Session 3, UN Workshop on Improving the Intergation of a Gender Perspective inti Official Chiba, Japan April 2013
 Day 1, Session 3, UN Workshop on Improving the Intergation of a Gender Perspective inti Official Statistics @ Chiba, Japan 16-19 April 2013 Saidah Hashim (Ms.) Manpower & Social Statistics Division Department
Quick Facts. n n. Total population of Zambia million Total adult population 8.1 million. o o
 FinScope Zambia 2015 Quick Facts n n Total population of Zambia 1 15.5 million Total adult population 8.1 million o o 54.8% of adults live in rural areas; 45.2% in urban areas 49.0% of adults are male;
2.1 Approximately how many people in this district lost all their sources of income as a result of the disaster?
 Questionnaire No. : Date District Interviewer Division Village Suggested respondents: Secretary General or President of District Chambers of Commerce, Secretary General or President of District Trade Union
IMPACT OF NREGA ON AGRICULTURAL LABOUR FORCE IN THOOTHUKUDI DISTRICT INTERVIEW SCHEDULE. 1. Name of Beneficiary: Contact: 2. Village Name Village Code
 IMPACT OF NREGA ON AGRICULTURAL LABOUR FORCE IN THOOTHUKUDI DISTRICT INTERVIEW SCHEDULE A. Primary Information 1. Name of Beneficiary: Contact: 2. Village Name Village Code 3. Ward Name Ward Code 4. Block
Consumption and Savings Pattern among Food Crop Farmers in Imeko Afon Local Government Area of Ogun State, Nigeria
 Consumption and Savings Pattern among Food Crop Farmers in Imeko Afon Local Government Area of Ogun State, Nigeria Akerele, E. O. Ologbon O.A.C. Ambali O. I and Oshisanya K.P Department of Agricultural
A/HRC/17/37/Add.2. General Assembly. United Nations
 United Nations General Assembly Distr.: General 18 May 2011 A/HRC/17/37/Add.2 English only Human Rights Council Seventeenth session Agenda item 3 Promotion and protection of all human rights, civil, political,
Census Research Paper Series
 2006 Census Research Paper Series #6 The Changing Industrial Structure of Northern Ontario by Chris Southcott, Ph.D. Lakehead University April, 2008 Prepared for the Local Boards of Northern Ontario Far
WMI BACKGROUND, METHODOLOGY, AND SUMMARY 3
 Table of Contents WMI BACKGROUND, METHODOLOGY, AND SUMMARY 3 BASELINE DATA 4 DEMOGRAPHICS 4 AGE DISTRIBUTION MARITAL STATUS PEOPLE IN HOUSEHOLD CHILDREN IN HOUSEHOLD ANNUAL HOUSEHOLD INCOME HOUSEHOLD SAVINGS
CleanCook Microfinance
 CleanCook Statement of Problem Cooking Cooking is a basic activity in every household in Kenya. In a typical rural household of 4 members, cooking is done thrice a day. According to the Kenya National
FinScope Consumer Survey Malawi 2014
 FinScope Consumer Survey Malawi 0 Introduction Malawi Government The Government of Malawi has increasingly recognised that access to financial services can play an important role in poverty alleviation
Venezuela Country Brief
 Venezuela Country Brief Venezuela is rich in natural resources, but poor economic policies over the past two decades have led to disappointed economic performance. A demand-led temporary boom in growth
Women in the Egyptian Labor Market An Analysis of Developments from 1988 to 2006
 Women in the Egyptian Labor Market An Analysis of Developments from 1988 to 2006 1 B Y R A G U I A S S A A D P O P U L A T I O N C O U N C I L A N D F A T M A E L - H A M I D I U N I V E R S I T Y O F
ECONOMIC CHARACTERISTICS
 Sierra Leone 2015 Population and Housing Census Thematic Report on ECONOMIC CHARACTERISTICS STATISTICS SIERRA LEONE (SSL) OCTOBER 2017 i ii Sierra Leone 2015 Population and Housing Census Thematic Report
PREVIOUS HOUSEHOLD BUDGET SURVEYS
 1973 HOUSEHOLD BUDGET SURVEY SPECIAL FEATURES AND RESULTS D. C. Murphy (Read before the Society, May 20,1976) INTRODUCTION The first report on the large scale national Household Budget Survey (HBS) conducted
The World Bank. Poverty Reduction & Economic Management Unit Africa Region. Statistics Sierra Leone
 A POVERTY PROFILE FOR SIERRA LEONE The World Bank Poverty Reduction & Economic Management Unit Africa Region Statistics Sierra Leone Currency Equivalents Currency Unit = Sierra Leonean Leone US$1 = 4,340
The Thirteenth International Conference of Labour Statisticians.
 Resolution concerning statistics of the economically active population, employment, unemployment and underemployment, adopted by the Thirteenth International Conference of Labour Statisticians (October
Lake County. Government Finance Study. Supplemental Material by Geography. Prepared by the Indiana Business Research Center
 County Government Finance Study Supplemental Material by Geography Prepared by the Indiana Business Research www.ibrc.indiana.edu for Sustainable Regional Vitality www.iun.edu/~csrv/index.shtml west Indiana
The Moldovan experience in the measurement of inequalities
 The Moldovan experience in the measurement of inequalities Veronica Nica National Bureau of Statistics of Moldova Quick facts about Moldova Population (01.01.2015) 3 555 159 Urban 42.4% Rural 57.6% Employment
Effect of Community Based Organization microcredit on livelihood improvement
 J. Bangladesh Agril. Univ. 8(2): 277 282, 2010 ISSN 1810-3030 Effect of Community Based Organization microcredit on livelihood improvement R. Akter, M. A. Bashar and M. K. Majumder 1 and Sonia B. Shahid
BASELINE SURVEY OF MINORITY CONCENTRATION DISTRICT. Executive Summary of Leh District (Jammu and Kashmir)
") BASELINE SURVEY OF MINORITY CONCENTRATION DISTRICT Background: Executive Summary of Leh District (Jammu and Kashmir) The Ministry of Minority Affairs (GOI) has identified 90 minority concentrated backward
BASELINE SURVEY OF MINORITY CONCENTRATION DISTRICT Background: Executive Summary of Leh District (Jammu and Kashmir) The Ministry of Minority Affairs (GOI) has identified 90 minority concentrated backward
FINAL QUALITY REPORT EU-SILC
 NATIONAL STATISTICAL INSTITUTE FINAL QUALITY REPORT EU-SILC 2006-2007 BULGARIA SOFIA, February 2010 CONTENTS Page INTRODUCTION 3 1. COMMON LONGITUDINAL EUROPEAN UNION INDICATORS 3 2. ACCURACY 2.1. Sample
ASSOCIATED PRESS-LIFEGOESSTRONG.COM BOOMERS SURVEY OCTOBER 2011 CONDUCTED BY KNOWLEDGE NETWORKS October 14, 2011
 2100 Geng Road Suite 100 Palo Alto, CA 94303 www.knowledgenetworks.com Interview dates: October 5 October 12, 2011 Interviews: 1,410 adults; 1,095 boomers Sampling margin of error for a 50% statistic with
Socio-economic Profile for Northeastern Region Community Futures Development Corporation. Prepared for: FedNor/Industry Canada
 Socio-economic Profile for Community Futures Development Corporation Prepared for: FedNor/Industry Canada Statistics Canada Central Region June 2015 TABLE OF CONTENTS Introduction 4 Geography Note 5 List
Consequential Omission: How demography shapes development lessons from the MDGs for the SDGs 1
 Consequential Omission: How demography shapes development lessons from the MDGs for the SDGs 1 Michael Herrmann Adviser, Economics and Demography UNFPA -- United Nations Population Fund New York, NY, USA
Employment, Industry and Occupations of Inuit in Canada,
 Employment, Industry and Occupations of Inuit in Canada, 1981-2001 Inuit Tapiriit Kanatami and Research and Analysis Directorate January, 2007 Research Project Manager: Sacha Senécal, Strategic Research
Statistics Division, Economic and Social Commission for Asia and the Pacific
 .. Distr: Umited ESAW/CRVS/93/22 ORIGINAL: ENGUSH EAST AND SOUTH ASIAN WORKSHOP ON STRATEGIES FOR ACCELERATING THE IMPROVEMENT OF CIVIL REGISTRATION AND VITAL STATISTICS SYSTEMS BEIJING, 29 NOVEMBER -
Virginia Individual Development Accounts Candidate Application
 Virginia Individual Development Accounts Candidate Application VIDA candidates must use this application to show that they meet the five criteria below. This form is also used to establish a VIDA savings
APPLICANT INFORMATION Applicant's Full Name (First M.I. Last) Social Security Number Citizenship
 Social Security Number Citizenship") APPLICATION CREDIT REQUESTED Application Date Application ID Amount Requested Term Product Specific Purpose of Loan We intend to apply for Joint Credit. Borrower Co-Borrower What branch would you like
APPLICATION CREDIT REQUESTED Application Date Application ID Amount Requested Term Product Specific Purpose of Loan We intend to apply for Joint Credit. Borrower Co-Borrower What branch would you like
Environment Expenditure Local Government
 46.0 46.0 ENVIRONMENT EXPENDITURE, LOCAL GOVERNMENT, AUSTRALIA 000 0 Environment Expenditure Local Government Australia 000 0 4600007005 ISSN 444-390 Recommended retail price $4.00 Commonwealth of Australia
Impact of fglobal lfinancial i and. Lao CBMS Sites
 Ministry of Planning and Investment Department of Statistics Impact of fglobal lfinancial i and Economic Crisis on Poverty Lao CBMS Sites 9 th Poverty and economic policy (PEP) research network policy
2008 Financial Literacy Survey
 Summary Report and Topline 2008 Financial Literacy Survey Prepared by Princeton Survey Research Associates International for the National Foundation for Credit Counseling and MSN Money 04.29.08 Many economists
Sierra Leone Jamal Zayid / Moses Sichei /
 2016 Jamal Zayid / j.zayid@afdb.org Moses Sichei / moses.sichei@undp.org Milton Korseh-Hindowa / milton.korseh-hindowa@undp.org www.africaneconomicoutlook.org Sierra Leone Sierra Leone is currently grappling
Lake County. Government Finance Study. Supplemental Material by Geography. Prepared by the Indiana Business Research Center
 County Government Finance Study Supplemental Material by Geography Prepared by the Indiana Business Research www.ibrc.indiana.edu for Sustainable Regional Vitality www.iun.edu/~csrv/index.shtml west Indiana
Determinants of Female Labour Force Participation Dynamics: Evidence From 2000 & 2007 Indonesia Family Life Survey
 Determinants of Female Labour Force Participation Dynamics: Evidence From 2000 & 2007 Indonesia Family Life Survey Diahhadi Setyonaluri PhD Student Australian Demographic and Social Research Institute
P4P Trader Survey Baseline and Follow-Up Survey [impact & non impact countries]
![P4P Trader Survey Baseline and Follow-Up Survey [impact & non impact countries]](/thumbs/94/120076853.jpg "P4P Trader Survey Baseline and Follow-Up Survey [impact & non impact countries]") P4P Trader Survey Baseline and Follow-Up Survey [impact & non impact countries] Introduction My name is and I am working for the World Food Programme here in [name of country]. We are conducting a survey
P4P Trader Survey Baseline and Follow-Up Survey [impact & non impact countries] Introduction My name is and I am working for the World Food Programme here in [name of country]. We are conducting a survey
COUNTRY REPORT - MAURITIUS
 COUNTRY REPORT - MAURITIUS ORGANISATION OF ECONOMIC STATISTICS General overview of the organization of economic statistics 1. The Central Statistics Office (CSO) is the official organisation responsible
KENYA POPULATION AND HOUSING CENSUS 1999 THE LABOUR FORCE MONOGRAPH
 REPUBLIC OF KENYA KENYA POPULATION AND HOUSING CENSUS 1999 THE LABOUR FORCE MONOGRAPH ANALYTICAL REPORT VOLUME IX Central Bureau of Statistics Ministry of Finance and Planning August 2002 Central Bureau
International Workshop on Sustainable Development Goals (SDG) Indicators Beijing, China June 2018
 Indicators Beijing, China June 2018") International Workshop on Sustainable Development Goals (SDG) Beijing, China 26-28 June 2018 CASE STUDIES AND COUNTRY EXAMPLES: USING HOUSEHOLD SURVEY DATA FOR SDG MONITORING IN MALAYSIA NORISAN MOHD ASPAR
International Workshop on Sustainable Development Goals (SDG) Beijing, China 26-28 June 2018 CASE STUDIES AND COUNTRY EXAMPLES: USING HOUSEHOLD SURVEY DATA FOR SDG MONITORING IN MALAYSIA NORISAN MOHD ASPAR
Business Partners Limited SME Confidence Index
 Business Partners Limited SME Confidence Index Fourth Quarter of 2017: October December Issued February 2018 1 RATIONALE FOR THE BUSINESS PARTNERS LIMITED SME CONFIDENCE INDEX SMEs are often punted as
AT KAARVAN CRAFTS FOUNDATION INSTITUTES - BAHAWALPUR & GUJRANWALA
 IMPACT EVALUATION STUDY PSDF s Funded Skills For Employability 16, (April 16 - June 16) AT KAARVAN CRAFTS FOUNDATION INSTITUTES - BAHAWALPUR & GUJRANWALA INTRODUCTION The Monitoring, Evaluation and Research
FSDZ Multi Sector GIS Mapping Project Final Report 17th September 23 rd December 2015
 FSDZ Multi Sector GIS Mapping Project Final Report 17th September 23 rd December 2015 Geo-Spatial Analysis: 3 Components 1). Access point data collection 3). Mapping Software 2). Add Poverty and other
The 2007 Canada Survey of Giving, Volunteering, and Participating: ATLANTIC CANADA
 The 2007 Canada Survey of Giving, Volunteering, and Participating: ATLANTIC CANADA DONATING: Donations Types of organizations supported Donor characteristics: - Age - Presence of children Donation methods
A Socio-economic Profile of Ireland s Fishery Harbour Centres. Killybegs
 A Socio-economic Profile of Ireland s Fishery Harbour Centres Killybegs A report commissioned by BIM Trutz Haase* and Feline Engling May 2013 *Trutz-Hasse Social & Economic Consultants www.trutzhasse.eu
June The World Bank Poverty Reduction & Economic Management Unit. Africa Region. Statistics Sierra Leone
 A POVERTY PROFILE FOR SIERRA LEONE June 2013 The World Bank Poverty Reduction & Economic Management Unit Africa Region Statistics Sierra Leone Currency Equivalents Currency Unit = Sierra Leonean Leone
The Big Switch follow up survey. Preliminary results
 The Big Switch follow up survey Preliminary results Background This research is carried out by the Centre for Competition Policy which is an independent, academic research centre funded by the Economic
MAIN FINDINGS OF THE DECENT WORK COUNTRY PROFILE ZAMBIA. 31 January 2013 Launch of the Decent Work Country Profile
 MAIN FINDINGS OF THE DECENT WORK COUNTRY PROFILE ZAMBIA Griffin Nyirongo Griffin Nyirongo 31 January 2013 Launch of the Decent Work Country Profile OUTLINE 1. Introduction What is decent work and DW Profile
Empowerment of Civil Servants through Savings and Credit Cooperative Society (SACCOS): Evidences from Institute of Accountancy Arusha
: Evidences from Institute of Accountancy Arusha") Empowerment of Civil Servants through Savings and Credit Cooperative Society (SACCOS): Evidences from Institute of Accountancy Arusha Chalicha Sila Arusha-Tanzania csila2004@gmail.com ABSTRACT The aim
Empowerment of Civil Servants through Savings and Credit Cooperative Society (SACCOS): Evidences from Institute of Accountancy Arusha Chalicha Sila Arusha-Tanzania csila2004@gmail.com ABSTRACT The aim
PRODUCTIVE SECTOR MANUFACTURING PDNA GUIDELINES VOLUME B
 PRODUCTIVE SECTOR MANUFACTURING PDNA GUIDELINES VOLUME B 2 MANUFACTURE CONTENTS n INTRODUCTION 4 n ASSESSMENT PROCESS 5 n PRE-DISASTER SITUATION 6 n FIELD VISITS FOR POST-DISASTER DATA COLLECTION 6 n ESTIMATING
Tracking Government Investments for Nutrition at Country Level Patrizia Fracassi, Clara Picanyol, 03 rd July 2014
 Tracking Government Investments for Nutrition at Country Level Patrizia Fracassi, Clara Picanyol, 03 rd July 2014 1. Introduction Having reliable data is essential to policy makers to prioritise, to plan,
National Survey of Mongolian Public Opinion
 National Survey of Mongolian Public Opinion March 1-15, 2016 The Government of Canada Detailed Methodology The survey was conducted by Social Policy Development Research Institute (SPDRI) under the supervision
A Review of the Sampling and Calibration Methodology of the Survey on Income and Living Conditions (SILC)
") A Review of the Sampling and Calibration Methodology of the Survey on Income and Living Conditions (SILC) 2010-2013 A response to the Technical Paper on The Measurement of Household Joblessness in SILC
A Review of the Sampling and Calibration Methodology of the Survey on Income and Living Conditions (SILC) 2010-2013 A response to the Technical Paper on The Measurement of Household Joblessness in SILC
economic growth QUARTERLY DATA SERIES
 ISSUE 8 December 2016 PROVINCIAL economic growth QUARTERLY DATA SERIES introduction The Quarterly Economic Review is a statistical release compiled by the Eastern Cape Socio Economic Consultative Council
UNITED NATIONS ECONOMIC COMMISSION FOR EUROPE CONFERENCE OF EUROPEAN STATISTICIANS TIME USE IN SERBIA
 UNITED NATIONS ECONOMIC COMMISSION FOR EUROPE CONFERENCE OF EUROPEAN STATISTICIANS UNECE Work Session on Gender Statistics (Geneva, Switzerland, 26-28 April 2010) Working paper 6 10 March 2010 Session
Social Security Provisioning in Bihar: A Case for Universal Old Age Pension
 Social Security Provisioning in Bihar: A Case for Universal Old Age Pension First Author: Dr. Manjur Ali (Research Officer) Second Author: Nilachala Acharya Authors Organisation: Centre for Budget and
YouGov / Avon UK Survey Results
 YouGov / Avon UK Survey Results Sample Size: 1995 Fieldwork: 9th - 11th November 2009 Total Gender Age Socialgrade Region Male Female 18 to 24 25 to 34 35 to 44 45 to 54 55+ ABC1 C2DE North Midlands East
CHAPTER.5 PENSION, SOCIAL SECURITY SCHEMES AND THE ELDERLY
 174 CHAPTER.5 PENSION, SOCIAL SECURITY SCHEMES AND THE ELDERLY 5.1. Introduction In the previous chapter we discussed the living arrangements of the elderly and analysed the support received by the elderly
Economic Statistics Division
 Economic Statistics Division December, 2014 TABLE OF CONTENTS Table of Contents... i List of Tables... iv List of Figures... vi Acknowledgement... vii Abbreviations... viii Chapter 1... 1 1.0 Introduction...
Catalogue No DATA QUALITY OF INCOME DATA USING COMPUTER ASSISTED INTERVIEWING: SLID EXPERIENCE. August 1994
 Catalogue No. 94-15 DATA QUALITY OF INCOME DATA USING COMPUTER ASSISTED INTERVIEWING: SLID EXPERIENCE August 1994 Chantal Grondin, Social Survey Methods Division Sylvie Michaud, Social Survey Methods Division
Market Study Report for the Municipality of Sioux Lookout. Prepared by:
 Market Study Report for the Municipality of Sioux Lookout Prepared by: March 31, 2011 Market Study Report For the Municipality of Sioux Lookout Prepared by: McSweeney & Associates 900 Greenbank Road Suite
Component One A Research Report on The Situation of Female Employment and Social Protection Policy in China (Guangdong Province)
") Component One A Research Report on The Situation of Female Employment and Social Protection Policy in China (Guangdong Province) By: King-Lun Ngok (aka Yue Jinglun) School of Government, Sun Yat-sen University
Component One A Research Report on The Situation of Female Employment and Social Protection Policy in China (Guangdong Province) By: King-Lun Ngok (aka Yue Jinglun) School of Government, Sun Yat-sen University
RESULTS OF THE KOSOVO 2015 LABOUR FORCE SURVEY JUNE Public Disclosure Authorized. Public Disclosure Authorized. Public Disclosure Authorized
 Public Disclosure Authorized Public Disclosure Authorized Public Disclosure Authorized Public Disclosure Authorized RESULTS OF THE KOSOVO 2015 LABOUR FORCE SURVEY JUNE 2016 Kosovo Agency of Statistics