Nigerian Gross Domestic Product Report (Expenditure and Income Approach)
|
|
|
- Patrick Small
- 6 years ago
- Views:
Transcription
 Report Date: October 2017 Data Source: National Bureau of")
1 Nigerian Gross Domestic Product Report (Expenditure and Income Approach) ( Q3, Q4 2016) Report Date: October 2017 Data Source: National Bureau of Statistics
2 Contents Preface 1 Summary 2 Gross Domestic Product Definitions and Summary 4 Consumption Expenditure Components 5 Capital Formation 8 Balance of trade in Goods and Services 10 National Disposable Income Definitions and Summary 13 Domestic income 15 External Income 18 Capital Finance Definitions and Summary 19 Savings and Net lending 19 Tables 2015 Appendix Tables Acknowledgements and Contacts 78
3 Preface This publication provides data on Quarterly Gross Domestic Product (GDP) by the EXPENDITURE and INCOME approach estimates for the Third and Fourth Quarter of It also contains quarterly estimates from Quarterly National Accounts (QNA) are integrated system of macroeconomic accounts designed to describe the entire system of production in a nation on a quarterly basis. They provide a picture of the current economic status of the economy that is more timely and frequent than the that provided by Annual National Accounts (ANA). The key attribute of QNA is that they provide a reasonable level of details of the economy that help government to assess, analyze, and monitor economic growth on a regular basis. QNA adopts the same concepts, definitions and structure as ANA. In principle QNA covers the entire sequence of accounts and balance sheets as reflected in the 2008 System of National Accounts (2008 SNA). The estimates herein are from a wide variety of sources including expenditure surveys, government accounts from the three tiers (Federal States and Local governments), trade statistics from the Nigerian Customs Services, Nigeria s Balance of Payments BOP compiled by the Central Bank of Nigeria and business/establishment survey among others. We are grateful to the various agencies and establishments that made their data available as input to the estimates. Dr. Yemi Kale, Statistician General, of the Federation National Bureau of Statistics, Abuja Nigeria. October 2017 Nigerian Gross Domestic Product Report (Expenditure and Income approach) - Q3, Q

4 Summary 1. In real terms year on year growth in GDP declined by 2.34% and 1.73%, in the third and fourth quarter respectively. Continuing the negative growth trend from the first half of Both household consumption and government consumption expenditures contributed to the fall in the third and fourth quarters, however a strong recovery in growth in net exports, particularly in the fourth quarter helped to stem the decline. 3. National Disposable Income recorded a strong growth in comparison to the GDP in the second half of 2016 in real terms. This is partly as a result of increases in other net transfers from the rest of the world. 4. Year on year growth in domestic Compensation of Employees declined in real terms. Operating surplus declined in the third and fourth quarters but grew overall in real terms in Overall, the economic environment which entered a recession in the first half of 2016, continued to remain challenging in the second half of the year. The rise in inflation and the decline in compensation of employees, contributed to the reduction in household consumption expenditure. In both the third and fourth quarter of 2016, growth in market price GDP was slightly slower than growth in basic price GDP, as a result of a decline in net taxes on products in the third quarter (of 5.04% year on year in real terms) and a growth of 6.99% in the fourth quarter. *Data may be subject to revisions Nigerian Gross Domestic Product Report (Expenditure and Income approach) - Q3, Q

5 Summary analysis of expenditure Components Although growth in total real GDP declined by 1.58 percent in real terms between 2015 and 2016 and grew 7.80% in nominal terms, this hides differing trends in the growth rates of its components. Figure 1: Percentage point contributions to year on year nominal growth rates of main expenditure components, and total GDP growth (basic prices) Figure 1 shows the contributions that each expenditure component made to year on year current price GDP growth, calculated as the growth of each component weighted by their importance to GDP, so that the sum of the bars in each quarter is equal to the growth rate in GDP. Growth in current price GDP was driven largely by household consumption, which recorded strong growth rates through most of 2016, However this is largely a result of an increase in prices; as constant price household consumption declined between 2015 and 2016, and particularly in the fourth quarter of Total nominal value of Net Exports grew in the fourth quarter of 2016, the first positive growth in total nominal value since 2015 Q2. However, the growth of exports in the third & fourth quarters could not stem the decrease in exports in the first half of 2016, and the significant year on year growth of the value of imports for the year For 2016 as a whole the net balance of trade in nominal terms was a deficit of N 2, 345 billion, compared to a deficit of N31 billion in By income measure, the decline in GDP growth in the second half of 2016 was driven largely by Compensation of Employees, which a recorded a negative annual growth rate in real terms of 9.68% n Growth for this item was positive in nominal terms, rising from 0.30% in 2015 to 4.31% in Nigerian Gross Domestic Product Report (Expenditure and Income approach) - Q3, Q
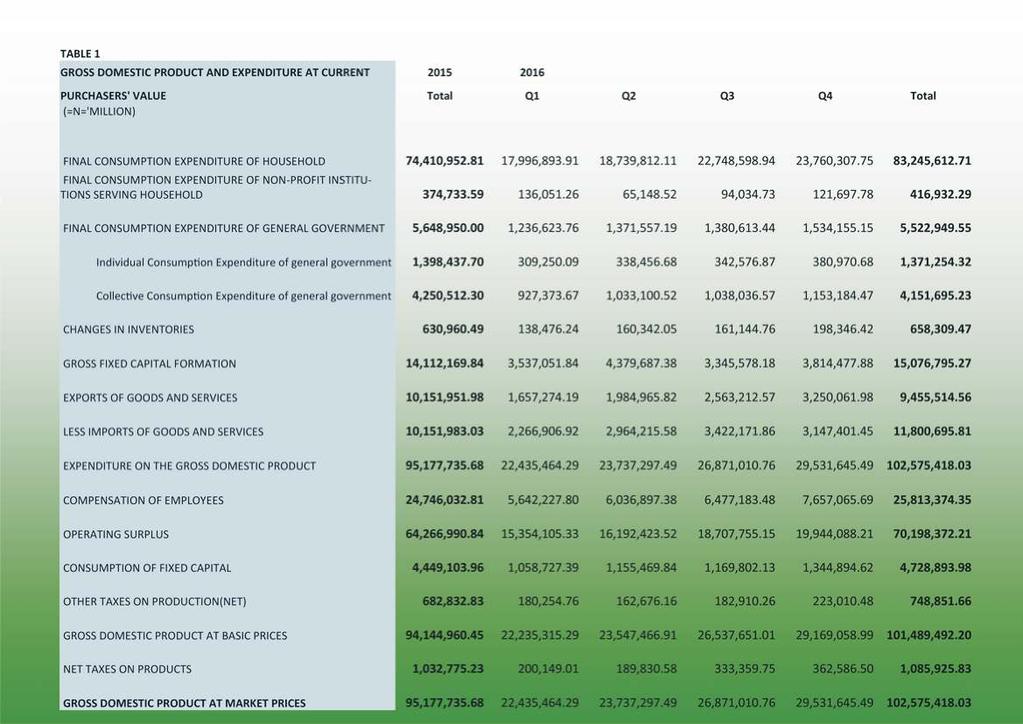
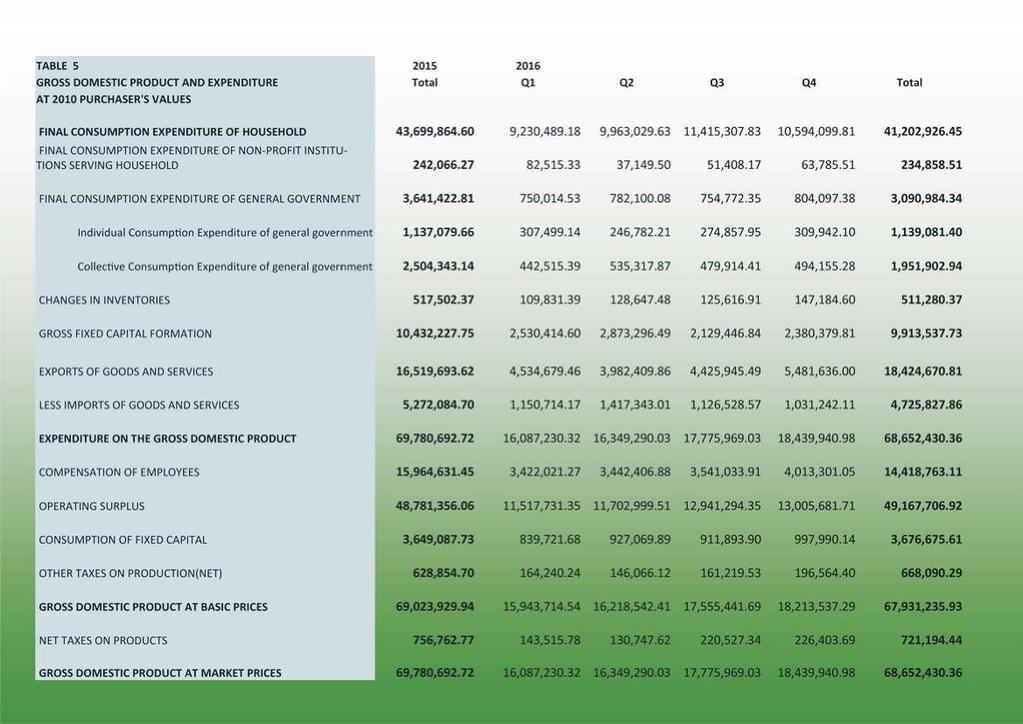
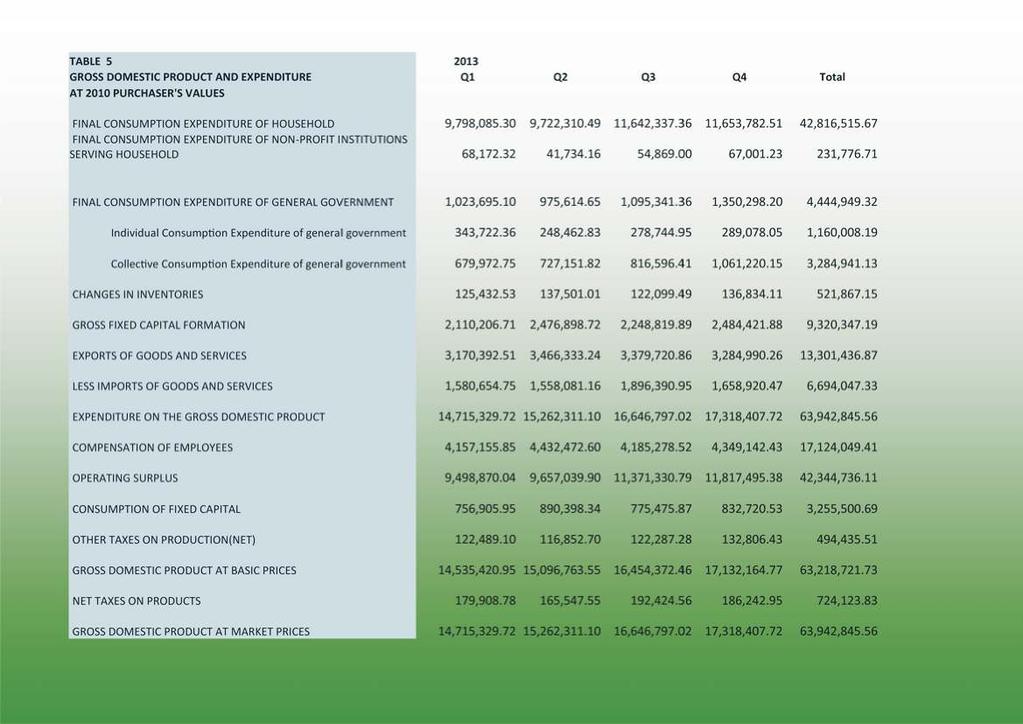
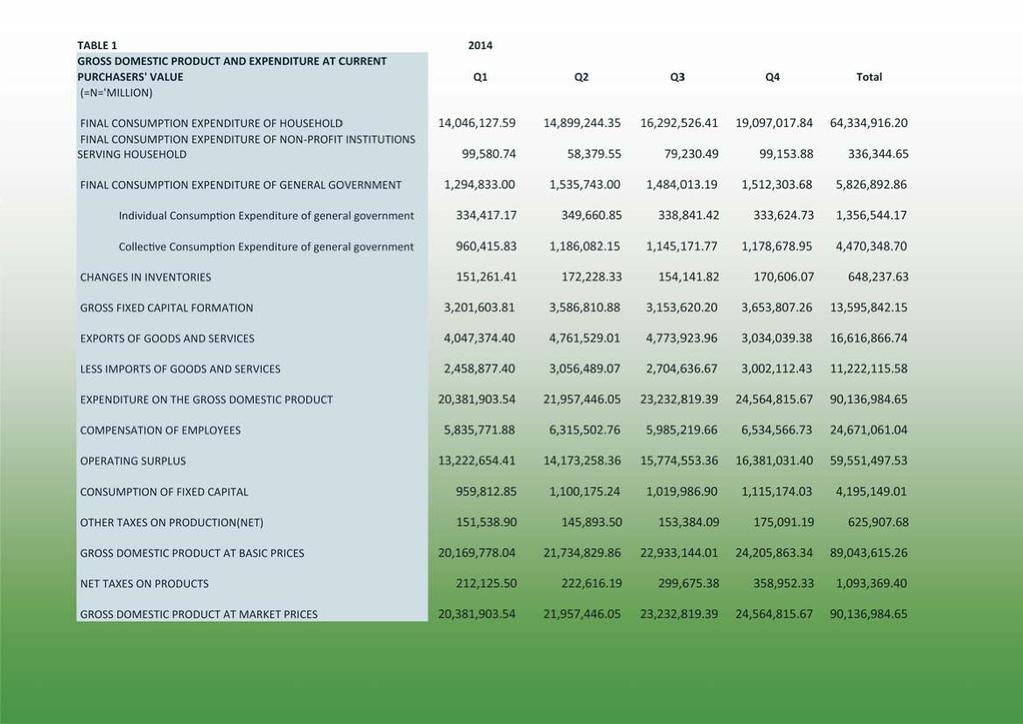
6 GDP By Expenditure The Gross Domestic Product (GDP) can be derived as the value of all goods and services available for final uses and export. GDP at market prices includes net taxes on products; this is subtracted to obtain basic price GDP. The expenditure approach measures the final uses of the produced output as the sum of Final consumption, Gross Capital Formation and Exports less Imports, which are considered in turn in this chapter. Consumption of fixed capital a measure of depreciation of assets comprises the difference between Gross Domestic Product (GDP) and Net Domestic Product (NDP) and is also considered in this chapter. Basic price GDP declined in real terms by 2.34% and 1.73% the third and fourth quarters of 2016 respectively, considerably lower than the growth rates of 2.84% and 2.11% that were recorded in the same quarters of Market price GDP declined at a similar rate in the third quarter at 2.38%, and a slightly slower rate1.63% in the fourth quarter as a result of faster growth in Net taxes in the fourth quarter. Household Final Consumption Expenditure: This consists of expenditure, including imputed expenditure, incurred by resident households on individual consumption goods and services. This is calculated as a residual. General Government Final Consumption Expenditure: This consists of expenditure, including imputed expenditure, incurred by government at all levels on both individual and collective consumption goods and services. Individual consumption items are those that are provided to individual households, such as education and health services. Collective consumption items relate to goods and services utilised by society as a whole, such as security and infrastructure. Not for Profit Institutions Serving Households Final Consumption Expenditure This consists of expenditure, including imputed expenditure, incurred by Not-for-Profit-Institutions- Serving-Households, which consist of organisations such as charities and non-government organisations. Gross Fixed Capital Formation This is measured as the total value of producer s acquisitions, less disposals, of fixed assets during the accounting period, plus certain additions to the value of non-produced assets (such as improvements to natural assets) realised by the productive activity of institutional units. Change in Inventories is the consist of changes in; stocks of outputs that are still held by units that produced them prior to their being further processed, sold, delivered to other units or used in other ways, measure by the value of the entries into inventories less the value of withdrawals and the value of any recurrent losses of goods held in inventories. Nigerian Gross Domestic Product Report (Expenditure and Income approach) - Q3, Q

7 Exports of Goods and Services Consists of sales of goods and services to residents abroad, to residents within Nigeria. Imports of Goods and Services Consists of sales of goods and services from residents abroad, to residents within Nigeria. Consumption of Fixed Capital This represents the reduction in value of the fixed assets used in production during the period, that results from physical deterioration, normal obsolescence or normal accidental damage. GDP Expenditure - Final Consumption Components Household Final Consumption Household consumption overall fell in real terms between 2014 and 2015 by 5.71% The general slowdown in the economy, particularly in the fourth quarter, may have contributed to households' decision to consume less and conserve more than in the previous year. This component accounted for 60.02% of real GDP in In nominal terms, this component nevertheless increased by 14.74%, reflecting the increase in prices over this period. Not-for-Profit-Institutions-Serving-Households (NPISH) After recording relatively strong growth in the beginning of 2016, this expenditure component recorded negative real growth in the second half of 2016; continued its decline by 6.90% in the third quarter, and recorded a slower decline of 3.18% in the fourth. In nominal terms, NPISH expenditure grew by 9.43% and 12.83% respectively in the third and fourth quarters. Despite this growth in nominal terms, overall expenditure of this component declined by 2.98% in Nigerian Gross Domestic Product Report (Expenditure and Income approach) - Q3, Q
8 GDP BY EXPENDITURE Q3, Q Final Consumption Expenditure of Household Full Year % Full Year % Contracted by From And % -2.39% 0.93% in Q in Q in Q Growth Rate Nigerian Gross Domestic Product Report (Expenditure and Income approach) - Q3, Q

9 GDP BY EXPENDITURE Q3, Q Final Consumption Expenditure of General Government Full Year 2016 Full Year % % Contracted by % in Q From % in Q And -6.29% in Q Growth Rate 7 Nigerian Gross Domestic Product Report (Expenditure and Income approach) - Q3, Q4 2016
10 General Government General government expenditure is predominantly on collective expenditure items; this subcomponent accounted for 63.15% of government expenditure in 2016, although this proportion is lower than the 68.77% recorded in Collective expenditure recorded steep declines in the third and fourth quarters of 2016, of 23.90% and 28.62% in real terms. Overall, this expenditure recorded the deepest decline amongst expenditure items at 22.1% in Individual consumption followed a different pattern; this component recorded a growth in real terms of 8.22% in the fourth quarter and a slight growth in real terms of 0.18% for the entire year. GDP Expenditure - Gross Capital Accumulation Gross Fixed Capital Formation (GFCF) Although GFCF recorded a growth in the second quarter, this item declined in real terms in both the third and fourth quarters by 8.60% and 7.97% respectively. Likewise, GFCF recorded a decline overall for 2016 of 4.97%. This decline is driven predominantly by decline of Non-residential Buildings, which accounted for 74.33% of real GFCF in In the second half of 2016, Non-residential buildings declined by 6.13% in the third quarter and 6.03% in the fourth quarter. Although Machinery and Equipment grew overall in 2016 by 2.79%, the growth was not enough to stem the decline of GFCF for Changes in inventories Changes in inventories, often regarded as a sign of economic competence (as firms stock up on products if they anticipate higher future demand) recorded the first growths in both real and nominal terms since This item grew in real terms by 1.05% in the third quarter, and by a strong 7.83% in the fourth quarter. The fourth quarter growth contributed to a slower decline overall in real terms, at 1.20% for the full year Consumption of Fixed Capital Consumption of fixed capital (defined in chapter 3) is a measure of depreciation of assets, and is not part of GDP but represents the difference between gross domestic product (GDP) and net domestic product (NDP). Consumption of fixed capital declined by 1.64% in real terms in the third quarter, but grew by 9.44% in the fourth. For the total year 2016, consumption of fixed capital grew slightly by 0.7% in real terms. Nigerian Gross Domestic Product Report (Expenditure and Income approach) - Q3, Q
11 GDP BY EXPENDITURE Q3, Q Changes in Inventories Full Year % Full Year % Grew by From And 7.83 % 1.05% -4.64% in Q in Q in Q Growth Rate Nigerian Gross Domestic Product Report (Expenditure and Income approach) - Q3, Q
12 GDP BY EXPENDITURE Q3, Q Gross Fixed Capital Formation Full Year 2016 Full Year % -1.32% Contracted by -7.97% in Q From And -8.60% -7.46% in Q in Q Growth Rate 10 Nigerian Gross Domestic Product Report (Expenditure and Income approach) - Q3, Q4 2016

13 As consumption of fixed capital recorded a higher growth rate than GDP in real terms in the third and fourth quarters, NDP declined by 2.67 and by 1.91% respectively. This compares to the decline of market price GDP at 2.38% in the third quarter and 1.63% in the fourth quarter. The positive growth trend of consumption of fixed capital contrasts with the declines in GFCF recorded in the third and fourth quarters of As a result, between these quarters and the corresponding periods of 2015 consumption of fixed capital increased as a proportion of GFCF, from 37.27% in 2015 Q4 to 41.93% in 2016 Q4. This represents an increasing need of investments in order to maintain the capital stock in later periods. GDP Expenditure - Trade Exports of Goods and Services The value of exports is greatly affected by the price of oil, given that a large percentage of the total value of exports consists of crude oil. Although there has been a decline in the value of exports in 2015 and in the first half of 2016, the fourth quarter recorded a growth of 26.80% from the previous quarter, and 54.40% from the same quarter in 2015, likely due to rising international dollar oil prices during the second half of However, this robust growth was unable to stem the general trend, as overall exports for 2016 declined by 6.86%. Imports of Goods and Services The value of imports continued its growth from the second quarter of 2016, growing 15.45% in third quarter, then declining 8.03% in the fourth. Overall, imports grew 16.24% in 2016, in contrast to the decline of 8.49% in This is likely affected by the increase in imports of mineral products by value recorded throughout out the year. Nigerian Gross Domestic Product Report (Expenditure and Income approach) - Q3, Q
14 GDP BY EXPENDITURE Q3, Q Exports of Goods and Services Full Year % Full Year % Grew by From And % 1.15% -3.58% in Q in Q in Q Growth Rate Nigerian Gross Domestic Product Report (Expenditure and Income approach) - Q3, Q

15 GDP BY EXPENDITURE Q3, Q Imports of Goods and Services Full Year 2016 Full Year % % Contracted by % in Q From % in Q And % in Q Growth Rate 13 Nigerian Gross Domestic Product Report (Expenditure and Income approach) - Q3, Q4 2016

16 Net Balance of Trade In the fourth quarter of 2016, the value of the balance of trade became positive for the first time since the third quarter of 2015; in the third quarter the deficit was N billion and in the fourth the surplus was N billion. The total deficit in 2016 was N 2, billion, a stark contrast to 2015, when the balance was a deficit of N 0.03 billion. Figure 2: Value of exports, imports and the balance of trade in N trillion (goods and services) National Disposable Income National Disposable Income (NDI) is equal to national income, plus net other current transfers from the rest of the world. It measures all of the income which is available for use by residents and firms in Nigeria. It differs slightly from GDP which can be thought of as the sum of all income produced in the economy, as some income produced in Nigeria is transferred to the rest of the world, and vice versa. National Income is calculated as the sum of domestic factor income (compensation of employees and operating surplus), external income (net compensation of employees and property income from the rest of world) and net taxes on production. Nigerian Gross Domestic Product Report (Expenditure and Income approach) - Q3, Q
17 GDP BY EXPENDITURE Q3, Q Expenditure on the Gross Domestic Product ( At Market Prices) Full Year % Full Year % Contracted by From And -1.63% -2.38% 1.77% in Q in Q in Q Growth Rate Nigerian Gross Domestic Product Report (Expenditure and Income approach) - Q3, Q
18 GDP BY EXPENDITURE Q3, Q Compensation of Employees (Wages and Salaries) Full Year 2016 Full Year % % Contracted by -2.03% in Q From And -8.55% -9.22% in Q in Q Growth Rate 16 Nigerian Gross Domestic Product Report (Expenditure and Income approach) - Q3, Q4 2016
19 Compensation of Employees This consists of total remuneration of employees in the formal sector, include both wages and salaries, and benefits in kind (such as pensions) Operating Surplus This is equal to the profit that remains for firms after costs have been covered. It includes the profit of those who are self-employed, which is often included in the national accounts under the entry Mixed Income. It is calculated as a residual. Compensation of Employees from rest of world (net) This is the same as domestic compensation of employees, other than that the remuneration is earned from institutional units not resident within Nigeria. Property and entrepreneurial income from rest of world (net) This is equal to operating surplus earned from non-resident units, plus property income earned from assets owned, minus interest payable in liabilities and rents payable on land or other tangible assets held abroad. Other Current Transfers from rest of world (net) These consist of transfers from non-resident units that are included as either compensation of employees or property and entrepreneurial income. They can include items such as remittances or net premiums and claims for non-life insurance. Net taxes on Products This represents total taxes payable on products, minus any subsidies received for the product. National Income Compensation of Employees In 2016, compensation of employees recorded an annual fall by 9.68% in real terms, following an over 8% annual fall in This component of national income has recorded negative year on year growth since the beginning of However, the real year on year decrease in employee compensation in the last two quarters (by 8.55% and 2.03% respectively) of 2016 were slower than the sharp declines in first two quarters(10.89% and 17.17% respectively) which indicated a sign of recovery in this component. Operating Surplus In 2016, operating surplus grew slightly by 0.79% in real terms, which was weaker than the 7.17% growth as recorded in The real growth rate of operating surplus fell negative in the last two quarters after continued declines in growth rate since the beginning of Nigerian Gross Domestic Product Report (Expenditure and Income approach) - Q3, Q
20 GDP BY EXPENDITURE Q3, Q Operating Surplus Full Year % Full Year % Contracted by From And -2.18% -0.98% 6.02% in Q in Q in Q Growth Rate Nigerian Gross Domestic Product Report (Expenditure and Income approach) - Q3, Q

21 The third quarter of 2016 was the first time that year on year operating surplus growth in real terms fell negative since However, the overall performance on operating surplus in 2016 was still relatively stronger than compensation of employees. Net Taxes on Products Net taxes on products started growing in the last quarter of 2016 at the rate of 6.88% in real terms, nevertheless the annual growth rate remained negative as 4.7%. All of the three components demonstrated significant growths in the second half of 2016 in nominal terms. However, given high inflation rates in 2016, most real growth rates remain negative. Figure 2: Y on Y Growth rates in domestic factor real incomes (%) Nigerian Gross Domestic Product Report (Expenditure and Income approach) - Q3, Q

.")
22 External Income Compensation of Employees Net compensation of employees received from the rest of the world increased by 58.00% and 40.36% in nominal terms in the third and the last quarter of 2016 respectively. With continued quarter on quarter growths of compensation of employees from the rest of the world in real terms in the second half of 2016, the last quarter of this year also witnessed an recovery in compensation of employees paid to the rest of the world (61.48% growth quarter on quarter growth rate). Compensation of employees from the RoW kept exceeding compensation of employees to RoW in 2016, resulting in significant growths in net compensation of employees from the rest of the world in both quarters. Property and Entrepreneurial Income The annual net property and entrepreneurial income to the rest of the world recorded over 2,251 billion Naira in In contrast to compensation of employees, property and entrepreneurial income from the rest of the world (net) has been negative since 2010, which indicates that property income paid to residents abroad is larger than property income received from assets and ventures abroad. In 2016, the difference became even larger in the last two quarters. Although property and entrepreneurial income from RoW and to RoW both grew strongly in nominal terms in Q3 & Q4, the latter indicator recorded a very minor year on year growth in Q3 (real) and a negative growth rate in Q4 (real). Therefore, net property and entrepreneurial income, which is dominated by income paid to the rest of the world, declined in both Q3 and Q4 in real terms. Nigerian Gross Domestic Product Report (Expenditure and Income approach) - Q3, Q
 - Q3, Q4 2016")
23 GDP BY EXPENDITURE Q3, Q Consumption of Fixed Capital Full Year % Full Year % Grew by From And 3.52 % 3.46% 3.04% in Q in Q in Q Growth Rate Nigerian Gross Domestic Product Report (Expenditure and Income approach) - Q3, Q
 - Q3, Q4 2016 22")
24 GDP BY EXPENDITURE Q3, Q Other Taxes on Production (NET) Full Year % Full Year % Grew by From And % 5.53% 9.90% in Q in Q in Q Growth Rate Nigerian Gross Domestic Product Report (Expenditure and Income approach) - Q3, Q

25 Other Current Transfers Other current transfers from the rest of the world (net), which includes transfers between resident and non-resident households such as remittances increased annually by 40.99% in nominal terms in Other current transfers from overseas greatly outweighed other current transfers to other countries. The fourth quarter recorded nominal increases on other current transfers in both directions. Net current transfer into Nigeria in both the third and the fourth quarter of 2016 (nominal) more than doubled compared to the numbers in the same periods of Capital Finance Capital finance is the sum savings, and consumption of fixed capital. It is equal to gross accumulation of capital; as all savings in the economy are invested, either as gross fixed capital formation, inventories, or as loans to the rest of the world. As with the difference between GDP and NDP (net domestic product) the word gross refers to the fact that consumption of fixed capital is included. Subtracting this value gives net capital accumulation. Savings Savings is measured as the difference between National Disposable Income and total consumption expenditure (of households, government and Not-for-Profit-Institutions-Serving-Households) Finance of Gross Accumulation This is equal to Savings + Consumption of Fixed Capital Consumption of Fixed Capital See chapter 1 Gross Fixed Capital Formation See chapter 1 Nigerian Gross Domestic Product Report (Expenditure and Income approach) - Q3, Q

26 Change in Inventories See chapter 1 Net lending to the rest of the world This represents savings, minus the value of acquisitions less disposables of financial assets, less the consumption of fixed capital. Essentially it is the amount that resident units in Nigeria are able to finance non-resident units. Savings Nominal savings in 2016 fell by 1.86% due to the depreciated value of Naira to other currencies, while real savings recorded a 28.61% annual growth. In the second half of 2016, the gap between savings in current prices and savings in constant prices remained large. Savings in the third quarter fell by 12.10% in nominal terms, followed by a 38.78% nominal growth in the last quarter. Net Lending to Rest of World Net Lending to rest of the world moves closely with export earnings. As such, net lending recorded strong year on year growths in real terms, of 33.21% in the third quarter, and of 69.85% in the fourth quarter of In nominal terms however, year on year net lending to the rest of the world fell sharply in the third and the fourth quarter, by more than 10 and 20 times compared to the same periods in Net lending to the rest of the world in real and nominal terms differs greatly, caused by the sharp depreciation of Naira currency since June, In 2016 overall, net lending to the rest of the world fell by142.26% in nominal terms, ending up with billion Naira debt, which was mainly caused by the large borrow in the first three quarters of the year. Although the last quarter recorded a positive net lending to the rest of the world ( billion Naira) in nominal terms, the effect on annual net lending was subdued by the continuous borrow in the first three quarters. Nigerian Gross Domestic Product Report (Expenditure and Income approach) - Q3, Q
27 GDP BY EXPENDITURE Q3, Q Gross Domestic Product at Basic Prices Full Year % Full Year % Contracted by From And -1.73% -2.34% 2.11% in Q in Q in Q Growth Rate Nigerian Gross Domestic Product Report (Expenditure and Income approach) - Q3, Q
28 GDP BY EXPENDITURE Q3, Q Gross Domestic Product at Market Prices Full Year % Full Year % Contracted by From And -1.63% -2.38% 1.77% in Q in Q in Q Growth Rate Nigerian Gross Domestic Product Report (Expenditure and Income approach) - Q3, Q
 - Q3, Q4")
29 Nigerian Gross Domestic Product Report (Expenditure and Income approach) - Q3, Q
30
31
32
33
34
35
36
37
38
39
40
41
42
43
44
45
46
47
48
49
50
51
52

53
54
55
56
57
58
59
60
61
62
63
64
65
66
67
68
69
70
71
72
73
74
75
76
77
78
79
80
81
82
83
84
85
86 Acknowledgements/Contacts Acknowledgements We acknowledge the contributions of our technical partner, Proshare in the design, concept and production of this publication. Contact NBSNigeria Head Office Address Plot 762,IndependenceAvenue,Central Business District,FCT, Abuja Nigeria Nigerian Gross Domestic Product Report (Expenditure and Income approach) - Q3, Q
18 NOV Nigerian Gross Domestic Product Report (expenditure approach) Q2 2015
 Q2 2015") 18 NOV 2015 Nigerian Gross Domestic Product Report (expenditure approach) Q2 2015 PREFACE This publication provides data on Quarterly Gross Domestic Product (GDP) by the EXPENDITURE approach estimates
18 NOV 2015 Nigerian Gross Domestic Product Report (expenditure approach) Q2 2015 PREFACE This publication provides data on Quarterly Gross Domestic Product (GDP) by the EXPENDITURE approach estimates
Retirement Savings Account (RSA) Membership Distribution
 Membership Distribution") Retirement Savings Account (RSA) Membership Distribution (Q1 2017) Report Date: April 2017 Data Source: National Bureau of Statistics / National Pension Commission Contents Executive Summary Retirement
Retirement Savings Account (RSA) Membership Distribution (Q1 2017) Report Date: April 2017 Data Source: National Bureau of Statistics / National Pension Commission Contents Executive Summary Retirement
INTEGRATED FINANCIAL AND NON-FINANCIAL ACCOUNTS FOR THE INSTITUTIONAL SECTORS IN THE EURO AREA
 INTEGRATED FINANCIAL AND NON-FINANCIAL ACCOUNTS FOR THE INSTITUTIONAL SECTORS IN THE EURO AREA In May 26 the published for the first time a set of annual integrated non-financial and financial accounts,
NATIONAL ACCOUNTS STATISTICS REPORT 2016
 NATIONAL ACCOUNTS STATISTICS REPORT 2016 STATISTICS REPORT. Private Bag 0024 Botswana Tel: (267) 367 1300. Toll Free: 0800 600 200. Fax: (267) 395 2201. Email: info@statsbots.org.bw Website: www.statsbots.org.bw
Pension Asset and Membership Data
 Pension Asset and Membership Data (Q2 2018) Report Date: August 2018 Data Source: National Bureau of Statistics / National Pension Commission Contents Executive Summary 1 RSA Membership Q2 Federal State
14 October 2013 Rev 25 SNA BASIC CONCEPTS (BASED ON SNA 2008)
") 14 October 2013 Rev 25 SNA BASIC CONCEPTS (BASED ON SNA 2008) CONCEPT Accumulation Asset Assets (produced) Assets (nonproduced) Asset (fixed) goods and services are used for the three economic activities
14 October 2013 Rev 25 SNA BASIC CONCEPTS (BASED ON SNA 2008) CONCEPT Accumulation Asset Assets (produced) Assets (nonproduced) Asset (fixed) goods and services are used for the three economic activities
Premium Motor Spirit (Petrol) Price Watch
 Price Watch") (February 2017) Report Date: February 2017 Data Source: National Bureau of Statistics (NBS) Contents Executive Summary 1 Average Petrol Prices Across States Average Petrol Prices Across Zones North Central
(February 2017) Report Date: February 2017 Data Source: National Bureau of Statistics (NBS) Contents Executive Summary 1 Average Petrol Prices Across States Average Petrol Prices Across Zones North Central
Economic ProjEctions for
 Economic Projections for 2016-2018 ECONOMIC PROJECTIONS FOR 2016-2018 Outlook for the Maltese economy 1 Economic growth is expected to ease Following three years of strong expansion, the Bank s latest
Premium Motor Spirit (Petrol) Price Watch
 Price Watch") Premium Motor Spirit (Petrol) Price Watch (MARCH 2017) Report Date: April 2017 Data Source: National Bureau of Statistics (NBS) Contents Executive Summary 1 Average Petrol Prices Across States Average
Premium Motor Spirit (Petrol) Price Watch (MARCH 2017) Report Date: April 2017 Data Source: National Bureau of Statistics (NBS) Contents Executive Summary 1 Average Petrol Prices Across States Average
NATIONAL ACCOUNTS STATISTICS TO KINGDOM OF TONGA. May Price: T$25.00
 SDT: 35-07 KINGDOM OF TONGA NATIONAL ACCOUNTS STATISTICS 2001-02 TO 2009-10 May 2011 Statistics Department P.O. Box 149, Nuku alofa Government of Tonga Telephone: (676) 23-300 / 23-913 Email: dept@stats.gov.to
National Accounts (Income and Expenditure): Year ended March 2012
: Year ended March 2012") National Accounts (Income and Expenditure): Year ended March 2012 Embargoed until 10:45am 21 November 2012 Key facts In the year ended March 2012: Current price gross domestic product (GDP) increased 3.7
National Accounts (Income and Expenditure): Year ended March 2012 Embargoed until 10:45am 21 November 2012 Key facts In the year ended March 2012: Current price gross domestic product (GDP) increased 3.7
Quarter 3, Copyrights Statistics Botswana 2018
 STATISTICS BOTSWANA GROSS DOMESTIC PRODUCT Quarter 3, 2018 Copyrights 2018. Private Bag 0024 Botswana Tel: (267) 367 1300. Fax: (267) 395 2201. Email: info@statsbots.org.bw Website: www.statsbots.org.bw
Operating Surplus, Mixed Income and Consumption of Fixed Capital 1
 Total Total Operating Surplus, Mixed Income and Consumption of Fixed Capital 1 Introduction This paper continues the series dedicated to extending the contents of the Handbook Essential SNA: Building the
MEASURING GDP AND ECONOMIC GROWTH
 21 MEASURING GDP AND ECONOMIC GROWTH GDP Defined GDP or gross domestic product is the market value of all final goods and services produced in a country in a given time period. This definition has four
Economic Projections for
 Economic Projections for 2015-2017 Article published in the Quarterly Review 2015:3, pp. 86-91 7. ECONOMIC PROJECTIONS FOR 2015-2017 Outlook for the Maltese economy 1 The Bank s latest macroeconomic projections
STATISTICS BOTSWANA GROSS DOMESTIC PRODUCT. No:2017/3. Third Quarter 2017
 No:2017/3 STATISTICS BOTSWANA GROSS DOMESTIC PRODUCT Third Quarter 2017 Copyrights 2017 Private Bag 0024, Gaborone. Tel: 367 1300 Fax: 395 2201 Toll Free: 0800 600 200 E-mail: info@statsbots.org.bw Website:
o c t o b e r H-1054 BUDAPEST, SZABADSÁG TÉR 9.
 october october Published by the Magyar Nemzeti Bank Publisher in charge: Eszter Hergár H-15 Budapest, Szabadság tér 9. www.mnb.hu ISSN -877 (print) ISSN -8758 (on-line) In accordance with Act CXXXIX
Economic Survey of Latin America and the Caribbean CHILE. 1. General trends. 2. Economic policy
 Economic Survey of Latin America and the Caribbean 2017 1 CHILE 1. General trends In 2016 the Chilean economy grew at a slower rate (1.6%) than in 2015 (2.3%), as the drop in investment and exports outweighed
PRELIMINARY ANNUAL NATIONAL ACCOUNTS 2014
 PRELIMINARY ANNUAL NATIONAL ACCOUNTS 2014 Est. by Statistics Act 9 of 2011 Preliminary Annual National Account 2014 Namibia Statistics Agency 1 MISSION STATEMENT In a coordinated manner we produce and
A new presentation for the quarterly National Accounts
 A new presentation for the quarterly National Accounts The Canadian System of National Accounts 2012 (CSNA2012) Section 1: Current presentation of the Canadian National Accounts Section 2: New presentation,
An Introduction to System of National Accounts - Basic Concepts
 Lesson-VI: Printable Lesson: VI Sequence of Accounts An Introduction to System of National Accounts - Basic Concepts Fourth e-learning Course on the 2008 System of National Accounts October December 2013
ECONOMY REPORT - JAPAN
 ECONOMY REPORT - JAPAN (Extracted from 2001 Economic Outlook) REAL GROSS DOMESTIC PRODUCT The Japanese economy was on a gradual recovery from the trough of the business cycle in April 1999, helped by both
Economic UpdatE JUnE 2016
 Economic Update June Date of issue: 30 June Central Bank of Malta, Address Pjazza Kastilja Valletta VLT 1060 Malta Telephone (+356) 2550 0000 Fax (+356) 2550 2500 Website https://www.centralbankmalta.org
Nigerian Gross Domestic Product Report
 Issue Quarter: Four Year: Nigerian Gross Domestic Product Report Quarter Four 2015 Preface This publication provides data on Quarterly Gross Domestic Product (GDP) estimates for the four quarters of 2014,
VIII. FINANCIAL STATISTICS
 VIII. FINANCIAL STATISTICS INTRODUCTION 405. The financial statistics covered in this chapter have broader sectoral coverage than the monetary statistics described in Chapter 7. The scope of the monetary
Projections for the Portuguese Economy:
 Projections for the Portuguese Economy: 2018-2020 March 2018 BANCO DE PORTUGAL E U R O S Y S T E M BANCO DE EUROSYSTEM PORTUGAL Projections for the portuguese economy: 2018-20 Continued expansion of economic
A Closer Look at U.S. Economic Weakness
 October 24, 2011 A Closer Look at U.S. Economic Weakness Stephen P. A. Brown and Hui Liu The most recent recession was the deepest of any since World War II. During the 2007 09 recession, U.S. real gross
MEDIUM-TERM FORECAST
 MEDIUM-TERM FORECAST Q2 2010 Published by: Národná banka Slovenska Address: Národná banka Slovenska Imricha Karvaša 1 813 25 Bratislava Slovakia Contact: Monetary Policy Department +421 2 5787 2611 +421
Note on the flow of funds in South Africa s national financial account for the year 2016
 Note on the flow of funds in South Africa s national financial account for the year 2016 by C Monyela and S Madonsela 1 Introduction The nominal value of financial flows in the South African economy declined
Projections for the Portuguese economy:
 Projections for the Portuguese economy: 217-19 7 Projections for the Portuguese economy: 217-19 1. Introduction The projections for the Portuguese economy point to a continued economic activity recovery
Selected Banking Sector Data: Sectorial Breakdown of Credit, epayment Channels and Staff Strength
 Selected Banking Sector Data: Sectorial Breakdown of Credit, epayment Channels and Staff Strength (Q1 2018) Report Date: May 2018 Data Source: National Bureau of Statistics (NBS) Contents Executive Summary
Chapter 5. Measuring a Nation s Production and Income. Macroeconomics: Principles, Applications, and Tools NINTH EDITION
 Macroeconomics: Principles, Applications, and Tools NINTH EDITION Chapter 5 Measuring a Nation s Production and Income During the recent deep economic downturn, economists, business writers, and politicians
2 Some Essential Macroeconomic Aggregates
 2 Some Essential Macroeconomic Aggregates 2.1 Defining Gross Domestic Product (GDP) 2.2 Deriving GDP in Volume 2.3 Defining Demand: the Role of Investment and Consumption 2.4 Reconciling Global Output
Gross domestic product, 2008 (Preliminary estimation)
") Internet publication www.ksh.hu Hungarian September 2009 Central Statistical Office ISBN 978-963-235-266-4 Gross domestic product, 2008 (Preliminary estimation) Contents Summary...2 Tables...4 Methodological
Internet publication www.ksh.hu Hungarian September 2009 Central Statistical Office ISBN 978-963-235-266-4 Gross domestic product, 2008 (Preliminary estimation) Contents Summary...2 Tables...4 Methodological
MEXICO. 1. General trends
 Economic Survey of Latin America and the Caribbean 2015 1 MEXICO 1. General trends Real GDP growth in Mexico in 2014 was 2.1%, up 0.7 percentage points on 2013. This increase stems from a good export performance,
Australian National Accounts
 30 June 1996 EMBARGO: 11:30 AM (CANBERRA TIME) MON 12 JAN 1998 Australian National Accounts National Balance Sheet ABS Catalogue No. 5241.0 NOTES The estimates included in this publication are consistent
Viet Nam GDP growth by sector Crude oil output Million metric tons 20
 Viet Nam This economy is weathering the global economic crisis relatively well due largely to swift and strong policy responses. The GDP growth forecast for 29 is revised up from that made in March and
Distance Learning Programme. IAS Prelims INDIAN ECONOMY
 Distance Learning Programme IAS Prelims INDIAN ECONOMY CONTENTS 1. Introduction to Economics 5-11 2. Concepts of National Income 12-20 3. Human Development 21-30 4. Poverty, Unemployment & Inequality 31-49
1 of 33. Measuring a Nation s Production and Income. 2 of 33
 1 of 33 2 of 33 The methods our government uses today to measure our economy, which we will study in this chapter, were developed in the 1930s. P R E P A R E D B Y FERNANDO QUIJANO, YVONN QUIJANO, AND
National-Income Accounting Part II
 National-Income Accounting Part II Nothing is more destructive than the gap between people's perceptions of their own day-to-day economic well-being and what politicians and statisticians are telling them
Structural changes in the Maltese economy
 Structural changes in the Maltese economy Article published in the Annual Report 2014, pp. 72-76 BOX 4: STRUCTURAL CHANGES IN THE MALTESE ECONOMY 1 Since the global recession that took hold around the
NATIONAL ACCOUNTS STATISTICS
 SDT: 35-06 KINGDOM OF TONGA NATIONAL ACCOUNTS STATISTICS 2010 October 2010 Statistics Department P.O. Box 149, Nuku alofa Government of Tonga Telephone: (676) 23-300 / 23-913 Fax : (676) 24-303 Email :
National Accounts
 Republic of Namibia National Accounts 1996 2006 Sectoral Contribution to GDP, 2006 Primary Sector 22.1% Tertiary Sector 51.6% Secondary Sector 18.4% Central Bureau of Statistics National Planning Commission
Swiss Balance of Payments and International Investment Position 2016
 Swiss Balance of Payments and International Investment Position 216 Swiss Balance of Payments and International Investment Position 216 Volume 3 Contents Page 1 Overview 4 Introductory remarks 4 Changes
Economic Projections :1
 Economic Projections 2017-2020 2018:1 Outlook for the Maltese economy Economic projections 2017-2020 The Central Bank s latest economic projections foresee economic growth over the coming three years to
The use of business services by UK industries and the impact on economic performance
 The use of business services by UK industries and the impact on economic performance Report prepared by Oxford Economics for the Business Services Association Final report - September 2015 Contents Executive
BALANCE OF PAYMENTS: BALANCES TABLE 1.1. SOURCE: Banco de España.
 1 OVERVIEW 1 Overview This chapter summarises the most salient developments in the balance of payments and in the international investment position in 28, along with the main changes introduced in connection
Economic Survey December 2006 English Summary
 Economic Survey December English Summary. Short term outlook Reaching an annualized growth rate of.5 per cent in the first half of, GDP growth in Denmark has turned out considerably stronger than expected
Note de conjuncture n
 Note de conjuncture n 1-2005 Growth accelerates in 2004, expected to slow down in 2005 STATEC has just published Note de Conjoncture No. 1-2005. The first issue of the year serves as an "Annual Economic
INCREASING THE RATE OF CAPITAL FORMATION (Investment Policy Report)
") policies can increase our supply of goods and services, improve our efficiency in using the Nation's human resources, and help people lead more satisfying lives. INCREASING THE RATE OF CAPITAL FORMATION
policies can increase our supply of goods and services, improve our efficiency in using the Nation's human resources, and help people lead more satisfying lives. INCREASING THE RATE OF CAPITAL FORMATION
Gross Domestic Product registered a year-on-year rate of change of 2.1%
 Quarterly National Accounts (Base 2011) First Quarter 2018 30 May 2018 Gross Domestic Product registered a year-on-year rate of change of 2.1% Portuguese Gross Domestic Product (GDP) recorded in the first
Malaysia. Real Sector. Economic recovery is gaining momentum.
 Malaysia Real Sector Economic recovery is gaining momentum. Malaysia s economy grew 4.7% in the first three quarters of 23, well above the year-earlier pace of 3.7%. GDP rose 5.1% in the third quarter,
Nigerian Gross Domestic Product Report
 Issue 03 Quarter: Three Year: Nigerian Gross Domestic Product Report Quarter Three NATIONAL BUREAU OF STATISTICS Preface This publication provides data on Quarterly Gross Domestic Product (GDP) estimates
Decision Makers and Markets
 Decision Makers and Markets Households S FINANCIAL Wages Rent Interest Profit T Budget C I Factors M. (Capital Labor) Government G Goods & Services Rest of world Firms Decision Makers and Markets Households
National Accounts Statistics Report 2015
 National Accounts Statistics Report 2015 Private Bag 0024, Gaborone. Tel: 3671300 Fax: 3952201 E-mail: info@statsbots.org.bw Website: http://www.statsbots.org.bw 2. Preface Published by STATISTICS BOTSWANA
In fiscal year 2016, for the first time since 2009, the
 Summary In fiscal year 216, for the first time since 29, the federal budget deficit increased in relation to the nation s economic output. The Congressional Budget Office projects that over the next decade,
Guidelines for the Notes on National Accounts Methodology
 Guidelines for the Notes on National Accounts Methodology In addition to the national accounts data, metadata on the national accounts methodology is published in the United Nations publication: National
BELIZE. 1. General trends
 Economic Survey of Latin America and the Caribbean 2016 1 BELIZE 1. General trends Economic growth fell from 4.1% in 2014 to 1.2% in 2015, as slower activity later in the year pulled down the average for
Economic Projections :2
 Economic Projections 2018-2020 2018:2 Outlook for the Maltese economy Economic projections 2018-2020 The Central Bank s latest economic projections foresee economic growth over the coming three years to
Published by the Stationery Office, Dublin, Ireland.
 An Phríomh-Oifig Staidrimh Central Statistics Office Published by the Stationery Office, Dublin, Ireland. Available from: Central Statistics Office, National Accounts, Ardee Road, Dublin 6. October 2013
Published by the Stationery Office, Dublin, Ireland.
 An Phríomh-Oifig Staidrimh Central Statistics Office Published by the Stationery Office, Dublin, Ireland. Available from: Central Statistics Office, National Accounts, Ardee Road, Dublin 6. November 2012
Austria s economy set to grow by close to 3% in 2018
 Austria s economy set to grow by close to 3% in 218 Gerhard Fenz, Friedrich Fritzer, Fabio Rumler, Martin Schneider 1 Economic growth in Austria peaked at the end of 217. The first half of 218 saw a gradual
Updated System of National Accounts (SNA): Chapter 16: Summarising and integrating the accounts
: Chapter 16: Summarising and integrating the accounts") Statistical Commission Thirty-ninth session 26 29 February 2008 Item 3(d) of the provisional agenda Items for discussion and decision: National accounts Background document Available in English only Updated
Statistical Commission Thirty-ninth session 26 29 February 2008 Item 3(d) of the provisional agenda Items for discussion and decision: National accounts Background document Available in English only Updated
International Journal of Business and Economic Development Vol. 4 Number 1 March 2016
 A sluggish U.S. economy is no surprise: Declining the rate of growth of profits and other indicators in the last three quarters of 2015 predicted a slowdown in the US economy in the coming months Bob Namvar
DOMINICAN REPUBLIC. 1. General trends
 Economic Survey of Latin America and the Caribbean 2015 1 DOMINICAN REPUBLIC 1. General trends The economy of the Dominican Republic grew by 7.3% in 2014, compared with 4.8% in 2013, driven by expanding
Net lending of the Portuguese economy increased to 1.1% of GDP
 22 December 2017 Quarterly Sector Accounts (Base 2011) Third Quarter 2017 Net lending of the Portuguese economy increased to 1.1% of GDP The net lending of the economy stood at 1.1% of the Gross Domestic
Structural Changes in the Maltese Economy
 Structural Changes in the Maltese Economy Dr. Aaron George Grech Modelling and Research Department, Central Bank of Malta, Castille Place, Valletta, Malta Email: grechga@centralbankmalta.org Doi:10.5901/mjss.2015.v6n5p423
Spain s economic recovery gains speed, but the external balance worsens
 Spain s economic recovery gains speed, but the external balance worsens Ángel Laborda and María Jesús Fernández 1 Correction of imbalances, together with structural reform and exogenous factors, supports
Test Yourself: National-Income Accounting
 Test Yourself: National-Income Accounting Nothing is more destructive than the gap between people's perceptions of their own day-to-day economic well-being and what politicians and statisticians are telling
REPORT ON THE B ALANCE OF PAYMENTS
 REPORT ON THE B ALANCE OF PAYMENTS 18 J A N U A RY Published by the Magyar Nemzeti Bank Publisher in charge: Eszter Hergár H-1 Budapest, Szabadság tér 9. www.mnb.hu ISSN -877 (print) ISSN -878 (on-line)
Objectives AGGREGATE DEMAND AND AGGREGATE SUPPLY
 AGGREGATE DEMAND 7 AND CHAPTER AGGREGATE SUPPLY Objectives After studying this chapter, you will able to Explain what determines aggregate supply Explain what determines aggregate demand Explain macroeconomic
GROSS DOMESTIC PRODUCT FOR 2011 FINAL DATA
 GROSS DOMESTIC PRODUCT FOR 2011 FINAL DATA In 2011 GDP at current prices amounts to 75 308 million Levs. GDP at 2005 constant prices increases by 1.8 % compared to the previous year. GDP, current prices
China Economic Update Q April 27, 2018
 il 27, 2018 Key Developments in Brief Economic Development Drivers of Growth Risks Predicted GDP growth of 6.5% in Service and modern production Corporate debt, esp. stateowned 2018 grow fast enterprises
Notes Numbers in the text and tables may not add up to totals because of rounding. Unless otherwise indicated, years referred to in describing the bud
 CONGRESS OF THE UNITED STATES CONGRESSIONAL BUDGET OFFICE The Budget and Economic Outlook: 4 to 4 Percentage of GDP 4 Surpluses Actual Projected - -4-6 Average Deficit, 974 to Deficits -8-974 979 984 989
GROSS DOMESTIC PRODUCT, FIRST QUARTER OF 2018 (PRELIMINARY DATA)
") GROSS DOMESTIC PRODUCT, FIRST QUARTER OF 2018 (PRELIMINARY DATA) In the first quarter of 2018 Gross Domestic Product (GDP) 1 at current prices amounts to 21 479 million BGN. In Euro terms GDP is 10 982
GROSS DOMESTIC PRODUCT, FIRST QUARTER OF 2018 (PRELIMINARY DATA) In the first quarter of 2018 Gross Domestic Product (GDP) 1 at current prices amounts to 21 479 million BGN. In Euro terms GDP is 10 982
Guidelines for the Notes on National Accounts Methodology
 Guidelines for the Notes on National Accounts Methodology In addition to the national accounts data, metadata on the national accounts methodology is published in the United Nations publication: National
Usable Productivity Growth in the United States
 Usable Productivity Growth in the United States An International Comparison, 1980 2005 Dean Baker and David Rosnick June 2007 Center for Economic and Policy Research 1611 Connecticut Avenue, NW, Suite
PERU. 1. General trends
 Economic Survey of Latin America and the Caribbean 2015 1 PERU 1. General trends Peru s gross domestic product (GDP) grew by 2.4% in 2014, compared with 5.8% in 2013. This slowdown was due mainly to the
Lesson: VII Expenditure Components of GDP: Part I
 An Introduction to System of National Accounts Lesson: VII Expenditure Components of GDP: Part I Fourth Intermediate-Level e-learning Course on 2008 System of National Accounts September - November 2014
THE CONSTRUCTION SECTOR IN 2015
 THE CONSTRUCTION SECTOR IN 215 Article published in the Quarterly Review 216:2, pp. 25-32 BOX 2: THE CONSTRUCTION SECTOR IN 215 1 This Box reviews developments in the construction and real estate sectors
BELIZE. 1. General trends
 Economic Survey of Latin America and the Caribbean 2017 1 BELIZE 1. General trends The Belizean economy experienced a reversal of fortunes in 2016, with growth dropping to -0.8% from 2.9% in 2015. A sharp
Economic Bulletin. June Lisbon,
 Economic Bulletin June 2017 Lisbon, 2017 www.bportugal.pt Economic Bulletin June 2017 Banco de Portugal Av. Almirante Reis, 71 1150-012 Lisboa www.bportugal.pt Edition Economics and Research Department
SOUTH ASIA. Chapter 2. Recent developments
 SOUTH ASIA GLOBAL ECONOMIC PROSPECTS January 2014 Chapter 2 s GDP growth rose to an estimated 4.6 percent in 2013 from 4.2 percent in 2012, but was well below its average in the past decade, reflecting
Session 5 Supply, Use and Input-Output Tables. The Use Table
 Session 5 Supply, Use and Input-Output Tables The Use Table Introduction A use table shows the use of goods and services by product and by type of use for intermediate consumption by industry, final consumption
El Salvador. 1. General trends. 2. Economic policy. Most macroeconomic indicators for El Salvador worsened in Real GDP increased by
 Economic Survey of Latin America and the Caribbean 2008-2009 173 El Salvador 1. General trends Most macroeconomic indicators for El Salvador worsened in 2008. Real GDP increased by 2.5%, two percentage
Preliminary Annual. National Accounts. Preliminary Annual National Accounts 2016
 Preliminary Annual National Accounts 2016 Preliminary Annual National Accounts 2016 1 Mission Statement In a coordinated manner produce and disseminate relevant, quality and timely statistics that are
Manual on the Changes between ESA 95 and ESA 2010
 EUROPEAN COMMISSION EUROSTAT Directorate C: National Accounts, Prices and Key Indicators Manual on the Changes between ESA 95 and ESA 2010 The Manual on the Changes between ESA 95 and ESA 2010 sets out
DOMINICAN REPUBLIC. 1. General trends
 Economic Survey of Latin America and the Caribbean 2016 1 DOMINICAN REPUBLIC 1. General trends The economy of the Dominican Republic grew by 7.0% in 2015, compared with 7.3% in 2014. That growth is driven
Project LINK October, 2012 Country Report: Turkey. Prepared by
 Project LINK October, 212 Country Report: Turkey Prepared by Suleyman Ozmucur University of Pennsylvania, Department of Economics and Bogazici University, Center for Economics & Econometrics, Istanbul,
Business Expectations Survey March 2014 Summary Review
 Business Expectations Survey March 2014 Summary Review 1. Introduction The BES reports on current confidence levels among local businesses as well as their expectations of movements in key economic indicators.
NBER WORKING PAPER SERIES U.S. GROWTH IN THE DECADE AHEAD. Martin S. Feldstein. Working Paper
 NBER WORKING PAPER SERIES U.S. GROWTH IN THE DECADE AHEAD Martin S. Feldstein Working Paper 15685 http://www.nber.org/papers/w15685 NATIONAL BUREAU OF ECONOMIC RESEARCH 1050 Massachusetts Avenue Cambridge,
Section 3: Explanatory notes
 Section 3: Explanatory notes Chart 1 The chart breaks the annual growth of households nominal disposable income per capita down into the contributions of the income components, and supplements this with
BALANCE OF PAYMENTS & INTERNATIONAL INVESTMENT POSITION
 BALANCE OF PAYMENTS & INTERNATIONAL INVESTMENT POSITION FOR THE QUARTER ENDED DECEMBER 2012 QUARTERLY FAST FACTS Current Account The Bermuda current account recorded a surplus of $189 million in the fourth
Quarterly Spanish National Accounts. Base 2000
 17 November 2010 Quarterly Spanish National Accounts. Base 2000 Third quarter of 2010 Quarterly National Accounts (GDP) Latest data Year-on-year growth rate Quarter-on-quarter growth rate Third quarter
NATIONAL ACCOUNTS REPORT 2006
 THE COMMONWEALTH OF THE BAHAMAS NATIONAL ACCOUNTS REPORT 2006 DEPARTMENT OF STATISTICS Clarence Bain Building Regent Center P. O. Box N-3904 P. O. Box F-42561 Nassau, Bahamas Freeport, Bahamas Telephone:
Outlook for Economic Activity and Prices
 Not to be released until : p.m. Japan Standard Time on Thursday, May 1, 8. May 1, 8 Bank of Japan Outlook for Economic Activity and Prices April 8 (English translation prepared by the Bank's staff based
Report Documentation Page Form Approved OMB No Public reporting burden for the collection of information is estimated to average 1 hour per re
 Testimony The Budget and Economic Outlook: 214 to 224 Douglas W. Elmendorf Director Before the Committee on the Budget U.S. House of Representatives February 5, 214 This document is embargoed until it
International economy in the first quarter of 2009
 The article is based on data with cutoff date as of June, 9. I volume, 8/9B International economy in the first quarter of 9 GLOBAL ECONOMY The GDP development in OECD countries recorded a further decrease
Guatemala. 1. General trends. 2. Economic policy. In 2009, the Guatemalan economy faced serious challenges as attempts were made to mitigate
 Economic Survey of Latin America and the Caribbean 2009-2010 161 Guatemala 1. General trends In 2009, the Guatemalan economy faced serious challenges as attempts were made to mitigate the impact of the
QUARTERLY REVIEW 2018
 QUARTERLY REVIEW 218 Vol. 51 No. 2 Central Bank of Malta, 218 Address Pjazza Kastilja Valletta VLT 6 Malta Telephone (+356) 255 Fax (+356) 255 25 Website www.centralbankmalta.org E-mail info@centralbankmalta.org