arbara School Distri ts S cond Int rim R port March 1 0, 20 9
|
|
|
- Osborne Dawson
- 6 years ago
- Views:
Transcription
1 T ---SantaBarbara --- SCHOOL DISTRICTS anta arbara School Distri ts S cond Int rim R port March 1 0, Santa Barbara Street / Santa Barbara. CA / (805) /
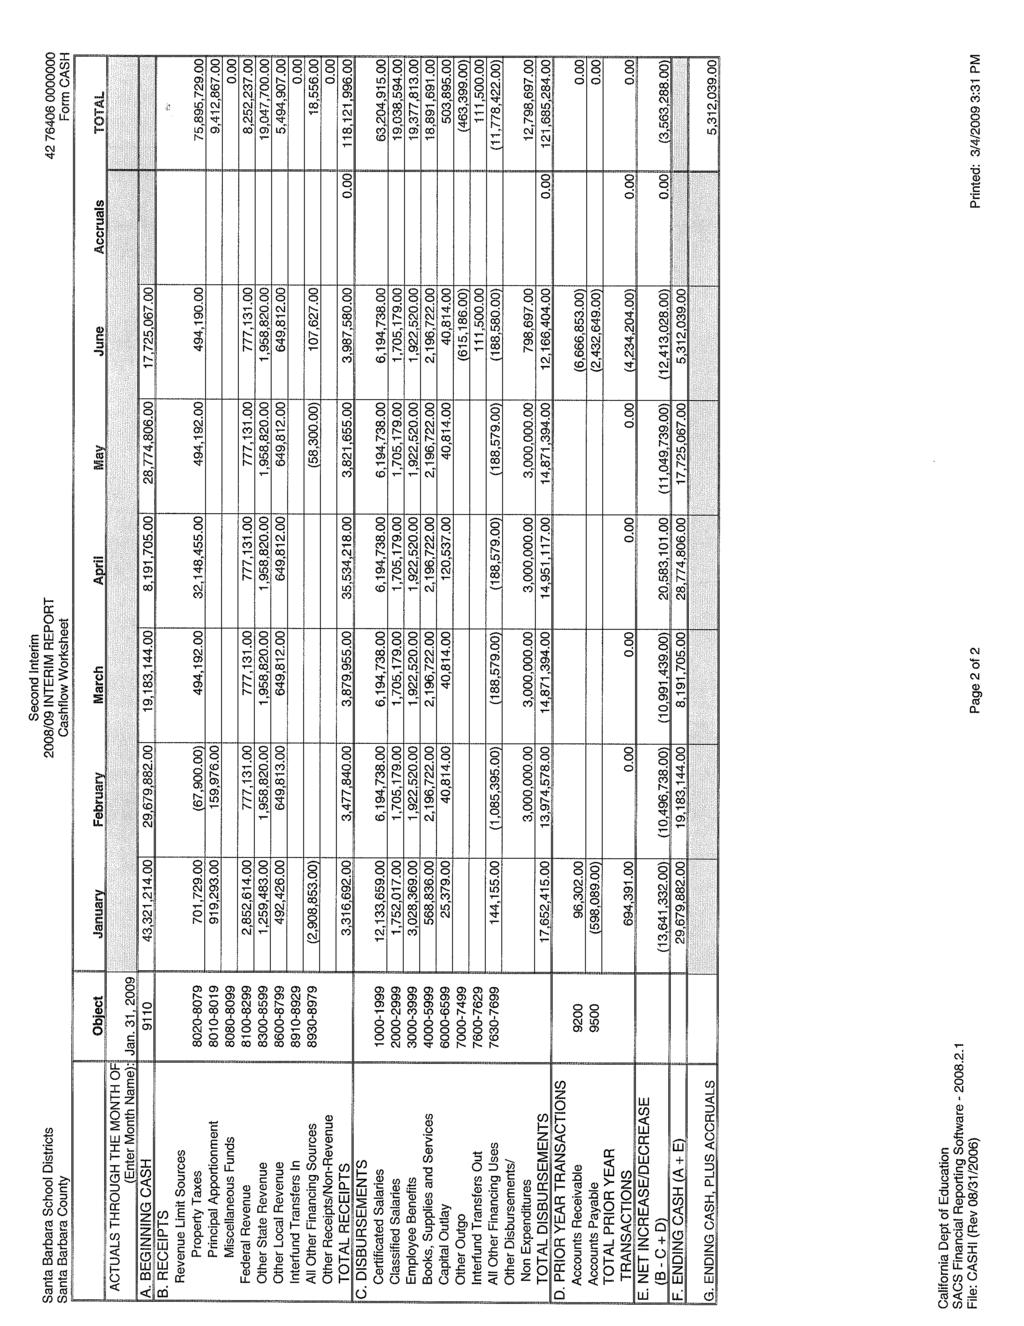
2 TO: FROM: Board of Education Eric D. Smith, Deputy Superintendent of Business Services DATE: March 5, 2009 RE: Second Interim Report Narrative The Fiscal Year Second Interim Report for the Santa Barbara School Districts has been prepared for the board s review and approval. The Second Interim Report reflects the most current assumptions as reported on the School Services of California School District and County Office Financial Projection Dartboard SECOND INTERIM REPORT (COMBINED) Form First Interim Budget Second Interim Budget Form01-General Fund $122,341, $ 121,422,706 Form12-Child Development Fund $ 4,986, $ 5,533,173 Form13-Cafeteria Special Revenue Fund $ 4,664, $ 4,653,932 Form14-Deferred Maintenance Fund $ 1,727, $ 1,746,043 Form21-Building Fund $ 4,735, $ 1,179,191 Form25-Capital Facilities Fund $ 3,687, $ 3,844,333 Form35-County School Facilities Fund $ 1,230, $ 1,262,401 Form40 Special Reserve Fund (Capital Outlay) $ 524, $ 532,191 Form51-Bond Interest and Redemption Fund $ 11,669, $ 6,928,647 Form67-Self-Insurance Fund $ 38, $ 1,518,000 Form71-Retiree Benefit Fund $ 3,134, $ 3,134,486 Total, Expenditures, Transfers Out and Uses $ 158,741, $ 154,721,981 GENERAL FUND REVENUES, TRANSFERS IN AND SOURCES First Interim Budget Second Interim Budget Unrestricted Restricted Unrestricted Restricted Revenue Limit Sources $ 83,871, $ 4,231, $ 81,151, $ 4,157, Federal Revenue $ 7,042, $ 476, $ 7,775, Other State Revenue $ 5,787, $13,947, $ 5,917, $ 14,058, Other Local Revenue $ 2,965, $ 1,899, $ 2,783, $ 2,711, Transfers In/Sources $ - $ - $ - $ - Contributions $ (12,164,253.00) $12,164, $(11,251,091.00) $ 11,251, Total $ 80,459, $39,284, $ 79,078, $ 39,953, Total $120,125, $119,031,
3 GENERAL FUND EXPENDITURES, TRANSFERS OUT AND USES First Interim Budget Second Interim Budget Unrestricted Restricted Unrestricted Restricted Certificated Salaries $ 48,039, $ 14,314, $ 48,031, $ 15,173, Classified Salaries $ 11,017, $ 7,783, $ 11,044, $ 7,993, Employee Benefits $ 13,712, $ 5,609, $ 13,379, $ 5,998, Books and Supplies $ 2,024, $ 6,532, $ 1,500, $ 5,060, Operating $ 6,954, $ 5,422, $ 6,842, $ 5,488, Capital Outlay $ 150, $ 230, $ 172, $ 331, Other Outgo $ 91, $ 20, $ 91, $ 20, Support Costs $ (1,413,466.00) $ 808, $ (1,468,468.00) $ 853, Transfers Out $ 458, $ 585, $ 519, $ 389, Total $ 81,034, $ 41,307, $ 80,113, $ 41,309, Total $ 122,341, SECOND INTERIM REPORT SUMMARY OF CHANGES First Second Form 01-General Fund Interim Budget Interim Budget Net Change Unrestricted Revenues Undesignated $83,871, $ 81,151, $ (2,719,950) State Lottery $ 1,683, $ 1,561, $ (121,245.00) Class Size Reduction / 9-12 $ 321, $ 321, $ 0.00 Class Size Reduction Operation, K-3 $ 2,755, $ 2,623, $ (132,749.00) Contributions to Restricted Programs $ (12,164,253.00) $ (11,251,181.00) $ 913, Sub-Total, Unrestricted Revenues $76,467, $ 74,406,461.00$ 2,060, Restricted Revenues Continuation Education $ 1,321, $ 1,252, $ (69,001.00) Community Day School $ 417, $ 393, $ (24,596.00) Title I Basic Grant Low Income $ 2,280, $ 2,821, $ 541, Title I Part A Non-Program Improvement $ 150, $ 150, $ - Special Education / PL $ 3,220, $ 4,102, $ 900,802.00) SB Middle School Workability Program $ 247, $ 247, $ - Vocational Education Act /Voc & Application Secondary IIC $ 135, $ 135, $ - Drug Free School Entitlements $ 53, $ 28, $ (24,656.00) Title II - Teacher Quality $ 655, $ 670, $ 14, Title II Technology $ 22, $ 40, $ 17, Title II EETT Competitive Grant $ 128, $ 111, $ (16,515.65) Title III Immigrant Education $ 70, $ 65, $ (4,891.00) Title III Limited English Proficiency $ 355, $ 405, $ 50, Title V - IASA $ 13, $ 13, $ - Medi-Cal Billing $ 35, $ 35, $ - Other Federal $ 88, $ 88, $ - FEMA Hazard $ 30, $ 30, $ - After School Education and Safety $ 787, $ 833, $ 45, Cal-Safe Academic and Supportive Services $ 172, $ 172, $ - Cal-Safe Child Care and Development Services $ 199, $ 199, $ - Community Based English Tutoring Program $ 74, $ 81, $ 6, English Language Acquisition $ 176, $ 181, $ 4, Lottery / Instructional Materials $ 271, $ 271, $ - 2
4 SECOND INTERIM REPORT SUMMARY OF CHANGES-Continued First Second Form 01-General Fund Interim Budget Interim Budget Net Change School Safety and Violence Prevention $ 377, $ 377, $ - Special Education $13,468, $ 12,329, $(1,139,865.00) Tobacco Use Prevention Education $ 17, $ 39, $ 22, Arts and Music Block Grant $ 273, $ 273, $ CA Instruction Gardens $ $ 4, $ 4, CAHSEE Intensive Instruction $ 208, $ 207, $ (274.00) Supplemental School Counseling $ 692, $ 692, $ - Economic Impact Aid $ 62, $ - $ (62,516.00) Economic Impact Aid (LEP) $ 2,175, $ 2,189, $ 14, Early Intervention $ 2, $ 2, $ - Gifted and Talented Education (GATE) $ 142, $ 142, $ - Instructional Material Realignment $ 1,054, $ 1,152, $ 98, Partnership Academies Program $ 162, $ 162, $ - Transportation-Home To School $ 685, $ 685, $ - Transportation-Special Ed $ 920, $ 920, $ - Peer Assistance and Review (PAR) $ 73, $ 73, $ - Pupil Retention Block Grant $ 617, $ 617, $ - Professional Development Block Grant $ 826, $ 165, $ (661,082.00) Targeted Instructional Block Grant $ 332, $ 305, $ (26,700.21) School/Library Improvement Block Grant $ 1,266, $ 1,266, $ - Quality Education Investment Accounts $ 297, $ 297, $ - Routine Restricted Maintenance $ 3,510, $ 3,510, $ - Donations $ 1,346, $ 2,164, $ 818, Sub-Total, Restricted Revenues $39,442, $ 39,953, $ (510,552.00) Total, Revenues $115,910, $114, Unrestricted Expenditures Undesignated $76,159, $ 67,667, $ (8,492,676.85) State Lottery $ 1,562, $ 1,111, $ (450,521.00) Class Size Reduction / 9-12 $ 556, $ 561, $ 4, Class Size Reduction, K-3 Operations $ 2,755, $ 10,773, $ 8,017, Sub-Total, Unrestricted Expenditures $81,034, $ 80,113, $ (921,437.85) Restricted Expenditures Continuation Education $ 1,769, $ 1,219, $ (549,944.00) Community Day School $ 417, $ 393, $ 24, Title I Basic Grant Low Income $ 2,280, $ 2,821, $ 541, Title I Part A Non-Program Improvement $ 150, $ 150, $ - Special Education / PL $ 3,220, $ 4,120, $ 900, SB Middle School Workability Program $ 247, $ 247, $ - Vocational Education Act /Voc & Application Secondary IIC $ 135, $ 135, $ - Drug Free School Entitlements $ 53, $ 51, $ (2,040.00) Title II - Teacher Quality $ 655, $ 670, $ 14, Title II Technology $ 22, $ 40, $ 17, Title II EETT Competitive Grant $ 111, $ 111, $ - Title III Immigrant Education $ 70, $ 65, $ (4,891.00) Title III Limited English Proficiency $ 355, $ 405, $ 50, Title V - IASA $ $ 13, $ 13, Medi-Cal Billing $ 35, $ 69, $ 34,
5 SECOND INTERIM REPORT SUMMARY OF CHANGES-Continued First Second Form 01-General Fund Interim Budget Interim Budget Net Change Other Federal $ 88, $ 88, $ - FEMA Hazard $ 30, $ 30, $ - After School Education and Safety $ 787, $ 833, $ 45, Cal-Safe Academic and Supportive Services $ 172, $ 172, $ - Cal-Safe Child Care and Development Services $ 199, $ 199, $ - Community Based English Tutoring Program $ 74, $ 117, $ 43, English Language Acquisition $ 232, $ 206, $ (26,656.00) Lottery / Instructional Materials $ 409, $ 409, $ - Career Technical Education & Supplies (1x-07) $ 140, $ 140, $ - School Safety and Violence Grant $ 446, $ 440, $ (5,523.00) Special Education $13,468, $ 12,329, $(1,139,865.00) Tobacco Use Prevention Education $ 17, $ 39, $ 22, Arts and Music Block Grant $ 346, $ 351, $ 5, Arts and Music Block Grant (1x-07) $ 271, $ 178, $ (93,099.00) California Instructional School Garden (1x-07) $ - $ 4, $ 4, CAHSEE Intensive Instruction $ 221, $ 231, $ 10, CAHSEE Individual Intensive Instruction $ 16, $ 16, $ - Supplemental School Counseling $ 688, $ 745, $ (56,802.00) Economic Impact Aid $ - $ - $ - Economic Impact Aid (LEP) $ 2,165, $ 2,117, $ (47,951.00) Education Technology: Staff Development $ $ $ - Early Intervention $ 2, $ 2, $ - Gifted And Talented Education (GATE) $ 139, $ 50, $ (88,657.69) Instructional Materials $ 972, $ 1,080, $ 107, Instructional Materials: ELL $ 36, $ 36, $ - Partnership Academies Program $ 162, $ 162, $ - Transportation-Home To School $ 685, $ 685, $ - Transportation-Special Education $ 920, $ 920, $ - Peer Assistance and Review (PAR) $ 149, $ 131, $ (18,416.00) Staff Development: Math and Reading $ 36, $ 2, $ (33,611.00) Staff Development: Administrator $ 1, $ 1, $ - Tenth Grade Guidance $ 2, $ 2, $ - Pupil Retention Block Grant $ 923, $ 938, $ 14, Professional Development Block Grant $ 776, $ 37, $ (738,774.00) Targeted Instructional Block Grant $ 381, $ 344, $ (37,521.00) School/Library Improvement Block Grant $ 1,208, $ 1,106, $ (102,112.00) Discretionary Block Grant Site (1x-07) $ 268, $ 252, $ (16,133.00) Instructional and Library Materials and Ed Technology (1x-07) $ 43, $ 40, $ (3,015.00) Quality Education Investment Act $ 182, $ 182, $ - Routine Restricted Maintenance $ 3,510, $ 3,315, $ (195,252.00) Donations $ 1,720, $ 2,753, $ 1,033, Sub-Total, Restricted Expenditures $ 41,307, $ 41,309, $ (2,637.00) Total, Expenditures $121,422, Total, Net Fund Balance Decrease 4
6 SIGNIIFICANT VARIANCES AT THE SECOND INTERIM REPORT (COMBINED) REVENUES Revenue Limit There is a $1,597,615 decrease in revenue limit sources between the adopted budget and second interim report due to an increase in the deficit factor from 4.71 percent to percent. Federal Revenue There is an increase of $1,001,167 between the adopted budget and second interim report due to the districts actual receipt of entitlement letters for certain federally funded categorical programs after the original budget was adopted. Categorical income is not budgeted until apportionment letters are received from the awarding agency. Other State Revenue There is a variance of $532,110 in other state revenue between the adopted budget and second interim report due to the re-instatement of the 6.5 percent to state categorical programs that were previously anticipated to be deficited by that amount. Other Local Income There is a significant favorable variance of $1,331,167 due to significant increases in donations between the adopted budget and the second interim report. EXPENDITURES Certificated Salaries Certificated salaries increased $2,071,083 from the adopted budget almost entirely due to increases on the restricted side of the budget. Classified Salaries There is a variance of $547,242 for classified salaries from the adopted budget largely due to the omission of the clerical hourly positions from the adopted budget. Employee Benefits Employee benefits expenditures were increased by $289,962 due to an increase in the health and welfare contribution to certificated teachers as a result of the district under-contributing to this group in prior years. Books and Supplies There is a significant variance of $622,605 from the adopted budget due to the re-allocation of categorical funds from place holder accounts to the books and supplies accounts. Other Operating Expenses Other unrestricted operating expenses increased from the adopted budget by $815,106 due to increases in the cost of postage, rental repairs, advertising, printing, waste disposal, and insurance. 5
7 Capital Outlay Capital outlay had an increase of $326,301 due to the purchase of hardware associated with the board approved plan to improve the operating efficiency of the districts financial system. The funds were previously designated in the ending balance. Other Outgo Other outgo experienced a slight decrease of $8,500 due to miscellaneous adjustments. 6
8 GENERAL FUND REVENUES, SECOND INTERIM GENERAL FUND UNRESTRICTED AND RESTRICTED REVENUES, Home to School Other Restricted Transfers Transportation 16% In/Sources 0% 0% Special Education Services and Transportation 8% Unrestricted 76% The largest source of revenue is from revenue limit sources. The revenue limit calculation uses ADA multiplied by a base revenue limit amount per ADA as defined for each district, and adjusted annually by state Cost of Living Allowance (COLA). The second largest source of revenue is other state revenue. The two largest state programs are funding for special education services, a restricted program, and K-3 class-size reduction, an unrestricted program. ENROLLMENT/ADA HISTORY AND PROJECTIONS Description Actual Proj. Proj. Proj. Proj. Proj. Elementary, K-8 Enrollment 4,466 4,573 4,385 4,373 4,362 4,346 High, 9-12 Enrollment 10,167 9,849 9,576 9,299 9,009 8,777 Total, Enrollment 14,633 14,422 13,961 13,672 13,371 13,123 Elementary, K-8 ADA 4,240 4,341 4,163 4,152 4,141 4,126 High, 9-12 ADA 9,473 9,302 9,045,8,783 8,509 8,290 Total, ADA 13,843 13,643 13,208 12,935 12,650 12,416 I. Figures have been rounded. II. Excludes charter school enrollment. 7
9 ADA is critical because it is used as the basis for most of the general fund revenues. Districts are only allowed to calculate ADA from actual student attendance. This means the district does not receive funding for any all day absences. For fiscal year , the elementary district will lose approximately $29.89 for each all day absence per student regardless of the reason. Likewise, for fiscal year , the high school district will lose approximately $35.89 for each all day absence per student regardless of reason. The following charts illustrate enrollment and ADA over the last three years plus projections for fiscal years , and ENROLLMENT/ADA HISTORY AND PROJECTIONS Enrollment ADA The districts revenue limit amount per ADA with a projected deficit of percent is currently $5, in the elementary school district and $6, in the high school district. The revenue limit calculation allows for a district to use the greater of either the current year or prior year ADA. Since both districts enrollment are declining, the prior year guarantee is being used to calculate the revenue limit. 8
10 LOTTERY REVENUE HISTORY AND PROJECTIONS DOLLARS PER ADA Proposition 37 was passed at a 58 percent majority in 1984 and established the California Lottery Act making the state the 21 st in the union to adopt a lottery. Under the terms of Proposition 37, lottery proceeds must be divided as follows: A full 50 percent of the annual lottery proceeds must be paid out in winnings. At least 34 percent must be distributed to public education, from kindergarten through the state college and university systems. No more than 16 percent may be used for the costs of publicizing and administering the games, including commissions for retail outlets. Lottery payments to education may be spent only for instruction, not acquisition of real property, construction of facilities, financing of research, or any other noninstructional purpose. In 2000, voters passed Proposition 20, requiring that half of any increases in education s share of lottery revenues (as compared to the "base amount") be used only for instructional materials Many believe that the lottery provides a significant share of funds for education. In actuality, the state lottery provides only a small share of the total support for California s public schools. In , expenditures from the state lottery fund accounted for just 1.9 percent of total K-12 spending. Despite successful efforts to increase lottery revenue, the share of total K-12 spending provided by the lottery has declined since Lottery funds accounted for 4.6 percent of total K-12 spending in , but only 1.9 percent in For the fiscal year, lottery proceeds represent less than 2 percent of the districts general fund revenue. Historically, lottery proceeds have fluctuated from a low of just under $90 per ADA to more than $175 per ADA. School Services of California s Financial Dartboard forecast that lottery proceeds will be $121 per ADA with $ of the $121 being unrestricted and $11.50 of the $121 being restricted for use on instructional materials per Proposition 20. $160 $140 $120 $100 $80 $60 $40 $20 $0 Restricted Unrestricted
11 GENERAL FUND EXPENDITURES BY CATEGORY, SECOND INTERIM Most of the expenditures of the districts are committed to the salaries and benefits for employees of the districts. Certificated employees include teachers, counselors, librarians, or others who provide services that require credentials. Classified/confidential employees include all of the support personnel including positions such as instructional aides, administrative assistants, secretaries, bus drivers, custodians, etc. Management employees include principals, assistant principals, instructional leaders, psychologists, classified management personnel, and district superintendents. GENERAL FUND EXPENDITURES BY CATEGORY Books & Supplies 5% Operating 10% Capital Outlay 0% Outgo/Trfs 0% Benefits 16% Classified/Confid ential Non-Mgmt 15% Management 6% Certificated Non- Mgmt 48% Benefits 16% Books & Supplies 2% UNRESTRICTED GENERAL FUND EXPENDITURES BY CATEGORY Operating 8% Capital Outlay 0% Outgo/Trfs 1% Classified/Confidential Non-Mgmt 12% Certificated Non-Mgmt 55% Management 6% 10
12 GENERAL FUND EXPENDITURES BY FUNCTION, SECOND INTERIM The Standardized Account Code Structure (SACS) requires the use of function codes in its account code structure. Function describes the activities or services performed to accomplish one or more objectives, or the activity for which a service or a material object is acquired. ncillary Services 1% GENERAL FUND EXPENDITURES BY FUNCTION, SECOND INTERIM General Admin. 5% Debt Service 0% Plant Services 11% Transfers Out 1% mmunity Services 1% Instructional Pupil Services Services 8% 12% Direct Instruction 61% 11
13 GENERAL FUND ENCROACHMENTS, SECOND INTERIM A significant portion of district revenue is restricted revenue and, as such, can only be expended for selected purposes as determined by the granting agency usually higher levels of government. The balance of the district revenue is called unrestricted since it can be expended as determined by the school district for general educational priorities. The largest restricted programs are special education, K-3 class size reduction and the Routine Restricted Maintenance Account (RRMA). For special education, the districts are projected to expend $16,689,034 to meet program obligations and state and federal law. State and federal special education revenue is significantly less than the obligation of the program. Therefore, the districts must use unrestricted or general-purpose revenue to address the full obligations of special education. The difference between the restricted revenue and the expenditures in special education is described as encroachment, indicating that the expenditures encroach on general-purpose revenues. Special education s encroachment is projected to be in the amount of $7,604,697 or about 46.2 percent of the entire district special education program. A requirement for those school districts that participate in the State School Facilities Program is to establish a RRMA equal to three percent of the total expenditures of the adopted budget. The RRMA is to fund the ongoing and major maintenance of district facilities that were constructed or modernized with state funds. K-3 class size reduction is technically an unrestricted program, however, the following graphic representations illustrate both the cost of operating the program and the amount of reimbursement the districts receive from the state. GENERAL FUND ENCROACHMENTS, SECOND INTERIM 9th Grade CSR RRMA Special Education Services 8% 1% 4% Other 0% Community Day 2% Unrestricted 20% Class Size Reduction 65% Lastly, there is an increase in the inter-fund transfer from the general fund to the cafeteria fund of $61,604 to support the Child Nutrition Services Department. This is due primarily to the increase cost of food and the state and federal governments decrease support of the National School Lunch Program. 12
14 Santa Barbara School Districts General Fund Contributions Fiscal Year Second Interim Res/Fund Code Description Ninth Grade Class Size Elementary Secondary Combined 1200 Reduction $ - $ 240, $ 240, K-3 Class Size Reduction $8,150, $ - $ 8,150, Community Day School $ - $ 223, $ 223, Spec Ed - Fed Funding $ 576, $ 636, $ 1,212, Spec Ed - State Funding $1,509, $ 4,882, $ 6,391, Gifted and Talented Program $ 10, $ 10, $ 20, Transportation - Home to School $ 146, $ 162, $ 308, Transportation - Spec Ed $ - $ 220, $ 220, Routine Restricted Maintenance $1,171, $ 2,339, $ 3,510, Various Schools Donations -to 9040 Restd Resource $ - $ 24, $ 24, Total Contributions $11,564, $ 87,38, $20,302, Fund 14 Deferred Maintenance $ - $ 389, $ - Fund 13 Cafeteria Fund $ 383, $ - $ - Fund 67 Property Liability Insurance $ - $ - $ - Fund 69 Dental/Vision Self-Insurance $ - $ 25, $ - Fund 71 Retiree Benefit Fund $ - $ - $ - Total Contributions $ 383, $ 414, $ - 13
15 NET CHANGE IN THE UNRESTRICTED ENDING BALANCE The chart below reflects the combined districts net change in the unrestricted ending balance. A positive number, one with the bar above the centerline, reflects that the district had more unrestricted income than expenditures in that particular fiscal year. A deficit amount, reflected with the bar below the centerline, indicates that district had more unrestricted expenditures than income in that particular fiscal year. NET CHANGE IN THE UNRESTRICTED ENDING BALANCE st Int nd Int Proj Proj Proj 14
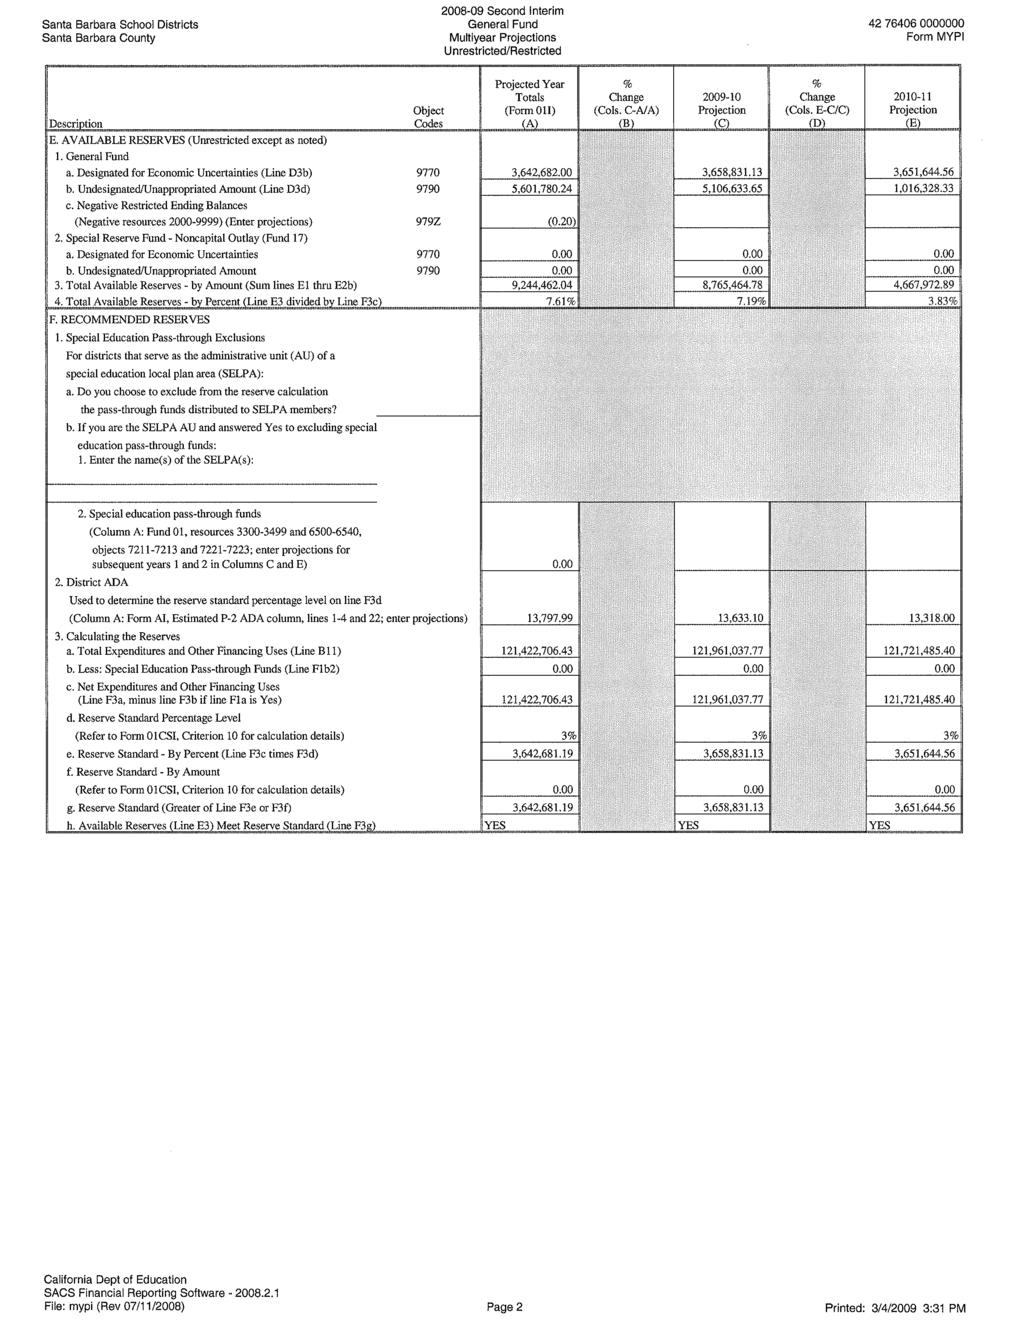
16 DISTRICT RESERVES AND NET ENDING BALANCE A school district s net ending balance is a district s reserve account to fund unforeseen events balance of the subsequent fiscal year. Included within the projected net ending balance is a reserve for economic uncertainties, which is a minimum balance that the state requires to be retained. The reserve for economic uncertainties is well above the state s minimum requirement of three percent; and is currently projected at 7.61 percent. DISTRICT RESERVES AND NET ENDING BALANCE Restricted Parcel Tax Unrestricted st Int 2nd Int Proj Proj Proj The budget shows the ability of the districts to meet their current and subsequent two year obligations, however, a significant operating deficit is starting to emerge and that deficit must be addressed with the development of the fiscal year budget. 15
17 OTHER FUNDS AT SECOND INTERIM FORM 12 CHILD DEVELOPMENT FUND This fund is used to account separately for federal, state, and local revenues to operate child development programs. The principal revenues in this fund are: Child Nutrition Programs (federal) State Preschool Child Nutrition Programs (state) Child Development Apportionments All moneys received by a Local Education Agency (LEA) for, or from the operation of, child development services covered under the Child Care and Development Services Act (Education Code Section 8200 et seq.) shall be deposited into this fund. The moneys may be used only for expenditures for the operation of child development programs. The costs incurred in the maintenance and operation of child development services shall be paid from this fund, with accounting to reflect specific funding sources (Education Code Section 8328) Form 12 First Interim Budget Second Interim Budget Net Change Revenues Federal Revenue $ 413, $ 423, $ 9, Other State Revenue $ 3,942, $ 4,052, $ 109, Other Local Revenue $ 698, $ 1,144, $ 445, Interfund Transfers-Transfer In $ - $ - $ - Total Revenues $ 5,054, $ 5,620, $ 565, Expenditures Salaries/Benefits $ 4,192, $ 4,408, $ 215, Books and Supplies $ 186, $ 274, $ 87, Services/Other Operating Expense $ 200, $ 433, $ 232, Capital Outlay $ - $ - $ - Other Outgo $ 190, $ 190, $ - Interfund Transfers-Transfer Out $ 216, $ 226, $ 10, Total Expenditures $ 4,986, $ 5,533, $ 546, Total, Net Fund Balance Increase $ 68, $ 87, $ 19,
18 FORM 13 CAFETERIA SPECIAL REVENUE FUND This fund is used to account separately for federal, state, and local resources to operate the food service program (Education Code sections ). The principal revenues in this fund are: Child Nutrition Programs (federal) Child Nutrition Programs (state) Food Service Sales Interest All Other Local Revenue The cafeteria special revenue fund (fund 13) shall be used only for those expenditures authorized by the governing board as necessary for the operation of the LEA's food service program (Education Code sections and 38100). The governing board of an LEA may establish and maintain within fund 13, cafeteria special revenue fund, a reserve for cafeteria equipment (Education Code Section 38102) Form 13 First Interim Budget Second Interim Budget Net Change Revenues Federal Revenue $ 2,685, $ 2,685, $ - Other State Revenue $ 233, $ 181, $ (52,000.00) Other Local Revenue $ 1,422, $ 1,402, $ (20,416.00) Interfund Transfers-Transfer In $ 322, $ 383, $ 61, Total Revenues $ 4,664, $ 4,653, $ (10,812.00) Expenditures Salaries/Benefits $ 2,321, $ 2,402, $ 80, Books and Supplies $ 1,964, $ 1,892, $ (71,705.00) Services/Other Operating Expense $ 138, $ 118, $ (19,500.00) Capital Outlay $ 13, $ 13, $ - Other Outgo $ - $ - $ - Interfund Transfers-Transfer Out $ 227, $ 227, $ - Total Expenditures $ 4,664, $ 4,653, $ (10,739.00) Total, Net Fund Balance Increase $ $ - $ (73.00) 17
19 FORM 14 DEFERRED MAINTENANCE FUND This fund is used to account separately for state apportionments and the LEA's contributions for deferred maintenance purposes (Education Code sections ). The principal revenues in this fund are: Deferred Maintenance Allowance Interest Inter-fund Transfers In Moneys in this fund may be expended only for the following purposes: a) Major repair or replacement of plumbing, heating, air-conditioning, electrical, roofing, and floor systems b) Exterior and interior painting of school buildings, including a facility that a county office of education is authorized to use pursuant to Education Code sections c) The inspection, sampling, and analysis of building materials d) The encapsulation or removal of asbestos-containing materials e) The inspection, identification, sampling, and analysis of building materials to determine the presence of lead-containing materials f) Any other items of maintenance approved by the State Allocation Board In addition, whenever the state funds provided pursuant to Education Code sections and (apportionments from the State Allocation Board) are insufficient to fully match the local funds deposited in this fund, the governing board of a school district may transfer the excess local funds deposited in this fund to any other expenditure classifications in other funds of the district (Education Code sections and 17583) Form 14 First Interim Budget Second Interim Budget Net Change Revenues Federal Revenue $ - $ - $ - Other State Revenue $ 576, $ 576, $ - Other Local Revenue $ 60, $ 31, $ (29,000.00) Interfund Transfers-Transfer In $ 585, $ 389, $ (195,252.00) Total Revenues $ 1,222, $ 998, $ (224,252.00) Expenditures Salaries/Benefits $ 131, $ 164, $ 33, Books and Supplies $ 45, $ 42, $ (3,000.00) Services/Other Operating Expense $ 1,550, $ 1,539, $ (11,032.00) Capital Outlay $ - $ - $ - Other Outgo $ - $ - $ - Interfund Transfers-Transfer Out $ - $ - $ - Total Expenditures $ 1,727, $ 1,746, $ 18, Total, Net Fund Balance Increase $ (504,406.00) $ (747,640.00) $ (243,234.00) 18
20 FORM 21 BUILDING FUND This fund exists primarily to account separately for proceeds from the sale of bonds (Education Code Section 15146) and may not be used for any purposes other than those for which the bonds were issued. Other authorized revenues to the building fund (fund 21) are proceeds from the sale or lease-with-option-to-purchase of real property (Education Code Section 17462) and revenue from rentals and leases of real property specifically authorized for deposit into the fund by the governing board (Education Code Section 41003). The principal revenues and other sources in this fund are: Rentals and Leases Interest Proceeds from the Sale of Bonds Proceeds from the Sale/Lease-Purchase of Land and Buildings Expenditures in fund 21, building fund, are most commonly made against the 6000 object codes for capital outlay. Another example of an authorized expenditure in Fund 21 is repayment of State School Building Aid out of proceeds from the sale of bonds (Education Code Section 16058) Form 21 First Interim Budget Second Interim Budget Net Change Revenues Federal Revenue $ - $ - $ - Other State Revenue $ 45, $ 457, $ 412, Other Local Revenue $ - $ - $ - Interfund Transfers-Transfer In $ - $ - $ - Total Revenues $ 45, $ 457, $ 412, Expenditures Salaries/Benefits $ 78, $ 161, $ 82, Books and Supplies $ 1, $ 1, $ Services/Other Operating Expense $ 43, $ 82, $ 38, Capital Outlay $ 1,501, $ 3,820, $ 2,318, Other Outgo $ - $ - $ - Interfund Transfers-Transfer Out $ 80, $ - $ (80,772.34) Total Expenditures $ 1,705, $ 4,065, $ 2,359, Total, Net Fund Balance Increase $ (1,660,441.34) $ (3,607,492.00) $ (1,947,050.66) 19
21 FORM 25 CAPITAL FACILITIES FUND This fund is used primarily to account separately for moneys received from fees levied on developers or other agencies as a condition of approving a development (Education Code sections ). The authority for these levies may be county/city ordinances (Government Codes sections ) or private agreements between the LEA and the developer. Interest earned in the Capital Facilities Fund (Fund 25) is restricted to that fund (Government Code Section 66006). The principal revenues in this fund are the following: Interest Mitigation/Developer Fees Expenditures in fund 25, capital facilities fund, are restricted to the purposes specified in Government Code sections or to the items specified in agreements with the developer (Government Code Section 66006). Expenditures incurred in another fund may be reimbursed to that fund by means of an inter-fund transfer Form 25 First Interim Budget Second Interim Budget Net Change Revenues Federal Revenue $ - $ - $ - Other State Revenue $ - $ - $ - Other Local Revenue $ 925, $ 618, $ (306,900.00) Interfund Transfers-Transfer In $ - $ - $ - Total Revenues $ 925, $ 618, $ (306,900.00) Expenditures Salaries/Benefits $ 161, $ 161, $ - Books and Supplies $ 15, $ 10, $ (4,800.00) Services/Other Operating Expense $ 392, $ 293, $ (98,998.00) Capital Outlay $ 3,118, $ 3,379, $ 260, Other Outgo $ - $ - $ - Interfund Transfers-Transfer Out $ - $ 18, $ 18, Total Expenditures $ 3,687, $ 3,862, $ 175, Total, Net Fund Balance Increase $ (2,762,089.00) $ (3,244,291.00) $ (482,202.00) 20
22 FORM 30 STATE SCHOOL BUILDING LEASE PURCHASE FUND This fund is used primarily to account separately for state apportionments for the reconstruction, remodeling, or replacing of existing school buildings or the acquisition of new school sites and buildings, as provided in the Leroy F. Greene State School Building Lease-Purchase Law of 1976 (Education Code Section et seq.). The LEA may be required to transfer to this fund any available moneys from other funds as the LEA's contribution to a particular project. The principal revenues and other sources in this fund are: Interest Inter-fund Transfers In School Facilities Apportionments Typical expenditures in this fund are items charged to Object 6200, buildings and improvement of buildings, and object 6300, books and media for new school libraries or major expansion of school libraries Form 30 First Interim Budget Second Interim Budget Net Change Revenues Federal Revenue $ - $ - $ - Other State Revenue $ - $ - $ - Other Local Revenue $ 1, $ 1, $ - Interfund Transfers-Transfer In $ - $ - $ - Total Revenues $ 1, $ 1, $ - Expenditures Salaries/Benefits $ - $ - $ - Books and Supplies $ - $ - $ - Services/Other Operating Expense $ - $ - $ - Capital Outlay $ - $ - $ - Other Outgo $ - $ - $ - Interfund Transfers-Transfer Out $ - $ - $ - Total Expenditures $ - $ - $ - Total, Net Fund Balance Increase $ 1, $ 1, $ - 21
23 FORM 35 COUNTY SCHOOL FACILITIES FUND This fund is established pursuant to Education Code Section to receive apportionments from the 1998 State School Facilities Fund (Proposition 1A), the 2002 State School Facilities Fund (Proposition 47), or the 2004 State School Facilities Fund (Proposition 55) authorized by the State Allocation Board for new school facility construction, modernization projects, and facility hardship grants, as provided in the Leroy F. Greene School Facilities Act of 1998 (Education Code Section et seq.). The principal revenues and other sources in this fund are: School Facilities Apportionments Interest Inter-fund Transfers In Funding provided by the State Allocation Board for reconstruction of facilities after disasters such as flooding may be deposited to fund 35. Typical expenditures in this fund are payments for the costs of sites, site improvements, buildings, building improvements, and furniture and fixtures capitalized as a part of the construction project Form 35 First Interim Budget Second Interim Budget Net Change Revenues Federal Revenue $ - $ - $ - Other State Revenue $ 1,041, $ 1,041, $ - Other Local Revenue $ 24, $ 45, $ 21, Interfund Transfers-Transfer In $ - $ - $ - Total Revenues $ 1,065, $ 1,086, $ 21, Expenditures Salaries/Benefits $ - $ - $ - Books and Supplies $ - $ - $ - Services/Other Operating Expense $ - $ - $ - Capital Outlay $ 1,230, $ 1,230, $ - Other Outgo $ - $ - $ - Interfund Transfers-Transfer Out $ - $ - $ - Total Expenditures $ 1,230, $ 1,230, $ - Total, Net Fund Balance Increase $ (165,589.00) $ (144,489.00) $ 21,
24 FORM 40 SPECIAL RESERVE FUND (CAPITAL OUTLAY) This fund exists primarily to provide for the accumulation of general fund moneys for capital outlay purposes (Education Code Section 42840). This fund may also be used to account for any other revenues specifically for capital projects that are not restricted to funds 21, 25, 30, 35, or 49. Other authorized resources that may be transferred to the special reserve fund for capital outlay projects (fund 40) are proceeds from the sale or lease-with-option-to-purchase of real property (Education Code Section 17462) and rentals and leases of real property specifically authorized for deposit to the fund by the governing board (Education Code Section 41003). The principal revenues and other sources in this fund are: Federal, State, or Local Revenues Rentals and Leases Interest Other Authorized Inter-fund Transfers In Proceeds from Sale/Lease-Purchase of Land and Buildings Federal Emergency Management Act (FEMA) Resource 6200, class size reduction facilities funding, may be transferred from the general fund to fund 40 for construction projects. Transfers authorized by the governing board from the general fund must be expended for capital outlay purposes. Proceeds from the sale or leasewith-option-to-purchase may be spent for capital outlay purposes, costs of maintenance of the LEA's property, and future maintenance and renovation of school sites (Education Code Section 17462). Expenditures for capital outlay are most commonly made against the 6000 object codes for capital outlay. Salaries of school district employees whose work is directly related to projects financed by fund 40 revenues are capitalized as a part of the capital facilities project Form 40 First Interim Budget Second Interim Budget Net Change Revenues Federal Revenue $ - $ - $ - Other State Revenue $ 524, $ 524, $ - Other Local Revenue $ 1, $ 9, $ 7, Interfund Transfers-Transfer In $ - $ - $ - Total Revenues $ 526, $ 533, $ 7, Expenditures Salaries/Benefits $ - $ - $ - Books and Supplies $ - $ - $ - Services/Other Operating Expense $ - $ - $ - Capital Outlay $ 524, $ 532, $ 7, Other Outgo $ - $ - $ - Interfund Transfers-Transfer Out $ - $ - $ - Total Expenditures $ 524, $ 532, $ 7, Total, Net Fund Balance Increase $ 1, $ 1, $ - 23
25 FORM 51- BOND INTEREST AND REDEMPTION FUND This fund is used for the repayment of bonds issued for an LEA (Education Code sections ). The board of supervisors of the county issues the bonds. The proceeds from the sale of the bonds are deposited in the county treasury to the building fund (Fund 21) of the LEA. Any premiums or accrued interest received from the sale of the bonds must be deposited in the bond interest and redemption fund (Fund 51) of the LEA. The county auditor maintains control over the LEA's bond interest and redemption fund. The principal and interest on the bonds must be paid by the county treasurer from taxes levied by the county auditor-controller. The principal revenues in this fund are: State Subventions for Homeowners' Exemptions Other Subventions/In-lieu Taxes Secured Roll Taxes Unsecured Roll Taxes Prior Years' Taxes Interest Expenditures in this fund are limited to bond interest, redemption, and related costs. Any money remaining in this fund after the payment of all bonds and coupons payable from the fund, or any money in excess of an amount sufficient to pay all unpaid bonds and coupons payable from the fund, shall be transferred to the general fund upon order of the county auditor (Education Code Section 15234) Form 51 First Interim Budget Second Interim Budget Net Change Revenues Federal Revenue $ - $ - $ - Other State Revenue $ 25, $ 34, $ 9, Other Local Revenue $ 4,861, $ 6,661, $ 1,800, Interfund Transfers-Transfer In $ - $ - $ - Total Revenues $ 4,887, $ 6,696, $ 1,809, Expenditures Salaries/Benefits $ - $ - $ - Books and Supplies $ - $ - $ - Services/Other Operating Expense $ - $ - $ - Capital Outlay $ - $ - $ - Other Outgo $ 5,131, $ 6,928, $ 1,797, Interfund Transfers-Transfer Out $ - $ - $ - Total Expenditures $ 5,131, $ 6,928, $ 1,797, Total, Net Fund Balance Increase $ (244,491.00) $ (232,080.00) $ 12,
26 FORM 66 WAREHOUSE REVOLVING FUND This fund is used primarily to maintain budget control and stock accounting of merchandise for an LEA's use (Education Code Section 42830). The warehouse revolving fund (fund 66) is reimbursed from various funds of the LEA for amounts consumed by these user funds. Expenses in fund 66, warehouse revolving fund, may include the purchase of stores to be placed in stock and the costs of receiving, storing, and delivering stores (Education Code Section 42832) Form 66 First Interim Budget Second Interim Budget Net Change Revenues Federal Revenue $ - $ - $ - Other State Revenue $ - $ - $ - Other Local Revenue $ - $ - $ - Interfund Transfers-Transfer In $ - $ - $ - Total Revenues Expenditures $ - $ - $ - Salaries/Benefits $ - $ - $ - Books and Supplies $ - $ - $ - Services/Other Operating Expense $ - $ - $ - Capital Outlay $ - $ - $ - Other Outgo $ - $ - $ - Interfund Transfers-Transfer Out $ - $ - $ - Total Expenditures $ - $ - $ - Total, Net Fund Balance Increase $ - $ - $ - 25
27 FORM 67- SELF INSURANCE FUND Self-insurance funds are used to separate moneys received for self-insurance activities from other operating funds of an LEA. Separate funds may be established for each type of selfinsurance activity, such as workers compensation, health and welfare, and deductible property loss (Education Code Section 17566). The principal revenues in this fund are the following: Interest In-District Premiums/Contributions Interagency Revenues All Other Local Revenue Expense transactions in the self-insurance fund (fund 67) shall be recorded for the payment of claims, estimates of costs relating to incurred-but-not-reported claims, administrative costs, deductible insurance amounts, cost of excess insurance, and other related costs. Most of the activities of fund 67 should be coded to function 6000, enterprise. Amounts contributed to fund 67, self-insurance fund, are lawfully restricted for insurance purposes (Education Code Section and Government Code Section 53205) Form 67 First Interim Budget Second Interim Budget Net Change Revenues Federal Revenue $ - $ - $ - Other State Revenue $ - $ - $ - Other Local Revenue $ 2, $ - $ (2,500.00) Interfund Transfers-Transfer In $ 25, $ 1,209, $ 1,184, Total Revenues $ 27, $ 1,209, $ 1,181, Expenditures Salaries/Benefits $ - $ - $ - Books and Supplies $ - $ - $ - Services/Other Operating Expense $ 38, $ 1,518, $ 1,480, Capital Outlay $ - $ - $ - Other Outgo $ - $ - $ - Interfund Transfers-Transfer Out $ - $ - $ - Total Expenditures $ 38, $ 1,518, $ 1,480, Total, Net Fund Balance Increase $ (10,500.00) $ (309,000.00) $ (298,500.00) 26
28 FORM 71- RETIREE BENEFITS FUND This fund exists to account separately for amounts held in trust from salary reduction agreements, other irrevocable contributions for employees' retirement benefit payments, or both. This fund should only be used to account for an LEA's irrevocable contributions to a postemployment benefit plan for which a formal trust exists. Amounts earmarked for postemployment benefits but not contributed irrevocably to a trust should be accounted for in the general fund or a special reserve fund. Moneys may be contributed to the retiree benefit fund (fund 71) from other funds by periodic expense charges to those funds in amounts based on existing and future obligation requirements. Payments may be made from the fund for insurance, annuities, administrative costs, or any other authorized purpose (Education Code Section 42850). The principal revenues in this fund are the following: Interest In-District Premiums/Contributions All Other Local Revenue Expenditures in fund 71, retiree benefit fund, are made using object 5800, professional/consulting services and operating expenditures. Use with function 6000, enterprise Form 71 First Interim Budget Second Interim Budget Net Change Revenues Federal Revenue $ - $ - $ - Other State Revenue $ - $ - $ - Other Local Revenue $ 3,221, $ 3,221, $ - Interfund Transfers-Transfer In $ - $ - $ - Total Revenues $ 3,221, $ 3,221, $ - Expenditures Salaries/Benefits $ - $ - $ - Books and Supplies $ - $ - $ - Services/Other Operating Expense $ 3,134, $ 3,134, $ - Capital Outlay $ - $ - $ - Other Outgo $ - $ - $ - Interfund Transfers-Transfer Out $ - $ - $ - Total Expenditures $ 3,134, $ 3,134, $ - Total, Net Fund Balance Increase $ 86, $ 86, $ - FINAL COMMENT The second interim report as presented is an accurate representation of what is known at this time. The District staff is pleased to present this narrative and overview of the fiscal year Second Interim Report for your review and consideration. 27
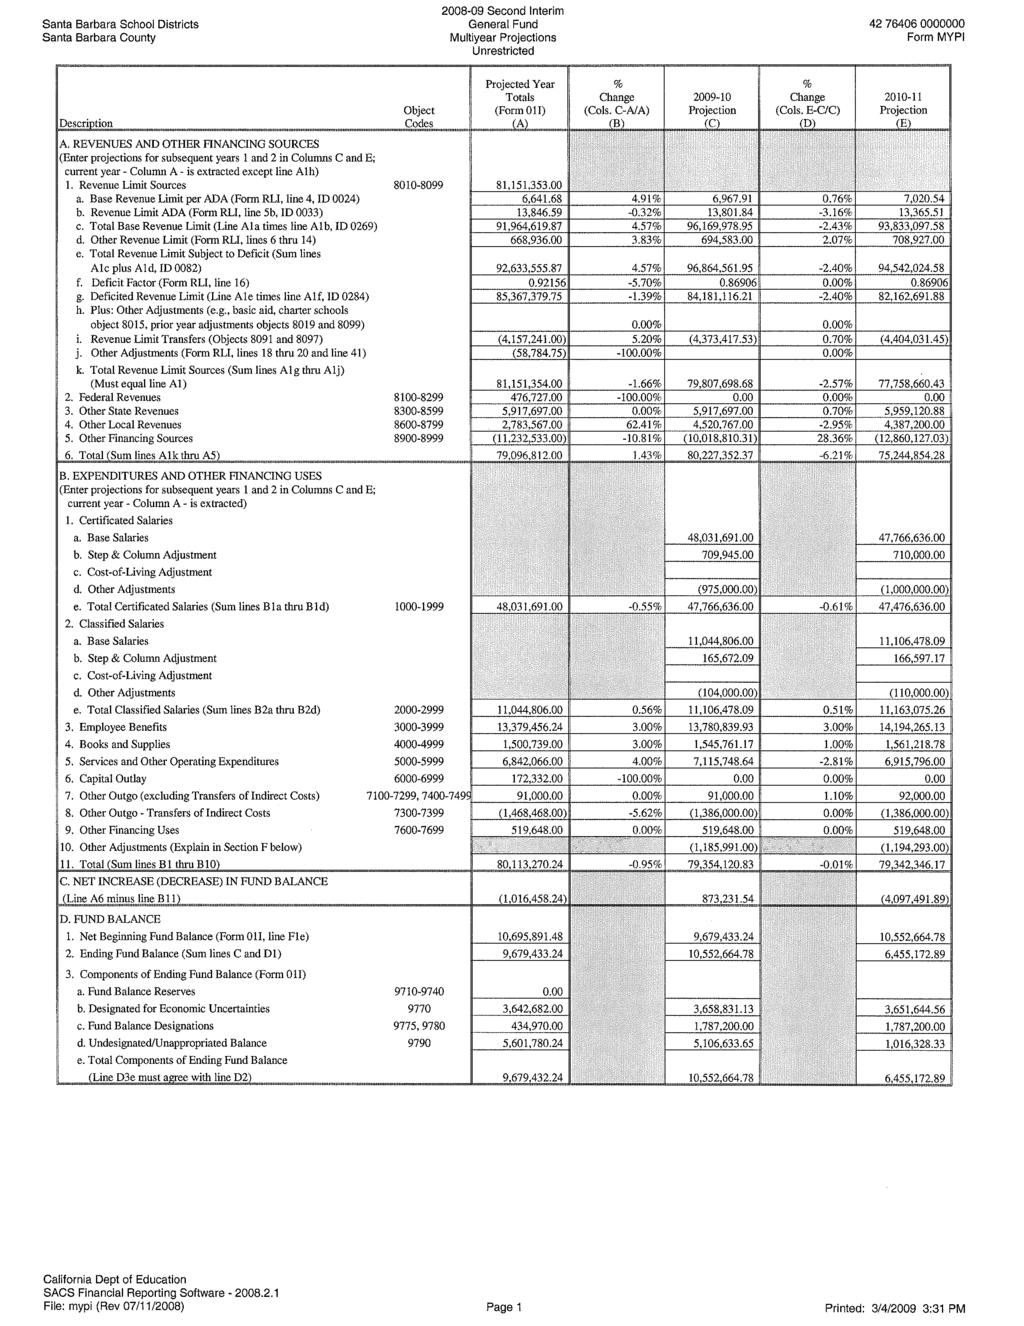
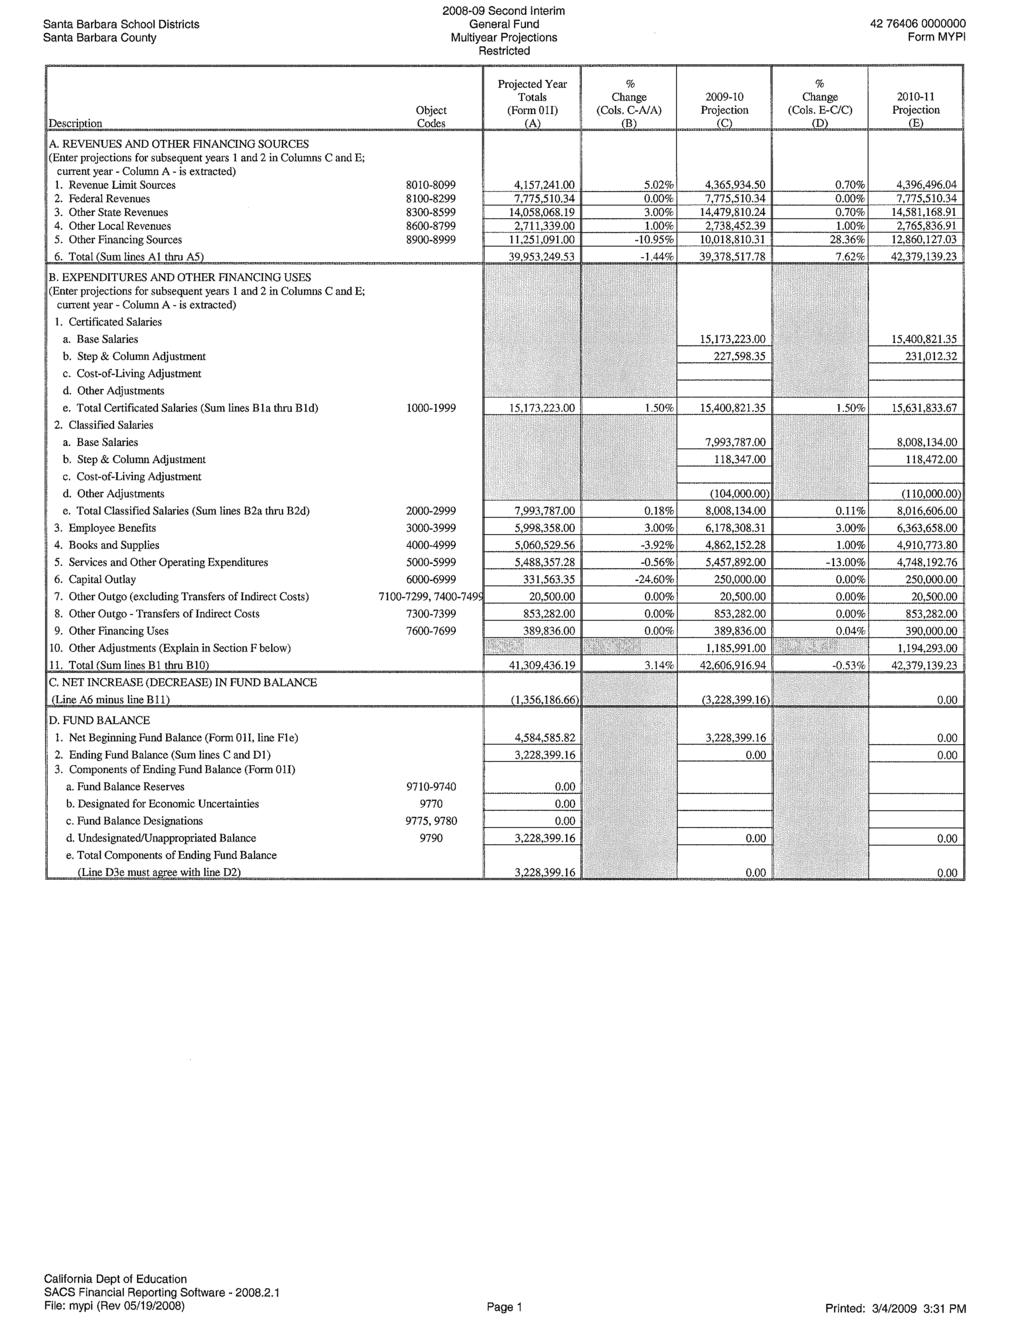
29 MULTI YEAR PROJECTION ASSUMPTIONS TO: FROM: Board of Education Eric D. Smith, Deputy Superintendent of Business Services DATE: March 5, 2009 RE: Second Interim Multi Year Projection Narrative The Multi Year Projection (MYP) for the Fiscal Year Second Interim Report for the Santa Barbara School Districts has been prepared for the board s review and approval. The MYP reflects the most current assumptions as reported on the School Services of California School District and County Office Financial Projection Dartboard. Whenever a multi year forecast is prepared, there will always be differences between the forecasted and actual results, due to events and circumstances that do not occur as anticipated, and those unexpected differences may be material. Stakeholders must recognize this inherent limitation of the financial forecast process. These limitations include issues, such as unanticipated changes in enrollment trends and economic conditions. As a result, the MYP should be considered a trend based on assumed criteria rather than a prediction of exact numbers. For this reason, multi-year forecasts should be updated at each interim financial reporting period to accurately reflect the district s current financial position. 28
30 ASSUMPTIONS District staff utilized the following revenue assumptions outlined in the state s adopted budget and presented by School Services of California in its Financial Dartboard Matrix. The following financial variables are utilized in the MYP: Factor Statutory COLA (use for K-12 and COE Revenue Limits) 5.66% 5.02% 0.70% 2.30% 2.50% 3.00% Revenue Limit Deficits: Eliminates COLA Further RL Cut Total Deficit % % % % % % % Net Revenue Limit Change: K % % 0.70% 2.30% 2.50% 3.00% Special Education COLA (on state 0.00% 0.00% 0.70% 2.30% 2.50% 3.00% and local share only)1 State Categorical Funding (including adult education and ROC/P)1 Tier I Tier II Tier III 0.00% % % 0.00% % % 0.70% 0.70% 0.70% 2.30% 2.30% 2.30% 2.50% 2.50% 2.50% 3.00% 3.00% 3.00% California CPI 1.90% 0.8% 1.90% 2.30% 2.80% 3.20% California Lottery2,3 Interest Rate for Ten-Year Treasuries Base $ $ $ $ $ $ Prop 20 $11.50 $11.50 $11.50 $11.50 $11.50 $ % 3.00% 3.40% 3.90% 4.30% 4.50% ESTIMATED STATEWIDE AVERAGE BASE REVENUE LIMITS PER ADA Year Elementary High School Unified Statewide Average (est.) $5,882 $7,069 $6, Santa Barbara School Districts $5,380 $6,461 Enrollment/ADA The methodology used to project enrollment in the elementary district is the cohort survival technique. The cohort survival technique is an enrollment projection methodology that groups students by grade level upon entry and tracks them through each year that they stay in school. This methodology evaluates the longitudinal relationship of the number of students passing from one grade to the next in the subsequent year. In doing so, it more closely accounts for retention, drop outs, and in and out migration on a grade by grade basis. Although there are other enrollment forecasting techniques available, the cohort survival method is usually the best choice for school districts due to its sensitivity to incremental changes in population. Basically, percentages are calculated from the historical enrollment data to determine a reliable percentage of increase or decrease in enrollment between any two grades. For example, if 100 students enrolled in first grade in and increased to 104 students in second grade in , the percentage of survival would have been 104 percent, or a ratio of Such ratios are calculated between each pair of grades or years in school over several recent years. The ratios used are the key factors in the reliability of the projections, given the validity of the data at the starting point. The strength of the ratios lies in the fact that each ratio encompasses collectively the variables that could possibly account for an increase or decrease in the size of a grade cohort as it moves on to the next grade. 29
31 The process of projecting kindergarten enrollment differs from other grades because there is very little data available regarding the presence of 4- and 5-year-old children that may enroll in the elementary district the following year. The industry standard for projecting kindergarten enrollment is to identify the percentage of county-wide live births that enroll in the elementary district five years later. Based on this analysis, it appears that 9.97 percent of county-wide births become kindergartners, based on this year s experience. Assuming that this percentage holds true for the next two years, the elementary district, excluding charter schools, will have kindergarten enrollments of 619, 617 and 615 for the , and school years, respectively. Santa Barbara Elementary School District Kindergarten Projection Santa Barbara County Live Birth Data Calendar Year Live Births Kdg. Year Actual Kdg. % of Births 1 Year Trend. Actual births/kindergarten enrollment Projected kindergarten enrollment Source: State Department of Finance , , , , , , , , , , ,
32 Using the cohort survival, it is anticipated that the combined district will continue to decline in enrollment. As a result, the districts MYP uses prior year P-2 ADA to project revenue limit revenue for fiscal years and Description Actual Proj. Proj. Proj. Proj. Proj. Elementary, K-8 Enrollment 4,466 4,573 4,385 4,373 4,362 4,346 High, 9-12 Enrollment 10,167 9,849 9,576 9,299 9,009 8,777 Total, Enrollment 14,633 14,422 13,961 13,672 13,371 13,123 Elementary, K-8 ADA 4,240 4,341 4,163 4,152 4,141 4,126 High, 9-12 ADA 9,473 9,302 9,045,8,783 8,509 8,290 Total, ADA 13,843 13,643 13,208 12,935 12,650 12,416 REVENUES REVENUE LIMIT SOURCES The districts revenue limit sources have been adjusted in the future years due to changes in average daily attendance and changes in the deficit factor. FEDERAL REVENUES Federal revenues are anticipated to remain relatively flat over the multi-year projection period. OTHER STATE REVENUES Other state revenues are expected to be adjusted for changes in enrollment, and changes in the deficit applied to certain categorical programs. OTHER LOCAL SOURCES Other local revenues are projected to increase significantly in fiscal year due to the inclusion of the Measure H and Measure I parcel tax income in the budget. EXPENDITURES CERTIFICATED SALARIES Certificated salaries reflect step and column movement of 1.5 percent per year. However, the multi-year projection also contemplates the reduction of 11.5 certificated teaching staff (at a cost of $85, per teacher) to reflect both the reduction in staffing due to the board s decision to rescind most of the inter-district transfers in the elementary district and due to declining enrollment for fiscal year Additionally, 11.5 certificated staff are anticipated to be reduced in fiscal year due to significant declining enrollment in the secondary district. CLASSIFIED SALARIES Classified salaries reflect step movement of 1.5 percent per year and a reduction of two classified full time equivalents in each year. EMPLOYEE BENEFITS Health and welfare benefits are projected to increase by 3 percent per fiscal year. Statutory benefits remain proportional to overall salaries. BOOKS AND SUPPLIES Books and supplies have been decreased in the first subsequent year due to the State s decrease in categorical funding and to reflect our intention to transfer Tier Three categorical funding to the unrestricted side of the budget. 31
33 OTHER OPERATING EXPENSES Other operating expenses have been increased in fiscal year and on the unrestricted side of the budget, however, we anticipate a reduction on the restricted side due to a decrease in the use of state categorical funds for outside consultants. CAPTAL OUTLAY Capital outlay expense is anticipated to decrease in fiscal year and and remain at those levels. OTHER OUTGO Other outgo expense is anticipated to decrease in fiscal year due to the loss of indirect cost rate as a result of the state deficiting categorical programs 15.4 percent in fiscal year and 4.5 percent in fiscal year RESERVES The combined districts multi-year projection indicates that it can meet the three percent minimum recommended reserve requirement in the current and subsequent two years. However, due to both mid year revenue reductions and a decrease in projected state funding, a significant operating deficit has begun to emerge and substantial expenditure reductions and revenue enhancements will be required to maintain fiscal solvency on a multi-year basis. The multi-year projection also anticipates that fiscal year restricted ending balances of certain state categorical programs will be swept to the unrestricted side of the budget and that thirty percent of tier III categorical programs that do not encroach will be transferred to the unrestricted general fund in subsequent years (see Attachment A). 32
34 Page 33
35 Page 1
36 Page 2
37 Page 3
38 Page 4
39 Page 5
40 Page 6
41 Page 7
42 Page 8
43 Page 9
44 Page 10
45 Page 11
46 Page 12
47 Page 13
48 Page 14
49 Page 15
50 Page 16
51 Page 17
52 Page 18
53 Page 19
54 Page 20
55 Page 21
56 Page 22
57 Page 23
58 Page 24
59 Page 25
60 Page 26
61 Page 27
62 Page 28
63 Page 29
64 Page 30
65 Page 31
66 Page 32
67 Page 33
68 Page 34
69 Page 35
70 Page 36
71 Page 37
72 Page 38
73 Page 39
74 Page 40
75 Page 41
76 Page 42
77 Page 43
78 Page 44
79 Page 45
80 Page 46
81 Page 47
82 Page 48
83 Page 49
84 Page 50
85 Page 51
86 Page 52
87 Page 53
88 Page 54
89 Page 55
90 Page 56
91 Page 57
92 Page 58
93 Page 59
94 Page 60
95 Page 61
96 Page 62
97 Page 63
98 Page 64
99 Page 65
100 Page 66
101 Page 67
102 Page 68
103 Page 69
104 Page 70
105 Page 71
106 Page 72
107 Page 73
108 Page 74
109 Page 75
110 Page 76
111 Page 77
112 Page 78
113 Page 79
114 Page 80
115 Page 81
116 Page 82
117 Page 83
118 Page 84
119 Page 85
120 Page 86
121 Page 87
122 Page 88
123 Page 89
124 Page 90
125 Page 91
126 Page 92
127 Page 93
128 Page 94
129 Page 95
130 Page 96
131 Page 97
132 Page 98
133 Page 99
134 Page 100
135 Page 101
136 Page 102
137 Page 103
138 Page 104
139 Page 105
140 Page 106
141 Page 107
142 Page 108
143 Page 109
144 Page 110
145 Page 111
146 Page 112
Fullerton Joint Union High School District. Definitions of Districts Funds
 Fullerton Joint Union High School District Definitions of Districts Funds Fund 01 - General Fund This is the chief operating fund for all LEAs. It is used to account for the ordinary operations of an LEA.
Millbrae Elementary School District First Interim for Fiscal Year Board of Trustees
 Millbrae Elementary School District First Interim for Fiscal Year 2016-2017 Board of Trustees Frank Barbaro Denis Fama Lynne Ferrario Maggie Musa D. Don Revelo Administration Vahn Phayprasert, Superintendent
EAST SIDE UNION HIGH SCHOOL DISTRICT
 EAST SIDE UNION HIGH SCHOOL DISTRICT Third Interim Financial Statement of Projections 20102011 (per Ed. Code 42931,e) May 31, 2011 Table of Contents General Fund 2010/11 Summary Page 2 General Fund 2010/11
(per Ed. Code 42931,e) May 20, 2010
 May 20, 2010") EAST SIDE UNION HIGH SCHOOL DISTRICT Third Financial Statement of Projections 2009-2010 (per Ed. Code 42931,e) May 20, 2010 Table of Contents Budget Assumptions - General Fund Page 1 Budget Reconciliation
EAST SIDE UNION HIGH SCHOOL DISTRICT Third Financial Statement of Projections 2009-2010 (per Ed. Code 42931,e) May 20, 2010 Table of Contents Budget Assumptions - General Fund Page 1 Budget Reconciliation
MANHATTAN BEACH UNIFIED SCHOOL DISTRICT TABLE OF CONTENTS JUNE 30, 2010
 TABLE OF CONTENTS FINANCIAL SECTION Independent Auditors' Report 2 Management's Discussion and Analysis 4 Basic Financial Statements Government-Wide Financial Statements Statement of Net Assets 13 Statement
Saugus Union School District Second Interim Report for FY Executive Summary. Board of Trustees
 Saugus Union School District Second Interim Report for FY 2012-13 Executive Summary Board of Trustees Douglas A. Bryce Paul De La Cerda Rose Koscielny Judy Egan Umeck Stephen S. Winkler Administration
The New State Budget: Revising Your Budget and Programs
 Excerpts from School Services of California and Total School Solutions Presented by Assistant Superintendent, Business Services Song Chin-Bendib The New State Budget: Revising Your Budget and Programs
SAN DIEGO UNIFIED SCHOOL DISTRICT. FINANCIAL STATEMENTS June 30, 2017
 FINANCIAL STATEMENTS June 30, 2017 FINANCIAL STATEMENTS WITH SUPPLEMENTARY INFORMATION For the Year Ended June 30, 2017 CONTENTS INDEPENDENT AUDITOR'S REPORT... 1 MANAGEMENT'S DISCUSSION AND ANALYSIS...
Adopted Budget Date Submitted: June 29, 2017 Board of Education Meeting
 Poway Unified School District 2017-2018 Adopted Budget Date Submitted: June 29, 2017 Board of Education Meeting 1 Description of Funds Fund 01 General Fund Fund 11 Adult Education Fund 12 Child Development
CORONADO UNIFIED SCHOOL DISTRICT AUDIT REPORT JUNE 30, 2016
 AUDIT REPORT JUNE 30, 2016 TABLE OF CONTENTS FOR THE YEAR ENDED JUNE 30, 2016 FINANCIAL SECTION Independent Auditors Report... 1 Management s Discussion and Analysis... 4 Basic Financial Statements Government
EL SEGUNDO UNIFIED SCHOOL DISTRICT
 AUDIT REPORT OF LOS ANGELES COUNTY EL SEGUNDO, CALIFORNIA The El Segundo Unified School District maintains a K 12 educational program. The District is located primarily within the boundaries of the City
San Dieguito Union High School District
 San Dieguito Union High School District INFORMATION REGARDING BOARD AGENDA ITEM TO: BOARD OF TRUSTEES DATE OF REPORT: November 27, 2016 BOARD MEETING DATE: December 8, 2016 PREPARED BY: SUBMITTED BY: SUBJECT:
Los Gatos Union School District Proposed Budget and Multi-year Projection. Narrative
 Los Gatos Union School District Proposed Budget and Multi-year Projection Public Hearing June 11, 2018 Adoption June 13, 2018 Revised Narrative to Proposed Budget (revisions in italics) Narrative 2018-2019
PERRIS UNION HIGH SCHOOL DISTRICT ANNUAL FINANCIAL REPORT JUNE 30, 2010
 PERRIS UNION HIGH SCHOOL DISTRICT ANNUAL FINANCIAL REPORT TABLE OF CONTENTS FINANCIAL SECTION Independent Auditors' Report 2 Management's Discussion and Analysis 4 Basic Financial Statements Government-Wide
WILLOWS UNIFIED SCHOOL DISTRICT Office of the Superintendent
 WILLOWS UNIFIED SCHOOL DISTRICT Office of the Superintendent Request For Placement on Board Agenda: Date: 11/30/11 AGENDA TOPIC: Approval of 2011/12 1st Interim Budget PRESENTER: Betty Skala, Director
ANAHEIM UNION HIGH SCHOOL DISTRICT ANNUAL FINANCIAL REPORT JUNE 30, 2013
 ANAHEIM UNION HIGH SCHOOL DISTRICT ANNUAL FINANCIAL REPORT TABLE OF CONTENTS FINANCIAL SECTION Independent Auditors' Report 2 Management's Discussion and Analysis 5 Basic Financial Statements Government-Wide
Twin Rivers Unified School District 2018/19 ADOPTED BUDGET
 Twin Rivers Unified School District 2018/19 ADOPTED BUDGET Presented to the Board of Trustees For Approval June 26, 2018 By Kate Ingersoll, Executive Director Fiscal Services Agenda The Budget Reporting
MARYSVILLE JOINT UNIFIED SCHOOL DISTRICT Financial Statement Unaudited Actuals. September 17, 2012
 MARYSVILLE JOINT UNIFIED SCHOOL DISTRICT 2011-12 Financial Statement Unaudited Actuals September 17, 2012 1 KEY FACTS Base Revenue Limit $6,501 Revenue Limit Deficit Factor.79398 20.602% Revenue Limit
HUGHSON UNIFIED SCHOOL DISTRICT ANNUAL FINANCIAL REPORT JUNE 30, 2016
 ANNUAL FINANCIAL REPORT TABLE OF CONTENTS FINANCIAL SECTION Independent Auditor's Report 2 Management's Discussion and Analysis 5 Basic Financial Statements Government-Wide Financial Statements Statement
Budget Forum
 FREMONT UNIFIED SCHOOL DISTRICT Educate Challenge Inspire Budget Forum 2013 2014 Presented to: Irvington High School PTSA Division of Business Services April 11, 2013 Outline About FUSD Funding for Education
CAMPBELL UNION HIGH SCHOOL DISTRICT San Jose, California. FINANCIAL STATEMENTS June 30, 2011
 San Jose, California FINANCIAL STATEMENTS June 30, 2011 FINANCIAL STATEMENTS WITH SUPPLEMENTARY INFORMATION For the Year Ended June 30, 2011 TABLE OF CONTENTS Page Independent Auditors' Report 1-2 Management's
LINDSAY UNIFIED SCHOOL DISTRICT ANNUAL FINANCIAL REPORT JUNE 30, 2015
 ANNUAL FINANCIAL REPORT TABLE OF CONTENTS FINANCIAL SECTION Independent Auditor's Report 2 Management's Discussion and Analysis 5 Basic Financial Statements Government-Wide Financial Statements Statement
TO: BOARD OF EDUCATION ACTION/MAJOR 06/25/14 FROM: SANDRA LYON / JANECE L. MAEZ / PAT HO RECOMMENDATION NO. A.32
 TO: BOARD OF EDUCATION ACTION/MAJOR 06/25/14 FROM: SANDRA LYON / JANECE L. MAEZ / PAT HO RE: ADOPT RECOMMENDATION NO. A.32 It is recommended that the Board of Education adopt the District Budget. A public
Fiscal Year: Budget Overview & SACS Format
 PROPOSED BUDGET Fiscal Year: 2009-2010 Budget Overview & SACS Format Presented: June 23, 2009 NEW HAVEN UNIFIED SCHOOL DISTRICT 34200 Alvarado Niles Road Union City, CA 94587 BOARD OF EDUCATION President
San Dieguito Union High School District
 San Dieguito Union High School District INFORMATION REGARDING BOARD AGENDA ITEM TO: BOARD OF TRUSTEES DATE OF REPORT: December 7, 2017 BOARD MEETING DATE: December 14, 2017 PREPARED BY: SUBMITTED BY: SUBJECT:
Appendix E Glossary of Common School Finance Terms
 ADA Average daily attendance. There are several kinds of attendance, and these are counted in different ways. For regular attendance, ADA is equal to the average number of pupils actually attending classes
DELHI UNIFIED SCHOOL DISTRICT Delhi, California. FINANCIAL STATEMENTS June 30, 2014
 Delhi, California FINANCIAL STATEMENTS June 30, 2014 FINANCIAL STATEMENTS WITH SUPPLEMENTARY INFORMATION For the Year Ended June 30, 2014 TABLE OF CONTENTS Page Independent Auditor's Report 1 Management's
COMPTON UNIFIED SCHOOL DISTRICT
 AUDIT REPORT JUNE 30, 2011 OF LOS ANGELES COUNTY COMPTON, CALIFORNIA JUNE 30, 2011 The Compton Unified School District was established on July 1, 1970, and is comprised of an area of approximately 30 square
State Budget Message
 1 2016-17 State Budget Message Governor Brown Advises caution and to be prepared for the next recession. LCFF (Local Control Funding Formula) is projected to be at 95.7% of target or full funding. At full
Budget Adoption
 2015-16 Budget Adoption Oakland USD Board of Education June 24, 2015 v.6 2 Table of Contents Executive Summary 2015-16 Budget All Funds Total General Fund General Fund Unrestricted Appendix OUSD 2015-16
REDWOOD CITY SCHOOL DISTRICT ANNUAL FINANCIAL REPORT JUNE 30, 2016
 REDWOOD CITY SCHOOL DISTRICT ANNUAL FINANCIAL REPORT TABLE OF CONTENTS FINANCIAL SECTION Independent Auditor s Report 2 Management's Discussion and Analysis 5 Basic Financial Statements Government-Wide
California Standardized Account Code Structure (SACS) Comprehensive Chart of Accounts
 Comprehensive Chart of Accounts") California Standardized Account Code Structure (SACS) Comprehensive Chart of Accounts Table of Contents PAGE OVERVIEW OF STANDARDIZED ACCOUNT CODE STRUCTURE (SACS)....2 FUND ACCOUNT COMPONENTS.. 3 RESOURCE
California Standardized Account Code Structure (SACS) Comprehensive Chart of Accounts Table of Contents PAGE OVERVIEW OF STANDARDIZED ACCOUNT CODE STRUCTURE (SACS)....2 FUND ACCOUNT COMPONENTS.. 3 RESOURCE
PERRIS UNION HIGH SCHOOL DISTRICT ANNUAL FINANCIAL REPORT JUNE 30, 2009
 PERRIS UNION HIGH SCHOOL DISTRICT ANNUAL FINANCIAL REPORT OF RIVERSIDE COUNTY PERRIS, CALIFORNIA GOVERNING BOARD MEMBER OFFICE TERM EXPIRES Joan D. Cooley President 2011 Carolyn A. Twyman Vice President
ABC UNIFIED SCHOOL DISTRICT ANNUAL FINANCIAL REPORT JUNE 30, 2013
 ABC UNIFIED SCHOOL DISTRICT ANNUAL FINANCIAL REPORT TABLE OF CONTENTS FINANCIAL SECTION Independent Auditors' Report 2 Management's Discussion and Analysis 5 Basic Financial Statements Government-Wide
PALO ALTO UNIFIED SCHOOL DISTRICT ANNUAL FINANCIAL REPORT FOR THE YEAR ENDED JUNE 30, 2016
 PALO ALTO UNIFIED SCHOOL DISTRICT ANNUAL FINANCIAL REPORT FOR THE YEAR ENDED TABLE OF CONTENTS FINANCIAL SECTION Independent Auditor's Report 2 Management s Discussion and Analysis 5 Basic Financial Statements
SAN LEANDRO UNIFIED SCHOOL DISTRICT ANNUAL FINANCIAL REPORT JUNE 30, 2018
 SAN LEANDRO UNIFIED SCHOOL DISTRICT ANNUAL FINANCIAL REPORT TABLE OF CONTENTS FINANCIAL SECTION Independent Auditor's Report 2 Management's Discussion and Analysis 5 Basic Financial Statements Government-Wide
BOARD OF EDUCATION Attachment: Action 22. PALO ALTO UNIFIED SCHOOL DISTRICT Date:
 BOARD OF EDUCATION Attachment: Action 22 PALO ALTO UNIFIED SCHOOL DISTRICT Date: 06.23.15 TO: FROM: Glenn Max McGee, Superintendent Cathy Mak, Chief Business Officer SUBJECT: Proposed PAUSD Budget for
FILLMORE UNIFIED SCHOOL DISTRICT
 AUDIT REPORT JUNE 30, 2017 TABLE OF CONTENTS FOR THE YEAR ENDED JUNE 30, 2017 FINANCIAL SECTION Independent Auditors Report... 1 Management s Discussion and Analysis... 4 Basic Financial Statements Government
REDWOOD CITY SCHOOL DISTRICT ANNUAL FINANCIAL REPORT JUNE 30, 2017
 REDWOOD CITY SCHOOL DISTRICT ANNUAL FINANCIAL REPORT TABLE OF CONTENTS FINANCIAL SECTION Independent Auditor s Report 2 Management's Discussion and Analysis 5 Basic Financial Statements Government-Wide
Alameda Unified School District Board Presentation
 Alameda Unified School District Board Presentation May 20, 2009 Prepared by: Michele Huntoon, CPA, Associate Vice President Lewis Wiley Jr., Director, Management Consulting Services Financial Trends 1
MOUNT PLEASANT ELEMENTARY SCHOOL DISTRICT San Jose, California. FINANCIAL STATEMENTS June 30, 2011
 MOUNT PLEASANT ELEMENTARY SCHOOL DISTRICT San Jose, California FINANCIAL STATEMENTS June 30, 2011 FINANCIAL STATEMENTS WITH SUPPLEMENTARY INFORMATION For the Year Ended June 30, 2011 TABLE OF CONTENTS
COACHELLA VALLEY UNIFIED SCHOOL DISTRICT TABLE OF CONTENTS JUNE 30, 2010
 TABLE OF CONTENTS FINANCIAL SECTION Independent Auditors' Report 2 Management's Discussion and Analysis 4 Basic Financial Statements Government-Wide Financial Statements Statement of Net Assets 14 Statement
Surprise Valley Joint Unified School District Budget Update September 11, 2007
 Surprise Valley Joint Unified School District 2007-2008 Budget Update September 11, 2007 The district's original budget was adopted June 28, 2007. The budget was built on the board adopted class schedules,
March 18, 2010
 EAST SIDE UNION HIGH SCHOOL DISTRICT Second Interim Financial i Report 20092010 March 18, 2010 EAST SIDE UNION HIGH SCHOOL DISTRICT BOARD OF TRUSTEES Eddie Garcia, President Lan Nguyen, Vice President
Rocky Point Charter School
 Rocky Point Charter School Fiscal Review May 7, 2010 Joel D. Montero Chief Executive Officer May 7, 2010 Deborah Stierli, Director Rocky Point Charter School 3500 Tamarack Drive Redding, CA 96003 Dear
GLOSSARY OF COMMON SCHOOL FINANCE TERMS.
 GLOSSARY OF COMMON SCHOOL FINANCE TERMS http://www.sscal.com/glossary.htm 17.1 May 2017 Glossary of Common Schooll Finance Terms ADA AB 12000 Accural Basis Accounting Ad valorem Taxes Apportionment Average
GLENN COUNTY OFFICE OF EDUCATION AUDIT REPORT
 GLENN COUNTY OFFICE OF EDUCATION AUDIT REPORT For the Fiscal Year Ended June 30, 2010 AUDIT REPORT For the Fiscal Year Ended June 30, 2010 Table of Contents FINANCIAL SECTION Page Independent Auditor s
Budget Narrative/FAQs
 Board Agenda Information June 16, 2016 Approval of 2016/2017 Budget AGENDA ITEM TITLE: Adoption of 2016/2017 Budget BACKGROUND: Annually, Peabody is required to adopt a budget for the subsequent year on
NATOMAS UNIFIED SCHOOL DISTRICT Sacramento, California. FINANCIAL STATEMENTS June 30, 2011
 Sacramento, California FINANCIAL STATEMENTS June 30, 2011 FINANCIAL STATEMENTS WITH SUPPLEMENTARY INFORMATION For the Year Ended June 30, 2011 TABLE OF CONTENTS Page Independent Auditors' Report 1-2 Management's
POINT ARENA SCHOOLS AUDIT REPORT JUNE 30, Board Meeting Packet: January 10,
 AUDIT REPORT JUNE 30, 2017 Board Meeting Packet: January 10, 2018 163 TABLE OF CONTENTS FOR THE YEAR ENDED JUNE 30, 2017 FINANCIAL SECTION Independent Auditors Report... 1 Management s Discussion and Analysis...
DINUBA UNIFIED SCHOOL DISTRICT
 AUDIT REPORT JUNE 30, 2016 TABLE OF CONTENTS FOR THE YEAR ENDED JUNE 30, 2016 FINANCIAL SECTION Independent Auditors Report... 1 Management s Discussion and Analysis... 4 Basic Financial Statements Government
Lawndale Elementary School District. Annual Financial Report. June 30, 2015
 Lawndale Elementary School District Annual Financial Report June 30, 2015 TABLE OF CONTENTS FINANCIAL SECTION Independent Auditor's Report 2 Management's Discussion and Analysis 5 Basic Financial Statements
ANAHEIM ELEMENTARY SCHOOL DISTRICT
 ANAHEIM ELEMENTARY SCHOOL DISTRICT AUDIT REPORT JUNE 30, 2016 TABLE OF CONTENTS FOR THE YEAR ENDED JUNE 30, 2016 FINANCIAL SECTION Independent Auditors Report... 1 Management s Discussion and Analysis...
Budget Study Session A Fiscal Profile of CVUSD. Business Services Division September 12, 2012
 Budget Study Session A Fiscal Profile of CVUSD Business Services Division September 12, 2012 Budget Study Session #1 Common School Financial Terms Concurrent Budget Cycles State of California Budget CVUSD
DAVIS JOINT UNIFIED SCHOOL DISTRICT UNAUDITED ACTUALS
 DAVIS JOINT UNIFIED SCHOOL DISTRICT 2017-18 UNAUDITED ACTUALS October 4, 2018 2 UNAUDITED ACTUALS REPORT Actual Financial Report of the District Final accounting of District results for receipts and expenditures
ATWATER ELEMENTARY SCHOOL DISTRICT
 ATWATER ELEMENTARY SCHOOL DISTRICT FIRST INTERIM December 12, 2017 Sandra Schiber, Superintendent Carol Longobardi, Fiscal Services Supervisor Linda Levesque, Assistant Superintendent of Business Services
LITTLE LAKE CITY SCHOOL DISTRICT ANNUAL FINANCIAL REPORT JUNE 30, 2016
 ANNUAL FINANCIAL REPORT TABLE OF CONTENTS FINANCIAL SECTION Independent Auditor's Report 2 Management's Discussion and Analysis 5 Basic Financial Statements Government-Wide Financial Statements Statement
POINT ARENA SCHOOLS AUDIT REPORT JUNE 30, 2018
 AUDIT REPORT JUNE 30, 2018 TABLE OF CONTENTS JUNE 30, 2018 FINANCIAL SECTION Independent Auditors Report... 1 Management s Discussion and Analysis... 4 Basic Financial Statements Government-wide Financial
LOS ALAMITOS UNIFIED SCHOOL DISTRICT ANNUAL FINANCIAL REPORT JUNE 30, 2015
 LOS ALAMITOS UNIFIED SCHOOL DISTRICT ANNUAL FINANCIAL REPORT TABLE OF CONTENTS FINANCIAL SECTION Independent Auditor's Report 2 Management's Discussion and Analysis 5 Basic Financial Statements Government-Wide
DOS PALOS-ORO LOMA JOINT UNIFIED SCHOOL DISTRICT ANNUAL FINANCIAL REPORT JUNE 30, 2016
 DOS PALOS-ORO LOMA JOINT UNIFIED SCHOOL DISTRICT ANNUAL FINANCIAL REPORT TABLE OF CONTENTS FINANCIAL SECTION Independent Auditor's Report 2 Management's Discussion and Analysis 5 Basic Financial Statements
BANNING UNIFIED SCHOOL DISTRICT ANNUAL FINANCIAL REPORT JUNE 30, 2016
 BANNING UNIFIED SCHOOL DISTRICT ANNUAL FINANCIAL REPORT TABLE OF CONTENTS FINANCIAL SECTION Independent Auditor's Report 2 Management's Discussion and Analysis 5 Basic Financial Statements Government-Wide
WEST SONOMA COUNTY UNION HIGH SCHOOL DISTRICT ANNUAL FINANCIAL REPORT JUNE 30, 2011
 WEST SONOMA COUNTY UNION HIGH SCHOOL DISTRICT ANNUAL FINANCIAL REPORT TABLE OF CONTENTS FINANCIAL SECTION Independent Auditors' Report 2 Management's Discussion and Analysis 4 Basic Financial Statements
BISHOP UNIFIED SCHOOL DISTRICT ANNUAL FINANCIAL REPORT
 BISHOP UNIFIED SCHOOL DISTRICT ANNUAL FINANCIAL REPORT TABLE OF CONTENTS FINANCIAL SECTION Independent Auditor's Report 2 Management's Discussion and Analysis 5 Basic Financial Statements Government-Wide
San Dieguito Union High School District
 San Dieguito Union High School District INFORMATION REGARDING BOARD AGENDA ITEM TO: BOARD OF TRUSTEES DATE OF REPORT: October 5, 2011 BOARD MEETING DATE: October 20, 2011 PREPARED BY: SUBMITTED BY: SUBJECT:
CERES UNIFIED SCHOOL DISTRICT ANNUAL FINANCIAL REPORT JUNE 30, 2014
 Vavrinek, Trine, Day & Co., LLP Certified Public Accountants VALUE THE DIFFERENCE December 14, 2014 State Controller's Office Division of Audits Financial Audits Bureau - Education Oversight Unit Via PDF
WASHINGTON UNIFIED SCHOOL DISTRICT ANNUAL FINANCIAL REPORT JUNE 30, 2016
 ANNUAL FINANCIAL REPORT TABLE OF CONTENTS FINANCIAL SECTION Independent Auditor's Report 2 Management's Discussion and Analysis 5 Basic Financial Statements Government-Wide Financial Statements Statement
SAN LEANDRO UNIFIED SCHOOL DISTRICT ANNUAL FINANCIAL REPORT JUNE 30, 2016
 SAN LEANDRO UNIFIED SCHOOL DISTRICT ANNUAL FINANCIAL REPORT TABLE OF CONTENTS FINANCIAL SECTION Independent Auditor s Report 2 Management's Discussion and Analysis 5 Basic Financial Statements Government-Wide
CAMPBELL UNION SCHOOL DISTRICT ANNUAL FINANCIAL REPORT FOR THE YEAR ENDED JUNE 30, 2016
 CAMPBELL UNION SCHOOL DISTRICT ANNUAL FINANCIAL REPORT FOR THE YEAR ENDED TABLE OF CONTENTS FINANCIAL SECTION Independent Auditor s Report 2 Management's Discussion and Analysis 5 Basic Financial Statements
Assistant Superintendents, Business Services Directors, Business Services ROC/Ps
 November 6, 2009 To: Assistant Superintendents, Business Services Directors, Business Services ROC/Ps From: Wendy Benkert, Ed.D., Assistant Superintendent Business Services Subject: 2009-10 First Interim
Solana Beach School District
 B U D G E T W O R K S H O P Solana Beach School District 2017-18 Proposed Budget June 8, 2017 Our Mission is to provide a child-centered education of the highest quality, using the unique vision and resources
Phase I. Phase II. July 2, L. Karen Monroe, Superintendent Alameda County Office of Education 313 W. Winton Avenue Hayward, CA 94544
 July 2, 2018 L. Karen Monroe, Superintendent Alameda County Office of Education 313 W. Winton Avenue Hayward, CA 94544 Re: Oakland Unified School District Phase II Dear Superintendent Monroe: On January
SANTA MONICA-MALIBU UNIFIED SCHOOL DISTRICT FIRST INTERIM REPORT DECEMBER 10, 2015 AGENDA ITEM A.24
 SANTA MONICA-MALIBU UNIFIED SCHOOL DISTRICT DECEMBER 10, 2015 AGENDA ITEM A.24 SMMUSD 1 st Interim Report Shows the District s financial position as of October 31, 2015 Displays the Adopted Budget, Current
SANTA BARBARA UNIFIED SCHOOL DISTRICT ANNUAL FINANCIAL REPORT JUNE 30, 2013
 SANTA BARBARA UNIFIED SCHOOL DISTRICT ANNUAL FINANCIAL REPORT TABLE OF CONTENTS FINANCIAL SECTION Independent Auditors' Report 2 Management's Discussion and Analysis 5 Basic Financial Statements Government-Wide
Ferndale School District #502 Business and Support Services Budget Summary Citizens' Budget General Fund
 Ferndale School District #502 Business and Support Services 2018-19 Budget Summary Citizens' Budget General Fund 7/31/2018 Prepared by: Mark Deebach, Assistant Superintendent for Business & Support Services
ANNUAL FINANCIAL REPORT JUNE 30, 2018
 ANNUAL FINANCIAL REPORT TABLE OF CONTENTS FINANCIAL SECTION Independent Auditor's Report 2 Management's Discussion and Analysis 5 Basic Financial Statements Government-Wide Financial Statements Statement
ANAHEIM ELEMENTARY SCHOOL DISTRICT
 ANAHEIM ELEMENTARY SCHOOL DISTRICT AUDIT REPORT JUNE 30, 2017 TABLE OF CONTENTS FOR THE YEAR ENDED JUNE 30, 2017 FINANCIAL SECTION Independent Auditors Report... 1 Management s Discussion and Analysis...
Cotati-Rohnert Park Unified School District
 Cotati-Rohnert Park Unified School District Management Review October 22, 2007 Joel D. Montero Chief Executive Officer Fiscal Crisis & Management Assistance Team October 22, 2007 Barbara Vrankovich, Superintendent
ANNUAL FINANCIAL REPORT JUNE 30, 2017
 ANNUAL FINANCIAL REPORT TABLE OF CONTENTS FINANCIAL SECTION Independent Auditor's Report 2 Management's Discussion and Analysis 5 Basic Financial Statements Government-Wide Financial Statements Statement
WEST CONTRA COSTA UNIFIED SCHOOL DISTRICT Richmond, California. FINANCIAL STATEMENTS June 30, 2013
 Richmond, California FINANCIAL STATEMENTS June 30, 2013 FINANCIAL STATEMENTS WITH SUPPLEMENTARY INFORMATION For the Year Ended June 30, 2013 TABLE OF CONTENTS Page Independent Auditor's Report 1 Management's
CASTRO VALLEY UNIFIED SCHOOL DISTRICT ANNUAL FINANCIAL REPORT JUNE 30, 2009
 CASTRO VALLEY UNIFIED SCHOOL DISTRICT ANNUAL FINANCIAL REPORT JUNE 30, 2009 OF ALAMEDA COUNTY CASTRO VALLEY, CALIFORNIA JUNE 30, 2009 GOVERNING BOARD MEMBER OFFICE TERM EXPIRES George Granger President
POWAY UNIFIED SCHOOL DISTRICT COUNTY OF SAN DIEGO POWAY, CALIFORNIA AUDIT REPORT JUNE 30, 2010
 COUNTY OF SAN DIEGO POWAY, CALIFORNIA AUDIT REPORT JUNE 30, 2010 WILKINSON HADLEY KING & CO. LLP CPA's and Advisors 218 W Douglas Ave. El Cajon, CA 92020 Introductory Section Poway Unified School District
Natomas Unified School District
 Natomas Unified School District : Item Inspector Natomas Unified School District Jun 25, 2014 : Regular Board Meeting : XIV. ACTION ITEMS c. Approve the District's 2014-15 Proposed Budget [Status: Completed]
ANNUAL FINANCIAL REPORT JUNE 30, 2015
 ANNUAL FINANCIAL REPORT TABLE OF CONTENTS FINANCIAL SECTION Independent Auditor's Report 2 Management's Discussion and Analysis 5 Basic Financial Statements Government-Wide Financial Statements Statement
WASHINGTON UNIFIED SCHOOL DISTRICT ANNUAL FINANCIAL REPORT JUNE 30, 2015
 ANNUAL FINANCIAL REPORT TABLE OF CONTENTS FINANCIAL SECTION Independent Auditor's Report 2 Management's Discussion and Analysis 5 Basic Financial Statements Government-Wide Financial Statements Statement
SOUTH PASADENA UNIFIED SCHOOL DISTRICT AUDIT REPORT JUNE 30, 2016
 SOUTH PASADENA UNIFIED SCHOOL DISTRICT AUDIT REPORT JUNE 30, 2016 12/14/2016 TABLE OF CONTENTS FOR THE YEAR ENDED JUNE 30, 2016 FINANCIAL SECTION Independent Auditors Report... 1 Management s Discussion
Lake Tahoe. Board of Education. Unified School District. First Interim Financial Report Dr. James R. Tarwater Superintendent
 Lake Tahoe Unified School District 2015-2016 First Interim Financial Report Dr. James R. Tarwater Superintendent December 8, 2015 Board of Education Barbara Bannar Dr. Michael Doyle Dr. Larry Green Ginger
TULARE COUNTY OFFICE OF EDUCATION AUDIT REPORT JUNE 30, 2016
 AUDIT REPORT JUNE 30, 2016 Received 12/15/2016 TABLE OF CONTENTS FOR THE YEAR ENDED JUNE 30, 2016 FINANCIAL SECTION Independent Auditors Report... 1 Management s Discussion and Analysis... 4 Basic Financial
MORONGO UNIFIED SCHOOL DISTRICT ANNUAL FINANCIAL REPORT JUNE 30, 2015
 ANNUAL FINANCIAL REPORT TABLE OF CONTENTS FINANCIAL SECTION Independent Auditor's Report 2 Management's Discussion and Analysis 5 Basic Financial Statements Government-Wide Financial Statements Statement
CALAVERAS UNIFIED SCHOOL DISTRICT COUNTY OF CALAVERAS SAN ANDREAS, CALIFORNIA ANNUAL FINANCIAL REPORT JUNE 30, 2014
 COUNTY OF CALAVERAS SAN ANDREAS, CALIFORNIA ANNUAL FINANCIAL REPORT JUNE 30, 2014 JUNE 30, 2014 FINANCIAL SECTION TABLE OF CONTENTS Page Independent Auditor's Report 1 Management s Discussion and Analysis
TRACY UNIFIED SCHOOL DISTRICT ANNUAL FINANCIAL REPORT JUNE 30, 2014
 TRACY UNIFIED SCHOOL DISTRICT ANNUAL FINANCIAL REPORT TABLE OF CONTENTS FINANCIAL SECTION Independent Auditor s Report 2 Management's Discussion and Analysis 5 Basic Financial Statements Government-Wide
CULVER CITY UNIFIED SCHOOL DISTRICT
 AUDIT REPORT JUNE 30, 2018 TABLE OF CONTENTS JUNE 30, 2018 FINANCIAL SECTION Independent Auditors Report... 1 Management s Discussion and Analysis... 4 Basic Financial Statements Government-wide Financial
CAMPBELL UNION HIGH SCHOOL DISTRICT San Jose, California. FINANCIAL STATEMENTS June 30, 2013
 San Jose, California FINANCIAL STATEMENTS June 30, 2013 FINANCIAL STATEMENTS WITH SUPPLEMENTARY INFORMATION For the Year Ended June 30, 2013 TABLE OF CONTENTS Page Independent Auditor's Report 1 Management's
NATOMAS UNIFIED SCHOOL DISTRICT. FINANCIAL STATEMENTS June 30, 2016
 FINANCIAL STATEMENTS June 30, 2016 FINANCIAL STATEMENTS WITH SUPPLEMENTARY INFORMATION For the Year Ended June 30, 2016 CONTENTS INDEPENDENT AUDITOR'S REPORT... 1 MANAGEMENT'S DISCUSSION AND ANALYSIS...
LOS ALAMITOS UNIFIED SCHOOL DISTRICT ANNUAL FINANCIAL REPORT JUNE 30, 2016
 LOS ALAMITOS UNIFIED SCHOOL DISTRICT ANNUAL FINANCIAL REPORT TABLE OF CONTENTS FINANCIAL SECTION Independent Auditor's Report 2 Management's Discussion and Analysis 5 Basic Financial Statements Government-Wide
RIM OF THE WORLD UNIFIED SCHOOL DISTRICT
 RIM OF THE WORLD UNIFIED SCHOOL DISTRICT ANNUAL FINANCIAL REPORT TABLE OF CONTENTS FINANCIAL SECTION Independent Auditor's Report 2 Management's Discussion and Analysis 5 Basic Financial Statements Government-Wide
An Independent Public School
 TO: Governing Board DATE: June 13, 2008 FROM: SUBJECT: Walter Wallace, Chief Business Officer 2008-09 Adopted Budget We have had several discussions this spring about the sorry outlook for school funding
ESPARTO UNIFIED SCHOOL DISTRICT COUNTY OF YOLO ESPARTO, CALIFORNIA FINANCIAL STATEMENTS WITH INDEPENDENT AUDITOR'S REPORT JUNE 30, 2014
 COUNTY OF YOLO ESPARTO, CALIFORNIA FINANCIAL STATEMENTS WITH INDEPENDENT AUDITOR'S REPORT JUNE 30, 2014 TABLE OF CONTENTS PAGE INDEPENDENT AUDITOR'S REPORT 1 MANAGEMENT S DISCUSSION AND ANALYSIS 3 BASIC
LONG BEACH UNIFIED SCHOOL DISTRICT LOS ANGELES COUNTY
 LOS ANGELES COUNTY REPORT ON AUDIT OF FINANCIAL STATEMENTS AND SUPPLEMENTARY INFORMATION INCLUDING REPORTS ON COMPLIANCE June 30, 2017 TABLE OF CONTENTS June 30, 2017 INDEPENDENT AUDITORS REPORT MANAGEMENT'S
VENTURA COUNTY OFFICE OF EDUCATION ANNUAL FINANCIAL REPORT JUNE 30, 2016
 VENTURA COUNTY OFFICE OF EDUCATION ANNUAL FINANCIAL REPORT TABLE OF CONTENTS FINANCIAL SECTION Independent Auditor's Report 2 Management's Discussion and Analysis 5 Basic Financial Statements Government-Wide
ADOPTED BUDGET
 2012-13 ADOPTED BUDGET THE FUTURE OF K-12 EDUCATION IN CALIFORNIA HANGS IN THE BALANCE PENDING THE RESULTS OF THE NOVEMBER VOTER TAX INTITATIVE November 2012 Tax Election School Districts Prepared by: