2017 IOWA STATE UNIVERSITY LAND VALUE SURVEY: OVERVIEW
|
|
|
- Elisabeth James
- 6 years ago
- Views:
Transcription
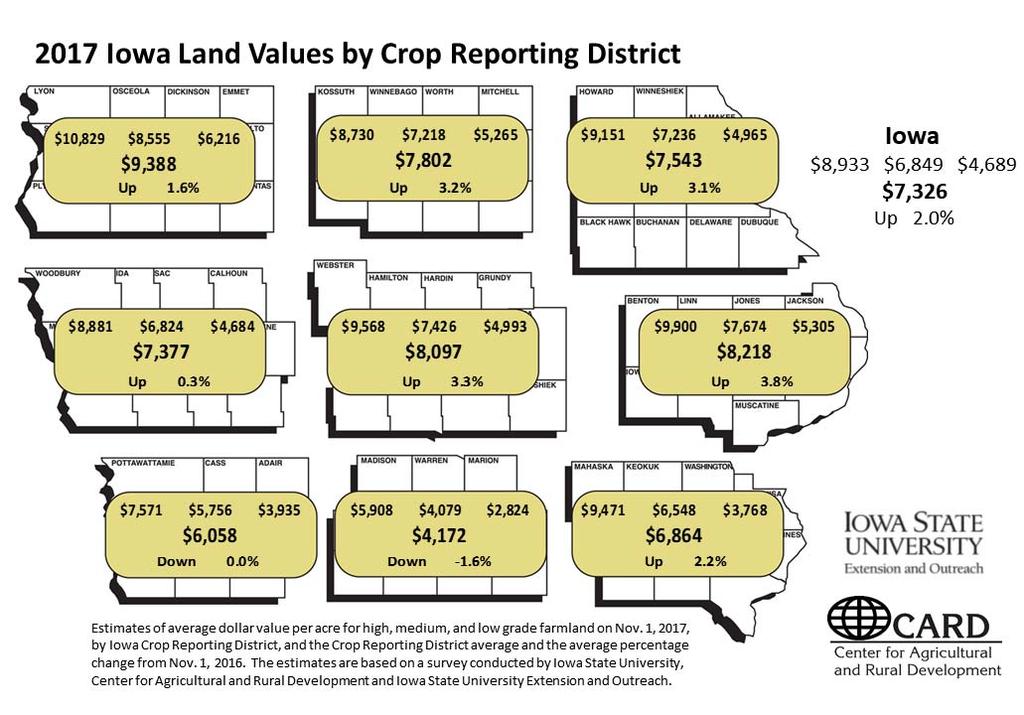
1 2017 IOWA STATE UNIVERSITY LAND VALUE SURVEY: OVERVIEW History and Purpose of the ISU Land Value Survey The survey was initiated in 1941 and is sponsored annually by Iowa State University. Only the state average and the district averages are based directly on ISU survey data. County estimates are derived using a procedure that combines ISU survey results with data from the US Census of Agriculture. Since 2014, the survey has been conducted by the Center for Agricultural and Rural Development in the Department of Economics at Iowa State University and Iowa State University Extension and Outreach. The survey is intended to provide information on general land value trends, geographical land price relationships, and factors influencing the Iowa land market. The survey is not intended to provide a direct estimate for any particular piece of property. The survey is an expert opinion survey based on reports by licensed real estate brokers, farm managers, appraisers, agricultural lenders, county assessors, and selected individuals considered to be knowledgeable of land market conditions. Respondents were asked to report for more than one county if they were knowledgeable about the land markets. The 2017 survey is based on 877 usable county-level land values estimates provided by 710 agricultural professionals. Of the 710 respondents, 64 percent completed the survey online. Online responses allow participants to provide estimates for up to 15 counties. A new web portal has been developed this year to facilitate the visualization and analysis of Iowa farmland values by pooling data from ISU, USDA, Chicago Fed, and the Realtor Land Institute, as well as by making use of charts over time and interactive county maps. The portal can be accessed at Participants in the survey are asked to estimate the value of high-, medium-, and low- quality land in their county. Comparative sales and other factors are taken into account by the respondents in making these value estimates. This survey is the only data source that provides an annual land value estimate at the county level for each of the 99 counties in Iowa. In addition, this survey provides estimates of high-, medium-, and low-quality land at the crop reporting districts and state level. Analysis by State The 2017 state average for all quality of land was estimated to be $7,326 per acre as of November The state value increased $143 per acre from November The percentage increase was 2.0 percent from November 2016, which was the first increase after three consecutive years of decline. December 11, 2017 Prepared by Dr. Wendong Zhang ( , wdzhang@iastate.edu), assistant professor of Economics and extension economist at Iowa State University, Karen Kovarik, CARD staff, Mykayla Getschel, Morgan Ruiz and Philip Sciranko, undergraduate research assistants. 1
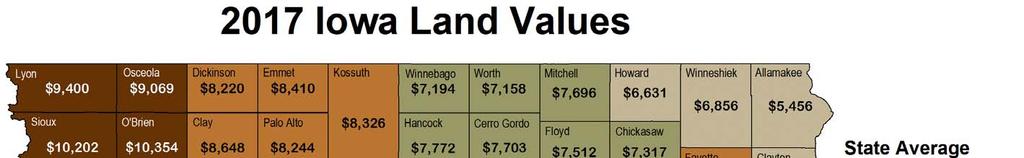
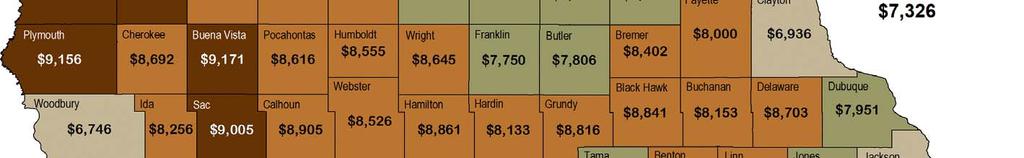
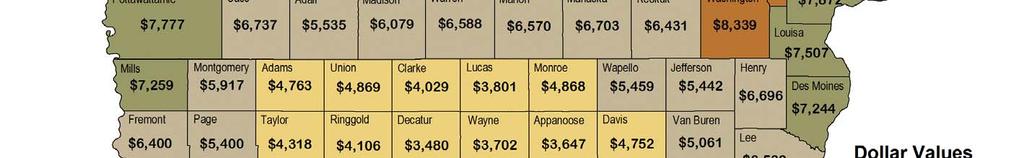
2 Analysis by Crop Reporting District The highest average land values were reported for Northwest Iowa, $9,388 per acre. The lowest average land values were estimated for South Central Iowa, $4,172 per acre. Seven of nine crop reporting districts reported an increase in land values: the largest percentage increase was in East Central Iowa, 3.8 percent, only the South Central district reported a loss, 1.6 percent lower than The Southwest district reported no notable changes in value. Low-quality land in Central, Southwest, South Central and Southeast Iowa all saw declines despite increases in other districts. Analysis by Counties The highest value was estimated for Scott County, $10,497 per acre. The lowest value was in Decatur County, $3,480 per acre. Only four of 99 counties in Iowa reported a drop in land value. The largest percentage increase, 4.7 percent, was reported in both Allamakee and Clayton Counties. The largest dollar decrease was reported Mills County, $25 per acre. The highest percentage decrease (0.3 percent) was reported in Fremont, Mills, Montgomery, and Page Counties. Analysis by Quality of Land Low-quality land in the state averaged $4,689 per acre and showed a 0.5 percent increase or $24 per acre. Low-quality land in the Central, Southwest, South Central, and Southeast districts all saw declines, despite increases in other districts. Medium-quality land averaged $6,849 per acre and showed a 2.2 percent increase or $144 per acre. High-quality land averaged $8,933 per acre and showed an increase of 2.0 percent or $175 per acre. Major Factors Influencing the Farmland Market Most survey respondents listed positive and/or negative factors influencing the land market. Of these respondents, 80 percent listed at least one positive factor, and 81 percent listed at least one negative factor. In most cases, respondents listed multiple factors. There were three positive factors listed by over 10 percent of respondents who provided at least one positive factor. The most frequently mentioned factor was low interest rates, mentioned by 21 percent of the respondents. Limited land supply was the second-most frequently mentioned positive factor, mentioned by 20 percent of the respondents. Other frequently mentioned positive factors included strong yields (15 percent), strong demand (6 percent), and investor demand (5 percent). There was only one negative factor listed by more than 10 percent of respondents who identified at least one negative factor. The most frequently mentioned negative factor affecting land values was lower commodity prices, mentioned by 41 percent of respondents. High input prices and eroding cash and credit availability were the second-most frequently mentioned negative factors, with each mentioned by 7 percent of respondents. Strong investment alternatives such as the stock market, an uncertain agricultural future, and weaker cash rents were mentioned by 6, 5, and 4 percent of the respondents, respectively. Number of Sales Compared to Previous Year Forty percent of respondents reported lower sales in 2017 relative to a year ago. On the other end of the spectrum, just 20 percent reported more sales, and 37 percent reported the same level 2
3 of sales in 2017 relative to Central Iowa has the highest percentage of respondents who reported lower sales, 63 percent, while the Southeast and Northwest districts have the lowest percentage of respondents who reported lower sales, 31 percent each. Land Sales by Buyer Category The 2017 survey asked respondents what percent of the land was sold to five categories of buyers: existing local farmers, existing relocating farmers, new farmers, investors, or other. The majority of farmland sales, 72 percent, were to existing farmers, of which existing local farmers capture 70 percent of land sales and only 2 percent were to existing relocating farmers. Investors represented 22 percent of land sales. New farmers represented 4 percent of sales, and other purchasers were 2 percent of sales. Sales to existing local farmers by crop reporting districts ranged from 81 percent in Northwest Iowa to 52 percent in South Central Iowa. Sales to investors were highest in South Central Iowa (34 percent). Northwest Iowa reported the lowest investor activity (15 percent). Land Sales by Seller Category The 2017 survey asked respondents what percent of land was bought from five categories of sellers: active farmers, retired farmers, estate sales, investors, or other. The majority of farmland sales, 54 percent, were from estate sales, followed by retired farmers at 23 percent. Active farmers account for 13 percent of sales, while investors accounted for 8 percent. Estate sales by crop reporting districts ranged from 64 percent in Northwest Iowa to 33 percent in South Central Iowa. Sales by investors were highest in South Central Iowa (19 percent). Northwest Iowa reported the lowest investor sale activity (5 percent). Respondents by Occupation and by Mode of Survey The 2017 ISU survey also asked the main occupation of the respondent: farm managers, appraisers, agricultural lenders, brokers/realtors, government, farmers/landowners, and other. This year s survey also asked about the number of years experience of respondents and number of counties they offer services in. Additionally, the land value survey was available online in addition to using the traditional mail copy. In total, 710 agricultural professional completed the survey, providing 877 county land value estimates, which is a historic high. Of these 710 respondents, agricultural lenders represented the largest group, accounting for 42 percent of all respondents. Realtors/brokers, farm managers, and appraisers were the other three largest groups, representing 14, 13, and 9 percent of respondents, respectively. Of all respondents, the percentage of agricultural lenders ranged from 39 percent in South Central to 52 percent in the Northeast district. Agricultural professionals on average have 25 years of experience in their current profession and offer professional service to an average of 9 counties. While government officials typically only serve two counties at most, farm managers, appraisers, ag lenders, and realtors/brokers offer services to 10, 13, 5, and 14 counties, respectively. The survey was completed online by 454 participants 64 percent of the 710 respondents in 3
4 total. Eighty-five percent of the respondents only provided land value estimates for their primary county, and 9 and 3 percent of these 710 respondents provided estimates for 2 and 3 counties, respectively. Farmland Value and Cash Crop Price Predictions by Respondents This year s survey asked respondents to predict land values and cash crop prices one and five years from now. The 2.0 percent increase boosted confidence in the strength of the farmland market despite growing farm financial stress, especially in the medium term. Fifty-eight percent of respondents forecasted an increase in their local land market a year later, while 25 percent expected a lower land value, and 18 percent forecasted no change a year later. Looking five years ahead, a vast majority of the respondents (83 percent) expect a higher land value than current levels, with only 13 percent forecasting a decline. Respondents expect a slow but steady improvement in the cash crop markets, both corn and soybean. In particular, the predicted state average cash corn prices for November 2018 and 2022 (five years from now) are $3.32/bu and $3.98/bu, respectively. The predicted state average soybean price predictions are $9.21/bu one year later, and $10.25/bu five years later. Land Quality and Corn Suitability Rating 2 To gauge how each respondent defined high-, medium-, and low-quality land for their county, we asked for estimated average CSR2 (Corn Suitability Rating 2) for high-, medium-, and lowquality land. We also asked their estimates for the percent of land area for each land quality class. Results show that agricultural professionals have adapted to CSR2. Approximately 90 percent of participants provided at least one CSR2 estimate for the corresponding land quality classes. The estimated average CSR2 statewide for high-, medium-, and low- quality land is 82, 70, and 56 points respectively, and the reported estimated percent of land area for high-, medium-, and low- quality land is 36, 41, and 23 percent, respectively. In addition, respondents ranked high-, medium-, and low-quality land based on relative conditions in their region. For example, the average CSR2 for high-quality land in the South Central district is 70, comparable to the CSR2 for low-quality land in Northwest district at 67. 4
5 Interpretation of the Survey Results The 2017 Iowa State University land value survey reported a 2.0 percent increase to $7,326 in average Iowa farmland values from November 2016 to November This represents the first, albeit modest, increase in the Iowa farmland market after three consecutive years of decline from 2013 to 2016; however, this does not necessarily indicate a turn of the land market. Actually, the inflation-adjusted average farmland value actually saw a 0.2 percent drop since a year ago. Given rising interest rates and stagnant farm income, the continued decline in values in the foreseeable future is still likely. This could be just a temporary break in a downward adjustment trajectory. This recent increase is largely driven by limited land supply: only 20 percent of respondents reported more sale activities in their primary county, and this marks the first time in the past 20 years that more respondents reported four years in a row of less sale activities than in each previous year. Specifically, 43 percent of survey respondents reported lower sales in 2017 relative to 2016, compared to 20 percent reporting more sales, and 37 percent reporting similar/no change in sales. In addition to limited land supply, favorable interest rates and strong crop yields were reported across the state, except for South Central and Southeast Iowa. In general, the results from the 2017 Iowa State University land value survey echo results from other surveys. In November, 2017 the Federal Reserve Bank of Chicago reported no change in Iowa s good farmland values from July 1st, 2017 to October 1st, 2017, which represents a 2% increase from October 1st, 2016 to October 1st, Specifically, the Northeast and Western districts saw a 1% increase over the last quarter, while the Central district saw a 1% decrease in land value from July to October The Eastern district saw no change in values. U.S. Department of Agriculture June Area Survey reported a 1.9% increase in Iowa s agricultural real estate values (land and building) from June 2016 to June In September, the Realtors Land Institute reported a 2% increase in Iowa cropland values from March 2017 to September 2017, which constitutes a 2.9% decline from September 2016 to September The 2017 ISU survey shows that seven of nine crop reporting districts reported an increase in land values: the largest percentage increase was in East Central Iowa, 3.8 percent, which likely is a result of stronger yields this year the East Central and Northeast districts are the only two districts that saw an increase in corn yields over 2016 levels. In contrast, the South Central district reported a loss, 1.6 percent lower than 2016, which could in part result from a 5 percent lower payment rate from the Conservation Reserve Program (CRP) from a year ago. The Southwest district reported no notable changes in value. Additionally, only four of 99 counties in Iowa reported a drop in land value Fremont, Mills, Montgomery, and Page Counties all saw a 0.3 percent decline. This year s survey revealed different patterns in land values across different land quality classes. While state average values for high- and medium-quality land both increased about 2 percent, there was only a 0.5 percent increase for low-quality farmland values. In addition, low-quality land in the Central, Southwest, Southeast, and South Central districts all saw a decline compared to a year ago, ranging from 0.4 percent to 6.1 percent. This, in part, results from a lower CRP rental rate for those lower-quality land parcels eligible for CRP in 82 out of 99 Iowa counties compared to a year ago. The survey also reported on buyers and sellers of Iowa farmland. The majority of farmland sales, 71 percent, were to existing farmers, with existing local farmers making up 70 percent of sales. Investors and new farmers represented 23 and 4 percent of sales, respectively. In contrast, estate sales accounted for 54 percent of farmland sales, and retired farmers accounted for 23 percent of sales. Additionally, the most common positive factors influencing land prices noted by survey respondents were low interest rates, limited land supply, strong crop yields, and strong demand. The most commonly cited negative influences were lower commodity prices, high input prices, weak cash rental rates, and stronger investment alternatives such as stock market returns. The farmland value estimates from the ISU Land Value Survey is average land value estimates for all farmland in the county, which not only includes cropland, but also pasture, CRP, and timberland. Specifically, we ask the respondents farmland value for average-sized farms in your county as of 5
6 November 1, It is important to note that when comparing results across surveys for Iowa and neighboring states, it is better to compare percentage change over time as opposed to dollar amount per acre. The Iowa State University survey is an opinion survey, as are the surveys conducted by Federal Reserve Bank, USDA, and the Realtor Land Institute. There are four major distinctions between the ISU survey and other surveys of Iowa farmland markets conducted by the USDA, Federal Reserve, and RLI. First, the respondents are different: the USDA survey is a producer opinion survey; the ISU survey relies on farm managers, appraisers, brokers and agricultural lenders; the RLI survey relies mainly on farm managers, appraisers, and brokers; the Federal Reserve survey relies on bank presidents and agricultural lenders; and, the USDA survey relies on estimates by individual agricultural producers. Second, the land value definitions are different USDA asks farmers to estimate the current market value of the parcel that he or she operates, the ISU survey asks for the typical farmland value for average-sized farms in a particular county, and RLI breaks down land value by high-, medium-, and low-quality tillable cropland, pasture, and timberland. Third, the spatial coverage of the survey is different: ISU provides an annual land value estimate at the county level, RLI is at the crop reporting district level, and USDA and Federal Reserve are typically at the state level. USDA Census of Agriculture does also provide a county-level estimate, but that is only conducted every five years. Fourth, the timing of the survey is different: ISU land value estimates are as of November 1, the USDA survey is released every August for value as of June, RLI estimates are released every March and September, and Federal Reserve estimates are released in January, April, July, and October. An opinion survey is just that. It represents the collective opinion of the survey respondents. Most of the respondents will use actual sales to formulate their opinions but each person can choose to weigh or discount particular sales as they deem necessary. In addition to farmland transactions, opinionbased surveys often provide consistent and complimentary information on farmland market trends at the county, district, and state level. A study led by Dr. Mike Duffy comparing the ISU land value survey and actual sales data in Iowa from 2000 to 2011 showed that differences were not statistically significant. Land value surveys provide a good indication of the direction of change and level of value, but they are still an opinion survey that represents who is being surveyed. It is important to consider the survey respondents, the questions asked, the time period covered, and other factors relating to a particular survey. The ISU land value survey is intended to provide information on general land value trends and geographical land price relationships and factors influencing the Iowa land market. The survey is not intended to provide a direct estimate for any particular piece of property. We recommend the interested buyer or seller hire an appraiser to conduct formal appraisal of particular parcel, go to county assessor websites, or examine recent auction results for comparable parcels in their region. 6
7 Outlook for Land Values After three consecutive declines since its 2013 peak, the average land value for all qualities of farmland saw its first increase. The estimated $7,326 per acre statewide average for all qualities of land represents a 2.0 percent increase from November To many, this recent 2.0 percent indicates a turnaround of the farmland market 58 percent of the respondents to the 2017 ISU survey expected another hike in their counties land value a year from now. However, as opposed to a result of improving farm income, this recent increase in land market is mainly driven by limited land supply. Given the rising interest rate and heightening farm financial stress across the Midwest, this recent bump could likely be just a temporary break in a continued downward adjustment in the farmland market. Many supply and demand factors were behind this recent increase in the land market. First, the farmland market has always been a thin market with less farmland sales, but the past four years the farmland market has been extremely tight: for four consecutive years, more respondents to the ISU survey reported less sales in their county compared to the previous year. In this year s survey, only 20 percent of the respondents reported more sales activities, while 44 and 37 percent reported less or similar sales activity, respectively. The limited farmland supply helped buoy market prices in many areas across the state. Second, the U.S. Department of Agriculture Economic Research Service forecasted that U.S. farm sector profits are relatively stable in 2017 after 3 consecutive years of decline: U.S. net farm income is forecast to increase $1.7 billion (2.7 percent) from 2016 to $63.2 billion in 2017 and net cash income is forecast to increase $3.7 billion (3.9 percent) to $96.9 billion. Third, the 2017 Iowa State University Cost of Production estimates revealed that the estimated average cost for corn production in Iowa dipped by 12 percent to $3.51/bushel for corn following soybean production, and the average cost for soybean dropped by 9 percent to $9.56 for herbicide resistant soybeans. Despite continued declines in commodity prices, the corresponding drop in production costs have resulted in breakeven or positive production margin for many producers this year, which has a positive impact on farm income and asset values. The 2.0 percent increase boosted confidence of our respondents in the perceived strength of the farmland market despite growing farm financial stress, especially in the medium term. Fifty-eight percent of the respondents to our 2017 ISU survey forecasted an increase in their local land market a year later, while 25 percent expected a lower land value, and 18 percent forecasted no change a year later. Looking at the land market five years from now, a vast majority of respondents (83 percent) expect a higher land value than current levels, with only 13 percent forecasting a decline. This is consistent with their corn and soybean price forecast, which is a slow but steady improvement in the cash crop markets, both corn and soybean. The farm managers and rural appraisers at the May th annual Soil Management and Land Valuation conference also expected a stabilization in Iowa s farmland market in late 2017 throughout 2018, but it may rebound a bit in the medium run before I would caution any immediate hail of the turn of the Iowa farmland market given the stagnant farm income and rising interest rates. The fundamentals of the U.S. farm economy haven t improved significantly, so this recent increase in land value to some extent is defying logic. There are several reasons for my caution. First, despite the 2.0 percent increase in nominal average state land values, the inflation-adjusted Iowa farmland value on average actually saw a 0.2 percent decline. In other words, the growth in general inflation in the U.S. economy actually outpaced the seeming gain in the farmland market. Second, the recent increase is largely influenced by very limited farmland supply, so if more farmers are forced to liquidate a portion of their assets due to heightening farm financial stress, there will be more land parcels available on the market, potentially allowing the land market to go down in the future. An analysis by Dr. Alejandro Plastina using farm data from the Iowa Farm Business Association shows that the share of financially stressed farms (vulnerable liquidity or solvency ratings) increased from 38 percent in December 2014 to 47 percent in December The Federal Reserve Banks in Chicago and Kansas City also reported continued deterioration in agricultural credit conditions, as a result, the downward pressures on the farmland market are still present. Finally, many neighboring states, from Kansas and Nebraska to Illinois and Indiana, all saw a modest decline in their land market compared to a year ago, according the surveys conducted 7
8 by the Federal Reserve Banks of Chicago and Kansas City. There is no explicit reason to believe that Iowa s land market has a fundamentally different dynamics than those of neighboring states, especially Illinois and Indiana. Actually, the Ag Economy Barometer, a nationwide producer survey conducted by Purdue University, reported that more producers expected to see a lower land value in their area as opposed to a higher land value. Put simply, land value is the net present value of all discounted future income flows. With certain assumptions imposed, one could think of land value being net income divided by interest (discount) rate. To understand the changes in land value over time and across space, it is useful to examine how net income and interest rates will change over the next few years. In particular, trends in net income for a particular region will be reflected in the farmland market, which tends to be localized. With the boost of strong yields, the prospect for the agricultural economy is showing signs of stabilization after four consecutive years of declines. USDA Economic Research Service forecasted in August 2017 that U.S. net farm income will rise 2.7 percent in However, the USDA Office of Chief Economist long-term forecast to 2026 expected a slow improvement in farm income as opposed to a sudden rebound. In other words, in the immediate future, we are likely to see stagnation in the net farm income and farm sector profits, which is prone to shocks of NAFTA renegotiations and implies a stagnant land market in the near future. In addition, even with the shift in its leadership, the Federal Reserve Bank will likely continue its efforts to raise the interest rates. Over the past two years, the Federal Reserve Bank has made three hikes, each 25 basis points, to the short-term federal funds rate to over 1 percent. The agricultural lenders have responded to raise the fixed and variable agricultural loans rates to its highest level in five years at more than 5.5 percent. This trend will likely continue especially in light of the growing agricultural debt repayment problems experienced at some agricultural banks. With stagnant future farm income and a highly probable increase in interest rates, we might see farmland values continue to recede due to stagnant commodity prices, new uncertainty regarding agricultural trade such as NAFTA renegotiations, and possible stress sales from some producers. Despite the recent increase driven by limited land supply, the economic fundamentals suggest that the Iowa farmland market appears to have peaked for the foreseeable future, and we may expect to see it drifting sideways. In other words, it seems that current farmland market hasn t fully capitalized the reduction of net farm income off its 2013 peak yet. U.S. crop agriculture continues on an amazing productivity run. The last five corn crops were the five largest ever produced, and the last four soybean crops were the four largest ever. This run is the result of a combination of improved seed genetics and mostly favorable weather conditions, and it is likely to continue into the next season. While these phenomenal yields help drive the per bushel production cost down, the abundant supply resulting from record yields also often leads to even lower commodity prices. Although current futures prices for the 2018 crops are offering a somewhat better outlook with the 2018/19 season average corn and soybean price around $3.80 and $9.90 per bushel, respectively, projections for the 2018/19 crop margins would be slightly below breakeven for both crops because of current wide basis levels. The likely high yields for next production season will exacerbate the oversupply of corn and soybean and thus keep the prices at low levels. This low-tonegative crop production margin likely will put additional downward pressure on the land market. Similarly, both the hog and cattle prices were stable compared to year ago, but about 20 percent lower than two years ago, and the effects of strong livestock profits compensating crop profit loss are much weaker. Farmland sale activities tend to be correlated with changes in land values with the current farm downturn, landowners tend to continue to hold to land parcels and postpone their land sales, which results in a continuation of less farmland sales. With the continued decline in farm income and profitability, some existing landowners may reconsider retirement and sell their land eventually. The heightening farm financial stress is already putting pressure on some vulnerable producers to liquidate some of their assets. To the extent that this will lead to more land parcels on the market, which is not much given the current tight market, there could be additional downward pressure on 8
9 the farmland market. According to the 2012 Iowa Farmland Ownership and Tenure Survey, half of Iowa s farmland has been held for more than 20 years. As a result, a large influx of farmland supply is not likely, but this potential rise in farmland sale activity and continued decline in farmland values might present opportunities for beginning farmers and ranchers to enter the market. Farmland has historically been a fairly robust investment that generates relatively stable returns. Since 1941 the nominal and inflation-adjusted Iowa farmland values have averaged a 6.5 percent and 2.7 percent increase per year, respectively. Farmland values have increased 73 percent of the years, decreased 26 percent of the years, and remained unchanged for three years between 1910 and While 20 percent of Iowa farmland is mainly owned for family or sentimental reasons, the strong robust returns have and will continue to attract interested farmers and investors to invest in the farmland market. There are several unique uncertainties worth watching over the next year or two. First, it remains unclear how quickly and by how much the Fed will raise interest rates. Second, it is uncertain how the trade agreement renegotiations like NAFTA will affect agricultural exports and farm income. This is particularly relevant for Iowa as it is one of the few states that have a trade surplus with Mexico, and disruptions of NAFTA could have major negative implications for the Midwest agricultural economy. Third, the agricultural sector is closely watching possible policy changes, especially the 2018 Farm Bill discussions and the impacts of new tax reform. Fourth, it is critical to watch whether the improved farm income and land market lead to landowners growing interest in selling land, or more stressed sales from financially stressed producers. If we define a golden era in agriculture as a period when the inflation-adjusted value of farmland significantly exceeds the 1910 level, we can argue that there have been three major golden eras in modern U.S. agriculture over the last 100 years: , , and most recently, With current commodity prices and U.S. farm income and asset values declining significantly, many farmers and agricultural professionals worry about the current farm downturn deteriorating into another farm crisis. However, I would argue that despite the growing financial stress across the Midwest over the past few years, we are unlikely to see a replay of 1980s farm crisis as evidenced by the sudden, precipitous collapse of the U.S. agricultural land market and mounting delinquent farm loans and foreclosures. This somewhat optimistic outlook mainly stems from the strong farm income growth from 2003 to 2013, the historically low interest rate environment, and more prudent agricultural lending practices. In addition, our analysis suggests that the trajectory of the current farm downturn will likely be a gradual, drawn-out one like that of the 1920s farm crisis, as opposed to a sudden collapse as in the 1980s farm crisis. Across the Midwest, there are signs of deteriorating agricultural credit conditions and a continued, prolonged downturn in the agricultural economy, although with a much slower pace. Given the rising interest rates and stagnant farm income, I would not be surprised to see a continued decline in values in the future. This recent bump of Iowa farmland market, to me, seems more like a temporary break in a downward adjustment trajectory. Iowa State University does not discriminate on the basis of race, color, age, ethnicity, religion, national origin, pregnancy, sexual orientation, gender identity, genetic information, sex, marital status, disability, or status as a U.S. veteran. Inquiries can be directed to the Interim Assistant Director of Equal Opportunity and Compliance, 3280 Beardshear Hall, (515)
10 Table 1. Recent Changes in Iowa Farmland Values Value Per Acre Dollar Change % Change Value Per Acre Dollar Change % Change Table 2. Iowa Farmland Values and Percentage Change by District and by Land Quality as of November 2017 District Average Value % Change High Quality % Change Medium Quality % Change Low Quality % Change Northwest $9, % $10, % $8, % $6, % North Central $7, % $8, % $7, % $5, % Northeast $7, % $9, % $7, % $4, % West Central $7, % $8, % $6, % $4, % Central $8, % $9, % $7, % $4, % East Central $8, % $9, % $7, % $5, % Southwest $6, % $7, % $5, % $3, % South Central $4, % $5, % $4, % $2, % Southeast $6, % $9, % $6, % $3, % STATE (avg) $7, % $8, % $6, % $4, % 10
11 Table 3. Iowa Farmland Values by Crop Reporting Districts and Quality of Land Year State Avg Northwest North Central Northeast West Central 11 Central East Central Southwest South Central Southeast All Quality High Quality Medium Quality Low Quality
12 Table 4. Level of Sales Activity, 2017 More Less Same (Percent) Northwest North Central Northeast West Central Central East Central Southwest South Central Southeast STATE Table 5. Iowa Land Purchases by Buyer Types, 2017 Existing Local Farmers Existing Relocating Farmers New Farmers Investors Other (Percent) Northwest North Central Northeast West Central Central East Central Southwest South Central Southeast STATE Table 6. Iowa Land Purchases by Seller Types, 2017 Active Farmers Retired Farmers Estate Sales Investors Other (Percent) Northwest North Central Northeast West Central Central East Central Southwest South Central Southeast STATE
13 Table 7. Survey Respondents and Responses by Mode, 2017 (Some respondents report on more than one county) Paper Online Responses Paper Online Respondents (Percent) (Percent) Northwest North Central Northeast West Central Central East Central Southwest South Central Southeast STATE
14 Table 8. Survey Respondents by Occupation, 2017 Farm manager Ag lender Broker/ Realtor Farmer/ Landowner Government Other Appraiser (Percent) Northwest North Central Northeast West Central Central East Central Southwest South Central Southeast STATE Table 9. Experience and Service Area by District and Respondent Occupation, 2017 Crop reporting Years of Number of Years of Number of district experience counties served Occupation experience counties served Northwest 27 8 Farm manager North Central 28 7 Appraiser Northeast 21 6 Ag lender 22 5 West Central 24 8 Brokers/Realtor Central Farmer/Landowner 37 4 East Central 24 5 Government 22 2 Southwest 24 6 Other South Central Southeast 27 8 STATE 25 9 STATE
15 Table 10. Predicted Percent Change in Local Land Value A Year Later decrease 10 percent or more decrease 5-10 percent decrease 3-5 percent decrease less than 3 percent increase 5 percent or less increase 5-10 percent increase more than 10 percent no change (Percent) Northwest North Central Northeast West Central Central East Central Southwest South Central Southeast STATE Table 11. Predicted Percent Change in Local Land Value Five Years Later decrease 10 percent or more decrease 5-10 percent decrease less than 5 percent no change increase 5 percent or less increase 5-10 percent increase percent increase more than 20 percent (Percent) Northwest North Central Northeast West Central Central East Central Southwest South Central Southeast STATE Table 12. Iowa Cash Crop Price Predictions for November 2018 and 2022 Cash Corn Prices Cash Soybean Prices One Year Later Five Years Later One Year Later Five Years Later Northwest $3.26 $3.87 $9.19 $10.33 North Central $3.35 $4.00 $9.05 $10.01 Northeast $3.35 $3.90 $9.30 $10.21 West Central $3.30 $3.97 $9.25 $10.28 Central $3.28 $3.98 $9.17 $10.08 East Central $3.40 $4.12 $9.32 $10.55 Southwest $3.31 $4.08 $9.22 $10.44 South Central $3.34 $4.04 $9.29 $10.29 Southeast $3.30 $3.95 $9.14 $10.21 STATE $3.32 $3.98 $9.21 $
16 Table 13. Estimated Average CSR2 and Percent of Land Area by Land Quality, 2017 Reported Average CSR2 Reported Percent of Land Area High Quality Medium Quality Low Quality High Quality Medium Quality Low Quality Northwest North Central Northeast West Central Central East Central Southwest South Central Southeast STATE Table 14. Estimated Average Mortgage and Operating Loan Rate 20-Year Farmland Mortgage Interest Rates (Percent) 1-Year Operating Loan Northwest North Central Northeast West Central Central East Central Southwest South Central Southeast STATE
17 Comparative Iowa Land Values By Crop Reporting District: County Name $/acre $/acre $ change % change District Name $/acre $/acre $ change % change Harrison $ 7,174 $ 7,147 $ % Northwest $ 9,388 $ 9,243 $ % Henry $ 6,696 $ 6,604 $ % North Central $ 7,802 $ 7,562 $ % Howard $ 6,631 $ 6,419 $ % Northeast $ 7,543 $ 7,313 $ % Humboldt $ 8,555 $ 8,307 $ % West Central $ 7,377 $ 7,358 $19 0.3% Ida $ 8,256 $ 8,167 $ % Central $ 8,097 $ 7,841 $ % Iowa $ 7,278 $ 7,123 $ % East Central $ 8,218 $ 7,917 $ % Jackson $ 6,855 $ 6,624 $ % Southwest $ 6,058 $ 6,060 -$3 0.0% Jasper $ 7,583 $ 7,441 $ % South Central $ 4,172 $ 4,241 -$69-1.6% Jefferson $ 5,442 $ 5,367 $ % Southeast $ 6,864 $ 6,716 $ % Johnson $ 8,769 $ 8,636 $ % State Average $ 7,326 $ 7,183 $ % Jones $ 7,485 $ 7,296 $ % Keokuk $ 6,431 $ 6,335 $ % By County: Kossuth $ 8,326 $ 8,103 $ % Lee $ 6,539 $ 6,459 $ % County Name $/acre $/acre $ change % change Linn $ 8,748 $ 8,578 $ % Adair $ 5,535 $ 5,530 $5 0.09% Louisa $ 7,507 $ 7,393 $ % Adams $ 4,763 $ 4,758 $5 0.11% Lucas $ 3,801 $ 3,761 $ % Allamakee $ 5,456 $ 5,211 $ % Lyon $ 9,400 $ 9,254 $ % Appanoose $ 3,647 $ 3,609 $ % Madison $ 6,079 $ 6,050 $ % Audubon $ 7,590 $ 7,530 $ % Mahaska $ 6,703 $ 6,610 $ % Benton $ 8,146 $ 7,922 $ % Marion $ 6,570 $ 6,490 $ % Black Hawk $ 8,841 $ 8,599 $ % Marshall $ 7,676 $ 7,474 $ % Boone $ 8,440 $ 8,168 $ % Mills $ 7,259 $ 7,283 -$ % Bremer $ 8,402 $ 8,139 $ % Mitchell $ 7,696 $ 7,503 $ % Buchanan $ 8,153 $ 7,913 $ % Monona $ 6,516 $ 6,463 $ % Buena Vista $ 9,171 $ 8,996 $ % Monroe $ 4,868 $ 4,807 $ % Butler $ 7,806 $ 7,596 $ % Montgomery $ 5,917 $ 5,937 -$ % Calhoun $ 8,905 $ 8,655 $ % Muscatine $ 7,872 $ 7,752 $ % Carroll $ 8,482 $ 8,342 $ % O'Brien $ 10,354 $ 10,194 $ % Cass $ 6,737 $ 6,731 $6 0.09% Osceola $ 9,069 $ 8,929 $ % Cedar $ 8,407 $ 8,278 $ % Page $ 5,400 $ 5,419 -$ % Cerro Gordo $ 7,703 $ 7,504 $ % Palo Alto $ 8,244 $ 8,054 $ % Cherokee $ 8,692 $ 8,577 $ % Plymouth $ 9,156 $ 9,057 $ % Chickasaw $ 7,317 $ 7,084 $ % Pocahontas $ 8,616 $ 8,388 $ % Clarke $ 4,029 $ 3,991 $ % Polk $ 7,723 $ 7,520 $ % Clay $ 8,648 $ 8,482 $ % Pottawattamie $ 7,777 $ 7,777 $1 0.01% Clayton $ 6,936 $ 6,625 $ % Poweshiek $ 7,287 $ 7,134 $ % Clinton $ 7,403 $ 7,225 $ % Ringgold $ 4,106 $ 4,084 $ % Crawford $ 7,870 $ 7,784 $ % Sac $ 9,005 $ 8,858 $ % Dallas $ 7,764 $ 7,577 $ % Scott $ 10,497 $ 10,335 $ % Davis $ 4,752 $ 4,693 $ % Shelby $ 7,726 $ 7,693 $ % Decatur $ 3,480 $ 3,443 $ % Sioux $ 10,202 $ 10,066 $ % Delaware $ 8,703 $ 8,379 $ % Story $ 8,652 $ 8,376 $ % Des Moines $ 7,244 $ 7,145 $ % Tama $ 7,667 $ 7,455 $ % Dickinson $ 8,220 $ 8,093 $ % Taylor $ 4,318 $ 4,315 $3 0.07% Dubuque $ 7,951 $ 7,615 $ % Union $ 4,869 $ 4,842 $ % Emmet $ 8,410 $ 8,248 $ % Van Buren $ 5,061 $ 4,999 $ % Fayette $ 8,000 $ 7,694 $ % Wapello $ 5,459 $ 5,384 $ % Floyd $ 7,512 $ 7,323 $ % Warren $ 6,588 $ 6,504 $ % Franklin $ 7,750 $ 7,538 $ % Washington $ 8,339 $ 8,214 $ % Fremont $ 6,400 $ 6,422 -$ % Wayne $ 3,702 $ 3,664 $ % Greene $ 7,868 $ 7,666 $ % Webster $ 8,526 $ 8,265 $ % Grundy $ 8,816 $ 8,552 $ % Winnebago $ 7,194 $ 7,003 $ % Guthrie $ 6,862 $ 6,773 $ % Winneshiek $ 6,856 $ 6,592 $ % Hamilton $ 8,861 $ 8,589 $ % Woodbury $ 6,746 $ 6,691 $ % Hancock $ 7,772 $ 7,565 $ % Worth $ 7,158 $ 6,973 $ % Hardin $ 8,133 $ 7,883 $ % Wright $ 8,645 $ 8,395 $ % 17
18
19 19
20 20
21 21
22 22
23 Iowa Nominal and inflation-adjusted average value per acre of Iowa farmland $10,000 $9,000 $8,000 $7,000 $6,000 $5,000 $4,000 $3,000 $2,000 $1,000 $ Nominal land values Inflation adjusted land values Annual Percentage Change in Nominal Iowa Farmland Values % 30.0% Annual Percentage Change (%) 20.0% 10.0% 0.0% 10.0% 20.0% 30.0% 40.0%
24 Iowa Farmland Sale Activity More Less Same % % 20.0% 10.0% % 10.0% 20.0% Percent_Change Index Benchmark 24
25 Buyers of Iowa Farmland Existing Farmers Investors New Farmers Other 25
26 Positive and Negative Factors of Iowa Farmland Market, November 2016 November Positive Factors, 2017 (Percent) Favorable Interest Rates Strong Yields Land Availability Investor Demand (Limited Supply) Cash/Credit Availability Strong Demand (Many Buyers) Negative Factors, 2017 (Percent) Commodity Prices (Lower) Cash/Credit Availability Input Costs (Higher) Cash Rent Rates (Weak) Uncertain Ag Future Strong Alternatives Stock Market, Economy 26
Comparative Iowa Land Values
 Comparative Iowa Land Values 2017-2018 By Crop Reporting District: 2017-2018 2018 2017 2018 2017 2017-2018 County Name $/acre $/acre $ change % change District Name $/acre $/acre $ change % change Harrison
Iowa Wealth Transfer and Projected Wealth Transfer
 Iowa Wealth Transfer 2008-2012 and Projected Wealth Transfer 2010-2059 Sandra Charvat Burke and Mark A. Edelman Findings This study highlights the wealth transfer that was recorded in Iowa and its counties
Indicators Program. Community and Economic Development. Iowa Income Trends: Sandra Charvat Burke
 Community and Economic Development Indicators Program Sandra Charvat Burke Findings Statewide, median household income was $53,183 during the 2011-2015 period. Counties ranged from $38,560 (Decatur) to
Count on IPERS for a safe and secure retirement.
 A MESSAGE FROM DONNA M. MUELLER, CEO 2015 PERFORMANCE REPORT AN ANNUAL SUMMARY FOR THE FISCAL YEAR ENDED JUNE 30, 2015 Count on IPERS for a safe and secure retirement. Since 1953, IPERS has been an important
Nonfarm Payroll Employment in Iowa. Manufacturing Employment Iowa
 Nonfarm Payroll Employment in Iowa Total Nonfarm Employment Goods Producing Mining Construction Manufacturing Durable Goods Nondurable Goods Service Producing Transportation, Communication, & Public Utilities
The Economic Impact of Travel on Iowa Counties 2012
 The Economic Impact of Travel on Iowa Counties 2012 A Study Prepared for the Iowa Economic Development Authority Iowa Tourism Office By the Research Department of the U.S. Travel Association Washington,
The Economic Impact of Travel on Iowa Counties 2009
 The Economic Impact of Travel on Iowa Counties 2009 A Study Prepared for the Iowa Department of Economic Development Iowa Tourism Office By the Research Department of the U.S. Travel Association Washington,
The Economic Impact of Travel on Iowa Counties 2017
 The Economic Impact of Travel on Iowa Counties 2017 A Study Prepared for the Iowa Economic Development Authority Iowa Tourism Office By the Research Department of the U.S. Travel Association Washington,
The Economic Impact of Travel on Iowa Counties 2016
 The Economic Impact of Travel on Iowa Counties 2016 A Study Prepared for the Iowa Economic Development Authority Iowa Tourism Office By the Research Department of the U.S. Travel Association Washington,
New Health Insurance Tax Credits in Iowa. Families USA
 New Health Insurance Tax Credits in Iowa Families USA Help Is at Hand: New Health Insurance Tax Credits in Iowa April 2013 by Families USA This publication is available online at www.familiesusa.org. Families
W-2 & Year-End Reporting for Local Churches. ~Emily Graber, Senior Staff Accountant, Iowa Annual Conference of the UMC
 W-2 & Year-End Reporting for Local Churches ~Emily Graber, Senior Staff Accountant, Iowa Annual Conference of the UMC 2016 W-2 Sample 2016 W-2 Preparation Box 1 Wages should include total pay for the year,
Investors Title Insurance Company - Iowa Approved Search Providers
 Investors Title Insurance Cpany - Iowa Approved Search Providers ( ALL COUNTIES ) Advanced Background Check, Inc. 122045 Turner Michelle 1221 Wilmington Ave Ste 211 Dayton OH 45420-1566 American Title,
The profitability of ethanol
 A Business Newsletter for Agriculture Vol. 12, No. 3 www.extension.iastate.edu/agdm January 2008 Tracking ethanol profitability by Don Hofstrand, value-added agriculture specialist, co-director AgMRC,
A Pay Raise for Iowa?
 A Pay Raise for Iowa? Falling Behind at the Minimum Wage Elaine Ditsler July 2006 The Iowa Policy Project 318 2nd Avenue North, Mount Vernon, Iowa 52314 319-338-0773 (phone) 319-354-4130 (fax) www.iowapolicyproject.org
Workforce and Economic Development Regional Status Report
 Workforce and Economic Development Regional Status Report Black Hawk, Bremer, Buchanan, Butler, Chickasaw, Grundy and Tama Counties Strategic Objectives 200,000 New Jobs 25% Increase in Family Incomes
WHY WE AREN T LIKELY TO SEE A REPLAY OF THE 1980s FARM CRISIS
 WHY WE AREN T LIKELY TO SEE A REPLAY OF THE 1980s FARM CRISIS Wendong Zhang Assistant Professor, Dept. of Economics Iowa State University Why We Aren t Likely to See A Replay of 1980s Farm Crisis Dr. Wendong
CEO. "When our members succeed, we succeed." Did you know? MISSION THE CREDIT UNION DIFFERENCE REPORT ANNUAL REPORT
 2016 CEO ANNUAL REPORT REPORT VISION Members Create meaningful relationships where members view us as their trusted financial partner. Employees Engage, develop and value the diversity in our employees
CEO s Message. Iowa Continues To Be A Pioneer
 Annual Report Fiscal Year 2004 CEO s Message Iowa Lottery Authority CEO Dr. Edward Stanek Iowa Continues To Be A Pioneer We experience change every day whether it s as simple as a new detour during road
Motor Vehicle Division Information Memo #19 04 SPECIAL PROVISIONS FOR CUSTOMERS IMPACTED BY FLOODING Motor Carrier Services
 Motor Vehicle Division Information Memo #19 04 SPECIAL PROVISIONS FOR CUSTOMERS IMPACTED BY FLOODING Motor Carrier Services DATE: April 11, 2019 FROM: Melissa Spiegel, Director Motor Vehicle Division TO:
In 2017, Iowa farmers are
 Vol. 21, No. 10 A Business Newsletter for Agriculture www.extension.iastate.edu/agdm August 2017 Crop insurance coverage-frequently asked questions in times of drought or floods By Charles Brown, farm
GRAIN MARKETS SENSITIVE TO EXPORTS, SOUTH AMERICAN WEATHER
 December 15, 1999 Ames, Iowa Econ. Info. 1779 GRAIN MARKETS SENSITIVE TO EXPORTS, SOUTH AMERICAN WEATHER October, November, and the first 10 days of December were unusually dry over a large part of southern
County Changes in Per Capita Personal Income
 County Changes in Per Capita Personal Income Morton J. Marcus Director, Indiana Business Research Center, Kelley School of Business, Indiana University BR ecently, the U.S. Bureau of Economic Analysis
Farm Finance Update. Nate Kauffman Omaha Branch Executive and Economist Federal Reserve Bank of Kansas City. March 17, 2017
 Farm Finance Update March 17, 2017 Nate Kauffman Omaha Branch Executive and Economist Federal Reserve Bank of Kansas City The views expressed are those of the author and do not necessarily reflect the
Delayed and Prevented Planting Provisions for Multiple Peril Crop Insurance
 Delayed and Prevented Planting Provisions for Multiple Peril Crop Insurance Most crop producers know that to achieve optimum yields it is important to plant early. Once the danger of a frost is past, the
FALL 2018 AGRICULTURAL LENDER SURVEY RESULTS
 FALL 2018 AGRICULTURAL LENDER SURVEY RESULTS A Contents Key Takeaways... 2 Introduction... 3 Agricultural Economy... 4 Farm Profitability and Economic Conditions... 4 Land Values and Cash Rent Levels...
AGRICULTURAL LENDER SURVEY RESULTS
 Summer 2017 AGRICULTURAL LENDER SURVEY RESULTS Summer 2017 / Agricultural Lender Survey Results / 1 Contents Key Takeaways... 3 Introduction... 4 Agricultural Economy... 5 Farm Profitability and Economic
Macroeconomic Outlook for U.S. Agriculture
 Macroeconomic Outlook for U.S. Agriculture Nathan Kauffman Omaha Branch Executive and Economist Federal Reserve Bank of Kansas City May 18, 216 The views expressed are those of the author and do not necessarily
Most crop producers know that to achieve
 Delayed and Prevented Planting Provisions for Multiple Peril Crop Insurance Ag Decision Maker File A1-57 Most crop producers know that to achieve optimum yields it is important to plant early. Once the
Nebraska Economic Outlook
 Nebraska Economic Outlook Nathan Kauffman Omaha Branch Executive and Economist Federal Reserve Bank of Kansas City August 3, 16 The views expressed are those of the author and do not necessarily reflect
Tax Law Changes Related to the Midwestern Disaster Areas
 Media Relations Office Washington, D.C. Media Contact: 202.622.4000 www.irs.gov/newsroom Public Contact: 800.829.1040 Tax Law Changes Related to the Midwestern Disaster Areas FS-2008-27, December 2008
The Beige Book. Summary of Economic Activity
 The Beige Book Eighth District January 2019 Summary of Economic Activity Reports from contacts indicate that economic conditions have slightly improved since our previous report. Firms continued to report
Agricultural Economic Update
 Agricultural Economic Update March 2, 217 Nate Kauffman Omaha Branch Executive and Economist Federal Reserve Bank of Kansas City The views expressed are those of the author and do not necessarily reflect
Iowa Lottery. Meeting the Challenge
 Iowa Lottery Meeting the Challenge Annual Report Fiscal Year 2009 CEO and Board Chair We re proud to report that the past fiscal year raised the highest amount of proceeds to help the state from the combined
COMMON MANUAL UPDATES
 August 1998 Through our commitment to excellence and our dedication to our customers, we will be the best student financial assistance program in the nation. FY99 Budget and Appropriations Update The House
Average Iowa farmland
 A Business Newsletter for Agriculture Vol. 17, No. 3 www.extension.iastate.edu/agdm January 2013 Farmland value reaches historic $8,296 statewide average by Mike Duffy, extension economist, 515-294-6160,
Most crop producers know that to achieve
 Delayed and Prevented Ag Decision Maker Planting Provisions File A1-57 Most crop producers know that to achieve optimum yields it is important to plant early. Once the danger of a frost is past, the more
Structure and Function of the Federal Reserve System
 1/17/17 Economic Outlook Cortney Cowley Economist Federal Reserve Bank of Kansas City Omaha Branch October, 17 The views expressed are those of the author and do not necessarily reflect the opinions of
AGRICULTURAL Finance Monitor
 n Second Quarter AGRICULTURAL Finance Monitor Selected Quotes from Banker Respondents Across the Eighth Federal Reserve District While commodity prices were down, farmers held their grain in storage. Now
Jason Henderson Vice President and Branch Executive Federal Reserve Bank of Kansas City Omaha Branch April 10, 2012
 Jason Henderson Vice President and Branch Executive April 1, 212 The views expressed are those of the author and do not necessarily reflect the opinions of the Federal Reserve Bank of Kansas City or the
MASON-DIXON MISSOURI POLL
 MASON-DIXON MISSOURI POLL APRIL 2018 PART I: GREITENS JOB PERFORMANCE EMBARGO: Newspaper Publication Wednesday, April 11, 2018 Broadcast & Internet Release - 5 am. CDT, Wednesday, April 11, 2018 Copyright
Retail Trade Analysis Report Fiscal Year 2016
 Retail Trade Analysis Report Fiscal Year 2016 Lucas County Iowa State University Department of Economics Contents: 10-Year Sales Summary 2 Local Economic Conditions 3-4 Peer Group Analysis 5-6 Pull Factor
Welcome. Your Community. Your Credit Union.
 Welcome Your Community. Your Credit Union. An Introduction On behalf of our staff and volunteer Board of Directors, I am pleased to welcome you to University of Iowa Community Credit Union. Established
A summary of regional economic indicators for the state of Missouri. FEDERAL RESERVE BANK of KANSAS CITY
 THE ECONOMIC DATABOOK A summary of regional economic indicators for the state of JULY 24, 2017 FEDERAL RESERVE BANK of KANSAS CITY SUMMARY OF CURRENT MISSOURI ECONOMIC CONDITIONS In, the unemployment rate
Retail Trade Analysis Report, Fiscal Year 2015: Lucas County
 Retail Trade Analysis Reports Iowa Community Indicators Program 3-1-2016 Retail Trade Analysis Report, Fiscal Year 2015: Lucas County Liesl Eathington Iowa State University, leathing@iastate.edu Follow
Farmers have significantly increased their debt levels
 2010 Debt, Income and Farm Financial Stress By Brian C. Briggeman, Economist, Federal Reserve Bank of Kansas City Farmers have significantly increased their debt levels in recent years. Since 2004, real
YIELD EXCLUSION: DESCRIPTION AND GUIDANCE
 FEFO 15-01 January 13, 2015 IELD EXCLUSION: DESCRIPTION AND GUIDANCE The ield Exclusion (E) allows specific years to be dropped from the calculation of guarantee yields for crop insurance. This option
Ohio Agriculture Risk Coverage and Price Loss Coverage Payments for Program Year 2016 Prepared by Ben Brown
 Ohio Agriculture Risk Coverage and Price Loss Coverage Payments for Program Year 2016 Prepared by Ben Brown As the calendar turned to October producers around Ohio and the country started to receive federal
Agricultural FINANCE Monitor
 Agricultural FINANCE Monitor agricultural credit conditions in the Eighth Federal Reserve District 2014 Fourth Quarter The eleventh quarterly survey of agricultural credit conditions was conducted by the
Crops Marketing and Management Update
 Crops Marketing and Management Update Grains and Forage Center of Excellence Dr. Todd D. Davis Assistant Extension Professor Department of Agricultural Economics Vol. 2018 (2) February 14, 2018 Topics
Agricultural FINANCE Monitor
 Agricultural FINANCE Monitor agricultural credit conditions in the Eighth Federal Reserve District 2012 Fourth Quarter The third quarterly survey of agricultural credit conditions was conducted by the
2015 Annual Report. Credit Union Difference in. ownership. governance earnings leadership
 Credit Union Difference in ownership governance earnings leadership 2015 Annual Report This credit union is federally insured by the National Credit Union Administration. our COMMITMENT CEO report VISION
FY 17 Year End, FY 18 Amendment, FY 19 Budget Discussion with Board of Supervisors. October 3, 2017
 FY 17 Year End, FY 18 Amendment, FY 19 Budget Discussion with Board of Supervisors October 3, 2017 Agenda Review FY 17, FY 18, FY 19 1. Strategic Plan Highlights 2. Revenue / Expenditure FY 17 Summary
Arkansas Property Tax: Revenue, Assessments & Rates
 Pulaski County Arkansas Property Tax: Revenue, Assessments & Rates Project Director Wayne P. Miller, Professor and Extension Economist Data Analysis Tyler R. Knapp, Program Associate Cover and Figure 1
Local Income Tax Distribution Amounts Final CY 2017 Certified Distributions Certified November 16, 2016
 ****PLEASE NOTE**** As required by IC 6-3.6-9-5, by October 1 the Budget Agency has certified to the county auditor an updated certification, after the initial estimates were certified on July 31, 2016.
Arkansas Property Tax: Revenue, Assessments & Rates
 State of Arkansas Arkansas Property Tax: Revenue, Assessments & Rates Project Director Wayne P. Miller, Professor and Extension Economist Data Analysis Tyler R. Knapp, Program Associate Cover and Figure
Credit Conditions for Young and Beginning Farmers. by Nathan S. Kauffman 1
 Credit Conditions for Young and Beginning Farmers by Nathan S. Kauffman 1 Introduction Agricultural credit conditions for young and beginning farmers are shaped by lenders perception of the trade-off between
ALICE STUDY OF FINANCIAL HARDSHIP ASSET LIMITED, INCOME CONSTRAINED, EMPLOYED. UnitedWayALICE.org/Iowa. Spring 2016
 ALICE ASSET LIMITED, INCOME CONSTRAINED, EMPLOYED Spring 2016 STUDY OF FINANCIAL HARDSHIP UnitedWayALICE.org/Iowa THE UNITED WAYS OF IOWA Appanoose County United Way United Way of Jasper County Belmond
file:///c:/users/cathy/appdata/local/microsoft/windows/temporary Int...
 1 of 5 9/25/17, 8:57 AM A Publication of the National Association of Manufacturers September 25, 2017 As expected, the Federal Reserve opted to not raise short-term interest rates at its September 19 20
Prepared for Farm Services Credit of America
 Final Report The Economic Impact of Crop Insurance Indemnity Payments in Iowa, Nebraska, South Dakota and Wyoming Prepared for Farm Services Credit of America Prepared by Brad Lubben, Agricultural Economist
For several years the Risk
 A Business Newsletter for Agriculture Vol. 15, No. 2 www.extension.iastate.edu/agdm December 2010 The new common crop insurance policy by William Edwards, extension economist, 515-294-6161, wedwards@iastate.edu
2017 Farm Bank Performance Report
 2017 Farm Bank Performance Report 2017 Farm Bank Performance Report Key Findings The banking industry is the nation s most important supplier of credit to agriculture providing nearly 50 percent of all
Retail Trade Analysis Report Fiscal Year 2016
 Retail Trade Analysis Report Fiscal Year 2016 Lyon County Iowa State University Department of Economics Contents: 10-Year Sales Summary 2 Local Economic Conditions 3-4 Peer Group Analysis 5-6 Pull Factor
Crops Marketing and Management Update
 Crops Marketing and Management Update Department of Agricultural Economics Princeton REC Dr. Todd D. Davis Assistant Extension Professor -- Crop Economics Marketing & Management Vol. 2016 (2) February
FLORIDA. Fluid Milk Report
 FLORIDA Fluid Milk Report Erik F. Rasmussen Market Administrator Florida Marketing Area Federal Order No. 6 www.fmmatlanta.com January 2018 Volume 19 No. 1 Dairy Forecast for 2018 Excerpts from Livestock,
Examining the Ohio Farm Economy Crop Margins, Land Economics, Tax Ohio Grain Farmers Symposium December 18, 2018
 Examining the Ohio Farm Economy Crop Margins, Land Economics, Tax Ohio Grain Farmers Symposium December 18, 2018 Barry Ward Ohio State University Extension The Ohio State University How much does it cost
Ohio Agriculture Risk Coverage and Price Loss Coverage Payments for Program Year 2016 Prepared by Ben Brown and Chris Bruynis
 Ohio Agriculture Risk Coverage and Price Loss Coverage Payments for Program Year 2016 Prepared by Ben Brown and Chris Bruynis As the calendar turned to October producers in some counties around Ohio and
U.S. & District Economic Outlook
 U.S. & District Economic Outlook Nebraska LEAD Program February 5, 2015 Jason Brown Senior Economist The views expressed are those of the presenter and do not necessarily reflect the positions of the Federal
A Top-4 Year! CEO & Board. Iowa Lottery Board. Immediate past member:
 2017 Annual Report CEO & Board A Top-4 Year! A third straight year of record scratch-game sales in fiscal year 2017 led the Iowa Lottery to achieve annual results that ranked in its Top 4 overall. This
Counter-Cyclical Agricultural Program Payments: Is It Time to Look at Revenue?
 Counter-Cyclical Agricultural Program Payments: Is It Time to Look at Revenue? Chad E. Hart and Bruce A. Babcock Briefing Paper 99-BP 28 December 2000 Revised Center for Agricultural and Rural Development
Land values and interest rates: will Iowa farms sink or swim?
 Land values and interest rates: will Iowa farms sink or swim? Dr. Alejandro Plastina Assistant Professor, Economics 2018 ICM 83% 1 20 18 16 14 12 10 8 6 4 2 0 Interest Rates on Farm Real Estate Loans (%
Current Economic Conditions in the Eighth Federal Reserve District. Little Rock Zone
 Current Economic Conditions in the Eighth Federal Reserve District Little Rock Zone July 2, 2010 Prepared by the Center for Regional Economics 8th District (CRE8) Federal Reserve Bank of St. Louis Eighth
State Issue 3 Grants a monopoly for the commercial production and sale of marijuana County Variance Sorted Alphabetically By County
 County Variance Sorted Alphabetically By County 2015 2015 2015 2015 2015 Vote 2015 Percent County Region Media Mkt. ISSUE 3 YES ISSUE 3 YES% *ISSUE 3 NO *ISSUE 3 NO% Variance (I) Variance (I) 2015 (I)
(Collective Bargaining), the above matter has been submitted to arbitration. Iowa Public Employment Relations Board Roster of Arbitrators.
, the above matter has been submitted to arbitration. Iowa Public Employment Relations Board Roster of Arbitrators.") .1-44).co Cat ;-1"/ ECtt cpl- In Re the Arbitration between CEO #291/Sector 2 Employer, Interest Arbitratiff;,---.5 C=, and PPME #2003, Roads, Union. 7 7:3 17.- Pursuant to Iowa Statutes Title 1, Subtitle
.1-44).co Cat ;-1"/ ECtt cpl- In Re the Arbitration between CEO #291/Sector 2 Employer, Interest Arbitratiff;,---.5 C=, and PPME #2003, Roads, Union. 7 7:3 17.- Pursuant to Iowa Statutes Title 1, Subtitle
Loan Deficiency Payments or the Loan Program?
 Loan Deficiency Payments or the Loan Program? Dermot J. Hayes and Bruce A. Babcock Briefing Paper 98-BP 19 September 1998 Center for Agricultural and Rural Development Iowa State University Ames, Iowa
Loan Deficiency Payments versus Countercyclical Payments: Do We Need Both for a Price Safety Net?
 CARD Briefing Papers CARD Reports and Working Papers 2-2005 Loan Deficiency Payments versus Countercyclical Payments: Do We Need Both for a Price Safety Net? Chad E. Hart Iowa State University, chart@iastate.edu
METRO/NON-METRO AREA (County) 1 PERSON 2 PERSON 3 PERSON 4 PERSON 5 PERSON 6 PERSON 7 PERSON 8 PERSON LIMIT LIMIT LIMIT LIMIT LIMIT LIMIT LIMIT LIMIT
 1 PERSON 2 PERSON 3 PERSON 4 PERSON 5 PERSON 6 PERSON 7 PERSON 8 PERSON LIMIT LIMIT LIMIT LIMIT LIMIT LIMIT LIMIT LIMIT") BLOOMINGTON/NORMAL (McLean) 120% $68,640 $78,480 $88,320 $98,040 $105,960 $113,760 $121,680 $129,480 80% $44,750 $51,150 $57,550 $63,900 $69,050 $74,150 $79,250 $84,350 60% $34,320 $39,240 $44,160 $49,020
BLOOMINGTON/NORMAL (McLean) 120% $68,640 $78,480 $88,320 $98,040 $105,960 $113,760 $121,680 $129,480 80% $44,750 $51,150 $57,550 $63,900 $69,050 $74,150 $79,250 $84,350 60% $34,320 $39,240 $44,160 $49,020
AN ANALYSIS OF FOOD STAMP BENEFIT REDEMPTION PATTERNS
 AN ANALYSIS OF FOOD STAMP BENEFIT REDEMPTION PATTERNS Office of Analysis, Nutrition and Evaluation June 6 Summary In 3, 13 million households redeemed food stamp benefits using the Electronic Benefit Transfer
What Can We Afford in Vigo County?
 What Can We Afford in Vigo County? Robert C. Guell Professor of Economics Indiana State University Kevin P. Christ Associate Professor of Economics Rose-Hulman Institute of Technology Near the conclusion
INSIGHTS FROM AGRICULTURAL LENDERS. January 11 th, 2019 Top Farmer Conference Beck Agricultural Center Dr. Brady Brewer
 INSIGHTS FROM AGRICULTURAL LENDERS January 11 th, 2019 Top Farmer Conference Beck Agricultural Center Dr. Brady Brewer bebrewer@purdue.edu AGRICULTURAL LENDER SURVEY Survey expectations and past results
The Farm Safety Net: The Good and Not So Good Michael Boehlje and Michael Langemeier Center for Commercial Agriculture Purdue University
 The Farm Safety Net: The Good and Not So Good Michael Boehlje and Michael Langemeier Center for Commercial Agriculture Purdue University USDA recently announced that they project net farm income to decline
Template Version Date: May 2011
 This document describes the Housing Finance Agency (HFA) Hardest-Hit Fund (HHF) data that state HFAs are required to provide to Bank of New York Mellon. It includes quarterly borrower characteristic data
Farmland Values Will the Boom Turn Bust?
 Farmland Values Will the Boom Turn Bust? Top Producer Seminar January 30, 2013 Brent Gloy Director, Center for Commercial Agriculture Bgloy@purdue.edu 765 494 0468 Agenda Is it a bubble? How much higher
How Long Will Commodity Prices Remain High?
 CARD Policy Briefs CARD Reports and Working Papers 5-2013 How Long Will Commodity Prices Remain High? Dermot J. Hayes Iowa State University, dhayes@iastate.edu Lisha Li Iowa State University, lisa1107@iastate.edu
AGRICULTURAL Finance Monitor
 n First Quarter AGRICULTURAL Finance Monitor Selected Quotes from Banker Respondents Across the Eighth Federal Reserve District Real estate values fell in ; however, recent land sales are showing some
The Beige Book. Summary of Economic Activity
 The Beige Book Eighth District February 2019 Summary of Economic Activity Economic conditions have been unchanged since our previous report. Labor market conditions remained tight as firms continued to
Wyoming Barley Production: Opportunities to Manage Production, Quality and Revenue Risks
 Wyoming Barley Production: Opportunities to Manage Production, Quality and Revenue Risks Agricultural Marketing Policy Center Linfield Hall P.O. Box 172920 Montana State University Bozeman, MT 59717-2920
Crops Marketing and Management Update
 Crops Marketing and Management Update Grains and Forage Center of Excellence Dr. Todd D. Davis Assistant Extension Professor Department of Agricultural Economics Vol. 2018 (3) March 11, 2018 Topics in
Managing Margins in 2017
 Managing Margins in 2017 12 th Farming for the Future Conference Coalition to Support Iowa s Farmers Ames, Iowa Jan. 19, 2017 Alejandro Plastina Assistant Professor plastina@iastate.edu 515-294-6160 Chad
Current Economic Conditions in the Eighth Federal Reserve District. Little Rock Zone
 Current Economic Conditions in the Eighth Federal Reserve District Little Rock Zone September 17, 2008 Prepared by the Center for Regional Economics 8th District (CRE8) Federal Reserve Bank of St. Louis
Template Version Date: August 2011
 This document describes the Housing Finance Agency (HFA) Hardest-Hit Fund (HHF) data that state HFAs are required to provide to Bank of New York Mellon. It includes quarterly borrower characteristic data
April 1, 2010 thru June 30, 2010 Performance Report
 Grantee: State of Iowa Grant: B-08-DF-19-0001 April 1, 2010 thru June 30, 2010 Performance Report Grant Number: B-08-DF-19-0001 Grantee Name: State of Iowa Grant : $156,690,815.00 Grant Status: Active
THE ROLE OF DEBT IN FARMLAND OWNERSHIP
 2nd Quarter 2011 26(2) THE ROLE OF DEBT IN FARMLAND OWNERSHIP Brian C. Briggeman JEL Classifications: Q14, Q15 Keywords: Agricultural Finance, Debt, Farmland Farm real estate debt often plays a key role
Well-Being in Non-Metropolitan Nebraska: Perceptions of the Present and Views of the Future
 University of Nebraska - Lincoln DigitalCommons@University of Nebraska - Lincoln Publications from the Center for Applied Rural Innovation (CARI) CARI: Center for Applied Rural Innovation 009 Well-Being
Crops Marketing and Management Update
 Crops Marketing and Management Update Grains and Forage Center of Excellence Dr. Todd D. Davis Assistant Extension Professor Department of Agricultural Economics Vol. 2017 (2) February 16, 2017 Topics
Staff Paper December 1991 USE OF CREDIT EVALUATION PROCEDURES AT AGRICULTURAL. Glenn D. Pederson. RM R Chellappan
 Staff Papers Series Staff Paper 91-48 December 1991 USE OF CREDIT EVALUATION PROCEDURES AT AGRICULTURAL BANKS IN MINNESOTA: 1991 SURVEY RESULTS Glenn D. Pederson RM R Chellappan Department of Agricultural
The overall composite fell 1.3
 Our Sponsors: Unemployment Rate Rises, Hospitality Falls Reminder: Dr. Christopher Thornberg from Beacon Economics will speak Monday, April 5, 4pm at HSU in Kate Buchanan Room. He will talk about California
Opportunities and challenges for agriculture. How will agriculture and the swine industry fare in today s economic climate? Opportunities.
 The outlook for the swine industry and its relationship with the global economy Brian C. Briggeman Associate Professor and Director of the Arthur Capper Cooperative Center How will agriculture and the
Gardner Farm Income and Policy Simulator. University of Illinois at Urbana-Champaign Gardner Agricultural Policy Program
 Gardner Farm Income and Policy Simulator University of Illinois at Urbana-Champaign Gardner Agricultural Policy Program Documentation Report on Model and Case Farms February 2018 Krista Swanson, Patrick
Overview of Sales Tax Exemptions for Agricultural Producers in the United States
 Overview of Sales Tax Exemptions for Agricultural Producers in the United States Dr. Wayne P. Miller Tyler R. Knapp November 2017 Draft Not for publication or quotation The University of Arkansas System
The Beige Book. Summary of Economic Activity
 The Beige Book Eighth District June 2017 Summary of Economic Activity Reports from contacts suggest economic conditions have slightly improved since our previous report. Employers reported little hiring