Can 401(k) Plans Provide Adequate Retirement Resources?
|
|
|
- Phebe Morgan
- 6 years ago
- Views:
Transcription
1 Can 401(k) Plans Provide Adequate Retirement Resources? Peter J. Brady January 2009 PRC WP Pension Research Council Working Paper Pension Research Council The Wharton School, University of Pennsylvania 3620 Locust Walk, 3000 SH-DH Philadelphia, PA Tel: Fax: The views presented in this article reflect the conclusions of the author and do not necessarily reflect the views of the Investment Company Institute or its members. I would like to thank Curtis Carlson for providing assistance in programming the stochastic simulations used in this paper, Michael Bogdan and Stephen Sigrist for research assistance, Sean Collins, Sarah Holden, Brian Reed, and John Sabelhaus for helpful comments, as well as participants at the National Tax Association 2006 Annual Meetings, the March 2007 Tax Economist Forum, and the August 2007 Federal Interagency Forum on Aging-Related Statistics Workshop on Estimating Pension Wealth. Any errors are the responsibility of the author. Opinions and errors are solely those of the author and not of the institutions with whom the author is affiliated Pension Research Council of the Wharton School of the University of Pennsylvania. All rights reserved.
2 Can 401(k) Plans Provide Adequate Retirement Resources? Peter J. Brady Abstract Despite only having been in existence for 27 years less than a typical working career some analysts seem to have concluded that 401(k) plans are a failure. For example, some argue that the 401(k) is coming up short due to, among other factors, low contribution rates among those participating. A recent government report concludes that low defined contribution plan savings may pose challenges to retirement security. In addition, there are proposals to replace 401(k) plans with Guaranteed Retirement Accounts, in part due to belief that 401(k) plan participants will not be adequately prepared for retirement. This paper illustrates that moderate 401(k) contribution rates can lead to adequate income replacement rates in retirement for many workers; that adequate asset accumulation can be achieved using only a 401(k) plan; and that these results do not rely on earning an investment premium on risky assets. Using Monte Carlo simulation techniques, this study also illustrates the investment risk faced by participants who choose to invest their 401(k) contributions in risky assets, or who choose to make systematic withdrawals from an investment account in retirement rather than annuitize their account balance. Peter J. Brady Investment Company Institute 1401 H Street, NW Washington, DC pbrady@ici.org
3 Can 401(k) Plans Provide Adequate Retirement Resources? Peter J. Brady* Investment Company Institute 1401 H Street, NW Washington, DC pbrady@ici.org December 2008 Abstract Despite only having been in existence for 27 years less than a typical working career some analysts seem to have concluded that 401(k) plans are a failure. For example, some argue that the 401(k) is coming up short due to, among other factors, low contribution rates among those participating. A recent government report concludes that low defined contribution plan savings may pose challenges to retirement security. In addition, there are proposals to replace 401(k) plans with Guaranteed Retirement Accounts, in part due to belief that 401(k) plan participants will not be adequately prepared for retirement. This paper illustrates that moderate 401(k) contribution rates can lead to adequate income replacement rates in retirement for many workers; that adequate asset accumulation can be achieved using only a 401(k) plan; and that these results do not rely on earning an investment premium on risky assets. Using Monte Carlo simulation techniques, this study also illustrates the investment risk faced by participants who choose to invest their 401(k) contributions in risky assets, or who choose to make systematic withdrawals from an investment account in retirement rather than annuitize their account balance. JEL classifications: J26, D91 Key Words: savings, pensions, longevity risk, phased withdrawal, replacement rate * The views presented in this article reflect the conclusions of the author and do not necessarily reflect the views of the Investment Company Institute or its members. I would like to thank Curtis Carlson for providing assistance in programming the stochastic simulations used in this paper, Michael Bogdan and Stephen Sigrist for research assistance, Sean Collins, Sarah Holden, Brian Reid, and John Sabelhaus for helpful comments, as well as participants at the National Tax Association 2006 Annual Meetings, the March 2007 Tax Economist Forum, and the August 2007 Federal Interagency Forum on Aging-Related Statistics Workshop on Estimating Pension Wealth. Any errors are the responsibility of the author.
4 1. Introduction When introduced in 1981, 401(k) plans were expected to be supplemental plans, used in conjunction with a defined benefit (DB) pension or a traditional defined contribution (DC) pension. 1 Increasingly, employees are provided pension benefits solely through a 401(k) plan. This development has raised concerns that 401(k) plans alone do not provide adequate financial resources in retirement. This paper illustrates that moderate 401(k) contribution rates can lead to adequate income replacement rates in retirement for many workers; that adequate asset accumulation can be achieved using only a 401(k) plan; and that these results do not rely on earning an investment premium on risky assets. Using Monte Carlo simulation techniques, this study also illustrates the investment risk faced by participants who choose to invest their 401(k) contributions in risky assets, or who choose to remain invested in risky assets rather than annuitize their account balance at retirement. Despite only having been in existence for 27 years less than a typical working career some analysts appear to have concluded that 401(k) plans are a failure. 2 For example, Munnell and Sundén (2004, 2006) argue that the 401(k) is coming up short due to low participation rates, inadequate contributions, poor investment decisions, and individuals withdrawing money from their 401(k) when changing jobs. A recent government report echoes many of these sentiments by noting, workers may receive limited or no contributions from their employers, spend accumulated savings prior to retirement, or choose not to participate in a pension plan at all, ultimately arriving at retirement with insufficient savings to support themselves (GAO, 1 In U.S. Senate Committee on Finance (1986), the Committee states: The committee also believes that excessive reliance on individual retirement savings (relative to employer-provided retirement savings) could result in inadequate retirement income security for many rank-and-file employees. In particular, the committee believes that qualified [401(k) plans] should be supplementary retirement savings arrangements for employees; such arrangements should not be the primary employer-maintained retirement plan. See also Joint Committee on Taxation (1987), which includes similar language. 2 See Tergesen (2008). Peter J. Brady December 18,
5 2007). In testimony before Congress, one academic proposed replacing 401(k) plans with Guaranteed Retirement Accounts, in part due to belief that 401(k) plan participants will not be adequately prepared for retirement (Ghilarducci, 2008). This paper focuses on the question of whether or not 401(k) plans can provide adequately for retirement given the modest contributions rates of many participants. 3 Munnell and Sundén (2006) points to two facts to support the conclusion that contributions to 401(k) plans are inadequate: (1) few 401(k) participants contribute the legal maximum to a 401(k) plan ($15,000 in 2006) and (2) the modal contribution rate is a 6 percent employee deferral plus a 3 percent employer match. The proposition that 401(k)s are inadequate in Ghilarducci (2008) is based in part on the fact that a riskless portfolio has historically yielded a real return of 3 percent or less, and that such a low rate of return would require too high a level of savings to achieve adequacy (Ghilarducci, 2006, p ). To assess the validity of these arguments, this study simulates realistic savings behavior combined with both riskless and risky investments. In addition, Social Security benefits are fully integrated into the assessment of adequacy. Despite noting the importance of Social Security and that evaluations of income security should consider total retirement income from all sources, not just DC plans (GAO, 2007, p. 4), GAO (2007) largely ignores Social Security when evaluating the adequacy of retirement savings in DC plans. This study constructs representative earnings paths that roughly represent median earnings for workers with a high school degree, a bachelor s degree, and a graduate degree. For a given earnings path and marital status, individuals are assumed to follow a particular savings path. There is no attempt to derive the optimal path for retirement savings or to define the exact 3 Other aspects of the critique of the 401(k) system have been addressed elsewhere. For example, Brady and Sigrist (2008) show that neither the offering of pensions by employers nor the participation in pension by employees is randomly distributed across the workforce; instead, those most likely to have the ability to save and to be focused on saving for retirement are much more likely to be covered by a pension. Multiple studies have shown that most 401(k) assets are preserved at job change and at retirement. See, for example, Amromin and Smith (2003); Bershadker and Smith (2006); Holden and Reid (2008); Sabelhaus, Bogdan, and Holden (2008); and Vanguard (2008). Peter J. Brady December 18,
6 amount of resources needed to adequately fund retirement. Instead, this paper assumes saving behaviors that a priori seem reasonable to the author, and which are consistent with the observed behavior of 401(k) plan participants. Income in retirement is assumed to consist of Social Security benefits and income derived from financial assets accumulated in a 401(k) plan. Replacement rates are calculated under various scenarios. For example, replacement rates are calculated assuming: current-law Social Security benefits and reduced Social Security benefits; contributions are invested in a portfolio of TIPS and contributions are invested in a portfolio of corporate stocks and bonds; and, retirees purchase an annuity and retirees make systematic withdrawals from an investment account. 2. Assumptions Used in the Simulations 4 The representative individuals in the simulations are assumed to be born on January 1, These individuals are age 40 in 2006, and reach their normal (Social Security) retirement age of 67 in Earnings paths are constructed that roughly represent median earnings for workers with different levels of education. For a given earnings path, individuals or married couples follow an assumed savings path. Married individuals are assumed to be the same age as their spouse. Retirement income is assumed to be derived from two sources: Social Security benefits and payments derived from assets accumulated in a 401(k) account. Retirement adequacy is assessed using a replacement rate that compares potential consumption after retirement to potential consumption prior to retirement. The relevant measure of pre-retirement potential consumption is calculated separately for renters and homeowners. 4 A technical appendix, available from the author upon request, explains in detail the construction of the representative earnings paths, the calculation of Socials Security benefits, the calculation of Federal and state income tax, and the method of stochastic simulations. Peter J. Brady December 18,
7 2.1. Earnings Paths The representative earnings paths are anchored at the approximate median earnings of workers age 40 with a high school degree, a bachelor s degree, and a graduate degree. In addition, a fourth earnings path one-third higher than the median graduate degree is calculated. The series are plotted in Figure 1. The names of the series reflect their origin: (1) HS-35K (high school graduate earning $35,000 at age 40 in 2006 dollars); (2) Col-55K (college graduate earning $55,000); (3) Grad-75K (worker with a graduate degree earning $75,000); and (4) Scaled Grad-100K (scaled graduate degree worker earning $100,000) Savings Table 1 summarizes the assumptions regarding the savings behavior used in the simulations. All savings are assumed to accumulate within and receive the tax treatment of a 401(k) plan. The contribution rate assumptions are behavior that a priori seemed reasonable to the author and which are consistent with pension plan participation and as documented in Brady and Sigrist (2008) and with employee deferrals and employer contribution rates as reported in profit Sharing/401(k) Council of America (2008). Those with higher earnings contribute a higher percentage of earnings to the 401(k) plan and start contributing at an earlier age. Similarly, because they have more earnings on a per person basis, single individuals are assumed to begin contributing at an earlier age than married couples with the same total earnings. Contributions to 401(k) plans as a percent of earnings, inclusive of any employer match, range from 4 percent a year for married couples with HS-35K earnings to 10 percent a year for single individuals and married couples with Scaled Grad-100K earnings. The age at which workers start contributing to a 401(k) plan ranges from 32 years of age for single individuals with Scaled Grad-100K earnings to 52 years of age for married couples with HS-35K earnings. Peter J. Brady December 18,
8 2.3. Social Security Benefits Workers are assumed to work until normal Social Security retirement age, which is 67 years of age in Parameters for the calculation of Social Security benefits use either historic values (for 2006 and years prior) or are consistent with the Social Security Administrations s (SSA) 2006 intermediate projection (Social Security Administration, 2006). Most parameters used in the calculation are indexed to wage growth, using the average wage index (AWI). The SSA s intermediate projection has average real wages growing by a steady 1.1 percent a year after 2015, with nominal wage growth of 3.9 percent and inflation of 2.8 percent. The initial benefit is indexed to inflation in the years after retirement. For each earnings path, I calculate three Social Security benefit levels: assuming the earnings are for a single individual; assuming the earnings are for a single-earner married couple; and assuming the earnings are for a married couple with each spouse earning one-half of total earnings (hereafter, dual-earner married couple ) Owner-Occupied Housing and Mortgage Payments For homeowners, it is assumed that all individuals and couples: (1) purchase a home at age 35; (2) finance 100 percent of the purchase price using a 30-year fixed-rate mortgage charging a 7.0 percent rate of interest; and (3) pay off the mortgage at age The purchase price of the home is assumed to vary by earnings path and is set (approximately) equal to the observed median purchase price in the second quarter of 2006, as reported by the National Association of Realtors (2006), in specific geographic regions. In 2006 dollars, the purchase prices are assumed to be $300,000 for the Scaled Grad-100K earnings path (equal to the median purchase price of a home in the Northeast region); $230,000 for the Grad-75K earnings path 5 According to tabulations of the Federal Reserve Board s 2004 Survey of Consumer Finances (SCF), of households with a household head age 65 to 74, 81 percent own their home; and, 60 percent of homeowners in this group, or 49 percent overall, own a home unencumbered by mortgage debt. Peter J. Brady December 18,
9 (median, all of U.S.); $190 for the Col-55K earnings path (median, Southern region); and $100,000 for the HS-35K earnings path (median, Buffalo, NY). The real price of the house is assumed to stay constant, with the nominal price increasing at the rate of inflation Taxes Payroll taxes are the sum of two taxes: the Social Security or Old Age, Survivor, and Disability Insurance (OASDI) tax of 6.2 percent of earnings up to the annual earnings base ($94,200 in 2006); 7 and the Medicare or Hospital Insurance (HI) tax of 1.45 percent on total earnings. Payroll taxes are applied only to earnings and do not effect disposable income after retirement. For Federal income tax, it is assumed that 2006 tax law applies. That is, current law tax rates are applied in all periods, and the parameters of the tax code that are indexed are adjusted for inflation (without regard to rounding rules) in periods both before and after Without loss of generality, state income taxes are calculated using the Virginia income tax. Adjusted gross income (AGI) while working is assumed to be equal to earnings less employee 401(k) contributions. In retirement, AGI is set equal to distributions from the 401(k) account plus includable Social Security benefits. 8 6 To check whether or not the assumptions regarding purchase price were reasonable, I calculated the percentage of pre-tax income represented by the sum of the total mortgage payment (both interest and principle payments) plus property taxes (assumed to 1.5 cents per dollar of value). For HS-35K workers, mortgage payments plus property taxes represented 29 percent of pre-tax income in the first year of the mortgage and represented 13 percent of pre-tax income in the final year of the mortgage. The corresponding numbers for the other earnings paths are: (1) 35 percent and 15 percent for Col-55K earners; (2) 32 percent and 14 percent for Grad-75K earners; and (3) 31 percent and 14 percent for Scaled-Grad earners. These ratios do not appear to be unreasonably high. If it is thought that the purchase prices are too low, then calculated replacement rates for homeowners would be understated. 7 For 2006 and prior years, historical earnings base numbers are used; after 2006, the earnings base is assumed to grow in line with SSA s intermediate projection. The earning base only affects the calculation of payroll taxes (and benefits) for singles and single-earner married couples with the Scaled-Grad-100K earnings profile, and even in this case only for a few years. Specifically, this earnings path exceeds the earnings base only in the years 2004 to In the case of Virginia AGI, 100-percent of Social Security benefits are excludable. Forty-one states and the District of Columbia have broad-based personal income taxes. Of these, 26 states and the District of Columbia do not tax Social Security benefits. See Snell and Waisanen (2007). Peter J. Brady December 18,
10 3. Baseline Simulation Results: TIPS Portfolio Annuitized at Retirement For the baseline case, contributions to a 401(k) are assumed to be invested in inflationindexed Treasury bonds, also known as Treasury inflation-protected securities (TIPS). Yields are assumed to be 2.4 percent real, which, through most of the projection period, yields a nominal rate of 5.2 percent. 9 Upon retirement, it is assumed that the entire 401(k) balance is used to purchase an inflation-indexed immediate life annuity that provides an annual payment until death and adjusts the payment each year to account for changes in the cost of living. Because the SSA s intermediate projection assumes life expectancy at age 65 will increase 1.9 years for males and 1.5 years for females between 2005 and 2035, annuity prices in 2033 for a 67 year-old are assumed to be equal to annuity prices in 2006 for a 65 year-old. Married workers were assumed to purchase joint and 50-percent survivor annuities; that is, a surviving spouse would continue to receive one-half of the original annuity payment Accumulations and Distributions Table 2 reports the amount of assets accumulated by the time a worker retires and the amount of annuity income that the assets would generate. Those with higher earnings are assumed to accumulate more in assets because they have higher earnings, contribute a higher proportion of their earnings, and begin contributing earlier. Controlling for total earnings, single 9 As of October 30, 2006 the yield on 10-year TIPS was 2.39 percent. The SSA s intermediate projection includes an implied real rate of 2.9 percent after However, the real return in the projection is calculated as the rate earned on debts held in the trust fund less current inflation; it is not a projection of the yield on a TIPS security. For example, in 2005, the SSA s real rate was 0.8 percent, but the 10-year TIPS yield was 1.8 percent. Because I do not know the long run relationship between TIPS yields and SSA s real interest rate, I use the current yield of 2.4 percent in the calculations. This is also, presumably, the real interest rate that is consistent with the real annuity prices discussed below. 10 Pricing was obtained on 10/31/06 for an annuity with a single annual payment, with payments commencing one year after the initial investment, and with no guaranteed minimum payments or death benefit. The amount of annual income per $100,000 invested is $6,067 for single males, $5,440 for single females, and $5,250 for joint and 50- percent survivor annuities. (See Uhttps://flagship.vanguard.com/VGApp/hnw/accounttypes/retirement/ ATSAnnuitiesOVContent.jspU.) Peter J. Brady December 18,
11 individuals accumulate more because they are assumed to begin saving at an earlier age. For married couples, assets at retirement (in 2006 dollars) range from $28,245 for HS-35K earners to $464,417 for Scaled Grad-100K earners. For single individuals, assets range from $77,709 to $559,562. With their accumulated 401(k) assets, single males could purchase real annuities providing annual income ranging from $4,587 for those with the HS-35K earnings path to $33,032 for those with the Scaled Grad-100K earnings path. Because females typically live longer than males, annual annuity payments for single females are 12 percent lower. With less money to invest both absolutely and on a per-person basis married couples can purchase annuities with annual payments ranging from $1,455 for HS-35K workers to $23,919 for Scaled Grad-100K workers Replacement Rates Pre-retirement potential consumption is calculated as average (from age 30 to 66) real net income. 11 Renters pre-retirement net income is equal to earnings less taxes and savings. Homeowners pre-retirement net income is equal to earnings less taxes, savings, and mortgage payments. For both renters and homeowners, net income in retirement is Social Security benefits and 401(k) distributions less any taxes, as it is assumed retirees no longer save and homeowners pay off their mortgage prior to retirement. 12 Results from the baseline simulations are presented in Table 3. All reported dollar amounts are in 2006 dollars. Because real earnings increase over time in the earnings paths used, 11 For a more thorough discussion of replacement rate measures, see Brady (2008). 12 The measure of average income in retirement takes into account survival probabilities, and thus places greater weight on income received in the early years of retirement. For the baseline case, weighting by life expectancy has little effect on the measured replacement rate as gross income is constant in real dollars. For more detail on the formula used, see Section below. Peter J. Brady December 18,
12 average real earnings for each series are higher than real earnings at age 40. For example, for the Col-55K earnings path, average real earnings after age 30 are $58,306. Prior to retirement, the percentage of gross earnings accounted for by savings and taxes for single individuals ranges from 26 percent for HS-35K workers to 36 percent for Scaled Grad- 100K workers. Holding total earnings fixed, married individuals have a lower reduction in income from savings and taxes, ranging from 18 percent to 30 percent. For homeowners, mortgage payments, net of tax benefits, represent an additional 10 percent to 15 percent of average pre-retirement earnings. All told, savings, taxes, and mortgage payments reduce preretirement gross earnings, on average, from 30 percent to 46 percent. In retirement, annual Social Security benefits for single individuals range from $18,814 for the HS-35K earnings path to $33,315 for the Scaled Grad-100K earnings path. Social Security benefits for married couples range from $27,754 to $49,973, in real 2006 dollars. In the case of single-earner married couples, benefits are higher than single individuals because the non-working spouse is eligible for benefits equal to 50-percent of the working spouse s benefit. In the case of dual-earner married couples, benefits are higher because each spouse earns half the amount of the single individual, and the progressive benefit formula results in benefits that replace a higher proportion of earnings. For example, for the Col-55K earnings path, singleearner married couples would receive $39,187 annually and dual-earner married couples would receive $32,547 annually, compared to $26,124 for single individuals. Adding in the annual annuity income derived from 401(k) accumulations, annual gross income ranges from $23,077 for single females with HS-35K earnings to $69,863 for singleearner married couples with Scaled Grad-100K earnings. For single individuals with HS-35K earnings, taxes in retirement are negligible, while for those that have Scaled Grad-100K earnings taxes represent about 15 percent of gross income. For married couples, taxes are negligible for those with HS-35K and Col-55K earnings, and only Peter J. Brady December 18,
13 reduce income by 7 percent for those with Scaled Grad-100K earnings. Reductions in gross income decline in retirement because (1) retirees do not save; (2) retirees do not pay payroll taxes; (3) income taxes decline; and (4) homeowners are assumed to have paid off their mortgage. Income taxes are lower because: gross income is lower; because Social Security income is at least partially excludable from taxable income; and because of increased deductions and credits. Replacement rates for single renters range from 83 to 92 percent. For married renters, replacement rates range from 83 to 102 percent of net income. Replacement rates for single homeowners range from 98 percent to 108 percent. For married homeowners, replacement rates range from 102 percent to 124 percent. 4. Judging Retirement Resource Adequacy A starting point for judging retirement resource adequacy would be to assume that a retiree would want to replace 100 percent of his average real net earnings. The results presented above suggest that most workers can achieve, or come close to achieving, this goal by supplementing Social Security benefits with income from a 401(k) plan, with moderate 401(k) contribution rates, conservative investments, and starting contributions at some point after reaching age 30. However, 100 percent potential consumption replacement may not be the correct standard for adequacy. The adequacy standard may be below 100 percent consumption replacement. First, there are work related expenses that may be eliminated or reduced in retirement. Second, with more leisure time, retirees may substitute home production for market purchases. 13 Third, consumer durables purchased prior to retirement may continue to provide services well into retirement or need to be replaced less often in retirement. Perhaps most importantly, if workers raised children 13 See Hurst (2007) for a discussion of changes in consumption near retirement. Peter J. Brady December 18,
14 while working, household expenses presumably would be lower if these individuals or couples are no longer supporting minor children in retirement. 14 The adequacy standard may also be above 100 percent consumption replacement. The primary argument in favor of individuals needing more net income in retirement is that they may experience higher out-of-pocket health care expenditures. This may be a factor both because the amount of health care services consumed by individuals likely increases in retirement, and because health care costs have tended to increase at a faster rate than general inflation. On balance, a consumption replacement rate at or below 100 percent is likely to provide adequate retirement resources, particularly for individuals who have raised children and particularly for lower income individuals, provided that Medicare and Medicaid programs remain in their current form. However, even if out-of-pocket retiree health care costs increase markedly, it is not clear that the proper measure of 401(k) adequacy would be the extent to which it can fund both living expenses and health care costs, particularly if the resources needed to fund health care are a multiple of what would otherwise be needed to fund living expenses. If, for example, the adequacy of 401(k) plans is judged relative to traditional DB pension plans, 401(k) plans do no better or worse than traditional DB plans in hedging medical expenses. In addition, if rising retiree medical costs are a public policy concern, encouraging individuals to accumulate enough financial assets to self-insure against these risks may not be the optimal public policy response. 5. Sensitivity of Baseline Results to Changes in Assumptions The simulations above require many assumptions, including assumptions about when an individual retires, the rate of return earned on savings, and the generosity of future Social 14 Scholz and Seshadri (2007) find that, controlling for lifetime earnings, children are an important determinant of household wealth. Peter J. Brady December 18,
15 Security benefits. An effort was made to make reasonable and defensible assumptions. This section investigates how sensitive the simulation results are to these assumptions. Table 4 summarizes the sensitivity analysis. If the individual or couple decides to retire at age 65 in 2031, two years prior to their normal retirement age, replacement rates are reduced by 9 to 15 percentage points. For renters, early retirement results in replacement rates that range from 75 to 90 percent. For homeowners, early retirement replacement rates range from 88 to 110 percent. The results suggest that renters wishing to retire early may need to save more than assumed in the baseline scenario. Changes in real interest rates can affect the amount of assets accumulated at retirement as well as the price of the annuity purchased at retirement. 15 The replacement rates for single individuals and higher earners are more sensitive to the rate of return assumptions because 401(k) accumulations finance a higher percentage of retirement income. For example, a 40 basis point change in the rate of return coupled with a change in the annuity payment of 10 percent changes the replacement rates of married couples with HS-35K by 1 percentage point. In contrast, replacement rates of single individuals with Scaled Grad-100K earnings change by between 5 and 8 percentage points relative to the baseline assumptions. The baseline simulation assumes Social Security benefits are determined under current law. If Social Security benefits are cut using progressive indexing starting in 2012, 16 replacement rates would be reduced by 1 to 13 percentage points. Rates would range from 75 to 95 percent for renters and from 90 to 110 percent for homeowners. A 28 percent across-the- 15 The effect of short-run fluctuations in interest rates on annuity prices can be fully hedged by matching the cash flow of the bond portfolio to the expected payout of an annuity, and can be partially hedged by matching the duration of the TIPS portfolio to the life expectancy of the average annuitant. To assess the effect of long-run fluctuations in the risk-free rate, a full stochastic analysis was not done because adequate historical return information on TIPS does not exist. For example, the Federal Reserve Board s H.15 release (Uwww.federalreserve.gov/releases/h15/U) provides data on 10-year inflation-indexed U.S. Treasury securities beginning in This paper simulates the progressive indexing proposal described in Purcell (2005) and is explained in detail in a technical appendix, which is available from the author upon request. Peter J. Brady December 18,
16 board cut in Social Security benefits would reduce replacement rates from 13 to 32 percentage points. Replacement rates would range from about 65 percent to 80 percent for renters and from about 75 percent to 90 percent for homeowners. Such benefits cuts would necessitate higher rates of savings to achieve adequacy. 6. Stochastic Simulations This section uses stochastic simulations to illustrate the range of potential outcomes if 401(k) plan contributions are invested in risky assets. Specifically, Monte Carlo simulation techniques are used which assume that, in any given year, investment returns are a random draw from all possible investment returns. Assets are assumed to be invested in a portfolio that is onehalf large corporate stocks and one-half corporate bonds, with the portfolio rebalanced annually. Data on investment returns for large company stocks and corporate bonds from 1926 to 2004 were taken from Ibbotson Associates (2005). Investments are assumed to be in mutual funds, with mutual fund expenses plus transaction costs equal to 120 basis points for stock funds and 70 basis points for bond funds. 17 Real historical returns are calculated as nominal returns in a given year less inflation experienced that year. Over the 1926 to 2004 period, the geometric mean real annual return for a portfolio with 50 percent large company stocks and 50 percent corporate bonds was 4.4 percent; the arithmetic mean real annual return was 5.2 percent; and the standard deviation of annual returns was 12.8 percent. For ease in exposition, the simulations presented above which assume that 401(k) assets are invested in TIPs and that an immediate inflation indexed annuity is purchased upon 17 In 2005, the average 401(k) participant incurred an asset-weighted stock mutual fund fee of 76 basis points in total expenses and an asset-weighted bond mutual fund fee of 58 basis points (see Holden and Hadley, 2006). These averages were increased to 120 basis points and 70 basis points, respectively, to account for both direct and indirect fund-portfolio trading expenses. Direct trading expenses include payments to brokers, as either direct fees or bid/ask spreads. Indirect trading expenses include the reduced price that a stock gets if large blocks of the stock are sold at a single time (for example, to meet cash flow needs due to share redemptions). See Edelen (1999) for a discussion of these costs. Intermediation costs are not restricted to mutual funds. Because of transaction costs and the costs of other investment services, no investor earns the pure market rate of return. Peter J. Brady December 18,
17 retirement will be referred to as the baseline case. Simulations that assume 401(k) assets are invested in a portfolio that is 50 percent large company stocks and 50 percent corporate bonds, rebalanced annually, with systematic withdrawals taken from the account during retirement, will be referred to as the investment account Accumulation of Assets For a single simulation of investment returns, random real rates of return are generated for each year over a 47-year period corresponding to the time period over which a simulated individual is aged 20 to 66. Nominal returns are calculated as the sum of real returns plus inflation. Inflation is either historical inflation (before 2006) or as projected in the SSA s intermediate projection (2006 and after). Assumptions regarding savings behavior are the same as used in the baseline case and presented in Table 1. A single simulation produces eight account balances at retirement, one for each possible combination of marital status and earnings path. This process is then repeated 5,000 times to get a range of possible outcomes. Results from these simulations are presented in Table 5. On average, over all 5,000 simulations, the investment account outperforms the baseline case. Retirees who began saving at age 52 could expect to have 24 percent more in accumulated assets compared to the baseline case, and retirees who began saving at age 32 and would be expected to have 73 percent more in accumulated assets compared to the baseline case. However, higher average returns are associated with higher risk. In the highest ten percent of simulations, returns were substantially higher for the investment account than for the baseline case with accumulated assets twice as high for those starting contributions at age 52 and nearly four times as high for those starting contributions at age 32. In the lowest ten percent of simulations, the investment account substantially underperformed the baseline case, with accumulated assets 27 percent lower for those starting contributions at age 52 and 30 percent lower for those starting contributions at age Peter J. Brady December 18,
18 32. An alternative measure of the risk is the percentage of cases in which the baseline case outperformed the investment account. This ranged from 28 percent of the time for investors with the shortest investment horizon to 18 percent of the time for investors with the longest investment horizon Distribution of Assets The baseline case assumes that, upon retirement, all accumulated 401(k) assets are used to purchase an inflation-indexed annuity. In contrast, the investment account is assumed to remain invested but with the annual distributions taken from the account. Although bequests do not affect calculated replacement rates, for completeness it is assumed that any remaining account balance is left to heirs upon death of a single individual. For married couples, it is assumed payments continue until the surviving spouse dies, with any remaining account balance left to heirs Investment Account Payout Formula Annual withdrawals from the investment account are based on remaining life expectancy. Conditional on survival to age t, withdrawals from the account are equal to: 18 I 1 W = t A t 1 (3) L s t where W = withdrawal from the investment account (indicated by the superscript I) at time t; I t A t 1 = account balance at age t-1 (i.e., Dec 31 of previous year); s L t = life expectancy conditional on surviving to age t, by gender/marital status; 19 s indexes the gender/marital status of the individual; 18 This is essentially the formula used by the IRS to determine required minimum distributions (RMD) from IRAs and 401(k) plans (which must begin in the year after the beneficiary attains age 70-1/2. Specifically, the balance as of January 1 determines the RMD for that year, and the distribution must be made by December 31. The t subscripts in the formula represent end-of-year measures, so the withdrawal is based on t-1account balances (assumed to also be equal to the balance on January 1) and withdrawals take place at time t, that is, December 31 of year t. 19 Life expectancy is taken from 2003 mortality statistics reported by the National Center for Health Statistics in Arias (2006). For married couples, the average of male and female conditional life expectancy is used. Peter J. Brady December 18,
19 Account balances evolve in the following manner: A = 1 (1 + r ) (4) t A t I t W t where r t = rate of return earned on the portfolio at age t All who die in a given year are assumed to die in the middle of that year. 20 Thus, in the event of the death of a single individual at age t, or, in the case of a married couple, in the event of death of the surviving spouse at age t, the amount of the bequest is calculated as: B = 1+ (0.5) r ) (5) t A t 1 ( t Because the life expectancy tables in Arias (2006) end at age 100, it is assumed any individuals surviving to age 100 die at the end of that year, with any remaining balance bequeathed to heirs Comparison of Payment Streams Payouts from an investment account differ from real immediate life annuity payments for two reasons. First, the payout formula is different. Annuities pay a fixed amount until death, with no payments to heirs upon the death of the annuitant. The investment account pays an amount that varies by age but, in the event of death, heirs get any remaining balance. The second difference is the amount of investment risk. A real immediate life annuity bears no investment risk, other than the risk that the insurance company cannot make the promised payments: as long as the insurance company remains solvent, the payment stream an annuitant will receive while alive is known with certainty. Payments from the investment account are not known with certainty: they vary not only by age, but also depend on the investment returns of the risky assets held in the account. To separate out the effect of the payment formula from the effect of investment risk, this section first compares the payment stream from a real annuity to the payment stream from an 20 Distributions from the account occur annually. An individual dying the day after a distribution would have fewer assets to bequeath than an individual dying the day before a distribution. The representative individuals in these examples are assumed to die in the middle of the year, which is roughly equivalent to what the average value of bequests would be from many individuals with deaths spread out over the entire year. Peter J. Brady December 18,
20 account with no investment risk. It then compares payments from a real annuity to payouts from an account invested in risky assets. Conditional on survival and reported separately for males, females, and married couples, Figure 2 plots the payment stream from $100,000 invested at age 67 (in 2033) in an inflationindexed annuity and from $100,000 invested at age 67 in TIPS that yield 2.4 percent real. 21 A single male would receive a real annuity payment of $5,903 a year (the solid red line). 22 Payouts from the TIPS account (the solid blue line) would equal $5,790 in the first year with payments increasing to $5,889 in the sixth year and then declining thereafter, falling under $5,000 at age 82 and under $4,000 at age 86. Conditional on the survival of the annuitant, the annuity is able pay more in every period than the TIPS account. This is because there is a risk of death and, in the event of death, payments cease. For the average male, the solid green line plots the probability that a man alive at age 67 will be alive at later ages. For example, there is a 51 percent chance of surviving to age 82 and a 35 percent chance of surviving to age 86. The dashed red line shows, for the average male, the expected payout from the annuity taking into account the probability of death. For the TIPS account, the expected payouts are the same whether or not the individual survives. This illustrates the trade off based on the payout method: conditional on surviving, the annuity pays more, but the expected payout is less. 23 The payment comparison is similar for single females, but both annuity payments and payments from the TIPS account differ from males because women typically live longer than 21 Provided bonds exist with sufficient amount of time to maturity, interest rate risk can be avoided by laddering the TIPS. That is, by holding bonds with a variety of maturity dates, it would be possible to ensure that interest payments and proceeds from maturing bonds would provide enough cash flow to fund the payout stream without the need to sell any of the bonds in the secondary market. 22 The quoted price for a $100,000 investment yielded a real annuity of $6,069 a year with payments commencing in one year. After the first payment, subsequent payments are adjusted for inflation. However, when measured in current dollars, and assuming 2.8 percent inflation the first payment is worth $5,903 ($6,069/1.028) because it occurs one year from the date of investment. 23 An actuarially fair annuity would have the same expected payout as the TIPS account. This is discussed in more detail below. Peter J. Brady December 18,
21 men. The annuity pays $5,292 a year in current dollars (the solid red line). 24 Payouts from the TIPS account (the solid blue line) would equal 4,922 in the first year and increase to $5,296 in the tenth year before falling off. Women have a 54 percent chance to live to age 85 and a 36 percent chance to live to age 89 (the solid green line). The annuity pays more in nearly every year, but the expected payout (the dashed red line) is less than the payout from the TIPS account. The payment comparison for married couples differs from the comparison for single individuals (the two bottom panels of Figure 2). Conditional on both spouses surviving, the withdrawals from the TIPS account exceed joint annuity payments until age 79 (at which point the probability that both spouses are alive has fallen to 47 percent). If one spouse dies and the other spouse survives, the real annuity payment is cut in half, but payments from the TIPS account continue using the same payout formula. For survivors, payments from the TIPS account exceed the survivor annuity until age 91 (at which point the probability that one spouse is alive is 35 percent). The dashed red line represents expected payments from the real annuity, and in both of the lower panels of Figure 2, it takes account both expected joint annuity payments and expected survivor annuity payments. As with single individuals, total payouts from the TIPS account (withdrawals plus bequests) exceed expected payments from the real annuity. However, unlike single individuals, there are many cases where the TIPS account pays out more than the inflation-indexed annuity even conditional on survival. Conditional on survival, Figure 3 compares the payment streams from a real annuity and from an account invested in risky assets. As before, 5,000 simulations are run assuming the portfolio is invested 50 percent in stock mutual funds and 50 percent bond in mutual funds, with the portfolio rebalanced annually. Ranking payment streams is more difficult than ranking 24 The quoted price for a $100,000 investment yielded a real annuity of $5,440 a year with payments commencing in one year. After the first payment, subsequent payments are adjusted for inflation. However, when measured in current dollars, and assuming 2.8 percent inflation the first payment is worth $5,292 ($5,440/1.028) because it occurs one year from the date of investment. Peter J. Brady December 18,
22 accumulations, as both the timing and the total amount of payments are important. To rank and evaluate payout streams, this paper borrows a measure of present discounted value (PDV) of withdrawals used by Dus, Maurer, and Mitchell (2005), which takes into account life expectancy as well as the time value of money, and is calculated as: PDV Withdrawals = t = 100 t= 67 W I t Pr( alive) ( ) ( t r* ) t (6) where t = age = withdrawal from the investment account at age t I W t Pr(alive) t = probability individual who is alive at age 67 is alive at age t r* = risk-free rate of return (=5.2%; 2.4% real + 2.8% inflation) In each panel of the chart, the average payout by year is presented for the top and bottom 10 percent of investment account simulation results ranked by the PDV of withdrawals (the light blue lines) and the middle 10 percent of simulations (the dark blue lines). Thus, the shaded area approximates a 90 percent confidence interval for investment account payouts. For men (Figure 3, top left panel), average payouts from the investment account for the middle decile of simulations exceed real annuity payments from age 68 to age 86 (at which point the probability of survival is 35 percent). Higher expected payouts are associated with more risk. In the top 10 percent of simulations, expected payouts from the investment account greatly exceed real annuity payments early on and do not fall below annuity payments until age 96. In the bottom 10 percent of simulations, withdrawals from the investment account are below real annuity payments in all periods. The comparison of payouts for women (Figure 3, top right panel) is similar to the comparison for men. Average payouts from the investment account for the middle decile of simulations exceed annuity payments from age 69 to age 92 (at which point the probability of survival is 24 percent). But the payouts are quite variable, with the top 10 percent of simulation Peter J. Brady December 18,
23 having much higher payouts and the payouts from the bottom 10 percent of simulations below the annuity payment in every year. The tradeoffs between an annuity and an investment are much different for a married couple (bottom two panels of Figure 3). 25 Conditional on both spouses surviving, the average payout from the middle decile of investment account simulations exceeds joint annuity payments from age 67 to age 90 (at which point the probability that both spouses are alive is 6 percent) and, conditional on one spouse surviving, exceed survivor annuity payments from age 67 to age 96 (at which point the probability of one spouse surviving is 13 percent). As with the simulations for single individuals, there is a good deal of uncertainty surrounding payouts. However, for a surviving spouse, even payouts corresponding to the lowest 10 percent of simulations were higher than the survivor annuity payments from age 67 to age Present Discounted Value Measures of Payment Streams The previous section presented visual comparisons of the payout streams from an immediate life annuity, an account invested in TIPS, and an account invested in risky assets. To facilitate the comparison of these payment streams, this section summarizes the payment streams by using measures of present discounted value (PDV) used by Dus, Maurer, and Mitchell (2005), which take account of both the time value of money and the probability of survival. The measure of the present discounted value of withdrawals was presented above. 26 In the case of the investment account, any remaining balance at the time of death is bequeathed to the heir. Similar to withdrawals, the PDV of bequest is calculated as: 25 Both Kotlikoff and Spivak (1981) and Brown and Poterba (2000) illustrate that married couples typically would value actuarially fair annuities less than would single individuals. 26 The PDV of withdrawal formula for annuities differs slightly from the formula for the investment account. As noted in above, the life expectancy tables in Arias (2006) end at age 100. For the investment account, it is assumed that any remaining balance at age 100 is bequeathed to heirs. For the annuity, the value of payments after age 100 for those that survive to age 100 is estimated as the conditional life expectancy at age 100 (in years) multiplied by the annual annuity payment. The value of payments after age 100 is included in the value of withdrawals and is assumed to be paid at age 100. Peter J. Brady December 18,
24 PDV Bequest = t = 100 = 67 B Pr( die) t t ( ) ( t r* ) t (7) where B t = bequest at age t (defined in equation (5) above); and Pr(die) t = probability individual who is alive at age 67 dies after age t-1 and before age t Upon death, annuity payments cease and there are no death benefits paid. Thus, the PDV of bequests in the case of an annuity is always equal to $0. To help quantify the risks involved in the various payout methods, Dus, Maurer, and Mitchell (2005) also develops a measure of shortfall relative to the amount of payment that would be received for an equivalent investment in an inflation-indexed, or real, annuity. The measure is: I A Shortfall t = 1 if W t < W t (8) = 0 otherwise where A W t = real annuity payment at age t To summarize the number of years that a shortfall would be expected for any individual, this study defines the shortfall count as: ShortfallCount = t = 100 t= 67 Shortfall Pr( alive) (10) t t To summarize the size of the shortfall when it does occur, Dus, Maurer, and Mitchell (2005) defines a measure of the PDV of the shortfall: PDV Shortfall = t = 100 t = 67 SF Pr( alive) t ( ) ( t r ) t (9) A I I A where SF t = W t W t if W t < W t = 0 otherwise Table 6 presents these measures for males, females, and married couples. For males, the PDV of withdrawals (or payments) from a real annuity purchased for $100,000 is $73,438, with the PDV of withdrawals slightly higher for females and slightly lower for married couples. Peter J. Brady December 18,
25 Payments cease upon death, so the PDV of bequests is $0. Annuities return less than a $1 in present value for every $1 invested primarily due to adverse selection: individuals who purchase annuities tend to live longer than the average person. To account for this fact, financial institutions use annuitant life tables, rather than population life tables, to price the annuities. The PDV measure uses life expectancy for the population as a whole; it represents the present value for the average person, not the present value for the average person who purchases an annuity. Total payments, inclusive of the PDV of bequest, are higher for the TIPS account. In fact, the PDV of total payments is exactly equal to $100, This is because the account earns a rate of return equal to the discount rate, and all assets are paid out as either a withdrawal or a bequest. Focusing solely on withdrawals, the PDV of withdrawals for a TIPS portfolio is 10 percent lower than a real annuity for males and 8 percent lower for females. The TIPS portfolio s PDV of shortfall conditional on a shortfall occurring is about $6,700 for men and about $5,700 for women. Mortality risk imposes a tradeoff: for the average person, a real annuity offers higher expected payments for the annuitant, but the TIPS portfolio offers higher total payments (inclusive of payments to heirs). Again, it can be seen that the tradeoffs are different for married couples. Not only is the PDV of total payments higher with a TIPS portfolio, but the PDV of withdrawals is higher as well. 28 Simply pooling mortality risk within a couple provides expected withdrawals that are 21 percent higher for the average couple than market-wide risk pooling in the presence of adverse 27 An actuarially fair annuity would also have a PDV of total payments of $100,000. The ratio of the PDV of payments and the cost of the annuity has been referred to as the moneys-worth ratio (Mitchell, et al, 1999), and the extent to which the ratio falls below 100 percent measures the difference between the price of an actuarially fair annuity and a market-rate annuity. It is of note that the literature has typically found a money s worth of about 85 cents on the dollar for nominal annuities. This paper finds a much lower money s worth for inflation-adjusted annuities than for nominal annuities. This is presumably due to either more serious adverse selection in the case of real annuities or the inability of the insurer to completely hedge inflation risk using the pool of available TIPS securities. 28 Both Kotlikoff and Spivak (1981) and Brown and Poterba (2000) illustrate that married couples face different incentives to annuitize than do single individuals. Peter J. Brady December 18,
26 selection. 29 There are still some risks, as it is expected that TIPS withdrawals will be less than annuity payments is 9.4 years. However, for married couples the TIPS portfolio s PDV of shortfall conditional on a shortfall occurring is only about $2,600. Invested in risky assets, the investment account earns, on average, much higher returns than TIPS. Per $100,000 invested, the expected PDV of total payments ranges from just under $130,000 for men to over $138,000 for married couples. In all cases the expected PDV of withdrawals exceed that of the real annuity. Withdrawals are expected to fall below that of a real annuity in 2.6 years for women, 2.0 years for men, and 0.2 years for married couples. Conditional on a shortfall occurring, the PDV of shortfall is under $1,000 for males and females, and under $100 for a married couple. Again these higher average returns entail more risk: in the lowest 10 percent of simulations, the PDV of total payments from a $100,000 investment is under $75,000 for males, females, and married couples Replacement Rates in Retirement: Combining Accumulation and Distribution This section combines the simulation results from the accumulation phase and the distribution phase as well as the calculation of Social Security benefits and taxes to compare net income streams in retirement for each of the simulated individuals and couples. Again, 5,000 simulations are run, with each simulation run from age 22 to age Net Income Streams For workers with HS-35K earnings, Figure 4 plots net retirement income conditional on survival for the baseline case and for the top, middle, and bottom deciles of simulations for the investment account. The shaded area represents an approximate 90 percent confidence area for possible results from the investment account. Results are plotted for single men, single women, 29 These calculations assume that spouses mortality risks are not correlated. Peter J. Brady December 18,
27 married couples with both members surviving, and for surviving spouses in the case where only one spouse is alive. For single males with HS-35K earnings, the average net income for the middle decile of investment account simulations is higher than the baseline case until age 91, when likelihood of survival is 16 percent, and higher for single females until age 96, when survival probability is 10 percent. Again, this higher median return comes with risk, as actual payments can be higher or lower. However, the overall risk is fairly low, as Social Security benefits provide a floor beneath which net income cannot fall. Average net income for the top decile of investment account simulations is 127 percent of the baseline case at age 67, rises to 156 percent at age 81, and does not fall below the baseline case until age 98. For women, the top decile of simulations shows a similar pattern of net income, although net income remains higher than the baseline case even at the end of the simulation. For men, average net income for the bottom decile of simulations is 96 percent of the baseline case at age 67, falling to 82 percent by age 100. For women, it is 95 percent of the baseline case at age 67 and falls to 85 percent at age 100. In the case of married couples with HS-35K earning where both spouses are surviving, the relative performance of the investment account and the baseline case are similar, but, because Social Security benefits make up an even larger proportion of retirement income, the total amount of risk associated with the investment account is much less. Average net income for the middle decile of investment account simulations is higher until age 93, when there is a 2 percent chance that both spouses are alive. As a percent of net income in the baseline case, the range of possible results from the investment account is much lower than is the case for single individuals, ranging as high as 117, but no lower than 95 percent. When a spouse dies, the surviving spouse has less net income than the couple. In the baseline case, net income for the surviving spouse is lower for two reasons. First, Social Security benefits are reduced by one-third for single-earner couples (from 150% of calculated Peter J. Brady December 18,
28 benefits of the working spouse to 100%), and reduced by one-half for dual earner couples (the surviving spouse continues to get his or her own benefit, but does not get the spouse s benefit). Second, payments from the annuity are cut in half because it is assumed that the annuity is a joint-and-50-percent-survivor annuity. In the case of the investment account, Social Security benefits are exactly the same as the baseline case, but payments from the investment account continue unchanged until both spouses die. In the case of married couples with HS-35K earnings where only one spouse is surviving, the investment account performs even better relative to the baseline case than it does for single individuals and married couples where both individuals are surviving. Median net income from the investment account is higher than the baseline case until age 98, when the chance of one spouse surviving is 8 percent. However, in contrast to other cases, the average net income of the lowest decile of simulations is higher than baseline case from age 67 to age 90, and never falls below 96 percent of the baseline case. Figure 5, Figure 6, and Figure 7 plot the same net income streams for Col-55K earners, Grad-75K earners, and Scaled-Grad 100K earners, respectively. As with HS-35k earners: (1) the average net income from the investment account for the middle decile of simulations is higher than the baseline case until retirees are in their mid-to-late 90s; (2) married couples with an investment account have less overall risk than single individuals because more of their income is from Social Security benefits; (3) the ratio of net income from the investment account to net income from the baseline case is higher for married couples with one surviving spouse than for all other cases. As lifetime earnings increase, the main difference in the investment account simulations relative to the baseline case is that, as a percent of net income, both the rewards and the risks of the investment account are increased. This is because, as lifetime earnings increase, Social Security benefits become a smaller portion of income and distributions from 401(k) accounts Peter J. Brady December 18,
29 become a larger portion of income. For a single male with Col-55K earnings, average net income for the middle decile of investment account simulations peaks at 118 percent of the baseline case net income and average net income for the top decile peaks at 176 percent of the baseline case. For a single male with Scaled Grad-100K earnings, the same ratios peak at 131 percent and 273 percent, respectively. The risk of shortfall also increases with earnings. Average net income for the bottom decile of investment account simulations falls to 77 percent at age 100 for a single male with Col-55K earnings, compared to 63 percent at age 100 for a single male with Scaled Grad-100K earnings. Again, married couples face lower risks as a percent of the baseline case net income. For example, even for the bottom decile of simulations the ratio of average net income from the investment account to net income from the baseline case never falls below 85 percent for the surviving spouse of a one-earner married couple, regardless of lifetime earnings Replacement Rate Measures As discussed in Section 3, the replacement rate measures average real net income in retirement as a percentage of average real net income prior to retirement (from age 30 to 66). The measure of average real net income in retirement takes into account survival probabilities, and thus places greater weight on income received in the early years of retirement. Specifically, the formula is: Average Retirement Net Income t = 100 ( B + S t t t = 67 = t = 100 t = 67 T t Pr( alive ) ) Pr( alive t ) t (10) where B = real Social Security benefit S = real income from accumulated savings T = real federal and state income taxes Peter J. Brady December 18,
30 For single renters and homeowners, Table 7 reports replacement rate measures for the baseline case and the investment account. The replacement rates for females are slightly lower than for males in all cases because females have longer live expectancy, decreasing both annuity payments and the rate at which assets are distributed from the investment account. The investment account produces higher expected replacement rates than the baseline case. For example, the expected replacement rate for single male renters with HS-35K earnings is 98 percent for the investment account, compared to 87 percent in the baseline case. However, the investment account involves risk and, for the bottom decile of simulations, the expected replacement rate for this individual is 81 percent. As illustrated above, higher earners are subject to more risk with the investment account. For the bottom decile of simulations, the expected replacement rate for a single male with Scaled Grad-100K earnings is 79 percent, relative to 86 percent in the baseline case. Table 8 reports replacement rates for married couples when both spouses survive. Because distributions from 401(k) plans are a smaller portion of their total retirement income, the investment account generates less variance in replacement rates for married couples. For example, even in the lowest decile of simulations, the investment account averages a replacement rate of 87 percent for dual-earner married renters with HS-35K earnings, compared to an 88 percent replacement rate in the baseline case. For dual-earner married renters with Scaled Grad-100K earnings, the lowest decile of investment account simulations averages a replacement rate of 91 percent, compared to 94 percent for the baseline case. Table 9 presents results for married couples when only one spouse survives. Relative to the baseline case, the investment account offers surviving spouses much higher average returns and less risk than for either single individuals or married couples when both survive. For survivors, even the worst ten percent of investment account simulations produces a higher average replacement than does the baseline case. Peter J. Brady December 18,
31 6.4 Discussion of Stochastic Simulation Results The stochastic simulations illustrate investment risk by showing a range of potential outcomes. The simulations should not be used to assess adequate retirement savings. The amount of savings deemed adequate ex ante should not vary with the type of investment chosen. The amount an individual decides to contribute to a 401(k) should be determined assuming that the investments will earn the risk-free rate of return and assuming that an annuity is purchased at retirement. The portfolio allocation of the 401(k) account is a separate decision and should be based on the individual s assessment as to whether or not the higher expected returns of a given investment compensate for any additional risk. Ex ante a dollar invested in corporate stocks or corporate bonds is worth the same as a dollar invested in TIPS. Thus, ex ante, asset allocation should not affect the rate of savings deemed to be adequate. Ex post a dollar invested in corporate stocks or corporate bonds could be worth more or less than a dollar invested in TIPS. The actual returns realized will cause individuals invested in risky assets to adjust future behavior. The higher expected rate of return on risky assets should not cause those invested in corporate equities or corporate bonds to plan on saving less than those investing in TIPS. The popular financial press often treats investment risk as the solution to an equation comparing savings and the amount resources needed in retirement. That is, it is often implied that an investor should first determine the rate of return needed, and then pick investments with that average return (and associated level of risk). For example: Richard needs average gains of 8% over 10-1/2 years on his Roth IRA, 401(k) and other investments to [finance his retirement goals]. [A financial planner] thinks he should be willing to take on more risk in hopes of boosting his returns. (Marantos, 2002) Peter J. Brady December 18,
32 This line of reasoning is incorrect. If there is a mismatch between saving rates and asset accumulation goals, either savings rates or goals need to be adjusted. The level of risk in a portfolio should not be affected by these calculations. Assessing the savings needs of a 401(k) plan participant is analogous to determining the present discounted value of future liabilities for a defined benefit pension plan. Traditional methods of pension accounting varied the discount rate for valuing future pension liabilities with the type of assets used to fund the pension. That is, if the pension fund was invested in equities, future liabilities would be discounted at the average return of equities; if it was invested in bonds, future liabilities would be discounted at the average return of bonds. Investment risk was not factored in. Financial economists objected to this method, arguing that all liabilities should be discounted at the risk-free rate of return, regardless of the asset allocation of the pension fund. Discounting future liabilities at differential rates based on asset allocation leads to the illogical conclusion that a dollar invested in stocks was worth more than a dollar invested in bonds. Similarly, an individual should not assume that investing in risky assets is a way to reduce the amount needed to save for retirement in a 401(k). However, just as a dollar invested in a risky asset should not be valued more than a dollar invested in a safe asset, neither should it be valued less. Ex ante, a voluntary rational decision to invest in risky assets cannot make an investor worse off than investing in the safe asset. 30 Willingly taking on risk implies that an investor prefers adjusting future consumption to account for actual realized returns to having the (certain) consumption path associated with the risk-free investment. Although not explicit, some recent studies seem to suggest that investors who choose riskier portfolios require more savings. For example, VanDerhei (2006) concludes that 30 If the individual does not have enough information to rationally choose, it would be appropriate for the state to provide the necessary information or to provide investor education. If the individual is incapable of making a rational decision, it would be appropriate for the state to make the decision for the individual. Peter J. Brady December 18,
33 investment in equities and a lack of annuitization can lead to higher required initial retirement wealth, or a higher necessary replacement rate. Ernst & Young (2008) illustrates that those without guaranteed lifetime income need to reduce their standard of living to insure that they have only a 5-percent probability of outliving their assets. These studies imply that, ex ante, a dollar invested in risky assets is worth less than a dollar invested in the risk-free asset. In addition to providing no additional insight regarding adequate savings rates, the stochastic simulation results cannot, by themselves, indicate whether an individual should invest in the riskless asset or should invest in risky assets. To make that determination requires information on the individuals preferences, including tolerance for risk and desire to leave bequests, and the individual s beliefs regarding life expectancy and future market returns. Nonetheless, the results suggest some insights into which individuals would be more or less likely to take on investment risk. First, perhaps counter-intuitively, the simulations in this paper suggest that workers with lower lifetime earnings would be the most inclined to invest in risky assets and the least likely to voluntarily purchase an annuity in retirement, all else equal. 31 This is because most of their wealth is in the form of an inflation-protected annuity (future Social Security benefits), making 401(k) assets a smaller portion of wealth and making any risks incurred in 401(k) investments smaller as a percentage of retirement income. Second, because of asymmetric information and adverse selection, annuities offered in the private insurance markets will not be actuarially fair for the average individual. This is illustrated by the fact that the PDV of payments produced by a dollar invested in an annuity is less than a dollar. Because annuities bought in the private market are not actuarially fair for the average individual, the cheapest way to increase annuity income in retirement is to delay 31 All else includes risk tolerance. For example, if risk tolerance increases with income or wealth, all else would not be equal. In this case, lower-income households would not necessarily be more likely to invest in risky assets. Peter J. Brady December 18,
34 claiming Social Security benefits. Social Security benefits can be claimed as early as age 62, but, if initial receipt of benefits is delayed, benefits are increased using actuarially fair adjustments until the individual attains age 70. If a portion of retirement assets are earmarked for the purchase of an annuity in the private marketplace, it would be better to use those assets to fund retirement consumption and delay claiming Social Security benefits until the assets were exhausted or age 70, whichever comes first. 32 Third, the simulation results also show that married couples face a different trade-off than single individuals when choosing to annuitize their wealth. Even if annuity prices are not actuarially fair for the average individual, individuals may prefer an annuity if they only value payments they receive and place no value on payments made to heirs. For single individuals, conditional on survival, the expected payout from a dollar invested in a real annuity is greater than the expected payout from a dollar invested in a portfolio of TIPS securities. However, for married couples, the ranking of expected payouts conditioned on survival are reversed. In addition, the investment account is relatively more attractive to the surviving spouse. As most individuals approaching retirement are married, 33 these facts may help explain the puzzle of few individuals choosing to annuitize their wealth at retirement. 34 The simulations illustrate both the higher average returns and the variance of those returns when investing in corporate equity and bonds. An important caveat is that the variance that is modeled is across time periods rather than across individuals. That is, the simulations do not illustrate that some individuals will experience better investment returns than others. The simulations assume all individuals are invested in the same investment portfolio; thus, there is no 32 An alternative option is discussed in Novack (2008). Under current law, an individual can claim Social Security benefits, but then repay the benefits, without interest, and restart benefits at a later age with the higher level of benefits. 33 For example, Brady and Pierce (forthcoming) find that, of taxpayers aged 55 to 70 who do not receive Social Security benefits, 72 percent are married. 34 As noted above, Both Kotlikoff and Spivak (1981) and Brown and Poterba (2000) illustrate that married couples face different incentives to annuitize than do married couples. Peter J. Brady December 18,
35 variance in returns across individuals. However, depending on the time period one invests over, the entire market would experience different rates of investment returns. Thus, all workers retiring in a given year would either have experienced historical returns that were above average, average, or below average. To the extent that individuals investing over the same time period experience different rates of return, it would represent an additional source of variation, and that source of variation is not modeled. 7. Conclusion Some analysts have concluded that, with typical contribution rates and without investments in risky assets, 401(k) plans cannot provide retirees with adequate resources. To assess these claims, this paper uses simulations to calculate the amount of retirement income that could be generated by 401(k) participants with different levels of earnings using realistic assumptions of participant behavior, and to illustrate the amount of income that can be generated from both riskless and risky investments. Annuities are priced using actual market prices rather than assuming that actuarially fair annuities exist. Investment returns on risky assets account for investment fees, rather than assuming that the market return is available without any transaction costs. The simulations incorporate Social Security benefits and the replacement rate measures used to assess adequacy account for taxes and savings and are calculated for both renters and homeowners. This study constructs representative earnings paths for individuals and married couples that roughly represent median earnings for workers with a high school degree, a bachelor s degree, and a graduate degree; and a fourth earnings path is created that is one-third higher than median graduate degree earnings. Depending on earnings, assumed total contributions rates to the 401(k) account, including employer contributions, range from 4 percent of earnings to 10 percent of earnings. Contributions to the account begin at age 32 to the highest earners and at Peter J. Brady December 18,
36 age 52 for the lowest earners. Income in retirement consists of Social Security benefits and income generated by the 401(k) plan account. In the baseline case, it is assumed that 401(k) participants invest in TIPS securities that provide a real yield of 2.4 percent and, at the time of retirement, use accumulated assets to purchase an annuity in the private market. For single individuals who rent, net income in retirement replaces about 85 to 90 percent of net pre-retirement income. Homeowners have higher replacement rates for net earnings because it is assumed that they pay off their mortgage prior to retirement and do not need to replace pre-retirement income used to pay mortgage principle and interest. For single individuals who are homeowners, net income in retirement replaces about 100 to 110 percent of net pre-retirement income. Because they get higher Social Security benefits controlling for total earnings, married couples achieve even higher replacement rates. For married renters, replacement rates range from about 90 to 100 percent, and for married homeowners, from about 100 to 115 percent. Thus, for most workers, moderate 401(k) contribution rates can lead to adequate income replacement rates in retirement, and this result does not rely on earning an investment premium on risky assets. Investment in risky assets increases the expected return of investments. For example, with baseline assumptions, a single female with earnings comparable to median earnings for workers with a bachelor s degree would replace 87 of pre-retirement net income in retirement. If she instead invested in risky assets, she would expect to increase her net income in retirement by nearly 20 percent. Associated with the higher average returns, these investments subject the participant to risks. However, because Social Security provides the bulk of most individual s retirement income and represents a floor beneath which retirement income cannot fall, the risk as a percentage of total retirement assets is not as large as would be suggested by examining the 401(k) plan distributions separately. For example, even if this individual experienced the investment returns of the bottom decile of simulations, her net income in retirement would be 95 Peter J. Brady December 18,
37 percent of the baseline case at age 67, not fall below 90 percent of the baseline case until age 92 (when the probability of survival would be 20 percent), and would be 85 percent at age 100 (when the probability of survival would be 3 percent). References Amromin, Gene and Paul Smith, What Explains Early Withdrawal from Retirement Accounts? Evidence from a Panel of Taxpayers, National Tax Journal, Vol. 56, No. 3, pp Arias, Elizabeth, United States Life Tables, 2003, National Vital Statistics Reports; Vol. 54, No.14. Hyattsville, MD: National Center for Health Statistics. Bershadker, Andrew and Paul A. Smith, "Cracking Open the Nest Egg: IRA Withdrawals and Retirement Finance," Proceedings: Ninety-Eighth Annual Conference on Taxation 2005, Washington DC: National Tax Association, September 2006, pp Brady, Peter J., Measuring retirement resource adequacy, Journal of Pension Economics and Finance, Published online by Cambridge University Press, September 2008 doi: /s Brady, Peter J., and Kevin K. Pierce, forthcoming. Using Panel Tax Data to Examine the Transition to Retirement, Proceedings: One-Hundred and First Annual Conference on Taxation 2008, Washington DC: National Tax Association, forthcoming. Brady, Peter, and Stephen Sigrist, Who Gets Retirement Plans and Why, ICI Perspective, Washington, DC: Investment Company Institute, Vol. 14, No Brown, Jeffrey R. and James M. Poterba. "Joint Life Annuities and Annuity Demand by Married Couples," Journal of Risk and Insurance, 2000, Vol. 67, No.4, pp Dus, Ivica, Raimond Maurer, and Olivia S. Mitchell, Betting on death and capital markets in retirement: a shortfall risk analysis of life annuities versus phased withdrawal plans, Financial Services Review, Vol. 14, pp Edelen, Roger, Investor Flows and the Assessed Performance of Open-End Mutual Funds, Journal of Financial Economics, Vol. 40, No.1, pp Ernst & Young, LLP, Retirement vulnerability of new retirees: The likelihood of outliving their assets, Washington, DC: Americans for a Secure Retirement, July, Ghilarducci, Teresa, When I m Sixty-Four: The Plot against Pensions and the Plan to Save Them, Princeton, NJ: Princeton University Press. Peter J. Brady December 18,
38 Ghilarducci, Teresa, Saving Retirement in the Face of America s Credit Crises: Short Term and Long Term Solutions, Oral Testimony, Committee on Education and Labor, October 7, TeresaGhilarducci.pdf Holden, Sarah, and Michael Hadley, The Economics of Providing 401(k) Plans: Services, Fees, and Expenses, ICI Fundamentals, Washington, DC: Investment Company Institute, Vol. 15, No Holden, Sarah, and Brian Reid, The Role of Individual Retirement Accounts in US Retirement Planning, in Recalibrating Retirement Spending and Saving, John Ameriks and Olivia S. Mitchell, eds., New York, NY: Oxford University Press. Hurst, Erik, Consumption in Retirement: Recent Developments, Pension Research Council Working Paper, No Ibbotson Associates, Stocks, Bonds, Bills, and Inflation 2005 Yearbook. Chicago, IL: Ibbotson Associates. Joint Committee on Taxation, General Explanation of the Tax Reform Act of 1986 (H.R. 3838, 99 th Congress; Public Law ). Washington, DC: U.S. Government Printing Office, May 4, Kotlikoff, Laurence J., and Avia Spivak, The Family as an Incomplete Annuities Market, Journal of Political Economy, Vol. 89, No. 2, pp Marantos, Jeanette, Lofty Retirement Goals Call for Some Risk, Los Angeles Times, p.c-3, January 14, Mitchell, Olivia S., James M. Poterba, Mark J. Warshawsky, and Jeffrey Brown "New Evidence on the Money's Worth of Individual Annuities," American Economic Review, American Economic Association, Vol. 89, No. 5, pp Munnell, Alicia H. and Annika Sundén, Coming up Short: The Challenge of 401(k) Plans. Washington, DC: Brookings Institution Press. Munnell, Alicia H. and Annika Sundén, (k) Plans Are Still Coming Up Short, Center for Retirement Research at Boston College Issue Brief, No. 43. National Association of Realtors, Metropolitan Area Existing-Home Prices and State Existing-Home Sales, 2 nd Quarter, Novack, Janet Trade In Your Social Security Check, Forbes.com, February 7, Available at: Profit Sharing/401(k) Council of America (PSCA), st Annual Survey of Profit Sharing and 401(k) Plans: Reflecting 2007 Plan Year Experience, Chicago, IL: Profit Sharing/401(k) Council of America. Peter J. Brady December 18,
39 Purcell, Patrick, Progressive Price Indexing of Social Security Benefits, Congressional Research Service, April 22, Sabelhaus, John, Michael Bogdan, and Sarah Holden. Defined Contribution Plan Distribution Choices at Retirement: A Survey of Employees Retiring Between 2002 and Washington, DC: Investment Company Institute, Fall Scholz, John Karl, and Anath Seshadri, Children and Household Wealth, University of Michigan Retirement Research Center Working Paper, No Snell, Ronald and Bert Waisanen, State Personal Income Taxes on Pensions and Retirement Income: Tax Year 2007, National Conference of State Legislatures, July Social Security Administration, OASDI Trustees Report. Tergesen, Anne, How to Fix 401(k)s, Wall Street Journal, December 13, 2008, p.r1. U.S. Government Accountability Office, Baby Boom Generation: Retirement of Baby Boomers is Unlikely to Precipitate Dramatic Decline in Market Returns, but Broader Risks Threaten Retirement Security, Report No. GAO U.S. Senate Committee on Finance, Report of the Committee on Finance, U.S. Senate, to Accompany H.R. 3838, S. Rep , Washington, DC: U.S. Government Printing Office, May 29, VanDerhei, Jack, Measuring Retirement Income Adequacy: Calculating Realistic Income Replacement Rates, EBRI Issue Brief, No. 297, Washington, DC: Employee Benefit Research institute, September Vanguard, How America Saves 2008: A Report on Vanguard 2007 Defined Contribution Plan Data, Valley Forge, PA: Vanguard, August 26, CRR_HowAmericaSaves08 Peter J. Brady December 18,
40 Table 1: Savings Behavior Assumptions by Earnings Path and Marital Status Single Married Earnings Path Age start savings Savings as percent of earnings Age start savings Savings as percent of earnings HS-35K 42 6% (6% employee; 0% employer) 52 4% (4% employee; 0% employer) Col-55K 42 9% (6% employee; 3% employer) Grad-75K 32 9% (5% employee; 4% employer) Scaled Grad-100K Source: Author s assumptions 32 10% (5% employee; 5% employer) 47 6% (4% employee; 2% employer) 37 9% (5% employee; 4% employer) 37 10% (5% employee; 5% employer) Table 2: 401(k) Asset Accumulation and Annuity Income in Baseline Simulation: Certain Investment Returns 1 Earnings Path Scaled Grad- 100K Marital Status HS-35K Col-55K Grad-75K 401(k) Balance at Retirement (2006$) Single $77,709 $188,867 $377,704 $559,562 Married 28,245 96, , ,417 Real Annuity (2006 $) Single Male $4,587 $11,149 $22,297 $33,032 Single Female 4,263 10,362 20,722 30,699 Married 1,455 4,953 16,146 23,919 Source: Author s calculations 1 Assumes savings are invested in inflation-indexed bond earning 2.4% real; inflation rates taken from history and Social Security Administration s Intermediate Projection. At retirement, real annuity purchased, with pricing for annuity taken from Vanguard s annuity website on October 31, Assumes single individuals by single life annuity and married individuals buy Joint and 50% Survivor annuity. Peter J. Brady December 18,
41 Table 3: Results From Baseline Simulation: Certain Investment Returns Earnings Path Scaled Grad-100K HS-35K Col-55K Grad-75K WORKING Average Real Pre-Tax Earnings (over age 30, 2006$) All Cases $36,219 $58,306 $77,156 $102,874 Average Real Earnings After Tax and Savings (2006$) Single $26,850 $40,227 $51,005 $65,646 Married 1-Earner 29,434 44,688 56,644 72,250 Married 50/50 Earners 29,643 44,953 56,909 72,446 Average Real Earnings After Tax, Savings, and Mortgage (2006$) Single $22,522 $33,080 $42,693 $55,439 Married 1-Earner 24,897 36,399 46,845 60,590 Married 50/50 Earners 25,106 36,644 47,084 60,737 RETIREMENT Annual Social Security Benefit (2006 $) Single $18,814 $26,124 $29,250 $33,315 Married 1-Earner 28,221 39,187 43,875 49,973 Married 50/50 earners 24,754 32,547 39,214 48,342 Average Real Benefit plus Annuity (2006$) Single Male $23,401 $37,274 $51,546 $66,347 Single Female 23,077 36,486 49,972 64,015 Married 1-Earner 29,676 44,139 60,020 73,892 Married 50/50 Earners 26,209 37,500 55,359 72,261 Average Real Benefit plus Annuity After Tax (2006$) Single Male $23,392 $35,680 $46,096 $56,150 Single Female 23,071 35,068 45,206 54,517 Married 1-Earner 29,676 44,139 58,064 69,390 Married 50/50 Earners 26,209 37,500 53,683 67,863 REPLACEMENT RATE Renters Single Male 87% 89% 90% 86% Single Female Married 1-Earner Married 50/50 Earners Homeowners Single Male 104% 108% 108% 101% Single Female Married 1-Earner Married 50/50 Earners Source: Author s calculation 1 Assumes savings are invested in inflation-indexed bond earning 2.4% real; inflation rates taken from history and Social Security Administration s Intermediate projection. At retirement, real annuity purchased, with pricing for annuity taken from Vanguard s annuity website on October 31, 2006 Peter J. Brady December 18,
42 Table 4: Sensitivity of Baseline Simulation Results to Changes in Assumptions 1 Replacement Rate by Earnings Path and Difference from Baseline Simulation Renters Home Owners HS-35K Col-55K Grad-75K Scaled Grad HS-35K Col-55K Grad-75K Scaled Grad Rate Diff Rate Diff Rate Diff Rate Diff Rate Diff Rate Diff Rate Diff Rate Diff Retire at Age 65 Single Male 75% -12% 77% -11% 80% -10% 76% -10% 90% -14% 95% -13% 97% -11% 91% -10% Single Female Married Single-Earner Married Dual-Earners Real Rate of Return 2.0% and Annuity Rate Reduced 10% Single Male Single Female Married Single-Earner Married Dual-Earners Real Rate of Return 2.8% and Annuity Rate Increased 10% Single Male Single Female Married Single-Earner Married Dual-Earners Progressive Indexation of Social Security Benefits (Beginning in 2012) Single Male Single Female Married Single-Earner Married Dual-Earners % Across-the-Board Cut in Social Security Benefits Single Male Single Female Married Single-Earner Married Dual-Earners Source: Author s calculation 1 Other than changed assumptions, all other assumptions as in baseline simulation. Peter J. Brady December 18,
43 Table 5: Accumulation Results from Stochastic Simulations SINGLE MARRIED Earnings Path Earnings Path HS-35K Col-55K Scaled Grad-75K Grad-100K HS-35K Col-55K Scaled Grad-75K Grad-100K Balance at the end of 2032 (2006$) Investment Account 1 Expected Value $113,679 $276,301 $653,018 $967,434 $ 35,060 $129,342 $499,425 $739,889 By Decile Top 216, ,857 1,394,984 2,066,643 56, ,518 1,013,163 1,500,983 Middle 104, , , ,993 33, , , ,633 Bottom 54, , , ,462 20,521 68, , ,775 Baseline Case 2 77, , , ,562 28,245 96, , ,417 Difference between Investment Account 1 and Baseline Case 2 (percent) Investment Account 1 Expected Value 46.3% 46.3% 72.9% 72.9% 24.1% 34.5% 59.3% 59.3% By Decile Top Middle Bottom Percent of Simulations where Baseline Case 2 Accumulates More Assets Than Investment Account 1 Percent of Simulations 21.5% 21.5% 17.6% 17.6% 27.6% 24.4% 19.2% 19.2% Source: Author s calculation 1 Assumes savings are invested in portfolio that is 50-percent stocks and 50-percent bonds. Five-thousand stochastic simulations are run assuming real returns after investment expenses are drawn from a distribution of returns with mean and standard deviation equal to historical experience (5.2% mean, 12.8% standard deviation); inflation rates taken from history and Social Security Administration s Intermediate projection. 2 Assumes savings are invested in inflation-indexed bond earning 2.4% real; inflation rates taken from history and Social Security Administration s Intermediate projection. Peter J. Brady December 18,
44 Table 6: Comparison of Present Discounted Value 1 of Annuity, TIPS Portfolio, and Investment Account ($100,000 investment at age 66; payout age 67 to 100) PDV of Withdrawal PDV of Bequest PDV of Total Payments Years of Shortfall Weighted by Probability Alive PDV of Shortfall Conditional on Shortfall Option Male Real Immediate Life Annuity 2 $73,438 $0 $73, $0 TIPS Portfolio 3 66,658 33, , ,719 Investment Account 3,4 Expected Value 84,424 45, , Top Decile 137,168 79, , Middle Decile 80,854 42, , ,367 Bottom Decile 50,129 24,212 74, ,248 Female Real Immediate Life Annuity 2 $76,112 $0 $76, $0 TIPS Portfolio 3 70,214 29, , ,700 Investment Account 3,4 Expected Value 92,645 42, , Top Decile 157,577 80, , Middle Decile 87,941 40, , ,045 Bottom Decile 52,165 21,294 73, ,746 Married Couple Real Immediate Life Annuity 2 $69,079 $0 $69, $0 TIPS Portfolio 3 83,614 16, , ,551 Investment Account 3,4 Expected Value 111,404 26, , Top Decile 192,057 55, , Middle Decile 105,483 24, , Bottom Decile 61,587 11,164 72, ,867 Source: Author's calculation 1 PDV at time of purchase. Takes into account both probability alive and time cost of money, using nominal interest rate of 5.2%: 2.8% inflation plus 2.4% real. 2 Pays amount that increases with inflation until death. For married individuals, pays ½ the total payment if one spouse dies. There are no payments upon death. Pricing for annuity taken from Vanguard s annuity website on October 31, Life expectancy in 2033 at age 67 expected to equal life expectancy in 2006 at age 65; inflation rates taken from Social Security Administration s Intermediate Projection. 3 Assumes investment account that annually pays out 1/E[T] of the account balance, where E[T] is life expectancy conditional on age; upon death, account balance is left to heirs. Life expectancy in 2033 at age 67 expected to equal life expectancy in 2006 at age Account invested in portfolio that is 50-percent stocks and 50-percent bonds. Five-thousand stochastic simulation are run assuming real returns after investment expenses are drawn from a distribution of returns with mean and standard deviation equal to historical experience (5.2% mean, 12.8% standard deviation); inflation rates taken from Social Security Administration s Intermediate Projection. Peter J. Brady December 18,
45 Table 7: Replacement Rates for Single Individuals from Baseline Case 1 and Stochastic Simulations 2 Earnings Path Scaled Grad-100K HS-35K Col-55K Grad-75K Single Male Renters Baseline Case 1 87% 89% 90% 86% Investment Account 2 Expected Value Top Decile Middle Decile Bottom Decile Single Male Homeowners Baseline Case 1 104% 108% 108% 101% Investment Account 2 Expected Value Top Decile Middle Decile Bottom Decile Percent of Simulations where PDV Withdrawals Greater for Investment Account Percent of Simulations 79% 79% 83% 83% Single Female Renters Baseline Case 1 86% 87% 89% 83% Investment Account 2 Expected Value Top Decile Middle Decile Bottom Decile Single Female Homeowners Baseline Case 1 102% 106% 106% 98% Investment Account 2 Expected Value Top Decile Middle Decile Bottom Decile Percent of Simulations where PDV Withdrawals Greater for Investment Account Percent of Simulations 79% 79% 83% 83% 1 Pays amount that increases with inflation until death. There are no payments upon death. Pricing for annuity taken from Vanguard s annuity website on October 31, Life expectancy in 2033 at age 67 expected to equal life expectancy in 2006 at age 65; inflation rates taken from Social Security Administration s Intermediate Projection. 2 Assumes investment account that annually pays out 1/E[T] of the account balance, where E[T] is life expectancy conditional on age; upon death, account balance is left to heirs. Life expectancy in 2033 at age 67 expected to equal life expectancy in 2006 at age 65. Account invested in portfolio that is 50-percent stocks and 50-percent bonds. Five-thousand stochastic simulation are run assuming real returns after investment expenses are drawn from a distribution of returns with mean and standard deviation equal to historical experience (5.2% mean, 12.8% standard deviation); inflation rates taken from Social Security Administration s Intermediate Projection. Peter J. Brady December 18,
46 Table 8: Replacement Rates for Married Couples from Baseline Case 1 and Stochastic Simulations 2 Earnings Path Scaled Grad- 100K HS-35K Col-55K Grad-75K Single-Earner Married Couple Renters Baseline Case 1 101% 99% 103% 96% Investment Account 2 Expected Value Top Decile Middle Decile Bottom Decile Single-Earner Married Couple Homeowners Baseline Case 1 119% 121% 124% 115% Investment Account 2 Expected Value Top Decile Middle Decile Bottom Decile Dual-Earner Married Couple Renters Baseline Case 1 88% 83% 94% 94% Investment Account 2 Expected Value Top Decile Middle Decile Bottom Decile Dual-Earner Married Homeowners Baseline Case 1 104% 102% 114% 112% Investment Account 2 Expected Value Top Decile Middle Decile Bottom Decile Percent of Simulations where PDV Withdrawals Greater for Investment Account Percent of Simulations 84% 85% 87% 87% 1 Pays amount that increases with inflation until death. Pays ½ the total payment if one spouse dies. There are no payments upon death. Pricing for annuity taken from Vanguard s annuity website on October 31, Life expectancy in 2033 at age 67 expected to equal life expectancy in 2006 at age 65; inflation rates taken from Social Security Administration s Intermediate Projection. 2 Assumes investment account that annually pays out 1/E[T] of the account balance, where E[T] is the average life expectancy for men and women conditional on age. Payments continue until both spouses die; upon death of both spouses, account balance is left to heirs. Life expectancy in 2033 at age 67 expected to equal life expectancy in 2006 at age 65. Account invested in portfolio that is 50-percent stocks and 50-percent bonds. Five-thousand stochastic simulation are run assuming real returns after investment expenses are drawn from a distribution of returns with mean and standard deviation equal to historical experience (5.2% mean, 12.8% standard deviation); inflation rates taken from Social Security Administration s Intermediate Projection. Peter J. Brady December 18,
47 Table 9: Replacement Rates for Married Survivors from Baseline Case 1 and Stochastic Simulations 2 Earnings Path Scaled Grad- 100K HS-35K Col-55K Grad-75K Single-Earner Married Survivor Renters Baseline Case 1 66% 64% 64% 59% Investment Account 2 Expected Value Top Decile Middle Decile Bottom Decile Single-Earner Married Survivor Homeowners Baseline Case 1 78% 79% 77% 71% Investment Account 2 Expected Value Top Decile Middle Decile Bottom Decile Dual-Earner Married Survivor Renters Baseline Case 1 44% 42% 48% 47% Investment Account 2 Expected Value Top Decile Middle Decile Bottom Decile Dual-Earner Married Survivor Homeowners Baseline Case 1 52% 51% 57% 56% Investment Account 2 Expected Value Top Decile Middle Decile Bottom Decile Percent of Simulations where PDV Withdrawals Greater for Investment Account Percent of Simulations 98% 98% 98% 98% 1 Pays amount that increases with inflation until death. Pays ½ the total payment if one spouse dies. There are no payments upon death. Pricing for annuity taken from Vanguard s annuity website on October 31, Life expectancy in 2033 at age 67 expected to equal life expectancy in 2006 at age 65; inflation rates taken from Social Security Administration s Intermediate Projection. 2 Assumes investment account that annually pays out 1/E[T] of the account balance, where E[T] is the average life expectancy for men and women conditional on age. Payments continue until both spouses die; upon death of both spouses, account balance is left to heirs. Life expectancy in 2033 at age 67 expected to equal life expectancy in 2006 at age 65. Account invested in portfolio that is 50-percent stocks and 50-percent bonds. Five-thousand stochastic simulation are run assuming real returns after investment expenses are drawn from a distribution of returns with mean and standard deviation equal to historical experience (5.2% mean, 12.8% standard deviation); inflation rates taken from Social Security Administration s Intermediate Projection. Peter J. Brady December 18,
48 Figure 1: Representative Earnings Paths 120 Earnings (Thousan nds, 2006$) Scaled Grad-100K Grad-75K Col-55K HS-35K Source: Constructed by author Age
49 Figure 2: Real Annuity Payouts Compared to TIPS Portfolio Payouts (annual payment/withdrawal, conditional on survival, $100,000 investment) Single Males Single Females Real Annuity Real Annuity*Prob Alive TIPS Portfolio Probability Alive Real Annuity Real Annuity*Prob Alive TIPS Portfolio Probability Alive Distribution (thousands, 2006 $) Probability (percent) Distribution (thousands, 2006 $) Probability (percent) Age Age 0 Married Couples -- Joint Real Joint Annuity Real Annuity*Prob Alive TIPS Portfolio Probability Both Alive Married Couples -- Survivor Real Survivor Annuity Real Annuity*Prob Alive TIPS Portfolio Probability One Alive Distribution (thousands, 2006 $) Probability (percent) Distribution (thousands, 2006 $) Probability (percent) Age Age 0
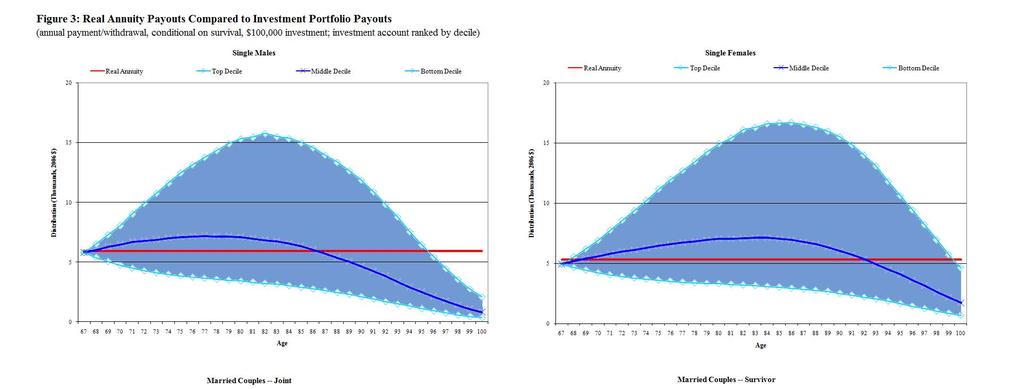
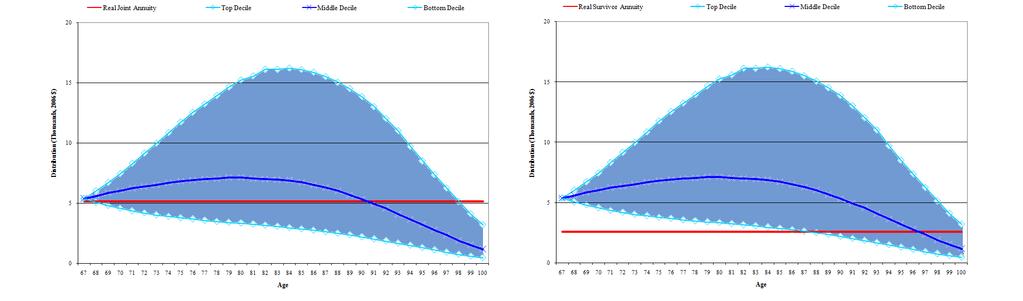
50
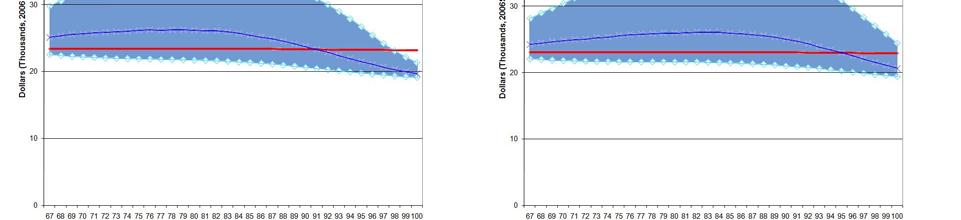
51
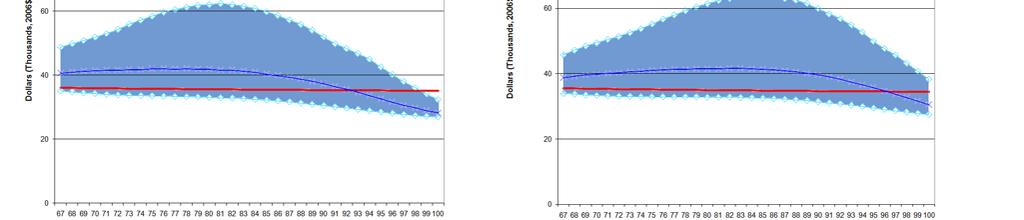
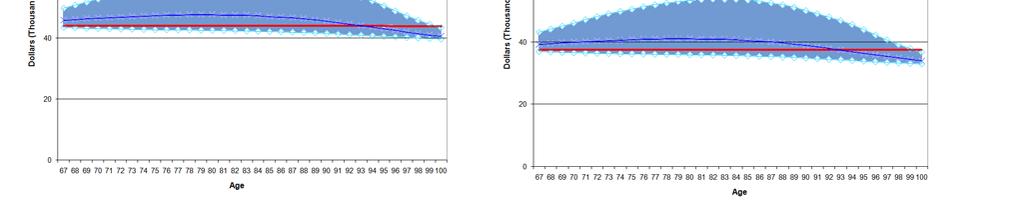
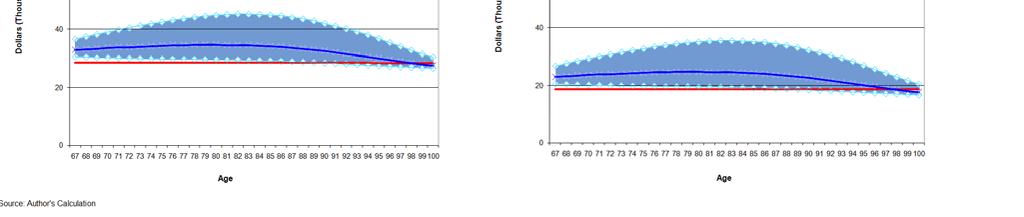
52
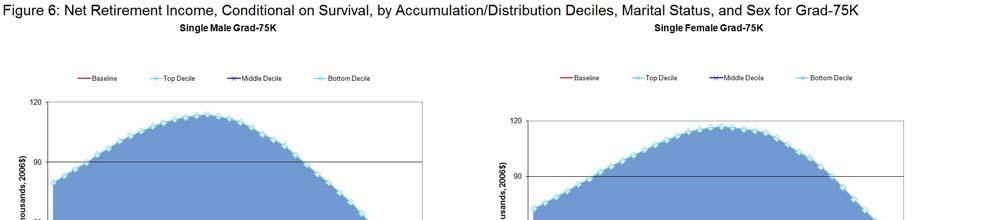
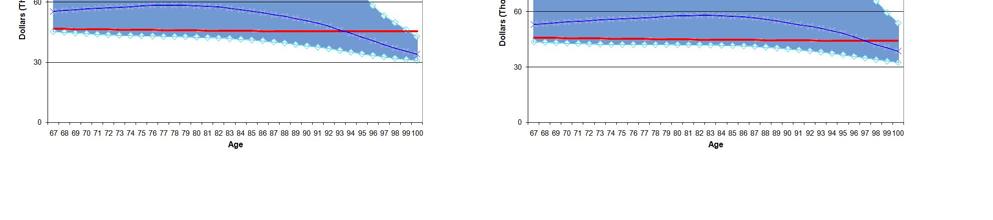
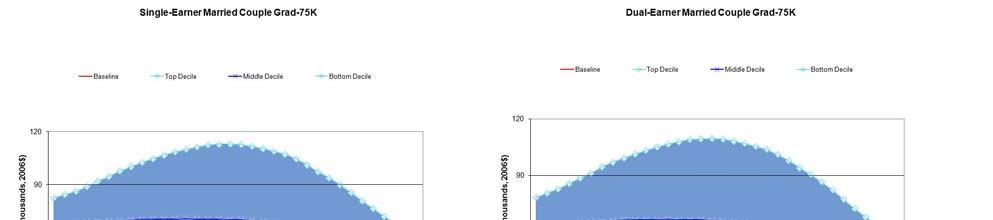
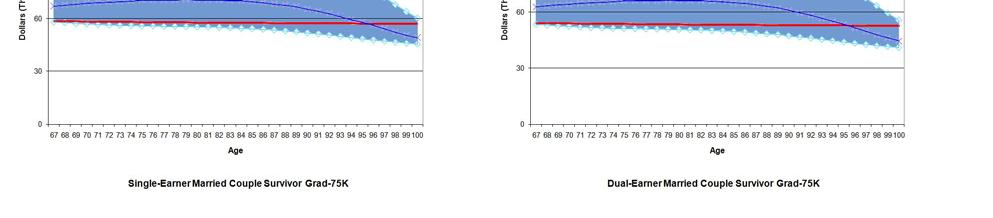
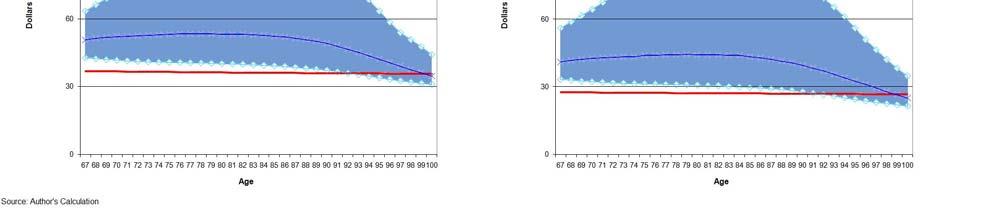
53
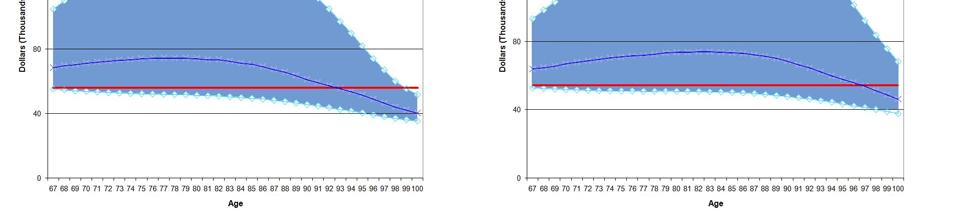
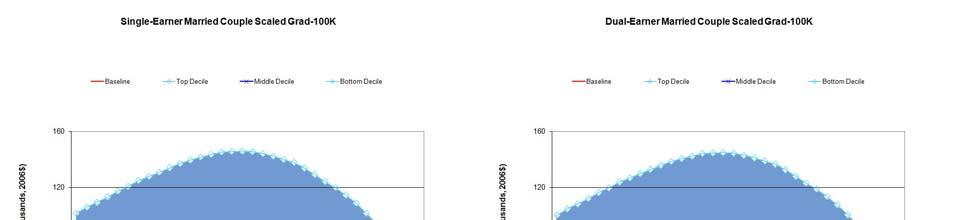
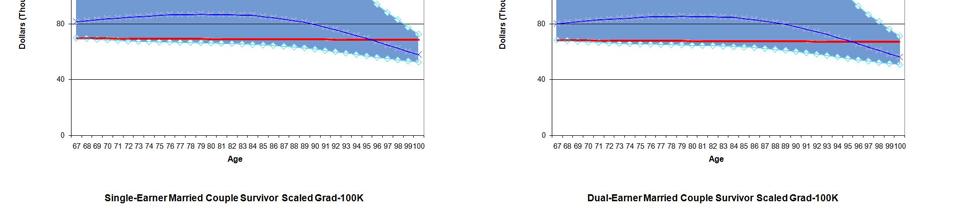
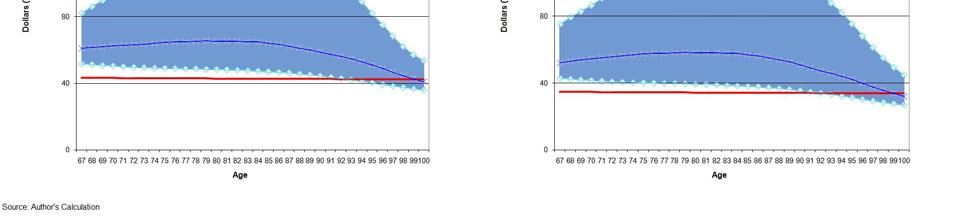
54
ICI RESEARCH PERSPECTIVE
 ICI RESEARCH PERSPECTIVE 1401 H STREET, NW, SUITE 1200 WASHINGTON, DC 20005 202-326-5800 WWW.ICI.ORG JULY 2017 VOL. 23, NO. 5 WHAT S INSIDE 2 Introduction 4 Which Workers Would Be Expected to Participate
How Economic Security Changes during Retirement
 How Economic Security Changes during Retirement Barbara A. Butrica March 2007 The Retirement Project Discussion Paper 07-02 How Economic Security Changes during Retirement Barbara A. Butrica March 2007
Retirement Savings: How Much Will Workers Have When They Retire?
 Order Code RL33845 Retirement Savings: How Much Will Workers Have When They Retire? January 29, 2007 Patrick Purcell Specialist in Social Legislation Domestic Social Policy Division Debra B. Whitman Specialist
Low Returns and Optimal Retirement Savings
 Low Returns and Optimal Retirement Savings David Blanchett, Michael Finke, and Wade Pfau September 2017 PRC WP2017 Pension Research Council Working Paper Pension Research Council The Wharton School, University
Social Security: Is a Key Foundation of Economic Security Working for Women?
 Committee on Finance United States Senate Hearing on Social Security: Is a Key Foundation of Economic Security Working for Women? Statement of Janet Barr, MAAA, ASA, EA on behalf of the American Academy
Redistribution under OASDI: How Much and to Whom?
 9 Redistribution under OASDI: How Much and to Whom? Lee Cohen, Eugene Steuerle, and Adam Carasso T his chapter presents the results from a study of redistribution in the Social Security program under current
Evaluating Lump Sum Incentives for Delayed Social Security Claiming*
 Evaluating Lump Sum Incentives for Delayed Social Security Claiming* Olivia S. Mitchell and Raimond Maurer October 2017 PRC WP2017 Pension Research Council Working Paper Pension Research Council The Wharton
All findings, interpretations, and conclusions of this presentation represent the views of the author(s) and not those of the Wharton School or the
 and not those of the Wharton School or the") All findings, interpretations, and conclusions of this presentation represent the views of the author(s) and not those of the Wharton School or the Pension Research Council. 2009 Pension Research Council
All findings, interpretations, and conclusions of this presentation represent the views of the author(s) and not those of the Wharton School or the Pension Research Council. 2009 Pension Research Council
Using Fixed SPIAs and Investments to Create an Inflation-Adjusted Income Stream
 Using Fixed SPIAs and Investments to Create an Inflation-Adjusted Income Stream April 5, 2016 by Luke F. Delorme Advisor Perspectives welcomes guest contributions. The views presented here do not necessarily
Retirement Savings and Household Wealth in 2007
 Retirement Savings and Household Wealth in 2007 Patrick Purcell Specialist in Income Security April 8, 2009 Congressional Research Service CRS Report for Congress Prepared for Members and Committees of
How to Rescue an Underfunded Retirement
 How to Rescue an Underfunded Retirement February 19, 2018 by Joe Tomlinson Americans have under-saved and will need more than withdrawals from savings to survive retirement. An optimal withdrawal strategy
Why Advisors Should Use Deferred-Income Annuities
 Why Advisors Should Use Deferred-Income Annuities November 24, 2015 by Michael Finke Retirement income planning is a mathematical problem in which an investor begins with a lump sum of wealth and withdraws
Retirement. Optimal Asset Allocation in Retirement: A Downside Risk Perspective. JUne W. Van Harlow, Ph.D., CFA Director of Research ABSTRACT
 Putnam Institute JUne 2011 Optimal Asset Allocation in : A Downside Perspective W. Van Harlow, Ph.D., CFA Director of Research ABSTRACT Once an individual has retired, asset allocation becomes a critical
The Value of Social Security Disability Insurance
 #2001-09 June 2001 The Value of Social Security Disability Insurance by Martin R. Holmer Policy Simulation Group John R. Gist and Alison M. Shelton Project Managers The Public Policy Institute, formed
Social Security and Medicare Lifetime Benefits and Taxes
 E X E C U T I V E O F F I C E R E S E A R C H Social Security and Lifetime Benefits and Taxes 2018 Update C. Eugene Steuerle and Caleb Quakenbush October 2018 Since 2003, we and our colleagues have released
Distributional Impact of Social Security Reforms: Summary
 Distributional Impact of Social Security Reforms: Summary by Barry Bosworth Gary Burtless and Claudia Sahm THE BROOKINGS INSTITUTION 1775 Massachusetts Ave. N.W. Washington, DC 20036 August 22, 2000 Prepared
Social Security and Medicare Lifetime Benefits and Taxes
 EXECUTIVE OFFICE RESEARCH Social Security and Lifetime Benefits and Taxes 2017 Update C. Eugene Steuerle and Caleb Quakenbush June 2018 Since 2003, we and our colleagues have been releasing periodic data
Fast Facts & Figures About Social Security, 2005
 Fast Facts & Figures About Social Security, 2005 Social Security Administration Office of Policy Office of Research, Evaluation, and Statistics 500 E Street, SW, 8th Floor Washington, DC 20254 SSA Publication
Economic Preparation for Retirement and the Risk of Out-of-pocket Long-term Care Expenses
 Economic Preparation for Retirement and the Risk of Out-of-pocket Long-term Care Expenses Michael D Hurd With Susann Rohwedder and Peter Hudomiet We gratefully acknowledge research support from the Social
MetLife Retirement Income. A Survey of Pre-Retiree Knowledge of Financial Retirement Issues
 MetLife Retirement Income IQ Study A Survey of Pre-Retiree Knowledge of Financial Retirement Issues June, 2008 The MetLife Mature Market Institute Established in 1997, the Mature Market Institute (MMI)
The Role of Tax Incentives in Retirement Preparation
 The Role of Tax Incentives in Retirement Preparation March 27, 2014 Lynn Dudley American Benefits Council Retirement Plan Tax Incentives Basics What are the tax incentives for retirement savings in employer-sponsored
Annuities in Retirement Income Planning
 For much of the recent past, individuals entering retirement could look to a number of potential sources for the steady income needed to maintain a decent standard of living: Defined benefit (DB) employer
Retirement Plans and Prospects for Retirement Income Adequacy
 Retirement Plans and Prospects for Retirement Income Adequacy Jack VanDerhei September 2014 PRC WP2014-06 Pension Research Council The Wharton School, University of Pennsylvania 3620 Locust Walk, 3000
NBER WORKING PAPER SERIES THE GROWTH IN SOCIAL SECURITY BENEFITS AMONG THE RETIREMENT AGE POPULATION FROM INCREASES IN THE CAP ON COVERED EARNINGS
 NBER WORKING PAPER SERIES THE GROWTH IN SOCIAL SECURITY BENEFITS AMONG THE RETIREMENT AGE POPULATION FROM INCREASES IN THE CAP ON COVERED EARNINGS Alan L. Gustman Thomas Steinmeier Nahid Tabatabai Working
Opting Out: The Galveston Plan and Social Security
 Opting Out: The Galveston Plan and Social Security Theresa M. Wilson PRC WP 99-22 1999 Pension Research Council 3641 Locust Walk, 304 CPC Wharton School, University of Pennsylvania Philadelphia, PA 19104-6218
HOW EARNINGS AND FINANCIAL RISK AFFECT PRIVATE ACCOUNTS IN SOCIAL SECURITY REFORM PROPOSALS
 HOW EARNINGS AND FINANCIAL RISK AFFECT PRIVATE ACCOUNTS IN SOCIAL SECURITY REFORM PROPOSALS Background The American public widely believes that the Social Security program faces a long-term financing problem
INADEQUATE RETIREMENT SAVINGS FOR WORKERS NEARING RETIREMENT
 SEPT 17 1 INADEQUATE RETIREMENT SAVINGS FOR WORKERS NEARING RETIREMENT by Teresa Ghilarducci, Bernard L. and Irene Schwartz Professor of Economics at The New School for Social Research and Director of
JOURNEY. Planning for Financial Security SAVING : INVESTING : PLANNING
 JOURNEY Planning for Financial Security SAVING : INVESTING : PLANNING Agenda 1 Cash management 2 Investment planning 3 Tax planning 4 Risk management 5 Retirement planning 6 Estate planning SAVING : INVESTING
Retirement vulnerability of new retirees:
 Retirement vulnerability of new retirees: The likelihood of outliving their assets by Ernst & Young LLP for Americans for Secure Retirement July 2008 Executive summary Many of the 77 million baby boomers
SOCIAL SECURITY. Office of the Chief Actuary. June 9, 2016
 Office of the Chief Actuary June 9, 2016 Mr. Kent Conrad, Co-Chair Mr. James B. Lockhart, III, Co-Chair Commission on Retirement Security and Personal Savings Bipartisan Policy Center 1225 Eye Street NW,
HOW MUCH TO SAVE FOR A SECURE
 November 2011, Number 11-13 RETIREMENT RESEARCH HOW MUCH TO SAVE FOR A SECURE RETIREMENT By Alicia H. Munnell, Francesca Golub-Sass, and Anthony Webb* Introduction One of the major challenges facing Americans
Actuary s Certification Letter (Pension Trust Fund)
") Actuarial Actuary s Certification Letter (Pension Trust Fund) May 19, 2017 Board of Trustees Texas Municipal Retirement System ( TMRS or the System ) Austin, Texas Dear Trustees: In accordance with the
Actuarial Actuary s Certification Letter (Pension Trust Fund) May 19, 2017 Board of Trustees Texas Municipal Retirement System ( TMRS or the System ) Austin, Texas Dear Trustees: In accordance with the
CRS Report for Congress Received through the CRS Web
 Order Code RL33387 CRS Report for Congress Received through the CRS Web Topics in Aging: Income of Americans Age 65 and Older, 1969 to 2004 April 21, 2006 Patrick Purcell Specialist in Social Legislation
2005 Survey of Owners of Non-Qualified Annuity Contracts
 2005 Survey of Owners of Non-Qualified Annuity Contracts Conducted by The Gallup Organization and Mathew Greenwald & Associates for The Committee of Annuity Insurers 2 2005 SURVEY OF OWNERS OF NON-QUALIFIED
Sustainable Spending for Retirement
 What s Different About Retirement? RETIREMENT BEGINS WITH A PLAN TM Sustainable Spending for Retirement Presented by: Wade Pfau, Ph.D., CFA Reduced earnings capacity Visible spending constraint Heightened
Social Security Reform: How Benefits Compare March 2, 2005 National Press Club
 Social Security Reform: How Benefits Compare March 2, 2005 National Press Club Employee Benefit Research Institute Dallas Salisbury, CEO Craig Copeland, senior research associate Jack VanDerhei, Temple
MISSOURI STATE EMPLOYEES RETIREMENT SYSTEM
 MISSOURI STATE EMPLOYEES RETIREMENT SYSTEM 4-YEAR EXPERIENCE STUDY JULY 1, 2003 THROUGH JUNE 30, 2007 ACTUARIAL INVESTIGATION REPORT 2003-2007 TABLE OF CONTENTS Item Overview and Economic Assumptions Summary
Jim Kessler and David Brown
 A Third Way Report by Jim Kessler and David Brown SOCIAL SECURITY JULY 2013 Is Social Security Regressive? By Jim Kessler and David Brown Marcia is doing well. Beginning with restaurant work to get through
Coping with Sequence Risk: How Variable Withdrawal and Annuitization Improve Retirement Outcomes
 Coping with Sequence Risk: How Variable Withdrawal and Annuitization Improve Retirement Outcomes September 25, 2017 by Joe Tomlinson Both the level and the sequence of investment returns will have a big
The Shrinking Tax Preference for Pension Savings: An Analysis of Income Tax Changes,
 March 29, 2010 The Shrinking Tax Preference for Pension Savings: An Analysis of Income Tax Changes, 1985-2007 by Gary Burtless THE BROOKINGS INSTITUTION Washington, DC and Eric Toder URBAN INSTITUTE Washington,
Research fundamentals
 Research fundamentals 1401 H Street, NW, Suite 1200 Washington, DC 20005 202/326-5800 www.ici.org January 2008 Vol. 17, No. 1 The Role of IRAs in U.S. Households Saving for Retirement Key Findings Four
What is the status of Social Security? When should you draw benefits? How a Job Impacts Benefits... 8
 TABLE OF CONTENTS Executive Summary... 2 What is the status of Social Security?... 3 When should you draw benefits?... 4 How do spousal benefits work? Plan for Surviving Spouse... 5 File and Suspend...
Optimal Withdrawal Strategy for Retirement Income Portfolios
 Optimal Withdrawal Strategy for Retirement Income Portfolios David Blanchett, CFA Head of Retirement Research Maciej Kowara, Ph.D., CFA Senior Research Consultant Peng Chen, Ph.D., CFA President September
How Much Should Americans Be Saving for Retirement?
 How Much Should Americans Be Saving for Retirement? by B. Douglas Bernheim Stanford University The National Bureau of Economic Research Lorenzo Forni The Bank of Italy Jagadeesh Gokhale The Federal Reserve
US Household Ownership of Mutual Funds in Most Mutual Fund Owners Are Educated and in Their Prime Earning Years
 ICI RESEARCH PERSPECTIVE 1401 H STREET, NW, SUITE 1200 WASHINGTON, DC 20005 202-326-5800 WWW.ICI.ORG OCTOBER 2016 VOL. 22, NO. 7 WHAT S INSIDE 2 US Household Ownership of Mutual Funds in 2016 2 Most Mutual
The Economic Consequences of a Husband s Death: Evidence from the HRS and AHEAD
 The Economic Consequences of a Husband s Death: Evidence from the HRS and AHEAD David Weir Robert Willis Purvi Sevak University of Michigan Prepared for presentation at the Second Annual Joint Conference
Establishing Your Retirement Income Stream
 1 Establishing Your Retirement Income Stream What is important about retirement planning to you? 2 Building your retirement house 4 Legacy Benefits 3 2 Retirement income planning Accumulation 1 Expenses
This PDF is a selection from a published volume from the National Bureau of Economic Research. Volume Title: Analyses in the Economics of Aging
 This PDF is a selection from a published volume from the National Bureau of Economic Research Volume Title: Analyses in the Economics of Aging Volume Author/Editor: David A. Wise, editor Volume Publisher:
M INNESOTA STATE PATROL RETIREMENT FUND
 M INNESOTA STATE PATROL RETIREMENT FUND 4 - YEAR EXPERIENCE STUDY JULY 1, 2011 THROUGH JUNE 30, 2015 GRS Gabriel Roeder Smith & Company Consultants & Actuaries 277 Coon Rapids Blvd. Suite 212 Coon Rapids,
Retirement Saving, Annuity Markets, and Lifecycle Modeling. James Poterba 10 July 2008
 Retirement Saving, Annuity Markets, and Lifecycle Modeling James Poterba 10 July 2008 Outline Shifting Composition of Retirement Saving: Rise of Defined Contribution Plans Mortality Risks in Retirement
Understanding Annuities: A Lesson in Variable Annuities
 Understanding Annuities: A Lesson in Variable Annuities Did you know that an annuity can be used to systematically accumulate money for retirement purposes, as well as to guarantee a retirement income
Social Security Reform and Benefit Adequacy
 URBAN INSTITUTE Brief Series No. 17 March 2004 Social Security Reform and Benefit Adequacy Lawrence H. Thompson Over a third of all retirees, including more than half of retired women, receive monthly
FPO THE VALUE OF INTEGRATING RETIREMENT ASSETS: CREATING A RELIABLE INCOME IN RETIREMENT
 THE NORTHWESTERN MUTUAL LIFE INSURANCE COMPANY (NORTHWESTERN MUTUAL) THE VALUE OF INTEGRATING RETIREMENT ASSETS: CREATING A RELIABLE INCOME IN RETIREMENT FPO 90-2596 (1016) You save and sacrifice throughout
How Will Rhode Island s New Hybrid Pension Plan Affect Teachers?
 How Will Rhode Island s New Hybrid Pension Plan Affect Teachers? RICHARD W. JOHNSON, BARBARA A. BUTRICA, OWEN HAAGA, AND BENJAMIN G. SOUTHGATE A REPORT OF THE PUBLIC PENSION PROJECT MARCH 2014 Copyright
John and Margaret Boomer
 Retirement Lifestyle Plan Includes Insurance and Estate - Using Projected Returns John and Margaret Boomer Prepared by : Sample Report June 06, 2012 Table Of Contents IMPORTANT DISCLOSURE INFORMATION 1-9
Research fundamentals
 Research fundamentals 1401 H Street, NW, Suite 1200 Washington, DC 20005 202/326-5800 www.ici.org January 2009 Vol. 18, No. 1 With the processing of the 2009 IRA Owners Survey results, ICI revised the
Issue Brief. Amer ican Academy of Actuar ies. An Actuarial Perspective on the 2006 Social Security Trustees Report
 AMay 2006 Issue Brief A m e r i c a n Ac a d e my o f Ac t ua r i e s An Actuarial Perspective on the 2006 Social Security Trustees Report Each year, the Board of Trustees of the Old-Age, Survivors, and
Breaking Free from the Safe Withdrawal Rate Paradigm: Extending the Efficient Frontier for Retiremen
 Breaking Free from the Safe Withdrawal Rate Paradigm: Extending the Efficient Frontier for Retiremen March 5, 2013 by Wade Pfau Combining stocks with single-premium immediate annuities (SPIAs) may be the
The Portfolio Pension Plan: An Alternative Model for Retirement Security
 The Portfolio Pension Plan: An Alternative Model for Retirement Security Richard C. Shea, Robert S. Newman, and Jonathan P. Goldberg September 2014 PRC WP2014-13 Pension Research Council The Wharton School,
Aging Seminar Series:
 Aging Seminar Series: Income and Wealth of Older Americans Domestic Social Policy Division Congressional Research Service November 19, 2008 Introduction Aging Seminar Series Focus on important issues regarding
Risks of Retirement Key Findings and Issues. February 2004
 Risks of Retirement Key Findings and Issues February 2004 Introduction and Background An understanding of post-retirement risks is particularly important today in light of the aging society, the volatility
Demographic Change, Retirement Saving, and Financial Market Returns
 Preliminary and Partial Draft Please Do Not Quote Demographic Change, Retirement Saving, and Financial Market Returns James Poterba MIT and NBER and Steven Venti Dartmouth College and NBER and David A.
Income and Poverty Among Older Americans in 2008
 Income and Poverty Among Older Americans in 2008 Patrick Purcell Specialist in Income Security October 2, 2009 Congressional Research Service CRS Report for Congress Prepared for Members and Committees
ICI RESEARCH PERSPECTIVE
 ICI RESEARCH PERSPECTIVE 1401 H STREET, NW, SUITE 1200 WASHINGTON, DC 20005 202-326-5800 WWW.ICI.ORG OCTOBER 2017 VOL. 23, NO. 8 WHAT S INSIDE 2 US Household Ownership of Mutual Funds in 2017 2 Most Mutual
Restructuring Social Security: How Will Retirement Ages Respond?
 Cornell University ILR School DigitalCommons@ILR Articles and Chapters ILR Collection 1987 Restructuring Social Security: How Will Retirement Ages Respond? Gary S. Fields Cornell University, gsf2@cornell.edu
1-47 TABLE PERCENTAGE OF WORKERS ELECTING SOCIAL SECURITY RETIREMENT BENEFITS AT VARIOUS AGES, SELECTED YEARS
 1-47 TABLE 1-13 -- NUMBER OF SOCIAL SECURITY RETIRED WORKER NEW BENEFIT AWARDS AND PERCENT RECEIVING REDUCED BENEFITS BECAUSE OF ENTITLEMENT BEFORE FRA, SELECTED YEARS 1956-2002 [Number in millions] Year
ICI RESEARCH PERSPECTIVE
 ICI RESEARCH PERSPECTIVE 40 H STREET, NW, SUITE 00 WASHINGTON, DC 0005 0/6-5800 WWW.ICI.ORG NOVEMBER 0 VOL. 7, NO. 8A WHAT S INSIDE Household Ownership of IRAs Growth in Number of IRA- Owning Households
RETIREMENT PLANNING. Created by Raymond James using Ibbotson Presentation Materials 2011 Morningstar, Inc. All rights reserved. Used with permission.
 RETIREMENT PLANNING Erik Melville 603 N Indian River Drive, Suite 300 Fort Pierce, FL 34950 772-460-2500 erik.melville@raymondjames.com www.melvillewealthmanagement.com Created by Raymond James using Ibbotson
Optimal Retirement Income Solutions in DC Retirement Plans Phase 1: Baseline, Interim Results and Commentary
 Optimal Retirement Income Solutions in DC Retirement Plans Phase 1: Baseline, Interim Results and Commentary July 2015 0 Acknowledgments Authors: Steve Vernon, FSA, svernon@stanford.edu Dr. Wade Pfau,
Financial Analysis. Jim Goodland PREPARED FOR: PREPARED BY: Louis and Rosalie Johnson October 25, 2016
 Financial Analysis PREPARED FOR: PREPARED BY: Louis and Rosalie Johnson October 25, 2016 Jim Goodland GPS Wealth Management, LLC Plymouth, Minnesota (763) 231-7880 Table of Contents Cover Page Table of
Methodology and assumptions guide
 Methodology and assumptions guide Last updated 15 August The results produced by the Accurium retirement healthcheck are based on the methodology and assumptions detailed below. Suitable for retirees The
Hartford Lifetime Income Summary booklet
 Hartford Lifetime Income Summary booklet A group deferred fixed annuity issued by Hartford Life Insurance Company TABLE OF CONTENTS 2 HLI at a glance 4 Is this investment option right for you? 4 How HLI
Volume URL: Chapter Title: Introduction to "Pensions in the U.S. Economy"
 This PDF is a selection from an out-of-print volume from the National Bureau of Economic Research Volume Title: Pensions in the U.S. Economy Volume Author/Editor: Zvi Bodie, John B. Shoven, and David A.
How Persistent Low Expected Returns Alter Optimal Life Cycle Saving, Investment, and Retirement Behavior
 How Persistent Low Expected Returns Alter Optimal Life Cycle Saving, Investment, and Retirement Behavior Vanya Horneff, Raimond Maurer, and Olivia S. Mitchell September 2017 PRC WP2017 Pension Research
ONcore Variable Annuities
 ONcore Variable Annuities Plan Accumulate Protect Access Table of Contents 2 Plan Overcome Risk Through Planning 6 Accumulate Accumulate Wealth and Manage Risk Using ONcore Variable Annuities 8 Protect
CONTENTS. 1-2 Summary of Benefit Provisions 3 Asset Information 4-6 Retired Life Data Active Member Data Inactive Vested Member Data
 CITY OF ST. CLAIR SHORES POLICE AND FIRE RETIREMENT SYSTEM 66TH ANNUAL ACTUARIAL VALUATION REPORT JUNE 30, 2015 CONTENTS Section Page 1 Introduction A Valuation Results 1 Funding Objective 2 Computed Contributions
What Replacement Rate Do Households Actually Experience in Retirement?
 What Replacement Rate Do Households Actually Experience in Retirement? Alicia H. Munnell and Mauricio Soto Boston College Prepared for the 7 th Annual Joint Conference of the Retirement Research Consortium
For Your Name and Spouse Here. Presented by: Dolph Janis Clear Income Strategies Phone:
 For and Here Presented by: Dolph Janis Phone: 74-99-49 Email: dolph@cisforlife.com Important Notes This analysis provides only broad, general guidelines, which may be helpful in shaping your thinking about
Summary Preparing for financial security in retirement continues to be a concern of working Americans and policymakers. Although most Americans partic
 Ownership of Individual Retirement Accounts (IRAs) and Policy Options for Congress John J. Topoleski Analyst in Income Security January 7, 2011 Congressional Research Service CRS Report for Congress Prepared
Votaire Assumptions and Methodology
 Votaire Assumptions and Methodology Data Data for actuarial projection is based on user input and linked accounts. Where relevant data may be missing, we have made assumptions we feel are reasonable or
Social Security Reform
 Election 2004: A Guide to Analyzing the Issues The Questions Candidates Should Answer about... Social Security Reform Founded in 1965, the Academy is a non-partisan, non-profit professional association
Northwestern Mutual Retirement Strategy. Retirement Income Planning with Confidence
 Northwestern Mutual Retirement Strategy Retirement Income Planning with Confidence Over the past decade, the conventional approach to retirement planning has shifted. Retirement planning used to focus
The Power of Working Longer 1. Gila Bronshtein Cornerstone Research Jason Scott
 The Power of Working Longer 1 Gila Bronshtein Cornerstone Research GBronshtein@cornerstone.com Jason Scott Jscott457@yahoo.com John B. Shoven Stanford University and NBER shoven@stanford.edu Sita N. Slavov
Actuary s Certification Letter (Pension Trust Fund)
") Actuarial Actuary s Certification Letter (Pension Trust Fund) May 22, 2015 Board of Trustees Texas Municipal Retirement System ( TMRS or the System ) Austin, Texas Dear Trustees: In accordance with the
Actuarial Actuary s Certification Letter (Pension Trust Fund) May 22, 2015 Board of Trustees Texas Municipal Retirement System ( TMRS or the System ) Austin, Texas Dear Trustees: In accordance with the
Updated Long-Term Projections for Social Security
 Updated Long-Term Projections for Social Security The Congressional Budget Office (CBO) most recently released long-term (1-year) Social Security projections in The Outlook for Social Security (June 24).
USING DEFINED MATURITY BOND FUNDS AND QLACs TO BETTER MANAGE RETIREMENT RISKS
 USING DEFINED MATURITY BOND FUNDS AND QLACs TO BETTER MANAGE RETIREMENT RISKS A Whitepaper for Franklin Templeton and MetLife by WADE D. PFAU, PH.D., CFA Professor of Retirement Income The American College
DETAILED METHODOLOGY. Fidelity Income Strategy Evaluator
 DETAILED METHODOLOGY Fidelity Income Strategy Evaluator Updated March 2017 FIDELITY INCOME STRATEGY EVALUATOR METHODOLOGY OVERVIEW The Fidelity Income Strategy Evaluator (ISE, the Tool ) is an educational
COUNTY OF VOLUSIA VOLUNTEER FIREFIGHTERS PENSION SYSTEM
 COUNTY OF VOLUSIA VOLUNTEER FIREFIGHTERS PENSION SYSTEM ACTUARIAL VALUATION REPORT AS OF OCTOBER 1, 2015 OUTLINE OF CONTENTS REPORT OF THE OCTOBER 1, 2015 ACTUARIAL VALUATION Pages Items - - Cover Letter
Issue Number 60 August A publication of the TIAA-CREF Institute
 18429AA 3/9/00 7:01 AM Page 1 Research Dialogues Issue Number August 1999 A publication of the TIAA-CREF Institute The Retirement Patterns and Annuitization Decisions of a Cohort of TIAA-CREF Participants
Social Security. Estimated Financial Effects of The Progressive Personal Account Plan --INFORMATION
 Social Security Memorandum Date: December 1, 2003 To: From: Subject: Peter Ferrara Steve Goss, Chief Actuary Estimated Financial Effects of The Progressive Personal Account Plan --INFORMATION This memorandum
The Four Pillars of U.S. Retirement
 October 2006 Prudential s Four Pillars of Retirement Series The Four Pillars of U.S. Retirement A Framework to Discuss How Americans Will Prepare for and Live in Retirement Prudential has prepared these
Retirement Redefined: Income Planning for the Modern Retiree
 Retirement Redefined: Income Planning for the Modern Retiree Challenges and choices facing pre-retiree baby boomers For investors. Not FDIC Insured May Lose Value No Bank Guarantee Retirement Income Planning
Retirement Security: What s Working and What s Not? James Poterba MIT, NBER, & TIAA-CREF. Bipartisan Policy Center 30 July 2014
 Retirement Security: What s Working and What s Not? James Poterba MIT, NBER, & TIAA-CREF Bipartisan Policy Center 30 July 2014 Retirement Support: A Three Legged Stool? Three Legs: Social Security, Private
Target Date Glide Paths: BALANCING PLAN SPONSOR GOALS 1
 PRICE PERSPECTIVE In-depth analysis and insights to inform your decision-making. Target Date Glide Paths: BALANCING PLAN SPONSOR GOALS 1 EXECUTIVE SUMMARY We believe that target date portfolios are well
DRAFT. A microsimulation analysis of public and private policies aimed at increasing the age of retirement 1. April Jeff Carr and André Léonard
 A microsimulation analysis of public and private policies aimed at increasing the age of retirement 1 April 2009 Jeff Carr and André Léonard Policy Research Directorate, HRSDC 1 All the analysis reported
DO REQUIRED MINIMUM DISTRIBUTIONS MATTER? THE EFFECT OF THE 2009 HOLIDAY ON RETIREMENT PLAN DISTRIBUTIONS
 RESEARCH DIALOGUE Issue no. 113 AUGUST 2014 DO REQUIRED MINIMUM DISTRIBUTIONS MATTER? THE EFFECT OF THE 2009 HOLIDAY ON RETIREMENT PLAN DISTRIBUTIONS Jeffrey R. Brown University of Illinois and NBER James
Medicaid Insurance and Redistribution in Old Age
 Medicaid Insurance and Redistribution in Old Age Mariacristina De Nardi Federal Reserve Bank of Chicago and NBER, Eric French Federal Reserve Bank of Chicago and John Bailey Jones University at Albany,
COMMUNICATION THE BOARD OF TRUSTEES, FEDERAL OLD-AGE AND SURVIVORS INSURANCE AND FEDERAL DISABILITY INSURANCE TRUST FUNDS
 THE 2008 ANNUAL REPORT OF THE BOARD OF TRUSTEES OF THE FEDERAL OLD-AGE AND SURVIVORS INSURANCE AND FEDERAL DISABILITY INSURANCE TRUST FUNDS COMMUNICATION FROM THE BOARD OF TRUSTEES, FEDERAL OLD-AGE AND
Lump-Sum Distributions at Job Change, Distributions Through 2012, p. 2
 November 2013 Vol. 34, No. 11 Lump-Sum Distributions at Job Change, Distributions Through 2012, p. 2 A T A G L A N C E Lump-Sum Distributions at Job Change, Distributions Through 2012, by Craig Copeland,
The Next Generation of Income Guarantee Riders: Part 1 The Deferral Phase By Wade Pfau October 30, 2012
 The Next Generation of Income Guarantee Riders: Part 1 The Deferral Phase By Wade Pfau October 30, 2012 Clients no longer need to move their assets to a variable annuity with a rider to guarantee lifetime