The South African Index of Multiple Deprivation 2001 at Datazone Level
|
|
|
- Anthony Anthony
- 5 years ago
- Views:
Transcription


1
2
3 The South African Index of Multiple Deprivation 2001 at Datazone Level Michael Noble, Helen Barnes, Gemma Wright, David McLennan, David Avenell, Adam Whitworth and Ben Roberts
4 Suggested citation: Noble, M., Barnes, H., Wright, G., McLennan, D., Avenell, D., Whitworth, A., and Roberts, B. (2009) The South African Index of Multiple Deprivation 2001 at Datazone Level, Pretoria, Department of Social Development. Disclaimer: The University of Oxford has taken reasonable care to ensure that the information in this report and the accompanying data are correct. However, no warranty, express or implied, is given as to its accuracy and the University of Oxford does not accept any liability for error or omission. The University of Oxford is not responsible for how the information is used, how it is interpreted or what reliance is placed on it. The University of Oxford does not guarantee that the information in this report or in the accompanying file is fit for any particular purpose. The University of Oxford does not accept responsibility for any alteration or manipulation of the report or the data once it has been released. The authors: Michael Noble is Professor of Social Policy at the Department of Social Policy and Social Work at the University of Oxford and Director of the Centre for the Analysis of South African Social Policy (CASASP) at the University of Oxford Helen Barnes is a Research Fellow at CASASP Gemma Wright is a Senior Research Fellow at the Department of Social Policy and Social Work at the University of Oxford and Deputy Director of CASASP David McLennan is a Senior Research Fellow at the Department of Social Policy and Social Work at the University of Oxford and Deputy Director of the Social Disadvantage Research Centre at the University of Oxford David Avenell is an independent GIS Consultant and associate member of CASASP Adam Whitworth is a Research Fellow at CASASP Benjamin Roberts is a Research Specialist Child, Youth, Family and Social Development at the Human Sciences Research Council Acknowledgements The team would like to thank the Department of Social Development for sponsoring this project; the UK Department for International Development Southern Africa for funding it; and Statistics South Africa for their assistance in producing the data. 2
5 Contents 1 Introduction Background Why measure deprivation at the small area level? Defining deprivation Dimensions of deprivation Structure of the report Domains and Indicators An introduction to the domains and indicators The model of multiple deprivation Domains Indicators Population denominators Income and Material Deprivation Domain Purpose of domain Background Indicators Combining the indicators Employment Deprivation Domain Purpose of domain Background Indicators Combining the indicators Health Deprivation Domain Purpose of domain Background Indicator Education Deprivation Domain Purpose of domain Background Indicator Living Environment Deprivation Domain Purpose of domain Background Indicators Combining the indicators The datazones Methodology Use of the 2001 Census
6 4.2 Creating domain indices Dealing with small numbers Combining indicators into domain indices Combining domain indices into an index of multiple deprivation Standardisation and transformation Weighting The geography of deprivation How to interpret the datazone level results The five domain measures and ranks The South African Index of Multiple Deprivation Datazone level results Appendix 1: Indicators used in the SAIMD Acronyms References
7 1 Introduction This report presents the South African Index of Multiple Deprivation 2001 (SAIMD 2001) at datazone level. The SAIMD is a composite index reflecting five dimensions of deprivation: income and material deprivation, employment deprivation, education deprivation, health deprivation and living environment deprivation. The SAIMD and the component domains of deprivation are presented at datazone level. As will be elaborated below, datazones are small areas containing approximately the same number of people (average 2 000). The datazone level SAIMD therefore provides a fine-grained picture of deprivation in South Africa and enables pockets of deprivation to be identified. 1.1 Background A key objective of the South African government since 1994 has been the improvement of the quality of life of all South Africans and the reduction of poverty and inequality. Furthermore, the South African constitution requires the Parliament to ensure that financial resources are distributed equitably among provincial and sub-provincial governments, based partly on levels of poverty and disadvantage (Alderman et al., 2003). In recognition of this a team from the University of Oxford s Centre for the Analysis of South African Social Policy (CASASP), the Human Sciences Research Council and Statistics South Africa (StatsSA) developed a small area measure of multiple deprivation known as the Provincial Indices of Multiple Deprivation (PIMD) (Noble et al., 2006a, 2006b, 2009 forthcoming). This project was funded by a pump priming grant from the University of Oxford. The PIMD has been used in various ways to target deprivation across the country (Noble et al., 2009 forthcoming). At that time the geographical unit employed to identify small area deprivation was the electoral ward. However due to the variation in the population size of wards across the country meant that this geography was less than ideal for comparative purposes. Indeed this was the reason why an index of multiple deprivation was separately created for each province rather than an overall index of multiple deprivation for the whole country. As was stated in Chapter 6 of the PIMD report: The original intention was to produce ward level South African Index of Multiple Deprivation (i.e. a single index for the whole country). However, the country s wards vary considerably in population size, especially by province. Though the national mean ward level population size is around , mean ward size by province ranges from around in the Northern Cape to in Gauteng. This raises two important issues: first, provinces with large wards will tend to be under-represented in 5
8 national indices of deprivation; and second, pockets of deprivation in larger wards may be diluted or hidden by relative non-deprivation in the vicinity. (Noble et al., 2006a, p 53) The recommendation in the original PIMD report to deal with this problem was: To address the issues raised above, it is recommended that a new small area unit be constructed that takes into account homogeneity and population size. The research team accordingly plans to develop Data Zones for South Africa which use Enumeration Areas as building blocks. This exercise will draw on work that has been carried out to create new small area geographies by the Office for National Statistics (England and Wales), the General Register Office for Scotland and the Northern Ireland Statistics and Research Agency. In these countries, similar problems with ward size and changing boundaries were encountered and it was therefore decided to develop a range of statistical areas that would be of consistent size and whose boundaries would not change. The key thing to note is that Data Zones would be analytical or statistical boundaries not political or administrative boundaries. They would be generated solely to ensure equity and consistency in the geographical measurement of deprivation. (Noble et al., 2006a, p 54) The National Department of Social Development, recognizing the importance of creating a national index at the new geography, supported this project as part of its DfID funded SACED 1 programme and as a result a new statistical geography (datazones) was created (See Section 3). Datazones have been designed to nest within municipalities and have a mean population of around 2000 with most datazones having populations between 1000 and Having created the datazones StatsSA then agreed to re-run the SAS code used to produce the PIMD at ward level on the 100% 2001 Census and supply the project team with datazone level data to construct the original PIMD domains and indicators at datazone level. This has enabled a national SAIMD at datazone level to be created. It is important to stress that the rationale, model of deprivation, the domains and their component indicators and the techniques used are, by design, identical to the PIMD. As this is the case some sections of this report are drawn from the original PIMD report 2. 1 Strengthening Analytical Capacity for Evidence-based Decision-making. 2 This allows this document to be read as a stand alone report without constant reference back to the original PIMD report. Original copyright is duly acknowledged and material drawn from the original report is enclosed in double quotation marks but (usually) not page referenced. 6
9 1.2 Why measure deprivation at the small area level? Why is small area level deprivation important? First, geographical patterns of social disadvantage (or advantage) are not random: the spatial distribution reflects the results of dynamic social processes, economic change, migration, availability and costs of living space, community preferences, and policies that may distribute particular groups to certain areas or exclude them from others. Second, the spatial concentration of multi-dimensional deprivation means that when correctly measured the most deprived areas can effectively be targeted (Smith, 1999; Kleinman, 1999; Smith et al., 2001). Third, the concentration of poor people in an area may mean that local services struggle to meet high demand, or that areas lack resources to support certain services. Fourth, when a range of deprivation measures is collected on an area basis, the exact mix of problems will vary from area to area. 1.3 Defining deprivation Townsend defined people as poor if they lack the resources to obtain the types of diet, participate in the activities and have the living conditions and amenities which are customary, or at least widely encouraged or approved in the societies to which they belong (Townsend, 1979: 31). Conversely he defined people as deprived if they lack the types of diet, clothing, housing, household facilities and fuel and environmental, educational, working and social conditions, activities and facilities which are customary (Townsend, 1987: 131 and 140). Deprivation therefore refers to peoples unmet needs, whereas poverty refers to the lack of resources required to meet those needs. This underpins our model of multiple deprivation. Townsend also lays down the foundation for articulating multiple deprivation as an accumulation of single deprivations (Townsend, 1987) - a concept which also underpins this project. 1.4 Dimensions of deprivation This view of multiple deprivation allows the separate measurement of different dimensions of deprivation, such as education deprivation and health deprivation. In the case of low income, there is an argument that, following Townsend, within a multiple deprivation measure only the deprivations resulting from a low income would be included and low income itself would not be a component. However, the considerable problems of measurement of material deprivations such as lack of adequate diet, clothing etc., mean that a measure of low income or consumption could be regarded as a useful proxy for material deprivation. In practice, as will be seen, an Income and Material Deprivation Domain was produced. 7
10 To summarise, the model which emerges from this theoretical framework is of a series of uni-dimensional domains of deprivation which may be combined, with appropriate weighting, into a single measure of multiple deprivation. The South African Index of Multiple Deprivation 2001 (SAIMD) has been developed using this model. 1.5 Structure of the report Section 2 presents the domains and indicators for the SAIMD. Section 3 describes the new datazone geography used in the SAIMD. Section 4 explains the methodological approach used. Section 5 presents an overview of the SAIMD at datazone level. 8
11 2 Domains and Indicators The datazone level South African Index of Multiple Deprivation (SAIMD) was constructed using the model of multiple deprivation briefly described in Section 1.3 above. The SAIMD comprises indicators which were first combined to form domains of deprivation. The domains and constituent indicators were identical to those used for the PIMD (Noble et al., 2006a). As with the PIMD a score for each of the domains was produced referred to as a domain index - and these domain indices were ranked to give a relative picture of each dimension of deprivation across the whole of South Africa. The domain indices were then combined to form the overall SAIMD. 2.1 An introduction to the domains and indicators The model of multiple deprivation As indicated, the conceptual model which underpins the SAIMD is based on the idea of distinct domains of deprivation which can be recognised and measured separately. These are experienced by individuals living in an area. People may be counted as deprived in one or more of the domains, depending on the number of types of deprivation that they experience. The overall [South African] index of multiple deprivation is conceptualised as a weighted area level aggregation of these specific domains of deprivation Domains Five domains of deprivation were identified that could be constructed using the 2001 Census to form the SAIMD. These were: Income and Material Deprivation, Employment Deprivation, Health Deprivation, Education Deprivation, and Living Environment Deprivation. Each domain is presented as a separate domain index reflecting a particular aspect of deprivation. Thus the Employment Deprivation Domain captures exclusion from the world of work and conditions of work not the low income that may flow from it. The Income Deprivation Domain can be used separately from [the SAIMD] to examine low income alone. The Education Deprivation Domain represents educational disadvantage and does not include non education indicators which may contribute to education deprivation such as the lack of electric lighting to undertake homework. Such an indicator would be captured in the Living Environment Deprivation Domain. This approach avoids the need to make any judgments about the complex links between different types of deprivation (for example the links between poor health and unemployment), and enables clear decisions to be made about the contribution that each domain should make to the overall [SAIMD]. 9
12 While the domains represent distinct dimensions of deprivation, it is perfectly possible, indeed likely, that the same person could be captured in more than one domain. So, for example, if someone was unemployed, had no qualifications and no or very little other income they would be captured in the Employment Deprivation, Education Deprivation and Income Deprivation Domains. This is entirely appropriate because one individual can experience more than one type of deprivation at any given time Indicators Each domain index contains a number of indicators, totalling thirteen overall (please see Appendix 1 for full details). Given the exclusive use of StatsSA s 2001 Census data for the construction of the index, all the indicators relate to 10 October 2001 (Census night). The aim for each domain was to include a parsimonious (i.e. economical in number) collection of indicators that comprehensively captured the deprivation for each domain, but within the constraints of the data available from the Census. Three further criteria were kept in mind when selecting indicators: They should be domain specific and appropriate for the purpose (as direct as possible measures of that form of deprivation); They should measure major features of that deprivation (not conditions just experienced by a very small number of people or areas); They should be statistically robust. The model is designed to be updated in three ways: first, to allow for the reevaluation of the number and nature of the dimensions of deprivation; second, to allow for new and more direct measures of those dimensions to be incorporated; and third, to measure changing deprivation on the ground as required Population denominators To enable the calculation of rate statistics, counts of deprived characteristics were divided by an appropriate population denominator. Since 2001 Census data were used, the denominators were also drawn from the Census. Appendix 1 lists the denominators that were used to create each of the indicators. 10
13 2.2 Income and Material Deprivation Domain Purpose of domain The purpose of this domain is to capture the proportion of the population experiencing income and/or material deprivation in an area Background As indicated in the section outlining the conceptual framework for multiple deprivation, this domain sets out to capture material deprivation. However, there are few indicators of material deprivation contained within the Census or otherwise available at small area level. Income deprivation is a good proxy for general material deprivation and is included in this domain alongside two direct measures of material deprivation. Despite advances in poverty measurement in South Africa over the past decade, and the emergence of a voluminous literature on the subject, the patterns and dynamics of poverty and inequality have become the subject of much debate. The key issue of contention relates to whether poverty has increased or decreased over the period. This situation has developed partly due to the wide range of definitions used. This is compounded by the absence of an official national poverty line, resulting in poverty estimates that fluctuate within quite a broad range, even when referring to a single dataset. Notwithstanding these debates, income deprivation is now often measured at national level as the proportion of households below a particular low income threshold. International comparisons frequently use the proportion of households living below various fractions (usually ranging from 40 to 60 %) of median or mean income. The availability of data in the Census on income distribution yields valuable insights into low income at very small spatial units Indicators Number of people living in a household that has a household income (need-adjusted using the modified OECD equivalence scale) that is below 40% of the mean equivalent household income; or Number of people living in a household without a refrigerator; or Number of people living in a household with neither a television nor a radio. The income deprivation aspect of this domain is represented by the number of people in a [datazone] living in households with an equivalent income of less than 40% of the national mean. Several household equivalent income thresholds and equivalence scales were investigated (see below) and the modified OECD 11
14 equivalence scale was selected. This commonly used scale, which was initially suggested by Hagenaars et al. (1994), allocates a value of 1 to the household head, of 0.5 to each additional adult member or child aged 14 or over and of 0.3 to each child under 14. Mean equivalent income was calculated using the 2000 Income and Expenditure Survey (IES) data and adjusted to 2001 levels using the Consumer Price Index. Having performed these calculations, a threshold of 40% of mean equivalised income in 2001 was adopted. With regards to material deprivation, there are questions in the 2001 Census questionnaire about the possession of material goods (e.g. radio, television, computer, refrigerator, telephone, and cell-phone). These are widely used measures of variations in living standards. For the purpose of the provincial indices, three of the six household durables were included in the income deprivation domain - a refrigerator, radio and television. Ownership of a refrigerator represents a fundamental basic asset for safe storage of food, while ownership of a radio or television represents an important mode of communication with the outside world and a means of accessing information critical to one's life and livelihood. According to the 2001 Census, nearly threequarters (73%) of households in the country had a radio, while slightly more than half had a television or refrigerator (54% and 51% respectively). For the other three excluded private goods, the levels of ownership were substantially lower. Cellular telephones were present in 32% of households, landline telephones in 24% of households and computers in a mere 9% of households. The current low levels of computer ownership in South Africa suggest that the lack of a computer is not a good indicator of deprivation at this stage of development. Telephone access has been included under the Living Environment Deprivation Domain and was thus not considered here Combining the indicators A simple proportion of people living in households experiencing one or more of the deprivations was calculated (i.e. the number of people living in a household with low income and/or without a refrigerator and/or without a television and radio divided by the total population). 3 3 Please see Noble et al. (2006a) and Noble et al. (2006b) for a full account of other issues considered 12
15 2.3 Employment Deprivation Domain Purpose of domain This domain measures employment deprivation conceptualised as involuntary exclusion of the working age population from the world of work Background In determining what constitutes employment deprivation in the South African context, the intention was to move beyond a mere count of those who would be classified as officially unemployed. It was felt that elements of the hidden unemployed should also be included, such as those who are involuntarily out of the labour force due to sickness or some form of disability Indicators Number of people who are unemployed (using official definition); plus Number of people who are not working because of illness or disability. Stats SA uses two definitions of unemployment. According to the (international) official or strict definition, the unemployed are those people within the economically active population who (a) did not work in the seven days prior to Census night, (b) wanted to work and were available to start work within a week of Census night, and (c) had taken active steps to look for work or start some form of self-employment in the four weeks prior to Census night. Active steps to seek work can be registration at an employment exchange, applications to employers, checking at work sites or farms, placing or answering newspaper advertisements, seeking assistance of friends, etc. A person who fulfils the first two criteria above but did not take active steps to seek work is considered unemployed according to the expanded definition. This broad definition captures discouraged work seekers, and those without the resources to take active steps to seek work. For the reasons discussed in the original PIMD report the official definition is used (see Noble et al., 2006a) Combining the indicators The domain was calculated as a proportion of the economically active population (15 to 65 year olds inclusive) plus people not working due to illness or disability that were unemployed or not working due to illness or disability (i.e. the number of people who are unemployed + the number of people not working due to illness or disability divided by the number of people who are economically active + the number of people not working due to illness or disability). 13
16 2.4 Health Deprivation Domain Purpose of domain This domain identifies areas with relatively high rates of people who die prematurely Background It is generally accepted that as a person ages they will have a greater risk of death in any given time period than those younger than them. This greater risk of death is not deemed by society to be unfair or unjust. Everyone will experience this deficit of health in his or her lifetime and it is therefore seen as an acceptable and unavoidable aspect of life. What is defined as unjust, and is therefore defined here as health deprivation, is unexpected deaths. The usual way of operationalising this principle in a measure is to age and gender standardise the data; that is to compare the number of deaths or level of morbidity in an area to what would be expected given the area s age and gender structure Indicator Years of Potential Life Lost For the measure of premature deaths used in [the SAIMD], Years of Potential Life Lost (YPLL), the level of unexpected mortality is weighted by the age of the individual who has died (see Blane and Drever, 1998). An area with a relatively high death rate in a young age group (including areas with high levels of infant mortality) will therefore have a higher overall YPLL score than an area with a similarly relatively high death rate for an older age group, all else being equal. The YPLL indicator is a directly age and gender standardised measure of premature death (i.e. death under the age of 75). Because the direct method of standardisation makes use of individual age/gender death rates it is particularly prone to problems associated with small numbers. An empirical Bayes or shrinkage technique is therefore used to smooth the individual age/gender death rates in order to reduce the impact of small number problems on the YPLL (see Section 4 below). 14
17 2.5 Education Deprivation Domain Purpose of domain The purpose of this domain is to capture the extent of deprivation in education qualifications in a local area. The primary focus for this measure is adults aged 18 to 65 years Background There is a close link between educational attainment, the type of work an individual is engaged in and the associated earnings potential. The level of education an individual has achieved determines both current income and savings potential and future opportunities for individuals and their dependents (Bhorat et al., 2004). Although the present South African government is intent on rectifying the disadvantages in education which stemmed from the apartheid system, there are still wide disparities, with the greatest challenges in the poorer, rural provinces (Chisholm, 2004; Reddy, 2005). This domain thus identifies areas where historical educational disadvantage is greatest by describing lack of educational qualification in the working age adult population Indicator Number of year olds (inclusive) with no schooling at secondary level or above. 15
18 2.6 Living Environment Deprivation Domain Purpose of domain The purpose of this domain is to identify deprivation relating to the poor quality of the living environment Background This domain considers different aspects of the immediate environment in which people live that impact on the quality of their day-to-day life. There are indicators measuring the quality of housing, the amenities within the dwelling, and access to adequate living space. [ ] Indicators 4 Number of people living in a household without piped water inside their dwelling or yard or within 200 metres; or Number of people living in a household without a pit latrine with ventilation or flush toilet; or Number of people living in a household without use of electricity for lighting; or Number of people living in a household without access to a telephone; or Number of people living in a household that is a shack; or Number of people living in a household with two or more people per room Combining the indicators A simple proportion of people living in households experiencing one or more of the deprivations was calculated (i.e. the number of people living in a household without piped water and/or without adequate toilet and/or without electricity for lighting and/or without access to a telephone and/or that is a shack and/or that is overcrowded divided by the total population). 4 Please see Noble et al. (2006a) and Noble et al. (2006b) for a full account of other issues considered 16
19 3 The datazones As referred to above, the SAIMD 2001 was made possible by the creation of a new statistical geography the datazones. This section briefly describes the process of creating these datazones. Datazones use Census Enumeration Areas (EAs) as the building blocks to create a standard geography. In simple terms a datazone comprises one or more contiguous EAs which share common characteristics. The creation of datazones involved complex geographical programming. The process of creating datazones from EAs involved several steps which were specified in terms of a series of rules. The process ensures that the datazones created are as appropriate a statistical geography as possible, and the datazones created share key common characteristics: Geographical nesting: Datazones are based on the existing EA geography and nest within 2001 municipality boundaries. Population size: Datazones were designed to have a common resident population size (within a fixed range). This allows comparability across the whole country. Population density: EAs must be sufficiently similar to one another in terms of population density to be allowed to merge and form part of the same datazone. This ensures that urban areas, particularly those at the edge of towns, do not blur into adjacent areas which are more rural and which have much lower population densities. Doing so helps to maximise the internal consistency of the datazones in terms of the population density. Internal homogeneity: Datazones must be internally homogenous in terms of area type. This ensures that datazones are a meaningful geography in the sense of capturing areas which are relatively similar to each other and that the datazones, therefore, represent an area in a socio-economic as well as a statistical sense. The process of guaranteeing internal homogeneity of area type was achieved through cluster analyses which assigned EAs to cluster types. In the process of creating datazones, province-tailored rules were established which specified the types of areas which are sufficiently similar to merge with each other. The resultant datazones were then checked in three ways: 1. Overlaying the datazones onto Google Earth Professional and examining the fit on the ground. 2. Checking with people who had detailed knowledge of the areas. 3. Occasionally, through site inspections. 17
20 A number of issues and problems emerged from this checking process and additional rules were therefore introduced and the whole process repeated. Examples of rules introduced included the need to control the overall shape of the resultant datazone (to promote circularity) and to deal with a number of special problems posed particularly by the EA geography in former homeland areas. In order to improve the datazones a final process of optimisation was undertaken. EAs were iteratively swapped in order to test whether doing so improved the composition of each datazone in terms of the population density of its component EAs. Some problems remain insoluble because of the underlying building block geography, (i.e. problems with the EA geography). This results in some datazones remaining as irregular shapes, as islands in seas, or with populations that are either too small or too large. Datazones with small populations (often remote rural areas such as mountain tops) or forming part of District Management Areas 5 were deleted. This left a base set of datazones. In addition, datazones where the non-institutional population is less than 300 were dropped leaving datazones for which domain indices were created. The provincial breakdown is as follows: Table 1 Number of datazones in each Province for the SAIMD 2001 Province Number of datazones Western Cape Eastern Cape Northern Cape 417 Free State KwaZulu-Natal North West Province Gauteng Mpumalanga Limpopo TOTAL District Management Areas are areas such as National Parks. 18
21 4 Methodology 4.1 Use of the 2001 Census The SAIMD (like the PIMD) is based on the 2001 Census. Using the 10% sample of the 2001 Census made available by StatsSA, the team developed code in the statistical analysis package SAS to provide to StatsSA so that they could run the code on the 100% Census and aggregate the results to datazone level to create the SAIMD. An EA to datazone look-up table (LUT) was also produced. The SAS code and LUT enabled a datazone level set of indicators to be produced at StatsSA which CASASP was then able to process into the domain scores and overall SAIMD. 4.2 Creating domain indices Dealing with small numbers To improve the reliability of a score which is based on small numbers, the shrinkage estimation technique can be applied. The effect of shrinkage is to move the score for a small area towards the average score of a larger area for a particular indicator. For example, where [datazones] are the small area geography, the [datazone] level scores would be moved towards the average score for the municipality in which the [datazone] is located. The extent of movement depends on both the reliability of the indicator and the heterogeneity of the larger area. If scores are robust, the movement is negligible as the amount of shrinkage is related to the standard error. The shrinkage technique does not mean that the score necessarily becomes smaller (i.e. less deprived). Where [datazones] do move this may be in the direction of more deprivation if the unreliable score shows less deprivation than the municipality mean 6. Shrinkage was applied to all domains Combining indicators into domain indices For each domain of deprivation (Income, Employment, etc) the aim is to obtain a single summary measure whose interpretation is straightforward in that it is, if possible, expressed in meaningful units (e.g. proportions of people or of households experiencing that form of deprivation). Apart from the Health Deprivation Domain, all of the other domains were created as simple rates. This avoided the key issue of weighting indicators which is necessary when combining indicators into a single measure. Because the domain scores are rates they are easy to interpret (i.e. X% of people in the [datazone] of the relevant age are 6 For further information see Noble et al. (2006b) pp
22 experiencing this type of deprivation). As discussed in Section 2.4, the Health Deprivation Domain is more complex as it had to be age standardised. There is no double counting of individuals within a domain. An individual may be captured in more than one domain but this is not double counting: it is simply identifying that they are deprived in more than one way. Five domain indices were created which were then combined into an overall SAIMD. 4.3 Combining domain indices into an index of multiple deprivation Standardisation and transformation Domains are conceived as independent domains of deprivation, each with their own contribution to multiple deprivation. The strength of this contribution should vary between domains depending on their relative importance. Once the domains had been constructed, it was necessary to combine them into an overall [SAIMD]. In order to do this the domain indices were standardised by ranking. They were then transformed to an exponential distribution. The exponential distribution was selected for the following reasons. First, it transforms each domain so that they each have a common distribution, the same range and identical maximum/minimum value, so that when the domains are combined into a single index of multiple deprivation the (equal) weighting is explicit; that is there is no implicit weighting as a result of the underlying distributions of the data. Second, it is not affected by the size of the [datazone s] population. Third, it effectively spreads out the part of the distribution in which there is most interest; that is the most deprived [datazones] in each domain. Each transformed domain has a range of 0 to 100, with a score of 100 for the most deprived [datazone]. The exponential transformation that was selected for standardising the domains in the [datazone] level [SAIMD] stretches out the most deprived 25% of [datazones] in [the country]. The chosen exponential distribution is one of an infinite number of possible distributions Weighting An important issue in constructing an overall index of multiple deprivation is the question of what explicit weight should be attached to the various components. The weight is the measure of importance that is attached to each component in 7 See Noble et al. (2006b) for further information 20
23 the overall composite measure. How can one attach weights to the various aspects of deprivation? That is, how can one determine which aspects are more important than others? There are at least five possible approaches to weighting: 1. driven by theoretical considerations; 2. empirically driven; 3. determined by policy relevance; 4. determined by consensus; and 5. entirely arbitrary. In the theoretical approach, account is taken of the available research evidence which informs the theoretical model of multiple deprivation and weights are selected which reflect this theory. There are two sorts of empirical approaches that might be applicable. First a commissioned survey or re-analysis of an existing survey might generate weights. Second one might apply a technique such as factor analysis to extract some latent factor called multiple deprivation, assuming that is, that the analysis permitted a single factor solution (see Senior, 2002). Alternatively, the individual domain scores could be released and weighted for combination in accordance with and proportional to the focus of particular policy initiatives or weighted in accordance with public expenditure on particular areas of policy. Another approach would be for policy makers and other customers or experts to simply be consulted for their views and the results examined for consensus. Finally, simply choosing weights without reference to the above or even selecting equal weights in the absence of empirical evidence would come into the category of entirely arbitrary. Weighting always takes place when elements are combined together. Thus if the domains are summed together to create an index of multiple deprivation this means they are given equal weight. It would be incorrect to assume that items can be combined without weighting. For the [SAIMD], equal weights were assigned to the exponentially transformed domains in the absence of evidence suggesting differential weights should be used. 21
24 5 The geography of deprivation 5.1 How to interpret the datazone level results There are six datazone level measures: five domain measures (which were combined to make the overall SAIMD) and one overall SAIMD. These six measures are each assigned a rank. The most deprived datazone for each measure is given a rank of 1. The ranks show how a datazone compares to all the other datazones in South Africa. 5.2 The five domain measures and ranks Each domain measure consists of a score which is then ranked. These domain measures (sometimes referred to as indices) can be used to describe each type of deprivation in an area. This is important as it allows users to focus on particular types of deprivation and to compare this across the country. The scores for all domains except the Health Deprivation Domain are straightforward rates 8. So, for example, if a [datazone] scores 38.6 in the Income and Material Deprivation Domain, this means that 38.6% of the [datazone s] population are income deprived. The score for the Health Deprivation Domain is an age adjusted rate of years of potential life lost per 1000 population, so, for example, a score of 200 means that there are 200 years of potential life lost per 1000 of the population of the [datazone] in question. Within a domain, the higher the score, the more deprived a [datazone] is. However, the scores should not be compared between domains as they have different minimum and maximum values and ranges (before exponential transformation has been applied and the domains combined). To compare between domains, the ranks should be used. A rank of 1 is assigned to the most deprived [datazone] The South African Index of Multiple Deprivation 2001 Each overall SAIMD describes a datazone by combining information from all five domains: Income and Material Deprivation, Employment Deprivation, Health Deprivation, Education Deprivation and Living Environment Deprivation. These were combined in three stages; first each domain was standardised by ranking; the ranks were then transformed to a standard distribution the exponential distribution described above. Finally the domains were combined using equal weights. The final datazone level SAIMD was then ranked in the same way as the domain measures. [The SAIMD] score is the combined sum of the weighted, exponentially transformed domain rank of the domain scores. Again, the bigger the [SAIMD] 8 Although, as has been indicated the scores have been made more robust by employing shrinkage estimation the resultant scores are still rates and can be interpreted as such. 22
25 Rank score, the more deprived the [datazone]. However, because of the exponential distribution, it is not possible to say, for example, that a [datazone] with a score of 40 is twice as deprived as a [datazone] with a score of 20. In order to make comparisons between [datazones], it is recommended that ranks should be used. The [SAIMD is] ranked in the same way as the domain measures, that is, a rank of 1 is assigned to the most deprived [datazone] within the [country]. 5.3 Datazone level results Table 2: The fifty most deprived datazones in South Africa Datazone code Municipality name Province Rank Datazone code Municipality name Province 1 531_239 Ulundi KwaZulu-Natal _51 Maphumulo KwaZulu-Natal 2 520_6 Nqutu KwaZulu-Natal _9 Nqutu KwaZulu-Natal 3 517_23 Okhahlamba KwaZulu-Natal _61 Maphumulo KwaZulu-Natal 4 515_77 Indaka KwaZulu-Natal _416 Qaukeni Eastern Cape 5 233_362 Port St Johns Eastern Cape _95 Hlabisa KwaZulu-Natal 6 515_107 Indaka KwaZulu-Natal _437 Mnquma Eastern Cape 7 231_436 Ntabankulu Eastern Cape _59 Msinga KwaZulu-Natal 8 233_273 Port St Johns Eastern Cape _171 Qaukeni Eastern Cape 9 230_397 Mbizana Eastern Cape _74 Abaqulusi KwaZulu-Natal _90 Indaka KwaZulu-Natal _137 Msinga KwaZulu-Natal _111 Indaka KwaZulu-Natal _4 Ingwe KwaZulu-Natal _301 Port St Johns Eastern Cape _241 Ulundi KwaZulu-Natal _919 Umzimvubu Eastern Cape _178 Msinga KwaZulu-Natal _1330 Umzimvubu Eastern Cape _859 Mhlontlo Eastern Cape _8 Msinga KwaZulu-Natal _532 Intsika Yethu Eastern Cape _10 Ingwe KwaZulu-Natal _29 umlalazi KwaZulu-Natal _219 Ntabankulu Eastern Cape _78 umlalazi KwaZulu-Natal _34 Indaka KwaZulu-Natal _125 Qaukeni Eastern Cape _292 Ntabankulu Eastern Cape _2 King Sabata Dalindyebo Eastern Cape _1383 Umzimvubu Eastern Cape _1061 King Sabata Dalindyebo Eastern Cape _198 Nongoma KwaZulu-Natal _136 Qaukeni Eastern Cape _7 Mbizana Eastern Cape _171 Abaqulusi KwaZulu-Natal _356 Port St Johns Eastern Cape _134 Msinga KwaZulu-Natal _3 uphongolo KwaZulu-Natal _46 Mbizana Eastern Cape _347 Port St Johns Eastern Cape _179 Nkandla KwaZulu-Natal The table above lists the 50 most deprived datazones in South Africa. Of these 27 are in KwaZulu-Natal while the remaining 23 are in the Eastern Cape. They are all located in former homeland areas. 23
26 If we take the 10% most deprived datazones in South Africa we find that they are shared between the nine provinces as follows: Table 3: Provincial share of the most deprived national decile of datazones of SAIMD Province Share of most deprived 10% of datazones Western Cape 0.0 Eastern Cape 46.8 Northern Cape 0.0 Free State 1.2 KwaZulu-Natal 44.7 North West 3.6 PGauteng i 0.1 Mpumalanga 1.4 Limpopo 2.3 N of datazones 2216 Most are located in either the Eastern Cape (46.8%) or KwaZulu-Natal (44.7%). Another way of looking at the picture is seeing what proportion of a province s datazones are in the most deprived 10% or 20% of datazones nationally. Table 4 shows the numbers of datazones per province, the number of these in the most deprived 10% nationally and the number in the most deprived 20% nationally. The final two columns show the percentage of the province s datazones which are in the most deprived 10% and the most deprived 20% nationally. 24
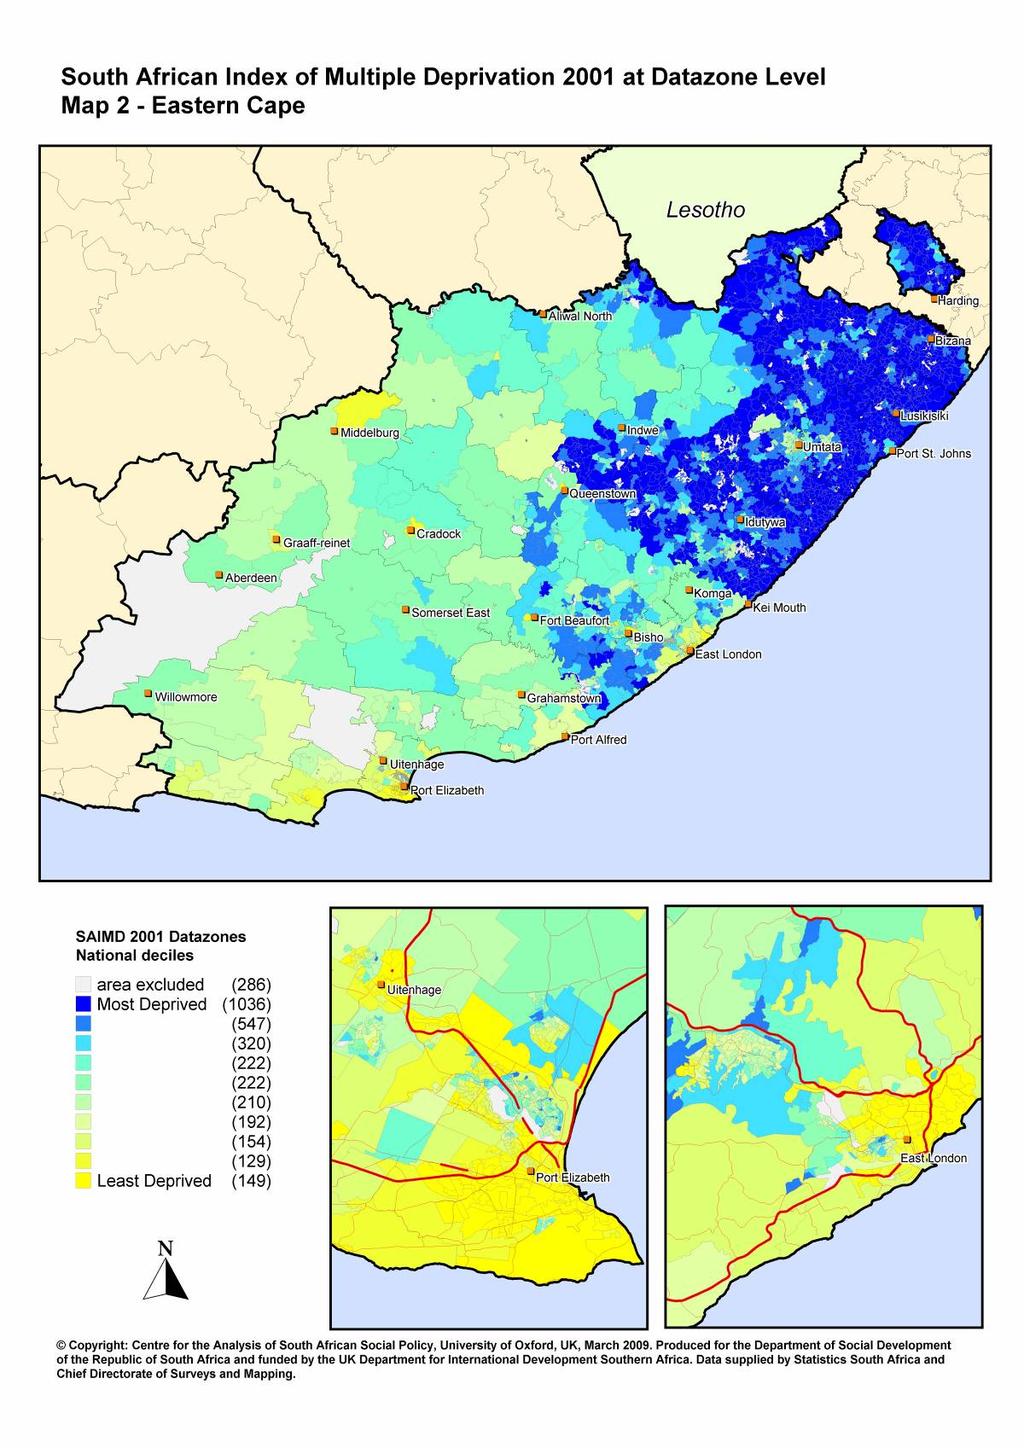
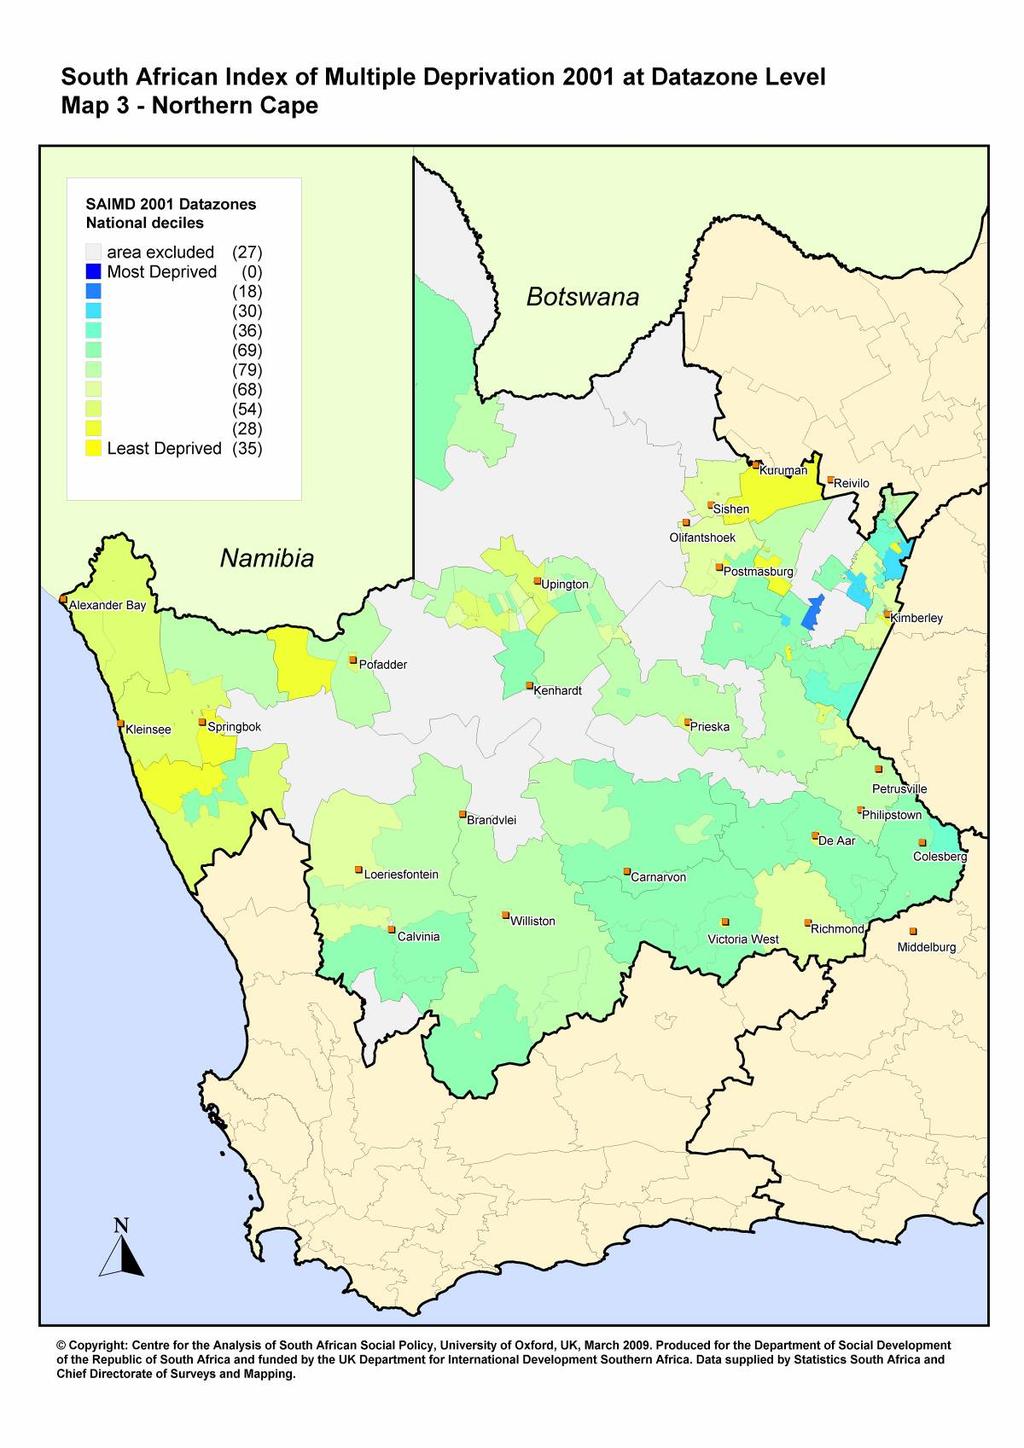
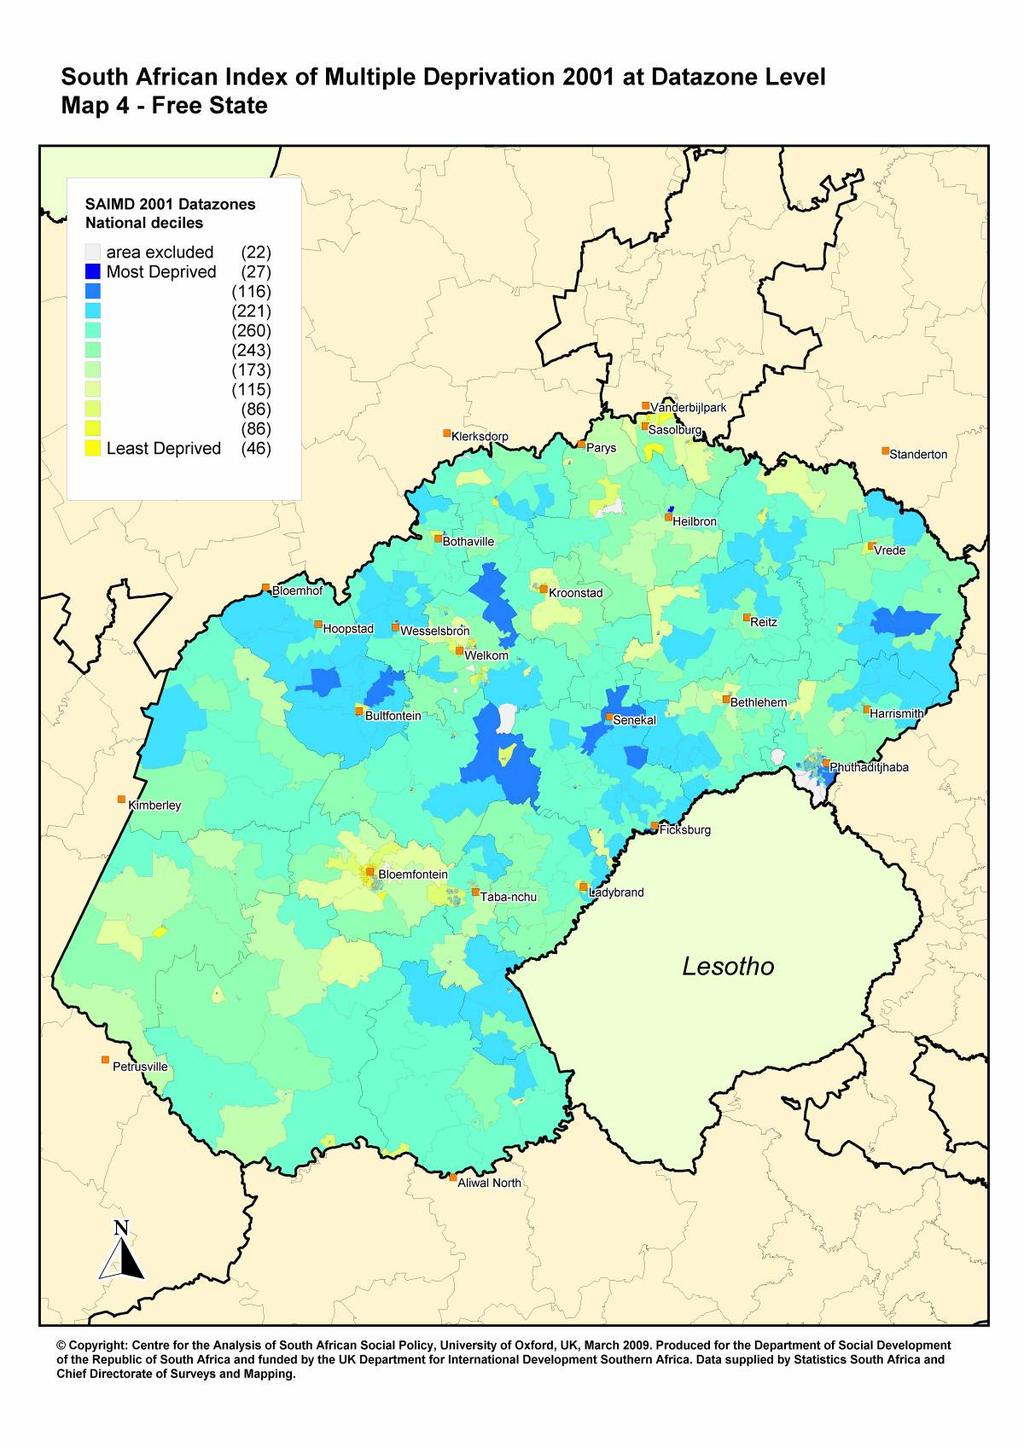
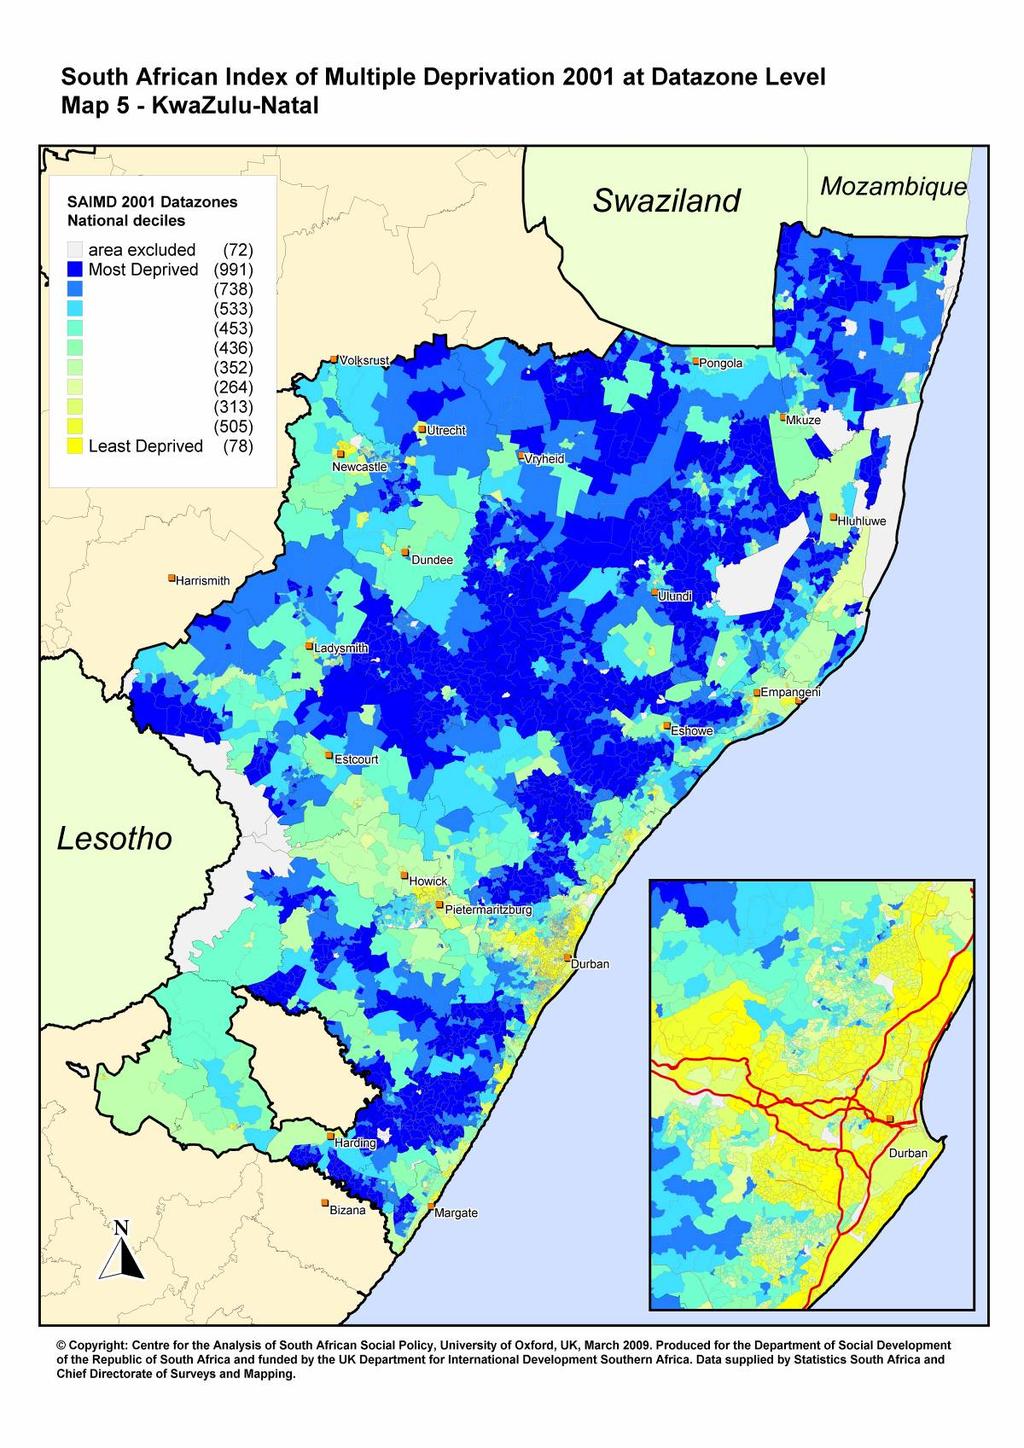
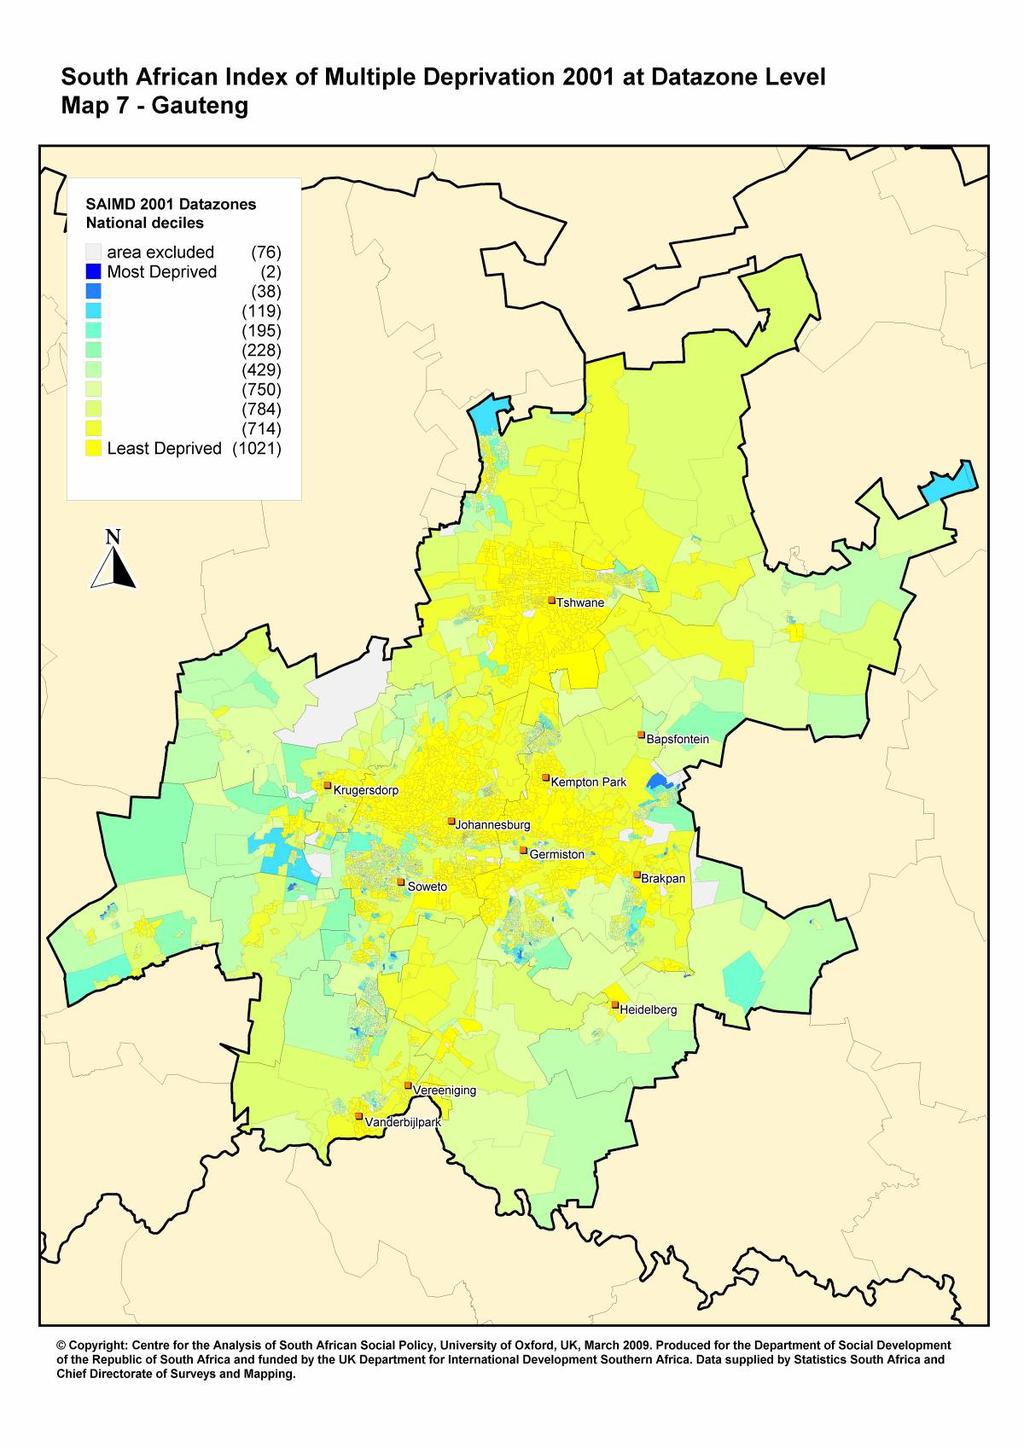
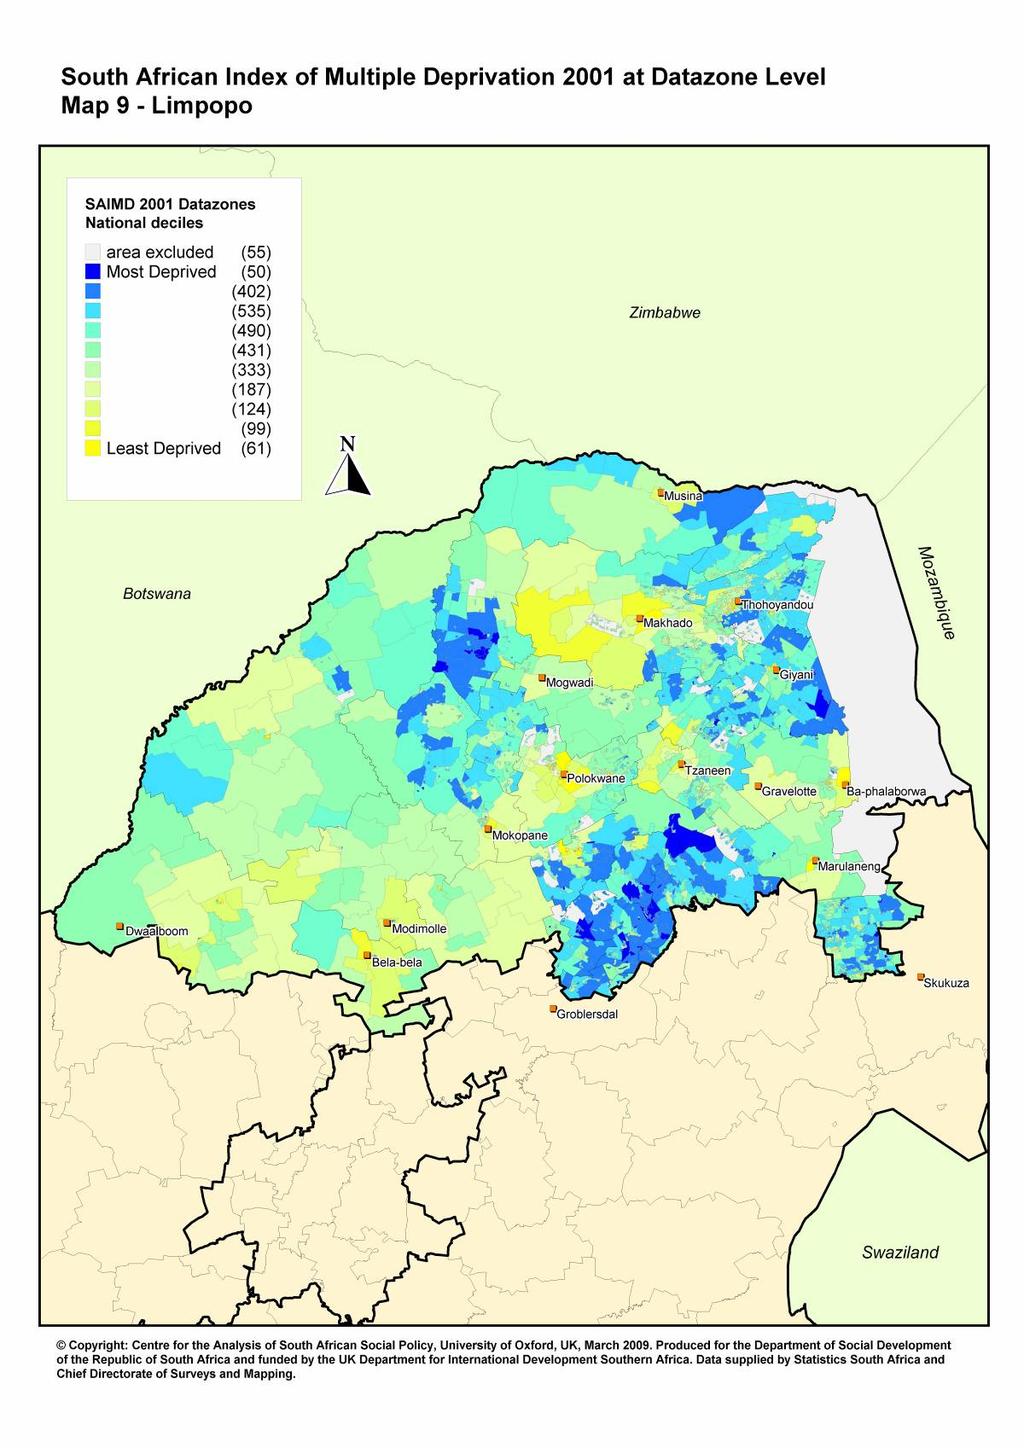
27 Table 4: The percentage of each province s datazones in the most deprived decile and the most deprived quintile of the SAIMD N datazones N in 10% most deprived N in 20% most deprived % in 10% most deprived % in 20% most deprived Western Cape Eastern Cape Northern Cape Free State KwaZulu-Natal North West Province Gauteng Mpumalanga Limpopo Nearly a third of the datazones in the Eastern Cape are in the most deprived 10% (decile) of deprivation nationally whist just over a fifth (21.3%) of KwaZulu-Natal s datazones are similarly deprived. There are no datazones in the Western Cape or Northern Cape in the most deprived decile and only two datazones in Gauteng in this decile. If we focus on the most deprived 20% we see that nearly half (49.8%) of the Eastern Cape s datazones are in the most deprived quintile whilst for KwaZulu- Natal the figure is 37%. These are followed by Limpopo (16.7%), North West (15.1%) and Mpumalnga (12.2%). The geography of deprivation across South Africa is now presented for the SAIMD Because of the relatively small size of datazones, the results are presented in nine maps, one for each province. These maps (Maps 1, 2, 3, 4, 5, 6, 7, 8 and 9), are located at the end of this section. The datazones have been divided into national (i.e. South Africa wide) deciles of deprivation - ten equal groups. On the map, the thin dark grey lines depict the datazone boundaries, the thicker black lines are the municipality boundaries, and the thickest black lines are the province boundaries. The most deprived 10% of datazones nationally are shaded in dark blue and the least deprived 10% of datazones are shaded in bright yellow (areas left white are datazones that were excluded for the reasons outlined in Section 3). If we consider the most deprived datazones (the blue areas) these overwhelmingly map onto the former homeland areas. In the Eastern Cape (Map 2) both the former Transkei and Ciskei are prominent. In KwaZulu-Natal (Map 5) 25
28 deprivation is predominant in the areas comprising the former KwaZulu homeland. In North West province (Map 6) deprivation is most prominent in the former Boputhatswana homeland. This concentration of poverty in the former homelands is also evident in Limpopo (Map 9), Mpumalanga (Map 8) and the Free State (Map 4). On the other hand relatively little of the most severe deprivation is present in Gauteng (Map 7) or the Western Cape (Map 1). However, the strength of the datazone geography is that pockets of deprivation can be picked up in otherwise affluent areas. So for example, taking Gauteng (Map 7), and considering the City of Johannesburg pockets of deprivation are apparent in parts of Soweto, Lenasia, and Orange Farm. Similarly within the City of Cape Town (Map 1), pockets of deprivation are apparent in Langa, Nyanga Crossroads, Imizamo Yethu, Masiphumelele and Khayelitsha. 26

29 27
30 28
31 29
32 30
33 31

34 32
35 33

36 34
37 35
38 Appendix 1: Indicators used in the SAIMD 2001 This Appendix gives further details of the indicators that were used in the SAIMD All indicators were derived from the 2001 Census. Information on the Census question used and the responses (codes) selected to define a person as deprived is provided below. All numerators and denominators exclude people living in institutions. For all domains apart from the Health Deprivation Domain, the score was calculated as a simple rate 9 : i.e. the percentage of people experiencing deprivation on one or more of the indicators in that domain. Income and Material Deprivation Domain Numerator Number of people living in a household that has a household income (need-adjusted using the modified OECD equivalence scale) that is below 40% of the mean equivalent household income The Census question P-22 ( What is the income category that best describes the gross income of (this person) before tax? ) was used to calculate a household income. A household equivalent income was calculated using this household income, a modified OECD equivalence scale, and Census question P-02 ( What is (the person s) date of birth and age in completed years? ). The cut-off used was below 40% mean household equivalent income derived from the IES 2000 and adjusted using the CPI. Further details of the equivalence scale used (and sensitivity testing of other equivalence scales) are given in the Technical Report. Number of people living in a household without a refrigerator This indicator used Census question H-29 ( Does the household have any of the following (in working condition): radio, television, computer, refrigerator, telephone in the dwelling, cell-phone? ). People were selected who lived in a household without a refrigerator (code 2). Number of people living in a household with neither a television nor a radio This indicator used Census question H-29 ( Does the household have any of the following (in working condition): radio, television, computer, refrigerator, telephone in the dwelling, cell-phone? ). People were selected who lived in a household with neither a radio nor a television (code 2 for both radio and television). 9 Adjusted using shrinkage estimation see Methodology section 36
A Diagnostic Evaluation of Poverty and Relative Deprivation at small area level for the Eastern Cape Province
 PSPPD II a partnership between the Presidency, the Republic of South Africa and the European Union Service Contract No. DCI AFS/2013 333 292 PROVISION OF PROJECT MANAGEMENT CONSULTANCY AND TECHNICAL ASSISTANCE
Multiple Deprivation and Income Poverty at Small Area Level in South Africa in Michael Noble, Wanga Zembe, Gemma Wright and David Avenell
 Multiple Deprivation and Income Poverty at Small Area Level in South Africa in 2011 Michael Noble, Wanga Zembe, Gemma Wright and David Avenell 2013 Suggested citation: Noble, M., Zembe, W., Wright, G.,
Indices of Deprivation
 DEPARTMENT OF SOCIAL POLICY AND INTERVENTION Indices of Deprivation Mapping the spatial distribution of multiple deprivation at small area level and their uses for targeting area-based regeneration policies
Datazone level Namibian Index of Mul ple Depriva on Empowered lives. Resilient nations. Kunene Report
 Datazone level Namibian Index of Mul ple Depriva on 2001 Empowered lives. Resilient nations. Kunene Report Disclaimer This Report is an independent publication commissioned by the United Nations Development
Datazone level Namibian Index of Mul ple Depriva on Empowered lives. Resilient nations. Oshana Report
 Datazone level Namibian Index of Mul ple Depriva on 2001 Empowered lives. Resilient nations. Oshana Report Disclaimer This Report is an independent publication commissioned by the United Nations Development
Neighbourhoods. The English Indices of Deprivation Bradford District. Neighbourhoods. Statistical Release. June 2011.
 Neighbourhoods Statistical Release The English Indices of Deprivation 2010 Bradford District About this release This release provides an overview of the findings of the English Indices of Deprivation 2010
Labour. Labour market dynamics in South Africa, statistics STATS SA STATISTICS SOUTH AFRICA
 Labour statistics Labour market dynamics in South Africa, 2017 STATS SA STATISTICS SOUTH AFRICA Labour Market Dynamics in South Africa 2017 Report No. 02-11-02 (2017) Risenga Maluleke Statistician-General
Datazone level Namibian Index of Mul ple Depriva on Empowered lives. Resilient nations. Omusa Region
 Datazone level Namibian Index of Mul ple Depriva on 2001 Empowered lives. Resilient nations. Omusa Region Disclaimer This Report is an independent publication commissioned by the United Nations Development
Poverty: Analysis of the NIDS Wave 1 Dataset
 Poverty: Analysis of the NIDS Wave 1 Dataset Discussion Paper no. 13 Jonathan Argent Graduate Student, University of Cape Town jtargent@gmail.com Arden Finn Graduate student, University of Cape Town ardenfinn@gmail.com
Scottish Indices of Multiple Deprivation (SIMD)
") Scottish Indices of Multiple Deprivation (SIMD) The dataset for the Lothian NHS Board Public Health Annual Report 2004 uses the Scottish Indices of Multiple Deprivation (SIMD). These indices are the most
Scottish Indices of Multiple Deprivation (SIMD) The dataset for the Lothian NHS Board Public Health Annual Report 2004 uses the Scottish Indices of Multiple Deprivation (SIMD). These indices are the most
INDICATORS OF POVERTY AND SOCIAL EXCLUSION IN RURAL ENGLAND: 2009
 INDICATORS OF POVERTY AND SOCIAL EXCLUSION IN RURAL ENGLAND: 2009 A Report for the Commission for Rural Communities Guy Palmer The Poverty Site www.poverty.org.uk INDICATORS OF POVERTY AND SOCIAL EXCLUSION
South African Baseline Study on Financial Literacy
 Regional Dissemination Conference on Building Financial Capability South African Baseline Study on Financial Literacy Lyndwill Clarke Head: Consumer Education 30-31 January 2013 Nairobi, Kenya Outline
Universe and Sample. Page 26. Universe. Population Table 1 Sub-populations excluded
 Universe and Sample Universe The universe from which the SAARF AMPS 2008 (and previous years) sample was drawn, comprised adults aged 16 years or older resident in private households, or hostels, residential
REVIEW OF THE LOCAL GOVERNMENT EQUITABLE SHARE FORMULA
 T In partnership with: REVIEW OF THE LOCAL GOVERNMENT EQUITABLE SHARE FORMULA Parliament 19 February 2013 INTRODUCING THE NEW FORMULA Structure of the presentation 2 Background to the formula and review
Healthy life expectancy: key points (new data this update)
") NOTE: This is an Archive Report of the Healthy Life Expectancy web pages on the ScotPHO website, as at 16 December 2014 Links within this report have been disabled to avoid users accessing out-of-date
NOTE: This is an Archive Report of the Healthy Life Expectancy web pages on the ScotPHO website, as at 16 December 2014 Links within this report have been disabled to avoid users accessing out-of-date
Intelligence Briefing English Indices of Deprivation 2010 A London perspective. June 2011
 Intelligence Briefing 2011-06 June 2011 English Indices of Deprivation 2010 A London perspective For more information please contact: Rachel Leeser Intelligence Unit Greater London Authority City Hall
ADDRESSING PUBLIC PRIVATE SECTOR INEQUALITIES PROFESSOR EMERITUS YOSUF VERIAVA
 ADDRESSING PUBLIC PRIVATE SECTOR INEQUALITIES PROFESSOR EMERITUS YOSUF VERIAVA HEALTH INEQUALITY AND INEQUITY Disparity: Is there a difference in the health status rates between population groups? Inequality:
GHS Series Volume I. Social Grants
 Statistical release GHS Series Volume I Social Grants In-depth analysis of the General Household Survey data 2003 2007 Embargoed until: 23 July 2009 12:00 Enquiries: Forthcoming issue: Expected release
General household survey July 2003
 Statistical release P0318 General household survey July 2003 Co-operation between Statistics South Africa (Stats SA), the citizens of the country, the private sector and government institutions is essential
Health Inequalities: Where do our deprived people live in Dumfries & Galloway?
 Health Inequalities: Where do our deprived people live in Dumfries & Galloway? What is meant by deprivation? Deprivation is a concept that overlaps with, but is not synonymous with, poverty. A definition
Labour force survey. September Embargoed until: 29 March :30
 Statistical release P0210 Labour force survey September 2006 Embargoed until: 29 March 2007 12:30 Enquiries: Forthcoming issue: Expected release date User Information Services LFS March 2007 September
The use of linked administrative data to tackle non response and attrition in longitudinal studies
 The use of linked administrative data to tackle non response and attrition in longitudinal studies Andrew Ledger & James Halse Department for Children, Schools & Families (UK) Andrew.Ledger@dcsf.gsi.gov.uk
Focus on Household and Economic Statistics. Insights from Stats SA publications. Nthambeleni Mukwevho Stats SA
 Focus on Household and Economic Statistics Insights from Stats SA publications Nthambeleni Mukwevho Stats SA South African Population Results from CS 2016 Source: CS 2016 EC Household Results from CS 2016
CONSUMPTION POVERTY IN THE REPUBLIC OF KOSOVO April 2017
 CONSUMPTION POVERTY IN THE REPUBLIC OF KOSOVO 2012-2015 April 2017 The World Bank Europe and Central Asia Region Poverty Reduction and Economic Management Unit www.worldbank.org Kosovo Agency of Statistics
Downloads from this web forum are for private, non-commercial use only. Consult the copyright and media usage guidelines on
 Econ 3x3 www.econ3x3.org A web forum for accessible policy-relevant research and expert commentaries on unemployment and employment, income distribution and inclusive growth in South Africa Downloads from
Income and Non-Income Inequality in Post- Apartheid South Africa: What are the Drivers and Possible Policy Interventions?
 Income and Non-Income Inequality in Post- Apartheid South Africa: What are the Drivers and Possible Policy Interventions? Haroon Bhorat Carlene van der Westhuizen Toughedah Jacobs Haroon.Bhorat@uct.ac.za
The Experience of Poverty in South Africa: A Summary of Afrobarometer Indicators,
 The Experience of Poverty in South Africa: A Summary of Afrobarometer Indicators, 2000-2011 January 2013 The Afrobarometer is a comparative series of public attitude surveys, covering up to 35 African
Deprivation in Rochdale Borough Indices of Deprivation 2004 (Revised)
") Deprivation in Rochdale Borough Indices of Deprivation 2004 (Revised) Summary New Indices of Deprivation (ID 2004) were published on 28 April 2004, based on data from 2001. These were subsequently revised
Deprivation in Rochdale Borough Indices of Deprivation 2004 (Revised) Summary New Indices of Deprivation (ID 2004) were published on 28 April 2004, based on data from 2001. These were subsequently revised
Quarterly Labour Force Survey
 Statistical release P0211 Quarterly Labour Force Survey Quarter 3, Embargoed until: 01 November 11:30 Enquiries: Forthcoming issue: Expected release date User Information Services Quarter 4, February 2012
Dundee City Electoral Wards Poverty Profile
 Dundee City Electoral Wards Poverty Profile 2013 Produced by: Tony Jenkins Senior Planning Officer (Information & Research) Information & Research Team Chief Executive Department Dundee City Council email:
Who cares about regional data?
 Who cares about regional data? Development happens somewhere - in a spatial locality. Aggregations hide [important] variety in the data Within South Africa: KwaZulu-Natal is not like the Western Cape Within
IMPACT OF GOVERNMENT PROGRAMMES USING ADMINISTRATIVE DATA SETS SOCIAL ASSISTANCE GRANTS
 IMPACT OF GOVERNMENT PROGRAMMES USING ADMINISTRATIVE DATA SETS SOCIAL ASSISTANCE GRANTS Project 6.2 of the Ten Year Review Research Programme Second draft, 19 June 2003 Dr Ingrid Woolard 1 Introduction
Copies can be obtained from the:
 Published by the Stationery Office, Dublin, Ireland. Copies can be obtained from the: Central Statistics Office, Information Section, Skehard Road, Cork, Government Publications Sales Office, Sun Alliance
Poverty and Social Exclusion in the UK. Main PSE UK Survey Sampling Frame
 UK Data Archive Study Number 7879 - Poverty and Social Exclusion Living Standards Survey, 2012 Poverty and Social Exclusion in the UK Working Paper Methods Series No. 21 Main PSE UK Survey Sampling Frame
Interaction of household income, consumption and wealth - statistics on main results
 Interaction of household income, consumption and wealth - statistics on main results Statistics Explained Data extracted in June 2017. Most recent data: Further Eurostat information, Main tables and Database.
Hands-on. Learning Brief 45. Learning from our implementing partners. University of Cape Town
 EARLY CHILDHOOD DEVELOPMENT Hands-on Learning from our implementing partners University of Cape Town Are children s rights prioritised at a time of budget cuts? Assessing the adequacy of the 2013/14 social
Impact Evaluation of Savings Groups and Stokvels in South Africa
 Impact Evaluation of Savings Groups and Stokvels in South Africa The economic and social value of group-based financial inclusion summary October 2018 SaveAct 123 Jabu Ndlovu Street, Pietermaritzburg,
Economic standard of living
 Home Previous Reports Links Downloads Contacts The Social Report 2002 te purongo oranga tangata 2002 Introduction Health Knowledge and Skills Safety and Security Paid Work Human Rights Culture and Identity
Stockport (Local Authority)
") Population Brinnington & Central (Ward) All Usual Residents (Count) 14999 Area (Hectares) (Count) 527 Females (Count) 7316 Females (Percentage) 48.8 Males (Count) 7683 Males (Percentage) 51.2 Dataset:
Population Brinnington & Central (Ward) All Usual Residents (Count) 14999 Area (Hectares) (Count) 527 Females (Count) 7316 Females (Percentage) 48.8 Males (Count) 7683 Males (Percentage) 51.2 Dataset:
J. D. Kennedy, M.C.I.P., R.P.P. C. A. Tyrrell, M.C.I.P., R.P.P. Associate
 MARSHALL MACKLIN MONAGHAN LIMITED 80 COMMERCE VALLEY DR. EAST THORNHILL, ONTARIO L3T 7N4 TEL: (905) 882-1100 FAX: (905) 882-0055 EMAIL: mmm@mmm.ca WEB SITE: www.mmm.ca January 6, 2004 File No. 14.02138.01.P01
Preliminary data for the Well-being Index showed an annual growth of 3.8% for 2017
 7 November 2018 Well-being Index - Preliminary data for the Well-being Index showed an annual growth of 3.8% for The Portuguese Well-being Index has positively progressed between and and declined in. It
BUDGET SOUTH AFRICAN BUDGET: THE MACRO PICTURE. Key messages
 BUDGET CHILDREN AND THE SOUTH AFRICAN BUDGET: THE MACRO PICTURE UNICEF/Pirozzi Key messages The nearly 2 million children in South Africa account for more than a third of the country s population. South
Snapshot: Anglicare NSW South, West & ACT - Central West NSW
 Snapshot: Anglicare NSW South, West & ACT - Central West NSW Introduction The Central West, Far West and Orana comprise a large regional and rural area of NSW. Bathurst, Orange, Dubbo and Broken Hill are
Poverty and income inequality in Scotland:
 A National Statistics Publication for Scotland Poverty and income inequality in Scotland: 2008-09 20 May 2010 This publication presents annual estimates of the proportion and number of children, working
Quarterly Labour Force Survey
 Statistical release Quarterly Labour Force Survey Quarter 4: Embargoed until: 14 February 2017 10:30 ENQUIRIES: FORTHCOMING ISSUE: EXPECTED RELEASE DATE User Information Services Quarter 1:2017 May 2017
Provincial Review 2016: KwaZulu-Natal
 Provincial Review 2016: KwaZulu-Natal KwaZulu-Natal has a strong role in South Africa s manufacturing and agriculture, and has its largest port and main North-South freight corridor. Its manufacturing
Area Analysis of Child Deprivation 2014 (WIMD Indicators 2014) 1
 1") Area Analysis of Child Deprivation 2014 (WIMD Indicators 2014) 1 This Statistical Article provides an Area Analysis of Child Deprivation in Wales, using some of the indicators underlying the Welsh Index
Area Analysis of Child Deprivation 2014 (WIMD Indicators 2014) 1 This Statistical Article provides an Area Analysis of Child Deprivation in Wales, using some of the indicators underlying the Welsh Index
How s Life in Israel?
 October 2015 How s Life in Israel? Additional information, including the data used in this country note, can be found at: www.oecd.org/statistics/hows-life-2015-country-notes-data.xlsx HOW S LIFE IN ISRAEL
Downloads from this web forum are for private, non-commercial use only. Consult the copyright and media usage guidelines on
 Econ 3x3 www.econ3x3.org A web forum for accessible policy-relevant research and expert commentaries on unemployment and employment, income distribution and inclusive growth in South Africa Downloads from
Women in the South African Labour Market
 Women in the South African Labour Market 1995-2005 Carlene van der Westhuizen Sumayya Goga Morné Oosthuizen Carlene.VanDerWesthuizen@uct.ac.za Development Policy Research Unit DPRU Working Paper 07/118
LABOUR MARKET PROVINCIAL 54.3 % 45.7 % Unemployed Discouraged work-seekers % 71.4 % QUARTERLY DATA SERIES
 QUARTERLY DATA SERIES ISSUE 6 October 2016 PROVINCIAL LABOUR MARKET introduction introduction The Eastern Cape Quarterly Review of Labour Markets is a statistical release compiled by the Eastern Cape Socio
Poverty and livelihoods in the City Issue 4 December 2016
 Poverty and livelihoods in the City Issue 4 December 2016 What is poverty and how do we measure it? Poverty is a complex issue that manifests itself in economic, social and political ways No single definition
Quarterly Labour Force Survey
 Statistical release Quarterly Labour Force Survey Quarter 1, Embargoed until: 08 May 11:30 Enquiries: Forthcoming issue: Expected release date User Information Services Quarter 2, July Tel: (012) 310 8600/4892/8390
Analysing family circumstances and education. Increasing our understanding of ordinary working families
 Analysing family circumstances and education Increasing our understanding of ordinary working families April 2017 Contents Table of figures 3 Summary 5 Testing the data linking 6 The analysis so far 7
SUMMARY OF THE CHILDREN S BILL COSTING
 Centre for Actuarial Research (CARe) SUMMARY OF THE CHILDREN S BILL COSTING Written by Debbie Budlender Children s Institute and Centre for Actuarial Research, University of Cape Town November 2006 Why
Michelle Jones, Stephanie Tipping
 Economy READER INFORMATION Need Identified Lead Author Date completed Director approved Economy Michelle Jones, Stephanie Tipping To be signed off To be signed off Key needs Economic inactivity The employment
Experian Consumer Credit Default Index October 2017
 Experian Consumer Credit Default Index October 2017 Index Page 1 Default Index Overview What is measures? Default Index Overview Experian Composite Consumer Default Index Page 2 Default Index Overview
Estimating a poverty line: An application to free basic municipal services in South Africa
 Estimating a poverty line: An application to free basic municipal services in South Africa Development Policy Research Unit Haroon Bhorat Development Policy Research Unit haroon.bhorat@uct.ac.za Morne
1. Introduction 2. DOMESTIC ECONOMIC DEVELOPMENTS. 2.1 Economic performance in South Africa ISBN: SECOND QUARTER 2013
 November 2013 ISBN: 978-1-920493-99-8 SECOND QUARTER 2013 1. Introduction The Quarterly Economic Update for the second quarter of 2013 (2Q2013) has been expanded and contains a range of new indicators.
DECEMBER 2006 INFORMING CHANGE. Monitoring poverty and social exclusion in Scotland 2006
 DECEMBER 2006 findings INFORMING CHANGE Monitoring poverty and social exclusion in Scotland 2006 The New Policy Institute has produced its 2006 edition of indicators of poverty and social exclusion in
How s Life in South Africa?
 How s Life in South Africa? November 2017 The figure below shows South Africa s relative strengths and weaknesses in well-being, with reference to both the OECD average and the average outcomes of the
Statistical release P0141
 Statistical release Consumer Price Index June 2015 Embargoed until: 22 July 2015 10:00 Enquiries: Forthcoming issue: Expected release date Marietjie Bennett / Anita Voges July 2015 19 August 2015 (012)
POVERTY IN AUSTRALIA: NEW ESTIMATES AND RECENT TRENDS RESEARCH METHODOLOGY FOR THE 2016 REPORT
 POVERTY IN AUSTRALIA: NEW ESTIMATES AND RECENT TRENDS RESEARCH METHODOLOGY FOR THE 2016 REPORT Peter Saunders, Melissa Wong and Bruce Bradbury Social Policy Research Centre University of New South Wales
REPORT OF THE SELECT COMMITTEE ON FINANCE ON THE PROVINCIAL TREASURIES EXPENDITURE REVIEW FOR THE 2014/15 FINANCIAL YEAR, DATED 14 OCTOBER 2015
 REPORT OF THE SELECT COMMITTEE ON FINANCE ON THE PROVINCIAL TREASURIES EXPENDITURE REVIEW FOR THE 2014/15 FINANCIAL YEAR, DATED 14 OCTOBER 2015 1. Introduction and Background The Select Committee on Finance
BANKWEST CURTIN ECONOMICS CENTRE INEQUALITY IN LATER LIFE. The superannuation effect. Helen Hodgson, Alan Tapper and Ha Nguyen
 BANKWEST CURTIN ECONOMICS CENTRE INEQUALITY IN LATER LIFE The superannuation effect Helen Hodgson, Alan Tapper and Ha Nguyen BCEC Research Report No. 11/18 March 2018 About the Centre The Bankwest Curtin
Understanding household income poverty at small area level
 Understanding household income poverty at small area level Robert Fry, Office for National Statistics Abstract A new ONS data release provides experimental estimates of the proportion of households in
Table 1 sets out national accounts information from 1994 to 2001 and includes the consumer price index and the population for these years.
 WHAT HAPPENED TO THE DISTRIBUTION OF INCOME IN SOUTH AFRICA BETWEEN 1995 AND 2001? Charles Simkins University of the Witwatersrand 22 November 2004 He read each wound, each weakness clear; And struck his
Population and Household Forecasts 2017 Methodology and Summary Report
 Prepared for: South Staffs Water Prepared by: David Harris Date issued: 22/9/17 (Release 1.0) Population and Household Forecasts 2017 Methodology and Summary Report Table of Contents 1. Summary... 3 2.
ANNUAL REPORT for the Child Poverty Strategy for Scotland
 ANNUAL REPORT for the Child Poverty Strategy for Scotland 2016 ANNUAL REPORT FOR THE CHILD POVERTY STRATEGY FOR SCOTLAND 2016 1 CONTENTS MINISTERIAL FOREWORD 02 1. INTRODUCTION 04 2. CHILD POVERTY IN SCOTLAND
Horseshoe - 20 mins Drive, Lavendon, MK464HA Understanding Demographics
 Horseshoe - 20 mins Drive, Lavendon, MK464HA Understanding Demographics Describing Horseshoe - 20 mins Drive, Lavendon, MK464HA Minute Drive Time (Night-time) In Relation To United Kingdom Package Contents
Economic Standard of Living
 DESIRED OUTCOMES New Zealand is a prosperous society, reflecting the value of both paid and unpaid work. All people have access to adequate incomes and decent, affordable housing that meets their needs.
LINKING POPULATION DYNAMICS TO MUNICIPAL REVENUE ALLOCATION IN SOUTH AFRICAN CITIES
 LINKING POPULATION DYNAMICS TO MUNICIPAL REVENUE ALLOCATION IN SOUTH AFRICAN CITIES SACN Programme: Well Governed Cities Document Type: Report Document Status: Final Date: March 2017 Joburg Metro Building,
LABOUR MARKET PROVINCIAL 51.6 % 48.4 % Unemployed Discouraged work-seekers % 71.8 % QUARTERLY DATA SERIES
 QUARTERLY DATA SERIES ISSUE 7 November 2016 PROVINCIAL LABOUR MARKET introduction introduction The Eastern Cape Quarterly Review of Labour Markets is a statistical release compiled by the Eastern Cape
A Facilitator Of Incremental Housing Finance RURAL HOUSING LOAN FUND BROCHURE
 A Facilitator Of Incremental Housing Finance RURAL HOUSING LOAN FUND BROCHURE WHAT IS RURAL HOUSING LOAN FUND Rural Housing Loan Fund (RHLF) is one of the Human Settlements Development Finance Institutions
P R E S S R E L E A S E Risk of poverty
 HELLENIC REPUBLIC HELLENIC STATISTICAL AUTHORITY Piraeus, 23 / 6 / 2017 P R E S S R E L E A S E Risk of poverty 2016 SURVEY ON INCOME AND LIVING CONDITIONS (Income reference period 2015) The Hellenic Statistical
MONITORING POVERTY AND SOCIAL EXCLUSION IN SCOTLAND 2015
 MONITORING POVERTY AND SOCIAL EXCLUSION IN SCOTLAND 2015 This study is the seventh in a series of reports monitoring poverty and social exclusion in Scotland since 2002. The analysis combines evidence
LINKING POPULATION DYNAMICS TO MUNICIPAL REVENUE ALLOCATION IN CITY OF CAPE TOWN
 LINKING POPULATION DYNAMICS TO MUNICIPAL REVENUE ALLOCATION IN CITY OF CAPE TOWN SACN Programme: Well Governed Cities Document Type: Report Document Status: Final Date: March 2017 Joburg Metro Building,
Relative regional consumer price levels of goods and services, UK: 2016
 Article Relative regional consumer price levels of goods and services, UK: 2016 UK relative regional consumer price levels (RRCPLs) of goods and services for 2016. They provide an indication of a region's
Multiple deprivation in help-seeking UK veterans
 Multiple deprivation in help-seeking UK veterans A report compiled by Combat Stress Dr Dominic Murphy, Emily Palmer & Rachel Ashwick Multiple Deprivations in Help-Seeking UK Veterans Contents Executive
Measuring asset ownership and entrepreneurship from a gender perspective
 Measuring asset ownership and entrepreneurship from a gender perspective EDGE pilot survey Presented by Babalwa Nyangintsimbi 25 July 2018- Addis Ababa Introduction EDGE aimed to undertake methodological
Disadvantage in the ACT
 Disadvantage in the ACT Report for ACT Anti-Poverty Week October 2013 Disadvantage in the ACT Report for ACT Anti-Poverty Week Prepared by Associate Professor Robert Tanton, Dr Yogi Vidyattama and Dr Itismita
Welfare Shifts in the Post-Apartheid South Africa: A Comprehensive Measurement of Changes
 Welfare Shifts in the Post-Apartheid South Africa: A Comprehensive Measurement of Changes Haroon Bhorat Carlene van der Westhuizen Sumayya Goga Haroon.Bhorat@uct.ac.za Development Policy Research Unit
Findings of the 2018 HILDA Statistical Report
 RESEARCH PAPER SERIES, 2018 19 31 JULY 2018 ISSN 2203-5249 Findings of the 2018 HILDA Statistical Report Geoff Gilfillan Statistics and Mapping Introduction The results of the 2018 Household, Income and
Knowledge is too important to leave in the hands of the bosses INFLATION MONITOR MARCH 2018
 Knowledge is too important to leave in the hands of the bosses INFLATION MONITOR MARCH 2018 1 The Consumer Price Index (CPI) declined to 3.8% in March 2018 The term inflation means a sustained increase
Any changes in media consumption may or may not be an indication of shifting performance in the marketplace.
 MEDIA RELEASE 4 November 2013 SAARF RAMS NOV 2013 A new benchmark for radio listening SAARF RAMS Nov 2013 establishes a new trend line for radio listening data in South Africa, following the inclusion
Quarterly Labour Force Survey
 Statistical release Quarterly Labour Force Survey Quarter 1, 2014 Embargoed until: 05 May 2014 11:30 Enquiries: Forthcoming issue: Expected release date User Information Services Quarter 2, 2014 July 2014
Methods and Data for Developing Coordinated Population Forecasts
 Methods and Data for Developing Coordinated Population Forecasts Prepared by Population Research Center College of Urban and Public Affairs Portland State University March 2017 Table of Contents Introduction...
Quarterly Labour Force Survey
 Statistical release P0211 Quarterly Labour Force Survey Quarter 2, 2014 Embargoed until: 29 July 2014 13:00 Enquiries: Forthcoming issue: Expected release date User Information Services Quarter 3, 2014
Changes to work and income around state pension age
 Changes to work and income around state pension age Analysis of the English Longitudinal Study of Ageing Authors: Jenny Chanfreau, Matt Barnes and Carl Cullinane Date: December 2013 Prepared for: Age UK
Financial Literacy Report 2015 Summary Rands and Sense: Financial Literacy in South Africa
 Financial Literacy Report 2015 Summary Rands and Sense: Financial Literacy in South Africa OVERVIEW OF THE STUDY Background. As part of on-going efforts by the FSB to better understand, monitor and promote
Monitoring poverty and social exclusion
 Monitoring poverty and social exclusion The New Policy Institute has constructed the first set of indicators to present a wide view of poverty and social exclusion in Britain. Forty-six indicators show
Residential Property Indices. Date Published: August 2018
 Residential Property Indices Date Published: August 2018 National Inflation Current annual inflation rate is 3.79% and monthly is 0.26% Market Review As at the end of July 2018 the national house price
THE WELFARE MONITORING SURVEY SUMMARY
 THE WELFARE MONITORING SURVEY SUMMARY 2015 United Nations Children s Fund (UNICEF) November, 2016 UNICEF 9, Eristavi str. 9, UN House 0179, Tbilisi, Georgia Tel: 995 32 2 23 23 88, 2 25 11 30 e-mail:
An analysis of training expenditure in the Public Service sector
 March 2018 An analysis of training expenditure in the Public Service sector 1. Background and Introduction The Public Service sector in South Africa, comprised of the national and provincial government
Trends in Medical Schemes Contributions, Membership and Benefits
 COUNCIL FOR MEDICAL SCHEMES Number 2 of 2008 Prepared by the Office of the Registrar of Medical Schemes Trends in Medical Schemes Contributions, Membership and Benefits 2002 2006 May 2008 COUNCIL FOR MEDICAL
METHODOLOGICAL ISSUES IN POVERTY RESEARCH
 METHODOLOGICAL ISSUES IN POVERTY RESEARCH IMPACT OF CHOICE OF EQUIVALENCE SCALE ON INCOME INEQUALITY AND ON POVERTY MEASURES* Ödön ÉLTETÕ Éva HAVASI Review of Sociology Vol. 8 (2002) 2, 137 148 Central
How much rent do I pay myself?
 How much rent do I pay myself? Methods of estimating the value of imputed rental for the weights of the South African CPI Lee Everts and Patrick Kelly Statistics South Africa Ottawa Group Meeting Copenhagen
Residential Property Indices. Date Published: September 2018
 Residential Property Indices Date Published: September 2018 National Inflation Current annual inflation rate is 3.85% and monthly is 0.27% Market Review As at the end of August 2018 the national house
Dundee Partnership Fairness Strategy
 Dundee Partnership Fairness Strategy 2014 Electoral Ward Profile 1 2 Contents Page 1 Introduction 1 2 Poverty Definition 2 2.1 Scottish Index of Multiple Deprivation 2012 2 2.2 Benefit and Tax Credit Data
Consumer Price Index
 STATISTICAL RELEASE P0141 Consumer Price Index May 2017 Embargoed until: 21 June 2017 10:00 ENQUIRIES: FORTHCOMING ISSUE: EXPECTED RELEASE DATE Marietjie Bennett / June 2017 19 July 2017 Evashnie Govender