DeSoto Independent School District. Annual Financial Report For the Fiscal Year Ended June 30, 2018
|
|
|
- Ella Davis
- 5 years ago
- Views:
Transcription
1 DeSoto Independent School District Annual Financial Report For the Fiscal Year Ended June 30, 2018
2 This Page Intentionally Left Blank
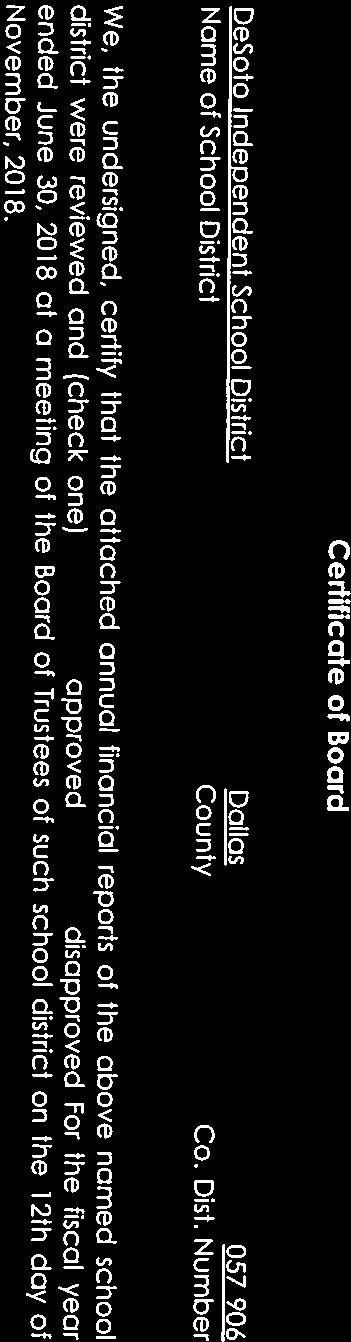
3 DeSoto Independent School District Annual Financial Report For the Fiscal Year Ended June 30, 2018 Table of Contents Continued Page Exhibit Certificate of Board... iii Independent Auditor's Report... 3 Management's Discussion and Analysis... 6 Basic Financial Statements Government-Wide Financial Statements: Statement of Net Position A-1 Statement of Activities B-1 Governmental Fund Financial Statements: Balance Sheet C-1 Reconciliation of the Governmental Funds Balance Sheet to the Statement of Net Position C-2 Statement of Revenues, Expenditures, and Changes in Fund Balance C-3 Reconciliation of the Governmental Funds Statement of Revenues, Expenditures, and Changes in Fund Balances to the Statement of Activities C-4 Proprietary Fund Financial Statements: Statement of Net Position D-1 Statement of Revenues, Expenses, and Changes in Fund Net Position D-2 Statement of Cash Flows D-3 Fiduciary Fund Financial Statements: Statement of Fiduciary Net Position E-1 Statement of Changes in Fiduciary Net Position E-2 Notes to the Basic Financial Statements Required Supplementary Information Budgetary Comparison Schedule General Fund G-1 Schedule of the District's Proportionate Share of the Net Pension Liability of a Cost-Sharing Multiple-Employer Pension Plan Teacher Retirement System of Texas G-2 Schedule of the District's Contributions to the Teacher Retirement System of Texas Pension Plan G-3 Schedule of the District's Proportionate Share of the Net OPEB Liability of a Cost-Sharing Multiple-Employer OPEB Plan Teacher Retirement System of Texas G-4 Schedule of the District's Contributions to the Teacher Retirement System of Texas OPEB Plan G-5 Notes to the Required Supplementary Information i
4 DeSoto Independent School District Annual Financial Report For the Fiscal Year Ended June 30, 2018 Table of Contents Continued Page Exhibit Supplementary Information Combining Statements Nonmajor Governmental Funds: Combining Balance Sheet H-1 Combining Statement of Revenues, Expenditures, and Changes in Fund Balances H-2 Required TEA Schedules: Schedule of Revenues, Expenditures, and Changes in Fund Balance Schedule of Delinquent Taxes Receivable J-1 Schedule of Revenues, Expenditures, and Changes in Fund Balance Budgetary Comparison Schedule Child Nutrition Program J-2 Schedule of Revenues, Expenditures, and Changes in Fund Balance Budgetary Comparison Schedule Debt Service Fund J-3 Overall Compliance and Internal Control Section Independent Auditor's Report on Internal Control over Financial Reporting and on Compliance and Other Matters Based on an Audit of Financial Statements Performed in Accordance with Government Auditing Standards Independent Auditor's Report on Compliance for Each Major Federal Program and on Internal Control over Compliance in Accordance with the Uniform Guidance Schedule of Findings and Questioned Costs Schedule of Expenditures of Federal Awards K-1 Notes to the Schedule of Expenditures of Federal Awards ii
5
6 This Page Intentionally Left Blank iv
7 Financial Section 1
8 This Page Intentionally Left Blank 2
9 Austin Conroe Dallas Fort Worth Houston Los Angeles Midland New York City San Antonio Independent Auditor s Report To the Board of Trustees DeSoto Independent School District DeSoto, Texas Report on the Financial Statements We have audited the accompanying financial statements of the governmental activities, each major fund, and the aggregate remaining fund information of DeSoto Independent School District (the District), as of and for the year ended June 30, 2018, and the related notes to the financial statements, which collectively comprise the District's basic financial statements as listed in the table of contents. Management's Responsibility for the Financial Statements Management is responsible for the preparation and fair presentation of these financial statements in accordance with accounting principles generally accepted in the United States of America. This includes the design, implementation, and maintenance of internal control relevant to the preparation and fair presentation of financial statements that are free from material misstatement, whether due to fraud or error. Auditor's Responsibility Our responsibility is to express opinions on these financial statements based on our audit. We conducted our audit in accordance with auditing standards generally accepted in the United States of America and the standards applicable to financial audits contained in Government Auditing Standard issued by the Comptroller General of the United States. Those standards require that we plan and perform the audit to obtain reasonable assurance about whether the financial statements are free from material misstatement. An audit involves performing procedures to obtain audit evidence about the amounts and disclosures in the financial statements. The procedures selected depend on the auditor's judgment, including the assessment of the risks of material misstatement of the financial statements, whether due to fraud or error. In making those risk assessments, the auditor considers internal control relevant to the entity's preparation and fair presentation of the financial statements in order to design audit procedures that are appropriate in the circumstances, but not for the purpose of expressing an opinion on the effectiveness of the District's internal control. Accordingly, we express no such opinion. An audit also includes evaluating the appropriateness of accounting policies used and the reasonableness of significant accounting estimates made by management, as well as evaluating the overall presentation of the financial statements. We believe that the audit evidence we have obtained is sufficient and appropriate to provide a basis for our audit opinions. Weaver and Tidwell, L.L.P North Field Street, Suite 1000 Dallas, Texas Main: Fax: CPAs AND ADVISORS WEAVER.COM
10 The Board of Directors DeSoto Independent School District Opinions In our opinion, the financial statements referred to above present fairly, in all material respects, the respective financial position of the governmental activities, each major fund and the aggregate remaining fund information of the District as of June 30, 2018, and the respective changes in financial position and, where applicable, cash flows thereof for the year then ended in accordance with accounting principles generally accepted in the United States of America. Emphasis of Matter Change in Accounting Principle As discussed in Note 1.C. and Note 9 to the basic financial statements, the District implemented Governmental Accounting Standards Board (GASB) Statement No. 75, Accounting and Financial Reporting for Postemployment Benefits Other Than Pensions. Beginning net position has been restated to reflect the change in accounting principle resulting from this statement. Our opinions are not modified with respect to this matter. Other Matters Required Supplementary Information Accounting principles generally accepted in the United States of America require that the management's discussion and analysis and the required supplementary information, as listed in the table of contents, be presented to supplement the basic financial statements. Such information, although not a part of the basic financial statements, is required by the Governmental Accounting Standards Board who considers it to be an essential part of financial reporting for placing the basic financial statements in an appropriate operational, economic, or historical context. We have applied certain limited procedures to the required supplementary information in accordance with auditing standards generally accepted in the United States of America, which consisted of inquiries of management about the methods of preparing the information and comparing the information for consistency with management's responses to our inquiries, the basic financial statements, and other knowledge we obtained during our audit of the basic financial statements. We do not express an opinion or provide any assurance on the information because the limited procedures do not provide us with sufficient evidence to express an opinion or provide any assurance. Supplementary Information Our audit was conducted for the purpose of forming opinions on the financial statements that collectively comprise the District's basic financial statements. The supplementary information and Schedule of Required Responses to Selected School FIRST Indicators, as listed in the table of contents, are presented for purposes of additional analysis and are not a required part of the basic financial statements. The schedule of expenditures of federal awards is presented for purposes of additional analysis as required by the audit requirements of Title 2 U.S. Code of Federal Regulations (CFR) Part 200, Uniform Administrative Requirements, Cost Principles, and Audit Requirements for Federal Awards (Uniform Guidance) and is also not a required part of the basic financial statements. The supplementary information and the schedule of expenditures of federal awards are the responsibility of management and were derived from and relate directly to the underlying accounting and other records used to prepare the basic financial statements. Such information has been subjected to the auditing procedures applied in the audit of the basic financial statements and certain additional procedures, including comparing and reconciling such information directly to the underlying accounting and other records used to prepare the basic financial statements or to the basic financial statements themselves, and other additional procedures in accordance with auditing standards 4
11 The Board of Directors DeSoto Independent School District generally accepted in the United States of America. In our opinion, the supplementary information and the schedule of expenditures of federal awards are fairly stated in all material respects in relation to the basic financial statements as a whole. The Schedule of Required Responses to Selected School FIRST Indicators has not been subjected to the auditing procedures applied in the audit of the basic financial statements, and accordingly, we do not express an opinion or provide any assurance on it. Other Reporting Required by Government Auditing Standards In accordance with Government Auditing Standards, we have also issued our report dated November 12, 2018 on our consideration of the District's internal control over financial reporting and on our test of its compliance with certain provisions of laws, regulations, contracts, and grant agreements and other matters. The purpose of that report is solely to describe the scope of our testing of internal control over financial reporting and compliance and the results of that testing, and not to provide an opinion on the effectiveness of the District s internal control over financial reporting or on compliance. That report is an integral part of an audit performed in accordance with Government Auditing Standards in considering the District's internal control over financial reporting and compliance. WEAVER AND TIDWELL, L.L.P. Dallas, Texas November 12,
12 Management s Discussion and Analysis As management of DeSoto Independent School District (the District), we offer readers of the District's financial statement this narrative overview and analysis of the financial activities of the District for the fiscal year ended June 30, Please read this narrative in conjunction with the independent auditors' report on page 3, and the District's Basic Financial Statements that begin on page 14. Financial Highlights The District's total net position at June 30, 2018 was ($70,078,126) (negative net position). Of this amount, ($109,028,930), represents negative unrestricted net position. In The District's total net position increased by $5,052,308 during the fiscal year prior to the restatement for the change in accounting principle. As of June 30, 2018, the District's governmental funds reported combined ending fund balances of $18,516,837. Approximately 71% of this total amount, $13,201,816, is unassigned and available for use within the District's fund balance policies. At the end of the current fiscal period, unassigned fund balance for the general fund was $13,201,816 or 14% of the total general fund expenditures. Overview of the Financial Statements This annual report consists of a series of financial statements. The government-wide financial statements include the Statement of Net Position and the Statement of Activities (on pages 14 and 15). These provide information about the activities of the District as a whole and present a longer-term view of the District's property and debt obligations and other financial matters. They reflect the flow of total economic resources in a manner similar to the financial reports of a business enterprise. Fund financial statements (starting on page 16) report the District's operations in more detail than the government-wide statements by providing information about the District's most significant funds. For governmental activities, these statements tell how services were financed in the short term as well as what resources remain for future spending. They reflect the flow of current financial resources, and supply the basis for tax levies and the appropriations budget. For proprietary activities, fund financial statements tell how goods or services of the District were sold to departments within the District or to external customers and how the sales revenues covered the expenses of the goods or services. The remaining statements, fiduciary statements, provide financial information about activities for which the District acts solely as a trustee or agent for the benefit of those outside of the District. The notes to the financial statements (starting on page 29) provide narrative explanations or additional data needed for full disclosure in the government-wide statements or the fund financial statements. The combining statements for nonmajor funds contain even more information about the District's individual funds. The TEA required schedules and federal awards section contain data used by monitoring or regulatory agencies for assurance that the District is using funds supplied in compliance with the terms of grants. 6
13 Reporting the District as a Whole The Statement of Net Position and the Statement of Activities The analysis of the District's overall financial condition and operations begins on page 14. Its primary purpose is to show whether the District is better off or worse off as a result of the year's activities. The statement of net position includes all the District's assets, deferred outflows of resources, liabilities, and deferred inflows of resources at the end of the period while the statement of activities includes all revenues and expenses generated by the District's operations during the period. These apply the accrual basis of accounting (the basis used by private sector companies). All of the current period's revenues and expenses are taken into account regardless of when cash is received or paid. The District's revenues are divided into those provided by outside parties who share the costs of some programs, such as tuition received from students from outside the district and grants provided by the U.S. Department of Education to assist children with disabilities or from disadvantaged backgrounds (program revenues), and revenues provided by the taxpayers or by TEA in equalization funding processes (general revenues). All the District's assets and deferred outflows of resources are reported whether they serve the current year or future years. Liabilities and deferred inflows of resources are considered regardless of whether they must be paid in the current or future years. These two statements report the District's net position and changes in them. The District's net position (the difference between assets and deferred outflows of resources; less liabilities and deferred inflows of resources) provide one measure of the District's financial health, or financial position. Over time, increases or decreases in the District's net position are one indicator of whether its financial health is improving or deteriorating. To fully assess the overall health of the District, however, you should consider nonfinancial factors as well, such as changes in the District's average daily attendance or its property tax base and the condition of the District's facilities. The government-wide financial statements of the District are primarily supported by taxes and intergovernmental revenues. The governmental activities of the District include: instruction, counseling, co-curricular activities, food services, transportation, maintenance, community services, and general administration. In fiscal year 2018, the District adopted the Governmental Accounting Standards Board Statement No. 75, Accounting and Financial Reporting for Postemployment Benefits Other Than Pensions which superseded GASB Statement No. 45. Statement No. 75 establishes financial reporting standards and/or accounting standards for state and local government defined benefit OPEB plans and defined contribution OPEB plans. Statement No. 75 requires that, at transition, a government recognizes a beginning deferred outflow of resources for its OPEB contributions, if any, made subsequent to the measurement date of the beginning net OPEB liability. The effects of the adoption of this statement has no impact on the District s governmental fund financial statements. However, adoption has resulted in certain changes to the presentation of the financial statements of the District s government-wide financial statements. More information on the adoption of this statement and the District s OPEB plan is available in Note 1. C. and Note 9, respectively. 7
14 Reporting the District's Most Significant Funds Fund Financial Statements A fund is a grouping of related accounts that is used to maintain control over resources that have been segregated for specific activities or objectives. The District, like other state and local governments, uses fund accounting to ensure and demonstrate compliance with finance-related legal requirements. All of the funds of the District can be divided into three categories: governmental funds, proprietary funds, and fiduciary funds. Governmental funds Most of the District's basic services are reported in governmental funds. These use modified accrual accounting (a method that measures the receipt and disbursement of cash and all other financial assets that can be readily converted to cash) and report balances that are available for future spending. The governmental fund statements provide a detailed short-term view of the District's general operations and the basic services it provides. We describe the differences between governmental activities (reported in the statement of net position and the statement of activities) and governmental funds in reconciliation schedules following each of the fund financial statements. Proprietary funds The District reports the activities for which it charges users (whether outside customers or other units of the District) in proprietary funds using the same accounting methods employed in the statement of net position and the statement of activities. The internal service fund reports the District's self-insurance workers compensation program that provides services for the District's other programs and activities. Fiduciary funds Fiduciary funds are used to account for resources held for the benefit of students and for a scholarship fund. Fiduciary funds are not reflected in the government-wide financial statements because the resources of those funds are not available to support the District s own programs. The accounting used for fiduciary funds is similar to the accounting used for proprietary funds. 8
15 Government-Wide Financial Analysis The analysis below presents both current and prior year data and discusses significant changes in the accounts. Our analysis focuses on the net position (Table I) and changes in net position (Table II) of the District's governmental activities. Negative net position of the District's governmental activities increased from ($75,130,434) as restated, to ($70,078,126). Unrestricted net position, the part of net position that can be used to finance day-today operations without constraints established by debt covenants, enabling legislation, or other legal requirements, was ($109,028,930) at June 30, Table I DeSoto Independent School District Net Position Governmental Governmental Activities Activities June 30, June 30, Current and other assets $ 32,994,256 $ 72,333,678 Capital assets, net 183,382, ,822,353 Total assets 216,377, ,156,031 Deferred outflows of resources 16,389,744 15,895,921 Long-term liabilities 271,152, ,479,468 Other liabilities 14,548,782 11,436,764 Total liabilities 285,700, ,916,232 Deferred inflows of resources 17,144,174 1,310,561 Net position Net investment in capital assets 37,981,783 (4,969,181) Restricted 969,021 11,526,282 Unrestricted (109,028,930) (19,731,942) Total net position $ (70,078,126) $ (13,174,841) 9
16 Table II DeSoto Independent School District Changes in Net Position Governmental Governmental Activities Activities Year Ended Year Ended June 30, June 30, Revenues Program revenues Charges for services $ 1,870,914 $ 2,300,605 Operating grants and contributions 9,957,721 22,104,725 General revenues Maintenance and operations taxes 31,989,503 26,174,908 Debt service taxes 8,749,337 6,502,485 State aid 49,914,266 54,336,093 Grants and contributions not restricted 25,419 30,848 Investment earnings 500,462 91,540 Miscellaneous 225, ,900 Total revenues 103,233, ,105,104 Expenses Instruction, curriculum and media 44,863,264 57,537,907 services Instructional and school leadership 7,684,305 10,230,476 Student support services 7,039,559 7,770,525 Child nutrition 6,958,196 6,186,469 Extracurricular activities 3,034,528 3,420,291 General administration 4,077,332 4,756,603 Plant maintenance, security, and data 11,649,689 11,455,106 processing Community services 2,233, ,977 Debt service 10,450,864 9,189,636 Facilities acquisition and construction 47, ,270 Juvenile Justice Alternative 9,612 32,754 Education Program Other intergovernmental charges 132, ,761 Total expenses 98,180, ,722,775 Increase (decrease) in net position 5,052, ,329 Net position at beginning of year before restatement (15,696,710) (13,557,170) Change in accounting principle (59,433,724) - Net position at end of year $ (70,078,126) $ (13,174,841) 10
17 The District showed a decrease in revenue of -7.9%. State Foundation revenue decreased due to enrollment and the effect of higher maintenance and operations tax collections on the State funding formula. Operating grants and contributions decreased due to the reduction of OPEB expense related to recording the State s on-behalf contribution. Average daily attendance decreased by 165 students or 1.8%. The District's General Fund expenditures increased $4.2 million due primarily to an increase in capital project expenditures related to the energy upgrade initiative financed through maintenance tax notes. The District's maintenance and operations (M&O) tax rate remained the same at $1.17 per $100 valuation. The District's debt service tax rate (I&S) increased from $0.29 per $100 valuation to $0.32 per $100 valuation. The cost of all governmental activities for the current fiscal period was $98,180,778. However, as shown in the Statement of Activities on page 15, the amount that our taxpayers ultimately financed for these activities through District taxes was only $40,738,840 because some of the costs were paid by those who directly benefited from the programs ($1,870,914) or by other governments and organizations that subsidized certain programs with grants and contributions ($9,957,721) or by State equalization funding ($49,914,266). The District s Funds As the District completed the year, its governmental funds (as presented in the balance sheet on page 16) reported a combined fund balance of $18,516,837, which is $36,199,314 less than last year's total of $54,716,151. Included in this period's total change in fund balance is a decrease of -$5,391,145 in the District's general fund and a decrease of -$3,409,794 in the District's debt service fund. The capital projects fund decreased -$27,212,592 due to construction payments on the new elementary school. The District amends the budget as needed throughout the year. The final budgeted expenditures increased by $6,813,706 primarily due to facilities acquisition and construction in the current year. Capital Assets and Debt Administration Capital Assets At June 30, 2018, the District had $183,382,926 invested in a broad range of capital assets, including facilities and equipment for instruction, transportation, athletics, administration, and maintenance. This amount represents a net increase of $26,359,736, or 16.8%, more than the prior year. More detailed information about the District's capital assets is presented in Note 4 to the financial statements. 11
18 Debt Administration At June 30, 2018, the District had $217,648,878 in long-term debt outstanding (including accreted interest on capital appreciation bonds) versus $222,539,539 last year a decrease of $4,890,661. More detailed information about the District's long-term liabilities is presented in Note 5 to the financial statements. Economic Factors and Next Year's Budgets and Rates The District's maintenance and operations tax rate will remain at $1.17 per $100 of taxable valuation, and the debt service tax rate will remain at $0.32 per $100 of taxable valuation. The District expects a 2.58% increase in average daily attendance during the school year. Property values are expected to increase 11.32%. The District s general fund original budget has budgeted expenditures to decrease $2 million due to lower facilities acquisition and construction costs offset by increased staffing levels. The District s general fund original budget has budgeted revenues $1,662,800 in excess of budgeted expenditures. Contacting the District's Financial Management This financial report is designed to provide our citizens, taxpayers, customers, and investors and creditors with a general overview of the District's finances and to show the District's accountability for the money it receives. If you have questions about this report or need additional financial information, contact the District's business office at DeSoto Independent School District, 200 East Beltline Road, DeSoto, Texas 75115; (972)
19 Basic Financial Statements 13
20 DeSoto Independent School District Exhibit A-1 Statement of Net Position June 30, 2018 Data Primary Government Control Governmental Codes Activities ASSETS 1110 Cash and cash equivalents $ 13,243, Investments 2,498, Property taxes receivable (delinquent) 1,686, Allowance for uncollectible taxes (614,434) 1240 Due from other governments 16,025, Accrued interest 3, Other receivables, net 136, Inventories 14,968 Capital assets 1510 Land 8,174, Buildings, net 141,187, Furniture and equipment, net 4,630, Construction in progress 29,390, Total assets 216,377,182 DEFERRED OUTFLOWS OF RESOURCES 1701 Deferred loss on bond refundings 7,115, Deferred outflows of resources - pensions 8,839, Deferred outflows of resources - OPEB 435, Total deferred outflows of resources 16,389,744 LIABILITIES 2110 Accounts payable 3,418, Accrued interest payable 1,497, Payroll deductions and withholdings 1,418, Accrued wages payable 7,737, Due to other governments 338, Unearned revenue 138,151 Noncurrent liabilities 2501 Due within one year 11,278, Due in more than one year 206,516, Net pension liability (District's share) 19,502, Net OPEB liability (District's share) 33,854, Total liabilities 285,700,878 DEFERRED INFLOWS OF RESOURCES 2605 Deferred inflows of resources - pensions 2,982, Deferred inflows of resources - OPEB 14,161, Total deferred inflows of resources 17,144,174 NET POSITION 3200 Net investment in capital assets 37,981, Restricted for federal and state programs 969, Unrestricted (109,028,930) 3000 TOTAL NET POSITION $ (70,078,126) The Notes to the Basic Financial Statements are an integral part of this statement. 14
21 DeSoto Independent School District Exhibit B-1 Statement of Activities For the Year Ended June 30, 2018 Net (Expense) Revenue and Changes in Net Program Revenues Position Primary Data Operating Government Control Charges for Grants and Governmental Codes Functions/Programs Expenses Services Contributions Activities PRIMARY GOVERNMENT Governmental activities 11 Instruction $ 42,782,756 $ 312,361 $ 201,873 $ (42,268,522) 12 Instructional resources and media 638,327 - (72,124) (710,451) 13 Curriculum and staff development 1,442, ,289 (1,022,892) 21 Instructional leadership 2,910,954-1,939,027 (971,927) 23 School leadership 4,773,351 - (544,786) (5,318,137) 31 Guidance, counseling and evaluation 3,152, ,149 (2,681,047) 32 Social work services 516,094-63,191 (452,903) 33 Health services 736,397 - (88,936) (825,333) 34 Student transportation 2,634,872 - (239,277) (2,874,149) 35 Food services 6,958,196 1,110,479 5,687,202 (160,515) 36 Cocurricular/extracurricular activities 3,034, , ,932 (2,324,858) 41 General administration 4,077,332 - (390,235) (4,467,567) 51 Plant maintenance and operations 8,031, ,336 (798,359) (8,721,647) 52 Security and monitoring services 794,953 - (64,817) (859,770) 53 Data processing services 2,823,112 - (253,490) (3,076,602) 61 Community services 2,233,151-1,578,601 (654,550) 72 Debt service - interest on long term debt 10,448,464-2,130,882 (8,317,582) 73 Debt service - bond issuance cost and fees 2, (2,400) 81 Facilities acquisition and construction 47, (47,431) Payments to Juvenile Justice 95 Alternative Education Program 9, (9,612) 99 Other intergovernmental charges 132,847 - (451,401) (584,248) TP TOTAL PRIMARY GOVERNMENT $ 98,180,778 $ 1,870,914 $ 9,957,721 $ (86,352,143) General revenues Taxes MT Property taxes, levied for general purposes $ 31,989,503 DT Property taxes, levied for debt service 8,749,337 SF State aid - formula grants 49,914,266 GC Grants and contributions not restricted 25,419 IE Investment earnings 500,462 MI Miscellaneous local and intermediate revenue 225,464 TR Total general revenues 91,404,451 CN Change in net position 5,052,308 NB Net position (deficit) - beginning (15,696,710) PA Prior period adjustment - (Note 15) (59,433,724) Net position (deficit) - beginning, as restated (75,130,434) NE NET POSITION (DEFICIT) - ENDING $ (70,078,126) The Notes to the Basic Financial Statements are an integral part of this statement. 15
22 DeSoto Independent School District Balance Sheet Governmental Funds June 30, 2018 Data Control General Debt Service Codes Fund Fund ASSETS 1110 Cash and cash equivalents $ 6,987,210 $ 1,736, Investments - 2,498, Property taxes - delinquent 1,302, , Allowance for uncollectible taxes (credit) (450,230) (164,204) 1240 Due from other governments 12,612,732 1, Accrued interest 1, Due from other funds 2,932, Other receivables 62, Inventories 14, Total assets $ 23,463,904 $ 4,455,205 LIABILITIES 2110 Accounts payable $ 315,340 $ 2, Payroll deductions and withholdings payable 1,418, Accrued wages payable 7,110, Due to other funds 227, Due to other governments 38, , Unearned revenues Total liabilities 9,109, ,776 DEFERRED INFLOWS OF RESOURCES 2601 Unavailable revenue 1,137, , Total deferred inflows of resources 1,137, ,278 FUND BALANCES NonspendabIe 3410 Inventories 14,968 - Restricted 3450 Federal or state funds grant restriction Capital acquisition and contractual obligation Retirement of long-term debt - 3,981,151 Committed 3545 Other committed fund balance Unassigned 13,201, Total fund balances 13,216,784 3,981,151 TOTAL LIABILITIES, DEFERRED INFLOWS 4000 OF RESOURCES, AND FUND BALANCES $ 23,463,904 $ 4,455,205 The Notes to the Basic Financial Statements are an integral part of this statement. 16
23 Exhibit C-1 60 Total Total Capital Nonmajor Governmental Projects Funds Funds $ 2,705,998 $ 1,615,828 $ 13,045, ,498, ,686, (614,434) - 3,411,475 16,025,395-2,241 3, , ,159,766-74, , ,968 $ 2,932,379 $ 5,104,395 $ 35,955,883 $ 2,896,904 $ 110,673 $ 3,325, ,418, ,738 7,737,747-2,932,553 3,159,766-11, , , ,151 2,896,904 3,820,968 16,118, ,320, ,320, , , ,021 35,475-35, ,981, , , ,201,816 35,475 1,283,427 18,516,837 $ 2,932,379 $ 5,104,395 $ 35,955,883 17
24 DeSoto Independent School District Exhibit C-2 Reconciliation of the Governmental Funds Balance Sheet to the Statement of Net Position June 30, 2018 TOTAL FUND BALANCES - GOVERNMENTAL FUNDS $ 18,516,837 The District uses an internal service fund to charge the costs of certain activities, such as self-insurance, to appropriate functions in other funds. The assets and liabilities of the internal service fund are included in governmental activities in the statement of net position. 105,171 Capital assets used in governmental activities are not financial resources and therefore are not reported in the fund financial statements. 274,065,278 Accumulated depreciation is not reported in the fund financial statements. (90,682,352) Bonds and notes payable are not reported in the fund financial statements. (140,463,808) Accreted interest payable on capital appreciation bonds is not reported in the fund financial statements. (68,572,673) Property tax revenue recorded as unavailable revenue in the fund financial statements was recognized as revenue in the government-wide financial statements. 1,320,501 Interest on outstanding debt is accrued in the government-wide financial statements, whereas in the fund financial statements interest expenditures are reported when due. (1,497,035) Bond premiums are not recognized in the fund financial statements. (8,612,397) Compensated absences are not recognized in the fund financial statements. (146,054) Deferred charges on bond refundings are not recognized in the fund financial statements. 7,115,131 Included in the items related to government-wide long-term debt is the recognition of the District's proportionate share of the net pension liability in the amount of $19,502,787, deferred inflows of resources related to TRS in the amount of $2,982,824, and deferred outflows of resources related to TRS in the amount of $8,839,092. This results in a net decrease in net position. (13,646,519) Included in the items related to debt is the recognition of the District's proportionate share of the TRS-Care net OPEB liability ($33,854,377) and a deferred inflow of resources ($14,161,350) and a deferred outflow of resources ($435,521). This results in a net decrease in net position. (47,580,206) TOTAL NET POSITION (DEFICIT) - GOVERNMENTAL ACTIVITIES $ (70,078,126) The Notes to the Basic Financial Statements are an integral part of this statement. 18
25 This Page Intentionally Left Blank 19
26 DeSoto Independent School District Statement of Revenues, Expenditures, and Changes in Fund Balance Governmental Funds For the Fiscal Year Ended June 30, 2018 Data Control General Debt Service Codes Fund Fund REVENUES 5700 Total local and intermediate sources $ 32,982,974 $ 8,833, State program revenues 53,657,881 2,182, Federal program revenues 831, Total revenues 87,472,514 11,016,512 EXPENDITURES Current 0011 Instruction 49,513, Instructional resources and media services 755, Curriculum and instructional staff development 1,077, Instructional leadership 2,489, School leadership 5,868, Guidance, counseling and evaluation services 3,609, Social work services 343, Health services 931, Student (pupil) transportation 2,506, Food services 56, Extracurricular activities 2,829, General administration 4,626, Facilities maintenance and operations 8,361, Security and monitoring services 678, Data processing services 2,682, Community Services 1,261,826 - Debt service 0071 Principal on long term debt 460,000 10,500, Interest on long term debt 84,450 3,923, Bond issuance cost and fees - 2,400 Capital outlay 0081 Facilities acquisition and construction 4,585,364 - Intergovernmental: 0095 Payments to Juvenile Justice Alternative Education Program 9, Other intergovernmental charges 132, Total expenditures 92,863,659 14,426,306 Excess (deficiency) of revenues 1100 over (under) expenditures (5,391,145) (3,409,794) 1200 Net change in fund balances (5,391,145) (3,409,794) 100 Fund balance - beginning 18,607,929 7,390, FUND BALANCE - ENDING $ 13,216,784 $ 3,981,151 The Notes to the Basic Financial Statements are an integral part of this statement. 20
27 Exhibit C-3 60 Total Total Capital Nonmajor Governmental Projects Funds Funds $ 238,508 $ 1,905,629 $ 43,960,758-1,132,168 56,972,914-15,092,630 15,924, ,508 18,130, ,857,961-5,164,195 54,677, , ,164 1,599,648-2,176,695 4,665,955-15,547 5,884, ,317 4,438,836 88,417 95, , , ,506,104-7,040,955 7,097, ,184 3,547, ,491 4,678, ,361, ,872-2,622 2,685,057-1,699,077 2,960, ,960, ,008, ,400 27,362,483-31,947, , ,847 27,451,100 18,316, ,057,275 (27,212,592) (185,783) (36,199,314) (27,212,592) (185,783) (36,199,314) 27,248,067 1,469,210 54,716,151 $ 35,475 $ 1,283,427 $ 18,516,837 21
28 DeSoto Independent School District Exhibit C-4 Reconciliation of the Governmental Funds Statement of Revenues, Expenditures, and Changes in Fund Balances to the Statement of Activities For the Fiscal Year Ended June 30, 2018 TOTAL NET CHANGE IN FUND BALANCES - GOVERNMENTAL FUNDS $ (36,199,314) The District uses an internal service fund to charge the costs of certain activities, such as self-insurance, to appropriate functions in other funds. The net income of the internal service fund is reported with governmental activities. The net effect of this consolidation is to decrease net position. (117,443) Current year capital outlays are expenditures in the fund financial statements, but they are shown as increases in capital assets in the government-wide financial statements. The effect of reclassifying the current year capital asset additions increases government-wide net position. 32,676,987 Depreciation is not recognized as an expense in governmental funds since it does not require the use of current financial resources. The net effect of the current year's depreciation is to decrease net position in the government-wide financial statements. (6,317,251) Current year long-term debt principal payments on bonds payable, maintenance tax notes payable and payments of accreted interest on capital appreciation bonds are expenditures in the fund financial statements, but are shown as reductions in long-term debt in the government-wide financial statements. 10,960,000 Current year interest accretion on capital appreciation bonds payable is not recorded in the fund financial statements, but is shown as an increase in accreted interest payable in the government-wide financial statements. (6,612,480) Interest expense on outstanding debt is accrued in the government-wide financial statements, whereas in the fund financial statements interest expenditures are reported when due. This amount represents the current year decrease in interest payable. 41,499 Revenues from property taxes are not recognized in the fund financial statements until they are considered available to finance current expenditures, but such revenues are recognized when assessed net of an allowance for uncollectible accounts in the government-wide financial statements. 149,658 Current year amortization of the premium/discount on bonds payable is not recorded in fund financial statements, but is shown as a decrease in long-term debt in the government-wide financial statements. 543,141 Current year amortization of the deferred charges on bond refundings is not recognized in the fund financial statements, but is shown as a decrease in deferred outflows of resources in the government-wide financial statements. (412,268) The Notes to the Basic Financial Statements are an integral part of this statement. 22
29 DeSoto Independent School District Exhibit C-4 Reconciliation of the Governmental Funds Statement of Revenues, Expenditures, and Changes in Fund Balances to the Statement of Activities Continued For the Fiscal Year Ended June 30, 2018 The increase in compensated absences is reported in the statement of activities but does not require the use of current financial resources and, therefore, is not reported as expenditures in the governmental funds. $ (146,054) The net change in net pension liability, deferred outflows, and deferred inflows is reported in the statement of activities but does not require the use of current financial resources and, therefore, is not reported as expenditures in the governmental funds. The net change consists of an increase in deferred outflows ($339,601); increase in deferred inflows ($1,850,106); and decrease in net pension liability ($142,820). (1,367,685) The net change in net OPEB liability, deferred outflows, and deferred inflows is reported in the statement of activities but does not require the use of current financial resources and, therefore, is not reported as expenditures in the governmental funds. The net change consists of an increase in deferred outflows ($101,052); increase in deferred inflows ($14,161,350); and decrease in net OPEB liability ($25,913,816). 11,853,518 CHANGE IN NET POSITION - GOVERNMENTAL ACTIVITIES $ 5,052,308 The Notes to the Basic Financial Statements are an integral part of this statement. 23
30 DeSoto Independent School District Exhibit D-1 Statement of Net Position Proprietary Funds June 30, 2018 ASSETS Current assets Governmental Activities Internal Service Fund Cash and cash equivalents $ 198,139 Total assets 198,139 LIABILITIES Current liabilities Accounts payable 92,968 Total liabilities 92,968 NET POSITION Unrestricted net position 105,171 TOTAL NET POSITION $ 105,171 The Notes to the Basic Financial Statements are an integral part of this statement. 24
31 DeSoto Independent School District Exhibit D-2 Statement of Revenues, Expenses, and Changes in Fund Net Position Proprietary Funds For the Fiscal Year Ended June 30, 2018 OPERATING REVENUES Governmental Activities Internal Service Fund Local and intermediate sources $ 457,040 Total operating revenues 457,040 OPERATING EXPENSES Other operating costs 574,483 Total operating expenses 574,483 Operating loss (117,443) Net position - beginning 222,614 NET POSITION - ENDING $ 105,171 The Notes to the Basic Financial Statements are an integral part of this statement. 25
32 DeSoto Independent School District Exhibit D-3 Statement of Cash Flows Proprietary Funds For the Fiscal Year Ended June 30, 2018 CASH FLOWS FROM OPERATING ACTIVITIES Governmental Activities Internal Service Fund Receipts from other funds $ 457,040 Cash payments for insurance claims and costs (508,353) Net cash used in operating activities (51,313) Net decrease in cash and cash equivalents (51,313) Cash and cash equivalents at beginning of year 249,452 Cash and cash equivalents at end of year $ 198,139 RECONCILIATION OF OPERATING LOSS TO NET CASH USED IN OPERATING ACTIVITIES Operating loss $ (117,443) Effect of increases and decreases in current assets and liabilities Increase (decrease) in accounts payable 66,130 NET CASH USED IN OPERATING ACTIVITIES $ (51,313) The Notes to the Basic Financial Statements are an integral part of this statement. 26
33 DeSoto Independent School District Exhibit E-1 Statement of Fiduciary Net Position Fiduciary Funds June 30, 2018 ASSETS Private Purpose Trust Fund Agency Funds Cash and cash equivalents $ 34,896 $ 97,322 Other receivables - 19,246 TOTAL ASSETS 34,896 $ 116,568 LIABILITIES Accounts payable - $ 50 Due to student groups - 116,518 TOTAL LIABILITIES - $ 116,568 NET POSITION Unrestricted net position 34,896 TOTAL NET POSITION $ 34,896 The Notes to the Basic Financial Statements are an integral part of this statement. 27
34 DeSoto Independent School District Exhibit E-2 Statement of Changes in Fiduciary Fund Net Position Fiduciary Funds For the Fiscal Year Ended June 30, 2018 ADDITIONS Private Purpose Trust Fund Local and intermediate sources $ 357 Total additions 357 DEDUCTIONS Operating costs 1,800 Total deductions 1,800 Change in net position (1,443) Net position - beginning 36,339 NET POSITION - ENDING $ 34,896 The Notes to the Basic Financial Statements are an integral part of this statement. 28
35 DeSoto Independent School District Notes to the Basic Financial Statements Note 1. Summary of Significant Accounting Policies DeSoto Independent School District's (the District) combined financial statements have been prepared in conformity with generally accepted accounting principles (GAAP) as applied to governmental units in conjunction with the Texas Education Agency's Financial Accountability System Resource Guide (FAR). The Governmental Accounting Standards Board (GASB) is the accepted standard setting body for establishing governmental accounting and financial reporting principles. The more significant accounting policies of the District are described below. A. Reporting Entity The Board of Trustees (the Board), a seven member group, has fiscal accountability over all activities related to public elementary and secondary education within the jurisdiction of the District. The Board is elected by the public and has the exclusive power and duty to govern and oversee the management of the public schools of the District. All powers and duties not specifically delegated by statute to the Texas Education Agency (the Agency) or to the State Board of Education are reserved for the Board, and the Agency may not substitute its judgment for the lawful exercise of those powers and duties by the Board. The District is not included in any other governmental reporting entity and has no component units. B. Basis of Presentation The government-wide financial statements (the statement of net position and the statement of activities) report information on all of the nonfiduciary activities of the District. Internal service fund activity has been eliminated to avoid overstating revenues and expenses. Interfund services provided and used are not eliminated in the process of consolidation. Governmental activities include programs primarily supported by taxes and intergovernmental revenues. The statement of activities demonstrates the degree to which the direct expenses of a given program are offset by program revenues. Direct expenses are those that are clearly identifiable with a specific program. Program revenues include 1) charges to customers or applicants who purchase, use, or directly benefit from goods, services, or privileges provided by a given program and 2) operating or capital grants and contributions that are restricted to meeting the operational or capital requirements of a particular program. Taxes and other items not properly included among program revenues are reported instead as general revenues. The District segregates transactions related to certain functions or activities in separate funds in order to aid financial management and to demonstrate legal compliance. These statements present each major fund as a separate column on the fund financial statements; all non-major funds are aggregated and presented in a single column. 29
36 DeSoto Independent School District Notes to the Basic Financial Statements Governmental funds are those funds through which most governmental functions typically are financed. The measurement focus of governmental funds is on the sources, uses and balance of current financial resources. The District has presented the following major governmental funds: 1. General Fund This fund is the District s primary operating fund. It is established to account for resources financing the fundamental operations of the District, in partnership with the community, in enabling and motivating students to reach their full potential. All revenues and expenditures not required to be accounted for in other funds are included here. This is a budgeted fund and any fund balances are considered resources available for current operations. Fund balances may be appropriated by the Board to implement its responsibilities. 2. Debt Service Fund This fund is established to account for payment of principal and interest on long-term general obligation debt and other long-term debts for which a tax has been dedicated. This is a budgeted fund. Any unused debt service fund balances are transferred to the general fund after all of the related debt obligations have been met. 3. Capital Projects Fund This fund is established to account for proceeds from the sale of bonds and other resources to be used for Board authorized acquisition, construction, or renovation, as well as, furnishings and equipping of major capital facilities. Upon completion of a project, any unused bond proceeds are transferred to the debt service fund and are used to retire related bond principal. Additionally, the District reports the following fund types: 1. Special Revenue Funds These funds are established to account for federally financed or expenditures legally restricted for specified purposes. In many special revenue funds, any unused balances are returned to the grantor at the close of specified project periods. For funds in this fund type, project accounting is employed to maintain integrity for the various sources of funds. 2. Internal Service Fund The District utilizes an internal service fund to account for revenues and expenses related to services provided to parties inside the District on a cost-reimbursement basis. This fund facilitates distribution of support costs to the users of support services. The District has an internal service fund for its self-insured workers compensation plan. The internal service fund is a proprietary fund type. Proprietary funds distinguish operating revenues and expenses from non-operating items. Operating revenues and expenses generally result from providing services and producing and delivering goods in connection with a proprietary fund's principal ongoing operations. Operating expenses for the proprietary fund includes the cost of personal and contractual services. All revenues and expenses not meeting this definition are reported as non-operating revenues and expenses. 3. Private Purpose Trust Fund The District accounts for donations which have the stipulation that the funds be used for a specific purpose in this fund. The District's private purpose trust fund is a scholarship fund. These funds are not budgeted. 4. Agency Funds These custodial funds are used to account for activities of student groups and other organizational activities requiring clearing accounts. Financial resources for the agency funds are recorded as assets and liabilities; therefore, these funds do not include revenues and expenditures and have no fund equity. If any unused resources are declared surplus by the student groups, they are transferred to the general fund with a recommendation to the Board for an appropriate utilization through a budgeted program. 30
37 DeSoto Independent School District Notes to the Basic Financial Statements C. New Accounting Standards Adopted In fiscal year 2018, the District adopted Governmental Accounting Standards Board Statement No. 75, Accounting and Financial Reporting for Postemployment Benefits Other Than Pensions which supersedes GASB Statement No. 45. The requirements of Statement No. 75 apply to the financial statements of all state and local government employers whose employees are provided postemployment benefits other than pensions that are administered through trusts or equivalent arrangements, and to the financial statements of state and local government in which the non-employer contributing entity (State) and District have a legal obligation to make contributions directly to such OPEB plan. This Statement establishes standards for measuring and recognizing liabilities, deferred outflows of resources, and deferred inflows of resources, and expense/expenditures related to the OPEB plan. Note disclosure and RSI requirements about the OPEB plan also are addressed. The adoption of Statement No. 75 has no impact on the District s governmental fund financial statements, which continue to report expenditures in the contribution amount determined legislatively. The calculation of OPEB contributions is unaffected by the change. However, the adoption has resulted in the restatement of the District s beginning net position for the fiscal year 2018 government-wide financial statements to reflect the reporting of net OPEB liability and deferred inflows of resources and deferred outflows of resources for its qualified OPEB plan and the recognition of OPEB expense in accordance with the provisions of the Statement. Net position as of July 1, 2017 was decreased by $59,433,724 to reflect the cumulative effect of adoption. An aggregate net OPEB liability of $59,768,193 offset by aggregate deferred outflows of resources of $334,469 at June 30, 2017 were reported as a prior period adjustment to the net position on July 1, Refer to Note 9 for more information regarding the District s OPEB plan. D. Measurement Focus/Basis of Accounting Measurement focus refers to what is being measured; basis of accounting refers to when revenues and expenditures are recognized in the accounts and reported in the financial statements. Basis of accounting relates to the timing of the measurement made, regardless of the measurement focus applied. The government-wide statements and fund financial statements for proprietary funds are reported using the economic resources measurement focus and the accrual basis of accounting. The economic resources measurement focus means all assets, deferred outflows of resources, liabilities, and deferred inflows of resources (whether current or non-current) are included on the statement of net position and the operating statements present increases (revenues) and decreases (expenses) in net total position. Under the accrual basis of accounting, revenues are recognized when earned and expenses are recognized at the time the liability is incurred. 31
38 DeSoto Independent School District Notes to the Basic Financial Statements Governmental fund financial statements are reported using the current financial resources measurement focus and are accounted for using the modified accrual basis of accounting. Under the modified accrual basis of accounting, revenues are recognized when susceptible to accrual; i.e., when they become both measurable and available. "Measurable" means the amount of the transaction can be determined and "available" means collectible within the current period or soon enough thereafter to be used to pay liabilities of the current period. The District considers revenues to be available if they are collected within 60 days after year end. Expenditures are recorded when the related fund liability is incurred. However, debt service expenditures, as well as expenditures related to compensated absences are recorded only when payment is due. The revenues susceptible to accrual are property taxes, charges for services, interest income and intergovernmental revenues. All other governmental fund revenues are recognized when received. Revenues from state and federal grants are recognized as earned when the related program expenditures are incurred. Funds received but unearned are reflected as unearned revenues, and funds expended but not yet received are shown as receivables. Revenue from investments, including governmental external investment pools, is based upon fair value. Fair value is the amount at which a financial instrument could be exchanged in a current transaction between willing parties, other than in a forced or liquidation sale. The District has adopted and installed an accounting system which exceeds the minimum requirements prescribed by the State Board of Education and approved by the State Auditor. Specifically, the District's accounting system uses codes and the code structure prescribed by the Agency s Financial Accountability System Resource Guide. E. Budgetary Control Formal budgetary accounting is employed for all required governmental funds and is presented on the modified accrual basis of accounting consistent with generally accepted accounting principles. The budget is prepared and controlled at the function level within each organization to which responsibility for controlling operations is assigned. The official school budget is prepared for adoption for required governmental funds prior to June 20 of the preceding fiscal year for the subsequent fiscal period beginning September 1. The budget is formally adopted by the Board at a public meeting held at least ten days after public notice has been given. The budget is prepared by fund, function, object, and organization. The budget is controlled at the organizational level by the appropriate department head or campus principal within Board allocations. Therefore, organizations may transfer appropriations as necessary without the approval of the Board unless the intent is to cross fund, function, or increase the overall budget allocations. Control of appropriations by the Board is maintained within funds at the function code level and revenue object code level. Annual budgets are adopted on a basis consistent with generally accepted accounting principles for the general fund, debt service fund, and the food service fund. The other special revenue funds adopt project-length budgets which do not correspond to the District's fiscal year. Each annual budget is presented on the modified accrual basis of accounting. The budget is amended throughout the year by the Board. Such amendments are reflected in the official minutes of the Board. 32
39 DeSoto Independent School District Notes to the Basic Financial Statements A reconciliation of fund balances for both appropriated budget and non-appropriated budget special revenue funds is as follows: Appropriated budget funds - food service special revenue fund $ 966,741 Nonappropriated budget funds 316,686 All special revenue funds $ 1,283,427 F. Encumbrance Accounting The District employs encumbrance accounting, whereby encumbrances for goods or purchased services are documented by purchase orders and contracts. An encumbrance represents a commitment of Board appropriation related to unperformed contracts for goods and services. The issuance of a purchase order or the signing of a contract creates an encumbrance but does not represent an expenditure for the period, only a commitment to expend resources. Appropriations lapse at June 30 and encumbrances outstanding at that time are either canceled or appropriately provided for in the subsequent year's budget. G. Inventories The consumption method is used to account for inventories of paper and other supplies. Under this method, these items are carried in an inventory account of the respective fund at cost, using the first-in, first-out method of accounting and are subsequently charged to expenditures when consumed. H. Interfund Transactions Short-term amounts owed between funds are classified as Due from and due to other funds. Interfund transfers arise from the need to move cash. I. Capital Assets Capital assets, which includes property, plant, equipment, and infrastructure assets, are reported in the applicable governmental activities columns in the government-wide financial statements. All capital assets are valued at historical cost or estimated historical cost if actual historical cost is not available. Donated assets are valued at the acquisition value on the date donated. Repairs and maintenance are recorded as expenses. Renewals and betterments are capitalized. Interest has not been capitalized during the construction period on property, plant and equipment. Assets capitalized have an original cost of $5,000 or more and over one-year of useful life. Depreciation has been calculated on each class of depreciable property using the straight-line method. Estimated useful lives are as follows: Buildings and improvements Furniture and equipment 50 years years 33
40 DeSoto Independent School District Notes to the Basic Financial Statements J. Compensated Absences It is the District's policy to permit employees to accumulate earned but unused vacation and sick pay benefits. Payment for unused vacation leave days accumulated locally will be made upon retirement or separation from the District. All vacation pay is accrued when incurred in the government-wide financial statements. A liability for these amounts is reported in governmental funds only if they have matured, for example, as a result of employee resignations and retirements. The District does not have a liability for unpaid sick leave at year end because the District s policy does not allow payment for unused sick leave not taken upon retirement or termination. K. Cash and Cash Equivalents For purposes of the statement of cash flows, investments are considered to be cash equivalents if they are highly liquid and have a maturity of three months or less when purchased. L. Investments Investments for the District are reported at fair value (generally based on quoted market prices) except for the position in investment pools. In accordance with state law, the pools operate in conformity with all of the requirements of the Securities and Exchange Commission s (SEC) Rule 2a7 as promulgated under the Investment Company Act of 1940, as amended. Accordingly, the pools qualify as a 2a7-like pool and are reported at the net asset value per share (which approximates fair value) even though it is calculated using the amortized cost method. The pools are subject to regulatory oversight by the State Treasurer, although it is not registered with the SEC. M. Net Position Net position represents the difference between assets and deferred outflows of resources; and liabilities and deferred inflows of resources. Net investment in capital assets consists of capital assets, less both accumulated depreciation and the outstanding balances of any borrowing used for the acquisition, construction or improvements of those assets, excluding unspent proceeds. Net position is reported as restricted when there are limitations imposed on its use either through the enabling legislations adopted by the District or through external restrictions imposed by creditors, grantors or laws or regulations of other governments. N. Long-Term Obligations In the government-wide financial statements, long-term debt and other long-term obligations are reported as liabilities in the applicable governmental activities statement of net position. Bond premiums and discounts are recorded and amortized over the life of the bonds using the effective interest method. Bonds payable are reported net of the applicable bond premium or discount. Bond issuance costs are expensed as incurred. In the fund financial statements, governmental fund types recognize bond premiums and discounts, as well as bond issuance costs, during the current period. The face amount of debt issued is reported as other financing sources. Premiums received on debt issuances are reported as other financing sources while discounts on debt issuances are reported as other financing uses. Issuance costs, whether or not withheld from the actual debt proceeds received, are reported as debt service expenditures. 34
41 DeSoto Independent School District Notes to the Basic Financial Statements O. Risk Management The District is exposed to various risks of loss related to torts theft of, damage to and destruction of assets; errors and omissions; injuries to employees; and natural disasters. During fiscal 2018, the District purchased commercial insurance to cover general liabilities. There were no significant reductions in coverage in the past fiscal year, and there were no settlements exceeding insurance coverage for each of the past three fiscal years. P. Estimates The preparation of financial statements in conformity with generally accepted accounting principles requires management to make estimates and assumptions that affect certain reported amounts and disclosures. Accordingly, actual results could differ from those estimates. Q. Pensions The fiduciary net position of the Teacher Retirement System of Texas (TRS) has been determined using the flow of economic resources measurement focus and full accrual basis of accounting. This includes for purposes of measuring the net pension liability, deferred outflows of resources and deferred inflows of resources related to pensions, pension expense, and information about assets, liabilities and additions to/deductions from TRS s fiduciary net position. Benefit payments (including refunds of employee contributions) are recognized when due and payable in accordance with the benefit terms. Investments are reported at fair value. R. Other Post-Employment Benefits The fiduciary net position of the Teacher Retirement System of Texas (TRS) TRS Care Plan has been determined using the flow of economic resources measurement focus and full accrual basis of accounting. This includes for purposes of measuring the net OPEB liability, deferred outflows of resources and deferred inflows of resources related to other post-employment benefits, OPEB expense, and information about assets, liabilities and additions to/deductions from TRS Care s fiduciary net position. Benefit payments are recognized when due and payable in accordance with the benefit terms. There are no investments as this is a pay-as-you-go plan and all cash is held in a cash account. 35
42 DeSoto Independent School District Notes to the Basic Financial Statements S. Deferred Outflows/Inflows of Resources A deferred outflow of resources is a consumption of net position that applies to a future period(s) and will not be recognized as an outflow of resources (expense/expenditures) until then. The District has two items that qualify for reporting in this category: 1. Deferred Outflows of Resources for Refunding Bonds reported in the government-wide statement of net position, deferred charges on refundings results from the difference in the carrying amount of refunded debt and its reacquisition price. This amount is deferred and amortized over the shorter of the life of the refunded or refunding debt. 2. Deferred Outflows of Resources for Pension reported in the government-wide statement of net position, the deferred outflows from the pension plan result from differences between projected and actual earnings on pension plan investments, changes in actuarial assumptions, differences between expected and actual economic experiences, changes in the District s proportional share of pension liabilities, and the District s contributions subsequent to the measurement date. The differences between projected and actual earnings on pension plan investments will be amortized over a closed five year period. The District s contributions subsequent to the measurement date will be recognized as a reduction of the net pension liability in the next fiscal year. The remaining pension related deferred outflows of resources will be amortized over the expected remaining lives of all employees that are provided with pensions through the pension plan. 3. Deferred Outflows of Resources For OPEB reported in the government-wide statement of net position, the deferred outflows from the OPEB plan result from differences between projected and actual earnings on pension plan investments, changes in actuarial assumptions, differences between expected and actual economic experiences, changes in the District s proportional share of OPEB liabilities, and the District s contributions subsequent to the measurement date. The differences between projected and actual earnings on pension plan investments will be amortized over a closed five year period. The District s contributions subsequent to the measurement date will be recognized as a reduction of the net OPEB liability in the next fiscal year. The remaining pension related deferred outflows of resources will be amortized over the expected remaining lives of all employees that are provided with OPEB through TRS Care. 36
43 DeSoto Independent School District Notes to the Basic Financial Statements A deferred inflow of resources is an acquisition of net position that applies to a future period(s). The District has three items that qualify for reporting in this category: 1. Deferred Inflows of Resources for Unavailable Revenue reported in the governmental funds balance sheet, unavailable revenue from property taxes arises from the modified accrual basis of accounting. The amounts are deferred and recognized as an inflow of resources in the period that the amounts become available. 2. Deferred Inflows of Resources for Pension reported in the government-wide statement of net position, the deferred inflows from the pension plan result from changes in actuarial assumptions, differences between expected and actual economic experiences, and changes in the District s proportional share of pension liabilities. The pension related deferred inflows of resources will be amortized over the expected remaining lives of all employees that are provided with pensions through the pension plan. 3. Deferred Inflows of Resources for OPEB reported in the government-wide statement of net position, the deferred inflows from the OPEB plan result from changes in actuarial assumptions, differences between expected and actual economic experiences, and changes in the District s proportional share of OPEB liabilities. The pension related deferred inflows of resources will be amortized over the expected remaining lives of all employees that are provided with OPEB through TRS Care. Note 2. Fund Balances In the fund financial statements, the governmental funds present fund balance as follows: Nonspendable. This classification includes amounts that cannot be spent because they are either (a) not in spendable form or (b) are legally or contractually required to be maintained intact. The District has classified inventories as being nonspendable as these items are not expected to be converted to cash. Restricted. This classification includes amounts for which constraints have been placed on the use of the resources either (a) externally imposed by creditors, grantors, contributors, or laws or regulations of other governments, or (b) imposed by law through constitutional provisions or enabling legislation. Committee. This classification includes amounts that can be used only for specific purposes pursuant to constraints imposed by formal action of the District's Board of Trustees. The Board of Trustees establishes (and modifies or rescinds) fund balance commitments by passage of a resolution. This can also be done through adoption and amendment of the budget. These amounts cannot be used for any other purpose unless the Board removes or changes the specified use by taking the same type of action that was employed when the funds were initially committed. This classification also includes contractual obligations to the extent that existing resources have been specifically committed for use in satisfying those contractual requirements. The Board has committed resources for campus activity funds. Assigned. This classification includes amounts that are constrained by the District's intent to be used for a specific purpose but are neither restricted nor committed. This intent can be expressed by the Board or through the Board delegating this responsibility to other individuals in the District. Under the District's adopted policy, only the Board may assign amounts for specific purposes. The District did not have any assigned fund balances as of June 30, Unassigned. This classification is the fund equity that is available for any legal purpose. The general fund is the only fund that will have a positive unassigned amount. 37
44 DeSoto Independent School District Notes to the Basic Financial Statements The order of spending and availability of fund balances is to reduce funds in the following order: restricted, committed, assigned, and finally unassigned funds Note 3. Deposits and Investments The District's funds are required to be deposited and invested under the terms of a depository contract. The depository bank deposits for safekeeping and trust with the District's agent bank approved pledged securities in an amount sufficient to protect District funds on a day-to-day basis during the period of the contract. The pledge of approved securities is waived only to the extent of the depository bank's dollar amount of Federal Deposit Insurance Corporation ("FDIC") insurance. Cash Deposits At June 30, 2018, the carrying amount of the District's deposit checking accounts and interest bearing demand accounts was $5,439,323 and the bank balance was $6,715,808. The District's cash deposits at June 30, 2018 and during the year ended June 30, 2018 were covered by FDIC insurance or by pledged collateral held by the District's agent bank in the District's name. In addition, the following is disclosed regarding coverage of combined balances on the date of highest deposit: Depository: Comerica Bank. The market value of securities pledged as of the date of the highest combined balance on deposit was $8,558,708. The highest combined balances of cash amounted to $6,715,807 and occurred on June 30, Total amount of FDIC coverage at the time of the highest combined balance was $250,000. Investments The Public Funds Investment Act (Government Code Chapter 2256) contains specific provisions in the areas of investment practices, management reports and establishment of appropriate policies. Among other things, it requires the District to adopt, implement, and publicize an investment policy. That policy must address the following areas: (1) safety of principal and liquidity, (2) portfolio diversification, (3) allowable investments, (4) acceptable risk levels, (5) expected rates of return, (6) maximum allowable stated maturity of portfolio investments, (7) maximum average dollar-weighted maturity allowed based on the stated maturity date for the portfolio, (8) investment staff quality and capabilities, (9) and bid solicitation preferences for certificates of deposit. Statutes authorize the District to invest in (1) obligations of the U.S. Treasury, certain U.S. agencies, and the State of Texas; (2) certificates of deposit, (3) certain municipal securities, (4) money market savings accounts, (5) repurchase agreements, (6) bankers acceptances, (7) Mutual Funds, (8) Investment pools, (9) guaranteed investment contracts, (10) and common trust funds. The Act also requires the District to have independent auditors perform test procedures related to investment practices as provided by the Act. The District is in substantial compliance with the requirements of the Act and with local policies. 38
45 DeSoto Independent School District Notes to the Basic Financial Statements For fiscal year 2018, the District is invested in the following: Investments measured at Net asset value Quoted Prices Significant in Active Other Significant Weighted Markets for Observable Unobservable Percent Average Balance at Identical Assets Inputs Inputs of Total Maturity Credit June 30, 2018 (Level 1) (Level 2) (Level 3) Investments (Days) Risk Texas Class $ 4,525,758 $ - $ - $ - 44% 50 days AAA/AAAm TexasTERM 2,528, % 35 days AAA/AAAm TexStar 815, % 46 days AAA/AAAm Investments by fair value level U.S. Government Agency Securities Fair Value Measurements Using Federal Home Loan Mortgage Corp. 2,498,075 2,498, % 27 days NR Total value $ 10,367,884 $ 2,498,075 $ - $ - The District categorizes its fair value measurements within the fair value hierarchy established by generally accepted accounting principles. GASB Statement No. 72, Fair Value Measurement and Application provides a framework for measuring fair value which establishes a three-level fair value hierarchy that describes the inputs that are used to measure assets and liabilities. 1. Level 1 inputs are quoted prices (unadjusted) for identical assets or liabilities in active markets that a government can access at the measurement date. 2. Level 2 inputs are inputs-other than quoted prices included within Level 1- that are observable for an asset or liability, either directly or indirectly. 3. Level 3 inputs are unobservable inputs for an asset or liability. The fair value hierarchy gives the highest priority to Level 1 inputs and the lowest priority to Level 3 inputs. If a price for an identical asset or liability is not observable, a government should measure fair value using another valuation technique that maximizes the use of relevant observable inputs and minimizes the use of unobservable inputs. If the fair value of an asset or a liability is measured using inputs from more than one level of the fair value hierarchy, the measurement is considered to be based on the lowest priority level input that is significant to the entire measurement. The District s investments in investment pools that are measured at net asset value are exempt from fair value reporting. All other investments are measured at fair value. Public funds investment pools in Texas (Pools) are established under the authority of the Interlocal Cooperation Act, Chapter 79 of the Texas Government Code, and are subject to the provisions of the Public Funds Investment Act (the Act), Chapter 2256 of the Texas Government Code. In addition to other provisions of the Act designed to promote liquidity and safety of principal, the Act requires Pools to: 1) have an advisory board composed of participants in the pool and other persons who do not have a business relationship with the pool and are qualified to advise the pool; 2) maintain a continuous rating of no lower than AAA or AAA-m or an equivalent rating by at least one nationally recognized rating service; and 3) maintain the market value of its underlying investment portfolio within one half of one percent of the value of its shares. 39
46 DeSoto Independent School District Notes to the Basic Financial Statements The District's investments in Pools are reported at an amount determined by the fair value per share of the pool's underlying portfolio, unless the pool is 2a7-like, in which case they are reported at share value. A 2a7-like pool is one which is not registered with the Securities and Exchange Commission (SEC) as an investment company, but nevertheless has a policy that it will, and does, operate in a manner consistent with the SEC's Rule 2a7 of the Investment Company Act of The Texas Cooperative Liquid Assets Securities System Trust (Texas CLASS) was created as an investment pool for its participants pursuant to Section of the Public Funds Investment Act, Texas Government Code. The Texas CLASS Trust Agreement (Trust) is an agreement of indefinite term regarding the investment, reinvestment and withdrawal of local government funds. The parties to the Trust Agreement are Texas local government entities that choose to participate (the Participants), MBIA Municipal Investors Service Corporation as Program Administrator (the Program Administrator) and Wells Fargo Bank Texas, NA as Custodian (the Custodian). Texas CLASS is supervised by a Board of Trustees who are elected by the Participants. The Board of Trustees supervises the Trust and its affairs and acts as the liaison between the Participants, the Custodian, and the Program Administrator. The Board administers the affairs of the Trust. It also selects the consultants for Texas CLASS, including the Program Administrator and the Custodian. The Board of Trustees has appointed an Advisory Board composed of Participants and other persons who do not have a business relationship with the Trust and are qualified to advise the Trust. The Advisory Board provides advice to the Board of Trustees and the Program Administrator about the investment policy and investment strategy of the Trust and about other matters as requested by the Board of Trustees and the Program Administrator. The Fund is rated AAA by Standard & Poor s rating agency. This rating is the highest principal stability fund rating assigned by Standard & Poor s. Texas Short Term Asset Reserve Program (TexSTAR) is administered by J.P. Morgan Investment Management Inc. (JPMIM) and Hilltop Securities Inc. (HTS) under an agreement with the TexSTAR board of directors. JPMIM provides investment management services, and FirstSouthwest, a division of HTS, provides participant services and marketing. The fund is rated AAAm by Standard and Poor s Rating Service. TexasTERM Local Government Investment Pool (TexasTERM) has been organized in conformity with the Interlocal Cooperation Act, Chapter 791 of the Texas Government Code, and the Public Funds Investment Act, Chapter 2256 of the Texas Government Code (PFIA). TexasTERM offers a series of professionally managed portfolios that are available to municipalities, counties, school districts, special districts and other governmental entities in the State of Texas. An Advisory Board is responsible for the overall management of TexasTERM. With respect to TexasTERM, the Advisory Board s responsibilities include the formulation and implementation of its investment and operating policies. TexasTERM complies with statutory investment restrictions for Texas local governments as provided in the PFIA. The Investment Advisor and Administrator for TexasTERM is PFM Asset Management LLC. 40
47 DeSoto Independent School District Notes to the Basic Financial Statements Cash and investments as of June 30, 2018 are classified in the accompanying financial statements as follows: Statement of net position Cash and cash equivalents $ 13,243,826 Fiduciary funds Cash and cash equivalents 132,218 Total cash and cash equivalents $ 13,376,044 Cash on hand $ 11,787 Deposits with financial institutions 5,439,323 Cash equivalents 7,924,934 Total cash and cash equivalents $ 13,376,044 In compliance with the Public Funds Investment Act, the District has adopted a deposit and investment policy. That policy addresses the following risks: 1. Credit Risk Generally, credit risk is the risk that an issuer of an investment will not fulfill its obligation to the holder of the investment. This is measured by the assignment of a rating by a nationally recognized statistical rating organization. The table on page 39 presents the minimum rating required by (where applicable) the Public Funds Investment Act, the District s investment policy, or debt agreements, and the actual rating as of the year-end for each investment type held by the District. 2. Custodial Credit Risk Custodial credit risk for deposits is the risk that, in the event of the failure of a depository financial institution, a government will not be able to recover its deposits or will not be able to recover collateral securities that are in the possession of an outside party. The custodial credit risk for investments is the risk that, in the event of the failure of the counterparty to a transaction, a government will not be able to recover the value of its investment or collateral securities that are in the possession of another party. Investments held by third parties were fully collateralized and held in the District s name 3. Concentration of Credit Risk This is the risk of loss attributed to the magnitude of the District's investment in a single issuer (i.e., lack of diversification). Concentration risk is defined as positions of 5 percent or more in the securities of a single issuer. The District's investments in public funds investment pools are not subject to the concentration risk. 4. Interest Rate Risk This is the risk that changes in interest rates will adversely affect the fair value of an investment. The District manages its exposure to declines in fair values by limiting the weighted average maturity of its investment portfolio to less than one year from the time of purchase. The weighted average maturity for each investment pool is less than 90 days. Additionally, all investments in bank certificates of deposit are covered by the District's depository pledge. The money market fund is also fully collateralized by pledged securities. 5. Foreign Currency Risk This is the risk that exchange rates will adversely affect the fair value of an investment. At June 30, 2018, the District was not exposed to foreign currency risk. 41
48 DeSoto Independent School District Notes to the Basic Financial Statements Note 4. Capital Assets Capital asset activity for the fiscal year ended June 30, 2018, was as follows: Governmental activities Capital assets not being depreciated Beginning Transfers/ Ending Balance Additions Retirements Balance Land $ 7,668,315 $ 506,309 $ - $ 8,174,624 Construction in progress 2,984,902 31,500,639 (5,094,849) 29,390,692 Total capital assets not being depreciated 10,653,217 32,006,948 (5,094,849) 37,565,316 Capital assets, being depreciated Buildings and improvements 219,215,295 45,400 5,094, ,355,544 Furniture and equipment 11,635, ,639 (115,665) 12,144,418 Total capital assets being depreciated 230,850, ,039 4,979, ,499,962 Less accumulated depreciation for Buildings and improvements (77,812,843) (5,355,117) - (83,167,960) Furniture and equipment (6,667,923) (962,134) 115,665 (7,514,392) Total accumulated depreciation (84,480,766) (6,317,251) 115,665 (90,682,352) Total capital assets, being depreciated, net 146,369,973 (5,647,212) 5,094, ,817,610 Governmental activities capital assets, net $ 157,023,190 $ 26,359,736 $ - $ 183,382,926 42
49 DeSoto Independent School District Notes to the Basic Financial Statements Depreciation expense is charged as direct expense to programs of the District as follows: Governmental activities Instruction $ 3,571,969 Instructional resources & media services 53,900 Curriculum & staff development 107,800 Instructional leadership 229,601 School leadership 377,301 Guidance, counseling & evaluation services 269,501 Social work services 1,947 Student transportation 53,900 Health services 173,140 Food services 240,462 Cocurricular/extracurricular activities 124,455 General administration 215,984 Plant maintenance and operations 254,685 Security & monitoring services 199,250 Data processing services 389,456 Community services 53,900 Total depreciation expense - governmental activities $ 6,317,251 Construction Commitments The District had an active construction project as of June 30, The project included an elementary school construction as well as street construction to the surrounding area. Fiscal year 2018 expenses and estimated future expenditures for capital projects are funded from bond proceeds and a note payable. The following summarizes the projects in process at year end: Expenditures Estimated Estimated Total Incurred to Future Project Cost 6/30/2018 Expenditures Katharine Johnson Academy Elementary School $ 25,346,269 $ 23,697,777 $ 1,648,492 Total ongoing construction $ 25,346,269 $ 23,697,777 $ 1,648,492 Note 5. Long-Term Debt Long-term debt includes par bonds, capital appreciation (deep discount) serial bonds, maintenance tax notes, and notes payable. All long-term debt represents transactions in the District's governmental activities. The District has entered into a continuing disclosure undertaking to provide Annual Reports and Material Event Notices to the State Information Depository of Texas (SID), which is the Municipal Advisory Council. This information is required under SEC Rule 15c2-12 to enable investors to analyze the financial condition and operations of the District. 43
50 DeSoto Independent School District Notes to the Basic Financial Statements The following is a summary of the changes in the District's long-term debt for the fiscal year ended June 30, 2018: Interest Amounts Amounts Issued Amounts Due Rate Original Outstanding Current Retired/ Outstanding Within Description Payable Issue July 1, 2017 Year Refunded June 30, 2018 One Year Bonded indebtedness 1995 School Building and Refunding Bonds % $ 27,022,385 $ 790,000 $ - $ 135,000 $ 655,000 $ 130, School Building and Refunding Bonds % 15,768,251 1,501, ,955 1,198, , School Building and Refunding Bonds % 64,851, , , School Building and Refunding Bonds % 36,123, A Refunding Bonds % 8,491,469 3,481, ,481, B Refunding Bonds % 31,994,992 27,070,000-1,595,000 25,475,000 1,235, Refunding Bonds % 4,995,925 4,995, ,000 4,520, , Refunding Bonds % 37,262,193 33,632,193-2,075,000 31,557,193 2,040, A Refunding Bonds % 7,640,000 6,190,000-1,465,000 4,725,000 1,505, B Refunding Bonds % 28,400,000 28,400,000-1,235,000 27,165, , A Refunding Bonds % 1,110,000 1,110,000-55,000 1,055,000 30, B Refunding Bonds % 26,750,000 26,750, ,750,000 - Total bonded indebtedness 134,434,614-7,337, ,096,659 6,478,045 Accreted interest - Capital appreciation bonds 65,122,238 6,612,480 3,162,045 68,572,673 4,095,289 Bond premiums 9,155, ,141 8,612,397 - Maintenance Tax Notes Series ,675, ,000 8,215, ,000 Note payable 5,152, ,152, ,848 Net pension liability 19,645,607 5,535,840 5,678,660 19,502,787 - Net OPEB liability 59,768,193 5,729 25,919,545 33,854,377 - Compensated absences - 146, ,054 - Total other obligations 167,518,725 12,300,103 35,763, ,055,437 4,800,137 Total obligations of District $ 301,953,339 $ 12,300,103 $ 43,101,346 $ 271,152,096 $ 11,278,182 Presented below is a summary of general obligation bond requirements to maturity: Years Ending General Obligation Bonds Total June 30, Principal Interest Requirements 2019 $ 6,478,045 $ 3,726,731 $ 10,204, ,582,551 3,523,369 10,105, ,550,914 3,333,806 9,884, ,819,635 3,206,731 9,026, ,630,879 3,118,456 8,749, ,071,398 14,046,455 39,117, ,302,630 10,115,855 41,418, ,445,601 4,302,663 36,748, ,215, ,388 7,382,394 Totals $ 127,096,659 $ 45,541,454 $ 172,638,113 The 1995, 2001, 2006, 2010A, 2012 and 2013 bond series include Capital Appreciation Bonds. No interest is paid on these bonds prior to maturity. The bonds mature variously through Interest accrues on these bonds semi-annually even though the interest is not paid until maturity. 44
51 DeSoto Independent School District Notes to the Basic Financial Statements General obligation bonds are direct obligations issued on a pledge of the general taxing power for the payment of the debt obligations of the District. General obligation bonds require the District to compute, at the time taxes are levied, the rate of tax required to provide (in each year bonds are outstanding) a fund to pay interest and principal at maturity. The District is in compliance with this requirement. There are a number of limitations and restrictions contained in the various general obligation bonds indentures. The District is in compliance with all significant limitations and restrictions at June 30, In addition, DeSoto Independent School District Limited Maintenance Tax Notes, Tax Credit 2014 were issued by the District on November 20, 2014, with an interest rate of 1.0%. Debt service payments for the notes will be paid from the general fund. The payment requirements are as follows: Years Ending Maintenance Tax Notes Total June 30, Principal Interest Requirements 2019 $ 470,000 $ 79,800 $ 549, ,000 75, , ,000 70, , ,000 65, , ,000 60, , ,730, ,100 2,951, ,035,000 77,225 3,112,225 Totals $ 8,215,000 $ 648,825 $ 8,863,825 The maintenance tax notes were issued under the federal Qualified Zone Academy Bond (QZAB) program. Under this program, proceeds must be used for specified programs and costs. Lastly, on June 28, 2017, the District entered into a Note Payable with Government Capital Corporation in order to purchase HVAC mechanical retrofits and energy management controls to be installed at District facilities. The property cost was $5,094,849 plus an additional $57,300 in issuance costs, which rolled into the cost of the loan. The total note was $5,152,149 and is seen as an addition on the long-term debt rollforward. The note requires a total payment of $433,532 over 15 periods, maturing on October 15, The first payment will be made on October 15, Debt service payments for the note will be paid from the general fund. The payment requirements are as follows: Years Ending Note Payable Total June 30, Principal Interest Requirements 2019 $ 234,848 $ 198,684 $ 433, , , , , , , , , , , , , ,720, ,050 2,167, ,988, ,804 2,167,660 Totals $ 5,152,149 $ 1,350,833 $ 6,502,982 45
52 DeSoto Independent School District Notes to the Basic Financial Statements Note 6. Property Taxes Property taxes are considered available when collected within the current period or expected to be collected soon enough thereafter to be used to pay liabilities of the current period. The District levies its taxes on October 1 on the assessed (appraised) value listed as of the prior January 1 for all real and business personal property located in the District in conformity with Subtitle E, Texas Property Tax Code. Taxes are due upon receipt of the tax bill and are past due and subject to interest if not paid by February 1 of the year following the October 1 levy date. The assessed value of the property tax roll upon which the levy for the fiscal period was based was $2,793,082,299. Taxes are delinquent if not paid by June 30. Delinquent taxes are subject to both penalty and interest charges plus 15% delinquent collection fees for attorney costs. The tax rates assessed for the period ended June 30, 2018, to finance General Fund operations and the payment of principal and interest on general obligation long-term debt were $1.17 and $0.32 per $100 valuation, respectively, for a total of $1.49 per $100 valuation. Current tax collections for the period ended June 30, 2018 were 98.51% of the June 30, 2018 adjusted tax levy. Delinquent taxes are prorated between maintenance and debt service based on rates adopted for the year of the levy. Allowances for uncollectible taxes within the General and Debt Service Funds are based on historical experience in collecting taxes. Uncollectible personal property taxes are periodically reviewed and written of, but the District is prohibited from writing off real property taxes without specific statutory authority from the Texas Legislature. As of June 30, 2018, property taxes receivable, net of estimated uncollectible taxes, totaled $852,391 and $219,291 for the General and Debt Service Funds, respectively. Property taxes are recorded as receivables and unavailable revenues at the time the taxes are assessed. Revenues are recognized as the related ad valorem taxes are collected. Note 7. Interfund Balances and Activities Interfund receivables and payables at June 30, 2018 represented short-term advances between funds. These amounts are expected to be repaid in less than one year from June 30, Payable Fund Receivable Fund Amount Primary Purpose General fund Capital projects fund $ 226,381 To cover cash shortage Nonmajor governmental funds General fund 2,932,553 To cover cash shortage General fund Nonmajor governmental funds 832 To cover cash shortage $ 3,159,766 Note 8. Defined Benefit Pension Plan A. Plan Description The District participates in a cost-sharing multiple employer defined benefit pension that has a special funding situation. The plan is administered by the Teacher Retirement System of Texas (TRS). It is a defined benefit pension plan established and administered in accordance with the Texas Constitution, Article XVI, Section 67 and Texas Government Code, Title 8, Subtitle C. The pension trust fund is a qualified pension trust under Section 401 (a) of the Internal Revenue Code. The Texas Legislature establishes benefits and contribution rates within the guidelines of the Texas Constitution. The pension's Board of Trustees does not have the authority to establish or amend benefit terms. 46
53 DeSoto Independent School District Notes to the Basic Financial Statements All employees of public, state-supported educational institutions in Texas who are employed for one half or more of the standard work load and who are not exempted from membership under Texas Government Code, Title 8, Section are covered by the system. B. Pension Plan Fiduciary Net Position Detailed information about the Teacher Retirement System's fiduciary net position is available in a separately-issued Comprehensive Annual Financial Report that includes financial statements and required supplementary information. That report may be obtained on the Internet at by writing to TRS at 1000 Red River Street, Austin, Texas, ; or by calling (512) C. Benefits Provided TRS provides service and disability retirement, as well as death and survivor benefits, to eligible employees (and their beneficiaries) of public and higher education in Texas. The pension formula is calculated using 2.3 percent (multiplier) times the average of the five highest annual creditable salaries times years of credited service to arrive at the annual standard annuity except for members who are grandfathered, the three highest annual salaries are used. The normal service retirement is at age 65 with five years of credited service or when the sum of the member's age and years of credited service equals 80 or more years. Early retirement is at age 55 with five years of service credit or earlier than 55 with 30 years of service credit. There are additional provisions for early retirement if the sum of the member's age and years of service credit total at least 80, but the member is less than age 60 or 62 depending on date of employment, or if the member was grandfathered in under a previous rule. There are no automatic post-employment benefit changes; including automatic COLAs. Ad hoc postemployment benefit changes, including ad hoc COLAs can be granted by the Texas Legislature as noted in the Plan Description above. D. Contributions Contribution requirements are established or amended pursuant to Article 16, section 67 of the Texas Constitution which requires the Texas legislature to establish a member contribution rate of not less than 6% of the member's annual compensation and a state contribution rate of not less than 6% and not more than 10% of the aggregate annual compensation paid to members of the system during the fiscal year. Texas Government Code section prohibits benefit improvements, if as a result of the particular action, the time required to amortize TRS' unfunded actuarial liabilities would be increased to a period that exceeds 31 years, or, if the amortization period already exceeds 31 years, the period would be increased by such action. Employee contribution rates are set in state statute, Texas Government Code Senate Bill 1458 of the 83rd Texas Legislature amended Texas Government Code for member contributions and established employee contribution rates for fiscal years 2014 thru The 84th Texas Legislature, General Appropriations Act (GAA) established the employer contribution rates for fiscal years 2016 and Member 7.2% 7.7% 7.7% Non-employer contributing entity (state) 6.8% 6.8% 6.8% Employers/district 6.8% 6.8% 6.8% 47
54 DeSoto Independent School District Notes to the Basic Financial Statements The contributions amount for the District s fiscal year 2018 are as follows: Employer contributions $ 1,999,047 Member contributions 1,977,784 NECE on-behalf contributions 2,896,500 Contributors to the plan include members, employers and the State of Texas as the only non-employer contributing entity. The State is the employer for senior colleges, medical schools and state agencies including TRS. In each respective role, the State contributes to the plan in accordance with state statutes and the General Appropriations Act (GAA). As the non-employer contributing entity for public education and junior colleges, the State of Texas contributes to the retirement system an amount equal to the current employer contribution rate times the aggregate annual compensation of all participating members of the pension trust fund during the fiscal year reduced by the amounts described below which are paid by the employers. Employers (public school, junior college, other entities or the State of Texas as the employer for senior universities and medical schools) are required to pay the employer contribution rate in the following instances: 1. On the portion of the member's salary that exceeds the statutory minimum for members entitled to the statutory minimum under Section of the Texas Education Code. 2. During a new member's first 90 days of employment. 3. When any part or all of an employee's salary is paid by federal funding sources, a privately sponsored source, from non-educational and general, or local funds. 4. When the employing district is a public junior college or junior college district, the employer shall contribute to the retirement system an amount equal to 50% of the state contribution rate for certain instructional or administrative employees; and 100% of the state contribution rate for all other employees. In addition to the employer contributions listed above, there are two additional surcharges an employer is subject to. 1. When employing a retiree of the Teacher Retirement System the employer shall pay both the member contribution and the state contribution as an employment after retirement surcharge. 2. When a school district or charter school does not contribute to the Federal Old-Age, Survivors and Disability Insurance (OASDI) Program for certain employees, they must contribute 1.5% of the state contribution rate for certain instructional or administrative employees; and 100% of the state contribution rate for all other employees. 48
55 DeSoto Independent School District Notes to the Basic Financial Statements E. Actuarial Assumptions The total pension liability in the August 31, 2017 actuarial valuation was determined using the following actuarial assumptions: Valuation date August 31, 2017 Actuarial cost method Individual entry age normal Asset valuation method Market value Single discount rate 8.00% Long-term expected rate 8.00% Municipal bond rate N/A* Last year ending August 31 in the 2017 to 2116 projection period (100 years) 2116 Inflation 2.50% Salary increases including inflation 3.50% to 9.50% Ad hoc post-employment benefit changes None * If a municipal bond rate was to be used, the rate would be 3.42% as of August 2017 (i.e. the rate closest to but not later than the Measurement Date). The source for the rate is the Fixed Income Market Data/Yield Curve/Data Municipal Bonds with 20 years to maturity that include only federally tax-exempt municipal bonds as reported in Fidelity Index s 20-Year Municipal GO AA Index. The actuarial methods and assumptions are based primarily on a study of actual experience for the four year period ending August 31, 2014 and adopted on September 24, Discount Rate The single discount rate used to measure the total pension liability was 8.0%. There was no change in the discount rate since the previous year. The projection of cash flows used to determine the discount rate assumed that contributions from plan members and those of the contributing employers and the nonemployer contributing entity are made at the statutorily required rates. Based on those assumptions, the pension plan's fiduciary net position was projected to be available to make all future benefit payments of current plan members. Therefore, the long-term expected rate of return on pension plan investments was applied to all periods of projected benefit payments to determine the total pension liability. The long-term rate of return on pension plan investments is 8.0%. The long-term expected rate of return on pension plan investments was determined using a building-block method in which best-estimates ranges of expected future real rates of return (expected returns, net of pension plan investment expense and inflation) are developed for each major asset class. These ranges are combined to produce the long-term expected rate of return by weighting the expected future real rates of return by the target asset allocation percentage and by adding expected inflation. 49
56 DeSoto Independent School District Notes to the Basic Financial Statements Best estimates of geometric real rates of return for each major asset class included in the Systems target asset allocation as of August 31, 2017 are summarized below: Global equity Long-Term Expected Geometric Expected Contribution to Long-Term Target Real Rate Portfolio Asset Class Allocation of Return Returns* U.S. 18.0% 4.6% 1.0% Non-U.S. developed 13.0% 5.1% 0.8% Emerging markets 9.0% 5.9% 0.7% Directional hedge funds 4.0% 3.2% 0.1% Private equity 13.0% 7.0% 1.1% Stable value: U.S. treasuries 11.0% 0.7% 0.1% Absolute return 0.0% 1.8% 0.0% Stable value hedge funds 4.0% 3.0% 0.1% Cash 1.0% (0.2%) 0.0% Real return: Global inflation linked bonds 3.0% 0.9% 0.0% Real assets 16.0% 5.1% 1.1% Energy and natural resources 3.0% 6.6% 0.2% Commodities 0.0% 1.2% 0.0% Risk parity Risk parity 5.0% 6.7% 0.3% Inflation expectation 2.2% Alpha 0.0% 1.0% Total 100% 8.7% *The expected contribution to returns incorporates the volatility drag resulting from the conversion between arithmetic and geometric mean returns. F. Discount Rate Sensitivity Analysis The following schedule shows the impact of the net pension liability if the discount rate used was 1% less than and 1% greater than the discount rate that was used (8%) in measuring the net pension liability. 1% Decrease 1% Increase in Discount Rate Discount Rate In Discount Rate (7.00%) (8.00%) (9.00%) District's proportionate share of the net pension liability $ 32,877,845 $ 19,502,787 $ 8,365,880 50
57 DeSoto Independent School District Notes to the Basic Financial Statements G. Pension Liabilities, Pension Expense, Deferred Outflows of Resources, and Deferred Inflows of Resources Related to Pensions At June 30, 2018, the District reported a liability of $19,502,787 for its proportionate share of the TRS's net pension liability. This liability reflects a reduction for State pension support provided to the District. The amount recognized by the District as its proportionate share of the net pension liability, the related State support, and the total portion of the net pension liability that was associated with the District were as follows: District's proportionate share of the collective net pension liability $ 19,502,787 State's proportionate share that is associated with the District 28,317,789 $ 47,820,576 The net pension liability was measured as of August 31, 2017 and the total pension liability used to calculate the net pension liability was determined by an actuarial valuation as of that date. The employer's proportion of the net pension liability was based on the employer's contributions to the pension plan relative to the contributions of all employers to the plan for the period September 1, 2016 thru August 31, At August 31, 2017 the employer's proportion of the collective net pension liability was % an increase of 17% from its proportionate share of % at August 31, Changes since the Prior Actuarial Valuation There were no changes to the actuarial assumptions or other inputs that affected measurement of the total pension liability since the prior measurement period. There were no changes of benefit terms that affected measurement of the total pension liability during the measurement period. For the fiscal year ended June 30, 2018, the District recognized pension expense of $3,527,653 and revenue of $2,159,968 for support provided by the State. 51
58 DeSoto Independent School District Notes to the Basic Financial Statements At June 30, 2018, the District reported its proportionate share of the TRS's deferred outflows of resources and deferred inflows of resources related to pensions from the following sources: Differences between expected and actual Deferred Outflows of Resources Deferred Inflows of Resources economic experience $ 285,335 $ (1,051,760) Changes in actuarial assumptions 888,383 (508,578) Difference between projected and actual investment earnings - (1,421,321) Changes in proportion and difference between the employer's contributions and the proportionate share of contributions 6,137,644 (1,165) Contributions paid to TRS subsequent to the measurement date 1,527,730 - $ 8,839,092 $ (2,982,824) $1,527,730 reported as deferred outflows of resources resulting from District contributions subsequent to the measurement date will be recognized as a reduction of the net pension liability in the year ended June 30, Other amounts reported as deferred outflows and inflows of resources related to pensions will be recognized in pension expense as follows: Years Ending June 30, Pension Expense Amount 2019 $ 667, ,911, , , ,197 Thereafter 331,031 Total $ 4,328,538 Note 9. Defined Other Post-Employment Benefit Plan Plan Description The District participates in the Texas Public School Retired Employees Group Insurance Program (TRS-Care). It is a multiple-employer, cost-sharing defined Other Post-Employment Benefit (OPEB) plan that has a special funding situation. The plan is administered through a trust by the Teacher Retirement System of Texas (TRS) Board of Trustees. It is established and administered in accordance with the Texas Insurance Code, Chapter
59 DeSoto Independent School District Notes to the Basic Financial Statements OPEB Plan Fiduciary Net Position Detailed information about the TRS-Care s fiduciary net position is available in the separately issued TRS Comprehensive Annual Financial Report that includes financial statements and required supplementary information. That report may be obtained on the Internet at by writing to TRS at 1000 Red River Street, Austin, Texas, ; or by calling (512) Benefits Provided TRS-Care provides a basic health insurance coverage (TRS-Care 1), at no cost to all retirees from public schools, charter schools, regional education service centers and other educational districts who are members of the TRS pension plan. Optional dependent coverage is available for an additional fee. Eligible retirees and their dependents not enrolled in Medicare may pay premiums to participate in one of two optional insurance plans with more comprehensive benefits (TRS-Care 2 and TRS-Care 3). Eligible retirees and dependents enrolled in Medicare may elect to participate in one of the two Medicare health plans for an additional fee. To qualify for TRS-Care coverage, a retiree must have at least 10 years of service credit in the TRS pension system. The Board of Trustees is granted the authority to establish basic and optional group insurance coverage for participants as well as to amend benefit terms as needed under Chapter There are no automatic post-employment benefit changes; including automatic COLAs. The premium rates for the optional health insurance are based on years of service of the member. The schedule below shows the monthly rates for the average retiree with Medicare Parts A&B coverage, with 20 to 29 years of service for the basic plan and the two optional plans. TRS-Care 1 TRS-Care 2 TRS-Care 3 Basic Plan Optional Plan Optional Plan Retiree* $ - $ 70 $ 100 Retiree and spouse Retiree* and children Retiree and family Surviving children only * or surviving spouse Contributions Contribution rates for the TRS-Care plan are established in state statute by the Texas Legislature, and there is no continuing obligation to provide benefits beyond each fiscal year. The TRS-Care plan is currently funded on a pay-as-you-go basis and is subject to change based on available funding. Funding for TRS-Care is provided by retiree premium contributions and contributions from the state, active employees, and school districts based upon public school district payroll. The TRS Board of trustees does not have the authority to set or amend contribution rates. 53
60 DeSoto Independent School District Notes to the Basic Financial Statements Texas Insurance Code, section establishes the state s contribution rate which is 1.0% of the employee s salary. Section establishes the active employee s rate which is.65% of pay. Section establishes an employer contribution rate of not less than 0.25 percent or not more than 0.75 percent of the salary of each active employee of the public. The actual employer contribution rate is prescribed by the Legislature in the General Appropriations Act. The following table shows contributions to the TRS-Care plan by type of contributor Active employee 0.65% 0.65% Non-employer contribution entity (state) 1.25% 1.00% Employers/District 0.75% 0.55% Federal/private funding remitted by employers 1.25% 1.00% The contribution amounts for the District s fiscal year 2018 are as follows: District contributions $ 404,747 Member contributions 166,010 NECE on-behalf contributions (state) 569,307 In addition to the employer contributions listed above, there is an additional surcharge all TRS employers are subject to (regardless of whether or not they participate in the TRS Care OPEB program). When employers hire a TRS retiree, they are required to pay to TRS Care, a monthly surcharge of $535 per retiree. TRS-Care received supplemental appropriations from the State of Texas as the Non-Employer Contributing Entity in the amount of $15.6 million in fiscal year 2017 and $212 million in fiscal year
61 DeSoto Independent School District Notes to the Basic Financial Statements Actuarial Assumptions The total OPEB liability in the August 31, 2017 actuarial valuation was determined using the following actuarial assumptions: Rates of mortality Rates of retirement Rates of termination General inflation Wage inflation Expected payroll growth Additional Actuarial Methods and Assumptions: Valuation date August 31, 2017 Actuarial cost method Individual entry age normal Inflation 2.50% Discount rate* 3.42%* Aging factors Based on plan specific experience Expenses third-party administrative expenses related to the delivery of health care benefits are included in the age- adjusted claims costs. Payroll growth rate 2.50% Projected salary increases** 3.50% to 9.50%** Healthcare trend rates*** 4.50% to 12.00%*** Election Rates Ad hoc post-employment benefit changes Normal retirement: 70% participation prior to age 65 and 75% participation after age 65 None *Source: Fixed income municipal bonds with 20 years to maturity that include only federal tax-exempt municipal bonds as reported in Fidelity Index s 20-Year Municipal GO AA Index as of August 31, **Includes inflation at 2.50% ***Initial trend rates are 7.00% for non-medicare retiree; 10.00% for Medicare retirees and 12.00% for prescriptions for all retirees. Initial trend rates decrease to an ultimate trend rate of 4.50% over a period of ten years. Discount Rate A single discount rate of 3.42% was used to measure the total OPEB liability. There was a change of.44 percent in the discount rate since the previous year. Because the plan is essentially a pay-as-yougo plan, the single discount rate is equal to the prevailing municipal bond rate. The projection of cash flows used to determine the discount rate assumed that contributions from active members and those of the contributing employers and the non-employer contributing entity are made at the statutorily required rates. Based on those assumptions, the OPEB plan s fiduciary net position was projected to not be able to make all future benefit payments of current plan members. Therefore, the municipal bond rate was applied to all periods of projected benefit payments to determine the total OPEB liability. 55
62 DeSoto Independent School District Notes to the Basic Financial Statements Sensitivity of the Net OPEB Liability Discount Rate The following schedule shows the impact of the net OPEB liability if the discount rate used was 1% less than and 1% greater than the discount rate that was used (3.42%) in measuring the net OPEB liability. Sensitivity of the Net OPEB Liability to the Single Discount Rate Assumptions Current 1% Decrease Discount Rate 1% Increase (2.42%) (3.42%) (4.42%) $ 39,956,570 $ 33,854,377 $ 28,949,591 Healthcare Cost Trend Rates The following presents the net OPEB liability of the plan using the assumed healthcare cost trend rate, as well as what the net OPEB liability would be if it were calculated using a trend rate that is onepercentage point lower or one-percentage point higher than the assumed health-care cost trend rate Sensitivity of the Net OPEB Liability to the Healthcare Cost Trend Rate Assumptions Current Healthcare Cost 1% Decrease Trend Rate 1% Increase $ 28,187,151 $ 33,854,377 $ 41,290,492 OPEB Liabilities, OPEB Expense, and Deferred Outflows of Resources, and Deferred Inflows of Resources Related to OPEBs At June 30, 2018, the District reported a liability of $33,854,377 for its proportionate share of the TRS s net OPEB liability. This liability reflects a reduction for State OPEB support provided to the District. The amount recognized by the District as its proportionate share of the net OPEB liability, the related State support, and the total portion of the net OPEB liability that was associated with the District were as follows: District's proportionate share of the net OPEB liability $ 33,854,377 State's proportionate share of the net OPEB liability associated with the District 47,618,752 Total $ 81,473,129 The net OPEB liability was measured as of August 31, 2017 and the total OPEB liability used to calculate the net OPEB liability was determined by an actuarial valuation as of that date. The employer s proportion of the net OPEB liability was based on the employer s contributions to the OPEB plan relative to the contributions of all employers to the plan for the period September 1, 2016 thru August 31, At August 31, 2017, the employer s proportion of the collective net OPEB liability was % which was the same proportion measured as of August 31,
63 DeSoto Independent School District Notes to the Basic Financial Statements Changes since the Prior Actuarial Valuation The following were changes to the actuarial assumptions or other inputs that affected measurement of the Total OPEB liability since the prior measurement period. 1. Effective January 1, 2018, only one health plan option will exist (instead of three), and all retirees will be required to contribute monthly premiums for coverage. The health plan changes triggered changes to several of the assumptions, including participation rates, retirement rates, and spousal participation rates. 2. The August 31, 2016 valuation had assumed that the savings related to the Medicare Part D reimbursements would phase out by This assumption was removed for the August 31, 2017 valuation. Although there is uncertainty regarding these federal subsidies, the new assumption better reflects the current substantive plan. This change was unrelated to the plan amendment, and its impact was included as an assumption change in the reconciliation of the total OPEB liability. This change significantly lowered the OPEB liability. 3. The discount rate changed from 2.98 percent as of August 31, 2016 to 3.42 percent as of August 31, This change lowered the total OPEB liability. There were no changes of benefit terms that affected measurement of the total OPEB liability during the measurement period. GASB 75 requires the District to record OPEB expense for the amount of the State s proportionate share of the collective OPEB expense that is allocated to the District and record revenue in the same amount for the support provided for the State. For the measurement period ended August 31, 2017, the State s proportionate share of the collective OPEB expense was a negative expense of $8,504,163,580 and the District s proportionate share is a negative $15,934,501. The amount is recorded as a negative revenue and negative expense for the District s year ended June 30, For the year ended June 30, 2018, the District recognized total negative OPEB expense of ($27,788,019), which includes both the District s proportionate share of the collective OPEB expense and the State s proportionate share of the collective OPEB expense that is allocated to the District as described above. At June 30, 2018, the District reported its proportionate share of the TRS s deferred outflows of resources and deferred inflows of resources related to other post-employment benefits from the following sources: Deferred Outflows of Resources Deferred Inflows of Resources Differences between expected and actual economic experience $ - $ (706,736) Changes of assumptions - (13,454,614) Net difference between projected and actual earnings on pension plan investments 5,143 - Changes in proportion and differences between District contributions and proportionate share of contributions (cost-sharing plan) District contributions after measurement date 430,222 - Totals $ 435,521 $ (14,161,350) 57
64 DeSoto Independent School District Notes to the Basic Financial Statements $430,222 reported as deferred outflows of resources related to OPEB resulting from District contributions subsequent to the measurement date will be recognized as a reduction of the net OPEB liability in the year ended June 30, The net amounts of the employer s balances of deferred outflows and inflows of resources related to OPEB will be recognized in OPEB expense as follows: Years Ending June 30, 2019 $ (1,867,907) 2020 (1,867,907) 2021 (1,867,907) 2022 (1,867,907) 2023 (1,869,193) Thereafter (4,815,230) Total $ (14,156,051) Note 10. Health Care During the period ended June 30, 2018, employees of the District were covered by a health insurance plan (the Plan). The District contributed $351 per month per employee to the Plan and employees, at their option, authorized payroll withholdings to pay any additional contribution and contributions for dependents. All contributions were paid to a fully insured plan. Note 11. Workers Compensation The District participates in the Workers Compensation Solutions Workers Compensation Self-Insurance Joint Fund. Workers Compensation Solutions has performed an evaluation of claims submitted for incidents occurring prior to June 30, 2018, and has projected open claims and incurred but not reported claims will cost $92,968. Edwards Risk Management, Inc. provides claims administration. Reinsurance is provided for individual claim losses exceeding $450,000 and aggregate losses exceeding $2,000,000 for the entire pool. The fixed cost charge is based on total payroll paid by the District. Increases or decreases in the fixed costs will adjust subsequent year charges. Changes in workers compensation claims liability amounts for the last three fiscal years are represented below: Beginning Claims and Fiscal of Period Changes in Claims End of Period Year Claims Liability Estimates Payments Claims Liability 2018 $ 26,838 $ 421,058 $ 354,928 $ 92, , , ,765 26, , , , ,181 58
65 DeSoto Independent School District Notes to the Basic Financial Statements Note 12. Due from Other Governments The District participates in a variety of federal and state programs from which it receives grants to partially or fully finance certain activities. In addition, the District receives entitlements from the State through the School Foundation, Per Capita, Existing Debt Allotment, and Instruction Facilities Allotment Programs. Amounts due from federal and state governments as of June 30, 2018, are summarized below. All federal grants shown below are passed through the Agency and are reported as due from other governments. State Federal Local Fund Entitlements Government Governments Total General $ 12,194,132 $ 418,600 $ - $ 12,612,732 Special revenue 156,428 3,255,047-3,411,475 Debt service 1, ,188 Total $ 12,351,748 $ 3,673,647 $ - $ 16,025,395 Note 13. Litigation and Contingencies The District is a party to various legal actions, none of which are believed by administration to have a material effect on the financial condition of the District. Accordingly, no provision for losses has been recorded in the accompanying basic financial statements for such contingencies. The District participates in numerous state and Federal grant programs which are governed by various rules and regulations of the grantor agencies. Costs charged to the respective grant programs are subject to audit and adjustment by the grantor agencies; therefore, to the extent that the District has not complied with the rules and regulations governing the grants, if any, refunds of any money received may be required and the collectability of any related receivable at June 30, 2018 may be impaired. In the opinion of the District, there are no significant contingent liabilities relating to compliance with the rules and regulations governing the respective grants; therefore, no provision has been recorded in the accompanying combined financial statements for such contingencies. Governmental bonds issued after August 31, 1986 are subject to the rebate provisions of the Tax Reform Act of The rebate applies to earnings from bond issue proceed investments that exceed bond issue stated interest rates. The formula is based on a five year history, therefore the exact amount of liability, if any, is unknown until five years from the bond issuance date. This calculation yielded no known material rebate liability as of June 30,
66 DeSoto Independent School District Notes to the Basic Financial Statements Note 14. Revenues from Local and Intermediate Sources During the current year, revenues from local and intermediate sources in the governmental funds consisted of the following: General Special Debt Capital Fund Revenue Funds Service Fund Projects Fund Total Property taxes $ 31,691,771 $ - $ 8,681,818 $ - $ 40,373,589 Food sales - 1,110, ,110,479 Investment income 165,319 15,058 81, , ,060 Penalties, interest and other tax related income 227,463-70, ,715 Co-curricular student activities 226, , ,795 Other 671, , ,201,120 Total $ 32,982,974 $ 1,905,629 $ 8,833,647 $ 238,508 $ 43,960,758 Note 15. Unearned and Unavailable Revenue Unearned and unavailable revenue reported in the governmental funds at June 30, 2018 consisted of the following: Special Revenue Debt Service General Fund Fund Fund Total Net tax unavailable revenue $ 727,129 $ - $ 183,278 $ 910,407 SHARS unavailable revenue 410, ,094 Total unavailable revenue $ 1,137,223 $ - $ 183,278 $ 1,320,501 Other unearned revenue $ - $ 138,151 $ - $ 138,151 Total unearned revenue $ - $ 138,151 $ - $ 138,151 Revenue that is not considered available at year end is reported as a deferred inflow of resources in the governmental funds and is recorded as revenue in the government-wide financial statements. Accordingly, tax and SHARS revenues are reported as revenue in the government-wide financial statements. Note 16. Excess of Expenditures over Appropriations by Function The Texas Education Agency (the Agency) requires the budgets for certain governmental funds to be filed with the Agency. The budget should not be exceeded in any functional category under the Agency s requirements. Expenditures exceeded appropriations in four functional categories in the general fund and one functional category in the food service fund for the fiscal year ended June 30,
67 DeSoto Independent School District Notes to the Basic Financial Statements Note 17. Prior Period Adjustment Net position at July 1, 2017 was restated per the following table for the implementation of GASB 75: Governmental Activities Beginning net position, as previously reported $ (15,696,710) Implementation of GASB 75 for OPEB (59,433,724) Beginning net position, restated $ (75,130,434) Note 18. Nonmonetary Transactions During 2018, the District received textbooks purchased by the State of Texas for the benefit of the District for a purchase price of $652,673. The District receives the textbooks as part of state funding for textbook allotment. The textbooks have been recorded in the amount of $652,673 in a special revenue fund as both state revenues and expenditures, which represents the amount of consideration given by the State of Texas 61
68 This Page Intentionally Left Blank 62
69 Required Supplementary Information 63
70 DeSoto Independent School District Exhibit G-1 Budgetary Comparison Schedule General Fund For the Year Ended June 30, 2018 Variance with Data Final Budget Control Budgeted Amounts Actual Amounts Positive or Codes Original Final (GAAP BASIS) (Negative) REVENUES 5700 Local and intermediate sources $ 33,203,204 $ 32,929,339 $ 32,982,974 $ 53, State program revenues 54,377,212 53,719,969 53,657,881 (62,088) 5900 Federal program revenues 925, , ,659 (93,341) 5020 Total revenues 88,505,416 87,574,308 87,472,514 (101,794) EXPENDITURES Current 0011 Instruction 49,583,662 50,188,799 49,513, , Instructional resources and media services 848, , ,401 93, Curriculum and instructional staff development 1,443,886 1,550,070 1,077, , Instructional leadership 2,695,313 2,609,263 2,489, , School leadership 5,750,936 5,853,398 5,868,742 (15,344) 0031 Guidance, counseling and evaluation services 4,243,304 3,639,815 3,609,519 30, Social work services 350, , ,245 90, Health services 942, , ,487 18, Student (pupil) transportation 2,347,096 2,557,096 2,506,104 50, Food services ,240 (56,240) 0036 Extracurricular activities 2,779,424 2,921,848 2,829,335 92, General administration 4,050,867 4,405,979 4,626,489 (220,510) 0051 Facilities maintenance and operations 8,340,030 8,654,685 8,361, , Security and monitoring services 763, , ,872 88, Data processing services 2,653,004 2,934,704 2,682, , Community services 698, ,757 1,261,826 (372,069) Debt service Principal on long-term debt 460, , , Interest on long-term debt 84,450 84,450 84,450 - Capital outlay 0081 Facilities acquisition and construction - 5,094,849 4,585, ,485 Intergovernmental 0095 Payments to Juvenile Justice Alternative Education Program 35,000 35,000 9,612 25, Other intergovernmental charges 127, , ,847 - Total expenditures 88,198,207 95,011,913 92,863,659 2,148, Excess (deficiency) of revenues 307,209 (7,437,605) (5,391,145) 2,046,460 over (under) expenditures 1200 Net change in fund balances 307,209 (7,437,605) (5,391,145) 2,046, Fund balance - beginning 18,607,929 18,607,929 18,607, FUND BALANCE - ENDING $ 18,915,138 $ 11,170,324 $ 13,216,784 $ 2,046,460 The Notes to the Required Supplementary Information are an integral part of this schedule. 64
71 DeSoto Independent School District Exhibit G-2 Schedule of the District s Proportionate Share of the Net Pension Liability of a Cost-Sharing Multiple-Employer Pension Plan Teacher Retirement System of Texas For the Last Four Fiscal Years District's proportion of the net pension liability % % % % District's proportionate share of net pension liability $ 19,502,787 $ 19,645,607 $ 17,610,035 $ 8,986,830 State's proportionate share of the net pension liability associated with the District 28,317,789 33,950,679 31,354,989 25,809,819 TOTALS $ 47,820,576 $ 53,596,286 $ 48,965,024 $ 34,796,649 District's covered payroll $ 60,949,899 $ 55,996,281 $ 51,070,870 $ 47,685,980 District's proportionate share of the net pension liability as a percentage of its covered payroll 32.00% 35.08% 34.48% 18.85% Plan fiduciary net position as a percentage of the total pension liability 82.17% 78.00% 78.43% 83.25% Note: GASB 68, 81,2,a requires that the information on this schedule be data from the period corresponding with the period covered as of the measurement date of August 31, the period from September 1, August 31, Note: Ten years of data is not available. The Notes to the Required Supplementary Information are an integral part of this schedule. 65
72 DeSoto Independent School District Exhibit G-3 Schedule of the District s Contributions to the Teacher Retirement System of Texas Pension Plan For the Last Four Fiscal Years TRS Contractually required contribution $ 1,863,057 $ 1,255,991 $ 1,622,610 $ 1,342,111 Contributions in relation to contractually required contribution (1,863,057) (1,255,991) (1,622,610) (1,342,111) CONTRIBUTIONS DEFICIENCY (EXCESS) $ - $ - $ - $ - District's covered payroll $ 59,288,941 $ 60,392,297 $ 54,874,390 $ 49,824,480 Contributions as a percentage of covered payroll 3.14% 2.08% 2.96% 2.69% Note: GASB 68, Paragraph 81.2.b requires that the data in this schedule be presented as of the District's current fiscal year as opposed to the time period covered by the measurement date of September 1, August 31, Note: Ten years of data is not available. The Notes to the Required Supplementary Information are an integral part of this schedule. 66
73 DeSoto Independent School District Exhibit G-4 Schedule of the District s Proportionate Share of the Net OPEB Liability of a Cost-Sharing Multiple-Employer OPEB Plan Teacher Retirement System of Texas Last Fiscal Year 2018 District's proportion of the net OPEB liability % District's proportionate share of net OPEB liability $ 33,854,377 State's proportionate share of the net OPEB liability associated with the District 47,618,752 TOTALS $ 81,473,129 District's covered payroll $ 60,949,899 District's proportionate share of the net OPEB liability as a percentage of its covered payroll 55.54% Plan fiduciary net position as a percentage of the total OPEB liability 0.91% Note: GASB 68, 81,2,a requires that the information on this schedule be data from the period corresponding with the period covered as of the measurement date of August 31, 2017 through the period from September 1, August 31, Note: Ten years of data is not available. The Notes to the Required Supplementary Information are an integral part of this schedule. 67
74 DeSoto Independent School District Exhibit G-5 Schedule of the District s Contributions to the Teacher Retirement System of Texas OPEB Plan Last Fiscal Year 2018 TRS Contractually required contribution $ 499,063 Contributions in relation to contractually required contribution (499,063) CONTRIBUTIONS DEFICIENCY (EXCESS) $ - District's covered payroll $ 59,288,941 Contributions as a percentage of covered payroll 0.84% Note: GASB 68, Paragraph 81.2.b requires that the data in this schedule be presented as of the District's current fiscal year as opposed to the time period covered by the measurement date of September 1, August 31, Note: Ten years of data is not available. The Notes to the Required Supplementary Information are an integral part of this schedule. 68
75 DeSoto Independent School District Notes to the Required Supplementary Information Note 1. Budgetary Data A. Budgetary Information The official budget was prepared for adoption for the general, child nutrition, and debt service funds. The following procedures are followed in establishing the budgetary data reflected in the basic financial statements: 1. Prior to June 20 of the preceding fiscal year, the District prepares a budget for the next succeeding fiscal year beginning July A meeting of the Board is called for the purpose of adopting the proposed budget with public notice given at least 10 days prior to the meeting. 3. Prior to the expenditures of funds, the budget is adopted by the Board. After adoption, the budget may be amended through action by the Board. Budget amendments are approved at the functional expenditure level. All amendments are before the fact and reflected in the official minutes of the Board. Budgets are controlled at the functional level by personnel responsible for the organizational financial reporting. All budget appropriations lapse at the year end. Budget amendments throughout the year were not significant. B. Excess of Expenditures over Appropriations For the fiscal year ended June 30, 2018, expenditures exceeded appropriations in the functions (the legal level of budgetary control) of the functions: Fund Function Final Budget Actual Variance General fund School leadership $ 5,853,398 $ 5,868,742 $ (15,344) General fund Food services - 56,240 (56,240) General fund General administration 4,405,979 4,626,489 (220,510) General fund Community services 889,757 1,261,826 (372,069) Function 23 - The District s variance is due to payroll exceeding the budget for the anticipated opening of the new elementary school in August Function 35 - The District s variance is due to the reimbursement to the Food Service Fund for meal charges by students that were unpaid at the end of the year and had not been budgeted. Function 41 The District s variance is due to outside legal service billings that were not received in a timely fashion to amend the budget prior to the end of the fiscal year. Function 61 The District s variance is due to a reclassification of expenditures, the majority of which are payroll related, for a federal grant that was overspent during the grant year and had to be reclassified when discovered by the District after the close of the fiscal year. 69
76 This Page Intentionally Left Blank 70
77 Combining Schedules 71
78 DeSoto Independent School District Combining Balance Sheet Nonmajor Governmental Funds June 30, Data Child Care ESEA 1, A Control Development Improving IDEA - Part B IDEA - Part B IDEA - Part B Codes Block Grant Basic Program Formula Preschool Discretionary ASSETS 1110 Cash and cash equivalents $ - $ - $ - $ - $ 2, Due from other governments 82, , ,695 31, Accrued interest Due from other funds Other receivables TOTAL ASSETS $ 82,664 $ 695,673 $ 528,695 $ 31,684 $ 2,786 LIABILITIES 2110 Accounts payable $ 112 $ 11,447 $ 977 $ - $ Accrued wages payable - 89, ,492 3, Due to other funds 82, , ,226 28, Due to other governments , Unearned revenues Total liabilities 82, , ,695 31,684 2,786 FUND BALANCES Restricted 3450 Federal or state funds grant restriction Committed 3545 Other committed fund balance Total fund balances TOTAL LIABILITIES AND FUND BALANCES $ 82,664 $ 695,673 $ 528,695 $ 31,684 $ 2,786 72
79 Exhibit H-1 Page 1 of National Career and ESEA II, A Title III, A Investing in Breakfast and Technical - Training and English Lang. Innovation Lunch Program Basic Grant Recruiting Acquisition A2 & E2 GEAR UP Grant $ 1,058,690 $ - $ - $ - $ - $ 153,957 $ - - 2,729 87,621 22, , , , , $ 1,060,480 $ 2,729 $ 87,621 $ 22,539 $ 724,502 $ 153,957 $ 412,450 $ 40,825 $ - $ - $ - $ 8,885 $ 38,196 $ 6,664 11,305-28,150-13,776 26,934 27,164 41,609 2,729 59,471 22, , , ,986-93,739 2,729 87,621 22, , , , , , $ 1,060,480 $ 2,729 $ 87,621 $ 22,539 $ 724,502 $ 153,957 $ 412,450 73
80 DeSoto Independent School District Combining Balance Sheet Nonmajor Governmental Funds Continued June 30, Data Other Visually Teacher State Control Federal Title IV, B Impaired Training Textbook Codes Grants 21st Century SSVI Reimbursement Fund ASSETS 1110 Cash and cash equivalents $ 8,529 $ - $ 977 $ 8,130 $ Due from other governments 82, , , Accrued interest Due from other funds Other receivables TOTAL ASSETS $ 90,970 $ 516,742 $ 977 $ 8,130 $ 156,428 LIABILITIES 2110 Accounts payable $ - $ 1,841 $ - $ - $ Accrued wages payable , Due to other funds 81, , , Due to other governments 6, Unearned revenues 2, , Total liabilities 90, , , ,428 FUND BALANCES Restricted 3450 Federal or state funds grant restriction ,280 - Committed 3545 Other committed fund balance Total fund balances , TOTAL LIABILITIES AND FUND BALANCES $ 90,970 $ 516,742 $ 977 $ 8,130 $ 156,428 74
81 Exhibit H-1 Page 2 of Total Other State Campus Meadows McCowan Nonmajor Special Activity Foundation MS STEM Governmental Revenue Funds Funds Grant Grant Grant Funds $ 32,468 $ 325,811 $ 5,077 $ 3,324 $ 16,079 $ 1,615, , ,411,475-2, , , ,019 $ 170,561 $ 330,327 $ 5,077 $ 3,324 $ 16,079 $ 5,104,395 $ - $ 1,726 $ - $ - $ - $ 110,673 71, ,738 82,750 11, ,932, , ,853 16,528-5,077 3,324 16, , ,561 15,921 5,077 3,324 16,079 3,820, , , , , ,283,427 $ 170,561 $ 330,327 $ 5,077 $ 3,324 $ 16,079 $ 5,104,395 75
82 DeSoto Independent School District Combining Statement of Revenues, Expenditures and Changes in Fund Balances Nonmajor Governmental Funds For the Fiscal Year Ended June 30, Data Child Care ESEA 1, A Control Development Improving IDEA - Part B IDEA - Part B IDEA - Part B Codes Block Grant Basic Program Formula Preschool Discretionary REVENUES 5700 Local and intermediate sources $ - $ - $ - $ - $ State program revenues Federal program revenues 304,375 1,950,127 1,836,417 26,529 72, Total revenues 304,375 1,950,127 1,836,417 26,529 72,080 EXPENDITURES Current 0011 Instruction 205,311 1,647,437 1,068,968 26,529 72, Curriculum and instructional staff development 13, , Instructional leadership 24, ,021 12, School leadership - 2, Guidance, counseling and evaluation services , Social work services 44, Food services Extracurricular activities General administration 8, Data processing services Community services 8,835 10, Total expenditures 304,375 1,950,127 1,836,417 26,529 72, Net change in fund balance Fund balance - beginning FUND BALANCE - ENDING $ - $ - $ - $ - $ - 76
83 Exhibit H-2 Page 1 of National Career and ESEA II, A Title III, A Investing in Breakfast and Technical - Training and English Lang. Innovation Lunch Program Basic Grant Recruiting Acquisition A2 & E2 GEAR UP Grant $ 1,125,537 $ - $ - $ - $ - $ - $ - 130, ,561,744 82, ,535 40,950 1,227,172 1,229, ,410 6,818,109 82, ,535 40,950 1,227,172 1,229, ,410-82,026-29, , , , ,535 10, ,159-7, , , , ,040, ,000 16,670 5, , ,075 7,040,955 82, ,535 40,950 1,227,172 1,229, ,410 (222,846) ,189, $ 966,741 $ - $ - $ - $ - $ - $ - 77
84 DeSoto Independent School District Combining Statement of Revenues, Expenditures and Changes in Fund Balances Nonmajor Governmental Funds For the Fiscal Year Ended June 30, Data Summer Visually Teacher State Control School Title IV, B Impaired Training Textbook Codes LEP 21st Century SSVI Reimbursement Fund REVENUES 5700 Local and intermediate sources $ - $ - $ - $ - $ State program revenues , , Federal program revenues 152,609 1,567, Total revenues 152,609 1,567,670-2, ,673 EXPENDITURES Current 0011 Instruction 123, , Curriculum and instructional staff development 15, Instructional leadership School leadership 12, Guidance, counseling and evaluation services Social work services Food services Extracurricular activities General administration Data processing services Community services - 1,567, Total expenditures 152,609 1,567, , Net change in fund balance , Fund balance - beginning FUND BALANCE - ENDING $ - $ - $ - $ 2,280 $ - 78
85 Exhibit H-2 Page 2 of Total Other State Campus Meadows McCowan Non-Major Special Activity Foundation MS STEM Governmental Revenue Funds Funds Grant Grant Grant Funds $ 27,125 $ 752,967 $ - $ - $ - $ 1,905, , ,209 1,132, ,092, , , ,209 18,130, , ,209 5,164,195 28, ,164 28, ,176, ,547 74, ,317 51, , ,040, , , , ,622 3, ,699, , , ,209 18,316,210-34, (185,783) - 279, ,469,210 $ - $ 314,406 $ - $ - $ - $ 1,283,427 79
86 This Page Intentionally Left Blank 80
87 Required T.E.A. Schedules 81
88 DeSoto Independent School District Schedule of Revenues, Expenditures and Changes in Fund Balance Schedule of Delinquent Taxes Receivable For the Fiscal Year Ended June 30, 2018 (1) (2) (3) Tax Rates Assessed/ Appraised Value Last Ten Debt for School Years Maintenance Service Tax Purposes 2009 Combined and prior years Various Various 2009 and prior ,233,596, ,105,349, ,096,688, ,066,718, ,093,189, ,216,234, ,382,114, ,541,291, School year under audit ,793,082, TOTALS 82
89 Exhibit J-1 (10) (20) (31) (32) (40) (50) Beginning Debt Ending Balance Current Year's Maintenance Service Entire Year's Balance July 1, 2017 Total Levy Collections Collections Adjustments June 30, 2018 $ 314,218 $ - $ 43,924 $ 13,626 $ (18,682) $ 237,986 60,659-7,635 3,304 (2,248) 47,472 61,303-8,424 3,645 (653) 48,581 70,556-12,277 4,722 (773) 52, ,830-20,476 7,875 (3,986) 76, ,490-26,975 11,672 6,582 91, ,598-38,654 15,982 (1,692) 125, ,123-62,807 15,568 2, , , ,142 29,779 (184,748) 246,625-40,346,332 31,339,110 8,571, , ,341 $ 1,733,071 $ 40,346,332 $ 31,680,424 $ 8,677,552 $ (35,311) $ 1,686,116 83
90 DeSoto Independent School District Exhibit J-2 Schedule of Revenues, Expenditures and Changes in Fund Balance Budgetary Comparison Schedule Child Nutrition Program For the Fiscal Year Ended June 30, 2018 Variance with Data Actual Final Budget Control Budgeted Amounts Amounts Positive of Codes Original Final (GAAP BASIS) (Negative) REVENUES 5700 Total local and intermediate sources $ 1,207,500 $ 1,070,901 $ 1,125,537 $ 54, State program revenues 35, , , Federal program revenues 5,131,357 5,258,076 5,561, , Total revenues 6,373,857 6,459,805 6,818, ,304 EXPENDITURES 0035 Food services 6,873,857 6,792,515 7,040,955 (248,440) 6030 Total expenditures 6,873,857 6,792,515 7,040,955 (248,440) 1200 Net change in fund balance (500,000) (332,710) (222,846) 109, Fund balance - beginning 1,189,587 1,189,587 1,189, FUND BALANCE - ENDING $ 689,587 $ 856,877 $ 966,741 $ 109,864 84
91 DeSoto Independent School District Exhibit J-3 Schedule of Revenues, Expenditures, and Changes in Fund Balance Budgetary Comparison Schedule Debt Service Fund For the Fiscal Year Ended June 30, 2018 Variance with Data Actual Final Budget Control Budgeted Amounts Amounts Positive of Codes Original Final (GAAP BASIS) (Negative) REVENUES 5700 Total local and intermediate sources $ 8,942,744 $ 8,773,256 $ 8,833,647 $ 60, State program revenues 2,539,896 2,185,108 2,182,865 (2,243) 5020 Total revenues 11,482,640 10,958,364 11,016,512 58,148 EXPENDITURES Debt service 0071 Principal on long term debt 10,500,000 10,500,000 10,500, Interest on long term debt 3,919,906 3,923,906 3,923, Bond issuance cost and fees 4,000 2,400 2, Total expenditures 14,423,906 14,426,306 14,426, Excess (deficiency) of revenues over (under) expenditures (2,941,266) (3,467,942) (3,409,794) 58, Net change in fund balance (2,941,266) (3,467,942) (3,409,794) 58, Fund balance - beginning 7,390,945 7,390,945 7,390, FUND BALANCE - ENDING $ 4,449,679 $ 3,923,003 $ 3,981,151 $ 58,148 85
92 This Page Intentionally Left Blank 86
93 Federal Awards Section 87
94 This Page Intentionally Left Blank 88
95 Austin Conroe Dallas Fort Worth Houston Los Angeles Midland New York City San Antonio Independent Auditor s Report on Internal Control over Financial Reporting and on Compliance and Other Matters Based on an Audit of Financial Statements Performed in Accordance with Government Auditing Standards To the Board of Trustees DeSoto Independent School District We have audited, in accordance with auditing standards generally accepted in the United States of America and the standards applicable to financial audits contained in Government Auditing Standards issued by the Comptroller General of the United States, the financial statements of the governmental activities, each major fund, and the aggregate remaining fund information of DeSoto Independent School District (the District), as of and for the year ended June 30, 2018, and the related notes to the financial statements, which collectively comprise the District s basic financial statements, and have issued our report thereon dated November 12, Internal Control over Financial Reporting In planning and performing our audit of the financial statements, we considered the District s internal control over financial reporting (internal control) to determine the audit procedures that are appropriate in the circumstances for the purpose of expressing our opinions on the financial statements, but not for the purpose of expressing an opinion on the effectiveness of the District s internal control. Accordingly, we do not express an opinion on the effectiveness of the District s internal control. Our consideration of internal control over financial reporting was for the limited purpose described in the preceding paragraph and was not designed to identify all deficiencies in internal control over financial reporting that might be material weaknesses or significant deficiencies and therefore, material weaknesses or significant deficiencies may exist that were not identified. However, as described in the accompanying schedule of findings and questioned costs, we identified certain deficiencies in internal control that we consider to be material weaknesses and significant deficiencies. A deficiency in internal control exists when the design or operation of a control does not allow management or employees in the normal course of performing their assigned functions, to prevent, or detect and correct misstatements on a timely basis. A material weakness is a deficiency, or a combination of deficiencies, in internal control, such that there is a reasonable possibility that a material misstatement of the entity s financial statements will not be prevented, or detected and corrected on a timely basis. We consider the deficiencies described in the accompanying schedule of findings and questioned costs to be material weaknesses, A significant deficiency is a deficiency, or a combination of deficiencies, in internal control that is less severe than a material weakness, yet important enough to merit attention by those charged with governance. We consider the deficiencies described in the accompanying schedule of findings and questioned costs to be significant deficiencies, and Weaver and Tidwell, L.L.P North Field Street, Suite 1000 Dallas, Texas Main: Fax: CPAs AND ADVISORS WEAVER.COM
96 The Board of Trustees DeSoto Independent School District Compliance and Other Matters As part of obtaining reasonable assurance about whether the District s financial statements are free from material misstatement, we performed tests of its compliance with certain provisions of laws, regulations, contracts, and grant agreements, noncompliance with which could have a direct and material effect on the determination of financial statement amounts. However, providing an opinion on compliance with those provisions was not an objective of our audit and, accordingly, we do not express such an opinion. The results of our tests disclosed an instance of noncompliance or other matter that is required to be reported under Government Auditing Standards and which is described in the accompanying schedule of findings and questioned costs as item The District s Response to Findings The District s response to the findings identified in our audit are described in the accompanying schedule of findings and questioned costs. The District s response was not subjected to the auditing procedures applied in the audit of the financial statements and, accordingly, we express no opinion on it. Purpose of this Report The purpose of this report is solely to describe the scope of our testing of internal control and compliance and the results of that testing, and not to provide an opinion on the effectiveness of the entity s internal control or on compliance. This report is an integral part of an audit performed in accordance with Government Auditing Standards in considering the entity s internal control and compliance. Accordingly, this communication is not suitable for any other purpose. WEAVER AND TIDWELL, L.L.P. Dallas, Texas November 12,

97 Austin Conroe Dallas Fort Worth Houston Los Angeles Midland New York City San Antonio Independent Auditor s Report on Compliance for Each Major Federal Program and Report on Internal Control over Compliance in Accordance with the Uniform Guidance To the Board of Trustees DeSoto Independent School District DeSoto, Texas Report on Compliance for Each Major Federal Program We have audited DeSoto Independent School District s (the District) compliance with the types of compliance requirements described in the OMB Compliance Supplement that could have a direct and material effect on each of the District s major federal programs for the year ended June 30, The District s major federal programs are identified in the summary of auditor s results section of the accompanying schedule of findings and questioned costs. Management s Responsibility Management is responsible for compliance with federal statutes, regulations, and terms and conditions of its federal awards applicable to its federal programs. Auditor s Responsibility Our responsibility is to express an opinion on compliance for each of the District s major federal programs based on our audit of the types of compliance requirements referred to above. We conducted our audit of compliance in accordance with auditing standards generally accepted in the United States of America; the standards applicable to financial audits contained in Government Auditing Standards, issued by the Comptroller General of the United States; and the audit requirements of Title 2 U.S. Code of Federal Regulations (CFR) Part 200, Uniform Administrative Requirements, Cost Principles, and Audit Requirements for Federal Awards (Uniform Guidance). Those standards and the Uniform Guidance require that we plan and perform the audit to obtain reasonable assurance about whether noncompliance with the types of compliance requirements referred to above that could have a direct and material effect on a major federal program occurred. An audit includes examining, on a test basis, evidence about the District s compliance with those requirements and performing such other procedures as we considered necessary in the circumstances. We believe that our audit provides a reasonable basis for our opinion on compliance for each major federal program. However, our audit does not provide a legal determination of the District s compliance. Opinion on Each Major Federal Program In our opinion, the District complied, in all material respects, with the types of compliance requirements referred to above that could have a direct and material effect on each of its major federal programs for the year ended June 30, Weaver and Tidwell, L.L.P North Field Street, Suite 1000 Dallas, Texas Main: Fax: CPAs AND ADVISORS WEAVER.COM
MIDWAY INDEPENDENT SCHOOL DISTRICT ANNUAL FINANCIAL REPORT FOR THE YEAR ENDED
 MIDWAY INDEPENDENT SCHOOL DISTRICT ANNUAL FINANCIAL REPORT FOR THE YEAR ENDED AUGUST 31, 2017 THIS PAGE LEFT BLANK INTENTIONALLY MIDWAY INDEPENDENT SCHOOL DISTRICT ANNUAL FINANCIAL REPORT FOR THE YEAR
SCHERTZ-CIBOLO-UNIVERSAL CITY INDEPENDENT SCHOOL DISTRICT ANNUAL FINANCIAL REPORT
 SCHERTZ-CIBOLO-UNIVERSAL CITY INDEPENDENT SCHOOL DISTRICT ANNUAL FINANCIAL REPORT FOR THE YEAR ENDED AUGUST 31, 2016 SCHERTZ-CIBOLO-UNIVERSAL CITY INDEPENDENT SCHOOL DISTRICT ANNUAL FINANCIAL REPORT FOR
ITASCA INDEPENDENT SCHOOL DISTRICT ANNUAL FINANCIAL REPORT FOR THE YEAR ENDED AUGUST 31, 2017 TABLE OF CONTENTS
 ITASCA INDEPENDENT SCHOOL DISTRICT ANNUAL FINANCIAL REPORT FOR THE YEAR ENDED AUGUST 31, 2017 TABLE OF CONTENTS Exhibit Page Certificate of Board 1 Independent Auditor s Report 2 4 Management s Discussion
ANNUAL FINANCIAL REPORT
 MIDLAND INDEPENDENT SCHOOL DISTRICT ANNUAL FINANCIAL REPORT for year ended August 31, 2016 615 WEST MISSOURI MIDLAND, TEXAS 797015017 Educating the Future! THIS PAGE LEFT BLANK INTENTIONALLY MIDLAND INDEPENDENT
SANTA GERTRUDIS INDEPENDENT SCHOOL DISTRICT
 SANTA GERTRUDIS INDEPENDENT SCHOOL DISTRICT ANNUAL FINANCIAL AND COMPLIANCE REPORT FOR THE YEAR ENDED AUGUST 31, 2018 This page left intentionally blank. SANTA GERTRUDIS INDEPENDENT SCHOOL DISTRICT ANNUAL
RIO GRANDE CITY CISD ANNUAL FINANCIAL REPORT FOR THE YEAR ENDED AUGUST 31, 2016 TABLE OF CONTENTS
 RIO GRANDE CITY CISD ANNUAL FINANCIAL REPORT FOR THE YEAR ENDED AUGUST 31, 2016 Exhibit TABLE OF CONTENTS Page CERTIFICATE OF BOARD 1 Independent Auditors' Report 2 Management's Discussion and Analysis
ERA INDEPENDENT SCHOOL DISTRICT ANNUAL FINANCIAL REPORT FOR THE YEAR ENDED JUNE 30, 2017
 ANNUAL FINANCIAL REPORT FOR THE YEAR ENDED JUNE 30, 2017 ANNUAL FINANCIAL REPORT Exhibit TABLE OF CONTENTS CERTIFICATE OF BOARD Independent Auditors' Report Management's Discussion and Analysis Basic Financial
FRIENDSWOOD INDEPENDENT SCHOOL DISTRICT
 FRIENDSWOOD INDEPENDENT SCHOOL DISTRICT ANNUAL FINANCIAL AND COMPLIANCE REPORT For The Year Ended August 31, 2018 FRIENDSWOOD INDEPENDENT SCHOOL DISTRICT TABLE OF CONTENTS Certificate of Board Page i
RIO GRANDE CITY CONSOLIDATED ISD ANNUAL FINANCIAL REPORT FOR THE YEAR ENDED
 RIO GRANDE CITY CONSOLIDATED ISD ANNUAL FINANCIAL REPORT FOR THE YEAR ENDED AUGUST 31, 2014 RIO GRANDE CITY CONSOLIDATED ISD ANNUAL FINANCIAL REPORT FOR THE YEAR ENDED AUGUST 31, 2014 Exhibit TABLE OF
TATUM INDEPENDENT SCHOOL DISTRICT
 TATUM INDEPENDENT SCHOOL DISTRICT ANNUAL FINANCIAL REPORT FOR THE YEAR ENDED AUGUST 31, 2017 Tatum Independent School District Annual Financial Report For The Year Ended August 31, 2017 TABLE OF CONTENTS
CROCKETT INDEPENDENT SCHOOL DISTRICT
 CROCKETT INDEPENDENT SCHOOL DISTRICT ANNUAL FINANCIAL REPORT FOR THE YEAR ENDED AUGUST 31, 2016 Exhibit CONTENTS Page Certificate of the Board Financial Section Independent Auditor s Report 2 Management's
RIO GRANDE CITY CISD ANNUAL FINANCIAL REPORT FOR THE YEAR ENDED AUGUST 31, 2015 TABLE OF CONTENTS
 RIO GRANDE CITY CISD ANNUAL FINANCIAL REPORT FOR THE YEAR ENDED AUGUST 31, 2015 Exhibit TABLE OF CONTENTS Page CERTIFICATE OF BOARD 1 Independent Auditors' Report 2 Management's Discussion and Analysis
LUBBOCK-COOPER INDEPENDENT SCHOOL DISTRICT ANNUAL FINANCIAL REPORT FOR THE YEAR ENDED JUNE 30, 2015
 ANNUAL FINANCIAL REPORT FOR THE YEAR ENDED JUNE 30, 2015 ANNUAL FINANCIAL REPORT For the Year Ended June 30, 2015 TABLE OF CONTENTS Page INTRODUCTORY SECTION Certificate of Board 1 Exhibit FINANCIAL SECTION
MONTGOMERY INDEPENDENT SCHOOL DISTRICT
 MONTGOMERY INDEPENDENT SCHOOL DISTRICT FINANCIAL REPORT AUGUST 31, 2009 C O N T E N T S INTRODUCTORY SECTION Certificate of Board Page Exhibit i FINANCIAL SECTION Independent Auditor s Report 1 Management
MERIDIAN INDEPENDENT SCHOOL DISTRICT
 MERIDIAN INDEPENDENT SCHOOL DISTRICT ANNUAL FINANCIAL AND COMPLIANCE REPORT FOR THE YEAR ENDED AUGUST 31, 2016 This page left intentionally blank. MERIDIAN INDEPENDENT SCHOOL DISTRICT ANNUAL FINANCIAL
BORGER INDEPENDENT SCHOOL DISTRICT ANNUAL FINANCIAL REPORT FOR THE YEAR ENDED AUGUST 31, 2015
 ANNUAL FINANCIAL REPORT Brown, Graham & Company, P.C. 7431 Continental Parkway Amarillo, Texas 79119 (806)3558241 ANNUAL FINANCIAL REPORT TABLE OF CONTENTS Page Number Certificate of Board 1 Exhibit Independent
SLIDELL INDEPENDENT SCHOOL DISTRICT
 SLIDELL INDEPENDENT SCHOOL DISTRICT ANNUAL FINANCIAL REPORT Slidell Independent School District Annual Financial Report For The Year Ended August 31, 2012 TABLE OF CONTENTS Page Exhibit INTRODUCTORY SECTION
Grand Prairie Independent School District
 Grand Prairie Independent School District Annual Financial Report For the Fiscal Year Ended August 31, 2017 2602 S. Belt Line Road Grand Prairie, Texas 75052 www.gpisd.org This Page Intentionally Left
West Independent School District. Annual Financial Report. August 31, 2018
 Annual Financial Report August 31, 2018 Table of Contents Page Exhibit Certificate of Board iv v - vii viii - xv Basic Financial Statements: Government-wide Financial Statements: Statement of Net Position
ANGLETON INDEPENDENT SCHOOL DISTRICT
 ANGLETON INDEPENDENT SCHOOL DISTRICT ANNUAL FINANCIAL REPORT FOR THE YEAR ENDED AUGUST 31, 2016 KENNEMER, MASTERS & LUNSFORD, LLC CERTIFIED PUBLIC ACCOUNTANTS 8 WEST WAY COURT LAKE JACKSON, TEXAS 77566
SAN PERLITA INDEPENDENT SCHOOL DISTRICT
 SAN PERLITA INDEPENDENT SCHOOL DISTRICT ANNUAL FINANCIAL REPORT AND COMPLIANCE REPORT JUNE 30, 2018 Board of Trustees June 30, 2018 TRUSTEES Melissa Guadiana President Nora Vasquez Vice President Maggie
YANTIS INDEPENDENT SCHOOL DISTRICT ANNUAL FINANCIAL REPORT YEAR ENDED AUGUST 31, 2018
 YANTIS INDEPENDENT SCHOOL DISTRICT ANNUAL FINANCIAL REPORT RUTHERFORD, TAYLOR & COMPANY, P.C. Certified Public Accountants 2802 Washington Street Greenville, Texas 75401 (903) 455-6252 ANNUAL FINANCIAL
TORNILLO INDEPENDENT SCHOOL DISTRICT
 TORNILLO INDEPENDENT SCHOOL DISTRICT Annual Financial Report FOR THE YEAR ENDED AUGUST 31, 2014 ANNUAL FINANCIAL AND COMPLIANCE REPORTS FOR THE YEAR ENDED AUGUST 31, 2014 ANNUAL FINANCIAL REPORT FOR THE
BOVINA INDEPENDENT SCHOOL DISTRICT ANNUAL FINANCIAL REPORT FOR THE YEAR ENDED JUNE 30, 2018
 ANNUAL FINANCIAL REPORT Brown, Graham & Company, P.C. 7431 Continental Parkway Amarillo, Texas 79119 (806)355-8241 ANNUAL FINANCIAL REPORT TABLE OF CONTENTS PAGE CERTIFICATE OF BOARD... 1 EXHIBIT INDEPENDENT
IDALOU INDEPENDENT SCHOOL DISTRICT ANNUAL FINANCIAL REPORT FOR THE YEAR ENDED JUNE 30, 2017
 ANNUAL FINANCIAL REPORT FOR THE YEAR ENDED JUNE 30, 2017 ANNUAL FINANCIAL REPORT For the Year Ended June 30, 2017 TABLE OF CONTENTS Page INTRODUCTORY SECTION Certificate of Board 1 Exhibit FINANCIAL SECTION
Weslaco Independent School District. Board of Trustees
 Weslaco Independent School District August 31, 2014 Board of Trustees David L. Fuentes Erasmo López Óscar Caballero Adrián González Andrew González Isidoro Nieto Dr. Richard Rivera President Vice-President
LUBBOCK-COOPER INDEPENDENT SCHOOL DISTRICT ANNUAL FINANCIAL REPORT FOR THE YEAR ENDED JUNE 30, 2010
 ANNUAL FINANCIAL REPORT FOR THE YEAR ENDED JUNE 30, 2010 ANNUAL FINANCIAL REPORT For the Year Ended June 30, 2010 TABLE OF CONTENTS Page INTRODUCTORY SECTION Certificate of Board 1 Exhibit FINANCIAL SECTION
Sherman Independent School District
 Sherman Independent School District Annual Financial Report Year Ended June 30, 2014 Sherman Independent School District Annual Financial Report Year Ended June 30, 2014 Table of Contents Page Exhibit
BASTROP INDEPENDENT SCHOOL DISTRICT
 BASTROP INDEPENDENT SCHOOL DISTRICT ANNUAL FINANCIAL REPORT FOR THE YEAR ENDED JUNE 30, 2008 Bastrop Independent School District Annual Financial Report For The Year Ended June 30, 2008 TABLE OF CONTENTS
BROCK INDEPENDENT SCHOOL DISTRICT
 ANNUAL FINANCIAL REPORT FOR THE YEAR ENDED JUNE 30, 2017 Introductory Section Brock Independent School District AnnuaiRnan~aiReport For The Year Ended June 30, 2017 TABLE OF CONTENTS INTRODUCTORY SECTION
Reyna & Garza, P.L.L.C. Certified Public Accountants
 RIO GRANDE CITY CONSOLIDATED INDEPENDENT SCHOOL DISTRICT AUDITED ANNUAL FINANCIAL REPORT FOR THE YEAR ENDED AUGUST 31, 2008 Reyna & Garza, P.L.L.C. Certified Public Accountants Exhibit RIO GRANDE CITY
Fort Sam Houston Independent School District Annual Financial and Compliance Report
 Fort Sam Houston Independent School District Annual Financial and Compliance Report Year Ended August 31, 2015 Annual Financial Report Year Ended August 31, 2015 Table of Contents Page Exhibit INTRODUCTORY
MONTGOMERY INDEPENDENT SCHOOL DISTRICT
 MONTGOMERY INDEPENDENT SCHOOL DISTRICT COMPREHENSIVE ANNUAL FINANCIAL REPORT FOR THE FISCAL YEAR ENDED AUGUST 31, 2016 PREPARED BY THE MONTGOMERY INDEPENDENT SCHOOL DISTRICT FINANCE DEPARTMENT MONTGOMERY,
DALHART INDEPENDENT SCHOOL DISTRICT ANNUAL FINANCIAL REPORT FOR THE YEAR ENDED
 ANNUAL FINANCIAL REPORT FOR THE YEAR ENDED AUGUST 31, 2010 ANNUAL FINANCIAL REPORT For the Year Ended August 31, 2010 TABLE OF CONTENTS Exhibit Page Certificate of Board 1 Independent Auditor's Report
ATHENS INDEPENDENT SCHOOL DISTRICT ANNUAL FINANCIAL REPORT
 ANNUAL FINANCIAL REPORT FOR THE YEAR ENDED JUNE 30, 2005 ANNUAL FINANCIAL REPORT FOR THE YEAR ENDED JUNE 30, 2005 TABLE OF CONTENTS Exhibit Page Table of Contents 1 Certificate of Board 3 Independent Auditor
SOUTH TEXAS INDEPENDENT SCHOOL DISTRICT
 SOUTH TEXAS INDEPENDENT SCHOOL DISTRICT ANNUAL FINANCIAL REPORT FOR THE YEAR ENDED AUGUST 31, 2013 SOUTH TEXAS INDEPENDENT SCHOOL DISTRICT ANNUAL FINANCIAL REPORT FOR THE YEAR ENDED AUGUST 31, 2013 TABLE
Crockett Independent School District. Annual Financial Report For the Fiscal Year Ended August 31, 2017
 Annual Financial Report For the Fiscal Year Ended August 31, 2017 Annual Financial Report For the Fiscal Year Ended August 31, 2017 Table of Contents Page Exhibit Certificate of the Board... iii Financial
JUDSON INDEPENDENT SCHOOL DISTRICT ANNUAL FINANCIAL REPORT FOR THE YEAR ENDED JUNE 30, 2014
 JUDSON INDEPENDENT SCHOOL DISTRICT ANNUAL FINANCIAL REPORT FOR THE YEAR ENDED JUNE 30, 2014 This Page Intentionally Left Blank ANNUAL FINANCIAL REPORT YEAR ENDED JUNE 30, 2014 TABLE OF CONTENTS PAGE EXHIBIT
LAKE TRAVIS INDEPENDENT SCHOOL DISTRICT. Annual Financial Report for the Fiscal Year Ended August 31, 2016
 LAKE TRAVIS INDEPENDENT SCHOOL DISTRICT Annual Financial Report for the Fiscal Year Ended August 31, 2016 LAKE TRAVIS INDEPENDENT SCHOOL DISTRICT Annual Financial Report Year Ended August 31, 2016 Table
PANHANDLE INDEPENDENT SCHOOL DISTRICT ANNUAL FINANCIAL REPORT FOR THE YEAR ENDED AUGUST 31, 2013
 PANHANDLE INDEPENDENT SCHOOL DISTRICT ANNUAL FINANCIAL REPORT FOR THE YEAR ENDED AUGUST 31, 2013 PANHANDLE INDEPENDENT SCHOOL DISTRICT ANNUAL FINANCIAL REPORT FOR THE YEAR ENDED AUGUST 31, 2013 TABLE OF
GEORGETOWN INDEPENDENT SCHOOL DISTRICT. Annual Financial Report for the Fiscal Year Ended June 30, 2015
 GEORGETOWN INDEPENDENT SCHOOL DISTRICT Annual Financial Report for the Fiscal Year Ended June 30, 2015 GEORGETOWN INDEPENDENT SCHOOL DISTRICT Annual Financial Report Year Ended June 30, 2015 Table of Contents
FRIENDSWOOD INDEPENDENT SCHOOL DISTRICT ANNUAL FINANCIAL AND COMPLIANCE REPORT. For The Year Ended August 31, 2008
 FRIENDSWOOD INDEPENDENT SCHOOL DISTRICT ANNUAL FINANCIAL AND COMPLIANCE REPORT For The Year Ended August 31, 2008 2000 Loop 197 N., Suite 200 Texas City, Texas 77590 (409) 948-4406 FRIENDSWOOD INDEPENDENT
TORNILLO INDEPENDENT SCHOOL DISTRICT
 TORNILLO INDEPENDENT SCHOOL DISTRICT Annual Financial Report FOR THE YEAR ENDED AUGUST 31, 2017 ANNUAL FINANCIAL AND COMPLIANCE REPORTS FOR THE YEAR ENDED AUGUST 31, 2017 ANNUAL FINANCIAL REPORT FOR THE
GALVESTON INDEPENDENT SCHOOL DISTRICT
 ANNUAL FINANCIAL REPORT of the GALVESTON For the Year Ended August 31, 2011 (This page intentionally left blank.) GALVESTON TABLE OF CONTENTS August 31, 2011 INTRODUCTORY SECTION Page Exhibit Certificate
MCKINNEY INDEPENDENT SCHOOL DISTRICT
 MCKINNEY INDEPENDENT SCHOOL DISTRICT Financial Report For the Year Ended June 30, 2011 MCKINNEY INDEPENDENT SCHOOL DISTRICT Financial Report For the Year Ended June 30, 2011 TABLE OF CONTENTS Page Exhibit
MANOR INDEPENDENT SCHOOL DISTRICT
 MANOR INDEPENDENT SCHOOL DISTRICT ANNUAL FINANCIAL REPORT Manor Independent School District Annual Financial Report For The Year Ended June 30, 2012 TABLE OF CONTENTS Page Exhibit INTRODUCTORY SECTION
WINK-LOVING INDEPENDENT SCHOOL DISTRICT ANNUAL FINANCIAL AND COMPLIANCE REPORT FOR THE YEAR ENDED AUGUST 31, 2012
 WINK-LOVING INDEPENDENT SCHOOL DISTRICT ANNUAL FINANCIAL AND COMPLIANCE REPORT FOR THE YEAR ENDED AUGUST 31, 2012 WINK LOVING INDEPENDENT SCHOOL DISTRICT ANNUAL FINANCIAL AND COMPLIANCE REPORT FOR THE
MCKINNEY INDEPENDENT SCHOOL DISTRICT
 MCKINNEY INDEPENDENT SCHOOL DISTRICT Financial Report For the Year Ended June 30, 2009 MCKINNEY INDEPENDENT SCHOOL DISTRICT Financial Report For the Year Ended June 30, 2009 TABLE OF CONTENTS Page Exhibit
AMARILLO INDEPENDENT SCHOOL DISTRICT Amarillo, Texas. ANNUAL FINANCIAL REPORT Year Ended June 30, 2013
 AMARILLO INDEPENDENT SCHOOL DISTRICT Amarillo, Texas ANNUAL FINANCIAL REPORT Year Ended June 30, 2013 TABLE OF CONTENTS Page Exhibit CERTIFICATE OF BOARD............................. 1 FINANCIAL SECTION
TEAGUE INDEPENDENT SCHOOL DISTRICT
 TEAGUE INDEPENDENT SCHOOL DISTRICT ANNUAL FINANCIAL AND COMPLIANCE REPORT JUNE 30, 2018 TEAGUE INDEPENDENT SCHOOL DISTRICT ANNUAL FINANCIAL AND COMPLIANCE REPORT FOR THE YEAR ENDED JUNE 30, 2018 TABLE
TOLTEC SCHOOL DISTRICT NO. 22 ELOY, ARIZONA
 ELOY, ARIZONA ANNUAL FINANCIAL REPORT FISCAL YEAR ENDED Issued by: Business and Finance Department This page is intentionally left blank. TABLE OF CONTENTS Page INDEPENDENT AUDITORS' REPORT...1 MANAGEMENT'S
EVANS-BRANT CENTRAL SCHOOL DISTRICT, NEW YORK Basic Financial Statements, Required Supplementary Information, Supplementary Information, and Federal
 EVANS-BRANT CENTRAL SCHOOL DISTRICT, NEW YORK Basic Financial Statements, Required Supplementary Information, Supplementary Information, and Federal Awards Information for the Year Ended June 30, 2017
Montgomery Independent School District
 Montgomery Independent School District Comprehensive Annual Financial Report For the Fiscal Year Ended August 31, 2017 Prepared By The Montgomery Independent School District Finance Department Montgomery,
WILLIAMSVILLE CENTRAL SCHOOL DISTRICT, NEW YORK Basic Financial Statements, Required Supplementary Information, Supplementary Information and Federal
 WILLIAMSVILLE CENTRAL SCHOOL DISTRICT, NEW YORK Basic Financial Statements, Required Supplementary Information, Supplementary Information and Federal Awards Information for the Year Ended June 30, 2017
Public Schools of the City of Ann Arbor, Michigan. Financial Report with Supplemental Information June 30, 2018
 Financial Report with Supplemental Information Contents Independent Auditor's Report 1-2 Management's Discussion and Analysis 3-9 Basic Financial Statements Government-wide Financial Statements: Statement
Kent County, Michigan. Annual Financial Report
 Kent County, Michigan Annual Financial Report For the year ended June 30, 2018 Table of Contents For the year ended June 30, 2018 Financial Section Independent Auditor s Report... 1 Management s Discussion
PALO ALTO UNIFIED SCHOOL DISTRICT ANNUAL FINANCIAL REPORT FOR THE YEAR ENDED JUNE 30, 2016
 PALO ALTO UNIFIED SCHOOL DISTRICT ANNUAL FINANCIAL REPORT FOR THE YEAR ENDED TABLE OF CONTENTS FINANCIAL SECTION Independent Auditor's Report 2 Management s Discussion and Analysis 5 Basic Financial Statements
MANOR INDEPENDENT SCHOOL DISTRICT
 MANOR INDEPENDENT SCHOOL DISTRICT ANNUAL FINANCIAL REPORT FOR THE YEAR ENDED AUGUST 31, 2010 Manor Independent School District Annual Financial Report For The Year Ended August 31, 2010 TABLE OF CONTENTS
Notice of Regular Meeting The Board of Trustees Lago Vista ISD
 LAGO VISTA INDEPENDENT SCHOOL DISTRICT Notice of Regular Meeting The Board of Trustees Lago Vista ISD A Regular Meeting of the Board of Trustees of Lago Vista ISD will be held on November 15, 2010, beginning
SCHOOL DISTRICT OF REEDSBURG Reedsburg, Wisconsin AUDITED FINANCIAL STATEMENTS. June 30, 2016
 Reedsburg, Wisconsin AUDITED FINANCIAL STATEMENTS C O N T E N T S Independent Auditor s Report... 1 Management s Discussion and Analysis... 4 Basic Financial Statements District-Wide Financial Statements
DENTON INDEPENDENT SCHOOL DISTRICT
 DENTON INDEPENDENT SCHOOL DISTRICT ANNUAL FINANCIAL REPORT FOR THE YEAR ENDED JUNE 30, 2013 DENTON INDEPENDENT SCHOOL DISTRICT ANNUAL FINANCIAL REPORT FOR THE YEAR ENDED JUNE 30, 2013 TABLE OF CONTENTS
School District of the Menomonie Area Menomonie, Wisconsin
 Menomonie, Wisconsin Financial Statements With Supplementary Financial Information Year Ended June 30, 2016 Financial Statements With Supplementary Financial Information Year Ended June 30, 2016 Table
GAYLORD COMMUNITY SCHOOLS GAYLORD, MICHIGAN FINANCIAL STATEMENTS JUNE 30, 2016
 GAYLORD, MICHIGAN FINANCIAL STATEMENTS JUNE 30, 2016 TABLE OF CONTENTS Independent Auditor's Report 1-3 Management's Discussion and Analysis 4-11 Basic Financial Statements District-wide Financial Statements
Belding Area Schools. Financial Statements With Supplemental Information June 30, 2018
 Financial Statements With Supplemental Information Contents Independent Auditor s Report 1-2 Management s Discussion and Analysis 3-9 Basic Financial Statements Government - Wide Financial Statements:
VALLEY VIEW INDEPENDENT SCHOOL DISTRICT
 ANNUAL FINANCIAL REPORT FOR THE YEAR ENDED AUGUST 31, 2011 Introductory Section LIST OF PRINCIPAL OFFICIALS AUGUST 31, 2011 Elected Officials Name Juan A. Pimentel Jose A. Rosillo Noe Reyes Frank Jimenez
SAUGUS UNION SCHOOL DISTRICT
 SAUGUS UNION SCHOOL DISTRICT Excellence in Elementary Education ANNUAL FINANCIAL REPORT TABLE OF CONTENTS FINANCIAL SECTION Independent Auditor's Report 2 Management's Discussion and Analysis 5 Basic Financial
Annual Financial Report For the Fiscal Year Ending August 31, 2017
 Pharr-San Juan-Alamo Independent School District Annual Financial Report For the Fiscal Year Ending August 31, 2017 Oscar R. Gonzalez, CPA & Associates P.L.L.C. Certified Public Accountants Pharr, Texas
PROVISO TOWNSHIP HIGH SCHOOL DISTRICT NO. 209 [Forest Park, Illinois] Audited Financial Statements And Supplementary Financial Information
![PROVISO TOWNSHIP HIGH SCHOOL DISTRICT NO. 209 [Forest Park, Illinois] Audited Financial Statements And Supplementary Financial Information](/thumbs/90/101384916.jpg "PROVISO TOWNSHIP HIGH SCHOOL DISTRICT NO. 209 [Forest Park, Illinois] Audited Financial Statements And Supplementary Financial Information") PROVISO TOWNSHIP HIGH SCHOOL DISTRICT NO. 209 [Forest Park, Illinois] Audited Financial Statements And Supplementary Financial Information June 30, 2017 THIS PAGE INTENTIONALLY LEFT BLANK PROVISO TOWNSHIP
PROVISO TOWNSHIP HIGH SCHOOL DISTRICT NO. 209 [Forest Park, Illinois] Audited Financial Statements And Supplementary Financial Information June 30, 2017 THIS PAGE INTENTIONALLY LEFT BLANK PROVISO TOWNSHIP
Annual Financial Report
 Annual Financial Report Prepared By The Waco Independent School District Business and Financial Services Department 501 Franklin Avenue, Waco, Texas 76701 (This page intentionally left blank) Table of
Tecumseh Public Schools Tecumseh, Michigan FINANCIAL STATEMENTS. June 30, 2018
 Tecumseh, Michigan FINANCIAL STATEMENTS TABLE OF CONTENTS Page INDEPENDENT AUDITOR S REPORT MANAGEMENT S DISCUSSION AND ANALYSIS i-ii iii-viii BASIC FINANCIAL STATEMENTS District-wide Financial Statements
SCHOOL DISTRICT OF AMERY Amery, Wisconsin FINANCIAL STATEMENTS AND SUPPLEMENTARY INFORMATION YEAR ENDED JUNE 30, 2018
 FINANCIAL STATEMENTS AND SUPPLEMENTARY INFORMATION YEAR ENDED TABLE OF CONTENTS YEAR ENDED FINANCIAL SECTION INDEPENDENT AUDITORS' REPORT 1 REQUIRED SUPPLEMENTARY INFORMATION Management's Discussion and
Independent Auditors Report. To the Board of Finance Town of East Haddam, Connecticut. Report on the Financial Statements
 29 South Main Street P.O. Box 272000 West Hartford, CT 06127-2000 Tel 860.561.4000 Fax 860.521.9241 blumshapiro.com Independent Auditors Report To the Board of Finance Town of East Haddam, Connecticut
REGION 16 EDUCATION SERVICE CENTER ANNUAL FINANCIAL REPORT FOR THE YEAR ENDED AUGUST
 ANNUAL FINANCIAL REPORT FOR THE YEAR ENDED AUGUST 31, 2018 BOLINGER, SEGARS, GILBERT & MOSS, L.L.P. LUBBOCK, TEXAS ANNUAL FINANCIAL REPORT FOR THE YEAR ENDED AUGUST 31, 2018 ANNUAL FINANCIAL REPORT FOR
Branch County, Michigan. Annual Financial Report
 Branch County, Michigan Annual Financial Report For the year ended Table of Contents For the year ended Financial Section Independent Auditor s Report... 1 Management s Discussion and Analysis... 4 Basic
SAUGUS UNION SCHOOL DISTRICT
 SAUGUS UNION SCHOOL DISTRICT Excellence in Elementary Education ANNUAL FINANCIAL REPORT TABLE OF CONTENTS FINANCIAL SECTION Independent Auditor's Report 2 Management's Discussion and Analysis 5 Basic Financial
LYONS ELEMENTARY SCHOOL DISTRICT 103 ANNUAL FINANCIAL REPORT FOR THE FISCAL YEAR ENDED JUNE 30, 2018
 ANNUAL FINANCIAL REPORT FOR THE FISCAL YEAR ENDED JUNE 30, 2018 ANNUAL FINANCIAL REPORT June 30, 2018 CONTENTS FINANCIAL SECTION Independent Auditor s Report... 1-2 Management s Discussion and Analysis...
PRAIRILAND INDEPENDENT SCHOOL DISTRICT
 ANNUALFINANCMLREPORT FOR THE YEAR ENDED JUNE 30, 2017 Prairiland Independent School District Annual Financial Report For The Year Ended June 30,2017 TABLE OF CONTENTS INTRODUCTORY SECTION Certificate of
MARK TWAIN UNION ELEMENTARY SCHOOL DISTRICT ANNUAL FINANCIAL REPORT FOR THE YEAR ENDED JUNE 30, 2018
 MARK TWAIN UNION ELEMENTARY SCHOOL DISTRICT ANNUAL FINANCIAL REPORT FOR THE YEAR ENDED This page left blank intentionally. TABLE OF CONTENTS FOR THE YEAR ENDED FINANCIAL SECTION Independent Auditor's Report
INDEPENDENT SCHOOL DISTRICT NO. 286 BROOKLYN CENTER, MINNESOTA. Financial Statements and Supplemental Information. Year Ended June 30, 2016
 INDEPENDENT SCHOOL DISTRICT NO. 286 BROOKLYN CENTER, MINNESOTA Financial Statements and Supplemental Information Year Ended June 30, 2016 THIS PAGE INTENTIONALLY LEFT BLANK INDEPENDENT SCHOOL DISTRICT
KELLOGGSVILLE PUBLIC SCHOOLS
 KELLOGGSVILLE PUBLIC SCHOOLS Kent County, Michigan Annual Financial Report For the year ended June 30, 2013 Table of Contents Year ended June 30, 2013 Financial Section Independent Auditor s Report...
Jersey Shore Area School District
 Financial Statements and Supplementary Information Table of Contents Independent Auditors Report 1 Management s Discussion and Analysis (Unaudited) 4 Basic Financial Statements: Government-Wide Financial
CLINTONDALE COMMUNITY SCHOOLS. REPORT ON FINANCIAL STATEMENTS (with required supplementary and additional supplementary information) JUNE 30, 2018
 JUNE 30, 2018") REPORT ON FINANCIAL STATEMENTS (with required supplementary and additional supplementary information) JUNE 30, 2018 TABLE OF CONTENTS Independent Auditor s Report Management s Discussion and Analysis PAGE
REPORT ON FINANCIAL STATEMENTS (with required supplementary and additional supplementary information) JUNE 30, 2018 TABLE OF CONTENTS Independent Auditor s Report Management s Discussion and Analysis PAGE
MAYVILLE COMMUNITY SCHOOLS Mayville, Michigan
 Mayville, Michigan REPORT ON FINANCIAL STATEMENTS (with required supplementary and additional supplementary information) YEAR ENDED JUNE 30, 2018 TABLE OF CONTENTS Page Number INDEPENDENT AUDITOR'S REPORT
Livonia Public Schools. Financial Report with Supplemental Information June 30, 2013
 Financial Report with Supplemental Information June 30, 2013 Contents Independent Auditor's Report 1-2 Management's Discussion and Analysis 3-12 Basic Financial Statements Government-wide Financial Statements:
GAYLORD COMMUNITY SCHOOLS GAYLORD, MICHIGAN FINANCIAL STATEMENTS JUNE 30, 2015
 GAYLORD, MICHIGAN FINANCIAL STATEMENTS JUNE 30, 2015 TABLE OF CONTENTS Independent Auditor's Report 1-3 Management's Discussion and Analysis 4-12 Basic Financial Statements District-wide Financial Statements
HAMILTON-WENHAM REGIONAL SCHOOL DISTRICT REPORT ON EXAMINATION OF BASIC FINANCIAL STATEMENTS
 HAMILTON-WENHAM REGIONAL SCHOOL DISTRICT REPORT ON EXAMINATION OF BASIC FINANCIAL STATEMENTS YEAR ENDED JUNE 30, 2018 HAMILTON-WENHAM REGIONAL SCHOOL DISTRICT REPORT ON EXAMINATION OF BASIC FINANCIAL STATEMENTS
GUILDERLAND CENTRAL SCHOOL DISTRICT AUDITED FINANCIAL STATEMENTS AND SUPPLEMENTAL SCHEDULES JUNE 30, 2017
 AUDITED FINANCIAL STATEMENTS AND SUPPLEMENTAL SCHEDULES JUNE 30, 2017 C O N T E N T S PAGE INDEPENDENT AUDITORS REPORT... 1 2 MANAGEMENT S DISCUSSION AND ANALYSIS... 3 11 BASIC FINANCIAL STATEMENTS Statement
LEBANON SCHOOL DISTRICT LEBANON, PENNSYLVANIA AUDIT REPORT
 LEBANON, PENNSYLVANIA AUDIT REPORT JUNE 30, 2016 TABLE OF CONTENTS PAGE INDEPENDENT AUDITOR S REPORT 1-3 MANAGEMENT S DISCUSSION AND ANALYSIS 4-12 BASIC FINANCIAL STATEMENTS Entity-wide Financial Statements:
SAN LEANDRO UNIFIED SCHOOL DISTRICT ANNUAL FINANCIAL REPORT JUNE 30, 2018
 SAN LEANDRO UNIFIED SCHOOL DISTRICT ANNUAL FINANCIAL REPORT TABLE OF CONTENTS FINANCIAL SECTION Independent Auditor's Report 2 Management's Discussion and Analysis 5 Basic Financial Statements Government-Wide
HOUGHTON LAKE COMMUNITY SCHOOLS. REPORT ON FINANCIAL STATEMENTS (with required supplementary and additional supplementary information)
") REPORT ON FINANCIAL STATEMENTS (with required supplementary and additional supplementary information) YEAR ENDED JUNE 30, 2018 1 C O N T E N T S Page Independent auditor s report... 4-6 Management s Discussion
REPORT ON FINANCIAL STATEMENTS (with required supplementary and additional supplementary information) YEAR ENDED JUNE 30, 2018 1 C O N T E N T S Page Independent auditor s report... 4-6 Management s Discussion
ENGADINE CONSOLIDATED SCHOOLS Mackinac County, Michigan
 ENGADINE CONSOLIDATED SCHOOLS Mackinac County, Michigan Annual Financial Report For the year ended Table of Contents For the year ended Financial Section Independent Auditor s Report... 1 Management s
Norway-Vulcan Area School District Norway, Michigan
 ANNUAL FINANCIAL REPORT June 30, 2018 JUNE 30, 2018 Table of Contents INDEPENDENT AUDITORS REPORT 1 MANAGEMENT S DISCUSSION AND ANALYSIS 3 BASIC FINANCIAL STATEMENTS District-wide Financial Statements
GUILDERLAND CENTRAL SCHOOL DISTRICT AUDITED FINANCIAL STATEMENTS AND SUPPLEMENTAL SCHEDULES JUNE 30, 2015
 AUDITED FINANCIAL STATEMENTS AND SUPPLEMENTAL SCHEDULES JUNE 30, 2015 C O N T E N T S PAGE INDEPENDENT AUDITORS REPORT... 1 2 MANAGEMENT S DISCUSSION AND ANALYSIS... 3 11 BASIC FINANCIAL STATEMENTS Statement
MADISON METROPOLITAN SCHOOL DISTRICT Madison, Wisconsin. FINANCIAL STATEMENTS June 30, 2018
 MADISON METROPOLITAN SCHOOL DISTRICT Madison, Wisconsin FINANCIAL STATEMENTS Madison, Wisconsin TABLE OF CONTENTS Page INDEPENDENT AUDITORS REPORT... 1 MANAGEMENT S DISCUSSION AND ANALYSIS... 4 BASIC FINANCIAL
WESTERN BEAVER COUNTY SCHOOL DISTRICT MIDLAND, PENNSYLVANIA JUNE 30, 2015
 WESTERN BEAVER COUNTY SCHOOL DISTRICT MIDLAND, PENNSYLVANIA JUNE 30, 2015 AUDIT REPORT MIDLAND, PENNSYLVANIA TABLE OF CONTENTS Page Independent Auditor s Report 1 2 Management s Discussion and Analysis
MADISON METROPOLITAN SCHOOL DISTRICT Madison, Wisconsin. FINANCIAL STATEMENTS June 30, 2017
 MADISON METROPOLITAN SCHOOL DISTRICT Madison, Wisconsin FINANCIAL STATEMENTS Madison, Wisconsin TABLE OF CONTENTS Page INDEPENDENT AUDITORS REPORT... 1 MANAGEMENT S DISCUSSION AND ANALYSIS... 4 BASIC FINANCIAL
ANNUAL FINANCIAL REPORT JUNE 30, 2017
 ANNUAL FINANCIAL REPORT TABLE OF CONTENTS FINANCIAL SECTION Independent Auditor's Report 2 Management's Discussion and Analysis 5 Basic Financial Statements Government-Wide Financial Statements Statement
BEXLEY CITY SCHOOL DISTRICT FRANKLIN COUNTY SINGLE AUDIT
 BEXLEY CITY SCHOOL DISTRICT FRANKLIN COUNTY SINGLE AUDIT FOR THE YEAR ENDED JUNE 30, 2016 BEXLEY CITY SCHOOL DISTRICT FRANKLIN COUNTY TABLE OF CONTENTS TITLE PAGE Independent Auditor s Report... 1 Management
FALLBROOK UNION HIGH SCHOOL DISTRICT ANNUAL FINANCIAL REPORT JUNE 30, 2017
 FALLBROOK UNION HIGH SCHOOL DISTRICT ANNUAL FINANCIAL REPORT TABLE OF CONTENTS FINANCIAL SECTION Independent Auditor's Report 2 Management's Discussion and Analysis 5 Basic Financial Statements Government-Wide
CONEJO VALLEY UNIFIED SCHOOL DISTRICT ANNUAL FINANCIAL REPORT JUNE 30, 2017
 CONEJO VALLEY UNIFIED SCHOOL DISTRICT ANNUAL FINANCIAL REPORT JUNE 30, 2017 TABLE OF CONTENTS JUNE 30, 2017 FINANCIAL SECTION Independent Auditor's Report 2 Management's Discussion and Analysis 5 Basic